Cidra, PR Map & Demographics
Cidra Map
Cidra Overview
$10,419
PER CAPITA INCOME
$21,845
AVG FAMILY INCOME
$19,107
AVG HOUSEHOLD INCOME
4.7%
WAGE / INCOME GAP [ % ]
95.3¢/ $1
WAGE / INCOME GAP [ $ ]
0.50
INEQUALITY / GINI INDEX
6,056
TOTAL POPULATION
2,785
MALE POPULATION
3,271
FEMALE POPULATION
85.14
MALES / 100 FEMALES
117.45
FEMALES / 100 MALES
41.8
MEDIAN AGE
3.5
AVG FAMILY SIZE
2.8
AVG HOUSEHOLD SIZE
1,881
LABOR FORCE [ PEOPLE ]
35.2%
PERCENT IN LABOR FORCE
12.7%
UNEMPLOYMENT RATE
Cidra Zip Codes
Cidra Area Codes
Income in Cidra
Income Overview in Cidra
Per Capita Income in Cidra is $10,419, while median incomes of families and households are $21,845 and $19,107 respectively.
| Characteristic | Number | Measure |
| Per Capita Income | 6,056 | $10,419 |
| Median Family Income | 1,459 | $21,845 |
| Mean Family Income | 1,459 | $27,819 |
| Median Household Income | 2,139 | $19,107 |
| Mean Household Income | 2,139 | $25,611 |
| Income Deficit | 1,459 | $0 |
| Wage / Income Gap (%) | 6,056 | 4.69% |
| Wage / Income Gap ($) | 6,056 | 95.31¢ per $1 |
| Gini / Inequality Index | 6,056 | 0.50 |
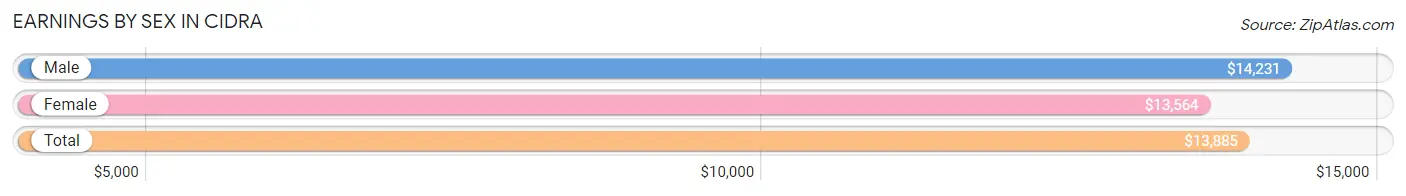
Earnings by Sex in Cidra
Average Earnings in Cidra are $13,885, $14,231 for men and $13,564 for women, a difference of 4.7%.
| Sex | Number | Average Earnings |
| Male | 849 (48.0%) | $14,231 |
| Female | 920 (52.0%) | $13,564 |
| Total | 1,769 (100.0%) | $13,885 |
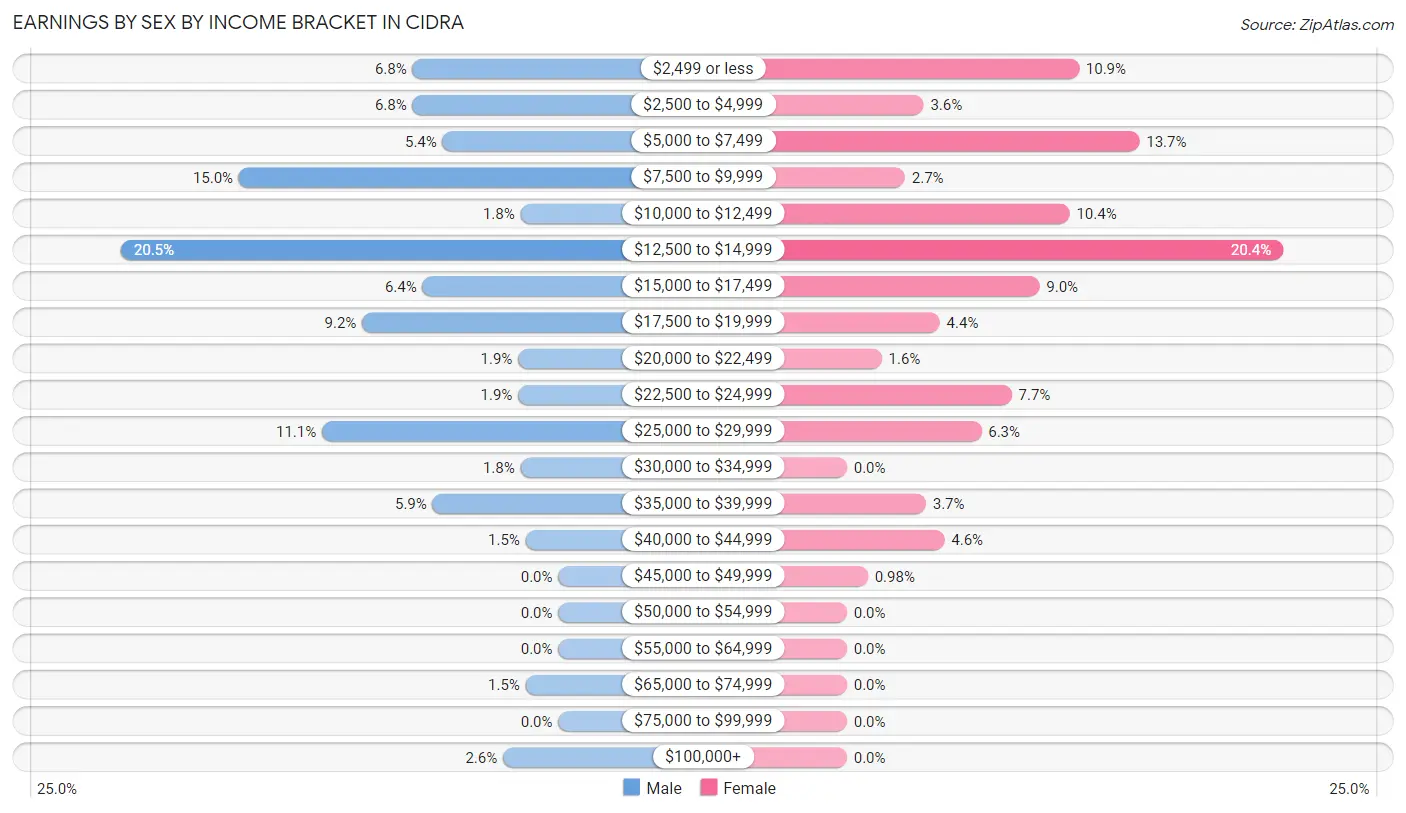
Earnings by Sex by Income Bracket in Cidra
The most common earnings brackets in Cidra are $12,500 to $14,999 for men (174 | 20.5%) and $12,500 to $14,999 for women (188 | 20.4%).
| Income | Male | Female |
| $2,499 or less | 58 (6.8%) | 100 (10.9%) |
| $2,500 to $4,999 | 58 (6.8%) | 33 (3.6%) |
| $5,000 to $7,499 | 46 (5.4%) | 126 (13.7%) |
| $7,500 to $9,999 | 127 (15.0%) | 25 (2.7%) |
| $10,000 to $12,499 | 15 (1.8%) | 96 (10.4%) |
| $12,500 to $14,999 | 174 (20.5%) | 188 (20.4%) |
| $15,000 to $17,499 | 54 (6.4%) | 83 (9.0%) |
| $17,500 to $19,999 | 78 (9.2%) | 40 (4.3%) |
| $20,000 to $22,499 | 16 (1.9%) | 15 (1.6%) |
| $22,500 to $24,999 | 16 (1.9%) | 71 (7.7%) |
| $25,000 to $29,999 | 94 (11.1%) | 58 (6.3%) |
| $30,000 to $34,999 | 15 (1.8%) | 0 (0.0%) |
| $35,000 to $39,999 | 50 (5.9%) | 34 (3.7%) |
| $40,000 to $44,999 | 13 (1.5%) | 42 (4.6%) |
| $45,000 to $49,999 | 0 (0.0%) | 9 (1.0%) |
| $50,000 to $54,999 | 0 (0.0%) | 0 (0.0%) |
| $55,000 to $64,999 | 0 (0.0%) | 0 (0.0%) |
| $65,000 to $74,999 | 13 (1.5%) | 0 (0.0%) |
| $75,000 to $99,999 | 0 (0.0%) | 0 (0.0%) |
| $100,000+ | 22 (2.6%) | 0 (0.0%) |
| Total | 849 (100.0%) | 920 (100.0%) |
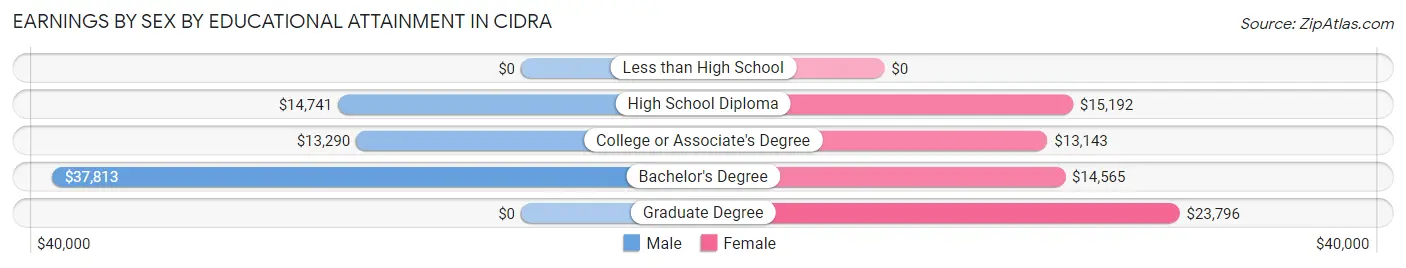
Earnings by Sex by Educational Attainment in Cidra
Average earnings in Cidra are $14,425 for men and $14,415 for women, a difference of 0.1%. Men with an educational attainment of bachelor's degree enjoy the highest average annual earnings of $37,813, while those with college or associate's degree education earn the least with $13,290. Women with an educational attainment of graduate degree earn the most with the average annual earnings of $23,796, while those with college or associate's degree education have the smallest earnings of $13,143.
| Educational Attainment | Male Income | Female Income |
| Less than High School | - | - |
| High School Diploma | $14,741 | $15,192 |
| College or Associate's Degree | $13,290 | $13,143 |
| Bachelor's Degree | $37,813 | $14,565 |
| Graduate Degree | - | - |
| Total | $14,425 | $14,415 |
Family Income in Cidra
Family Income Brackets in Cidra
According to the Cidra family income data, there are 404 families falling into the less than $10,000 income range, which is the most common income bracket and makes up 27.7% of all families.
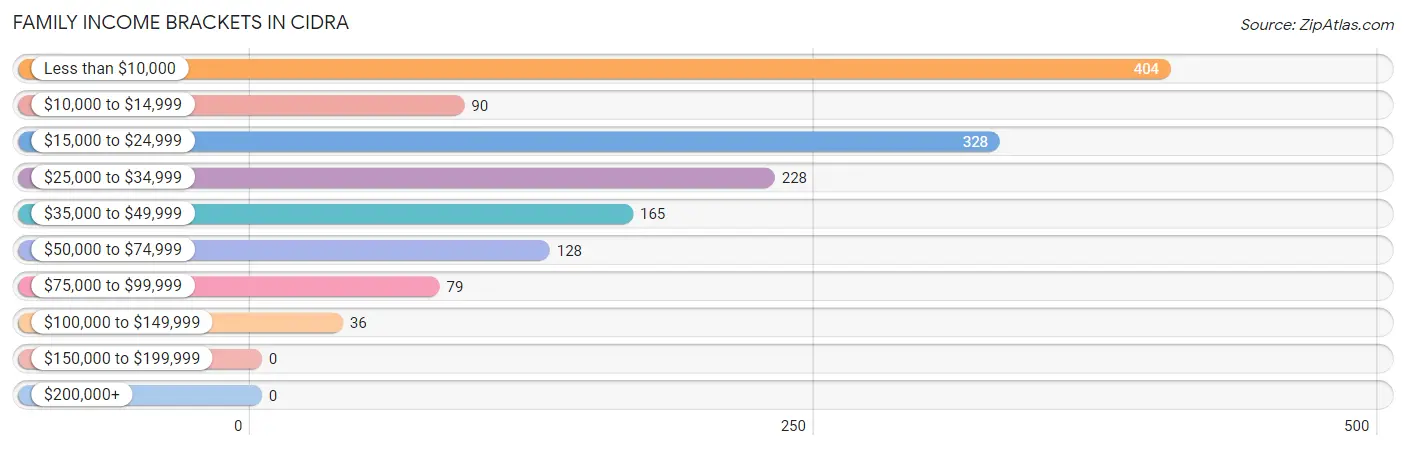
| Income Bracket | # Families | % Families |
| Less than $10,000 | 404 | 27.7% |
| $10,000 to $14,999 | 90 | 6.2% |
| $15,000 to $24,999 | 328 | 22.5% |
| $25,000 to $34,999 | 228 | 15.6% |
| $35,000 to $49,999 | 165 | 11.3% |
| $50,000 to $74,999 | 128 | 8.8% |
| $75,000 to $99,999 | 79 | 5.4% |
| $100,000 to $149,999 | 36 | 2.5% |
| $150,000 to $199,999 | 0 | 0.0% |
| $200,000+ | 0 | 0.0% |
Family Income by Famaliy Size in Cidra
4-person families (155 | 10.6%) account for the highest median family income in Cidra with $39,875 per family, while 2-person families (758 | 51.9%) have the highest median income of $10,681 per family member.
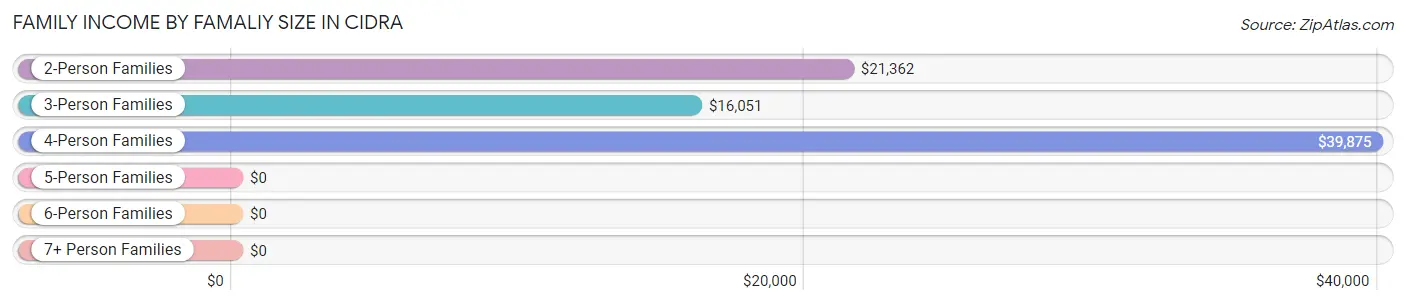
| Income Bracket | # Families | Median Income |
| 2-Person Families | 758 (51.9%) | $21,362 |
| 3-Person Families | 389 (26.7%) | $16,051 |
| 4-Person Families | 155 (10.6%) | $39,875 |
| 5-Person Families | 124 (8.5%) | $0 |
| 6-Person Families | 33 (2.3%) | $0 |
| 7+ Person Families | 0 (0.0%) | $0 |
| Total | 1,459 (100.0%) | $21,845 |
Family Income by Number of Earners in Cidra
The median family income in Cidra is $21,845, with families comprising 2 earners (190) having the highest median family income of $39,417, while families with no earners (698) have the lowest median family income of $12,281, accounting for 13.0% and 47.8% of families, respectively.
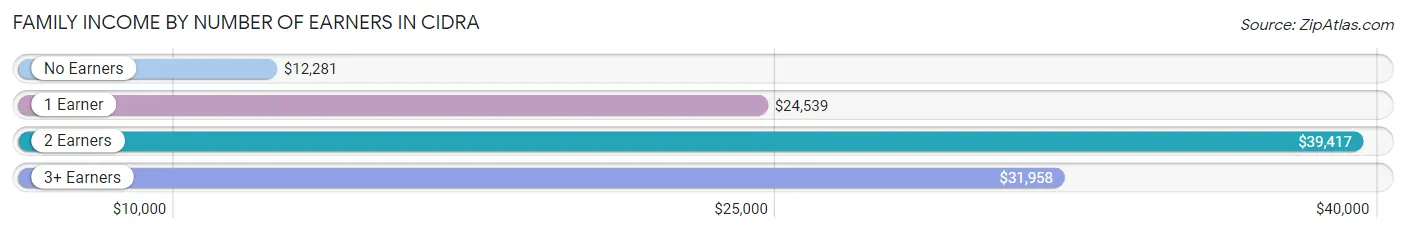
| Number of Earners | # Families | Median Income |
| No Earners | 698 (47.8%) | $12,281 |
| 1 Earner | 502 (34.4%) | $24,539 |
| 2 Earners | 190 (13.0%) | $39,417 |
| 3+ Earners | 69 (4.7%) | $31,958 |
| Total | 1,459 (100.0%) | $21,845 |
Household Income in Cidra
Household Income Brackets in Cidra
With 635 households falling in the category, the less than $10,000 income range is the most frequent in Cidra, accounting for 29.7% of all households.
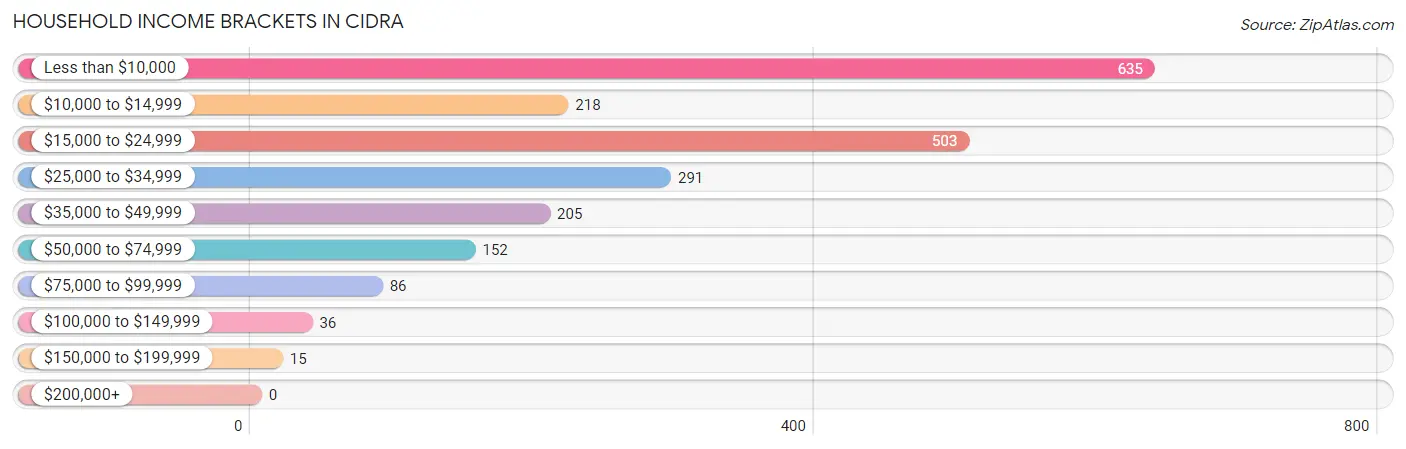
| Income Bracket | # Households | % Households |
| Less than $10,000 | 635 | 29.7% |
| $10,000 to $14,999 | 218 | 10.2% |
| $15,000 to $24,999 | 503 | 23.5% |
| $25,000 to $34,999 | 291 | 13.6% |
| $35,000 to $49,999 | 205 | 9.6% |
| $50,000 to $74,999 | 152 | 7.1% |
| $75,000 to $99,999 | 86 | 4.0% |
| $100,000 to $149,999 | 36 | 1.7% |
| $150,000 to $199,999 | 15 | 0.7% |
| $200,000+ | 0 | 0.0% |
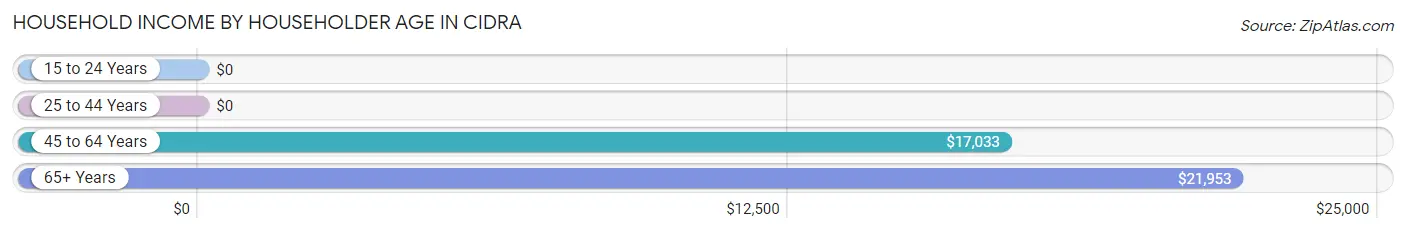
Household Income by Householder Age in Cidra
The median household income in Cidra is $19,107, with the highest median household income of $21,953 found in the 65+ years age bracket for the primary householder. A total of 843 households (39.4%) fall into this category. Meanwhile, the 15 to 24 years age bracket for the primary householder has the lowest median household income of $0, with 20 households (0.9%) in this group.
| Income Bracket | # Households | Median Income |
| 15 to 24 Years | 20 (0.9%) | $0 |
| 25 to 44 Years | 368 (17.2%) | $0 |
| 45 to 64 Years | 908 (42.4%) | $17,033 |
| 65+ Years | 843 (39.4%) | $21,953 |
| Total | 2,139 (100.0%) | $19,107 |
Poverty in Cidra
Income Below Poverty by Sex and Age in Cidra
With 52.7% poverty level for males and 58.0% for females among the residents of Cidra, under 5 year old males and 5 year old females are the most vulnerable to poverty, with 136 males (100.0%) and 43 females (100.0%) in their respective age groups living below the poverty level.
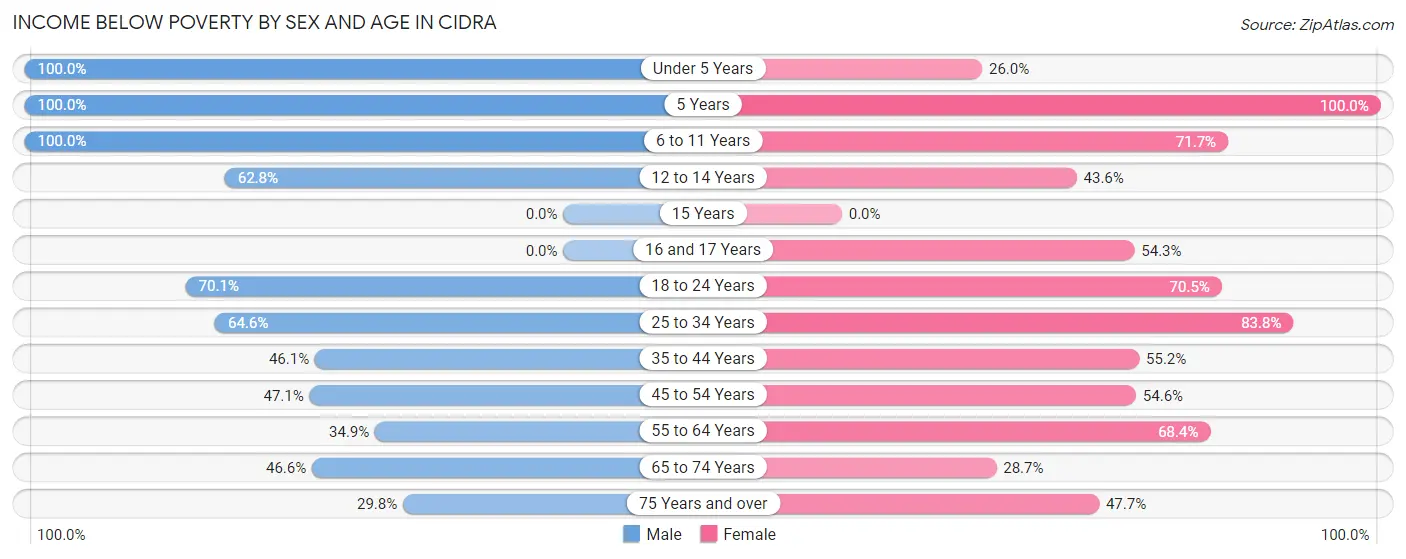
| Age Bracket | Male | Female |
| Under 5 Years | 136 (100.0%) | 19 (26.0%) |
| 5 Years | 39 (100.0%) | 43 (100.0%) |
| 6 to 11 Years | 70 (100.0%) | 86 (71.7%) |
| 12 to 14 Years | 71 (62.8%) | 51 (43.6%) |
| 15 Years | 0 (0.0%) | 0 (0.0%) |
| 16 and 17 Years | 0 (0.0%) | 82 (54.3%) |
| 18 to 24 Years | 204 (70.1%) | 313 (70.5%) |
| 25 to 34 Years | 245 (64.6%) | 274 (83.8%) |
| 35 to 44 Years | 195 (46.1%) | 250 (55.2%) |
| 45 to 54 Years | 204 (47.1%) | 238 (54.6%) |
| 55 to 64 Years | 87 (34.9%) | 279 (68.4%) |
| 65 to 74 Years | 132 (46.6%) | 115 (28.7%) |
| 75 Years and over | 83 (29.7%) | 127 (47.7%) |
| Total | 1,466 (52.7%) | 1,877 (58.0%) |
Income Above Poverty by Sex and Age in Cidra
According to the poverty statistics in Cidra, males aged 16 and 17 years and females aged under 5 years are the age groups that are most secure financially, with 100.0% of males and 74.0% of females in these age groups living above the poverty line.
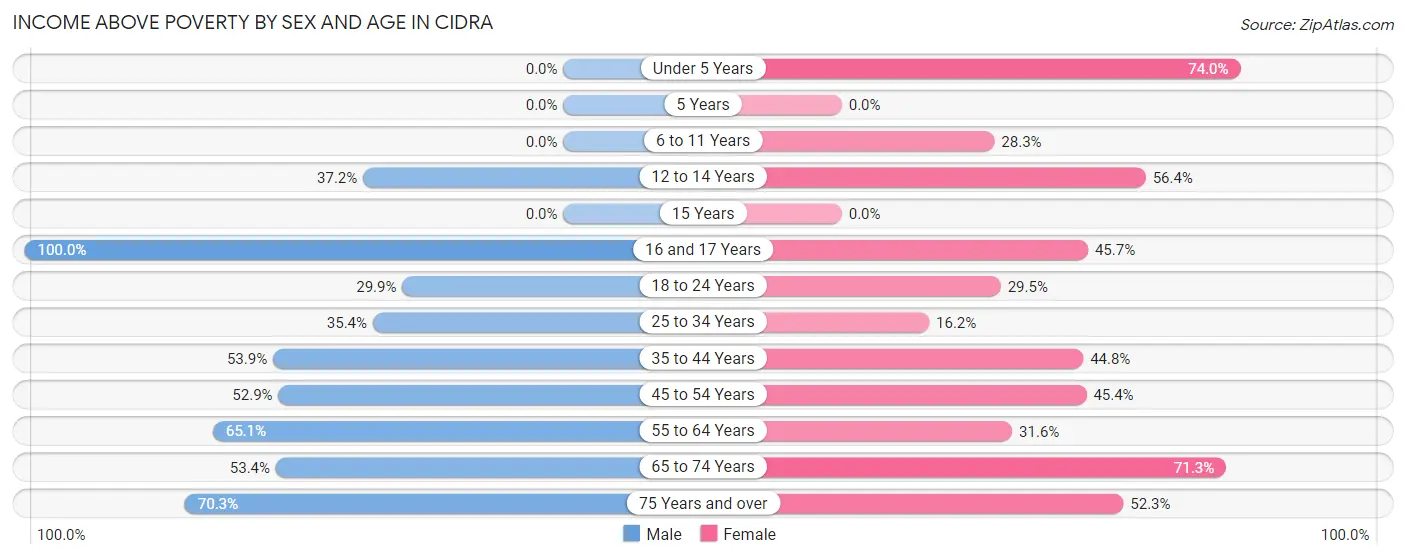
| Age Bracket | Male | Female |
| Under 5 Years | 0 (0.0%) | 54 (74.0%) |
| 5 Years | 0 (0.0%) | 0 (0.0%) |
| 6 to 11 Years | 0 (0.0%) | 34 (28.3%) |
| 12 to 14 Years | 42 (37.2%) | 66 (56.4%) |
| 15 Years | 0 (0.0%) | 0 (0.0%) |
| 16 and 17 Years | 87 (100.0%) | 69 (45.7%) |
| 18 to 24 Years | 87 (29.9%) | 131 (29.5%) |
| 25 to 34 Years | 134 (35.4%) | 53 (16.2%) |
| 35 to 44 Years | 228 (53.9%) | 203 (44.8%) |
| 45 to 54 Years | 229 (52.9%) | 198 (45.4%) |
| 55 to 64 Years | 162 (65.1%) | 129 (31.6%) |
| 65 to 74 Years | 151 (53.4%) | 286 (71.3%) |
| 75 Years and over | 196 (70.3%) | 139 (52.3%) |
| Total | 1,316 (47.3%) | 1,362 (42.0%) |
Income Below Poverty Among Married-Couple Families in Cidra
The poverty statistics for married-couple families in Cidra show that 28.8% or 189 of the total 657 families live below the poverty line. Families with no children have the highest poverty rate of 31.0%, comprising of 154 families. On the other hand, families with 1 or 2 children have the lowest poverty rate of 21.9%, which includes 35 families.
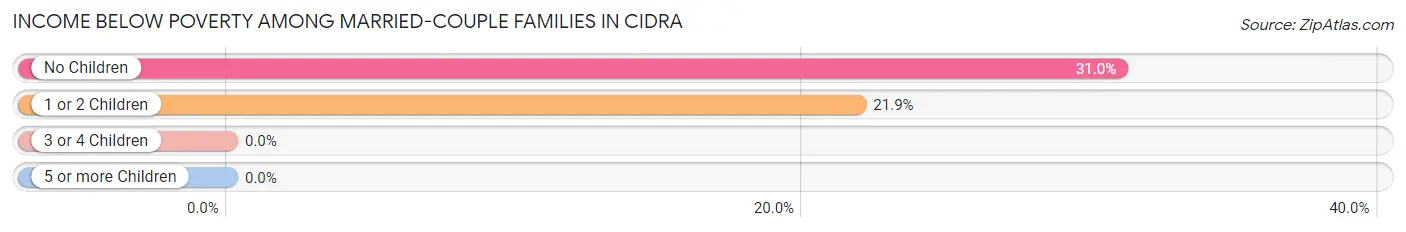
| Children | Above Poverty | Below Poverty |
| No Children | 343 (69.0%) | 154 (31.0%) |
| 1 or 2 Children | 125 (78.1%) | 35 (21.9%) |
| 3 or 4 Children | 0 (0.0%) | 0 (0.0%) |
| 5 or more Children | 0 (0.0%) | 0 (0.0%) |
| Total | 468 (71.2%) | 189 (28.8%) |
Income Below Poverty Among Single-Parent Households in Cidra
According to the poverty data in Cidra, 38.1% or 40 single-father households and 71.3% or 497 single-mother households are living below the poverty line. Among single-father households, those with 1 or 2 children have the highest poverty rate, with 40 households (57.1%) experiencing poverty. Likewise, among single-mother households, those with 3 or 4 children have the highest poverty rate, with 20 households (100.0%) falling below the poverty line.
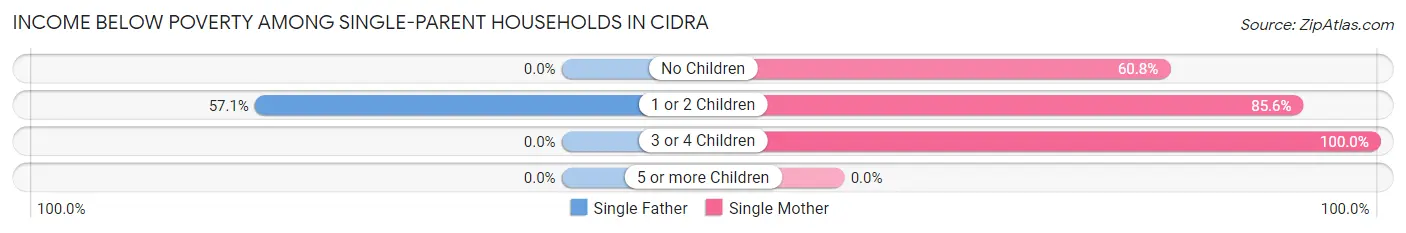
| Children | Single Father | Single Mother |
| No Children | 0 (0.0%) | 251 (60.8%) |
| 1 or 2 Children | 40 (57.1%) | 226 (85.6%) |
| 3 or 4 Children | 0 (0.0%) | 20 (100.0%) |
| 5 or more Children | 0 (0.0%) | 0 (0.0%) |
| Total | 40 (38.1%) | 497 (71.3%) |
Income Below Poverty Among Married-Couple vs Single-Parent Households in Cidra
The poverty data for Cidra shows that 189 of the married-couple family households (28.8%) and 537 of the single-parent households (67.0%) are living below the poverty level. Within the married-couple family households, those with no children have the highest poverty rate, with 154 households (31.0%) falling below the poverty line. Among the single-parent households, those with 3 or 4 children have the highest poverty rate, with 20 household (100.0%) living below poverty.
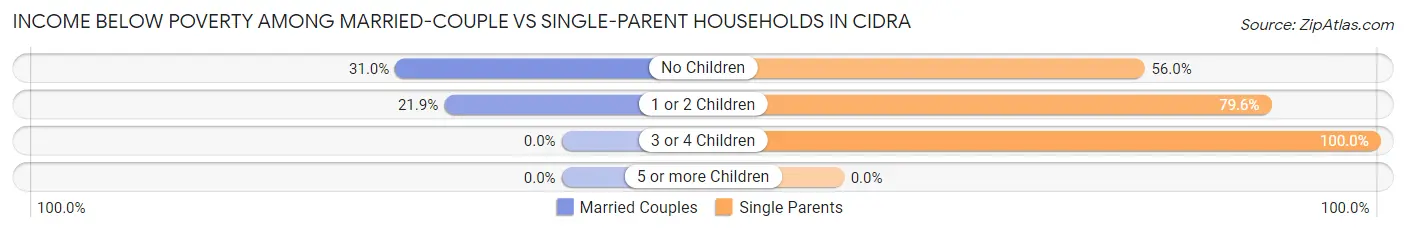
| Children | Married-Couple Families | Single-Parent Households |
| No Children | 154 (31.0%) | 251 (56.0%) |
| 1 or 2 Children | 35 (21.9%) | 266 (79.6%) |
| 3 or 4 Children | 0 (0.0%) | 20 (100.0%) |
| 5 or more Children | 0 (0.0%) | 0 (0.0%) |
| Total | 189 (28.8%) | 537 (67.0%) |
Race in Cidra
The most populous races in Cidra are Hispanic or Latino (6,020 | 99.4%), White / Caucasian (2,168 | 35.8%), and Two or more Races (1,882 | 31.1%).
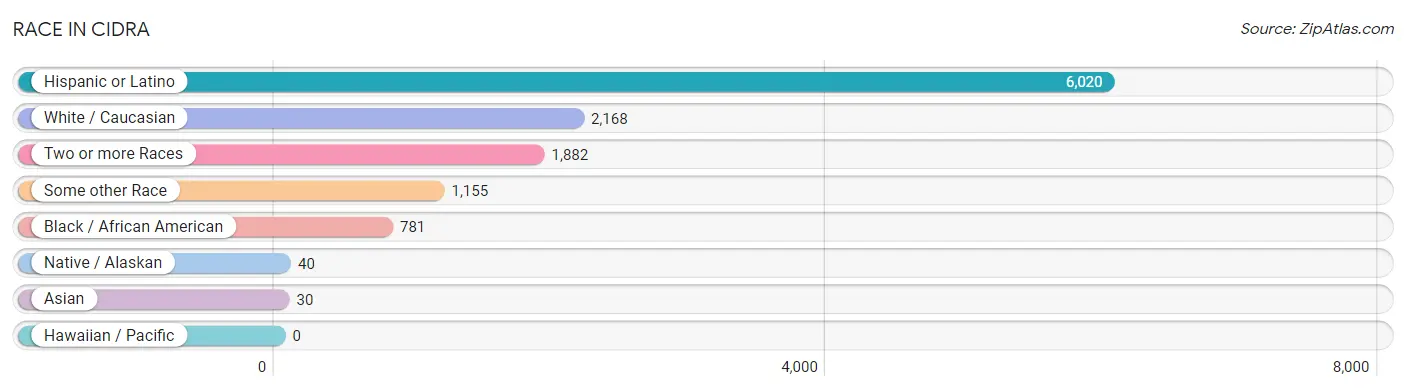
| Race | # Population | % Population |
| Asian | 30 | 0.5% |
| Black / African American | 781 | 12.9% |
| Hawaiian / Pacific | 0 | 0.0% |
| Hispanic or Latino | 6,020 | 99.4% |
| Native / Alaskan | 40 | 0.7% |
| White / Caucasian | 2,168 | 35.8% |
| Two or more Races | 1,882 | 31.1% |
| Some other Race | 1,155 | 19.1% |
| Total | 6,056 | 100.0% |
Ancestry in Cidra
The most populous ancestries reported in Cidra are Puerto Rican (6,014 | 99.3%), Central American Indian (92 | 1.5%), American (60 | 1.0%), Thai (57 | 0.9%), and Spaniard (6 | 0.1%), together accounting for 102.9% of all Cidra residents.
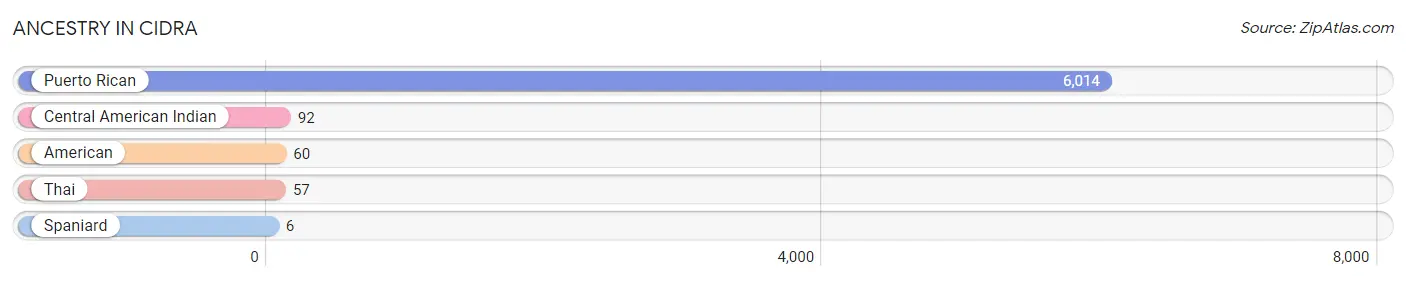
| Ancestry | # Population | % Population |
| American | 60 | 1.0% |
| Central American Indian | 92 | 1.5% |
| Puerto Rican | 6,014 | 99.3% |
| Spaniard | 6 | 0.1% |
| Thai | 57 | 0.9% | View All 5 Rows |
Immigrants in Cidra

| Immigration Origin | # Population | % Population | View All 0 Rows |
Sex and Age in Cidra
Sex and Age in Cidra
The most populous age groups in Cidra are 45 to 49 Years (289 | 10.4%) for men and 20 to 24 Years (369 | 11.3%) for women.
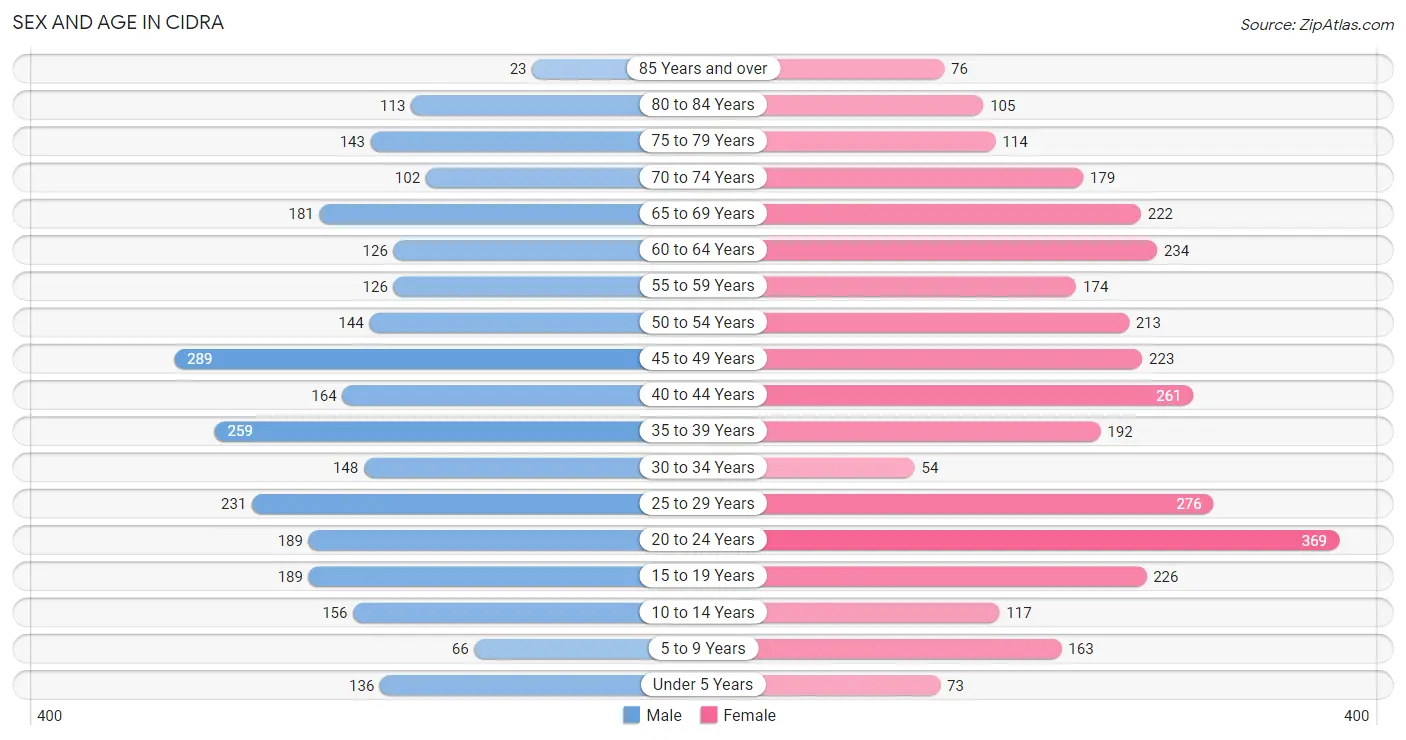
| Age Bracket | Male | Female |
| Under 5 Years | 136 (4.9%) | 73 (2.2%) |
| 5 to 9 Years | 66 (2.4%) | 163 (5.0%) |
| 10 to 14 Years | 156 (5.6%) | 117 (3.6%) |
| 15 to 19 Years | 189 (6.8%) | 226 (6.9%) |
| 20 to 24 Years | 189 (6.8%) | 369 (11.3%) |
| 25 to 29 Years | 231 (8.3%) | 276 (8.4%) |
| 30 to 34 Years | 148 (5.3%) | 54 (1.7%) |
| 35 to 39 Years | 259 (9.3%) | 192 (5.9%) |
| 40 to 44 Years | 164 (5.9%) | 261 (8.0%) |
| 45 to 49 Years | 289 (10.4%) | 223 (6.8%) |
| 50 to 54 Years | 144 (5.2%) | 213 (6.5%) |
| 55 to 59 Years | 126 (4.5%) | 174 (5.3%) |
| 60 to 64 Years | 126 (4.5%) | 234 (7.1%) |
| 65 to 69 Years | 181 (6.5%) | 222 (6.8%) |
| 70 to 74 Years | 102 (3.7%) | 179 (5.5%) |
| 75 to 79 Years | 143 (5.1%) | 114 (3.5%) |
| 80 to 84 Years | 113 (4.1%) | 105 (3.2%) |
| 85 Years and over | 23 (0.8%) | 76 (2.3%) |
| Total | 2,785 (100.0%) | 3,271 (100.0%) |
Families and Households in Cidra
Median Family Size in Cidra
The median family size in Cidra is 3.53 persons per family, with single male/father families (105 | 7.2%) accounting for the largest median family size of 4.11 persons per family. On the other hand, single female/mother families (697 | 47.8%) represent the smallest median family size with 3.29 persons per family.
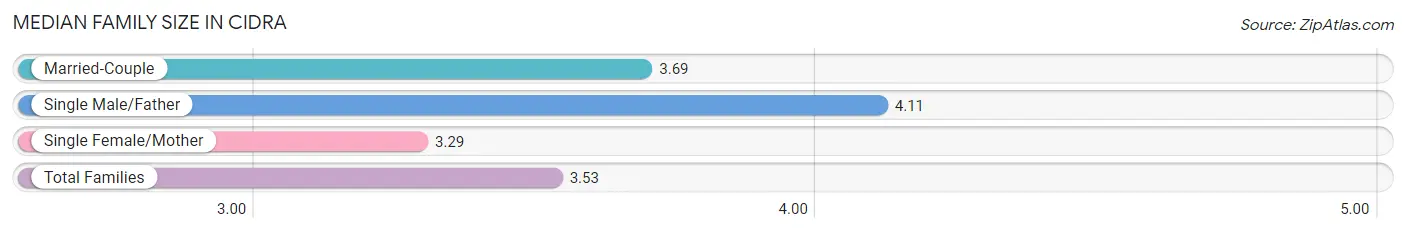
| Family Type | # Families | Family Size |
| Married-Couple | 657 (45.0%) | 3.69 |
| Single Male/Father | 105 (7.2%) | 4.11 |
| Single Female/Mother | 697 (47.8%) | 3.29 |
| Total Families | 1,459 (100.0%) | 3.53 |
Median Household Size in Cidra
The median household size in Cidra is 2.80 persons per household, with single male/father households (105 | 4.9%) accounting for the largest median household size of 4.32 persons per household. non-family households (680 | 31.8%) represent the smallest median household size with 1.10 persons per household.
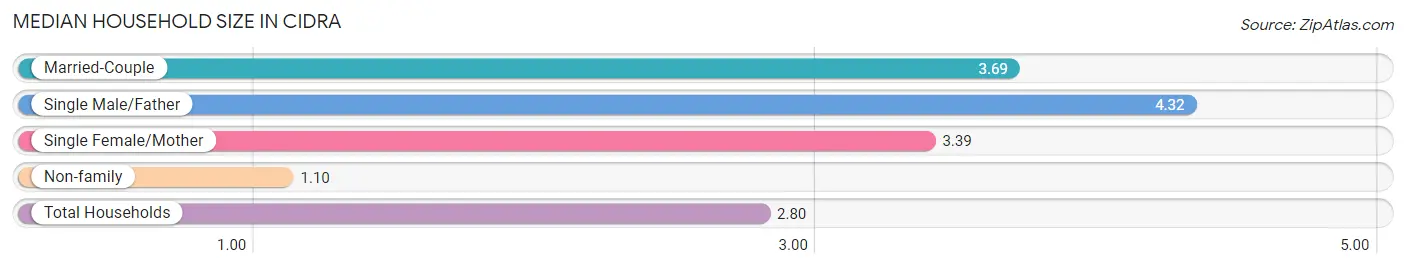
| Household Type | # Households | Household Size |
| Married-Couple | 657 (30.7%) | 3.69 |
| Single Male/Father | 105 (4.9%) | 4.32 |
| Single Female/Mother | 697 (32.6%) | 3.39 |
| Non-family | 680 (31.8%) | 1.10 |
| Total Households | 2,139 (100.0%) | 2.80 |
Household Size by Marriage Status in Cidra
Out of a total of 2,139 households in Cidra, 1,459 (68.2%) are family households, while 680 (31.8%) are nonfamily households. The most numerous type of family households are 2-person households, comprising 742, and the most common type of nonfamily households are 1-person households, comprising 628.
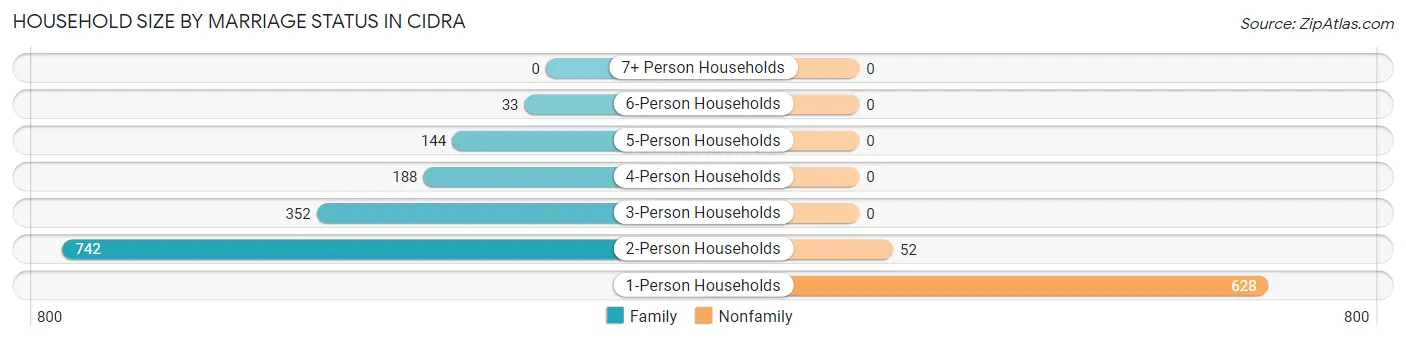
| Household Size | Family Households | Nonfamily Households |
| 1-Person Households | - | 628 (29.4%) |
| 2-Person Households | 742 (34.7%) | 52 (2.4%) |
| 3-Person Households | 352 (16.5%) | 0 (0.0%) |
| 4-Person Households | 188 (8.8%) | 0 (0.0%) |
| 5-Person Households | 144 (6.7%) | 0 (0.0%) |
| 6-Person Households | 33 (1.5%) | 0 (0.0%) |
| 7+ Person Households | 0 (0.0%) | 0 (0.0%) |
| Total | 1,459 (68.2%) | 680 (31.8%) |
Female Fertility in Cidra
Fertility by Age in Cidra
Average fertility rate in Cidra is 12.0 births per 1,000 women. Women in the age bracket of 20 to 34 years have the highest fertility rate with 29.0 births per 1,000 women. Women in the age bracket of 20 to 34 years acount for 100.0% of all women with births.
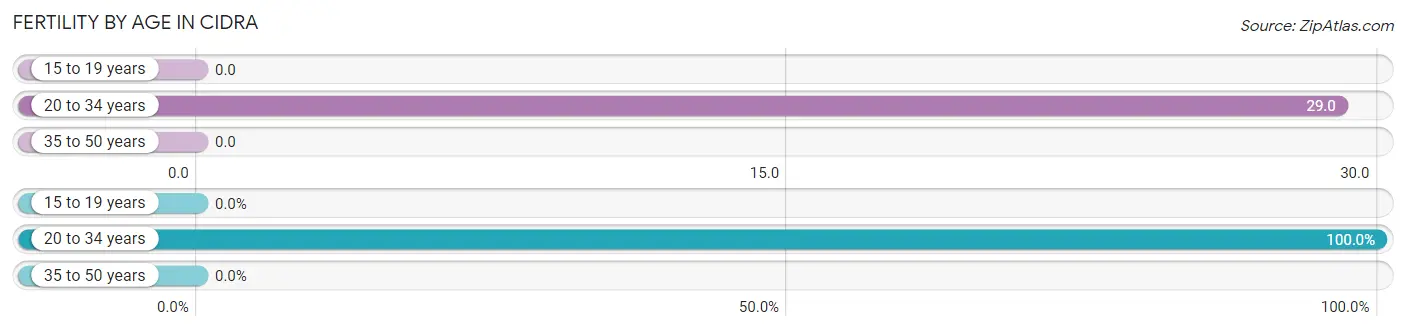
| Age Bracket | Women with Births | Births / 1,000 Women |
| 15 to 19 years | 0 (0.0%) | 0.0 |
| 20 to 34 years | 20 (100.0%) | 29.0 |
| 35 to 50 years | 0 (0.0%) | 0.0 |
| Total | 20 (100.0%) | 12.0 |
Fertility by Age by Marriage Status in Cidra
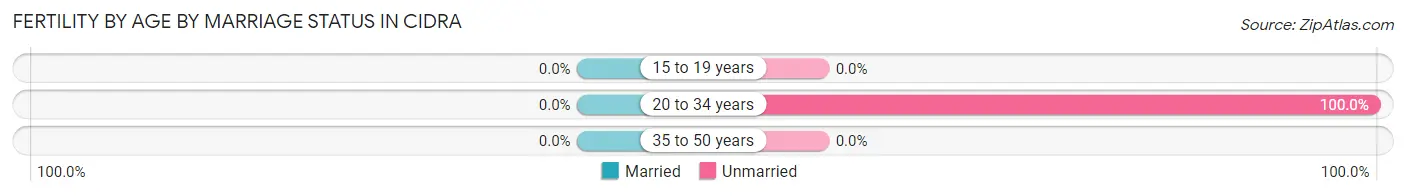
| Age Bracket | Married | Unmarried |
| 15 to 19 years | 0 (0.0%) | 0 (0.0%) |
| 20 to 34 years | 0 (0.0%) | 20 (100.0%) |
| 35 to 50 years | 0 (0.0%) | 0 (0.0%) |
| Total | 0 (0.0%) | 20 (100.0%) |
Fertility by Education in Cidra
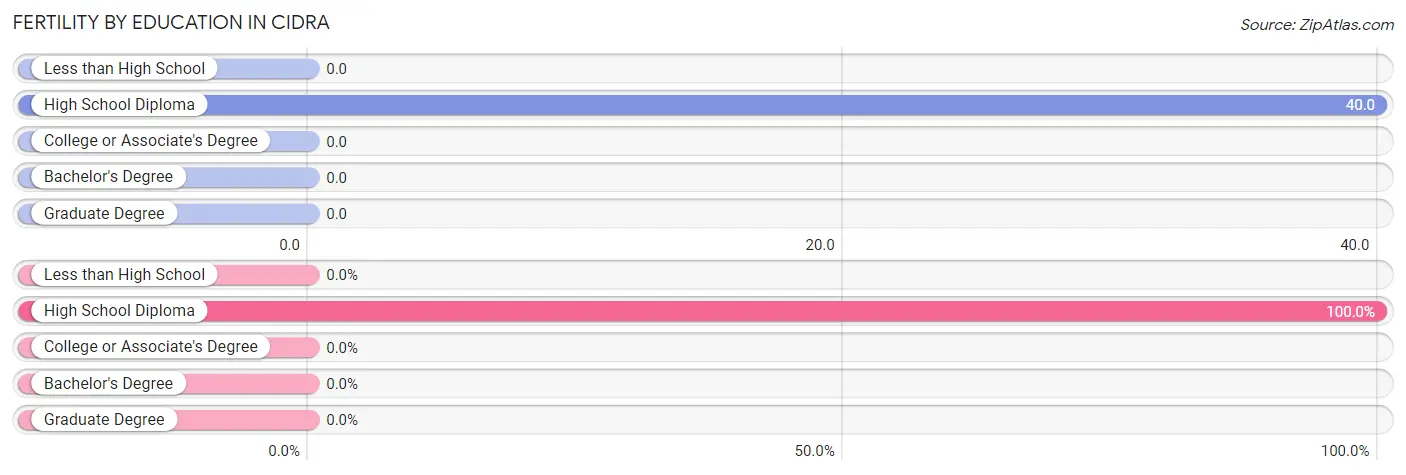
| Educational Attainment | Women with Births | Births / 1,000 Women |
| Less than High School | 0 (0.0%) | 0.0 |
| High School Diploma | 20 (100.0%) | 40.0 |
| College or Associate's Degree | 0 (0.0%) | 0.0 |
| Bachelor's Degree | 0 (0.0%) | 0.0 |
| Graduate Degree | 0 (0.0%) | 0.0 |
| Total | 20 (100.0%) | 12.0 |
Fertility by Education by Marriage Status in Cidra
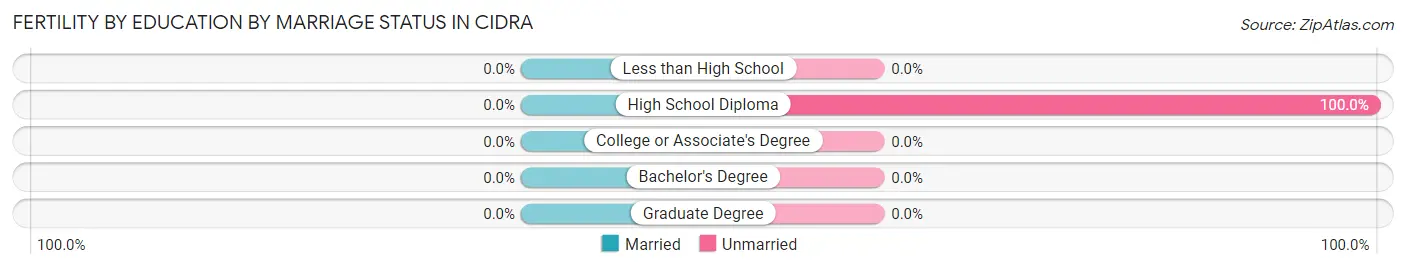
| Educational Attainment | Married | Unmarried |
| Less than High School | 0 (0.0%) | 0 (0.0%) |
| High School Diploma | 0 (0.0%) | 20 (100.0%) |
| College or Associate's Degree | 0 (0.0%) | 0 (0.0%) |
| Bachelor's Degree | 0 (0.0%) | 0 (0.0%) |
| Graduate Degree | 0 (0.0%) | 0 (0.0%) |
| Total | 0 (0.0%) | 20 (100.0%) |
Employment Characteristics in Cidra
Employment by Class of Employer in Cidra
Among the 1,606 employed individuals in Cidra, private company employees (1,085 | 67.6%), self-employed (not incorporated) (220 | 13.7%), and state government employees (112 | 7.0%) make up the most common classes of employment.
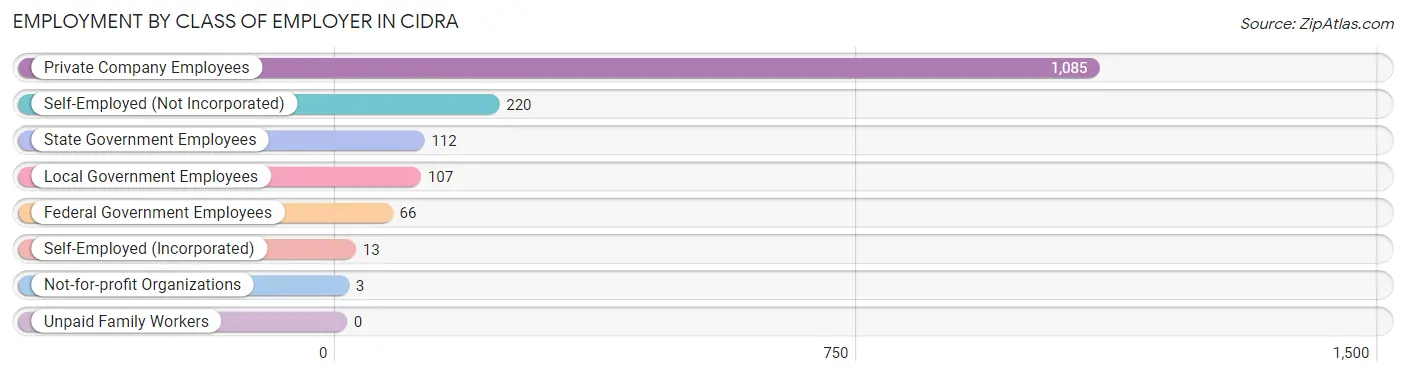
| Employer Class | # Employees | % Employees |
| Private Company Employees | 1,085 | 67.6% |
| Self-Employed (Incorporated) | 13 | 0.8% |
| Self-Employed (Not Incorporated) | 220 | 13.7% |
| Not-for-profit Organizations | 3 | 0.2% |
| Local Government Employees | 107 | 6.7% |
| State Government Employees | 112 | 7.0% |
| Federal Government Employees | 66 | 4.1% |
| Unpaid Family Workers | 0 | 0.0% |
| Total | 1,606 | 100.0% |
Employment Status by Age in Cidra
According to the labor force statistics for Cidra, out of the total population over 16 years of age (5,345), 35.2% or 1,881 individuals are in the labor force, with 12.7% or 239 of them unemployed. The age group with the highest labor force participation rate is 25 to 29 years, with 70.2% or 356 individuals in the labor force. Within the labor force, the 20 to 24 years age range has the highest percentage of unemployed individuals, with 44.6% or 79 of them being unemployed.
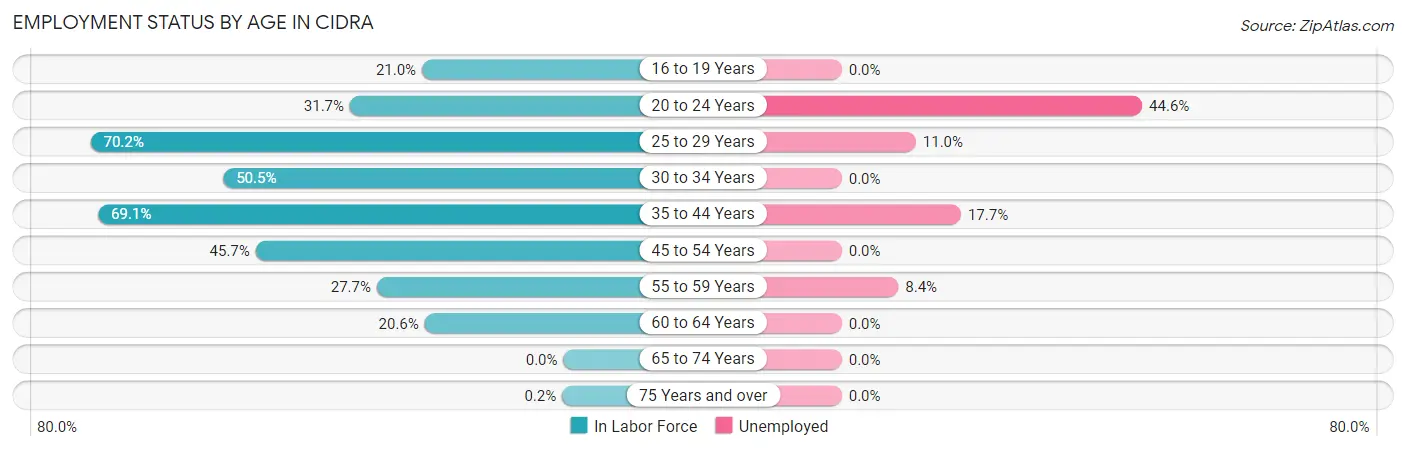
| Age Bracket | In Labor Force | Unemployed |
| 16 to 19 Years | 87 (21.0%) | 0 (0.0%) |
| 20 to 24 Years | 177 (31.7%) | 79 (44.6%) |
| 25 to 29 Years | 356 (70.2%) | 39 (11.0%) |
| 30 to 34 Years | 102 (50.5%) | 0 (0.0%) |
| 35 to 44 Years | 605 (69.1%) | 107 (17.7%) |
| 45 to 54 Years | 397 (45.7%) | 0 (0.0%) |
| 55 to 59 Years | 83 (27.7%) | 7 (8.4%) |
| 60 to 64 Years | 74 (20.6%) | 0 (0.0%) |
| 65 to 74 Years | 0 (0.0%) | 0 (0.0%) |
| 75 Years and over | 1 (0.2%) | 0 (0.0%) |
| Total | 1,881 (35.2%) | 239 (12.7%) |
Employment Status by Educational Attainment in Cidra
According to labor force statistics for Cidra, 51.9% of individuals (1,616) out of the total population between 25 and 64 years of age (3,114) are in the labor force, with 9.8% or 158 of them being unemployed. The group with the highest labor force participation rate are those with the educational attainment of college / associate degree, with 71.2% or 616 individuals in the labor force. Within the labor force, individuals with less than high school education have the highest percentage of unemployment, with 24.4% or 39 of them being unemployed.
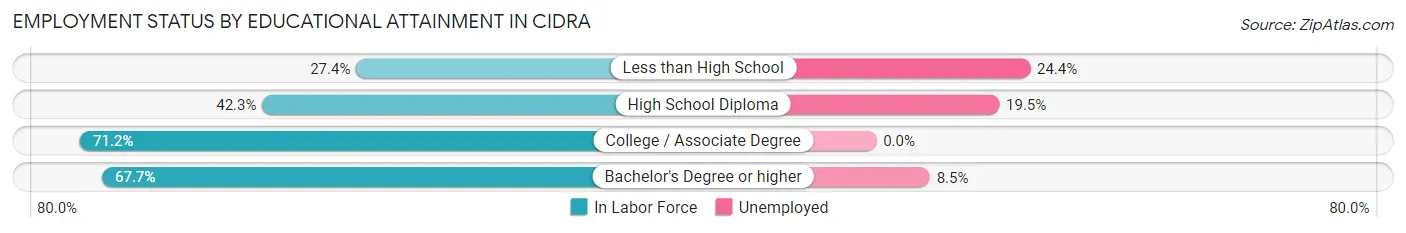
| Educational Attainment | In Labor Force | Unemployed |
| Less than High School | 160 (27.4%) | 143 (24.4%) |
| High School Diploma | 476 (42.3%) | 219 (19.5%) |
| College / Associate Degree | 616 (71.2%) | 0 (0.0%) |
| Bachelor's Degree or higher | 365 (67.7%) | 46 (8.5%) |
| Total | 1,616 (51.9%) | 305 (9.8%) |
Employment Occupations by Sex in Cidra
Management, Business, Science and Arts Occupations
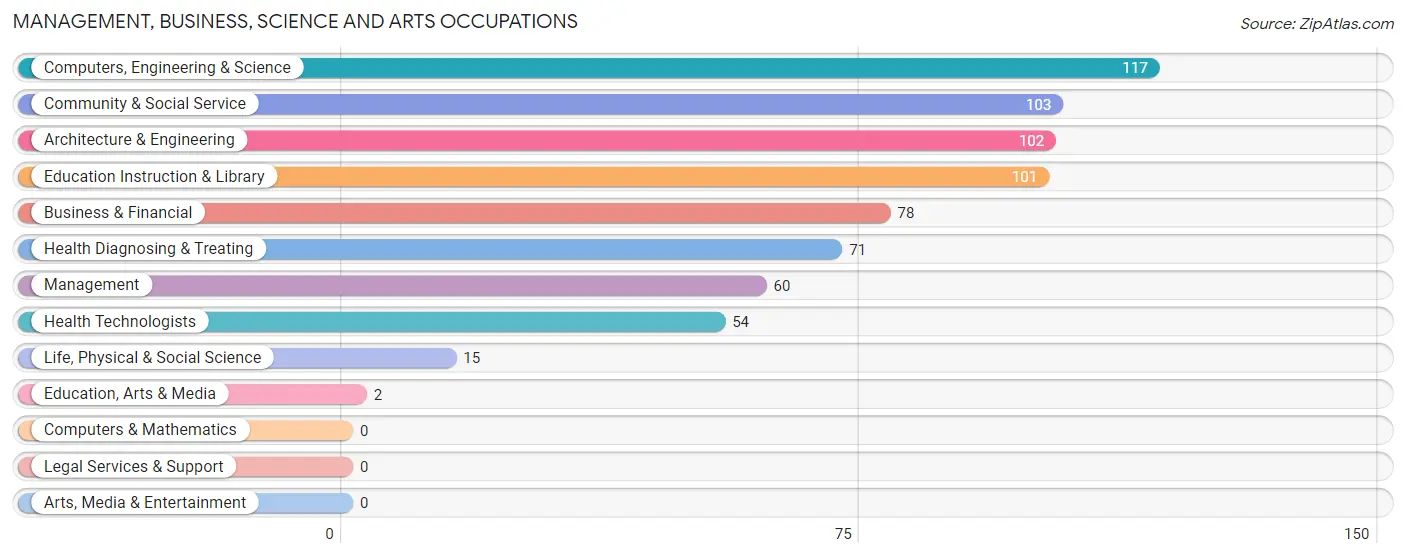
The most common Management, Business, Science and Arts occupations in Cidra are Computers, Engineering & Science (117 | 7.3%), Community & Social Service (103 | 6.4%), Architecture & Engineering (102 | 6.4%), Education Instruction & Library (101 | 6.3%), and Business & Financial (78 | 4.9%).
Management, Business, Science and Arts Occupations by Sex
Within the Management, Business, Science and Arts occupations in Cidra, the most male-oriented occupations are Education, Arts & Media (100.0%), Management (35.0%), and Architecture & Engineering (31.4%), while the most female-oriented occupations are Business & Financial (100.0%), Life, Physical & Social Science (100.0%), and Health Diagnosing & Treating (100.0%).
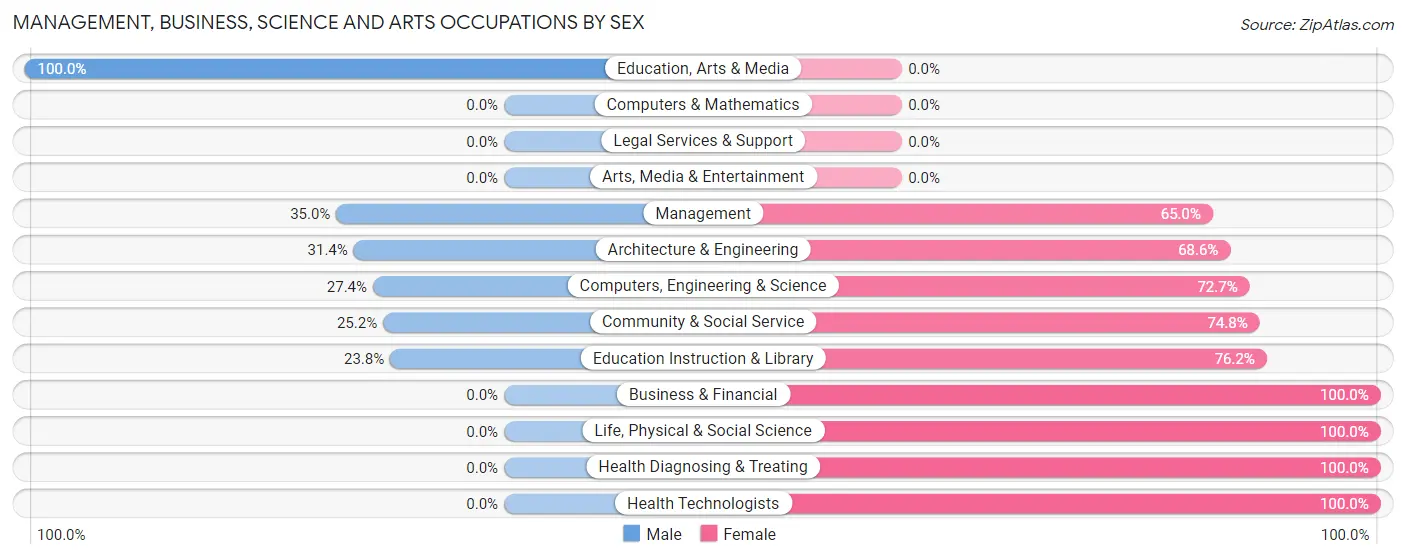
| Occupation | Male | Female |
| Management | 21 (35.0%) | 39 (65.0%) |
| Business & Financial | 0 (0.0%) | 78 (100.0%) |
| Computers, Engineering & Science | 32 (27.4%) | 85 (72.7%) |
| Computers & Mathematics | 0 (0.0%) | 0 (0.0%) |
| Architecture & Engineering | 32 (31.4%) | 70 (68.6%) |
| Life, Physical & Social Science | 0 (0.0%) | 15 (100.0%) |
| Community & Social Service | 26 (25.2%) | 77 (74.8%) |
| Education, Arts & Media | 2 (100.0%) | 0 (0.0%) |
| Legal Services & Support | 0 (0.0%) | 0 (0.0%) |
| Education Instruction & Library | 24 (23.8%) | 77 (76.2%) |
| Arts, Media & Entertainment | 0 (0.0%) | 0 (0.0%) |
| Health Diagnosing & Treating | 0 (0.0%) | 71 (100.0%) |
| Health Technologists | 0 (0.0%) | 54 (100.0%) |
| Total (Category) | 79 (18.4%) | 350 (81.6%) |
| Total (Overall) | 732 (45.8%) | 867 (54.2%) |
Services Occupations
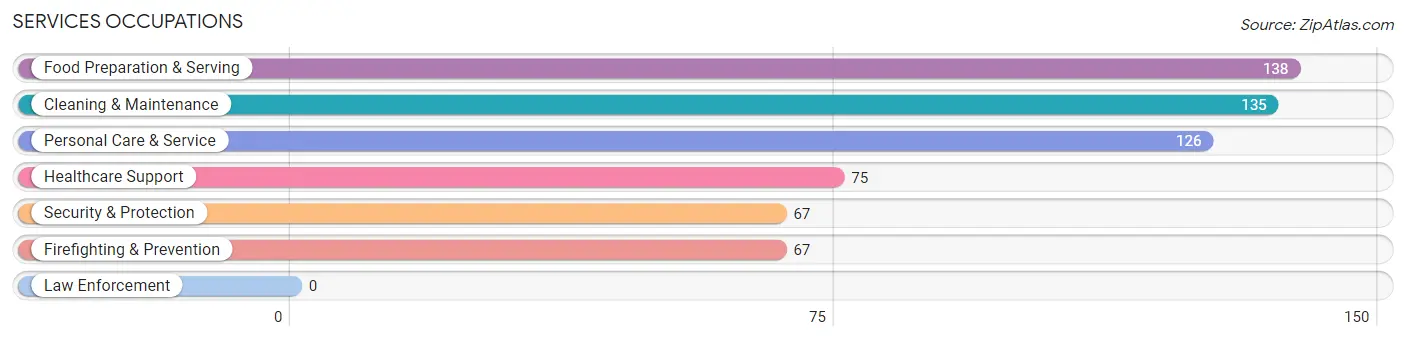
The most common Services occupations in Cidra are Food Preparation & Serving (138 | 8.6%), Cleaning & Maintenance (135 | 8.4%), Personal Care & Service (126 | 7.9%), Healthcare Support (75 | 4.7%), and Security & Protection (67 | 4.2%).
Services Occupations by Sex
Within the Services occupations in Cidra, the most male-oriented occupations are Security & Protection (82.1%), Firefighting & Prevention (82.1%), and Personal Care & Service (59.5%), while the most female-oriented occupations are Food Preparation & Serving (79.7%), Cleaning & Maintenance (64.4%), and Healthcare Support (62.7%).
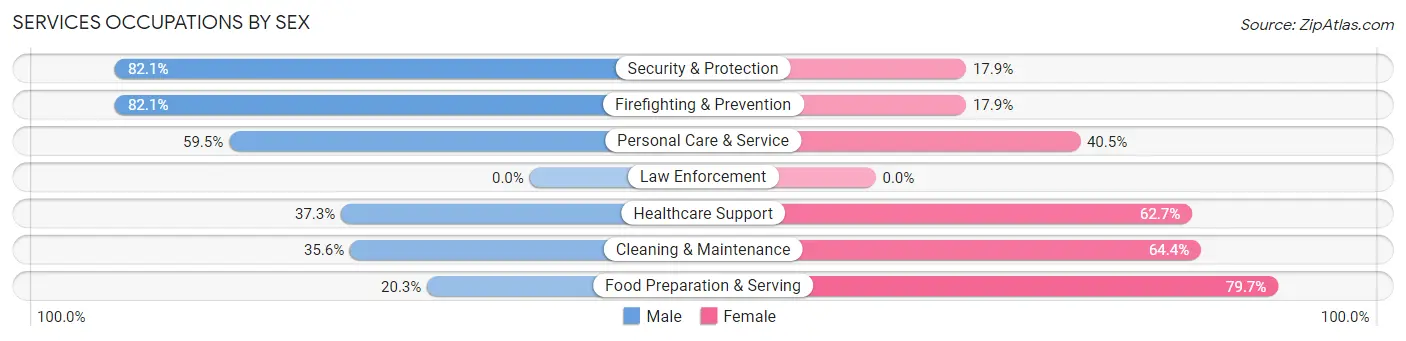
| Occupation | Male | Female |
| Healthcare Support | 28 (37.3%) | 47 (62.7%) |
| Security & Protection | 55 (82.1%) | 12 (17.9%) |
| Firefighting & Prevention | 55 (82.1%) | 12 (17.9%) |
| Law Enforcement | 0 (0.0%) | 0 (0.0%) |
| Food Preparation & Serving | 28 (20.3%) | 110 (79.7%) |
| Cleaning & Maintenance | 48 (35.6%) | 87 (64.4%) |
| Personal Care & Service | 75 (59.5%) | 51 (40.5%) |
| Total (Category) | 234 (43.2%) | 307 (56.8%) |
| Total (Overall) | 732 (45.8%) | 867 (54.2%) |
Sales and Office Occupations
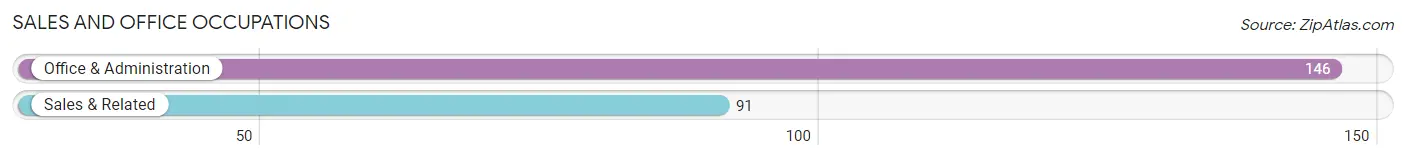
The most common Sales and Office occupations in Cidra are Office & Administration (146 | 9.1%), and Sales & Related (91 | 5.7%).
Sales and Office Occupations by Sex
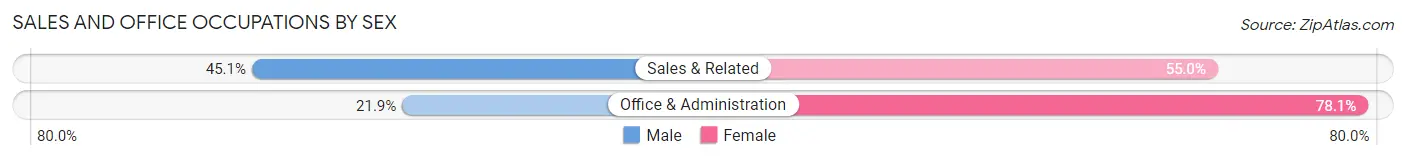
| Occupation | Male | Female |
| Sales & Related | 41 (45.1%) | 50 (54.9%) |
| Office & Administration | 32 (21.9%) | 114 (78.1%) |
| Total (Category) | 73 (30.8%) | 164 (69.2%) |
| Total (Overall) | 732 (45.8%) | 867 (54.2%) |
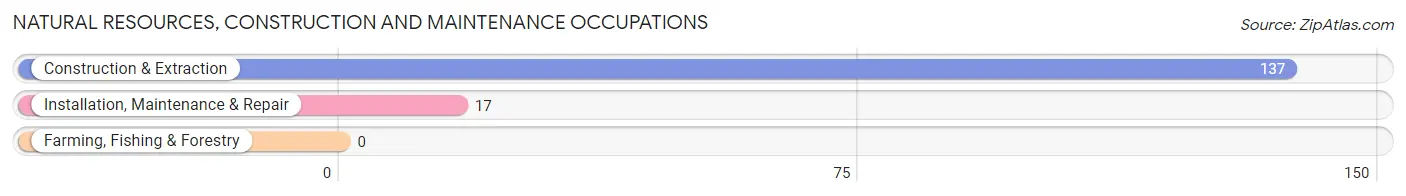
Natural Resources, Construction and Maintenance Occupations
The most common Natural Resources, Construction and Maintenance occupations in Cidra are Construction & Extraction (137 | 8.6%), and Installation, Maintenance & Repair (17 | 1.1%).
Natural Resources, Construction and Maintenance Occupations by Sex
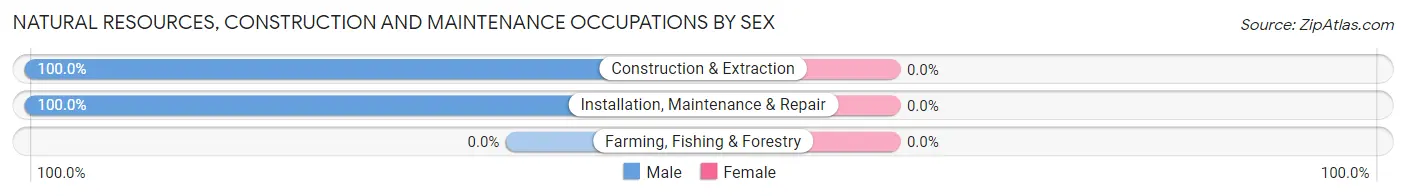
| Occupation | Male | Female |
| Farming, Fishing & Forestry | 0 (0.0%) | 0 (0.0%) |
| Construction & Extraction | 137 (100.0%) | 0 (0.0%) |
| Installation, Maintenance & Repair | 17 (100.0%) | 0 (0.0%) |
| Total (Category) | 154 (100.0%) | 0 (0.0%) |
| Total (Overall) | 732 (45.8%) | 867 (54.2%) |
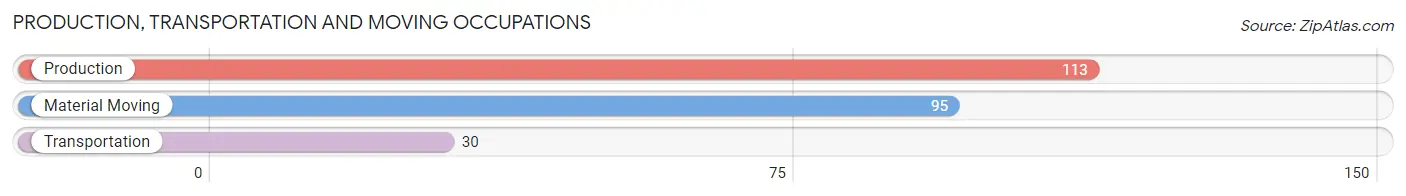
Production, Transportation and Moving Occupations
The most common Production, Transportation and Moving occupations in Cidra are Production (113 | 7.1%), Material Moving (95 | 5.9%), and Transportation (30 | 1.9%).
Production, Transportation and Moving Occupations by Sex
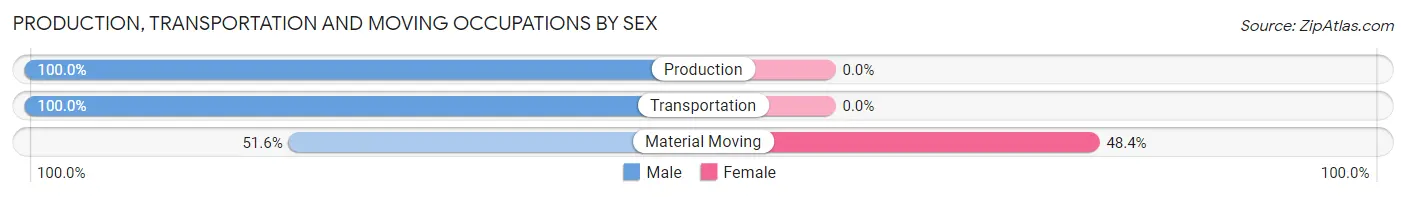
| Occupation | Male | Female |
| Production | 113 (100.0%) | 0 (0.0%) |
| Transportation | 30 (100.0%) | 0 (0.0%) |
| Material Moving | 49 (51.6%) | 46 (48.4%) |
| Total (Category) | 192 (80.7%) | 46 (19.3%) |
| Total (Overall) | 732 (45.8%) | 867 (54.2%) |
Employment Industries by Sex in Cidra
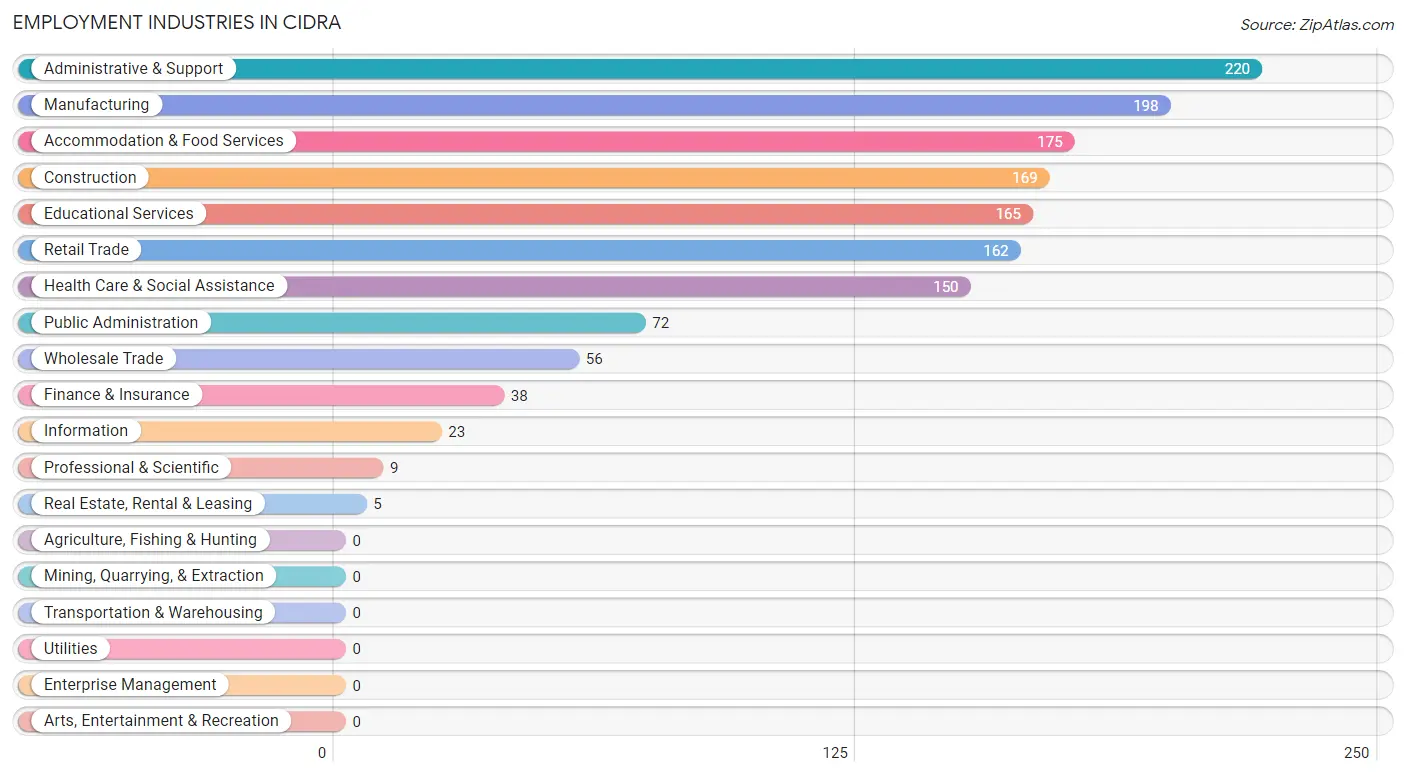
Employment Industries in Cidra
The major employment industries in Cidra include Administrative & Support (220 | 13.8%), Manufacturing (198 | 12.4%), Accommodation & Food Services (175 | 10.9%), Construction (169 | 10.6%), and Educational Services (165 | 10.3%).
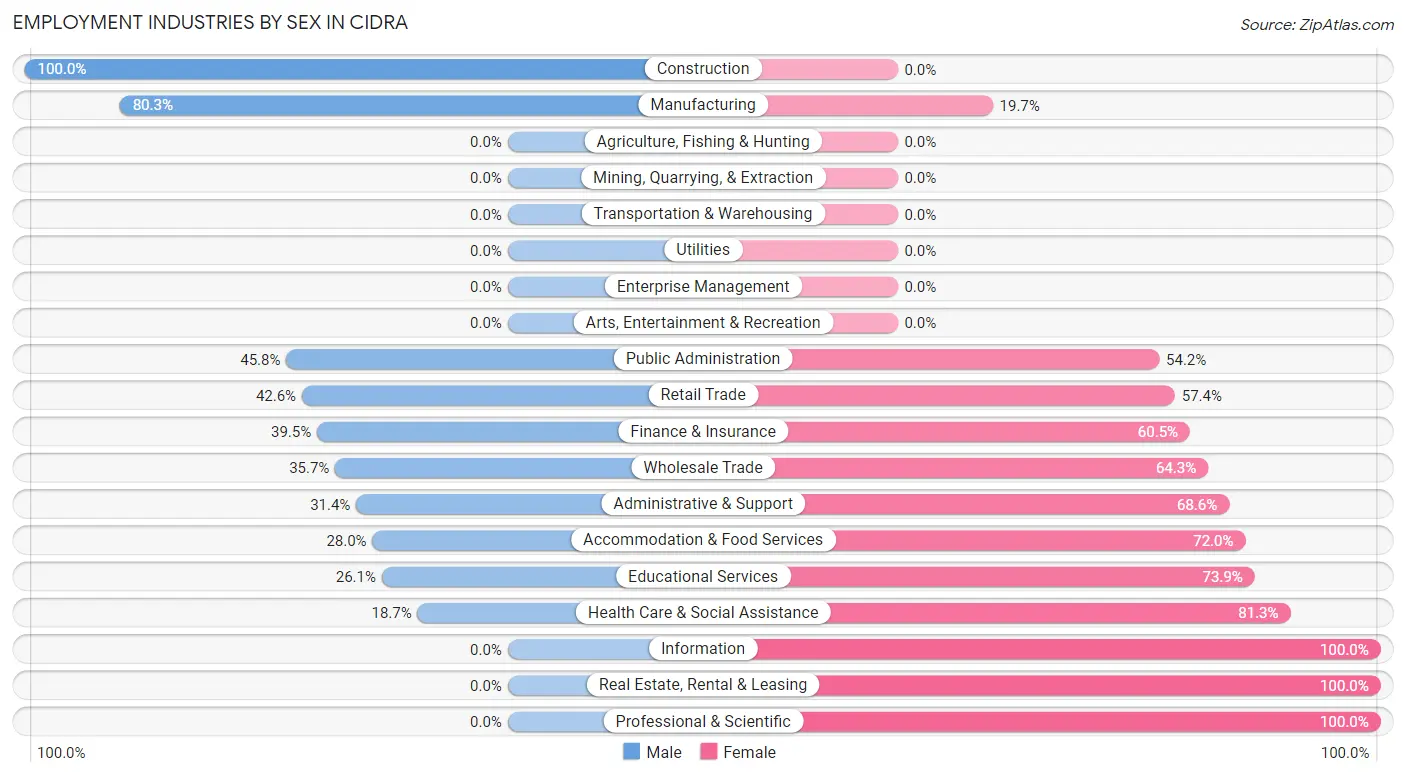
Employment Industries by Sex in Cidra
The Cidra industries that see more men than women are Construction (100.0%), Manufacturing (80.3%), and Public Administration (45.8%), whereas the industries that tend to have a higher number of women are Information (100.0%), Real Estate, Rental & Leasing (100.0%), and Professional & Scientific (100.0%).
| Industry | Male | Female |
| Agriculture, Fishing & Hunting | 0 (0.0%) | 0 (0.0%) |
| Mining, Quarrying, & Extraction | 0 (0.0%) | 0 (0.0%) |
| Construction | 169 (100.0%) | 0 (0.0%) |
| Manufacturing | 159 (80.3%) | 39 (19.7%) |
| Wholesale Trade | 20 (35.7%) | 36 (64.3%) |
| Retail Trade | 69 (42.6%) | 93 (57.4%) |
| Transportation & Warehousing | 0 (0.0%) | 0 (0.0%) |
| Utilities | 0 (0.0%) | 0 (0.0%) |
| Information | 0 (0.0%) | 23 (100.0%) |
| Finance & Insurance | 15 (39.5%) | 23 (60.5%) |
| Real Estate, Rental & Leasing | 0 (0.0%) | 5 (100.0%) |
| Professional & Scientific | 0 (0.0%) | 9 (100.0%) |
| Enterprise Management | 0 (0.0%) | 0 (0.0%) |
| Administrative & Support | 69 (31.4%) | 151 (68.6%) |
| Educational Services | 43 (26.1%) | 122 (73.9%) |
| Health Care & Social Assistance | 28 (18.7%) | 122 (81.3%) |
| Arts, Entertainment & Recreation | 0 (0.0%) | 0 (0.0%) |
| Accommodation & Food Services | 49 (28.0%) | 126 (72.0%) |
| Public Administration | 33 (45.8%) | 39 (54.2%) |
| Total | 732 (45.8%) | 867 (54.2%) |
Education in Cidra
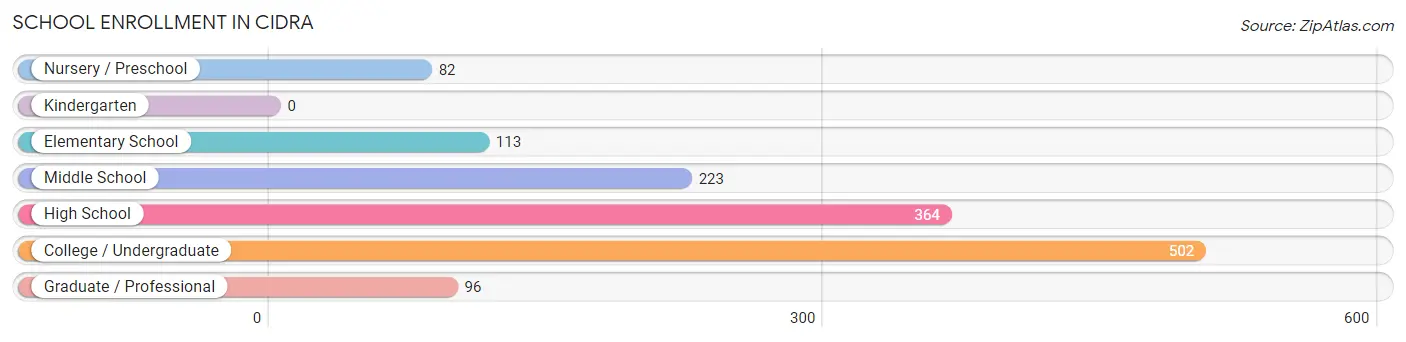
School Enrollment in Cidra
The most common levels of schooling among the 1,380 students in Cidra are college / undergraduate (502 | 36.4%), high school (364 | 26.4%), and middle school (223 | 16.2%).
| School Level | # Students | % Students |
| Nursery / Preschool | 82 | 5.9% |
| Kindergarten | 0 | 0.0% |
| Elementary School | 113 | 8.2% |
| Middle School | 223 | 16.2% |
| High School | 364 | 26.4% |
| College / Undergraduate | 502 | 36.4% |
| Graduate / Professional | 96 | 7.0% |
| Total | 1,380 | 100.0% |
School Enrollment by Age by Funding Source in Cidra
Out of a total of 1,380 students who are enrolled in schools in Cidra, 429 (31.1%) attend a private institution, while the remaining 951 (68.9%) are enrolled in public schools. The age group of 25 to 34 year olds has the highest likelihood of being enrolled in private schools, with 114 (100.0% in the age bracket) enrolled. Conversely, the age group of 5 to 9 year old has the lowest likelihood of being enrolled in a private school, with 229 (100.0% in the age bracket) attending a public institution.
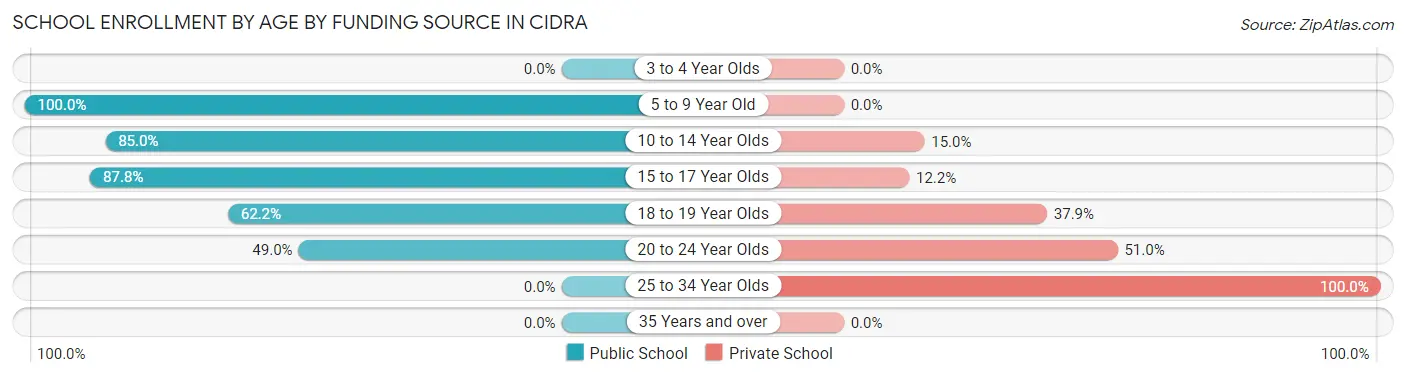
| Age Bracket | Public School | Private School |
| 3 to 4 Year Olds | 0 (0.0%) | 0 (0.0%) |
| 5 to 9 Year Old | 229 (100.0%) | 0 (0.0%) |
| 10 to 14 Year Olds | 232 (85.0%) | 41 (15.0%) |
| 15 to 17 Year Olds | 209 (87.8%) | 29 (12.2%) |
| 18 to 19 Year Olds | 110 (62.2%) | 67 (37.9%) |
| 20 to 24 Year Olds | 171 (49.0%) | 178 (51.0%) |
| 25 to 34 Year Olds | 0 (0.0%) | 114 (100.0%) |
| 35 Years and over | 0 (0.0%) | 0 (0.0%) |
| Total | 951 (68.9%) | 429 (31.1%) |
Educational Attainment by Field of Study in Cidra
Education (228 | 29.6%), business (160 | 20.8%), science & technology (130 | 16.9%), communications (79 | 10.3%), and engineering (62 | 8.1%) are the most common fields of study among 769 individuals in Cidra who have obtained a bachelor's degree or higher.
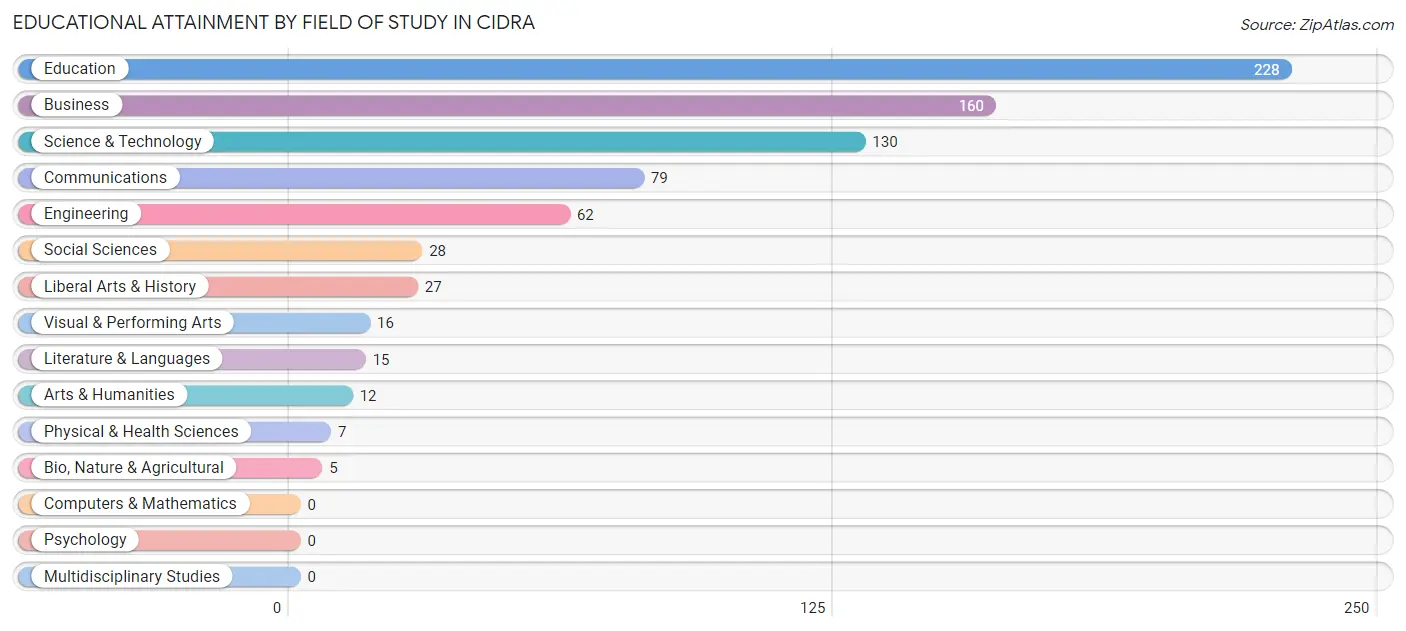
| Field of Study | # Graduates | % Graduates |
| Computers & Mathematics | 0 | 0.0% |
| Bio, Nature & Agricultural | 5 | 0.6% |
| Physical & Health Sciences | 7 | 0.9% |
| Psychology | 0 | 0.0% |
| Social Sciences | 28 | 3.6% |
| Engineering | 62 | 8.1% |
| Multidisciplinary Studies | 0 | 0.0% |
| Science & Technology | 130 | 16.9% |
| Business | 160 | 20.8% |
| Education | 228 | 29.6% |
| Literature & Languages | 15 | 1.9% |
| Liberal Arts & History | 27 | 3.5% |
| Visual & Performing Arts | 16 | 2.1% |
| Communications | 79 | 10.3% |
| Arts & Humanities | 12 | 1.6% |
| Total | 769 | 100.0% |
Transportation & Commute in Cidra
Vehicle Availability by Sex in Cidra
The most prevalent vehicle ownership categories in Cidra are males with 2 vehicles (347, accounting for 44.5%) and females with 2 vehicles (330, making up 42.2%).
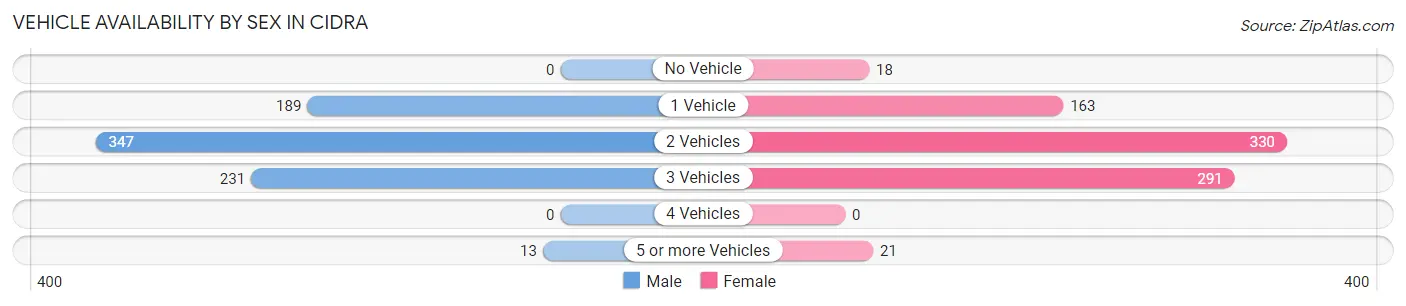
| Vehicles Available | Male | Female |
| No Vehicle | 0 (0.0%) | 18 (2.2%) |
| 1 Vehicle | 189 (24.2%) | 163 (19.8%) |
| 2 Vehicles | 347 (44.5%) | 330 (40.1%) |
| 3 Vehicles | 231 (29.6%) | 291 (35.4%) |
| 4 Vehicles | 0 (0.0%) | 0 (0.0%) |
| 5 or more Vehicles | 13 (1.7%) | 21 (2.5%) |
| Total | 780 (100.0%) | 823 (100.0%) |
Commute Time in Cidra
The most frequently occuring commute durations in Cidra are 10 to 14 minutes (423 commuters, 26.4%), 5 to 9 minutes (215 commuters, 13.4%), and 15 to 19 minutes (168 commuters, 10.5%).
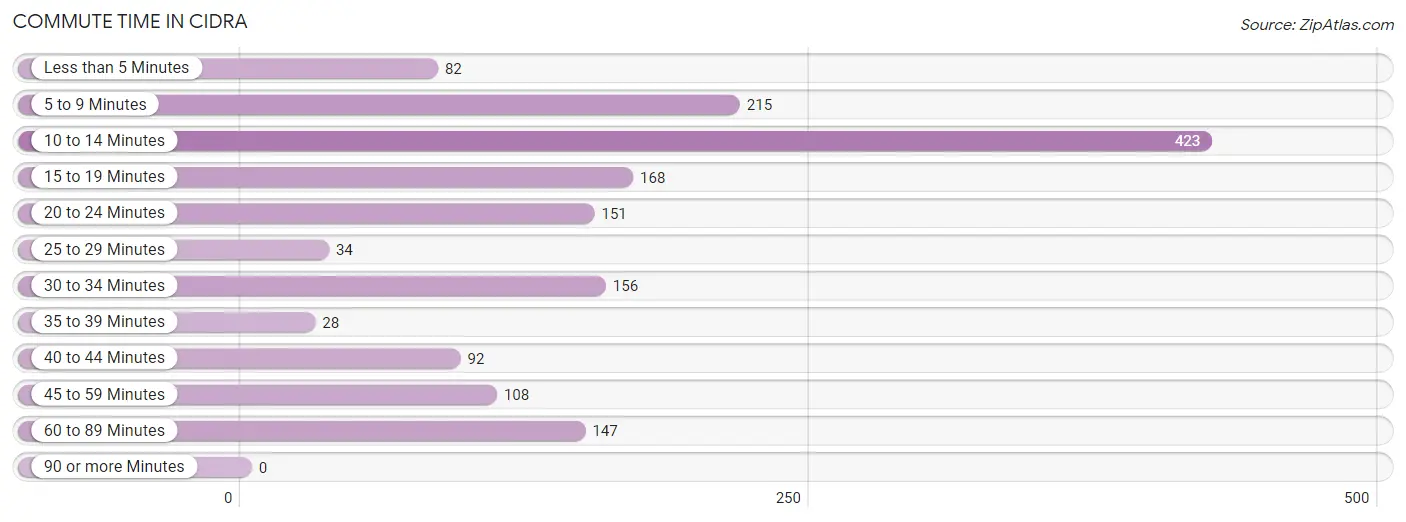
| Commute Time | # Commuters | % Commuters |
| Less than 5 Minutes | 82 | 5.1% |
| 5 to 9 Minutes | 215 | 13.4% |
| 10 to 14 Minutes | 423 | 26.4% |
| 15 to 19 Minutes | 168 | 10.5% |
| 20 to 24 Minutes | 151 | 9.4% |
| 25 to 29 Minutes | 34 | 2.1% |
| 30 to 34 Minutes | 156 | 9.7% |
| 35 to 39 Minutes | 28 | 1.8% |
| 40 to 44 Minutes | 92 | 5.7% |
| 45 to 59 Minutes | 108 | 6.7% |
| 60 to 89 Minutes | 147 | 9.2% |
| 90 or more Minutes | 0 | 0.0% |
Commute Time by Sex in Cidra
The most common commute times in Cidra are 10 to 14 minutes (180 commuters, 23.1%) for males and 10 to 14 minutes (243 commuters, 29.5%) for females.
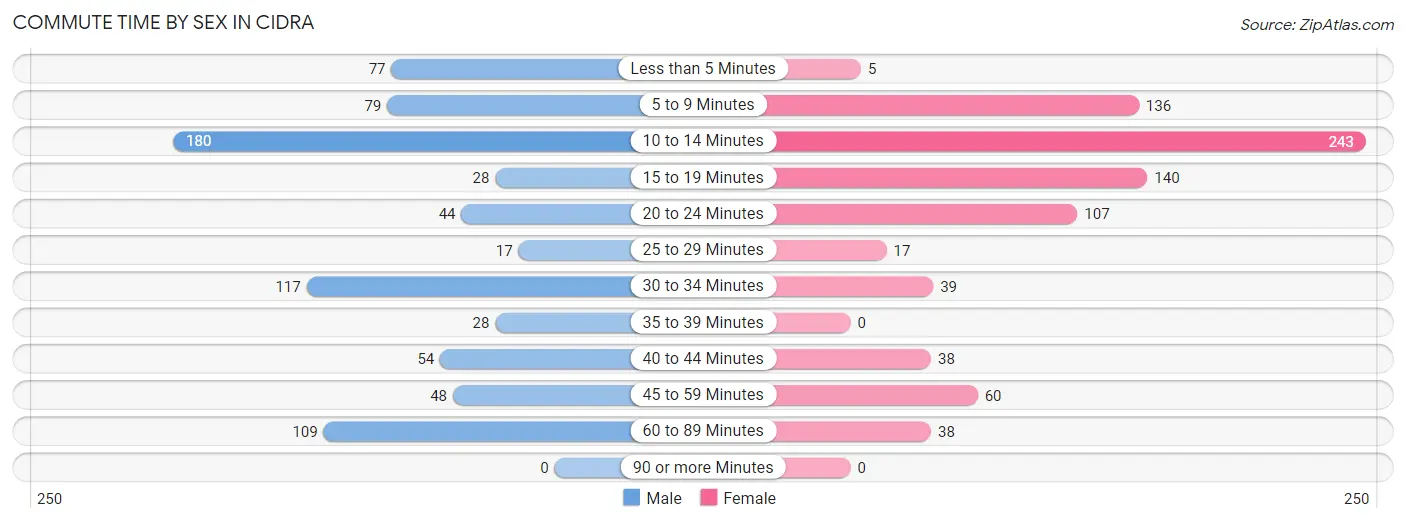
| Commute Time | Male | Female |
| Less than 5 Minutes | 77 (9.9%) | 5 (0.6%) |
| 5 to 9 Minutes | 79 (10.1%) | 136 (16.5%) |
| 10 to 14 Minutes | 180 (23.1%) | 243 (29.5%) |
| 15 to 19 Minutes | 28 (3.6%) | 140 (17.0%) |
| 20 to 24 Minutes | 44 (5.6%) | 107 (13.0%) |
| 25 to 29 Minutes | 17 (2.2%) | 17 (2.1%) |
| 30 to 34 Minutes | 117 (15.0%) | 39 (4.7%) |
| 35 to 39 Minutes | 28 (3.6%) | 0 (0.0%) |
| 40 to 44 Minutes | 54 (6.9%) | 38 (4.6%) |
| 45 to 59 Minutes | 48 (6.1%) | 60 (7.3%) |
| 60 to 89 Minutes | 109 (14.0%) | 38 (4.6%) |
| 90 or more Minutes | 0 (0.0%) | 0 (0.0%) |
Time of Departure to Work by Sex in Cidra
The most frequent times of departure to work in Cidra are 6:00 AM to 6:29 AM (269, 34.4%) for males and 6:30 AM to 6:59 AM (223, 27.1%) for females.
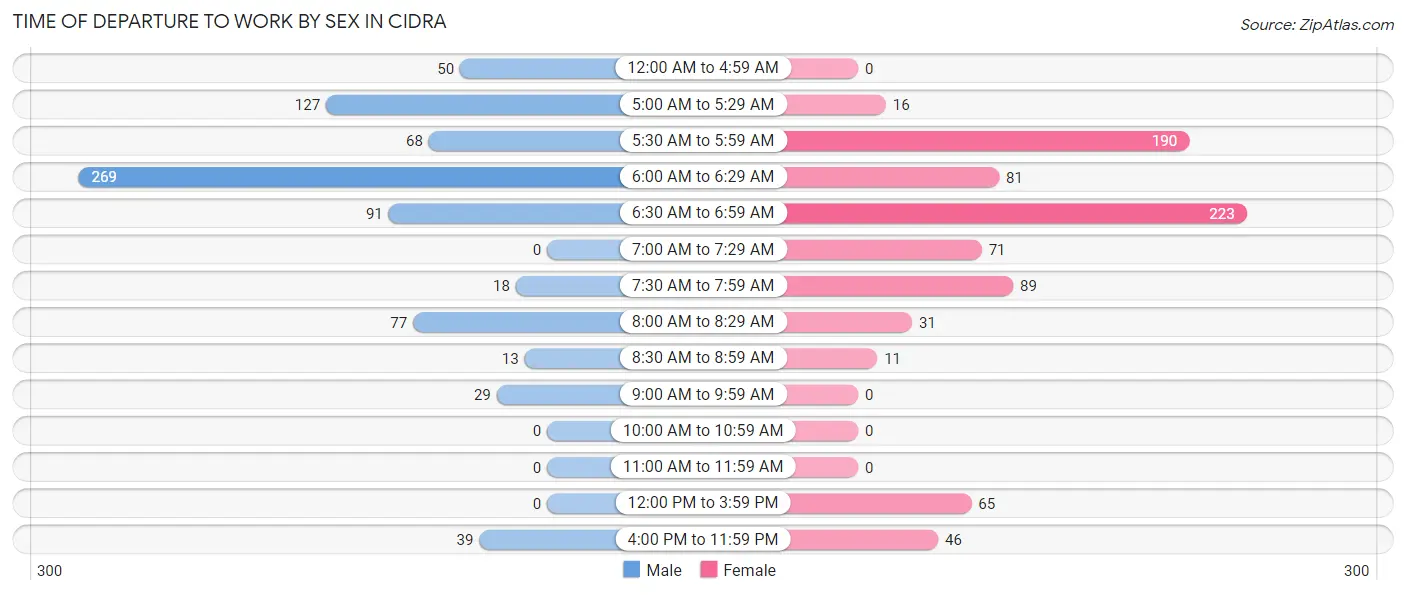
| Time of Departure | Male | Female |
| 12:00 AM to 4:59 AM | 50 (6.4%) | 0 (0.0%) |
| 5:00 AM to 5:29 AM | 127 (16.3%) | 16 (1.9%) |
| 5:30 AM to 5:59 AM | 68 (8.7%) | 190 (23.1%) |
| 6:00 AM to 6:29 AM | 269 (34.4%) | 81 (9.8%) |
| 6:30 AM to 6:59 AM | 91 (11.7%) | 223 (27.1%) |
| 7:00 AM to 7:29 AM | 0 (0.0%) | 71 (8.6%) |
| 7:30 AM to 7:59 AM | 18 (2.3%) | 89 (10.8%) |
| 8:00 AM to 8:29 AM | 77 (9.9%) | 31 (3.8%) |
| 8:30 AM to 8:59 AM | 13 (1.7%) | 11 (1.3%) |
| 9:00 AM to 9:59 AM | 29 (3.7%) | 0 (0.0%) |
| 10:00 AM to 10:59 AM | 0 (0.0%) | 0 (0.0%) |
| 11:00 AM to 11:59 AM | 0 (0.0%) | 0 (0.0%) |
| 12:00 PM to 3:59 PM | 0 (0.0%) | 65 (7.9%) |
| 4:00 PM to 11:59 PM | 39 (5.0%) | 46 (5.6%) |
| Total | 781 (100.0%) | 823 (100.0%) |
Housing Occupancy in Cidra
Occupancy by Ownership in Cidra
Of the total 2,139 dwellings in Cidra, owner-occupied units account for 1,045 (48.8%), while renter-occupied units make up 1,094 (51.1%).
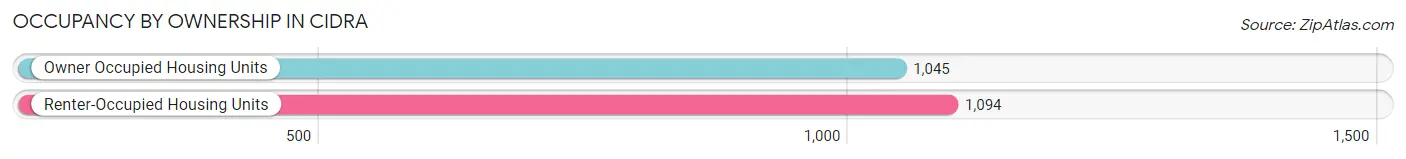
| Occupancy | # Housing Units | % Housing Units |
| Owner Occupied Housing Units | 1,045 | 48.8% |
| Renter-Occupied Housing Units | 1,094 | 51.1% |
| Total Occupied Housing Units | 2,139 | 100.0% |
Occupancy by Household Size in Cidra
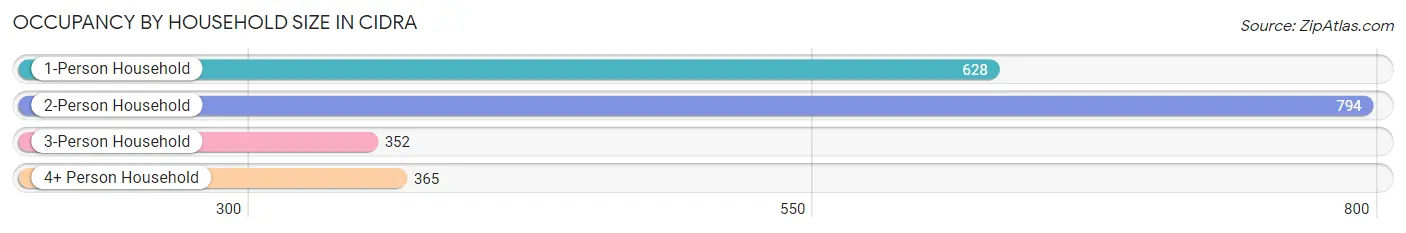
| Household Size | # Housing Units | % Housing Units |
| 1-Person Household | 628 | 29.4% |
| 2-Person Household | 794 | 37.1% |
| 3-Person Household | 352 | 16.5% |
| 4+ Person Household | 365 | 17.1% |
| Total Housing Units | 2,139 | 100.0% |
Occupancy by Ownership by Household Size in Cidra
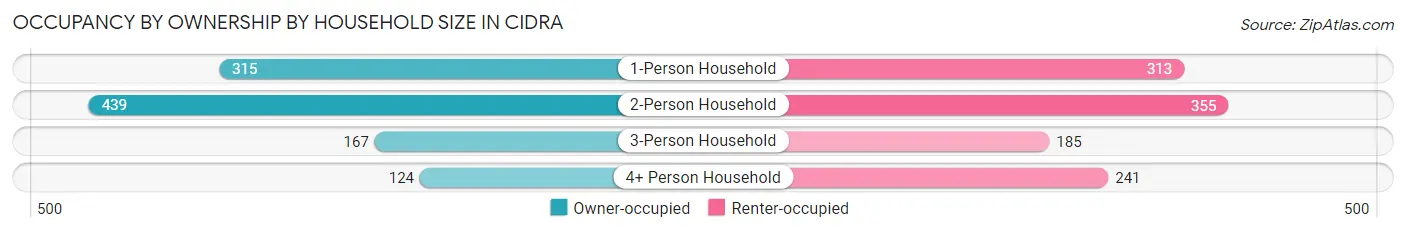
| Household Size | Owner-occupied | Renter-occupied |
| 1-Person Household | 315 (50.2%) | 313 (49.8%) |
| 2-Person Household | 439 (55.3%) | 355 (44.7%) |
| 3-Person Household | 167 (47.4%) | 185 (52.6%) |
| 4+ Person Household | 124 (34.0%) | 241 (66.0%) |
| Total Housing Units | 1,045 (48.8%) | 1,094 (51.1%) |
Occupancy by Educational Attainment in Cidra
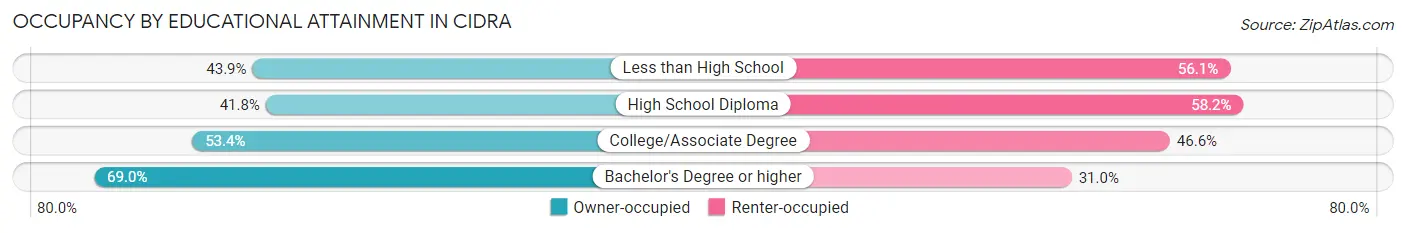
| Household Size | Owner-occupied | Renter-occupied |
| Less than High School | 254 (43.9%) | 325 (56.1%) |
| High School Diploma | 304 (41.8%) | 424 (58.2%) |
| College/Associate Degree | 298 (53.4%) | 260 (46.6%) |
| Bachelor's Degree or higher | 189 (69.0%) | 85 (31.0%) |
Occupancy by Age of Householder in Cidra
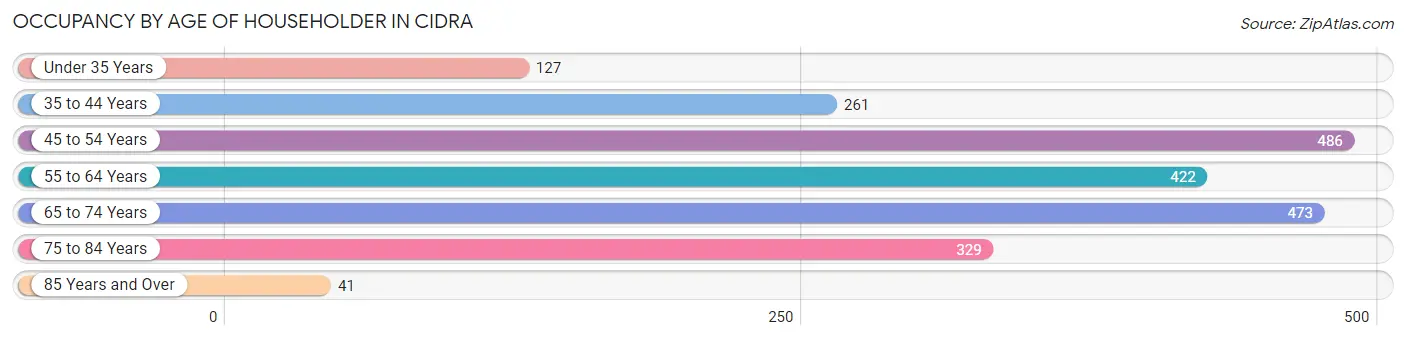
| Age Bracket | # Households | % Households |
| Under 35 Years | 127 | 5.9% |
| 35 to 44 Years | 261 | 12.2% |
| 45 to 54 Years | 486 | 22.7% |
| 55 to 64 Years | 422 | 19.7% |
| 65 to 74 Years | 473 | 22.1% |
| 75 to 84 Years | 329 | 15.4% |
| 85 Years and Over | 41 | 1.9% |
| Total | 2,139 | 100.0% |
Housing Finances in Cidra
Median Income by Occupancy in Cidra
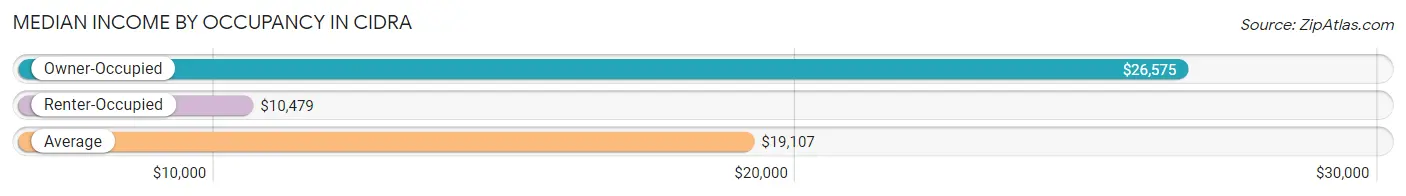
| Occupancy Type | # Households | Median Income |
| Owner-Occupied | 1,045 (48.8%) | $26,575 |
| Renter-Occupied | 1,094 (51.1%) | $10,479 |
| Average | 2,139 (100.0%) | $19,107 |
Occupancy by Householder Income Bracket in Cidra
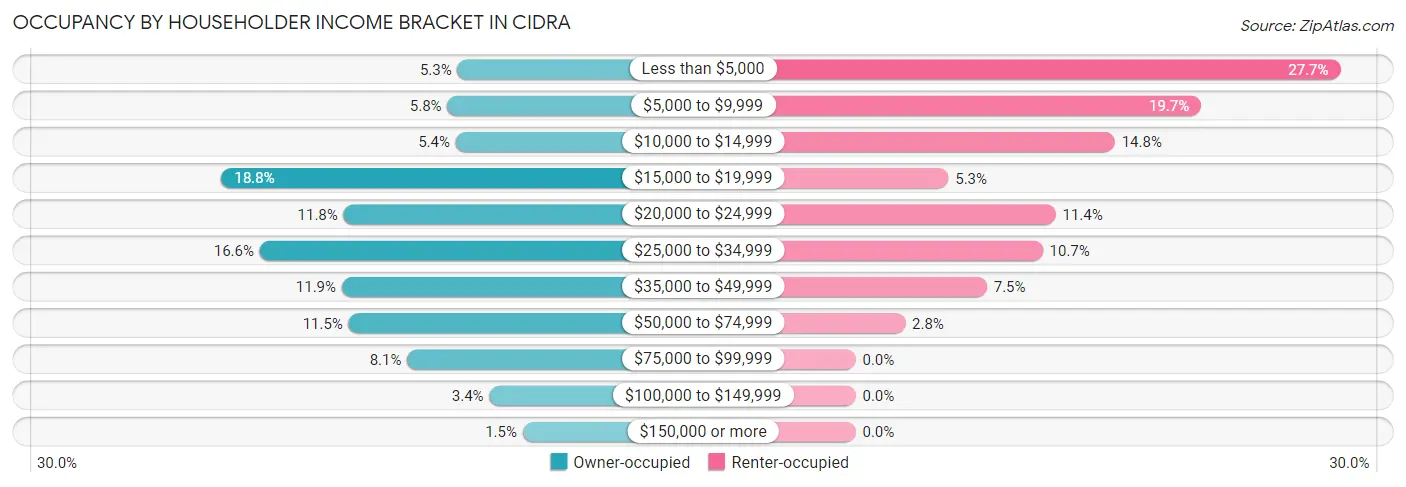
| Income Bracket | Owner-occupied | Renter-occupied |
| Less than $5,000 | 55 (5.3%) | 303 (27.7%) |
| $5,000 to $9,999 | 61 (5.8%) | 216 (19.7%) |
| $10,000 to $14,999 | 56 (5.4%) | 162 (14.8%) |
| $15,000 to $19,999 | 196 (18.8%) | 58 (5.3%) |
| $20,000 to $24,999 | 123 (11.8%) | 125 (11.4%) |
| $25,000 to $34,999 | 173 (16.6%) | 117 (10.7%) |
| $35,000 to $49,999 | 124 (11.9%) | 82 (7.5%) |
| $50,000 to $74,999 | 120 (11.5%) | 31 (2.8%) |
| $75,000 to $99,999 | 85 (8.1%) | 0 (0.0%) |
| $100,000 to $149,999 | 36 (3.4%) | 0 (0.0%) |
| $150,000 or more | 16 (1.5%) | 0 (0.0%) |
| Total | 1,045 (100.0%) | 1,094 (100.0%) |
Monthly Housing Cost Tiers in Cidra
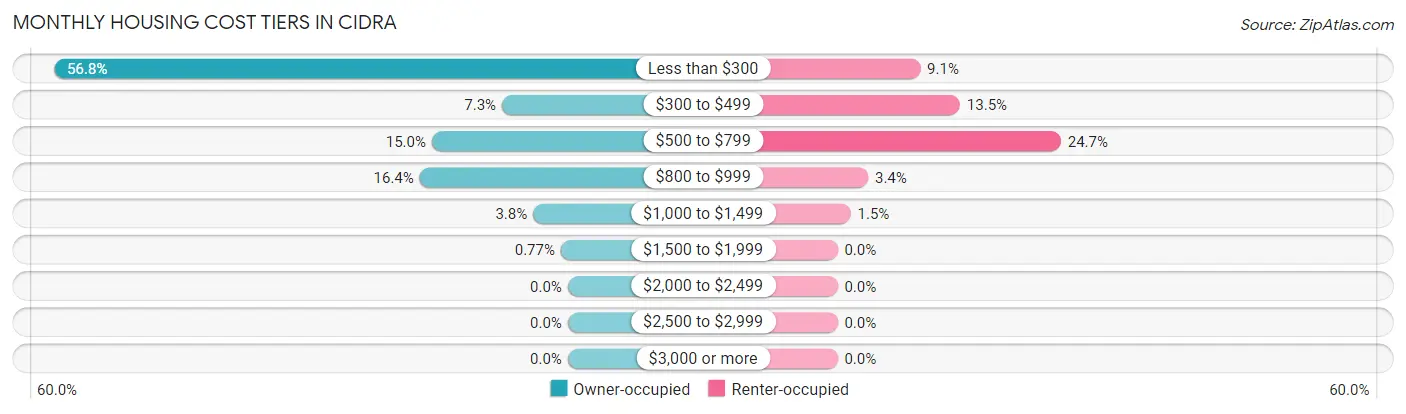
| Monthly Cost | Owner-occupied | Renter-occupied |
| Less than $300 | 593 (56.8%) | 100 (9.1%) |
| $300 to $499 | 76 (7.3%) | 148 (13.5%) |
| $500 to $799 | 157 (15.0%) | 270 (24.7%) |
| $800 to $999 | 171 (16.4%) | 37 (3.4%) |
| $1,000 to $1,499 | 40 (3.8%) | 16 (1.5%) |
| $1,500 to $1,999 | 8 (0.8%) | 0 (0.0%) |
| $2,000 to $2,499 | 0 (0.0%) | 0 (0.0%) |
| $2,500 to $2,999 | 0 (0.0%) | 0 (0.0%) |
| $3,000 or more | 0 (0.0%) | 0 (0.0%) |
| Total | 1,045 (100.0%) | 1,094 (100.0%) |
Physical Housing Characteristics in Cidra
Housing Structures in Cidra
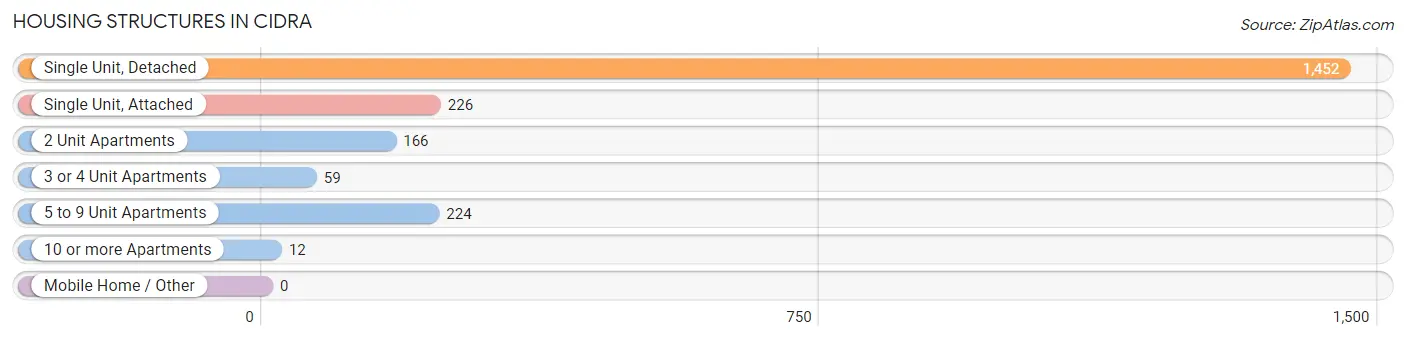
| Structure Type | # Housing Units | % Housing Units |
| Single Unit, Detached | 1,452 | 67.9% |
| Single Unit, Attached | 226 | 10.6% |
| 2 Unit Apartments | 166 | 7.8% |
| 3 or 4 Unit Apartments | 59 | 2.8% |
| 5 to 9 Unit Apartments | 224 | 10.5% |
| 10 or more Apartments | 12 | 0.6% |
| Mobile Home / Other | 0 | 0.0% |
| Total | 2,139 | 100.0% |
Housing Structures by Occupancy in Cidra
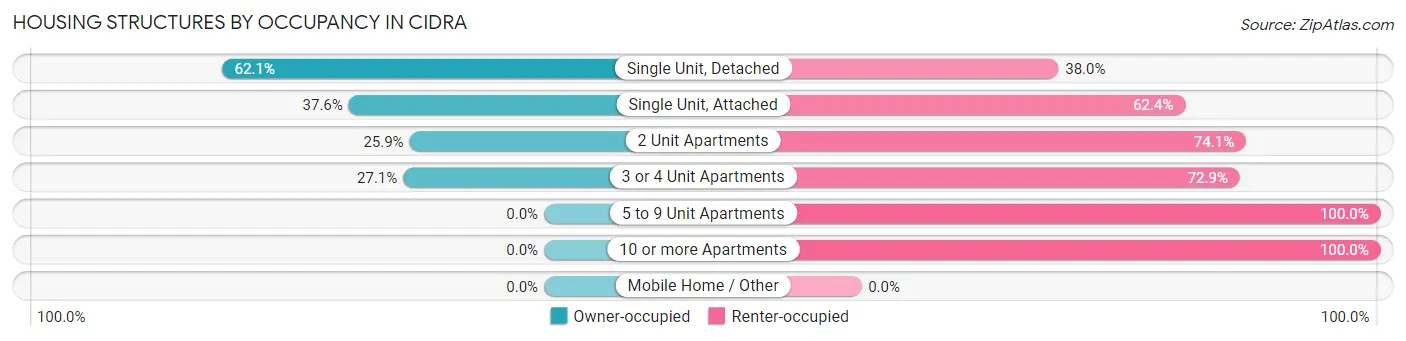
| Structure Type | Owner-occupied | Renter-occupied |
| Single Unit, Detached | 901 (62.1%) | 551 (38.0%) |
| Single Unit, Attached | 85 (37.6%) | 141 (62.4%) |
| 2 Unit Apartments | 43 (25.9%) | 123 (74.1%) |
| 3 or 4 Unit Apartments | 16 (27.1%) | 43 (72.9%) |
| 5 to 9 Unit Apartments | 0 (0.0%) | 224 (100.0%) |
| 10 or more Apartments | 0 (0.0%) | 12 (100.0%) |
| Mobile Home / Other | 0 (0.0%) | 0 (0.0%) |
| Total | 1,045 (48.8%) | 1,094 (51.1%) |
Housing Structures by Number of Rooms in Cidra
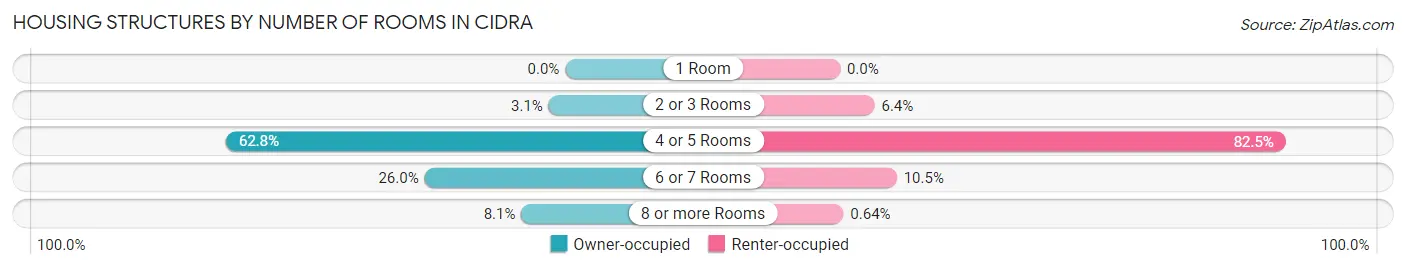
| Number of Rooms | Owner-occupied | Renter-occupied |
| 1 Room | 0 (0.0%) | 0 (0.0%) |
| 2 or 3 Rooms | 32 (3.1%) | 70 (6.4%) |
| 4 or 5 Rooms | 656 (62.8%) | 902 (82.5%) |
| 6 or 7 Rooms | 272 (26.0%) | 115 (10.5%) |
| 8 or more Rooms | 85 (8.1%) | 7 (0.6%) |
| Total | 1,045 (100.0%) | 1,094 (100.0%) |
Housing Structure by Heating Type in Cidra
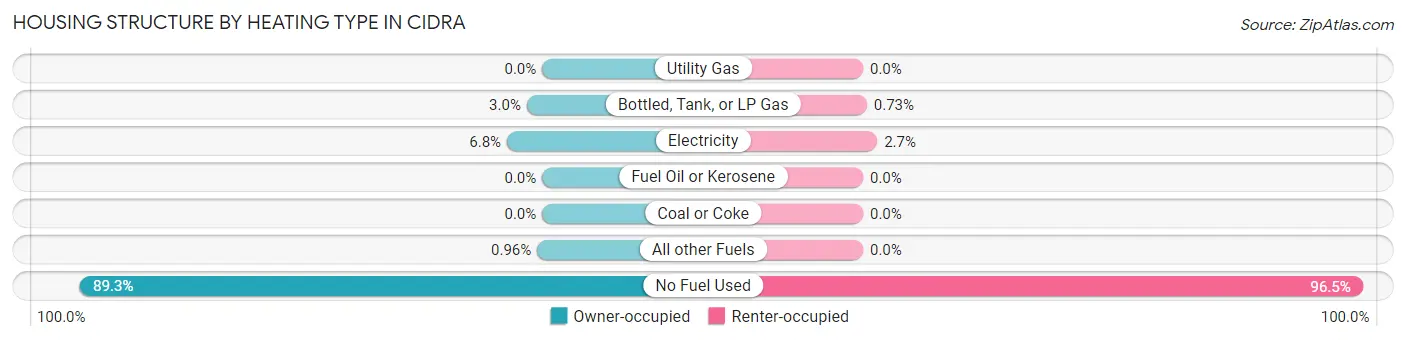
| Heating Type | Owner-occupied | Renter-occupied |
| Utility Gas | 0 (0.0%) | 0 (0.0%) |
| Bottled, Tank, or LP Gas | 31 (3.0%) | 8 (0.7%) |
| Electricity | 71 (6.8%) | 30 (2.7%) |
| Fuel Oil or Kerosene | 0 (0.0%) | 0 (0.0%) |
| Coal or Coke | 0 (0.0%) | 0 (0.0%) |
| All other Fuels | 10 (1.0%) | 0 (0.0%) |
| No Fuel Used | 933 (89.3%) | 1,056 (96.5%) |
| Total | 1,045 (100.0%) | 1,094 (100.0%) |
Household Vehicle Usage in Cidra
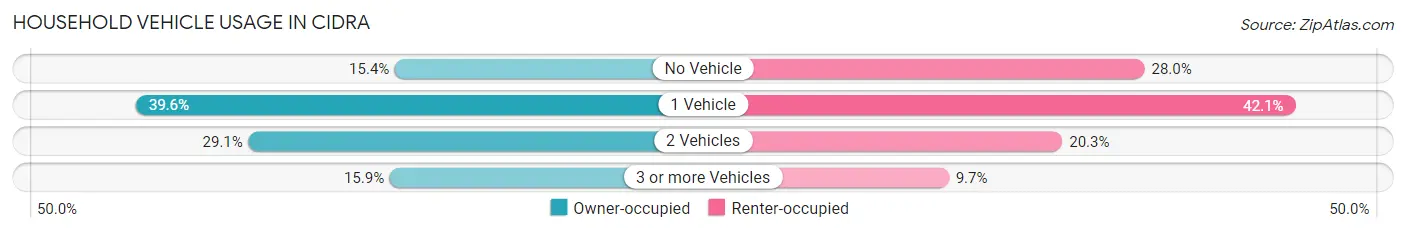
| Vehicles per Household | Owner-occupied | Renter-occupied |
| No Vehicle | 161 (15.4%) | 306 (28.0%) |
| 1 Vehicle | 414 (39.6%) | 460 (42.0%) |
| 2 Vehicles | 304 (29.1%) | 222 (20.3%) |
| 3 or more Vehicles | 166 (15.9%) | 106 (9.7%) |
| Total | 1,045 (100.0%) | 1,094 (100.0%) |
Real Estate & Mortgages in Cidra
Real Estate and Mortgage Overview in Cidra
| Characteristic | Without Mortgage | With Mortgage |
| Housing Units | 671 | 374 |
| Median Property Value | $130,200 | $116,900 |
| Median Household Income | $25,524 | $16 |
| Monthly Housing Costs | $147 | $0 |
| Real Estate Taxes | - | - |
Property Value by Mortgage Status in Cidra
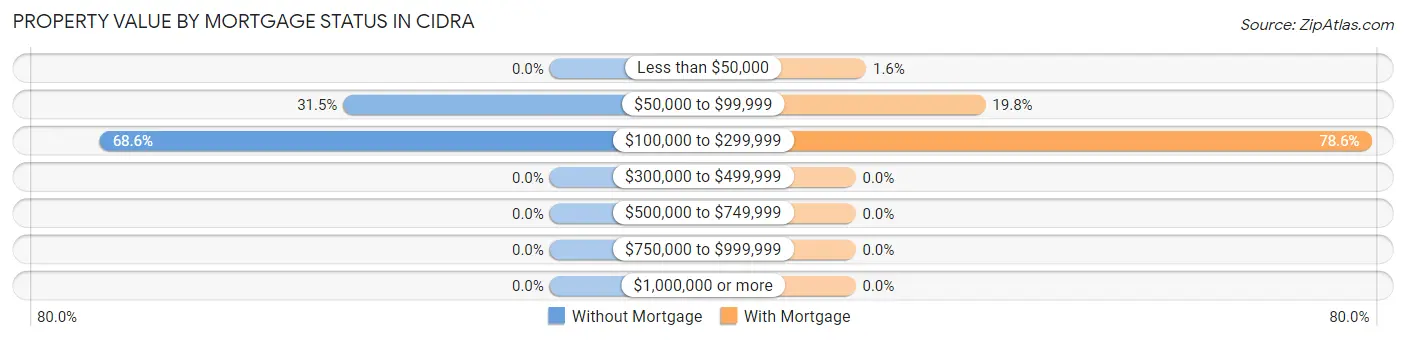
| Property Value | Without Mortgage | With Mortgage |
| Less than $50,000 | 0 (0.0%) | 6 (1.6%) |
| $50,000 to $99,999 | 211 (31.5%) | 74 (19.8%) |
| $100,000 to $299,999 | 460 (68.5%) | 294 (78.6%) |
| $300,000 to $499,999 | 0 (0.0%) | 0 (0.0%) |
| $500,000 to $749,999 | 0 (0.0%) | 0 (0.0%) |
| $750,000 to $999,999 | 0 (0.0%) | 0 (0.0%) |
| $1,000,000 or more | 0 (0.0%) | 0 (0.0%) |
| Total | 671 (100.0%) | 374 (100.0%) |
Household Income by Mortgage Status in Cidra
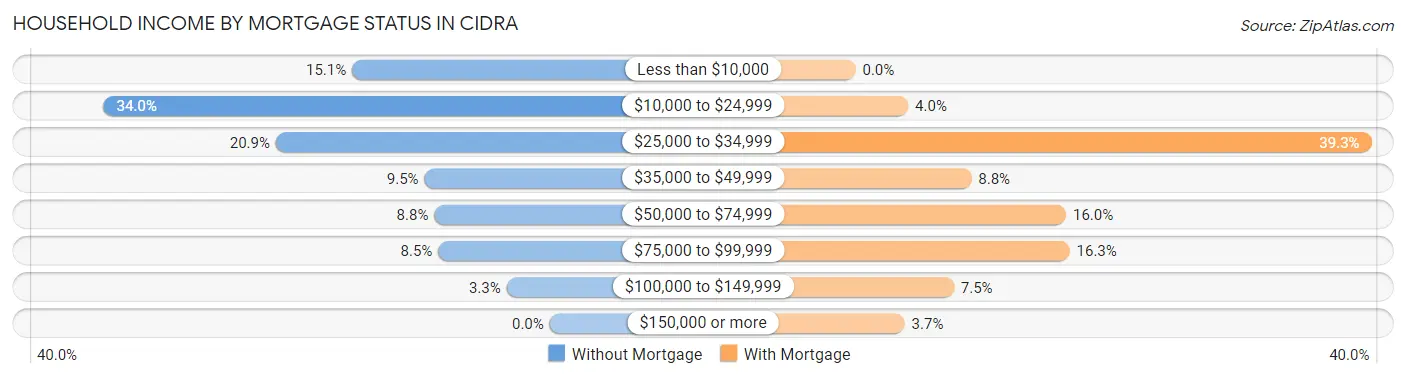
| Household Income | Without Mortgage | With Mortgage |
| Less than $10,000 | 101 (15.0%) | 0 (0.0%) |
| $10,000 to $24,999 | 228 (34.0%) | 15 (4.0%) |
| $25,000 to $34,999 | 140 (20.9%) | 147 (39.3%) |
| $35,000 to $49,999 | 64 (9.5%) | 33 (8.8%) |
| $50,000 to $74,999 | 59 (8.8%) | 60 (16.0%) |
| $75,000 to $99,999 | 57 (8.5%) | 61 (16.3%) |
| $100,000 to $149,999 | 22 (3.3%) | 28 (7.5%) |
| $150,000 or more | 0 (0.0%) | 14 (3.7%) |
| Total | 671 (100.0%) | 374 (100.0%) |
Property Value to Household Income Ratio in Cidra
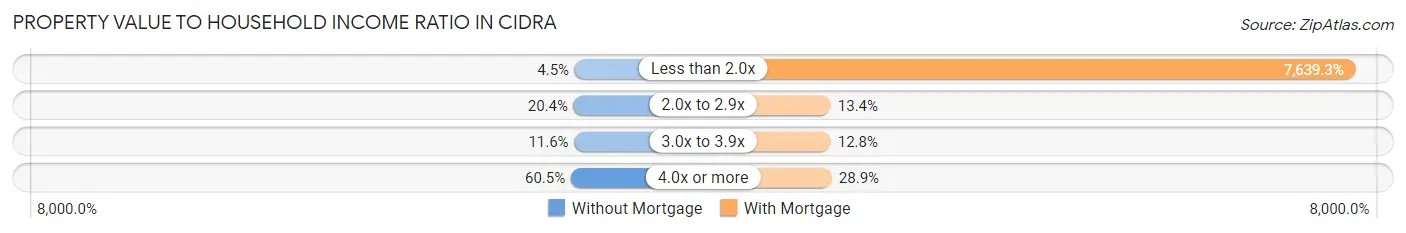
| Value-to-Income Ratio | Without Mortgage | With Mortgage |
| Less than 2.0x | 30 (4.5%) | 28,571 (7,639.3%) |
| 2.0x to 2.9x | 137 (20.4%) | 50 (13.4%) |
| 3.0x to 3.9x | 78 (11.6%) | 48 (12.8%) |
| 4.0x or more | 406 (60.5%) | 108 (28.9%) |
| Total | 671 (100.0%) | 374 (100.0%) |
Real Estate Taxes by Mortgage Status in Cidra
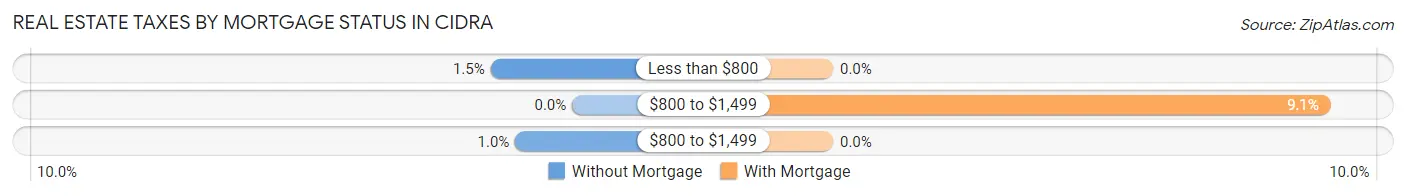
| Property Taxes | Without Mortgage | With Mortgage |
| Less than $800 | 10 (1.5%) | 0 (0.0%) |
| $800 to $1,499 | 0 (0.0%) | 34 (9.1%) |
| $800 to $1,499 | 7 (1.0%) | 0 (0.0%) |
| Total | 671 (100.0%) | 374 (100.0%) |
Health & Disability in Cidra
Health Insurance Coverage by Age in Cidra
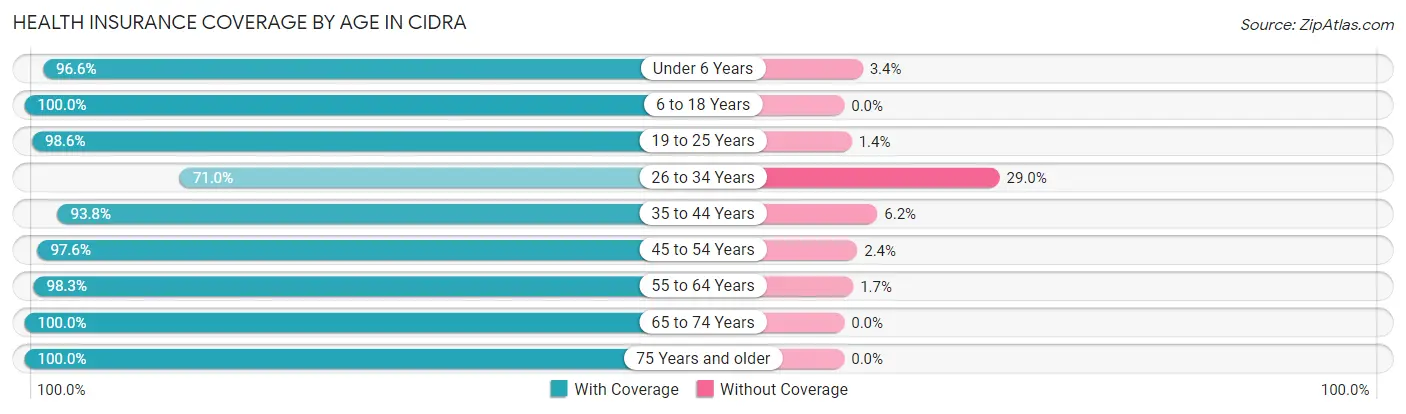
| Age Bracket | With Coverage | Without Coverage |
| Under 6 Years | 281 (96.6%) | 10 (3.4%) |
| 6 to 18 Years | 813 (100.0%) | 0 (0.0%) |
| 19 to 25 Years | 707 (98.6%) | 10 (1.4%) |
| 26 to 34 Years | 368 (71.0%) | 150 (29.0%) |
| 35 to 44 Years | 822 (93.8%) | 54 (6.2%) |
| 45 to 54 Years | 848 (97.6%) | 21 (2.4%) |
| 55 to 64 Years | 646 (98.3%) | 11 (1.7%) |
| 65 to 74 Years | 684 (100.0%) | 0 (0.0%) |
| 75 Years and older | 545 (100.0%) | 0 (0.0%) |
| Total | 5,714 (95.7%) | 256 (4.3%) |
Health Insurance Coverage by Citizenship Status in Cidra

| Citizenship Status | With Coverage | Without Coverage |
| Native Born | 281 (96.6%) | 10 (3.4%) |
| Foreign Born, Citizen | 813 (100.0%) | 0 (0.0%) |
| Foreign Born, not a Citizen | 707 (98.6%) | 10 (1.4%) |
Health Insurance Coverage by Household Income in Cidra
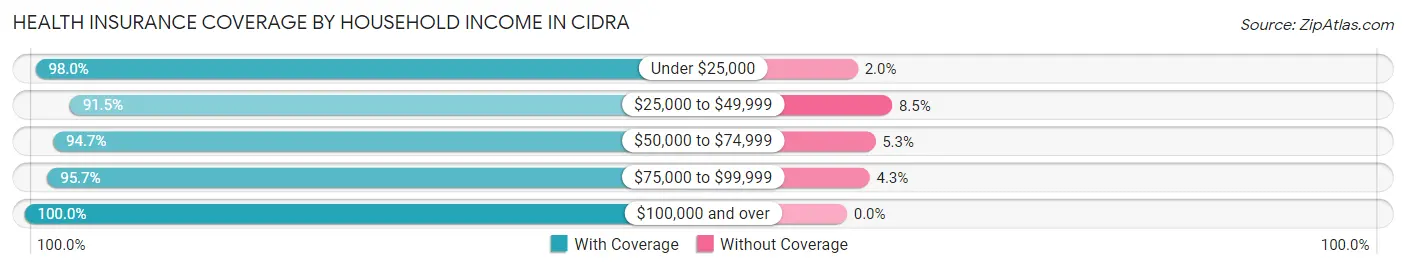
| Household Income | With Coverage | Without Coverage |
| Under $25,000 | 3,119 (98.0%) | 65 (2.0%) |
| $25,000 to $49,999 | 1,622 (91.5%) | 150 (8.5%) |
| $50,000 to $74,999 | 551 (94.7%) | 31 (5.3%) |
| $75,000 to $99,999 | 225 (95.7%) | 10 (4.3%) |
| $100,000 and over | 166 (100.0%) | 0 (0.0%) |
Public vs Private Health Insurance Coverage by Age in Cidra
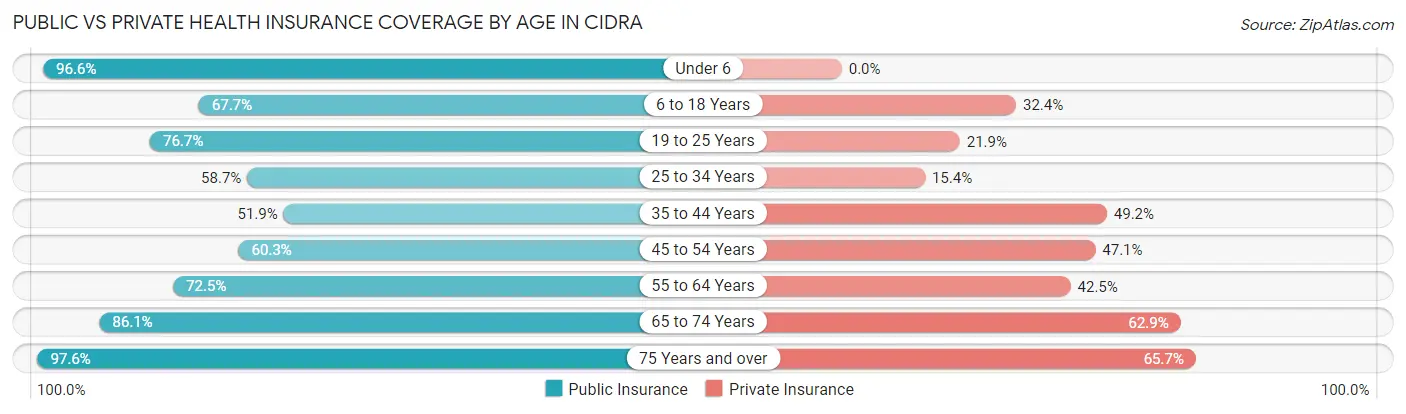
| Age Bracket | Public Insurance | Private Insurance |
| Under 6 | 281 (96.6%) | 0 (0.0%) |
| 6 to 18 Years | 550 (67.6%) | 263 (32.4%) |
| 19 to 25 Years | 550 (76.7%) | 157 (21.9%) |
| 25 to 34 Years | 304 (58.7%) | 80 (15.4%) |
| 35 to 44 Years | 455 (51.9%) | 431 (49.2%) |
| 45 to 54 Years | 524 (60.3%) | 409 (47.1%) |
| 55 to 64 Years | 476 (72.5%) | 279 (42.5%) |
| 65 to 74 Years | 589 (86.1%) | 430 (62.9%) |
| 75 Years and over | 532 (97.6%) | 358 (65.7%) |
| Total | 4,261 (71.4%) | 2,407 (40.3%) |
Disability Status by Sex by Age in Cidra
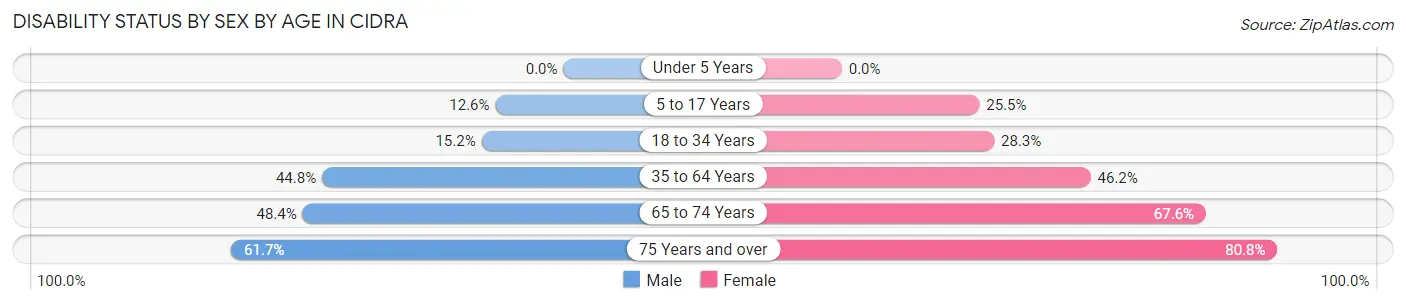
| Age Bracket | Male | Female |
| Under 5 Years | 0 (0.0%) | 0 (0.0%) |
| 5 to 17 Years | 39 (12.6%) | 110 (25.5%) |
| 18 to 34 Years | 94 (15.2%) | 218 (28.3%) |
| 35 to 64 Years | 495 (44.8%) | 599 (46.2%) |
| 65 to 74 Years | 137 (48.4%) | 271 (67.6%) |
| 75 Years and over | 172 (61.7%) | 215 (80.8%) |
Disability Class by Sex by Age in Cidra
Disability Class: Hearing Difficulty
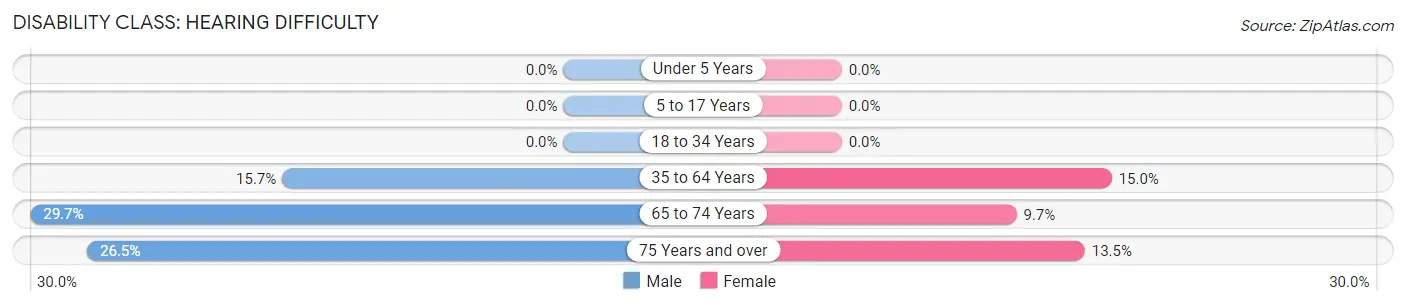
| Age Bracket | Male | Female |
| Under 5 Years | 0 (0.0%) | 0 (0.0%) |
| 5 to 17 Years | 0 (0.0%) | 0 (0.0%) |
| 18 to 34 Years | 0 (0.0%) | 0 (0.0%) |
| 35 to 64 Years | 173 (15.7%) | 195 (15.0%) |
| 65 to 74 Years | 84 (29.7%) | 39 (9.7%) |
| 75 Years and over | 74 (26.5%) | 36 (13.5%) |
Disability Class: Vision Difficulty
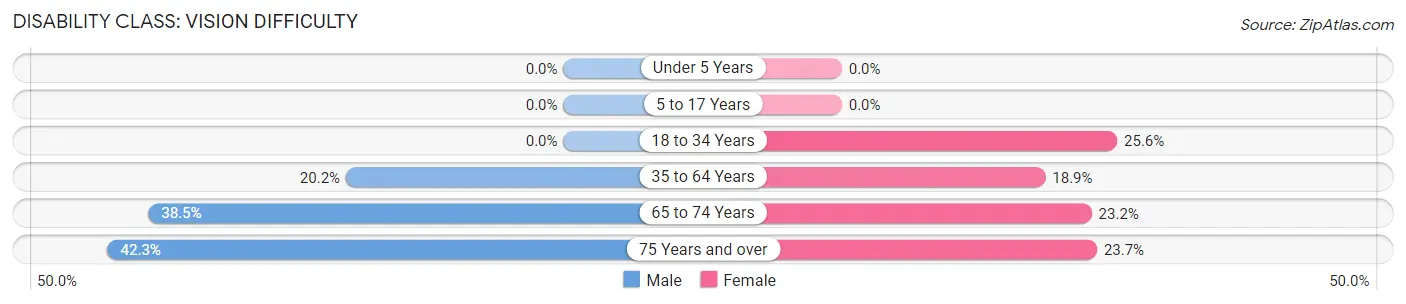
| Age Bracket | Male | Female |
| Under 5 Years | 0 (0.0%) | 0 (0.0%) |
| 5 to 17 Years | 0 (0.0%) | 0 (0.0%) |
| 18 to 34 Years | 0 (0.0%) | 197 (25.6%) |
| 35 to 64 Years | 223 (20.2%) | 245 (18.9%) |
| 65 to 74 Years | 109 (38.5%) | 93 (23.2%) |
| 75 Years and over | 118 (42.3%) | 63 (23.7%) |
Disability Class: Cognitive Difficulty
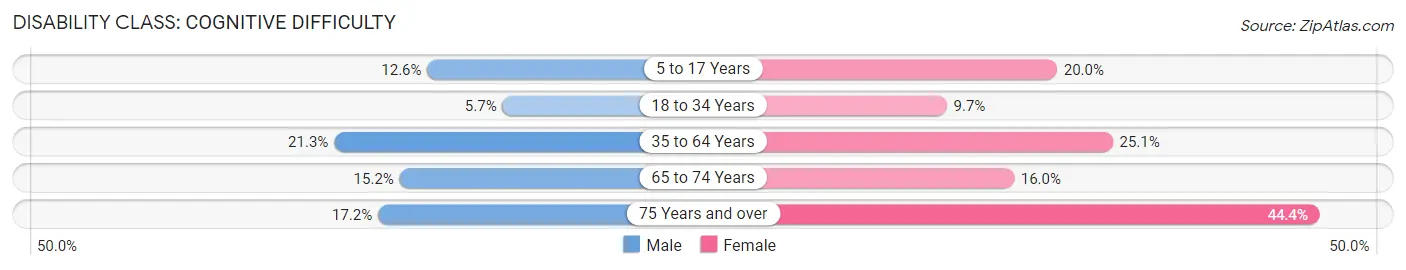
| Age Bracket | Male | Female |
| 5 to 17 Years | 39 (12.6%) | 86 (20.0%) |
| 18 to 34 Years | 35 (5.7%) | 75 (9.7%) |
| 35 to 64 Years | 235 (21.3%) | 326 (25.1%) |
| 65 to 74 Years | 43 (15.2%) | 64 (16.0%) |
| 75 Years and over | 48 (17.2%) | 118 (44.4%) |
Disability Class: Ambulatory Difficulty
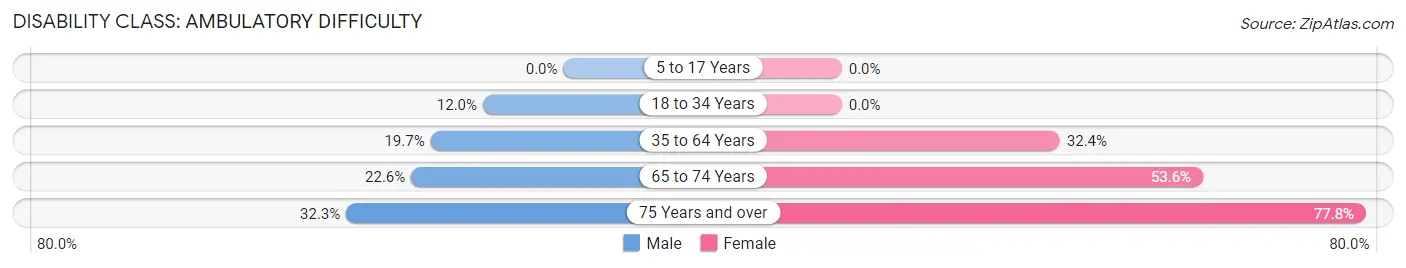
| Age Bracket | Male | Female |
| 5 to 17 Years | 0 (0.0%) | 0 (0.0%) |
| 18 to 34 Years | 74 (11.9%) | 0 (0.0%) |
| 35 to 64 Years | 218 (19.7%) | 420 (32.4%) |
| 65 to 74 Years | 64 (22.6%) | 215 (53.6%) |
| 75 Years and over | 90 (32.3%) | 207 (77.8%) |
Disability Class: Self-Care Difficulty
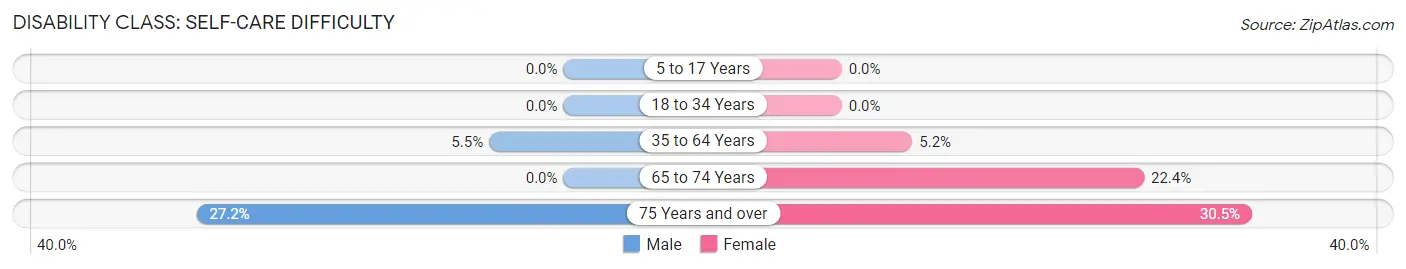
| Age Bracket | Male | Female |
| 5 to 17 Years | 0 (0.0%) | 0 (0.0%) |
| 18 to 34 Years | 0 (0.0%) | 0 (0.0%) |
| 35 to 64 Years | 61 (5.5%) | 68 (5.2%) |
| 65 to 74 Years | 0 (0.0%) | 90 (22.4%) |
| 75 Years and over | 76 (27.2%) | 81 (30.4%) |
Technology Access in Cidra
Computing Device Access in Cidra
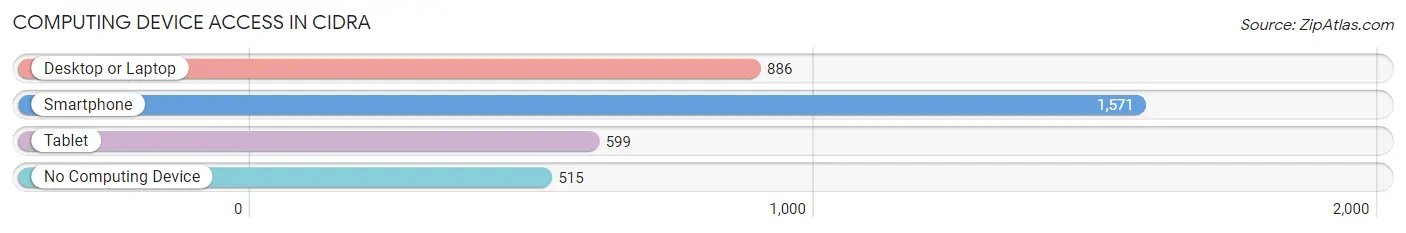
| Device Type | # Households | % Households |
| Desktop or Laptop | 886 | 41.4% |
| Smartphone | 1,571 | 73.5% |
| Tablet | 599 | 28.0% |
| No Computing Device | 515 | 24.1% |
| Total | 2,139 | 100.0% |
Internet Access in Cidra
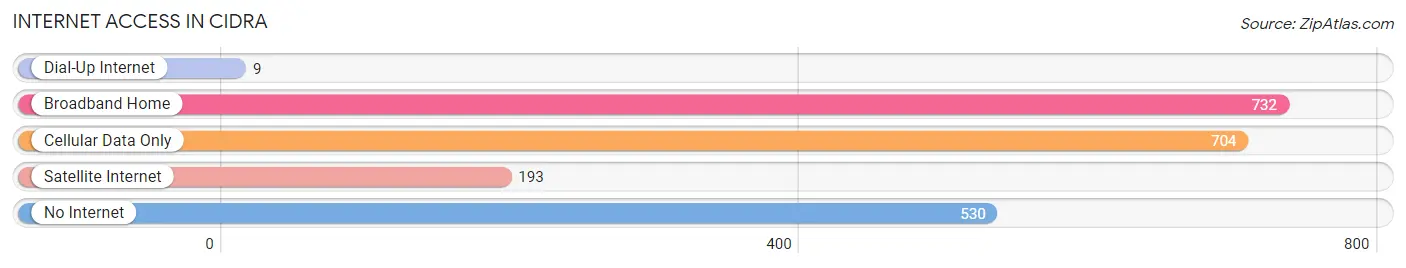
| Internet Type | # Households | % Households |
| Dial-Up Internet | 9 | 0.4% |
| Broadband Home | 732 | 34.2% |
| Cellular Data Only | 704 | 32.9% |
| Satellite Internet | 193 | 9.0% |
| No Internet | 530 | 24.8% |
| Total | 2,139 | 100.0% |
Cidra Summary
Cidra is a municipality located in the central region of Puerto Rico. It is part of the San Juan-Caguas-Guaynabo Metropolitan Statistical Area. The town is located in the northern part of the island, about 25 miles southwest of San Juan. As of the 2010 census, the population of Cidra was 28,625.
History
The area of Cidra was originally inhabited by the Taíno Indians. The first Spanish settlers arrived in the area in the early 16th century. The town was officially founded in 1795 and was named after the cidra tree, which is native to the area.
In the 19th century, Cidra was an important agricultural center, producing coffee, sugar cane, and tobacco. The town was also known for its production of leather goods.
Geography
Cidra is located in the northern part of Puerto Rico, about 25 miles southwest of San Juan. The town is situated in the central mountain range of the island, at an elevation of 1,000 feet above sea level. The terrain is mostly hilly and mountainous, with some flat areas. The town is bordered by the municipalities of Aguas Buenas, Caguas, Cayey, and Comerío.
Climate
Cidra has a tropical climate, with temperatures ranging from the mid-70s to the mid-80s Fahrenheit. The town receives an average of 60 inches of rain per year.
Economy
Cidra’s economy is largely based on agriculture. The town is known for its production of coffee, sugar cane, and tobacco. Other industries in the area include manufacturing, construction, and tourism.
Demographics
As of the 2010 census, the population of Cidra was 28,625. The population is mostly of Hispanic descent, with a small percentage of African-American and white residents. The median household income in the town is $17,845, and the median age is 37.
Education
Cidra is served by the Puerto Rico Department of Education. The town has several public schools, including elementary, middle, and high schools. There are also several private schools in the area.
Conclusion
Cidra is a municipality located in the central region of Puerto Rico. It is part of the San Juan-Caguas-Guaynabo Metropolitan Statistical Area. The town is known for its production of coffee, sugar cane, and tobacco, and its economy is largely based on agriculture. As of the 2010 census, the population of Cidra was 28,625. The town is served by the Puerto Rico Department of Education, and there are several public and private schools in the area.
Common Questions
What is Per Capita Income in Cidra?
Per Capita income in Cidra is $10,419.
What is the Median Family Income in Cidra?
Median Family Income in Cidra is $21,845.
What is the Median Household income in Cidra?
Median Household Income in Cidra is $19,107.
What is Income or Wage Gap in Cidra?
Income or Wage Gap in Cidra is 4.7%.
Women in Cidra earn 95.3 cents for every dollar earned by a man.
What is Inequality or Gini Index in Cidra?
Inequality or Gini Index in Cidra is 0.50.
What is the Total Population of Cidra?
Total Population of Cidra is 6,056.
What is the Total Male Population of Cidra?
Total Male Population of Cidra is 2,785.
What is the Total Female Population of Cidra?
Total Female Population of Cidra is 3,271.
What is the Ratio of Males per 100 Females in Cidra?
There are 85.14 Males per 100 Females in Cidra.
What is the Ratio of Females per 100 Males in Cidra?
There are 117.45 Females per 100 Males in Cidra.
What is the Median Population Age in Cidra?
Median Population Age in Cidra is 41.8 Years.
What is the Average Family Size in Cidra
Average Family Size in Cidra is 3.5 People.
What is the Average Household Size in Cidra
Average Household Size in Cidra is 2.8 People.
How Large is the Labor Force in Cidra?
There are 1,881 People in the Labor Forcein in Cidra.
What is the Percentage of People in the Labor Force in Cidra?
35.2% of People are in the Labor Force in Cidra.
What is the Unemployment Rate in Cidra?
Unemployment Rate in Cidra is 12.7%.