Celada, PR Map & Demographics
Celada Map
Celada Overview
$13,608
PER CAPITA INCOME
$41,098
AVG FAMILY INCOME
$26,864
AVG HOUSEHOLD INCOME
24.9%
WAGE / INCOME GAP [ % ]
75.1¢/ $1
WAGE / INCOME GAP [ $ ]
0.40
INEQUALITY / GINI INDEX
3,311
TOTAL POPULATION
1,461
MALE POPULATION
1,850
FEMALE POPULATION
78.97
MALES / 100 FEMALES
126.63
FEMALES / 100 MALES
38.2
MEDIAN AGE
3.6
AVG FAMILY SIZE
2.9
AVG HOUSEHOLD SIZE
1,719
LABOR FORCE [ PEOPLE ]
59.2%
PERCENT IN LABOR FORCE
28.5%
UNEMPLOYMENT RATE
Income in Celada
Income Overview in Celada
Per Capita Income in Celada is $13,608, while median incomes of families and households are $41,098 and $26,864 respectively.
| Characteristic | Number | Measure |
| Per Capita Income | 3,311 | $13,608 |
| Median Family Income | 822 | $41,098 |
| Mean Family Income | 822 | $41,066 |
| Median Household Income | 1,147 | $26,864 |
| Mean Household Income | 1,147 | $36,594 |
| Income Deficit | 822 | $0 |
| Wage / Income Gap (%) | 3,311 | 24.94% |
| Wage / Income Gap ($) | 3,311 | 75.06¢ per $1 |
| Gini / Inequality Index | 3,311 | 0.40 |
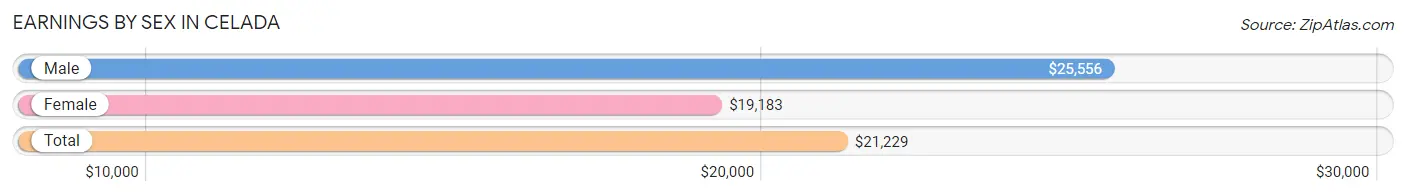
Earnings by Sex in Celada
Average Earnings in Celada are $21,229, $25,556 for men and $19,183 for women, a difference of 24.9%.
| Sex | Number | Average Earnings |
| Male | 864 (59.6%) | $25,556 |
| Female | 587 (40.5%) | $19,183 |
| Total | 1,451 (100.0%) | $21,229 |
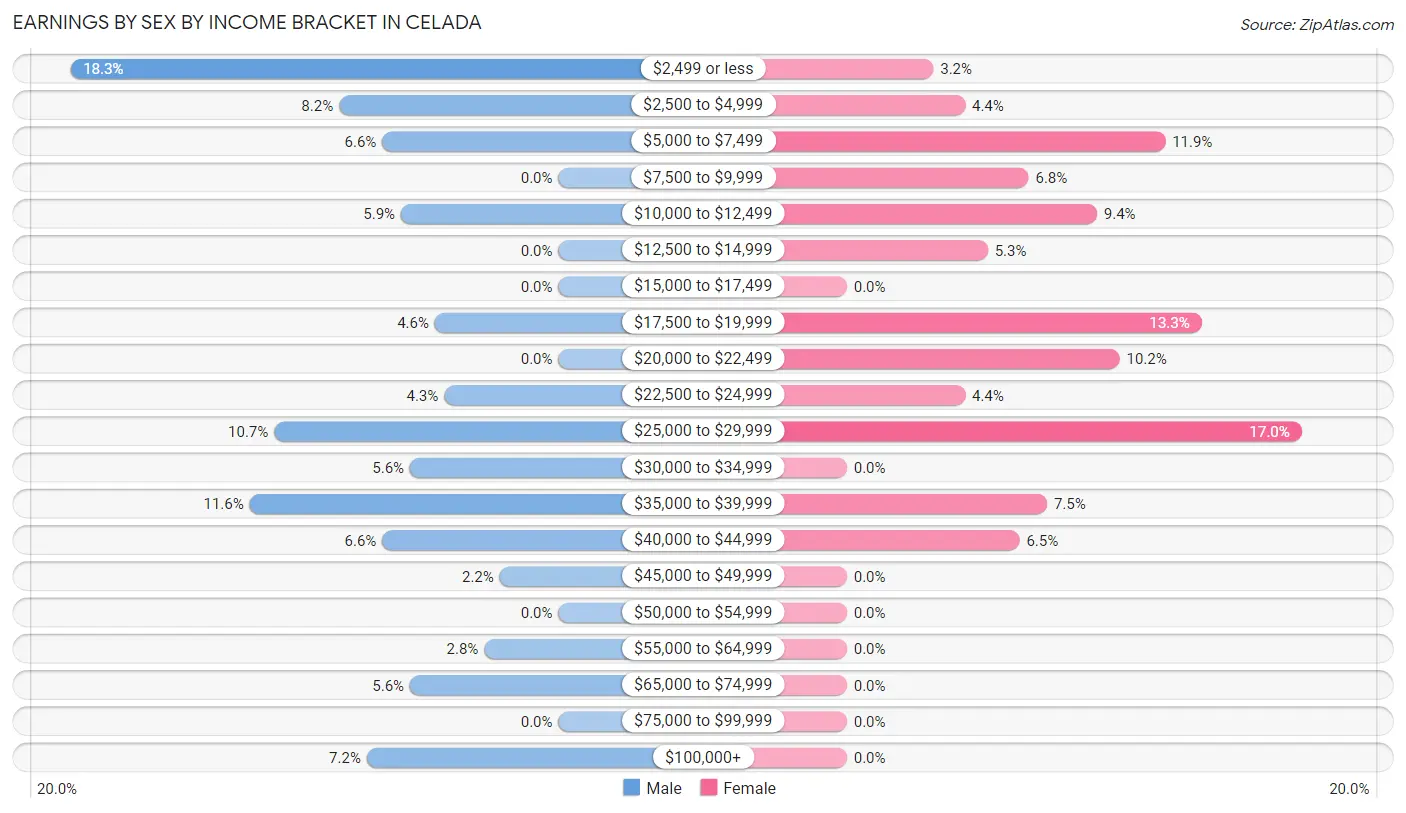
Earnings by Sex by Income Bracket in Celada
The most common earnings brackets in Celada are $2,499 or less for men (158 | 18.3%) and $25,000 to $29,999 for women (100 | 17.0%).
| Income | Male | Female |
| $2,499 or less | 158 (18.3%) | 19 (3.2%) |
| $2,500 to $4,999 | 71 (8.2%) | 26 (4.4%) |
| $5,000 to $7,499 | 57 (6.6%) | 70 (11.9%) |
| $7,500 to $9,999 | 0 (0.0%) | 40 (6.8%) |
| $10,000 to $12,499 | 51 (5.9%) | 55 (9.4%) |
| $12,500 to $14,999 | 0 (0.0%) | 31 (5.3%) |
| $15,000 to $17,499 | 0 (0.0%) | 0 (0.0%) |
| $17,500 to $19,999 | 40 (4.6%) | 78 (13.3%) |
| $20,000 to $22,499 | 0 (0.0%) | 60 (10.2%) |
| $22,500 to $24,999 | 37 (4.3%) | 26 (4.4%) |
| $25,000 to $29,999 | 92 (10.6%) | 100 (17.0%) |
| $30,000 to $34,999 | 48 (5.6%) | 0 (0.0%) |
| $35,000 to $39,999 | 100 (11.6%) | 44 (7.5%) |
| $40,000 to $44,999 | 57 (6.6%) | 38 (6.5%) |
| $45,000 to $49,999 | 19 (2.2%) | 0 (0.0%) |
| $50,000 to $54,999 | 0 (0.0%) | 0 (0.0%) |
| $55,000 to $64,999 | 24 (2.8%) | 0 (0.0%) |
| $65,000 to $74,999 | 48 (5.6%) | 0 (0.0%) |
| $75,000 to $99,999 | 0 (0.0%) | 0 (0.0%) |
| $100,000+ | 62 (7.2%) | 0 (0.0%) |
| Total | 864 (100.0%) | 587 (100.0%) |
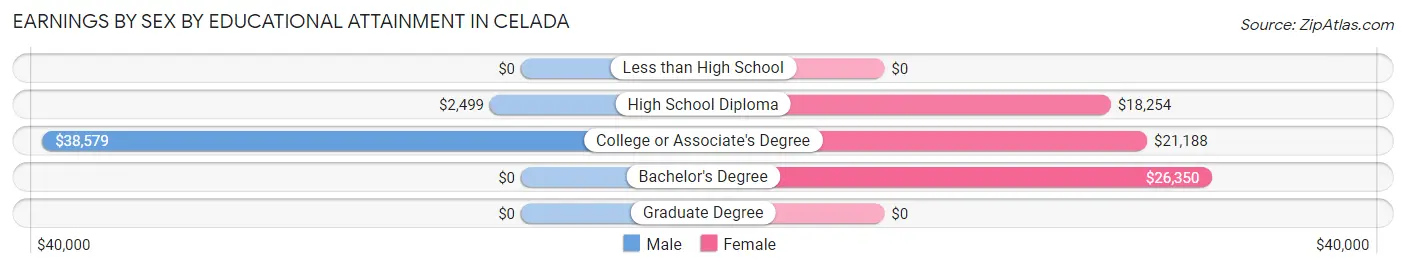
Earnings by Sex by Educational Attainment in Celada
Average earnings in Celada are $27,114 for men and $20,000 for women, a difference of 26.2%. Men with an educational attainment of college or associate's degree enjoy the highest average annual earnings of $38,579, while those with high school diploma education earn the least with $2,499. Women with an educational attainment of bachelor's degree earn the most with the average annual earnings of $26,350, while those with high school diploma education have the smallest earnings of $18,254.
| Educational Attainment | Male Income | Female Income |
| Less than High School | - | - |
| High School Diploma | $2,499 | $18,254 |
| College or Associate's Degree | $38,579 | $21,188 |
| Bachelor's Degree | - | - |
| Graduate Degree | - | - |
| Total | $27,114 | $20,000 |
Family Income in Celada
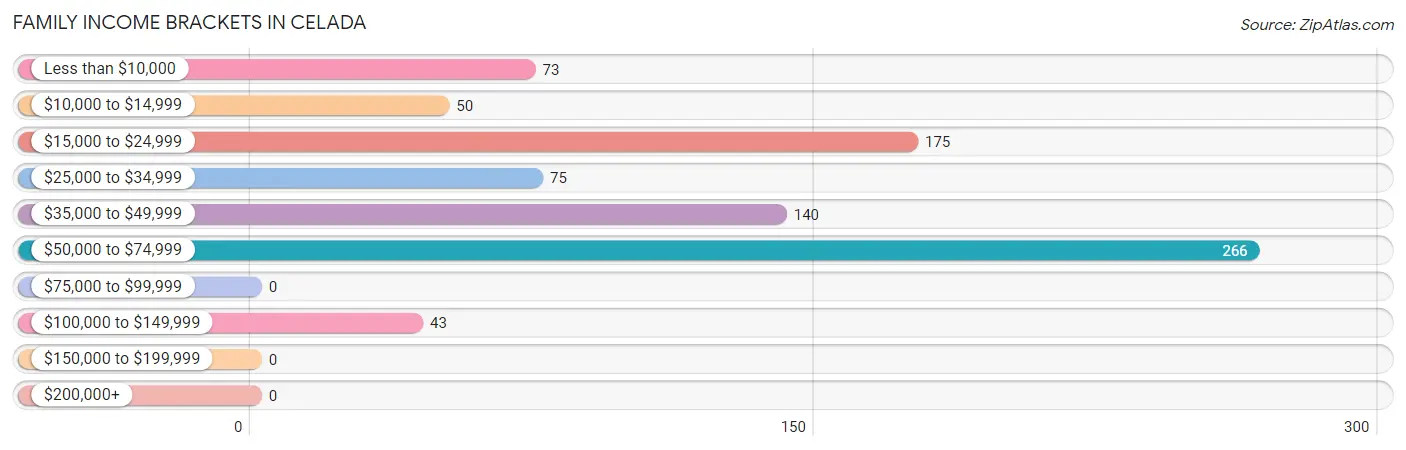
Family Income Brackets in Celada
According to the Celada family income data, there are 266 families falling into the $50,000 to $74,999 income range, which is the most common income bracket and makes up 32.4% of all families.
| Income Bracket | # Families | % Families |
| Less than $10,000 | 73 | 8.9% |
| $10,000 to $14,999 | 50 | 6.1% |
| $15,000 to $24,999 | 175 | 21.3% |
| $25,000 to $34,999 | 75 | 9.1% |
| $35,000 to $49,999 | 140 | 17.0% |
| $50,000 to $74,999 | 266 | 32.4% |
| $75,000 to $99,999 | 0 | 0.0% |
| $100,000 to $149,999 | 43 | 5.2% |
| $150,000 to $199,999 | 0 | 0.0% |
| $200,000+ | 0 | 0.0% |
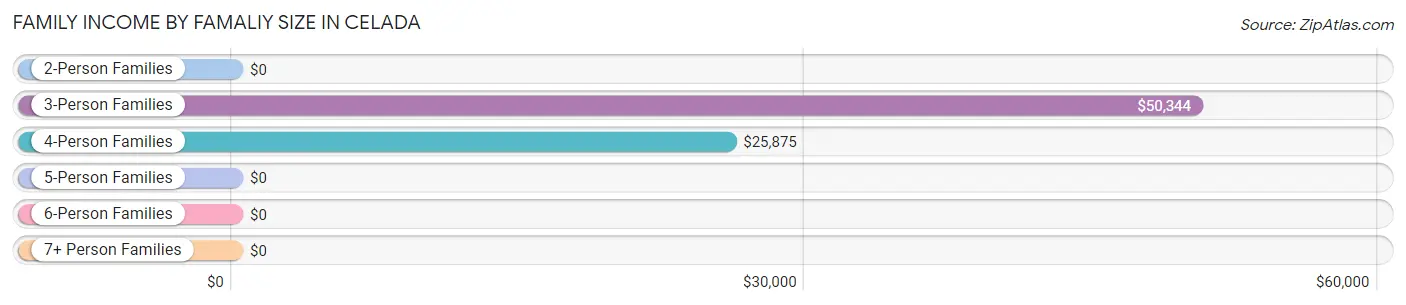
Family Income by Famaliy Size in Celada
3-person families (175 | 21.3%) account for the highest median family income in Celada with $50,344 per family, while 3-person families (175 | 21.3%) have the highest median income of $16,781 per family member.
| Income Bracket | # Families | Median Income |
| 2-Person Families | 316 (38.4%) | $0 |
| 3-Person Families | 175 (21.3%) | $50,344 |
| 4-Person Families | 229 (27.9%) | $25,875 |
| 5-Person Families | 87 (10.6%) | $0 |
| 6-Person Families | 0 (0.0%) | $0 |
| 7+ Person Families | 15 (1.8%) | $0 |
| Total | 822 (100.0%) | $41,098 |
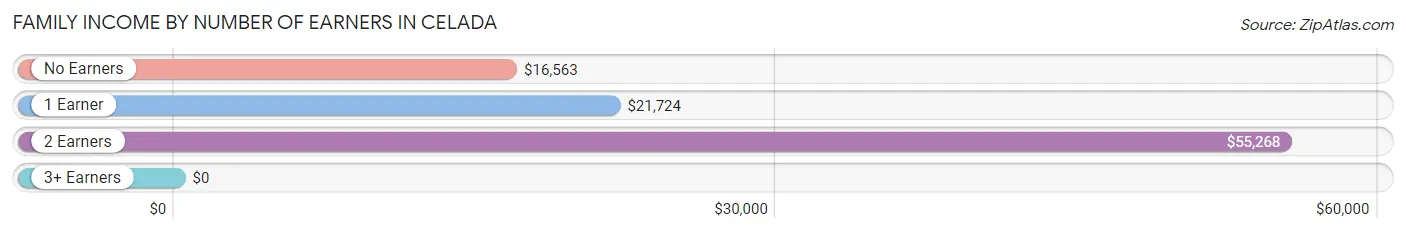
Family Income by Number of Earners in Celada
| Number of Earners | # Families | Median Income |
| No Earners | 131 (15.9%) | $16,563 |
| 1 Earner | 290 (35.3%) | $21,724 |
| 2 Earners | 366 (44.5%) | $55,268 |
| 3+ Earners | 35 (4.3%) | $0 |
| Total | 822 (100.0%) | $41,098 |
Household Income in Celada
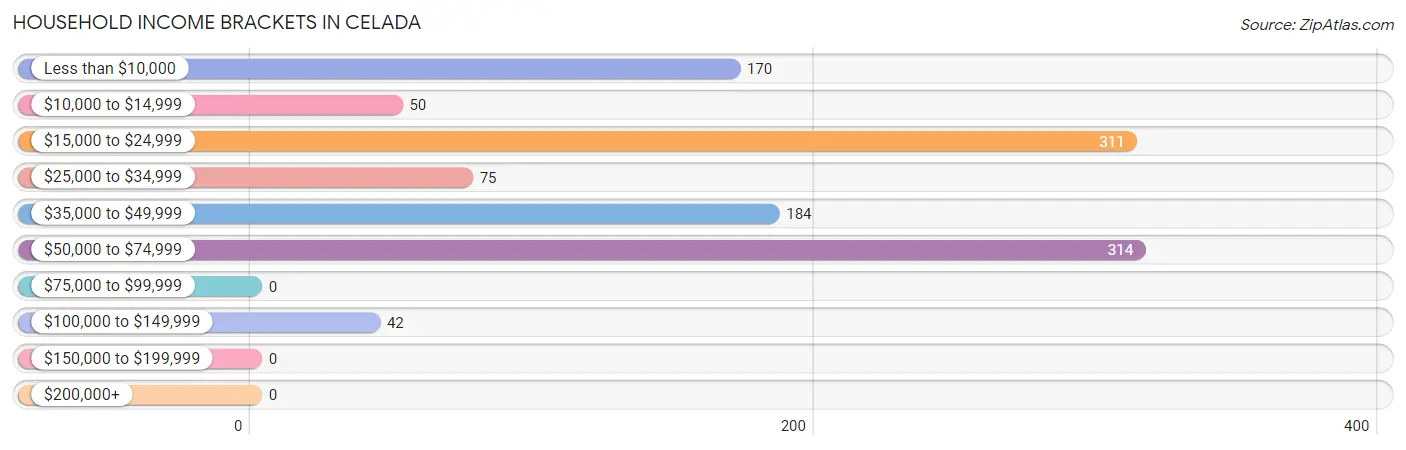
Household Income Brackets in Celada
With 314 households falling in the category, the $50,000 to $74,999 income range is the most frequent in Celada, accounting for 27.4% of all households.
| Income Bracket | # Households | % Households |
| Less than $10,000 | 170 | 14.8% |
| $10,000 to $14,999 | 50 | 4.4% |
| $15,000 to $24,999 | 311 | 27.1% |
| $25,000 to $34,999 | 75 | 6.5% |
| $35,000 to $49,999 | 184 | 16.0% |
| $50,000 to $74,999 | 314 | 27.4% |
| $75,000 to $99,999 | 0 | 0.0% |
| $100,000 to $149,999 | 42 | 3.7% |
| $150,000 to $199,999 | 0 | 0.0% |
| $200,000+ | 0 | 0.0% |
Household Income by Householder Age in Celada
The median household income in Celada is $26,864, with the highest median household income of $55,086 found in the 25 to 44 years age bracket for the primary householder. A total of 367 households (32.0%) fall into this category.
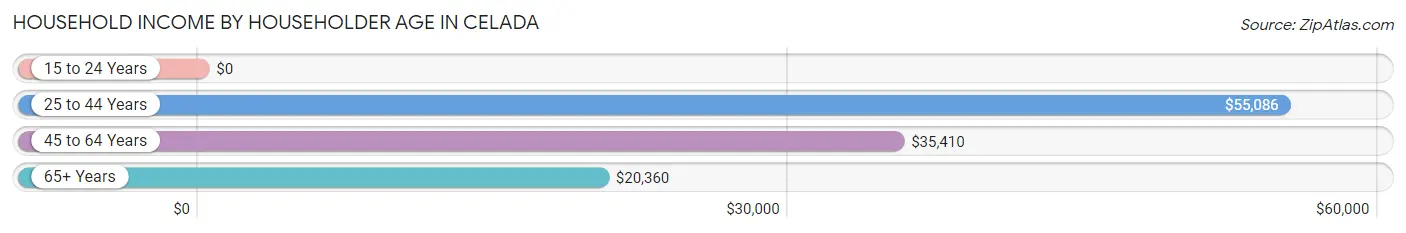
| Income Bracket | # Households | Median Income |
| 15 to 24 Years | 0 (0.0%) | $0 |
| 25 to 44 Years | 367 (32.0%) | $55,086 |
| 45 to 64 Years | 535 (46.6%) | $35,410 |
| 65+ Years | 245 (21.4%) | $20,360 |
| Total | 1,147 (100.0%) | $26,864 |
Poverty in Celada
Income Below Poverty by Sex and Age in Celada
With 24.8% poverty level for males and 48.9% for females among the residents of Celada, 6 to 11 year old males and 6 to 11 year old females are the most vulnerable to poverty, with 21 males (100.0%) and 212 females (91.0%) in their respective age groups living below the poverty level.
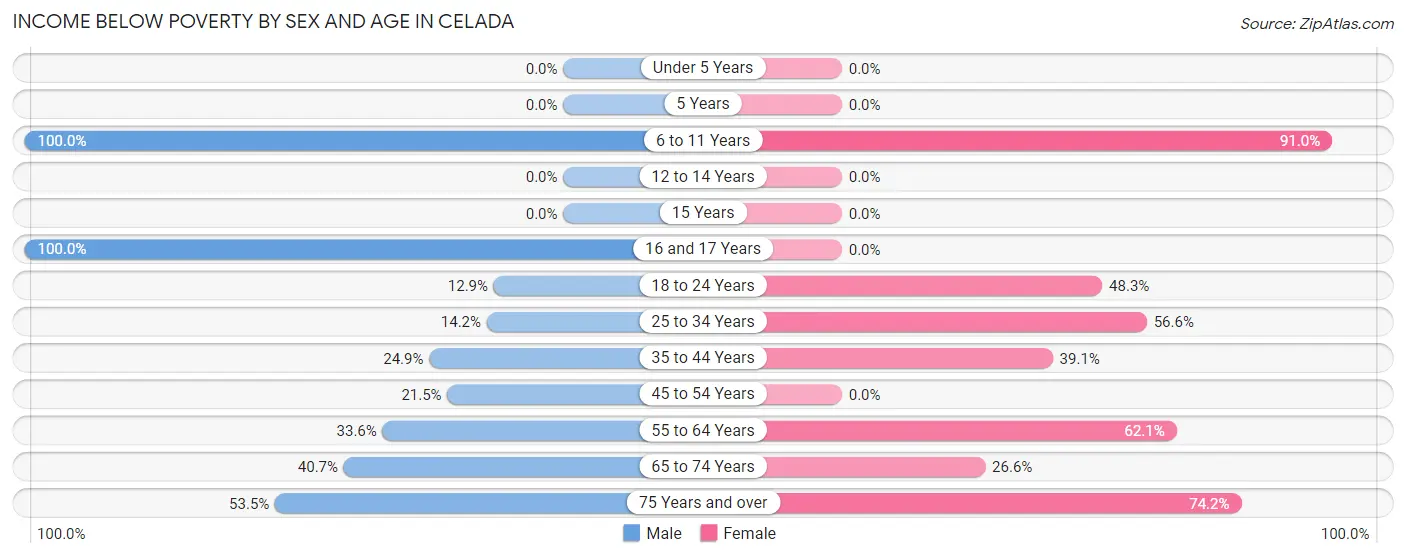
| Age Bracket | Male | Female |
| Under 5 Years | 0 (0.0%) | 0 (0.0%) |
| 5 Years | 0 (0.0%) | 0 (0.0%) |
| 6 to 11 Years | 21 (100.0%) | 212 (91.0%) |
| 12 to 14 Years | 0 (0.0%) | 0 (0.0%) |
| 15 Years | 0 (0.0%) | 0 (0.0%) |
| 16 and 17 Years | 51 (100.0%) | 0 (0.0%) |
| 18 to 24 Years | 32 (12.9%) | 101 (48.3%) |
| 25 to 34 Years | 46 (14.2%) | 90 (56.6%) |
| 35 to 44 Years | 57 (24.9%) | 128 (39.1%) |
| 45 to 54 Years | 20 (21.5%) | 0 (0.0%) |
| 55 to 64 Years | 101 (33.6%) | 192 (62.1%) |
| 65 to 74 Years | 11 (40.7%) | 29 (26.6%) |
| 75 Years and over | 23 (53.5%) | 152 (74.2%) |
| Total | 362 (24.8%) | 904 (48.9%) |
Income Above Poverty by Sex and Age in Celada
According to the poverty statistics in Celada, males aged under 5 years and females aged 12 to 14 years are the age groups that are most secure financially, with 100.0% of males and 100.0% of females in these age groups living above the poverty line.
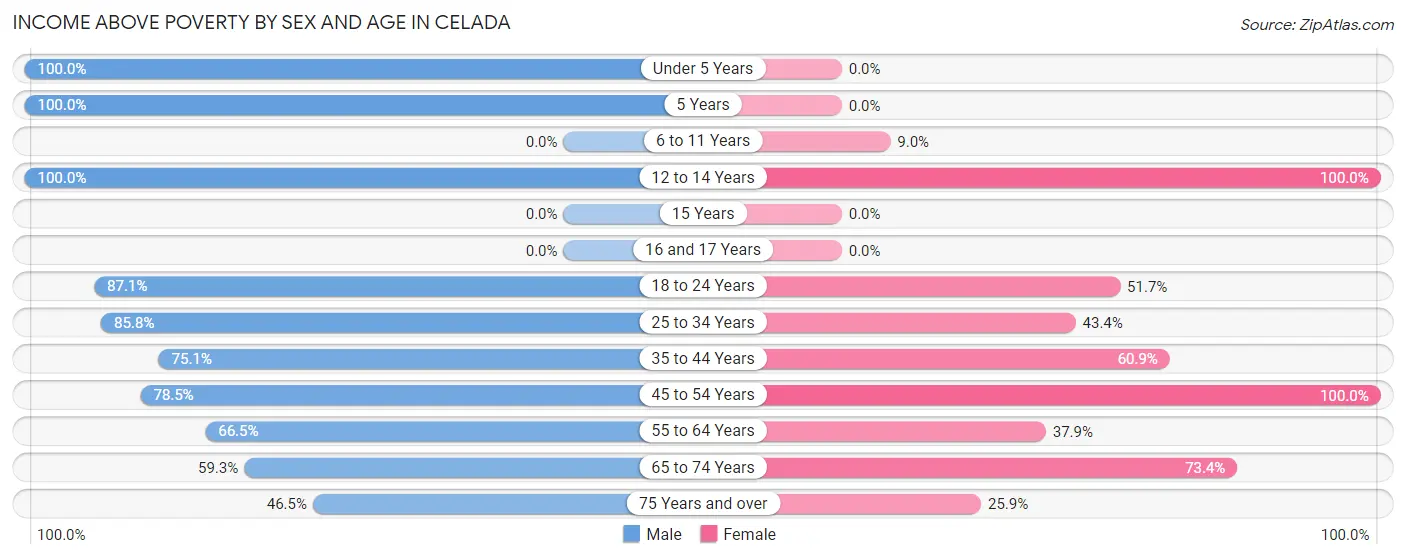
| Age Bracket | Male | Female |
| Under 5 Years | 59 (100.0%) | 0 (0.0%) |
| 5 Years | 44 (100.0%) | 0 (0.0%) |
| 6 to 11 Years | 0 (0.0%) | 21 (9.0%) |
| 12 to 14 Years | 21 (100.0%) | 29 (100.0%) |
| 15 Years | 0 (0.0%) | 0 (0.0%) |
| 16 and 17 Years | 0 (0.0%) | 0 (0.0%) |
| 18 to 24 Years | 216 (87.1%) | 108 (51.7%) |
| 25 to 34 Years | 278 (85.8%) | 69 (43.4%) |
| 35 to 44 Years | 172 (75.1%) | 199 (60.9%) |
| 45 to 54 Years | 73 (78.5%) | 270 (100.0%) |
| 55 to 64 Years | 200 (66.4%) | 117 (37.9%) |
| 65 to 74 Years | 16 (59.3%) | 80 (73.4%) |
| 75 Years and over | 20 (46.5%) | 53 (25.9%) |
| Total | 1,099 (75.2%) | 946 (51.1%) |
Income Below Poverty Among Married-Couple Families in Celada
The poverty statistics for married-couple families in Celada show that 17.2% or 70 of the total 406 families live below the poverty line. Families with no children have the highest poverty rate of 24.0%, comprising of 70 families. On the other hand, families with 1 or 2 children have the lowest poverty rate of 0.0%, which includes 0 families.
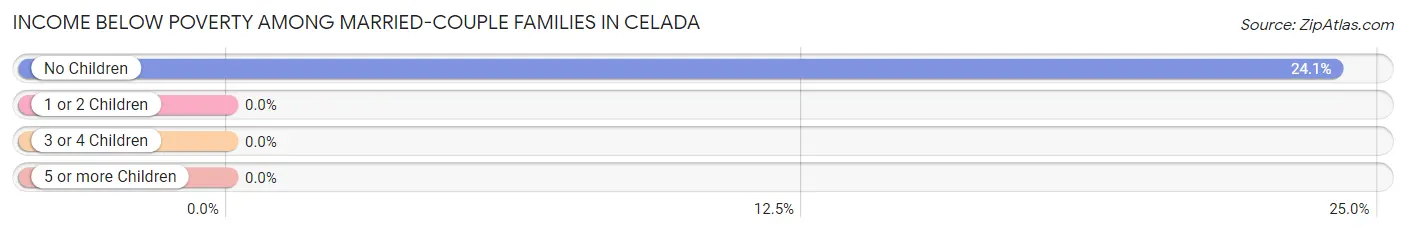
| Children | Above Poverty | Below Poverty |
| No Children | 221 (75.9%) | 70 (24.0%) |
| 1 or 2 Children | 115 (100.0%) | 0 (0.0%) |
| 3 or 4 Children | 0 (0.0%) | 0 (0.0%) |
| 5 or more Children | 0 (0.0%) | 0 (0.0%) |
| Total | 336 (82.8%) | 70 (17.2%) |
Income Below Poverty Among Single-Parent Households in Celada
According to the poverty data in Celada, 24.6% or 28 single-father households and 73.8% or 223 single-mother households are living below the poverty line. Among single-father households, those with 1 or 2 children have the highest poverty rate, with 20 households (100.0%) experiencing poverty. Likewise, among single-mother households, those with 3 or 4 children have the highest poverty rate, with 55 households (100.0%) falling below the poverty line.
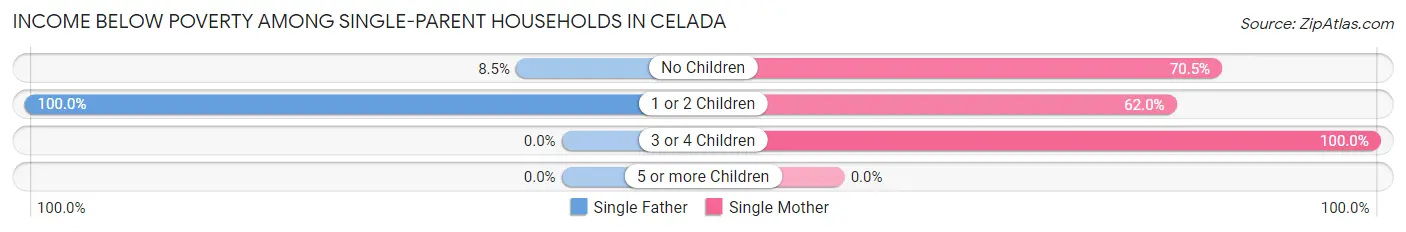
| Children | Single Father | Single Mother |
| No Children | 8 (8.5%) | 124 (70.5%) |
| 1 or 2 Children | 20 (100.0%) | 44 (62.0%) |
| 3 or 4 Children | 0 (0.0%) | 55 (100.0%) |
| 5 or more Children | 0 (0.0%) | 0 (0.0%) |
| Total | 28 (24.6%) | 223 (73.8%) |
Income Below Poverty Among Married-Couple vs Single-Parent Households in Celada
The poverty data for Celada shows that 70 of the married-couple family households (17.2%) and 251 of the single-parent households (60.3%) are living below the poverty level. Within the married-couple family households, those with no children have the highest poverty rate, with 70 households (24.0%) falling below the poverty line. Among the single-parent households, those with 3 or 4 children have the highest poverty rate, with 55 household (100.0%) living below poverty.
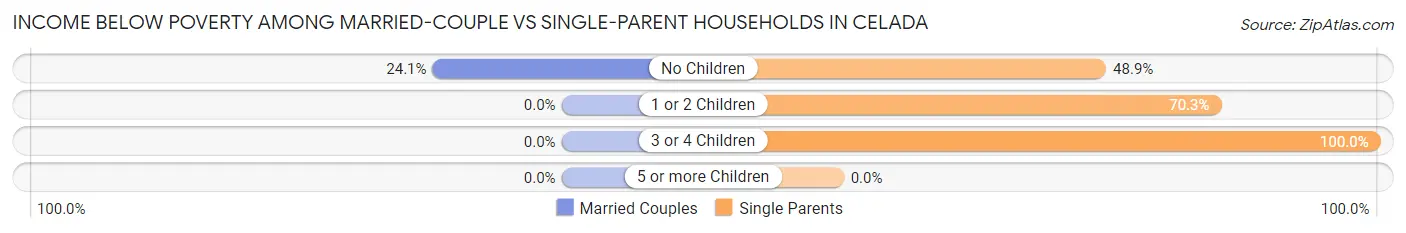
| Children | Married-Couple Families | Single-Parent Households |
| No Children | 70 (24.0%) | 132 (48.9%) |
| 1 or 2 Children | 0 (0.0%) | 64 (70.3%) |
| 3 or 4 Children | 0 (0.0%) | 55 (100.0%) |
| 5 or more Children | 0 (0.0%) | 0 (0.0%) |
| Total | 70 (17.2%) | 251 (60.3%) |
Race in Celada
The most populous races in Celada are Hispanic or Latino (3,232 | 97.6%), White / Caucasian (1,703 | 51.4%), and Two or more Races (608 | 18.4%).
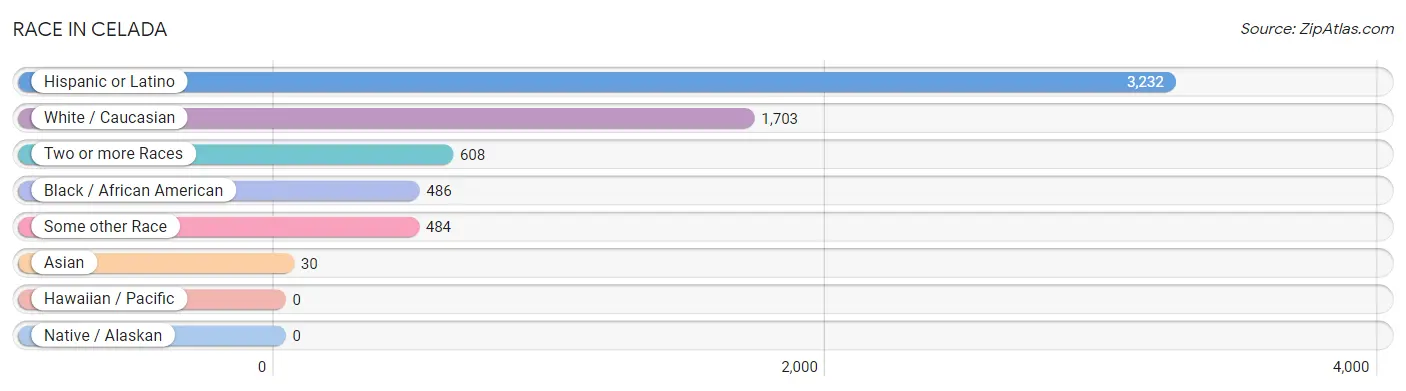
| Race | # Population | % Population |
| Asian | 30 | 0.9% |
| Black / African American | 486 | 14.7% |
| Hawaiian / Pacific | 0 | 0.0% |
| Hispanic or Latino | 3,232 | 97.6% |
| Native / Alaskan | 0 | 0.0% |
| White / Caucasian | 1,703 | 51.4% |
| Two or more Races | 608 | 18.4% |
| Some other Race | 484 | 14.6% |
| Total | 3,311 | 100.0% |
Ancestry in Celada
The most populous ancestries reported in Celada are Puerto Rican (3,219 | 97.2%), American (187 | 5.7%), Thai (30 | 0.9%), African (16 | 0.5%), and Subsaharan African (16 | 0.5%), together accounting for 104.7% of all Celada residents.
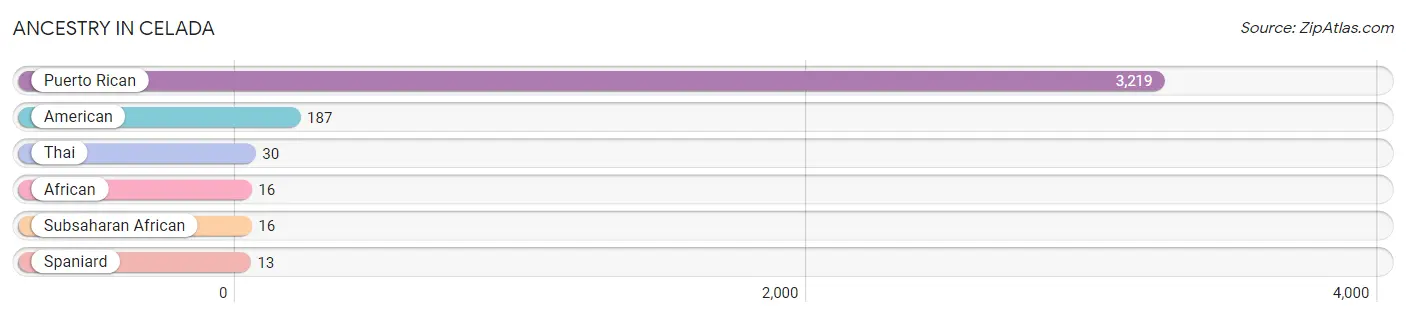
| Ancestry | # Population | % Population |
| African | 16 | 0.5% |
| American | 187 | 5.7% |
| Puerto Rican | 3,219 | 97.2% |
| Spaniard | 13 | 0.4% |
| Subsaharan African | 16 | 0.5% |
| Thai | 30 | 0.9% | View All 6 Rows |
Immigrants in Celada

| Immigration Origin | # Population | % Population | View All 0 Rows |
Sex and Age in Celada
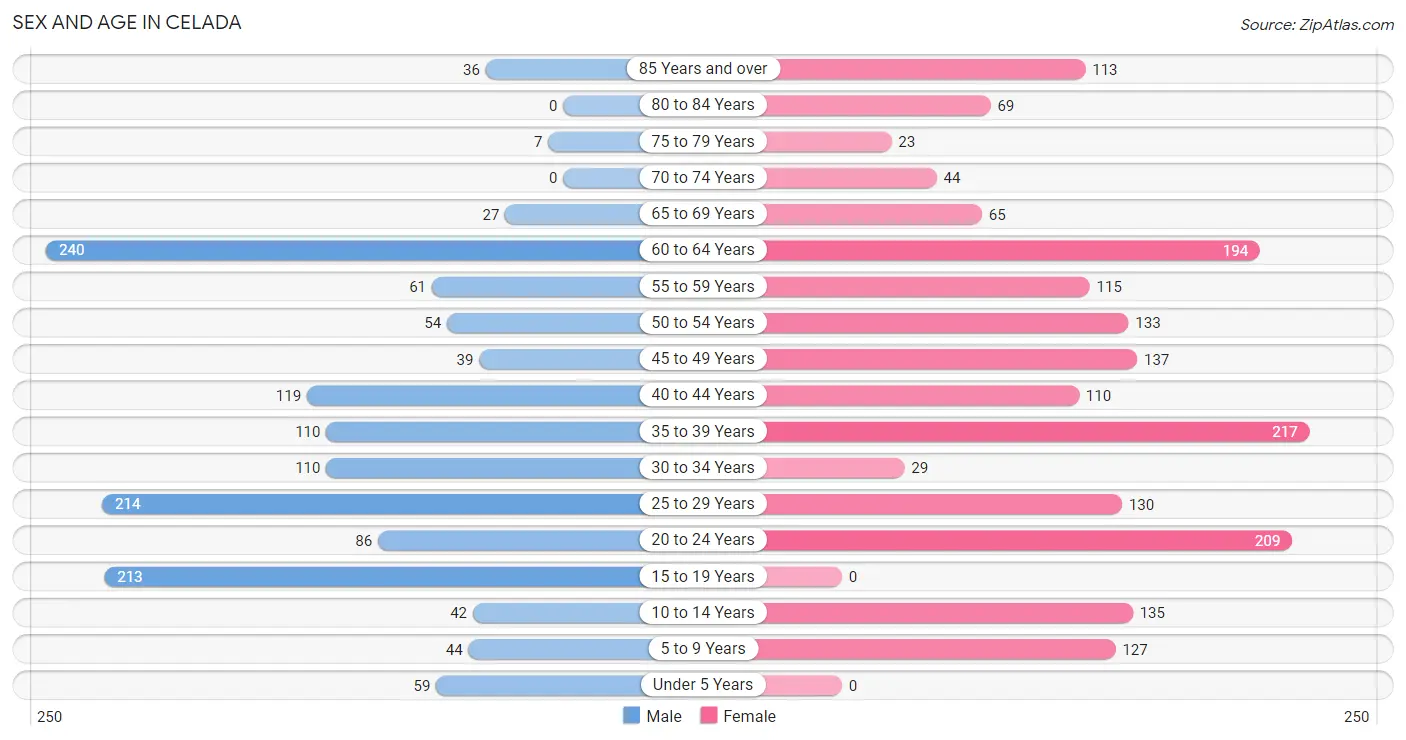
Sex and Age in Celada
The most populous age groups in Celada are 60 to 64 Years (240 | 16.4%) for men and 35 to 39 Years (217 | 11.7%) for women.
| Age Bracket | Male | Female |
| Under 5 Years | 59 (4.0%) | 0 (0.0%) |
| 5 to 9 Years | 44 (3.0%) | 127 (6.9%) |
| 10 to 14 Years | 42 (2.9%) | 135 (7.3%) |
| 15 to 19 Years | 213 (14.6%) | 0 (0.0%) |
| 20 to 24 Years | 86 (5.9%) | 209 (11.3%) |
| 25 to 29 Years | 214 (14.6%) | 130 (7.0%) |
| 30 to 34 Years | 110 (7.5%) | 29 (1.6%) |
| 35 to 39 Years | 110 (7.5%) | 217 (11.7%) |
| 40 to 44 Years | 119 (8.2%) | 110 (5.9%) |
| 45 to 49 Years | 39 (2.7%) | 137 (7.4%) |
| 50 to 54 Years | 54 (3.7%) | 133 (7.2%) |
| 55 to 59 Years | 61 (4.2%) | 115 (6.2%) |
| 60 to 64 Years | 240 (16.4%) | 194 (10.5%) |
| 65 to 69 Years | 27 (1.8%) | 65 (3.5%) |
| 70 to 74 Years | 0 (0.0%) | 44 (2.4%) |
| 75 to 79 Years | 7 (0.5%) | 23 (1.2%) |
| 80 to 84 Years | 0 (0.0%) | 69 (3.7%) |
| 85 Years and over | 36 (2.5%) | 113 (6.1%) |
| Total | 1,461 (100.0%) | 1,850 (100.0%) |
Families and Households in Celada
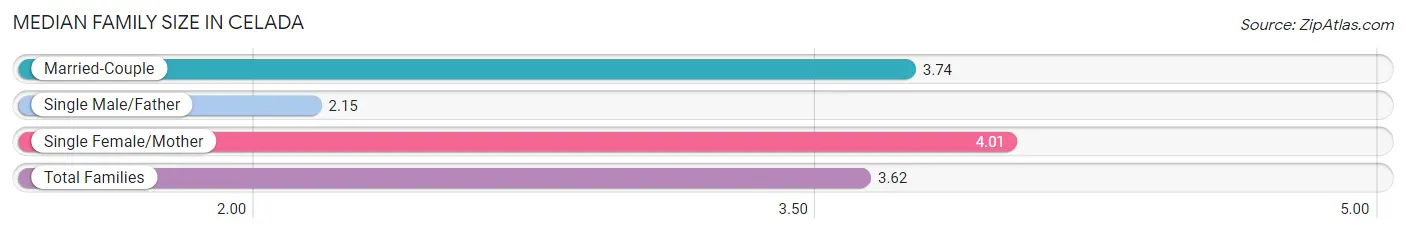
Median Family Size in Celada
The median family size in Celada is 3.62 persons per family, with single female/mother families (302 | 36.7%) accounting for the largest median family size of 4.01 persons per family. On the other hand, single male/father families (114 | 13.9%) represent the smallest median family size with 2.15 persons per family.
| Family Type | # Families | Family Size |
| Married-Couple | 406 (49.4%) | 3.74 |
| Single Male/Father | 114 (13.9%) | 2.15 |
| Single Female/Mother | 302 (36.7%) | 4.01 |
| Total Families | 822 (100.0%) | 3.62 |
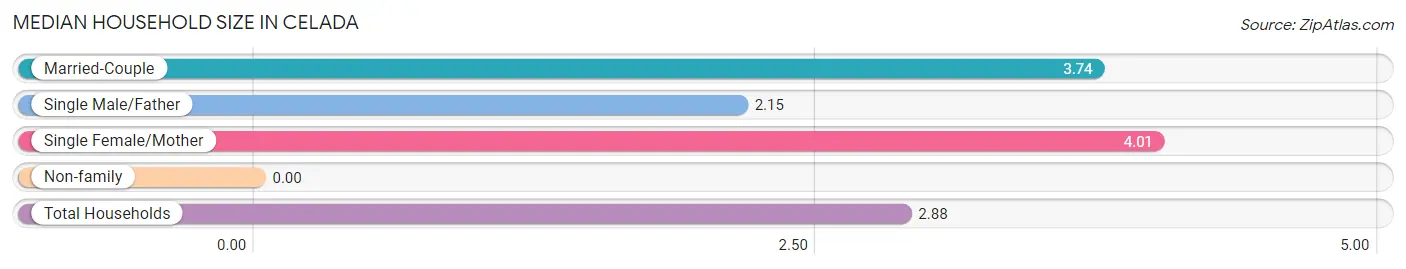
Median Household Size in Celada
| Household Type | # Households | Household Size |
| Married-Couple | 406 (35.4%) | 3.74 |
| Single Male/Father | 114 (9.9%) | 2.15 |
| Single Female/Mother | 302 (26.3%) | 4.01 |
| Non-family | 325 (28.3%) | - |
| Total Households | 1,147 (100.0%) | 2.88 |
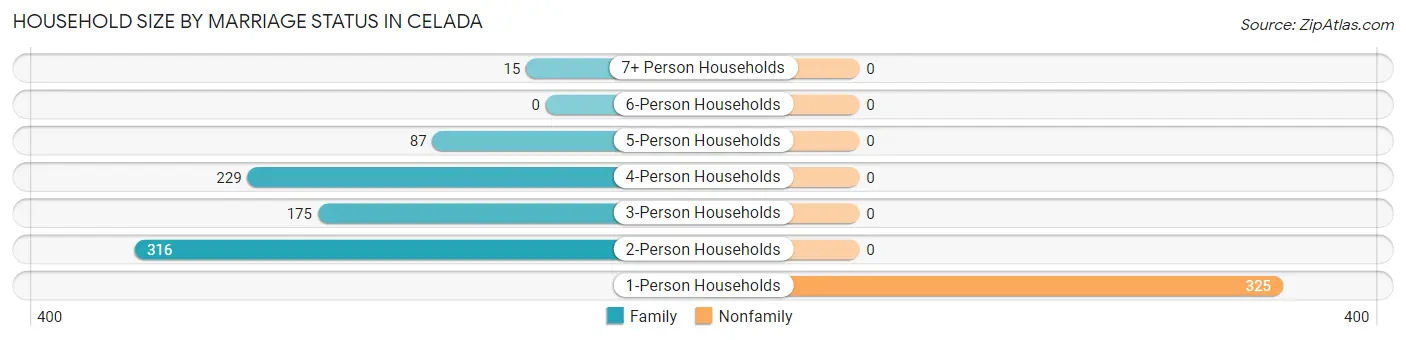
Household Size by Marriage Status in Celada
Out of a total of 1,147 households in Celada, 822 (71.7%) are family households, while 325 (28.3%) are nonfamily households. The most numerous type of family households are 2-person households, comprising 316, and the most common type of nonfamily households are 1-person households, comprising 325.
| Household Size | Family Households | Nonfamily Households |
| 1-Person Households | - | 325 (28.3%) |
| 2-Person Households | 316 (27.6%) | 0 (0.0%) |
| 3-Person Households | 175 (15.3%) | 0 (0.0%) |
| 4-Person Households | 229 (20.0%) | 0 (0.0%) |
| 5-Person Households | 87 (7.6%) | 0 (0.0%) |
| 6-Person Households | 0 (0.0%) | 0 (0.0%) |
| 7+ Person Households | 15 (1.3%) | 0 (0.0%) |
| Total | 822 (71.7%) | 325 (28.3%) |
Female Fertility in Celada
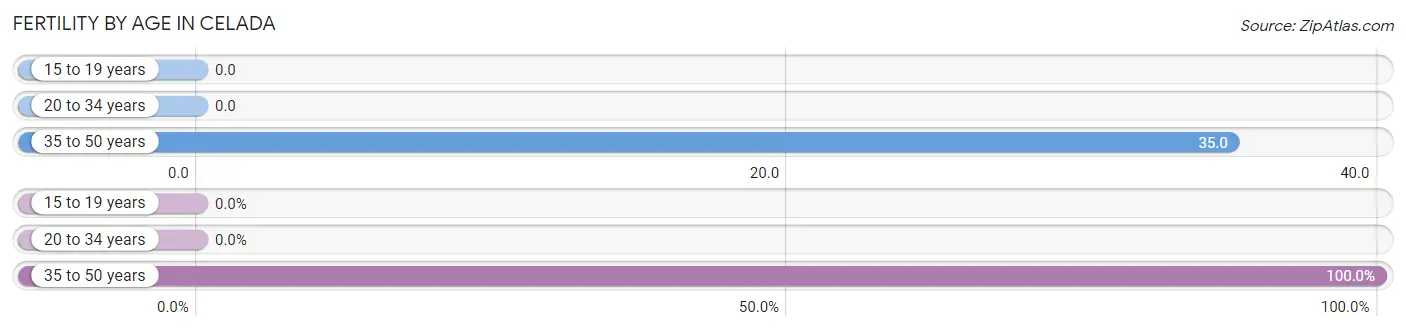
Fertility by Age in Celada
Average fertility rate in Celada is 20.0 births per 1,000 women. Women in the age bracket of 35 to 50 years have the highest fertility rate with 35.0 births per 1,000 women. Women in the age bracket of 35 to 50 years acount for 100.0% of all women with births.
| Age Bracket | Women with Births | Births / 1,000 Women |
| 15 to 19 years | 0 (0.0%) | 0.0 |
| 20 to 34 years | 0 (0.0%) | 0.0 |
| 35 to 50 years | 17 (100.0%) | 35.0 |
| Total | 17 (100.0%) | 20.0 |
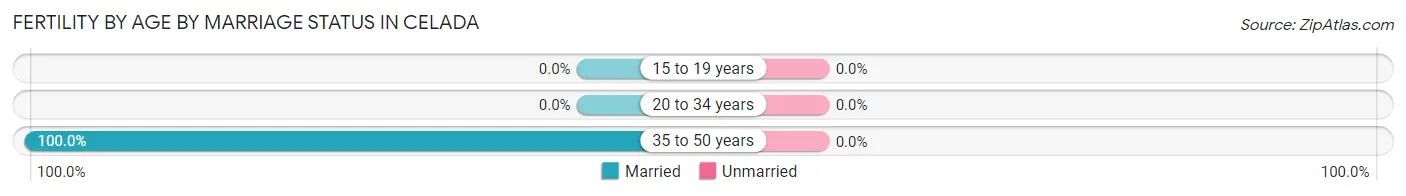
Fertility by Age by Marriage Status in Celada
| Age Bracket | Married | Unmarried |
| 15 to 19 years | 0 (0.0%) | 0 (0.0%) |
| 20 to 34 years | 0 (0.0%) | 0 (0.0%) |
| 35 to 50 years | 17 (100.0%) | 0 (0.0%) |
| Total | 17 (100.0%) | 0 (0.0%) |
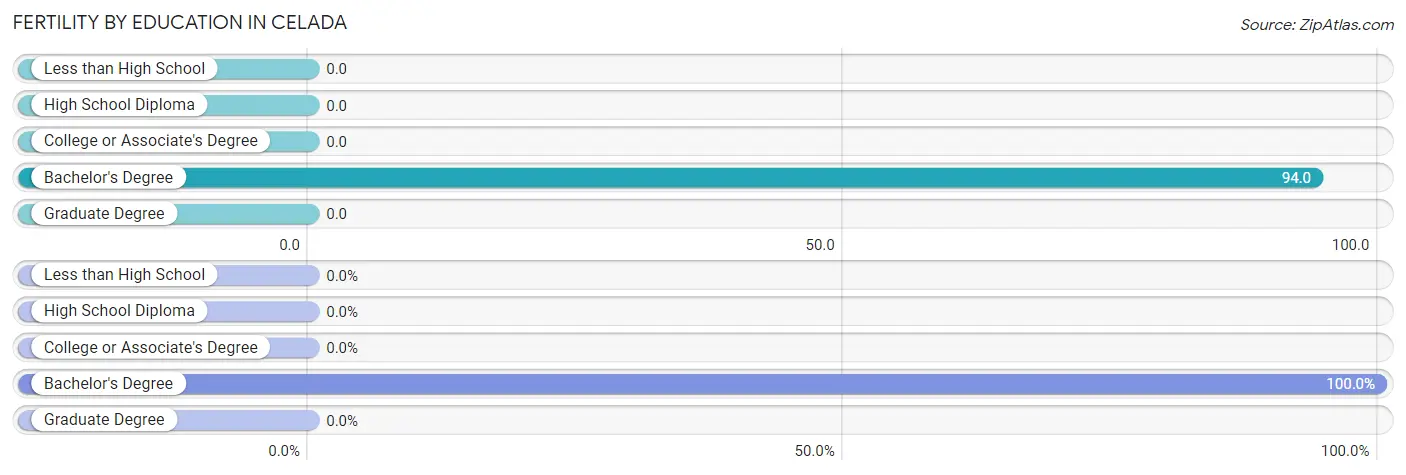
Fertility by Education in Celada
| Educational Attainment | Women with Births | Births / 1,000 Women |
| Less than High School | 0 (0.0%) | 0.0 |
| High School Diploma | 0 (0.0%) | 0.0 |
| College or Associate's Degree | 0 (0.0%) | 0.0 |
| Bachelor's Degree | 17 (100.0%) | 94.0 |
| Graduate Degree | 0 (0.0%) | 0.0 |
| Total | 17 (100.0%) | 20.0 |
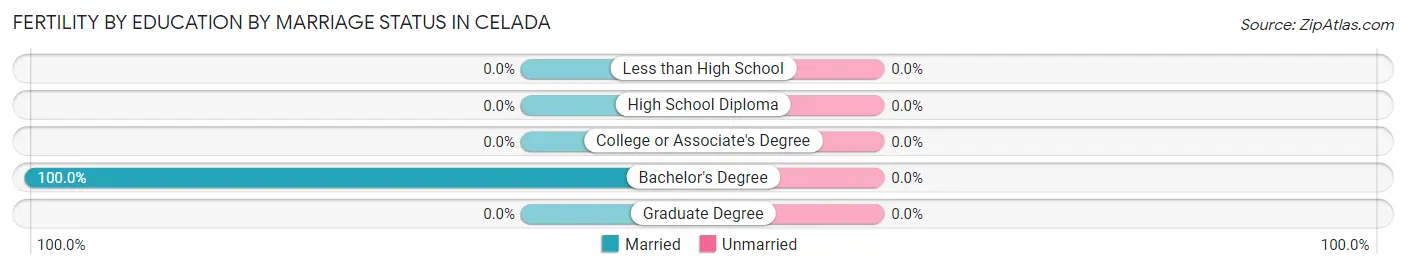
Fertility by Education by Marriage Status in Celada
| Educational Attainment | Married | Unmarried |
| Less than High School | 0 (0.0%) | 0 (0.0%) |
| High School Diploma | 0 (0.0%) | 0 (0.0%) |
| College or Associate's Degree | 0 (0.0%) | 0 (0.0%) |
| Bachelor's Degree | 17 (100.0%) | 0 (0.0%) |
| Graduate Degree | 0 (0.0%) | 0 (0.0%) |
| Total | 17 (100.0%) | 0 (0.0%) |
Employment Characteristics in Celada
Employment by Class of Employer in Celada
Among the 1,078 employed individuals in Celada, private company employees (585 | 54.3%), self-employed (not incorporated) (256 | 23.7%), and state government employees (125 | 11.6%) make up the most common classes of employment.
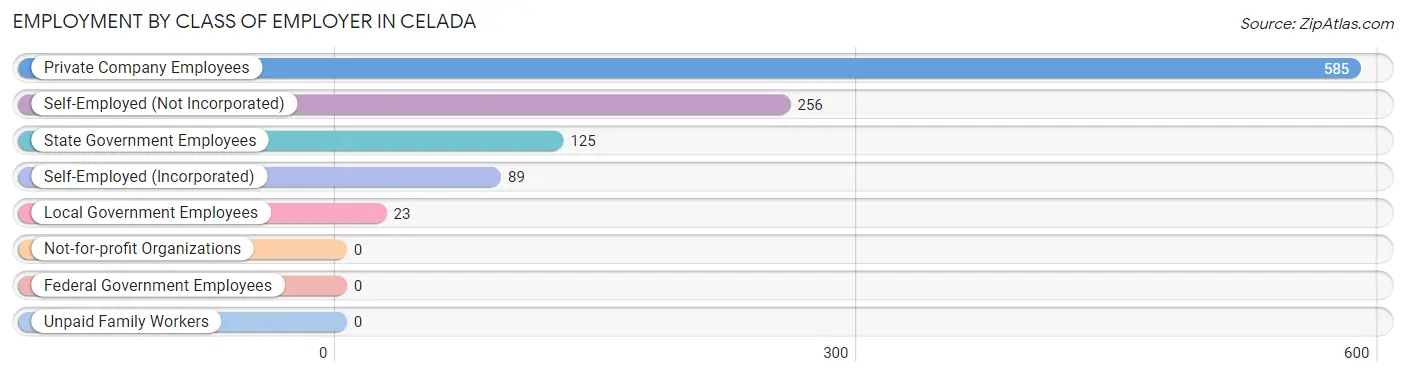
| Employer Class | # Employees | % Employees |
| Private Company Employees | 585 | 54.3% |
| Self-Employed (Incorporated) | 89 | 8.3% |
| Self-Employed (Not Incorporated) | 256 | 23.7% |
| Not-for-profit Organizations | 0 | 0.0% |
| Local Government Employees | 23 | 2.1% |
| State Government Employees | 125 | 11.6% |
| Federal Government Employees | 0 | 0.0% |
| Unpaid Family Workers | 0 | 0.0% |
| Total | 1,078 | 100.0% |
Employment Status by Age in Celada
According to the labor force statistics for Celada, out of the total population over 16 years of age (2,904), 59.2% or 1,719 individuals are in the labor force, with 28.5% or 490 of them unemployed. The age group with the highest labor force participation rate is 30 to 34 years, with 100.0% or 139 individuals in the labor force. Within the labor force, the 20 to 24 years age range has the highest percentage of unemployed individuals, with 80.5% or 211 of them being unemployed.
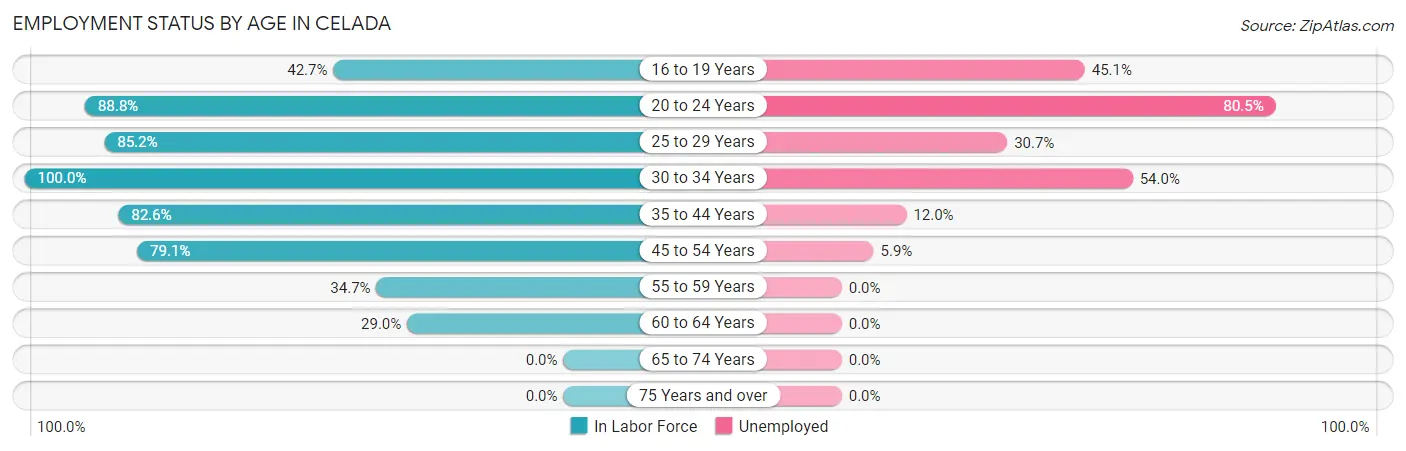
| Age Bracket | In Labor Force | Unemployed |
| 16 to 19 Years | 91 (42.7%) | 41 (45.1%) |
| 20 to 24 Years | 262 (88.8%) | 211 (80.5%) |
| 25 to 29 Years | 293 (85.2%) | 90 (30.7%) |
| 30 to 34 Years | 139 (100.0%) | 75 (54.0%) |
| 35 to 44 Years | 459 (82.6%) | 55 (12.0%) |
| 45 to 54 Years | 287 (79.1%) | 17 (5.9%) |
| 55 to 59 Years | 61 (34.7%) | 0 (0.0%) |
| 60 to 64 Years | 126 (29.0%) | 0 (0.0%) |
| 65 to 74 Years | 0 (0.0%) | 0 (0.0%) |
| 75 Years and over | 0 (0.0%) | 0 (0.0%) |
| Total | 1,719 (59.2%) | 490 (28.5%) |
Employment Status by Educational Attainment in Celada
According to labor force statistics for Celada, 67.8% of individuals (1,364) out of the total population between 25 and 64 years of age (2,012) are in the labor force, with 17.4% or 237 of them being unemployed. The group with the highest labor force participation rate are those with the educational attainment of college / associate degree, with 83.2% or 549 individuals in the labor force. Within the labor force, individuals with high school diploma education have the highest percentage of unemployment, with 39.0% or 191 of them being unemployed.
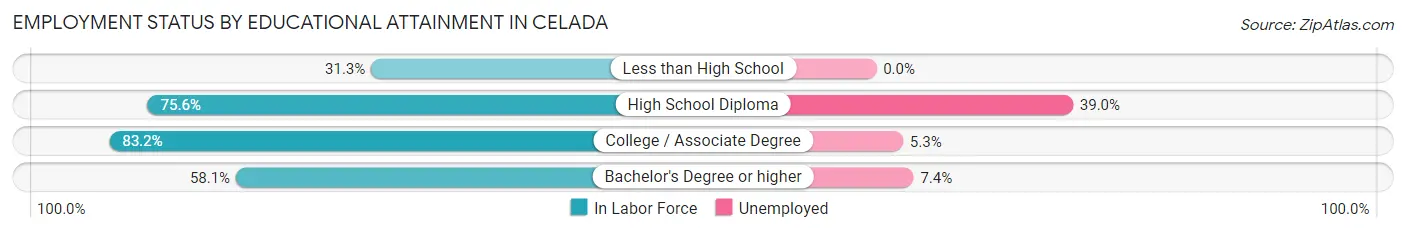
| Educational Attainment | In Labor Force | Unemployed |
| Less than High School | 97 (31.3%) | 0 (0.0%) |
| High School Diploma | 490 (75.6%) | 253 (39.0%) |
| College / Associate Degree | 549 (83.2%) | 35 (5.3%) |
| Bachelor's Degree or higher | 229 (58.1%) | 29 (7.4%) |
| Total | 1,364 (67.8%) | 350 (17.4%) |
Employment Occupations by Sex in Celada
Management, Business, Science and Arts Occupations
The most common Management, Business, Science and Arts occupations in Celada are Community & Social Service (101 | 8.2%), Arts, Media & Entertainment (101 | 8.2%), Management (95 | 7.7%), Health Diagnosing & Treating (40 | 3.3%), and Health Technologists (40 | 3.3%).
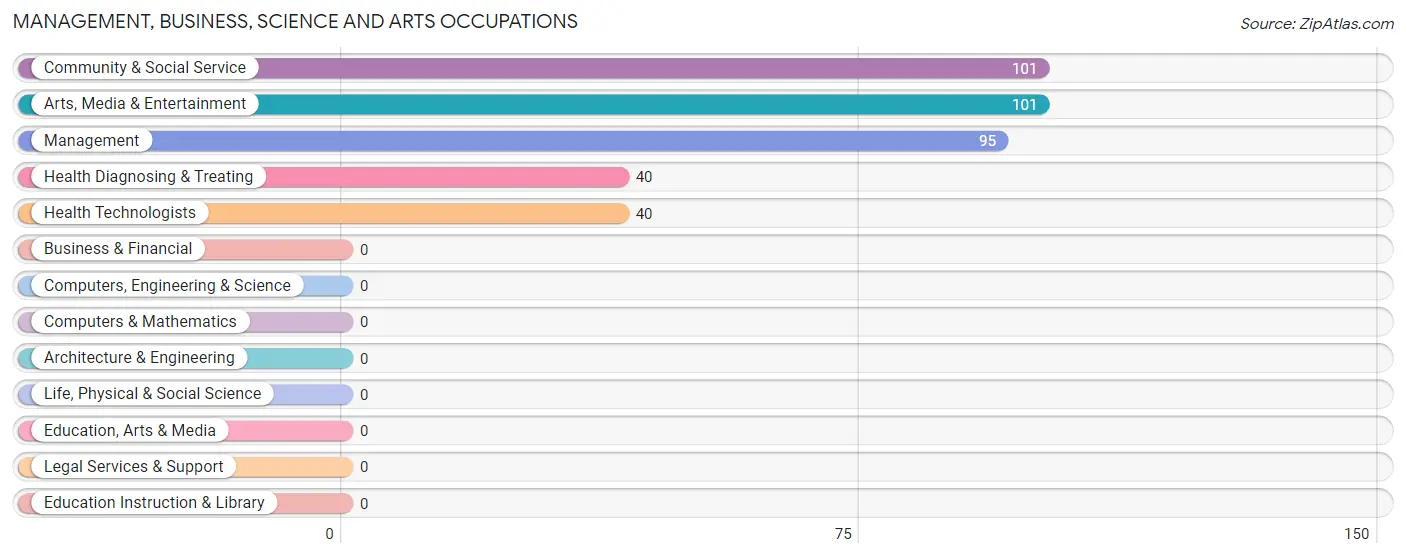
Management, Business, Science and Arts Occupations by Sex
Within the Management, Business, Science and Arts occupations in Celada, the most male-oriented occupations are Community & Social Service (100.0%), and Arts, Media & Entertainment (100.0%), while the most female-oriented occupations are Management (100.0%), Health Diagnosing & Treating (100.0%), and Health Technologists (100.0%).
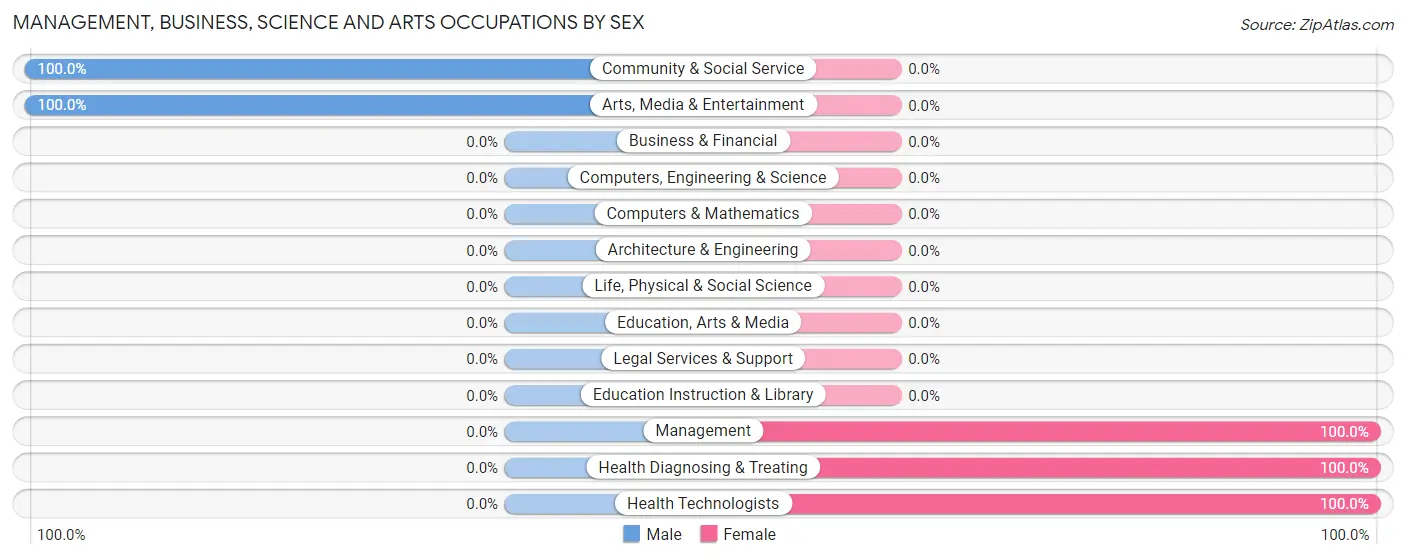
| Occupation | Male | Female |
| Management | 0 (0.0%) | 95 (100.0%) |
| Business & Financial | 0 (0.0%) | 0 (0.0%) |
| Computers, Engineering & Science | 0 (0.0%) | 0 (0.0%) |
| Computers & Mathematics | 0 (0.0%) | 0 (0.0%) |
| Architecture & Engineering | 0 (0.0%) | 0 (0.0%) |
| Life, Physical & Social Science | 0 (0.0%) | 0 (0.0%) |
| Community & Social Service | 101 (100.0%) | 0 (0.0%) |
| Education, Arts & Media | 0 (0.0%) | 0 (0.0%) |
| Legal Services & Support | 0 (0.0%) | 0 (0.0%) |
| Education Instruction & Library | 0 (0.0%) | 0 (0.0%) |
| Arts, Media & Entertainment | 101 (100.0%) | 0 (0.0%) |
| Health Diagnosing & Treating | 0 (0.0%) | 40 (100.0%) |
| Health Technologists | 0 (0.0%) | 40 (100.0%) |
| Total (Category) | 101 (42.8%) | 135 (57.2%) |
| Total (Overall) | 747 (60.8%) | 482 (39.2%) |
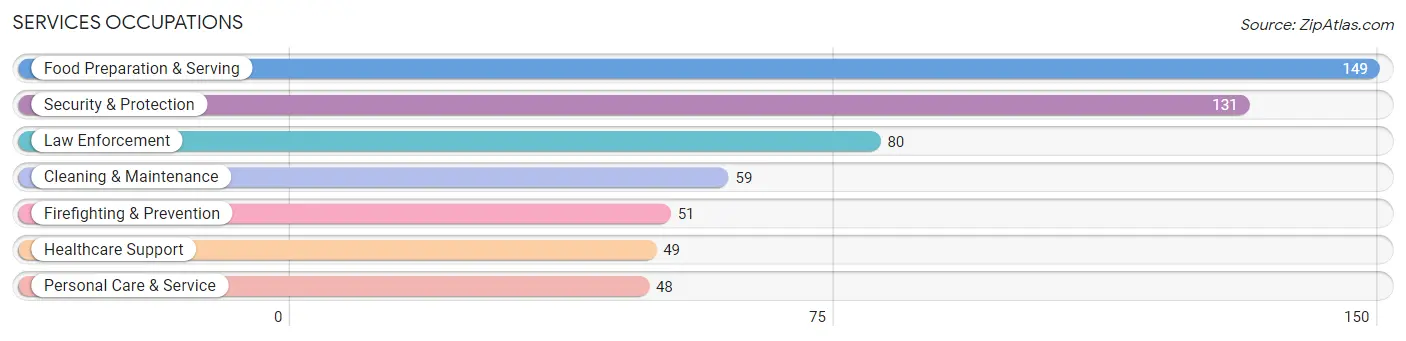
Services Occupations
The most common Services occupations in Celada are Food Preparation & Serving (149 | 12.1%), Security & Protection (131 | 10.7%), Law Enforcement (80 | 6.5%), Cleaning & Maintenance (59 | 4.8%), and Firefighting & Prevention (51 | 4.2%).
Services Occupations by Sex
Within the Services occupations in Celada, the most male-oriented occupations are Firefighting & Prevention (100.0%), Personal Care & Service (100.0%), and Food Preparation & Serving (82.6%), while the most female-oriented occupations are Healthcare Support (100.0%), Law Enforcement (75.0%), and Security & Protection (45.8%).
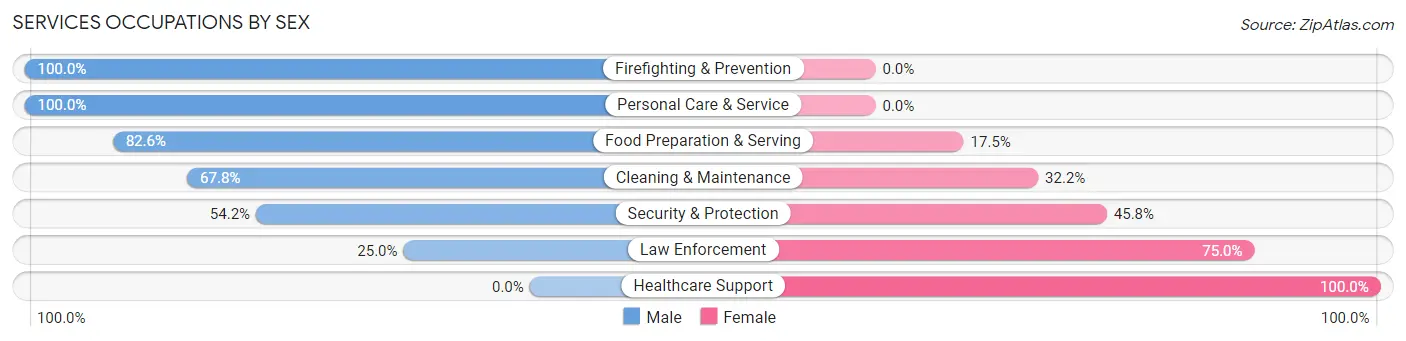
| Occupation | Male | Female |
| Healthcare Support | 0 (0.0%) | 49 (100.0%) |
| Security & Protection | 71 (54.2%) | 60 (45.8%) |
| Firefighting & Prevention | 51 (100.0%) | 0 (0.0%) |
| Law Enforcement | 20 (25.0%) | 60 (75.0%) |
| Food Preparation & Serving | 123 (82.6%) | 26 (17.4%) |
| Cleaning & Maintenance | 40 (67.8%) | 19 (32.2%) |
| Personal Care & Service | 48 (100.0%) | 0 (0.0%) |
| Total (Category) | 282 (64.7%) | 154 (35.3%) |
| Total (Overall) | 747 (60.8%) | 482 (39.2%) |
Sales and Office Occupations
The most common Sales and Office occupations in Celada are Sales & Related (152 | 12.4%), and Office & Administration (101 | 8.2%).

Sales and Office Occupations by Sex
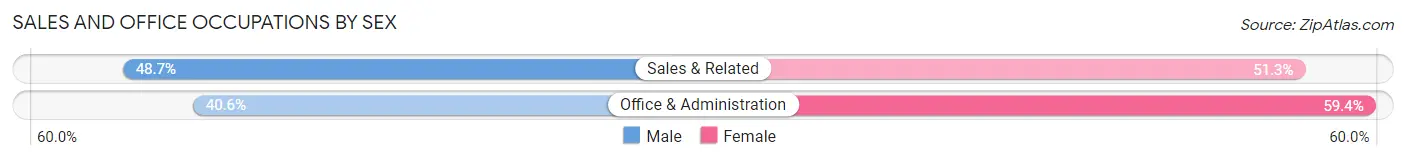
| Occupation | Male | Female |
| Sales & Related | 74 (48.7%) | 78 (51.3%) |
| Office & Administration | 41 (40.6%) | 60 (59.4%) |
| Total (Category) | 115 (45.5%) | 138 (54.5%) |
| Total (Overall) | 747 (60.8%) | 482 (39.2%) |
Natural Resources, Construction and Maintenance Occupations
The most common Natural Resources, Construction and Maintenance occupations in Celada are Construction & Extraction (94 | 7.6%), and Installation, Maintenance & Repair (24 | 1.9%).
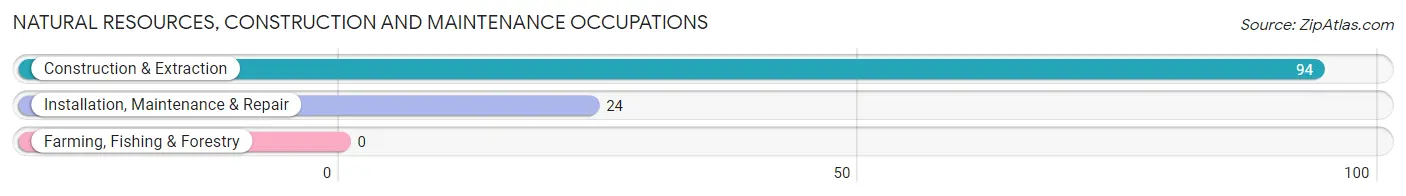
Natural Resources, Construction and Maintenance Occupations by Sex
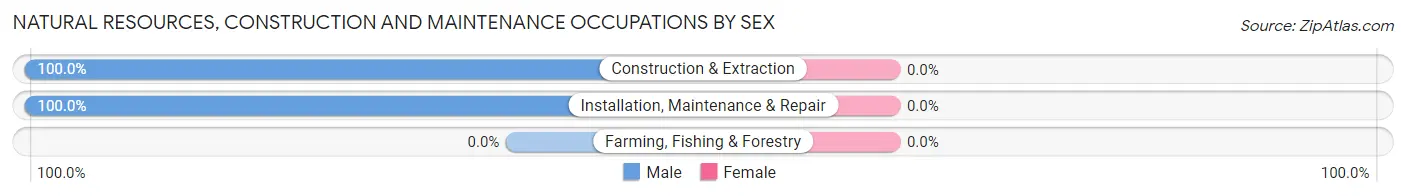
| Occupation | Male | Female |
| Farming, Fishing & Forestry | 0 (0.0%) | 0 (0.0%) |
| Construction & Extraction | 94 (100.0%) | 0 (0.0%) |
| Installation, Maintenance & Repair | 24 (100.0%) | 0 (0.0%) |
| Total (Category) | 118 (100.0%) | 0 (0.0%) |
| Total (Overall) | 747 (60.8%) | 482 (39.2%) |
Production, Transportation and Moving Occupations
The most common Production, Transportation and Moving occupations in Celada are Production (80 | 6.5%), Transportation (62 | 5.0%), and Material Moving (44 | 3.6%).
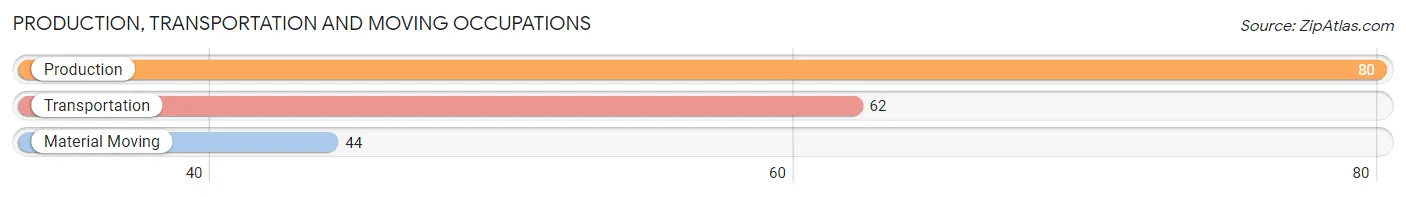
Production, Transportation and Moving Occupations by Sex
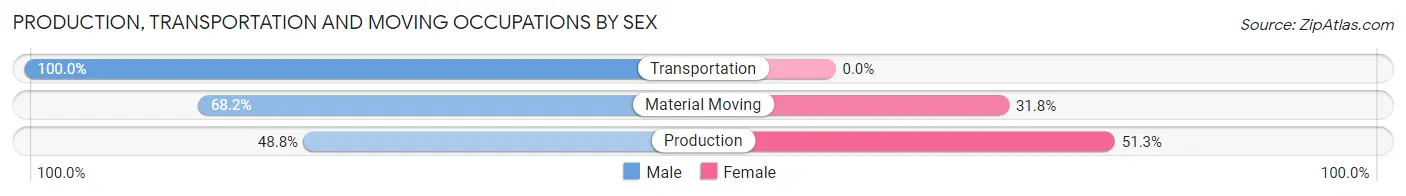
| Occupation | Male | Female |
| Production | 39 (48.7%) | 41 (51.2%) |
| Transportation | 62 (100.0%) | 0 (0.0%) |
| Material Moving | 30 (68.2%) | 14 (31.8%) |
| Total (Category) | 131 (70.4%) | 55 (29.6%) |
| Total (Overall) | 747 (60.8%) | 482 (39.2%) |
Employment Industries by Sex in Celada
Employment Industries in Celada
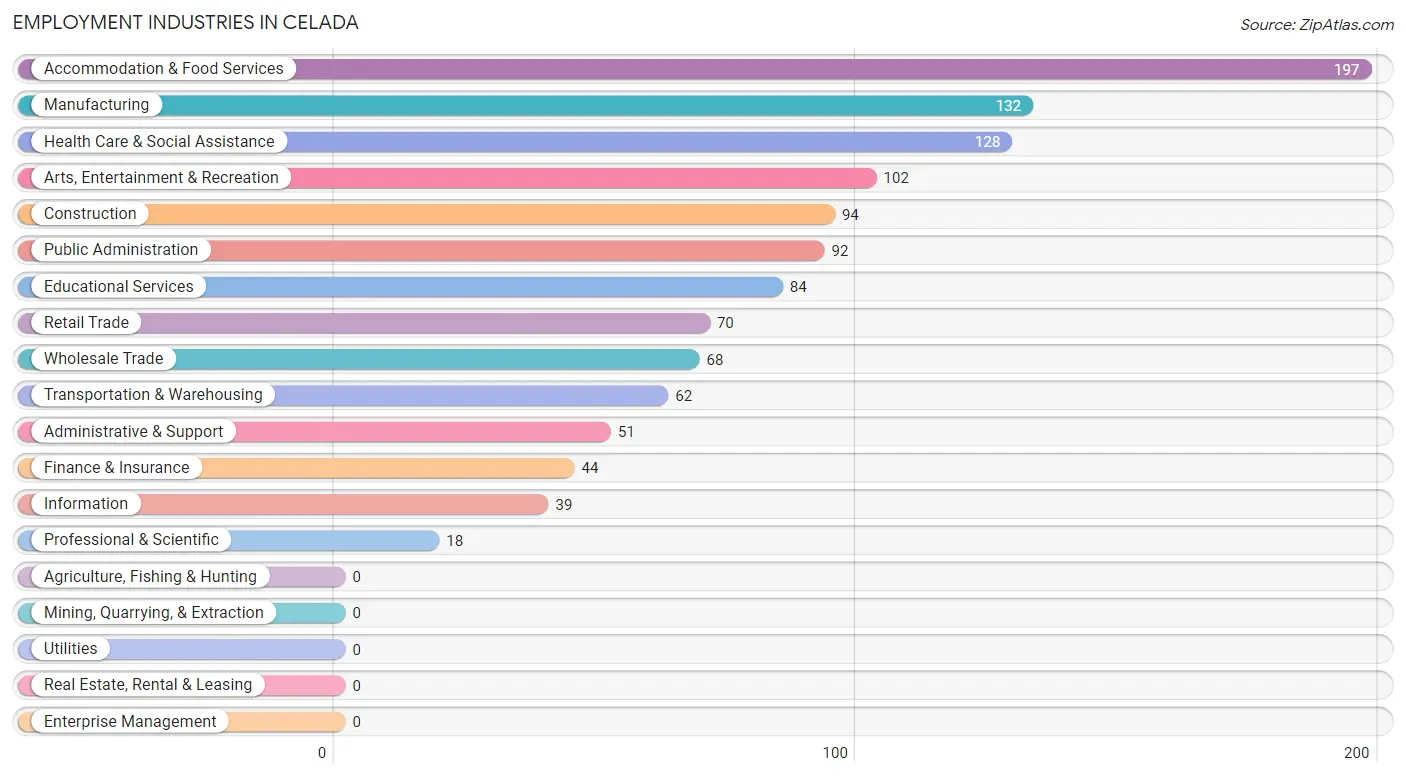
The major employment industries in Celada include Accommodation & Food Services (197 | 16.0%), Manufacturing (132 | 10.7%), Health Care & Social Assistance (128 | 10.4%), Arts, Entertainment & Recreation (102 | 8.3%), and Construction (94 | 7.6%).
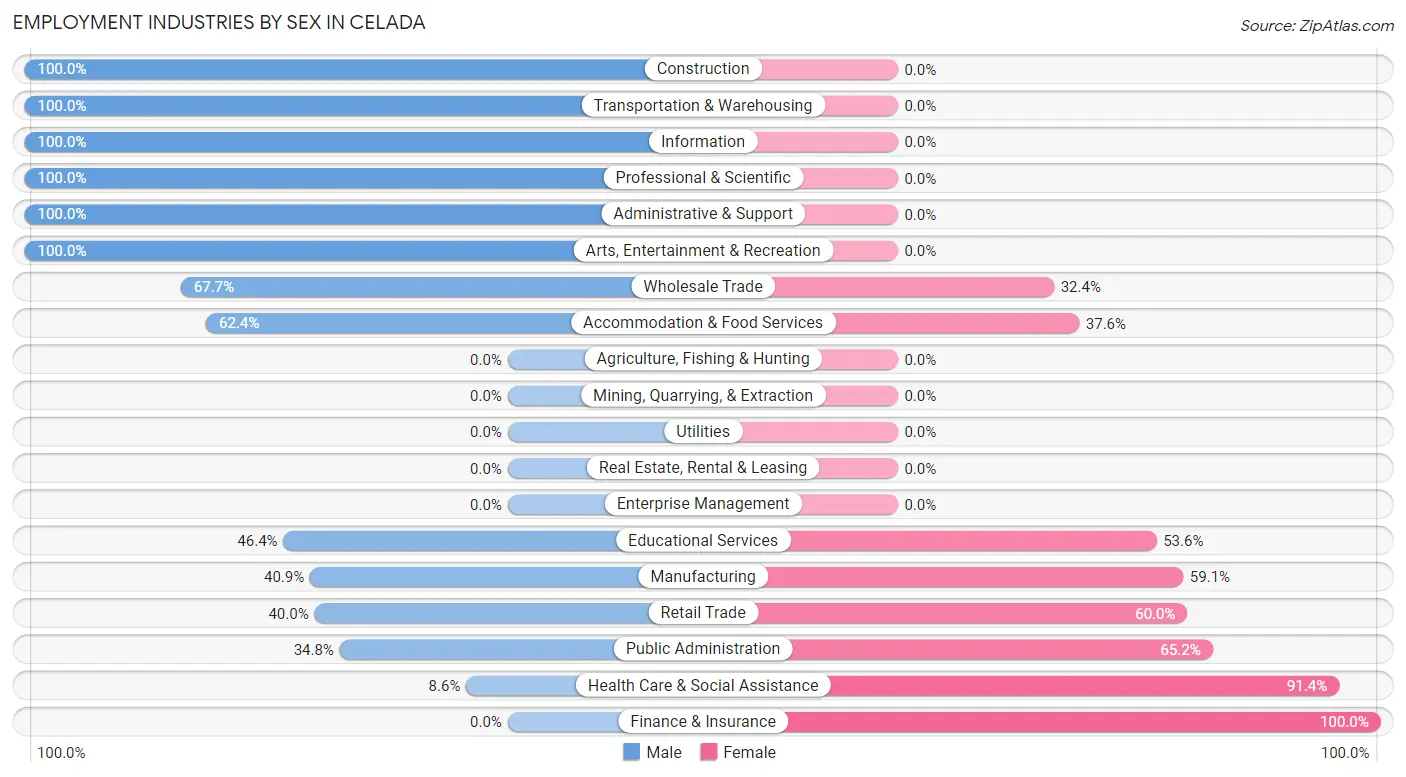
Employment Industries by Sex in Celada
The Celada industries that see more men than women are Construction (100.0%), Transportation & Warehousing (100.0%), and Information (100.0%), whereas the industries that tend to have a higher number of women are Finance & Insurance (100.0%), Health Care & Social Assistance (91.4%), and Public Administration (65.2%).
| Industry | Male | Female |
| Agriculture, Fishing & Hunting | 0 (0.0%) | 0 (0.0%) |
| Mining, Quarrying, & Extraction | 0 (0.0%) | 0 (0.0%) |
| Construction | 94 (100.0%) | 0 (0.0%) |
| Manufacturing | 54 (40.9%) | 78 (59.1%) |
| Wholesale Trade | 46 (67.6%) | 22 (32.4%) |
| Retail Trade | 28 (40.0%) | 42 (60.0%) |
| Transportation & Warehousing | 62 (100.0%) | 0 (0.0%) |
| Utilities | 0 (0.0%) | 0 (0.0%) |
| Information | 39 (100.0%) | 0 (0.0%) |
| Finance & Insurance | 0 (0.0%) | 44 (100.0%) |
| Real Estate, Rental & Leasing | 0 (0.0%) | 0 (0.0%) |
| Professional & Scientific | 18 (100.0%) | 0 (0.0%) |
| Enterprise Management | 0 (0.0%) | 0 (0.0%) |
| Administrative & Support | 51 (100.0%) | 0 (0.0%) |
| Educational Services | 39 (46.4%) | 45 (53.6%) |
| Health Care & Social Assistance | 11 (8.6%) | 117 (91.4%) |
| Arts, Entertainment & Recreation | 102 (100.0%) | 0 (0.0%) |
| Accommodation & Food Services | 123 (62.4%) | 74 (37.6%) |
| Public Administration | 32 (34.8%) | 60 (65.2%) |
| Total | 747 (60.8%) | 482 (39.2%) |
Education in Celada
School Enrollment in Celada
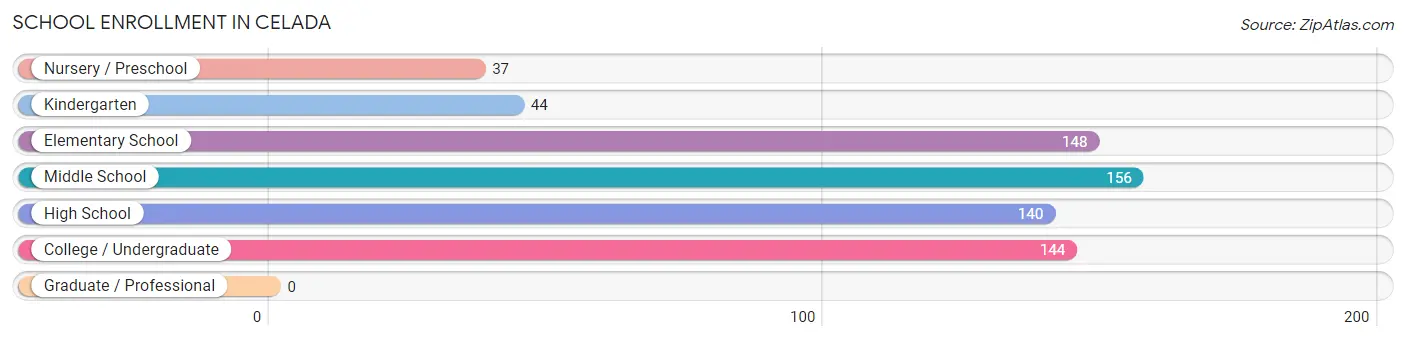
The most common levels of schooling among the 669 students in Celada are middle school (156 | 23.3%), elementary school (148 | 22.1%), and college / undergraduate (144 | 21.5%).
| School Level | # Students | % Students |
| Nursery / Preschool | 37 | 5.5% |
| Kindergarten | 44 | 6.6% |
| Elementary School | 148 | 22.1% |
| Middle School | 156 | 23.3% |
| High School | 140 | 20.9% |
| College / Undergraduate | 144 | 21.5% |
| Graduate / Professional | 0 | 0.0% |
| Total | 669 | 100.0% |
School Enrollment by Age by Funding Source in Celada
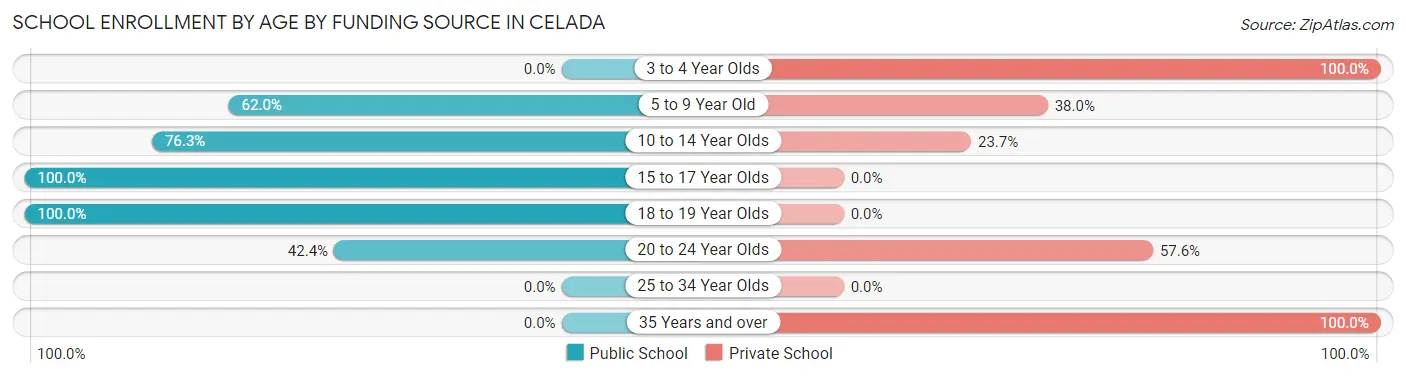
Out of a total of 669 students who are enrolled in schools in Celada, 252 (37.7%) attend a private institution, while the remaining 417 (62.3%) are enrolled in public schools. The age group of 3 to 4 year olds has the highest likelihood of being enrolled in private schools, with 37 (100.0% in the age bracket) enrolled. Conversely, the age group of 15 to 17 year olds has the lowest likelihood of being enrolled in a private school, with 51 (100.0% in the age bracket) attending a public institution.
| Age Bracket | Public School | Private School |
| 3 to 4 Year Olds | 0 (0.0%) | 37 (100.0%) |
| 5 to 9 Year Old | 106 (62.0%) | 65 (38.0%) |
| 10 to 14 Year Olds | 135 (76.3%) | 42 (23.7%) |
| 15 to 17 Year Olds | 51 (100.0%) | 0 (0.0%) |
| 18 to 19 Year Olds | 86 (100.0%) | 0 (0.0%) |
| 20 to 24 Year Olds | 39 (42.4%) | 53 (57.6%) |
| 25 to 34 Year Olds | 0 (0.0%) | 0 (0.0%) |
| 35 Years and over | 0 (0.0%) | 55 (100.0%) |
| Total | 417 (62.3%) | 252 (37.7%) |
Educational Attainment by Field of Study in Celada
Business (144 | 35.2%), arts & humanities (72 | 17.6%), computers & mathematics (66 | 16.1%), science & technology (40 | 9.8%), and physical & health sciences (35 | 8.6%) are the most common fields of study among 409 individuals in Celada who have obtained a bachelor's degree or higher.
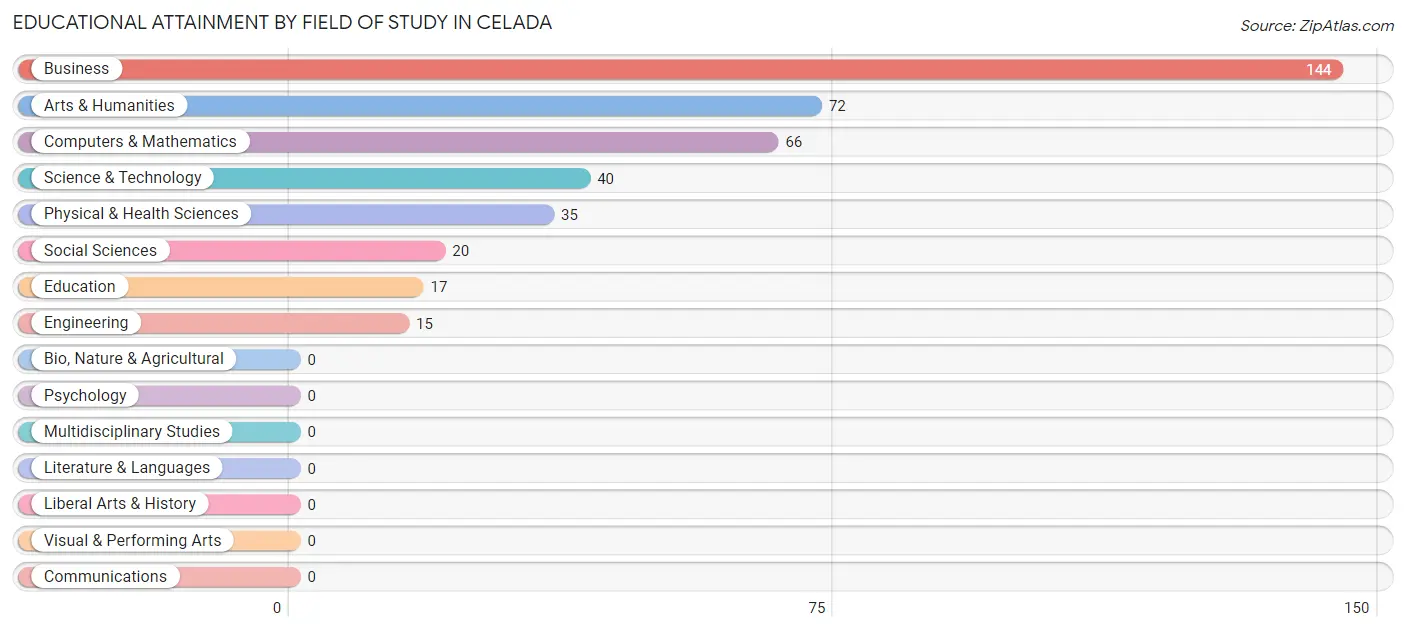
| Field of Study | # Graduates | % Graduates |
| Computers & Mathematics | 66 | 16.1% |
| Bio, Nature & Agricultural | 0 | 0.0% |
| Physical & Health Sciences | 35 | 8.6% |
| Psychology | 0 | 0.0% |
| Social Sciences | 20 | 4.9% |
| Engineering | 15 | 3.7% |
| Multidisciplinary Studies | 0 | 0.0% |
| Science & Technology | 40 | 9.8% |
| Business | 144 | 35.2% |
| Education | 17 | 4.2% |
| Literature & Languages | 0 | 0.0% |
| Liberal Arts & History | 0 | 0.0% |
| Visual & Performing Arts | 0 | 0.0% |
| Communications | 0 | 0.0% |
| Arts & Humanities | 72 | 17.6% |
| Total | 409 | 100.0% |
Transportation & Commute in Celada
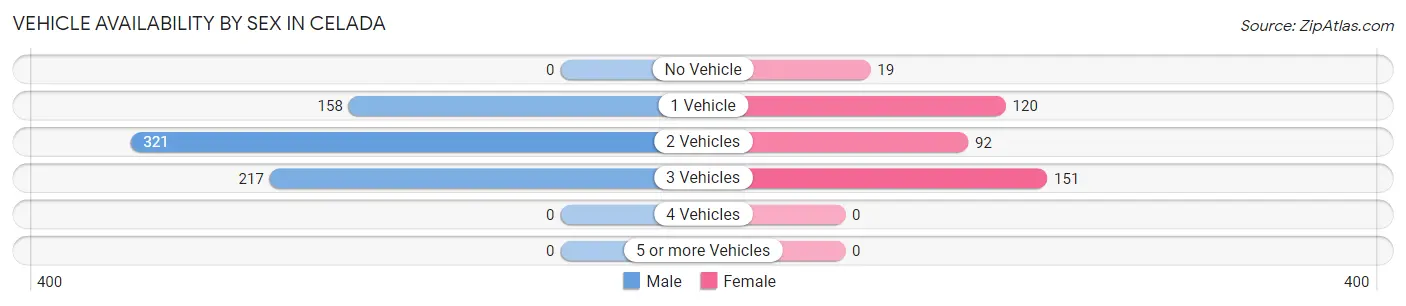
Vehicle Availability by Sex in Celada
The most prevalent vehicle ownership categories in Celada are males with 2 vehicles (321, accounting for 46.1%) and females with 2 vehicles (92, making up 84.0%).
| Vehicles Available | Male | Female |
| No Vehicle | 0 (0.0%) | 19 (5.0%) |
| 1 Vehicle | 158 (22.7%) | 120 (31.4%) |
| 2 Vehicles | 321 (46.1%) | 92 (24.1%) |
| 3 Vehicles | 217 (31.2%) | 151 (39.5%) |
| 4 Vehicles | 0 (0.0%) | 0 (0.0%) |
| 5 or more Vehicles | 0 (0.0%) | 0 (0.0%) |
| Total | 696 (100.0%) | 382 (100.0%) |
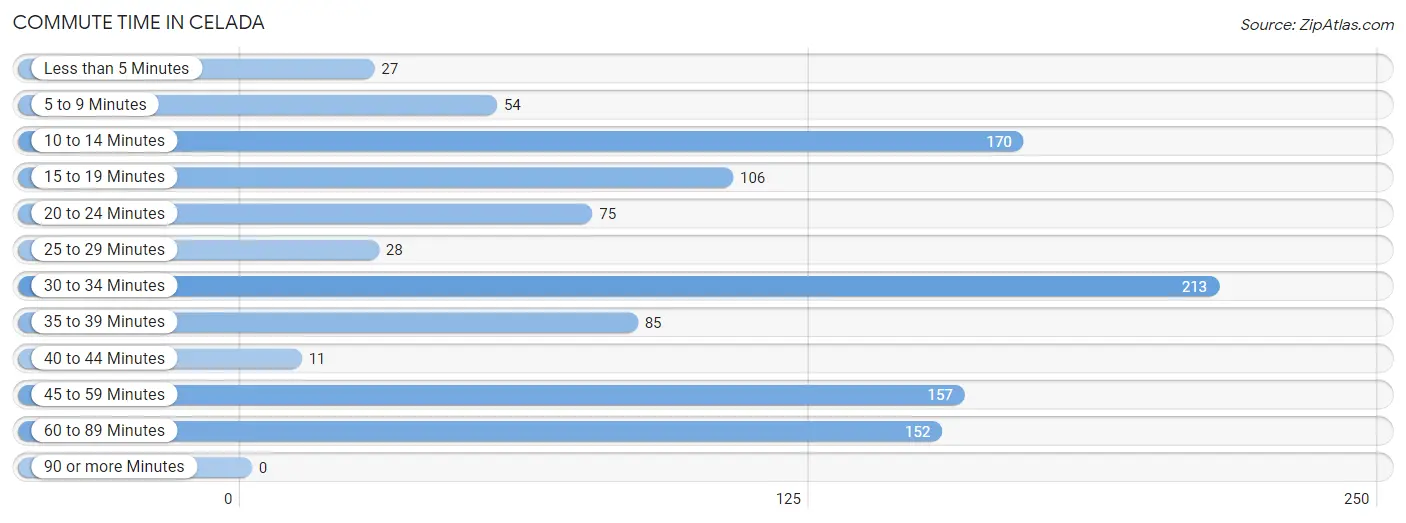
Commute Time in Celada
The most frequently occuring commute durations in Celada are 30 to 34 minutes (213 commuters, 19.8%), 10 to 14 minutes (170 commuters, 15.8%), and 45 to 59 minutes (157 commuters, 14.6%).
| Commute Time | # Commuters | % Commuters |
| Less than 5 Minutes | 27 | 2.5% |
| 5 to 9 Minutes | 54 | 5.0% |
| 10 to 14 Minutes | 170 | 15.8% |
| 15 to 19 Minutes | 106 | 9.8% |
| 20 to 24 Minutes | 75 | 7.0% |
| 25 to 29 Minutes | 28 | 2.6% |
| 30 to 34 Minutes | 213 | 19.8% |
| 35 to 39 Minutes | 85 | 7.9% |
| 40 to 44 Minutes | 11 | 1.0% |
| 45 to 59 Minutes | 157 | 14.6% |
| 60 to 89 Minutes | 152 | 14.1% |
| 90 or more Minutes | 0 | 0.0% |
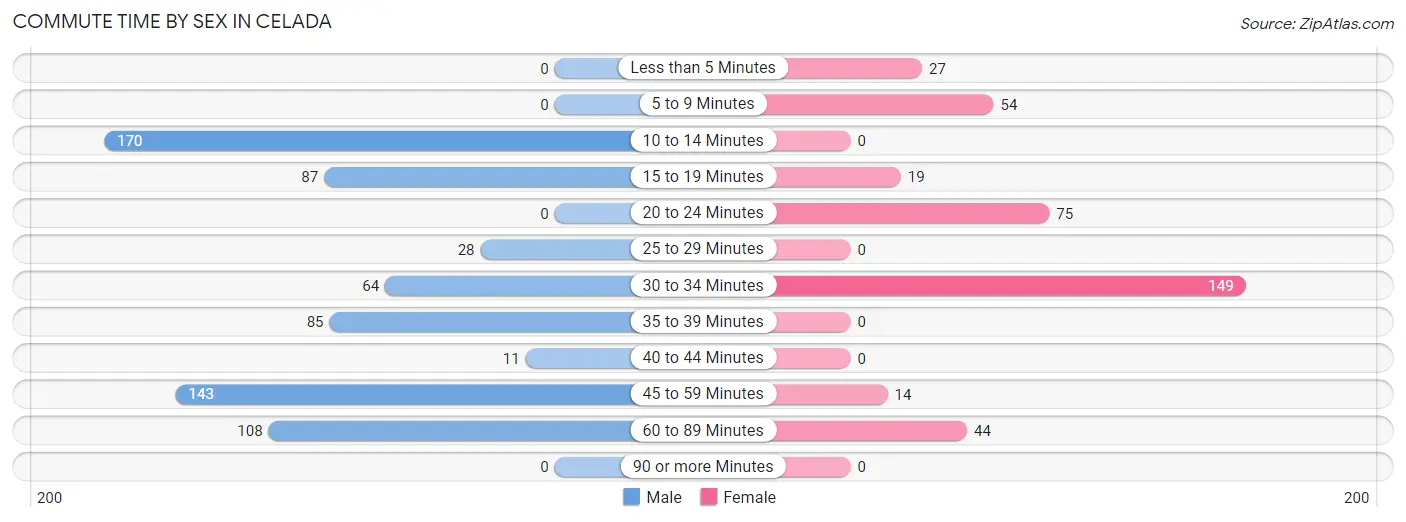
Commute Time by Sex in Celada
The most common commute times in Celada are 10 to 14 minutes (170 commuters, 24.4%) for males and 30 to 34 minutes (149 commuters, 39.0%) for females.
| Commute Time | Male | Female |
| Less than 5 Minutes | 0 (0.0%) | 27 (7.1%) |
| 5 to 9 Minutes | 0 (0.0%) | 54 (14.1%) |
| 10 to 14 Minutes | 170 (24.4%) | 0 (0.0%) |
| 15 to 19 Minutes | 87 (12.5%) | 19 (5.0%) |
| 20 to 24 Minutes | 0 (0.0%) | 75 (19.6%) |
| 25 to 29 Minutes | 28 (4.0%) | 0 (0.0%) |
| 30 to 34 Minutes | 64 (9.2%) | 149 (39.0%) |
| 35 to 39 Minutes | 85 (12.2%) | 0 (0.0%) |
| 40 to 44 Minutes | 11 (1.6%) | 0 (0.0%) |
| 45 to 59 Minutes | 143 (20.5%) | 14 (3.7%) |
| 60 to 89 Minutes | 108 (15.5%) | 44 (11.5%) |
| 90 or more Minutes | 0 (0.0%) | 0 (0.0%) |
Time of Departure to Work by Sex in Celada
The most frequent times of departure to work in Celada are 5:30 AM to 5:59 AM (124, 17.8%) for males and 6:00 AM to 6:29 AM (137, 35.9%) for females.
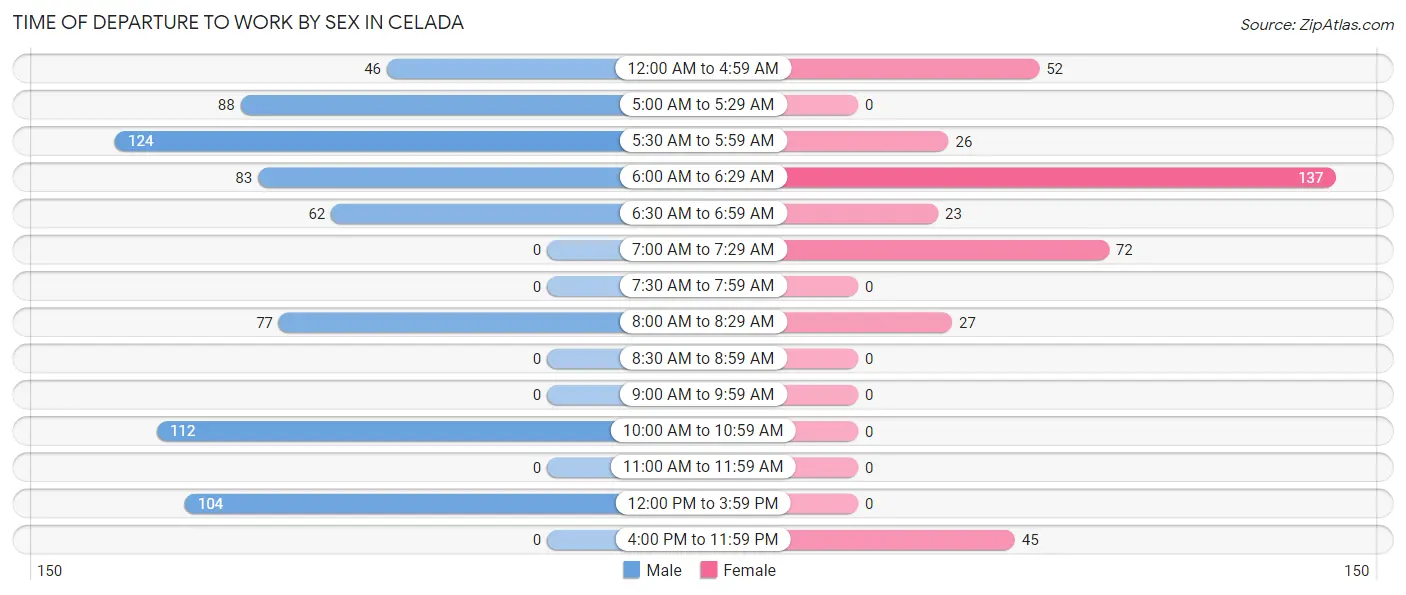
| Time of Departure | Male | Female |
| 12:00 AM to 4:59 AM | 46 (6.6%) | 52 (13.6%) |
| 5:00 AM to 5:29 AM | 88 (12.6%) | 0 (0.0%) |
| 5:30 AM to 5:59 AM | 124 (17.8%) | 26 (6.8%) |
| 6:00 AM to 6:29 AM | 83 (11.9%) | 137 (35.9%) |
| 6:30 AM to 6:59 AM | 62 (8.9%) | 23 (6.0%) |
| 7:00 AM to 7:29 AM | 0 (0.0%) | 72 (18.9%) |
| 7:30 AM to 7:59 AM | 0 (0.0%) | 0 (0.0%) |
| 8:00 AM to 8:29 AM | 77 (11.1%) | 27 (7.1%) |
| 8:30 AM to 8:59 AM | 0 (0.0%) | 0 (0.0%) |
| 9:00 AM to 9:59 AM | 0 (0.0%) | 0 (0.0%) |
| 10:00 AM to 10:59 AM | 112 (16.1%) | 0 (0.0%) |
| 11:00 AM to 11:59 AM | 0 (0.0%) | 0 (0.0%) |
| 12:00 PM to 3:59 PM | 104 (14.9%) | 0 (0.0%) |
| 4:00 PM to 11:59 PM | 0 (0.0%) | 45 (11.8%) |
| Total | 696 (100.0%) | 382 (100.0%) |
Housing Occupancy in Celada
Occupancy by Ownership in Celada
Of the total 1,147 dwellings in Celada, owner-occupied units account for 1,005 (87.6%), while renter-occupied units make up 142 (12.4%).
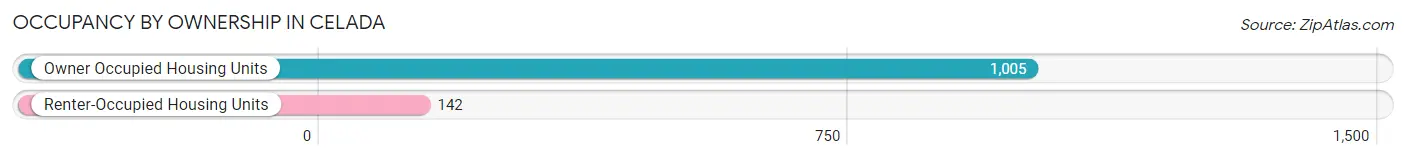
| Occupancy | # Housing Units | % Housing Units |
| Owner Occupied Housing Units | 1,005 | 87.6% |
| Renter-Occupied Housing Units | 142 | 12.4% |
| Total Occupied Housing Units | 1,147 | 100.0% |
Occupancy by Household Size in Celada
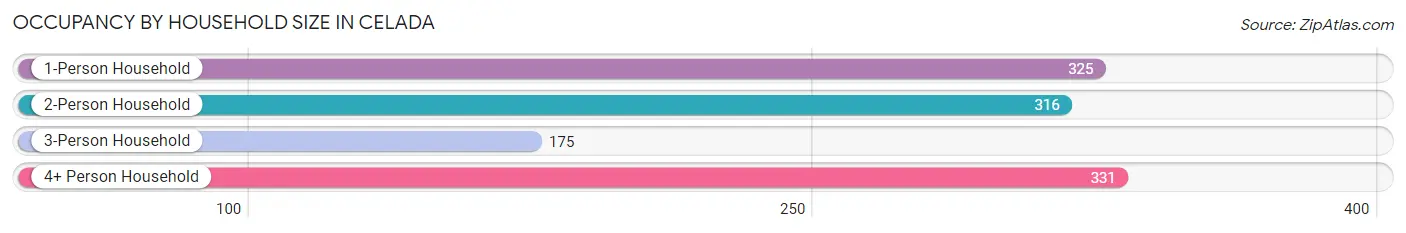
| Household Size | # Housing Units | % Housing Units |
| 1-Person Household | 325 | 28.3% |
| 2-Person Household | 316 | 27.6% |
| 3-Person Household | 175 | 15.3% |
| 4+ Person Household | 331 | 28.9% |
| Total Housing Units | 1,147 | 100.0% |
Occupancy by Ownership by Household Size in Celada
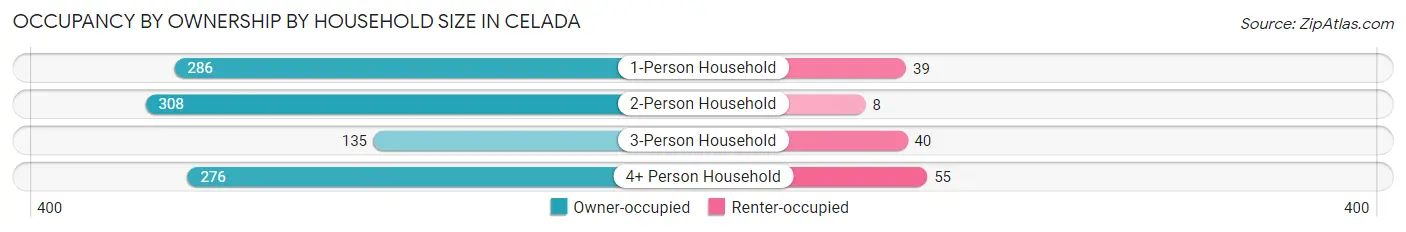
| Household Size | Owner-occupied | Renter-occupied |
| 1-Person Household | 286 (88.0%) | 39 (12.0%) |
| 2-Person Household | 308 (97.5%) | 8 (2.5%) |
| 3-Person Household | 135 (77.1%) | 40 (22.9%) |
| 4+ Person Household | 276 (83.4%) | 55 (16.6%) |
| Total Housing Units | 1,005 (87.6%) | 142 (12.4%) |
Occupancy by Educational Attainment in Celada
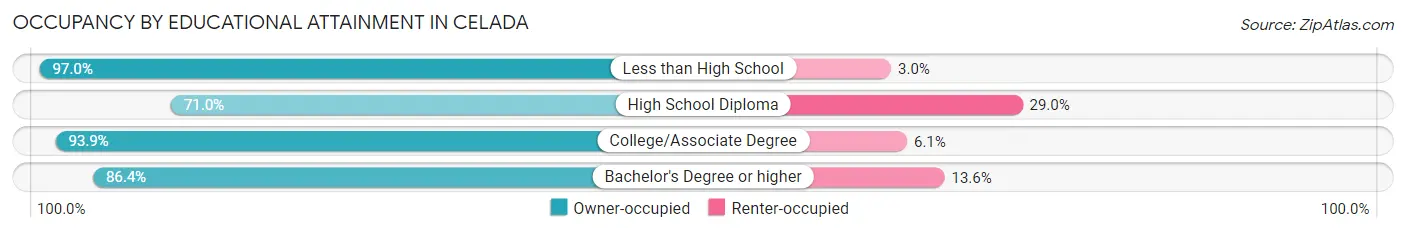
| Household Size | Owner-occupied | Renter-occupied |
| Less than High School | 262 (97.0%) | 8 (3.0%) |
| High School Diploma | 181 (71.0%) | 74 (29.0%) |
| College/Associate Degree | 307 (93.9%) | 20 (6.1%) |
| Bachelor's Degree or higher | 255 (86.4%) | 40 (13.6%) |
Occupancy by Age of Householder in Celada
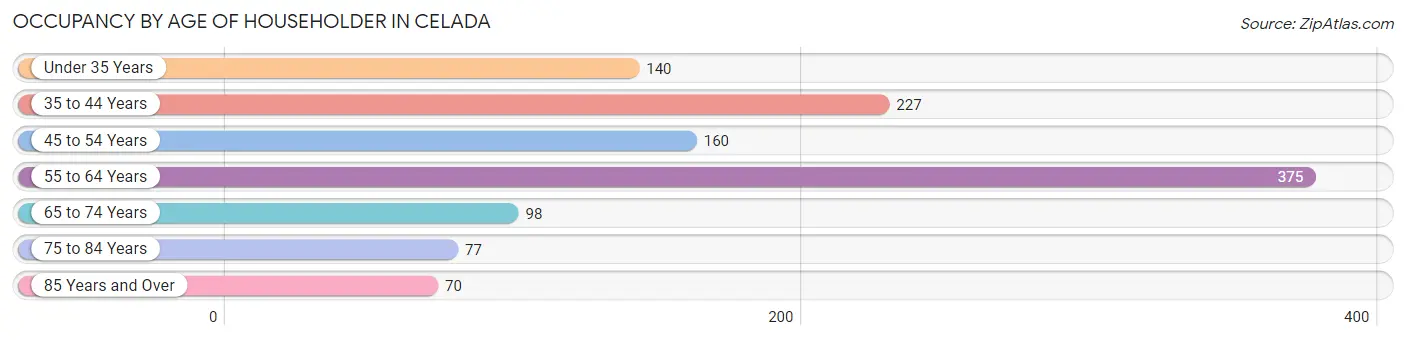
| Age Bracket | # Households | % Households |
| Under 35 Years | 140 | 12.2% |
| 35 to 44 Years | 227 | 19.8% |
| 45 to 54 Years | 160 | 14.0% |
| 55 to 64 Years | 375 | 32.7% |
| 65 to 74 Years | 98 | 8.5% |
| 75 to 84 Years | 77 | 6.7% |
| 85 Years and Over | 70 | 6.1% |
| Total | 1,147 | 100.0% |
Housing Finances in Celada
Median Income by Occupancy in Celada
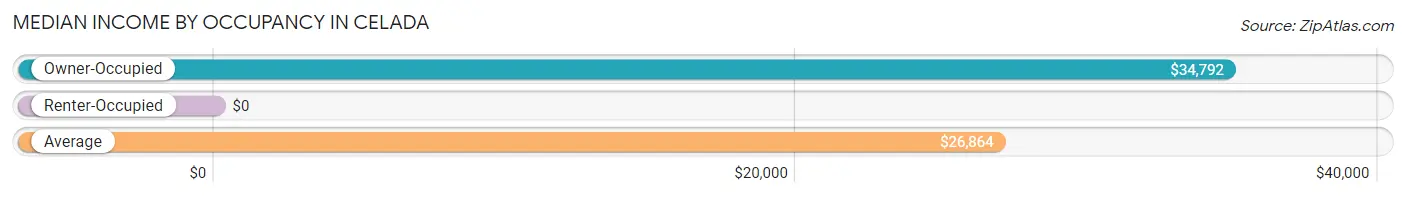
| Occupancy Type | # Households | Median Income |
| Owner-Occupied | 1,005 (87.6%) | $34,792 |
| Renter-Occupied | 142 (12.4%) | $0 |
| Average | 1,147 (100.0%) | $26,864 |
Occupancy by Householder Income Bracket in Celada
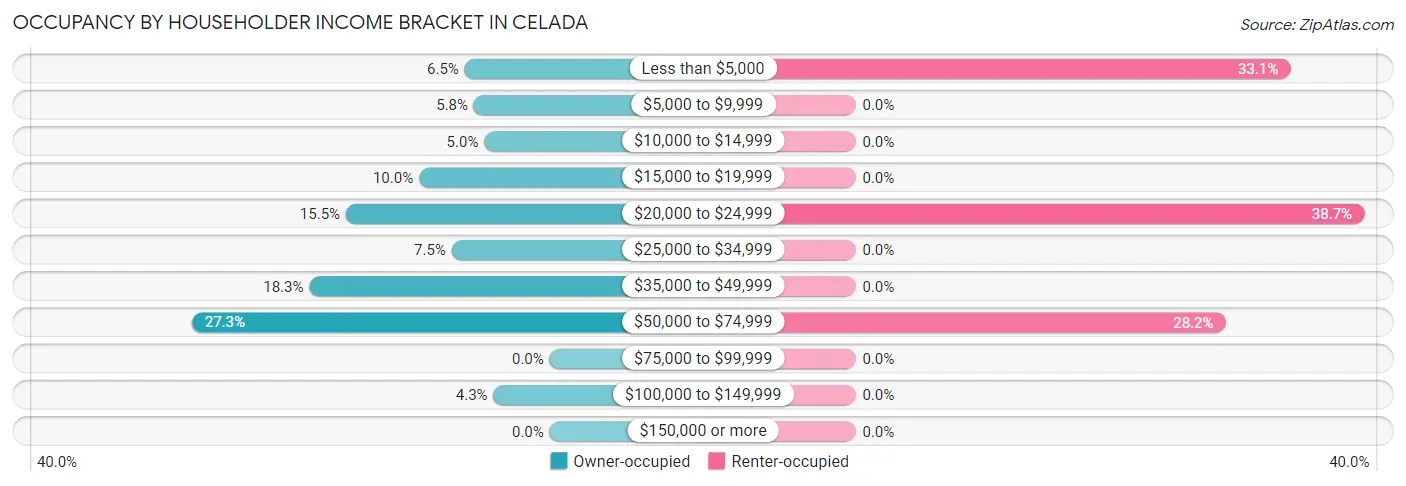
| Income Bracket | Owner-occupied | Renter-occupied |
| Less than $5,000 | 65 (6.5%) | 47 (33.1%) |
| $5,000 to $9,999 | 58 (5.8%) | 0 (0.0%) |
| $10,000 to $14,999 | 50 (5.0%) | 0 (0.0%) |
| $15,000 to $19,999 | 100 (10.0%) | 0 (0.0%) |
| $20,000 to $24,999 | 156 (15.5%) | 55 (38.7%) |
| $25,000 to $34,999 | 75 (7.5%) | 0 (0.0%) |
| $35,000 to $49,999 | 184 (18.3%) | 0 (0.0%) |
| $50,000 to $74,999 | 274 (27.3%) | 40 (28.2%) |
| $75,000 to $99,999 | 0 (0.0%) | 0 (0.0%) |
| $100,000 to $149,999 | 43 (4.3%) | 0 (0.0%) |
| $150,000 or more | 0 (0.0%) | 0 (0.0%) |
| Total | 1,005 (100.0%) | 142 (100.0%) |
Monthly Housing Cost Tiers in Celada
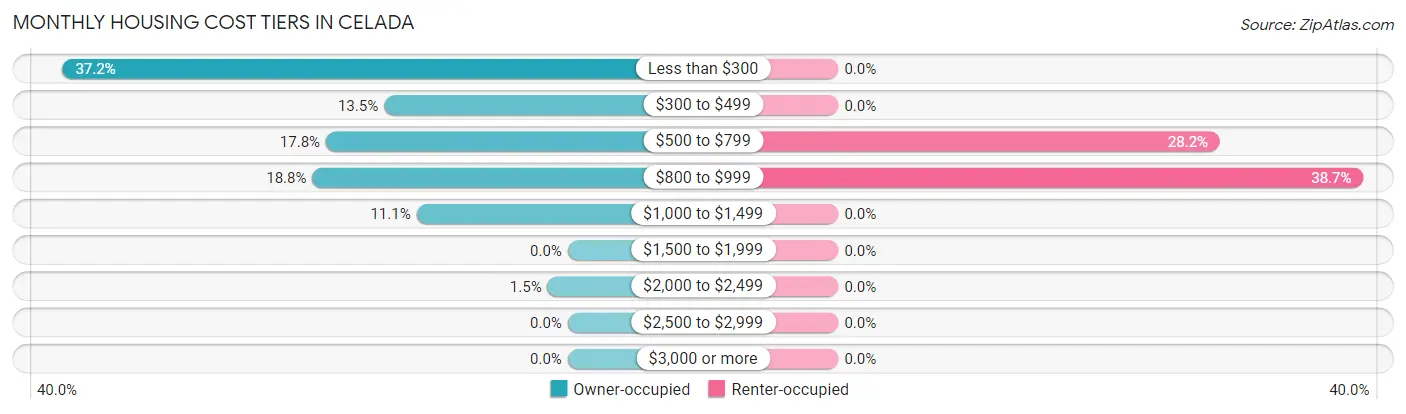
| Monthly Cost | Owner-occupied | Renter-occupied |
| Less than $300 | 374 (37.2%) | 0 (0.0%) |
| $300 to $499 | 136 (13.5%) | 0 (0.0%) |
| $500 to $799 | 179 (17.8%) | 40 (28.2%) |
| $800 to $999 | 189 (18.8%) | 55 (38.7%) |
| $1,000 to $1,499 | 112 (11.1%) | 0 (0.0%) |
| $1,500 to $1,999 | 0 (0.0%) | 0 (0.0%) |
| $2,000 to $2,499 | 15 (1.5%) | 0 (0.0%) |
| $2,500 to $2,999 | 0 (0.0%) | 0 (0.0%) |
| $3,000 or more | 0 (0.0%) | 0 (0.0%) |
| Total | 1,005 (100.0%) | 142 (100.0%) |
Physical Housing Characteristics in Celada
Housing Structures in Celada
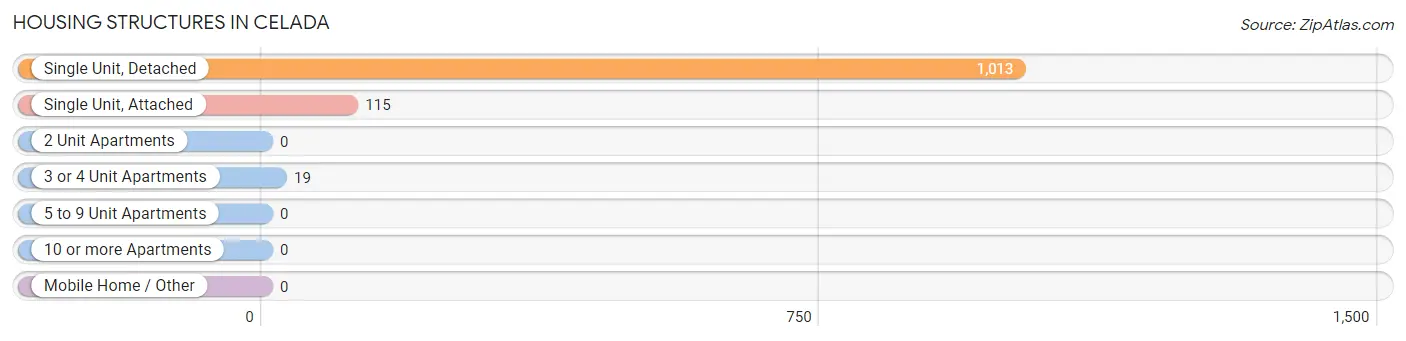
| Structure Type | # Housing Units | % Housing Units |
| Single Unit, Detached | 1,013 | 88.3% |
| Single Unit, Attached | 115 | 10.0% |
| 2 Unit Apartments | 0 | 0.0% |
| 3 or 4 Unit Apartments | 19 | 1.7% |
| 5 to 9 Unit Apartments | 0 | 0.0% |
| 10 or more Apartments | 0 | 0.0% |
| Mobile Home / Other | 0 | 0.0% |
| Total | 1,147 | 100.0% |
Housing Structures by Occupancy in Celada
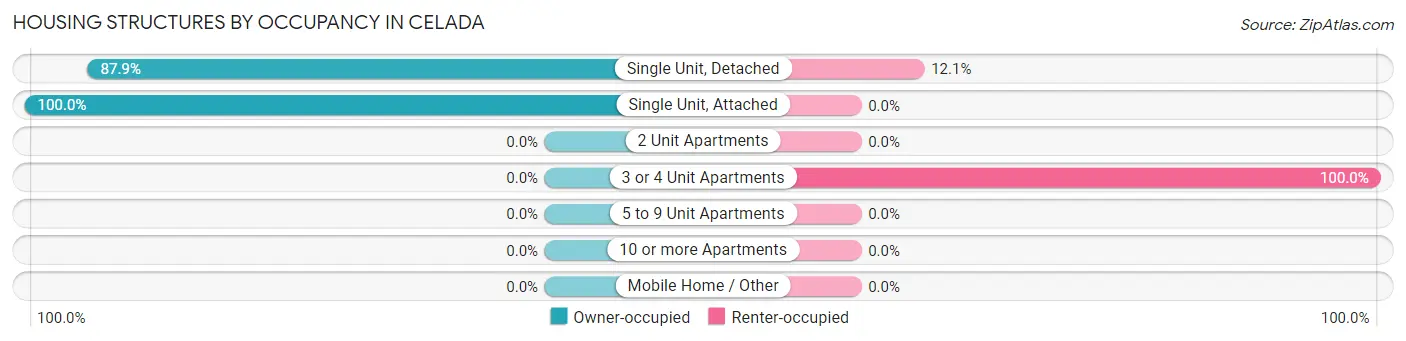
| Structure Type | Owner-occupied | Renter-occupied |
| Single Unit, Detached | 890 (87.9%) | 123 (12.1%) |
| Single Unit, Attached | 115 (100.0%) | 0 (0.0%) |
| 2 Unit Apartments | 0 (0.0%) | 0 (0.0%) |
| 3 or 4 Unit Apartments | 0 (0.0%) | 19 (100.0%) |
| 5 to 9 Unit Apartments | 0 (0.0%) | 0 (0.0%) |
| 10 or more Apartments | 0 (0.0%) | 0 (0.0%) |
| Mobile Home / Other | 0 (0.0%) | 0 (0.0%) |
| Total | 1,005 (87.6%) | 142 (12.4%) |
Housing Structures by Number of Rooms in Celada
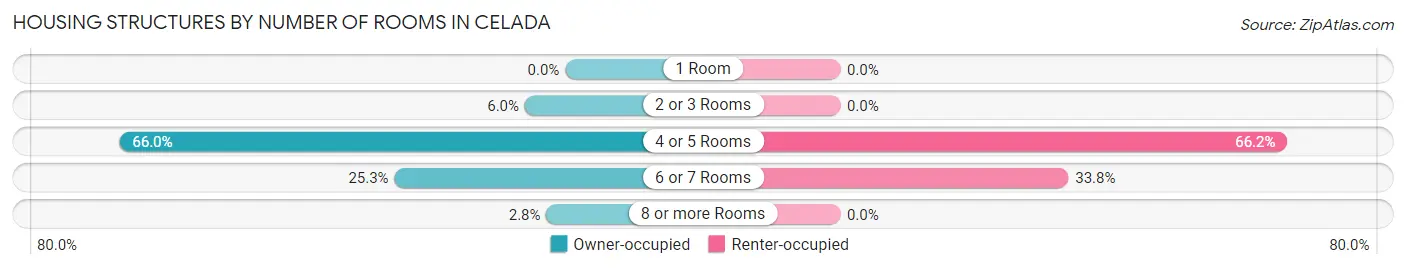
| Number of Rooms | Owner-occupied | Renter-occupied |
| 1 Room | 0 (0.0%) | 0 (0.0%) |
| 2 or 3 Rooms | 60 (6.0%) | 0 (0.0%) |
| 4 or 5 Rooms | 663 (66.0%) | 94 (66.2%) |
| 6 or 7 Rooms | 254 (25.3%) | 48 (33.8%) |
| 8 or more Rooms | 28 (2.8%) | 0 (0.0%) |
| Total | 1,005 (100.0%) | 142 (100.0%) |
Housing Structure by Heating Type in Celada
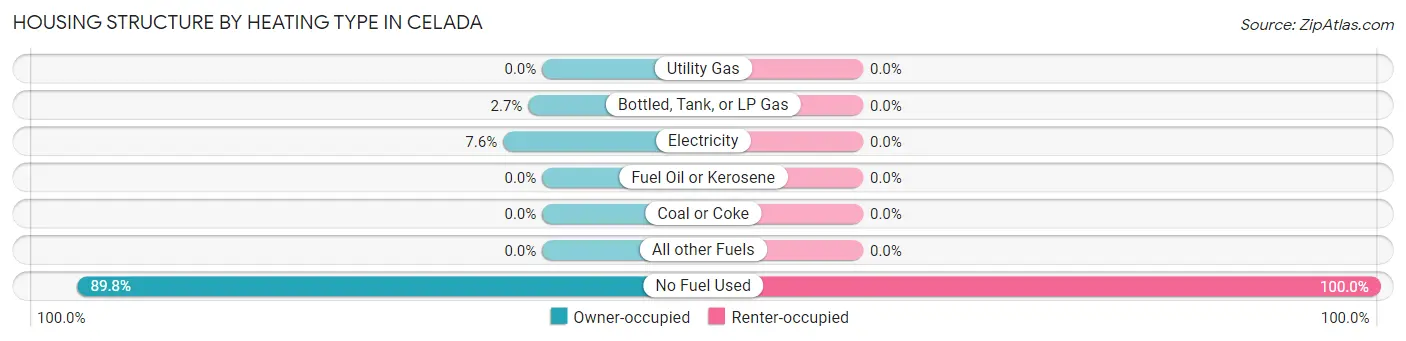
| Heating Type | Owner-occupied | Renter-occupied |
| Utility Gas | 0 (0.0%) | 0 (0.0%) |
| Bottled, Tank, or LP Gas | 27 (2.7%) | 0 (0.0%) |
| Electricity | 76 (7.6%) | 0 (0.0%) |
| Fuel Oil or Kerosene | 0 (0.0%) | 0 (0.0%) |
| Coal or Coke | 0 (0.0%) | 0 (0.0%) |
| All other Fuels | 0 (0.0%) | 0 (0.0%) |
| No Fuel Used | 902 (89.7%) | 142 (100.0%) |
| Total | 1,005 (100.0%) | 142 (100.0%) |
Household Vehicle Usage in Celada
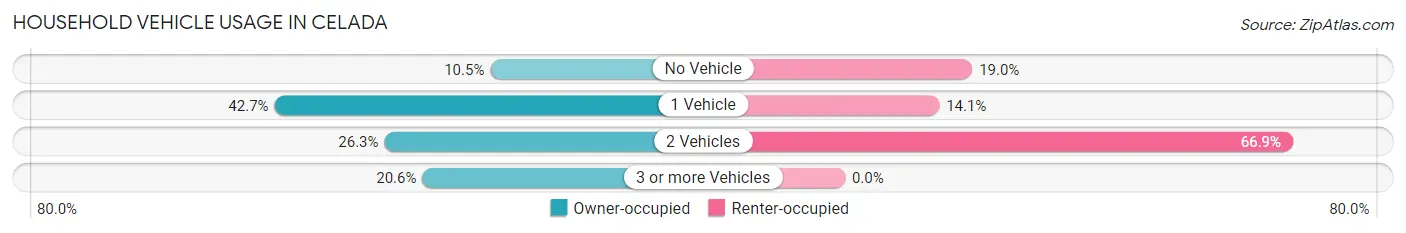
| Vehicles per Household | Owner-occupied | Renter-occupied |
| No Vehicle | 105 (10.4%) | 27 (19.0%) |
| 1 Vehicle | 429 (42.7%) | 20 (14.1%) |
| 2 Vehicles | 264 (26.3%) | 95 (66.9%) |
| 3 or more Vehicles | 207 (20.6%) | 0 (0.0%) |
| Total | 1,005 (100.0%) | 142 (100.0%) |
Real Estate & Mortgages in Celada
Real Estate and Mortgage Overview in Celada
| Characteristic | Without Mortgage | With Mortgage |
| Housing Units | 481 | 524 |
| Median Property Value | $116,600 | $143,700 |
| Median Household Income | $24,766 | $0 |
| Monthly Housing Costs | $193 | $0 |
| Real Estate Taxes | - | - |
Property Value by Mortgage Status in Celada
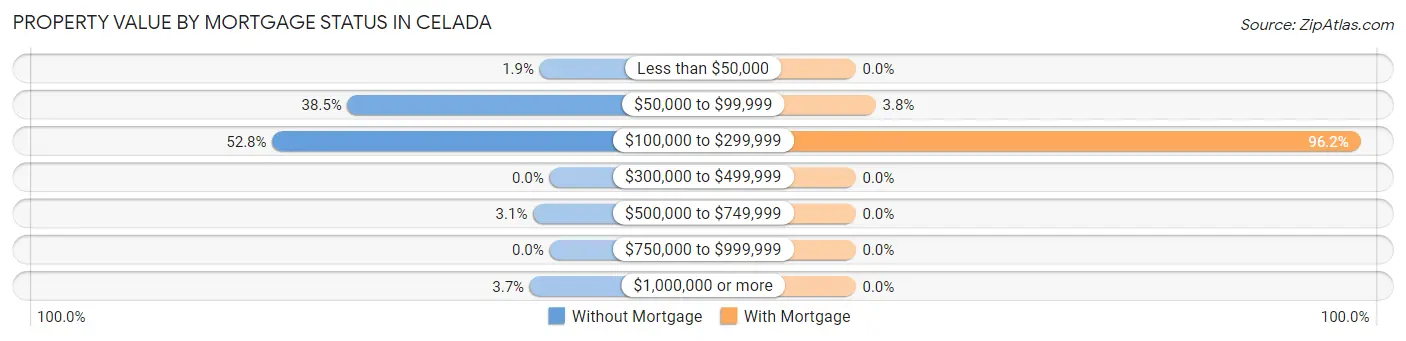
| Property Value | Without Mortgage | With Mortgage |
| Less than $50,000 | 9 (1.9%) | 0 (0.0%) |
| $50,000 to $99,999 | 185 (38.5%) | 20 (3.8%) |
| $100,000 to $299,999 | 254 (52.8%) | 504 (96.2%) |
| $300,000 to $499,999 | 0 (0.0%) | 0 (0.0%) |
| $500,000 to $749,999 | 15 (3.1%) | 0 (0.0%) |
| $750,000 to $999,999 | 0 (0.0%) | 0 (0.0%) |
| $1,000,000 or more | 18 (3.7%) | 0 (0.0%) |
| Total | 481 (100.0%) | 524 (100.0%) |
Household Income by Mortgage Status in Celada
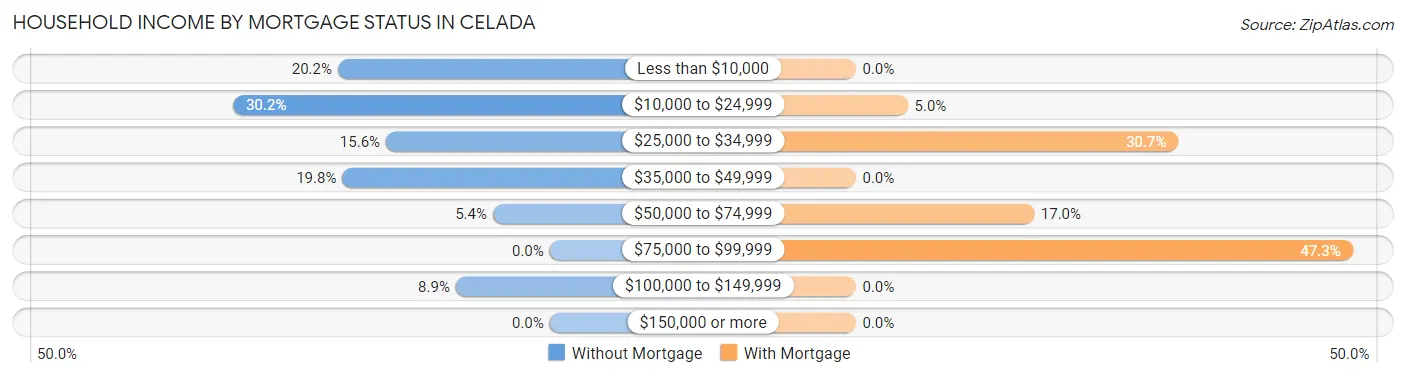
| Household Income | Without Mortgage | With Mortgage |
| Less than $10,000 | 97 (20.2%) | 0 (0.0%) |
| $10,000 to $24,999 | 145 (30.1%) | 26 (5.0%) |
| $25,000 to $34,999 | 75 (15.6%) | 161 (30.7%) |
| $35,000 to $49,999 | 95 (19.8%) | 0 (0.0%) |
| $50,000 to $74,999 | 26 (5.4%) | 89 (17.0%) |
| $75,000 to $99,999 | 0 (0.0%) | 248 (47.3%) |
| $100,000 to $149,999 | 43 (8.9%) | 0 (0.0%) |
| $150,000 or more | 0 (0.0%) | 0 (0.0%) |
| Total | 481 (100.0%) | 524 (100.0%) |
Property Value to Household Income Ratio in Celada
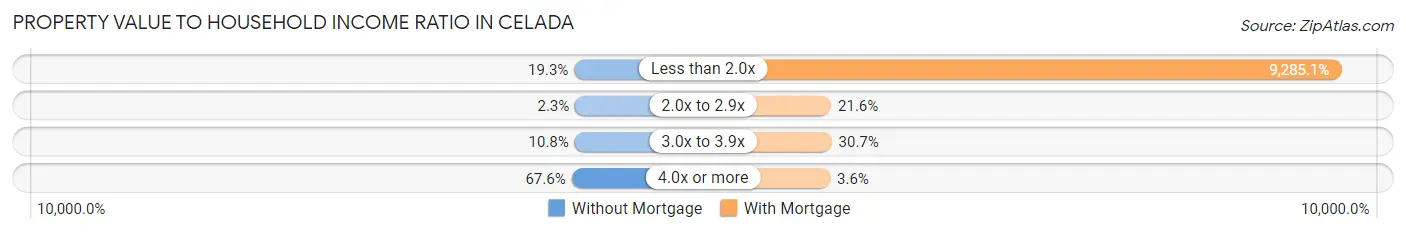
| Value-to-Income Ratio | Without Mortgage | With Mortgage |
| Less than 2.0x | 93 (19.3%) | 48,654 (9,285.1%) |
| 2.0x to 2.9x | 11 (2.3%) | 113 (21.6%) |
| 3.0x to 3.9x | 52 (10.8%) | 161 (30.7%) |
| 4.0x or more | 325 (67.6%) | 19 (3.6%) |
| Total | 481 (100.0%) | 524 (100.0%) |
Real Estate Taxes by Mortgage Status in Celada
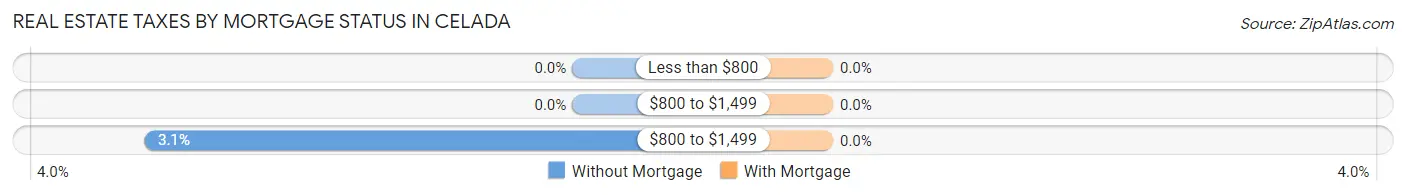
| Property Taxes | Without Mortgage | With Mortgage |
| Less than $800 | 0 (0.0%) | 0 (0.0%) |
| $800 to $1,499 | 0 (0.0%) | 0 (0.0%) |
| $800 to $1,499 | 15 (3.1%) | 0 (0.0%) |
| Total | 481 (100.0%) | 524 (100.0%) |
Health & Disability in Celada
Health Insurance Coverage by Age in Celada
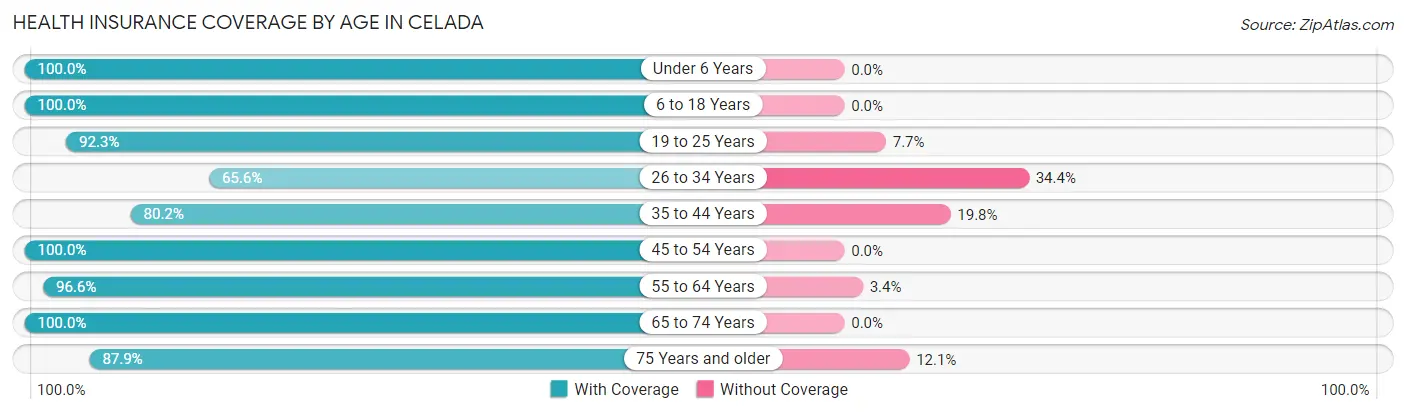
| Age Bracket | With Coverage | Without Coverage |
| Under 6 Years | 103 (100.0%) | 0 (0.0%) |
| 6 to 18 Years | 355 (100.0%) | 0 (0.0%) |
| 19 to 25 Years | 489 (92.3%) | 41 (7.7%) |
| 26 to 34 Years | 269 (65.6%) | 141 (34.4%) |
| 35 to 44 Years | 446 (80.2%) | 110 (19.8%) |
| 45 to 54 Years | 363 (100.0%) | 0 (0.0%) |
| 55 to 64 Years | 589 (96.6%) | 21 (3.4%) |
| 65 to 74 Years | 136 (100.0%) | 0 (0.0%) |
| 75 Years and older | 218 (87.9%) | 30 (12.1%) |
| Total | 2,968 (89.6%) | 343 (10.4%) |
Health Insurance Coverage by Citizenship Status in Celada
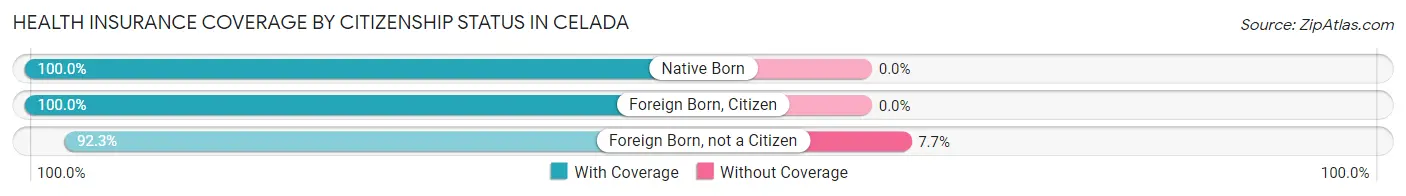
| Citizenship Status | With Coverage | Without Coverage |
| Native Born | 103 (100.0%) | 0 (0.0%) |
| Foreign Born, Citizen | 355 (100.0%) | 0 (0.0%) |
| Foreign Born, not a Citizen | 489 (92.3%) | 41 (7.7%) |
Health Insurance Coverage by Household Income in Celada
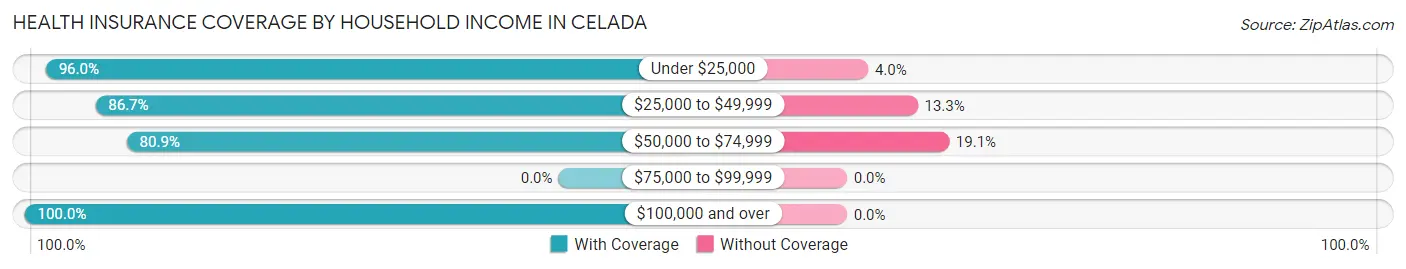
| Household Income | With Coverage | Without Coverage |
| Under $25,000 | 1,233 (96.0%) | 51 (4.0%) |
| $25,000 to $49,999 | 674 (86.7%) | 103 (13.3%) |
| $50,000 to $74,999 | 799 (80.9%) | 189 (19.1%) |
| $75,000 to $99,999 | 0 (0.0%) | 0 (0.0%) |
| $100,000 and over | 251 (100.0%) | 0 (0.0%) |
Public vs Private Health Insurance Coverage by Age in Celada
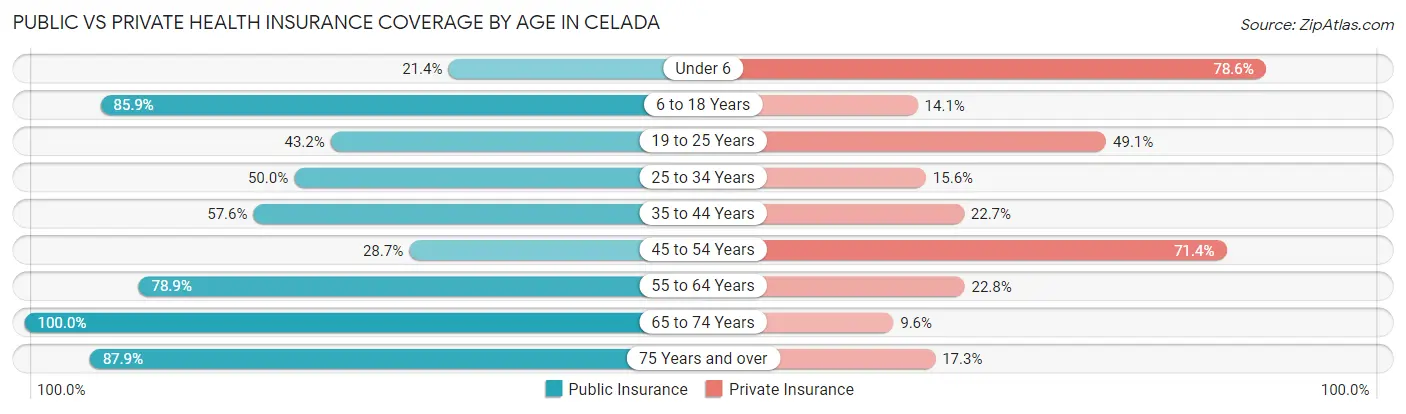
| Age Bracket | Public Insurance | Private Insurance |
| Under 6 | 22 (21.4%) | 81 (78.6%) |
| 6 to 18 Years | 305 (85.9%) | 50 (14.1%) |
| 19 to 25 Years | 229 (43.2%) | 260 (49.1%) |
| 25 to 34 Years | 205 (50.0%) | 64 (15.6%) |
| 35 to 44 Years | 320 (57.6%) | 126 (22.7%) |
| 45 to 54 Years | 104 (28.6%) | 259 (71.4%) |
| 55 to 64 Years | 481 (78.8%) | 139 (22.8%) |
| 65 to 74 Years | 136 (100.0%) | 13 (9.6%) |
| 75 Years and over | 218 (87.9%) | 43 (17.3%) |
| Total | 2,020 (61.0%) | 1,035 (31.3%) |
Disability Status by Sex by Age in Celada
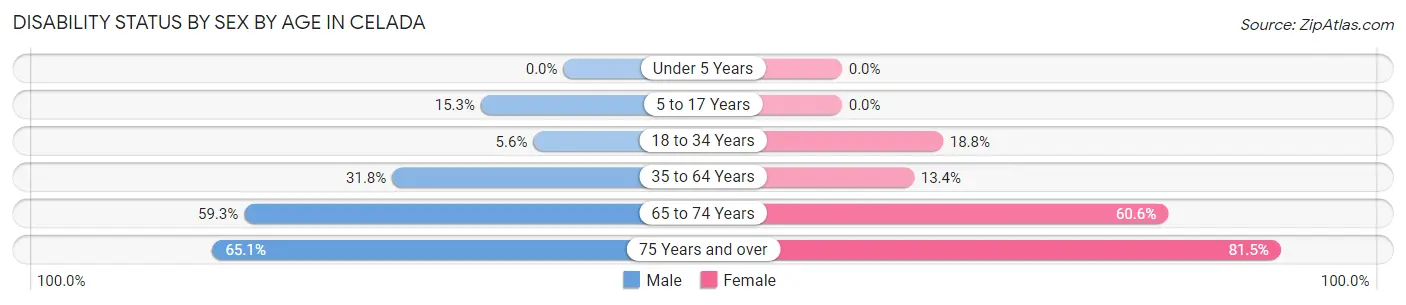
| Age Bracket | Male | Female |
| Under 5 Years | 0 (0.0%) | 0 (0.0%) |
| 5 to 17 Years | 21 (15.3%) | 0 (0.0%) |
| 18 to 34 Years | 32 (5.6%) | 69 (18.8%) |
| 35 to 64 Years | 198 (31.8%) | 121 (13.4%) |
| 65 to 74 Years | 16 (59.3%) | 66 (60.6%) |
| 75 Years and over | 28 (65.1%) | 167 (81.5%) |
Disability Class by Sex by Age in Celada
Disability Class: Hearing Difficulty
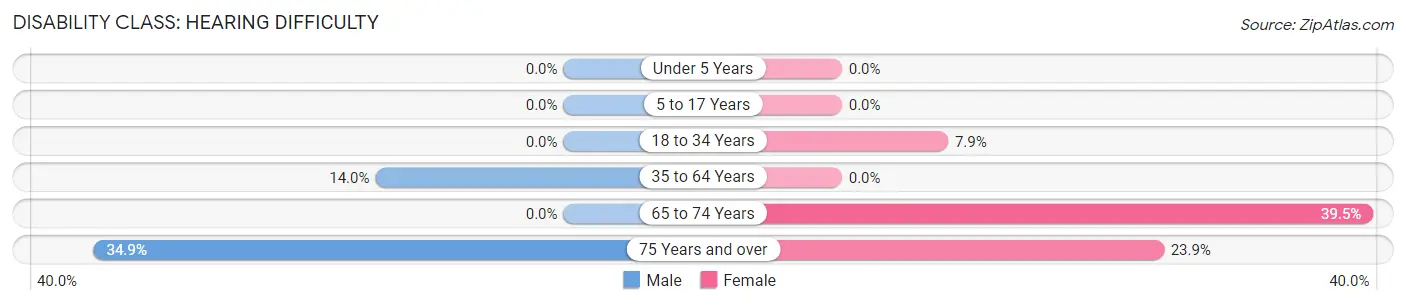
| Age Bracket | Male | Female |
| Under 5 Years | 0 (0.0%) | 0 (0.0%) |
| 5 to 17 Years | 0 (0.0%) | 0 (0.0%) |
| 18 to 34 Years | 0 (0.0%) | 29 (7.9%) |
| 35 to 64 Years | 87 (14.0%) | 0 (0.0%) |
| 65 to 74 Years | 0 (0.0%) | 43 (39.5%) |
| 75 Years and over | 15 (34.9%) | 49 (23.9%) |
Disability Class: Vision Difficulty
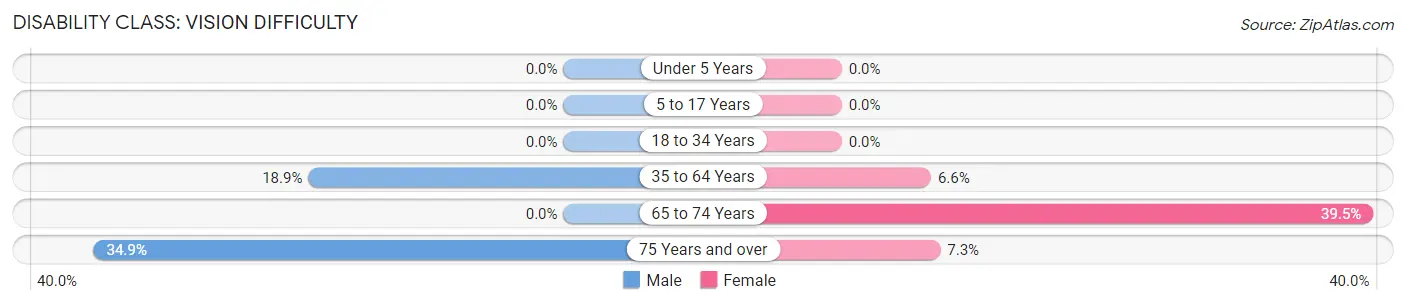
| Age Bracket | Male | Female |
| Under 5 Years | 0 (0.0%) | 0 (0.0%) |
| 5 to 17 Years | 0 (0.0%) | 0 (0.0%) |
| 18 to 34 Years | 0 (0.0%) | 0 (0.0%) |
| 35 to 64 Years | 118 (18.9%) | 60 (6.6%) |
| 65 to 74 Years | 0 (0.0%) | 43 (39.5%) |
| 75 Years and over | 15 (34.9%) | 15 (7.3%) |
Disability Class: Cognitive Difficulty
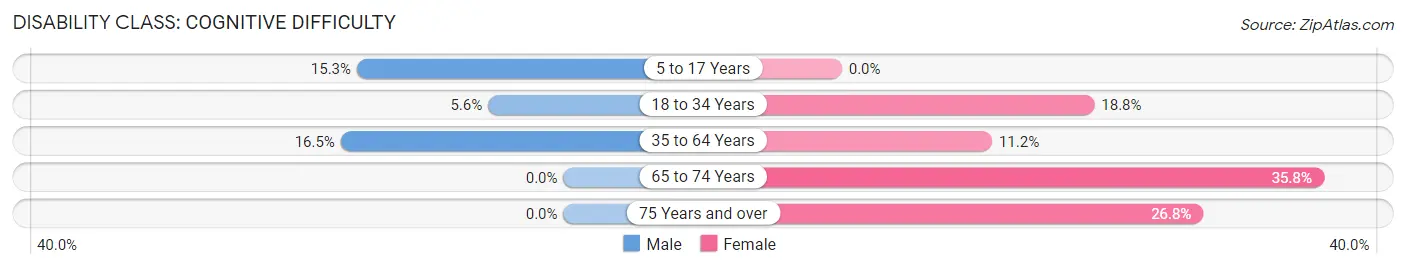
| Age Bracket | Male | Female |
| 5 to 17 Years | 21 (15.3%) | 0 (0.0%) |
| 18 to 34 Years | 32 (5.6%) | 69 (18.8%) |
| 35 to 64 Years | 103 (16.5%) | 101 (11.2%) |
| 65 to 74 Years | 0 (0.0%) | 39 (35.8%) |
| 75 Years and over | 0 (0.0%) | 55 (26.8%) |
Disability Class: Ambulatory Difficulty
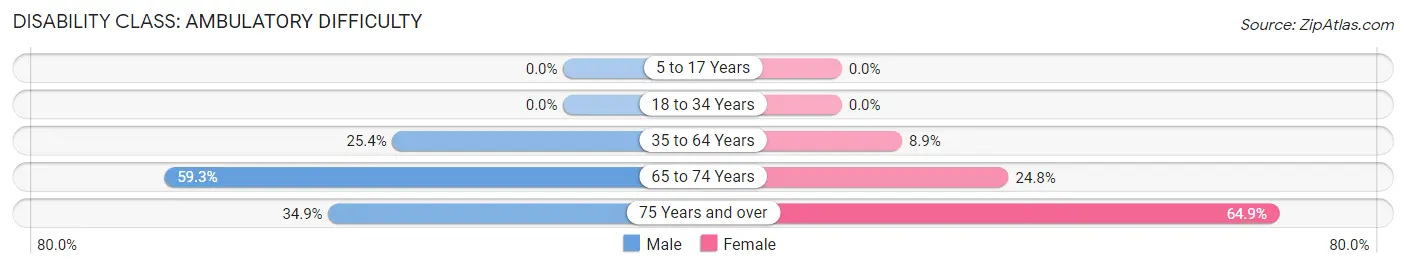
| Age Bracket | Male | Female |
| 5 to 17 Years | 0 (0.0%) | 0 (0.0%) |
| 18 to 34 Years | 0 (0.0%) | 0 (0.0%) |
| 35 to 64 Years | 158 (25.4%) | 81 (8.9%) |
| 65 to 74 Years | 16 (59.3%) | 27 (24.8%) |
| 75 Years and over | 15 (34.9%) | 133 (64.9%) |
Disability Class: Self-Care Difficulty
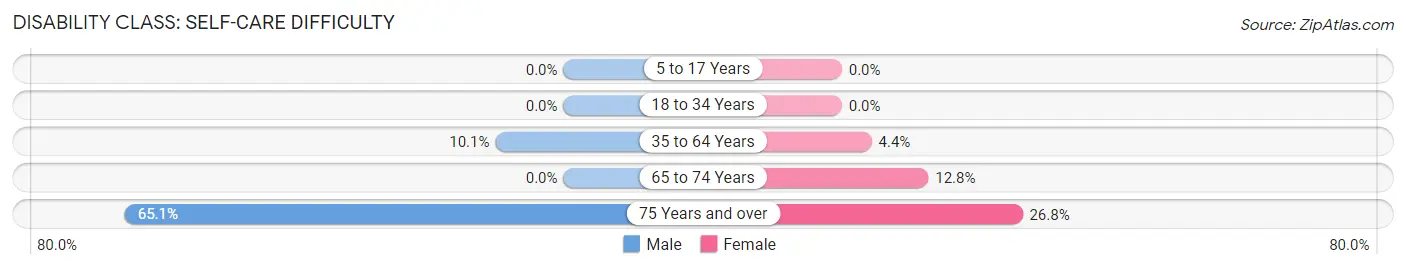
| Age Bracket | Male | Female |
| 5 to 17 Years | 0 (0.0%) | 0 (0.0%) |
| 18 to 34 Years | 0 (0.0%) | 0 (0.0%) |
| 35 to 64 Years | 63 (10.1%) | 40 (4.4%) |
| 65 to 74 Years | 0 (0.0%) | 14 (12.8%) |
| 75 Years and over | 28 (65.1%) | 55 (26.8%) |
Technology Access in Celada
Computing Device Access in Celada
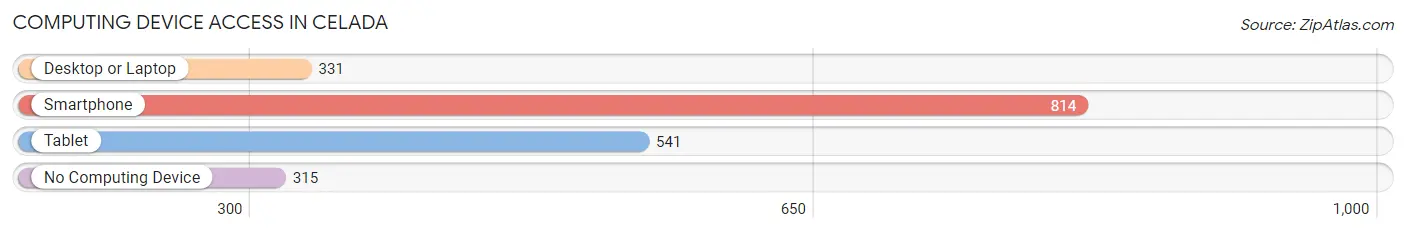
| Device Type | # Households | % Households |
| Desktop or Laptop | 331 | 28.9% |
| Smartphone | 814 | 71.0% |
| Tablet | 541 | 47.2% |
| No Computing Device | 315 | 27.5% |
| Total | 1,147 | 100.0% |
Internet Access in Celada
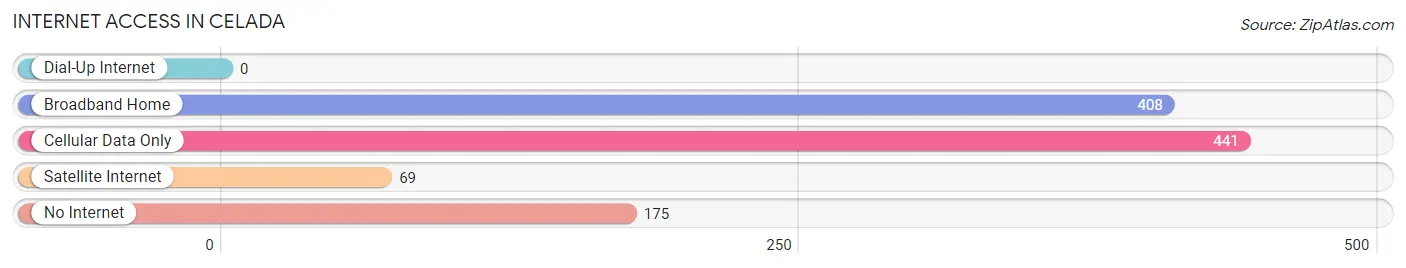
| Internet Type | # Households | % Households |
| Dial-Up Internet | 0 | 0.0% |
| Broadband Home | 408 | 35.6% |
| Cellular Data Only | 441 | 38.5% |
| Satellite Internet | 69 | 6.0% |
| No Internet | 175 | 15.3% |
| Total | 1,147 | 100.0% |
Celada Summary
Celada is a small town located in the province of Palencia, in the autonomous community of Castile and León, in northern Spain. It is situated in the foothills of the Cantabrian Mountains, about 30 kilometers from the provincial capital of Palencia. The town has a population of around 1,500 people and is known for its traditional architecture and rural lifestyle.
Geography
Celada is located in the foothills of the Cantabrian Mountains, in the region of Palencia. The town is situated at an altitude of 890 meters above sea level and is surrounded by lush green hills and valleys. The climate in Celada is temperate, with mild winters and hot summers. The average annual temperature is around 13°C.
The town is located on the banks of the River Ebro, which flows through the region. The river is a major source of water for the town and its surrounding areas. The town is also home to several small lakes, which provide a habitat for a variety of wildlife.
Economy
The economy of Celada is mainly based on agriculture and livestock farming. The town is known for its production of cheese, which is made from the milk of the local cows. Other agricultural products include wheat, barley, oats, potatoes, and vegetables. Livestock farming is also an important part of the local economy, with sheep, pigs, and cows being the main animals raised.
The town also has a small industrial sector, with several small factories producing furniture, textiles, and other goods. Tourism is also an important part of the local economy, with visitors coming to the town to enjoy its traditional architecture and rural lifestyle.
Demographics
As of 2020, the population of Celada was estimated to be around 1,500 people. The majority of the population is of Spanish descent, with a small minority of immigrants from other countries. The town has a high rate of unemployment, with around 20% of the population being unemployed.
The town is predominantly Roman Catholic, with around 95% of the population identifying as such. The town also has a small Muslim population, with around 5% of the population identifying as Muslim.
Education
Celada has one primary school, which serves the town and its surrounding areas. The school offers classes from kindergarten to sixth grade. There is also a secondary school in the town, which offers classes from seventh to twelfth grade.
Conclusion
Celada is a small town located in the province of Palencia, in the autonomous community of Castile and León, in northern Spain. It is situated in the foothills of the Cantabrian Mountains, about 30 kilometers from the provincial capital of Palencia. The town has a population of around 1,500 people and is known for its traditional architecture and rural lifestyle. The economy of Celada is mainly based on agriculture and livestock farming, with tourism also playing an important role in the local economy. The majority of the population is of Spanish descent, with a small minority of immigrants from other countries. The town has one primary school and one secondary school, which serve the town and its surrounding areas.
Common Questions
What is Per Capita Income in Celada?
Per Capita income in Celada is $13,608.
What is the Median Family Income in Celada?
Median Family Income in Celada is $41,098.
What is the Median Household income in Celada?
Median Household Income in Celada is $26,864.
What is Income or Wage Gap in Celada?
Income or Wage Gap in Celada is 24.9%.
Women in Celada earn 75.1 cents for every dollar earned by a man.
What is Inequality or Gini Index in Celada?
Inequality or Gini Index in Celada is 0.40.
What is the Total Population of Celada?
Total Population of Celada is 3,311.
What is the Total Male Population of Celada?
Total Male Population of Celada is 1,461.
What is the Total Female Population of Celada?
Total Female Population of Celada is 1,850.
What is the Ratio of Males per 100 Females in Celada?
There are 78.97 Males per 100 Females in Celada.
What is the Ratio of Females per 100 Males in Celada?
There are 126.63 Females per 100 Males in Celada.
What is the Median Population Age in Celada?
Median Population Age in Celada is 38.2 Years.
What is the Average Family Size in Celada
Average Family Size in Celada is 3.6 People.
What is the Average Household Size in Celada
Average Household Size in Celada is 2.9 People.
How Large is the Labor Force in Celada?
There are 1,719 People in the Labor Forcein in Celada.
What is the Percentage of People in the Labor Force in Celada?
59.2% of People are in the Labor Force in Celada.
What is the Unemployment Rate in Celada?
Unemployment Rate in Celada is 28.5%.