Villalba Municipio, PR Map & Demographics
Villalba Municipio Map
Villalba Municipio Overview
$12,133
PER CAPITA INCOME
$26,868
AVG FAMILY INCOME
$22,461
AVG HOUSEHOLD INCOME
11.7%
WAGE / INCOME GAP [ % ]
88.3¢/ $1
WAGE / INCOME GAP [ $ ]
$12,675
FAMILY INCOME DEFICIT
0.50
INEQUALITY / GINI INDEX
21,984
TOTAL POPULATION
10,634
MALE POPULATION
11,350
FEMALE POPULATION
93.69
MALES / 100 FEMALES
106.73
FEMALES / 100 MALES
43.0
MEDIAN AGE
3.2
AVG FAMILY SIZE
2.8
AVG HOUSEHOLD SIZE
7,801
LABOR FORCE [ PEOPLE ]
42.8%
PERCENT IN LABOR FORCE
13.9%
UNEMPLOYMENT RATE
Income in Villalba Municipio
Income Overview in Villalba Municipio
Per Capita Income in Villalba Municipio is $12,133, while median incomes of families and households are $26,868 and $22,461 respectively.
| Characteristic | Number | Measure |
| Per Capita Income | 21,984 | $12,133 |
| Median Family Income | 5,861 | $26,868 |
| Mean Family Income | 5,861 | $36,715 |
| Median Household Income | 7,761 | $22,461 |
| Mean Household Income | 7,761 | $33,109 |
| Income Deficit | 5,861 | $12,675 |
| Wage / Income Gap (%) | 21,984 | 11.69% |
| Wage / Income Gap ($) | 21,984 | 88.31¢ per $1 |
| Gini / Inequality Index | 21,984 | 0.50 |
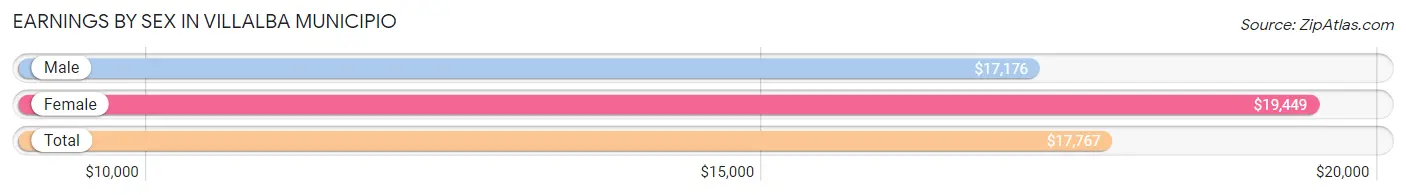
Earnings by Sex in Villalba Municipio
Average Earnings in Villalba Municipio are $17,767, $17,176 for men and $19,449 for women, a difference of 11.7%.
| Sex | Number | Average Earnings |
| Male | 4,149 (56.0%) | $17,176 |
| Female | 3,262 (44.0%) | $19,449 |
| Total | 7,411 (100.0%) | $17,767 |
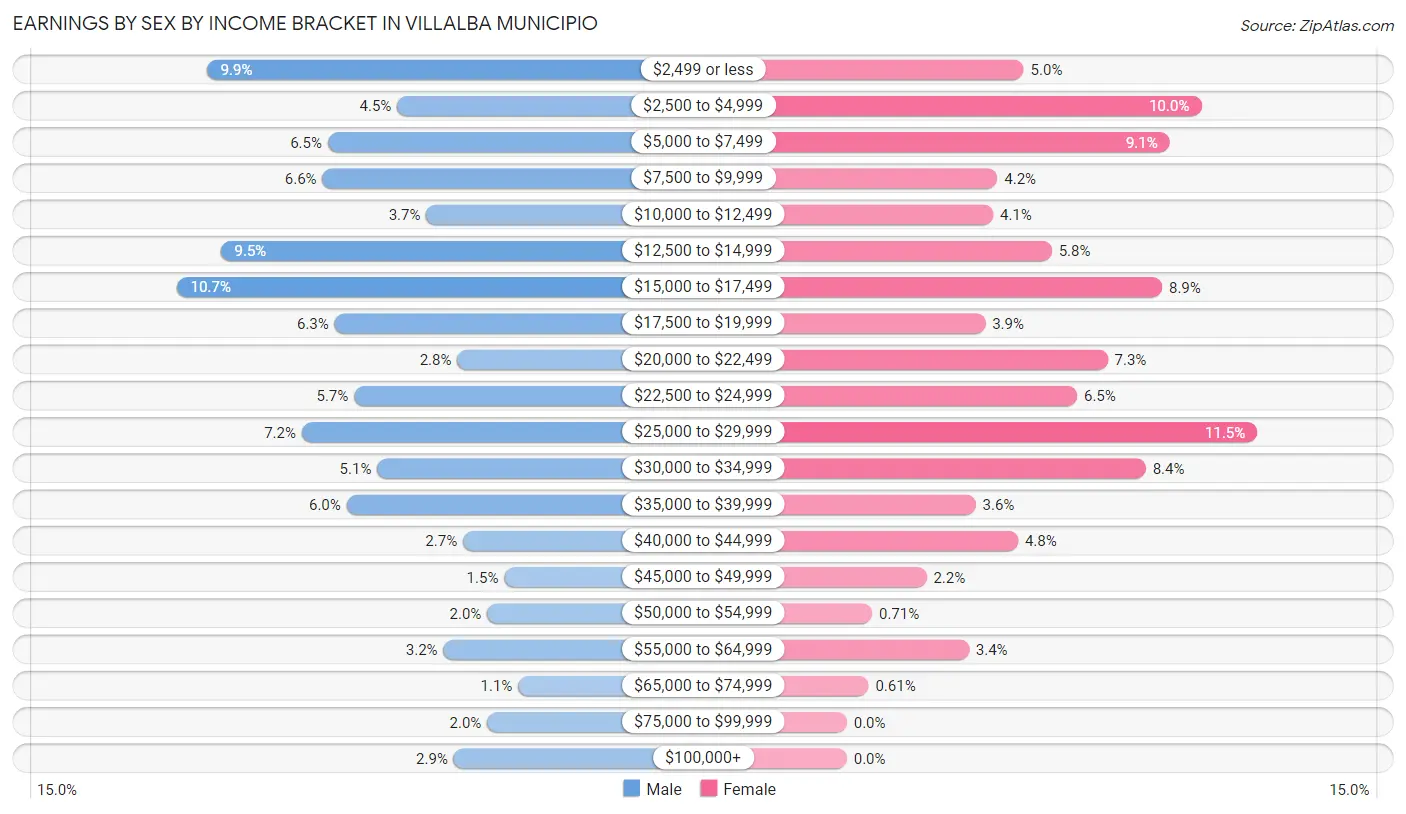
Earnings by Sex by Income Bracket in Villalba Municipio
The most common earnings brackets in Villalba Municipio are $15,000 to $17,499 for men (444 | 10.7%) and $25,000 to $29,999 for women (376 | 11.5%).
| Income | Male | Female |
| $2,499 or less | 409 (9.9%) | 162 (5.0%) |
| $2,500 to $4,999 | 188 (4.5%) | 325 (10.0%) |
| $5,000 to $7,499 | 269 (6.5%) | 296 (9.1%) |
| $7,500 to $9,999 | 275 (6.6%) | 138 (4.2%) |
| $10,000 to $12,499 | 154 (3.7%) | 134 (4.1%) |
| $12,500 to $14,999 | 393 (9.5%) | 188 (5.8%) |
| $15,000 to $17,499 | 444 (10.7%) | 289 (8.9%) |
| $17,500 to $19,999 | 261 (6.3%) | 127 (3.9%) |
| $20,000 to $22,499 | 118 (2.8%) | 239 (7.3%) |
| $22,500 to $24,999 | 238 (5.7%) | 211 (6.5%) |
| $25,000 to $29,999 | 299 (7.2%) | 376 (11.5%) |
| $30,000 to $34,999 | 211 (5.1%) | 274 (8.4%) |
| $35,000 to $39,999 | 247 (5.9%) | 118 (3.6%) |
| $40,000 to $44,999 | 111 (2.7%) | 157 (4.8%) |
| $45,000 to $49,999 | 63 (1.5%) | 73 (2.2%) |
| $50,000 to $54,999 | 83 (2.0%) | 23 (0.7%) |
| $55,000 to $64,999 | 134 (3.2%) | 112 (3.4%) |
| $65,000 to $74,999 | 47 (1.1%) | 20 (0.6%) |
| $75,000 to $99,999 | 83 (2.0%) | 0 (0.0%) |
| $100,000+ | 122 (2.9%) | 0 (0.0%) |
| Total | 4,149 (100.0%) | 3,262 (100.0%) |
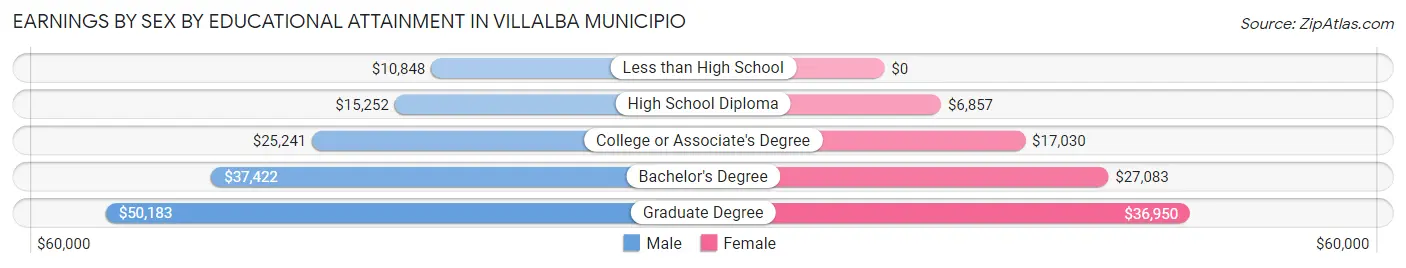
Earnings by Sex by Educational Attainment in Villalba Municipio
Average earnings in Villalba Municipio are $17,971 for men and $20,893 for women, a difference of 14.0%. Men with an educational attainment of graduate degree enjoy the highest average annual earnings of $50,183, while those with less than high school education earn the least with $10,848. Women with an educational attainment of graduate degree earn the most with the average annual earnings of $36,950, while those with high school diploma education have the smallest earnings of $6,857.
| Educational Attainment | Male Income | Female Income |
| Less than High School | $10,848 | $0 |
| High School Diploma | $15,252 | $6,857 |
| College or Associate's Degree | $25,241 | $17,030 |
| Bachelor's Degree | $37,422 | $27,083 |
| Graduate Degree | $50,183 | $36,950 |
| Total | $17,971 | $20,893 |
Family Income in Villalba Municipio
Family Income Brackets in Villalba Municipio
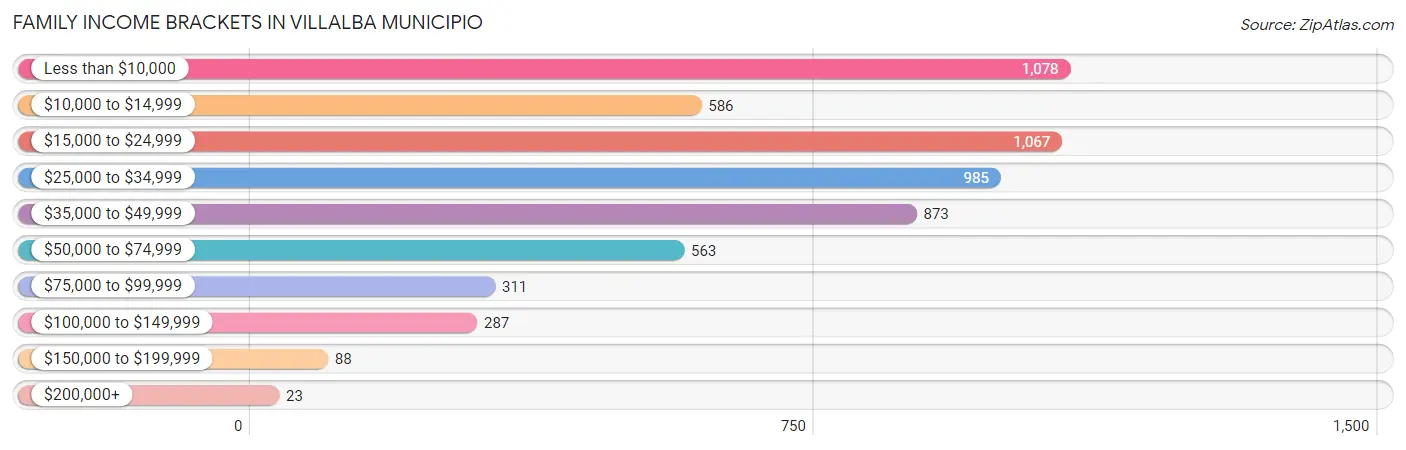
According to the Villalba Municipio family income data, there are 1,078 families falling into the less than $10,000 income range, which is the most common income bracket and makes up 18.4% of all families. Conversely, the $200,000+ income bracket is the least frequent group with only 23 families (0.4%) belonging to this category.
| Income Bracket | # Families | % Families |
| Less than $10,000 | 1,078 | 18.4% |
| $10,000 to $14,999 | 586 | 10.0% |
| $15,000 to $24,999 | 1,067 | 18.2% |
| $25,000 to $34,999 | 985 | 16.8% |
| $35,000 to $49,999 | 873 | 14.9% |
| $50,000 to $74,999 | 563 | 9.6% |
| $75,000 to $99,999 | 311 | 5.3% |
| $100,000 to $149,999 | 287 | 4.9% |
| $150,000 to $199,999 | 88 | 1.5% |
| $200,000+ | 23 | 0.4% |
Family Income by Famaliy Size in Villalba Municipio
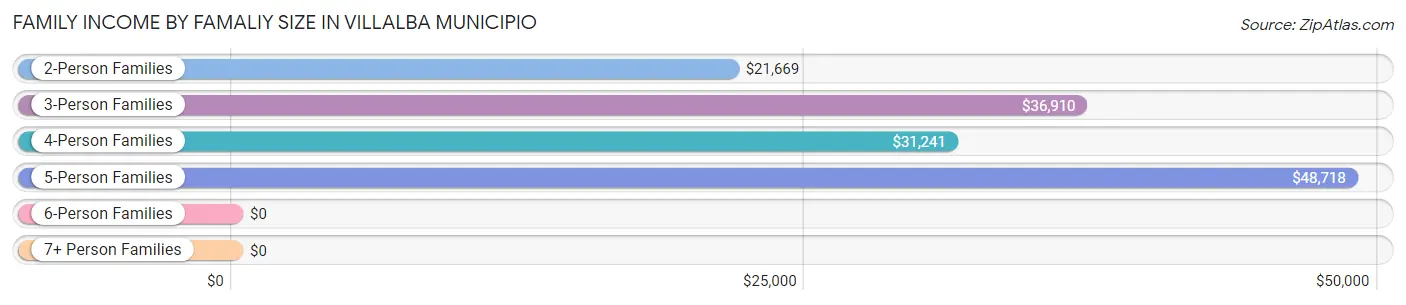
5-person families (528 | 9.0%) account for the highest median family income in Villalba Municipio with $48,718 per family, while 3-person families (1,447 | 24.7%) have the highest median income of $12,303 per family member.
| Income Bracket | # Families | Median Income |
| 2-Person Families | 2,641 (45.1%) | $21,669 |
| 3-Person Families | 1,447 (24.7%) | $36,910 |
| 4-Person Families | 1,085 (18.5%) | $31,241 |
| 5-Person Families | 528 (9.0%) | $48,718 |
| 6-Person Families | 143 (2.4%) | $0 |
| 7+ Person Families | 17 (0.3%) | $0 |
| Total | 5,861 (100.0%) | $26,868 |
Family Income by Number of Earners in Villalba Municipio
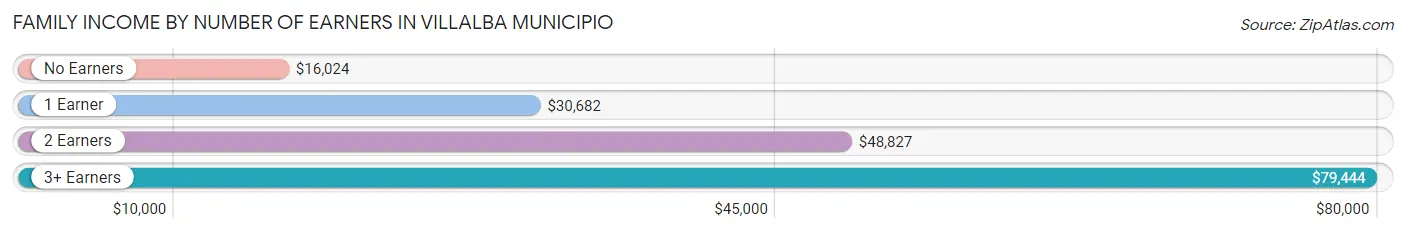
The median family income in Villalba Municipio is $26,868, with families comprising 3+ earners (184) having the highest median family income of $79,444, while families with no earners (2,183) have the lowest median family income of $16,024, accounting for 3.1% and 37.2% of families, respectively.
| Number of Earners | # Families | Median Income |
| No Earners | 2,183 (37.2%) | $16,024 |
| 1 Earner | 2,118 (36.1%) | $30,682 |
| 2 Earners | 1,376 (23.5%) | $48,827 |
| 3+ Earners | 184 (3.1%) | $79,444 |
| Total | 5,861 (100.0%) | $26,868 |
Household Income in Villalba Municipio
Household Income Brackets in Villalba Municipio
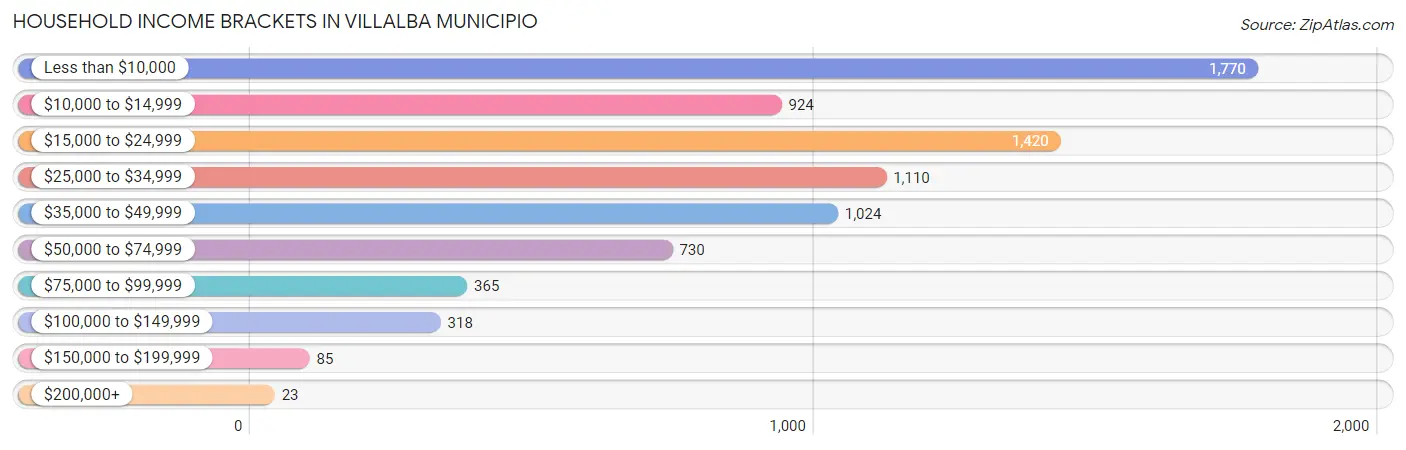
With 1,770 households falling in the category, the less than $10,000 income range is the most frequent in Villalba Municipio, accounting for 22.8% of all households. In contrast, only 23 households (0.3%) fall into the $200,000+ income bracket, making it the least populous group.
| Income Bracket | # Households | % Households |
| Less than $10,000 | 1,770 | 22.8% |
| $10,000 to $14,999 | 924 | 11.9% |
| $15,000 to $24,999 | 1,420 | 18.3% |
| $25,000 to $34,999 | 1,110 | 14.3% |
| $35,000 to $49,999 | 1,024 | 13.2% |
| $50,000 to $74,999 | 730 | 9.4% |
| $75,000 to $99,999 | 365 | 4.7% |
| $100,000 to $149,999 | 318 | 4.1% |
| $150,000 to $199,999 | 85 | 1.1% |
| $200,000+ | 23 | 0.3% |
Household Income by Householder Age in Villalba Municipio
The median household income in Villalba Municipio is $22,461, with the highest median household income of $33,125 found in the 25 to 44 years age bracket for the primary householder. A total of 1,578 households (20.3%) fall into this category. Meanwhile, the 65+ years age bracket for the primary householder has the lowest median household income of $21,224, with 2,689 households (34.6%) in this group.
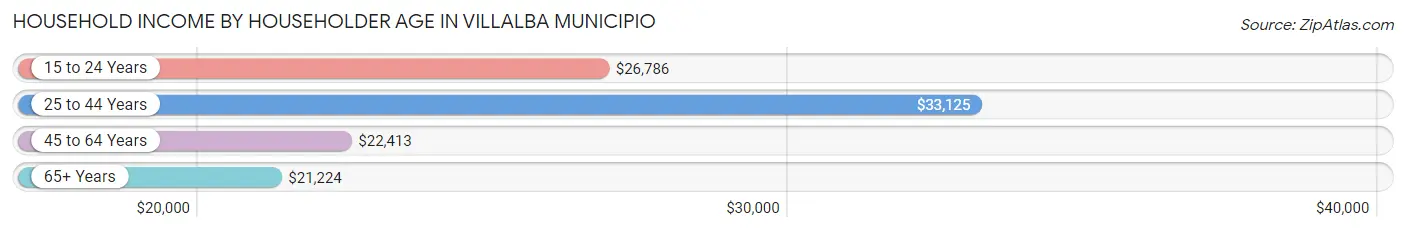
| Income Bracket | # Households | Median Income |
| 15 to 24 Years | 114 (1.5%) | $26,786 |
| 25 to 44 Years | 1,578 (20.3%) | $33,125 |
| 45 to 64 Years | 3,380 (43.5%) | $22,413 |
| 65+ Years | 2,689 (34.6%) | $21,224 |
| Total | 7,761 (100.0%) | $22,461 |
Poverty in Villalba Municipio
Income Below Poverty by Sex and Age in Villalba Municipio
With 40.5% poverty level for males and 44.8% for females among the residents of Villalba Municipio, under 5 year old males and 5 year old females are the most vulnerable to poverty, with 310 males (66.8%) and 59 females (100.0%) in their respective age groups living below the poverty level.
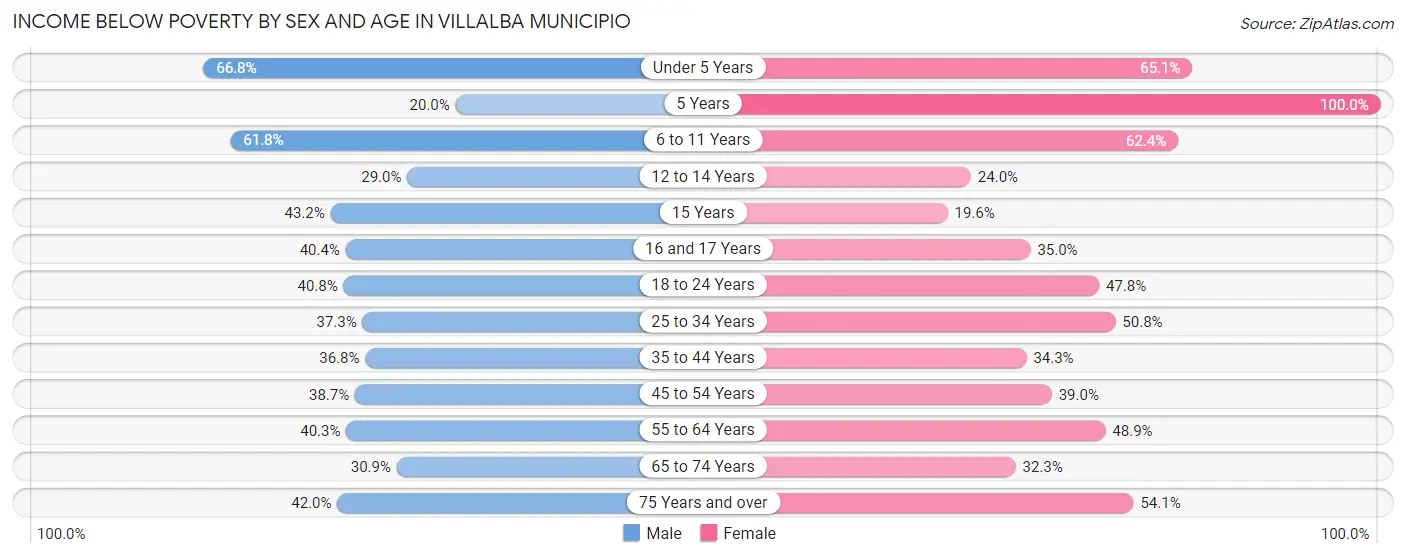
| Age Bracket | Male | Female |
| Under 5 Years | 310 (66.8%) | 296 (65.0%) |
| 5 Years | 17 (20.0%) | 59 (100.0%) |
| 6 to 11 Years | 466 (61.8%) | 483 (62.4%) |
| 12 to 14 Years | 117 (29.0%) | 92 (24.0%) |
| 15 Years | 70 (43.2%) | 33 (19.6%) |
| 16 and 17 Years | 101 (40.4%) | 83 (35.0%) |
| 18 to 24 Years | 459 (40.8%) | 499 (47.7%) |
| 25 to 34 Years | 489 (37.3%) | 711 (50.8%) |
| 35 to 44 Years | 418 (36.8%) | 437 (34.3%) |
| 45 to 54 Years | 531 (38.7%) | 567 (39.0%) |
| 55 to 64 Years | 614 (40.3%) | 843 (48.9%) |
| 65 to 74 Years | 384 (30.9%) | 448 (32.3%) |
| 75 Years and over | 292 (41.9%) | 523 (54.1%) |
| Total | 4,268 (40.5%) | 5,074 (44.8%) |
Income Above Poverty by Sex and Age in Villalba Municipio
According to the poverty statistics in Villalba Municipio, males aged 5 years and females aged 15 years are the age groups that are most secure financially, with 80.0% of males and 80.4% of females in these age groups living above the poverty line.
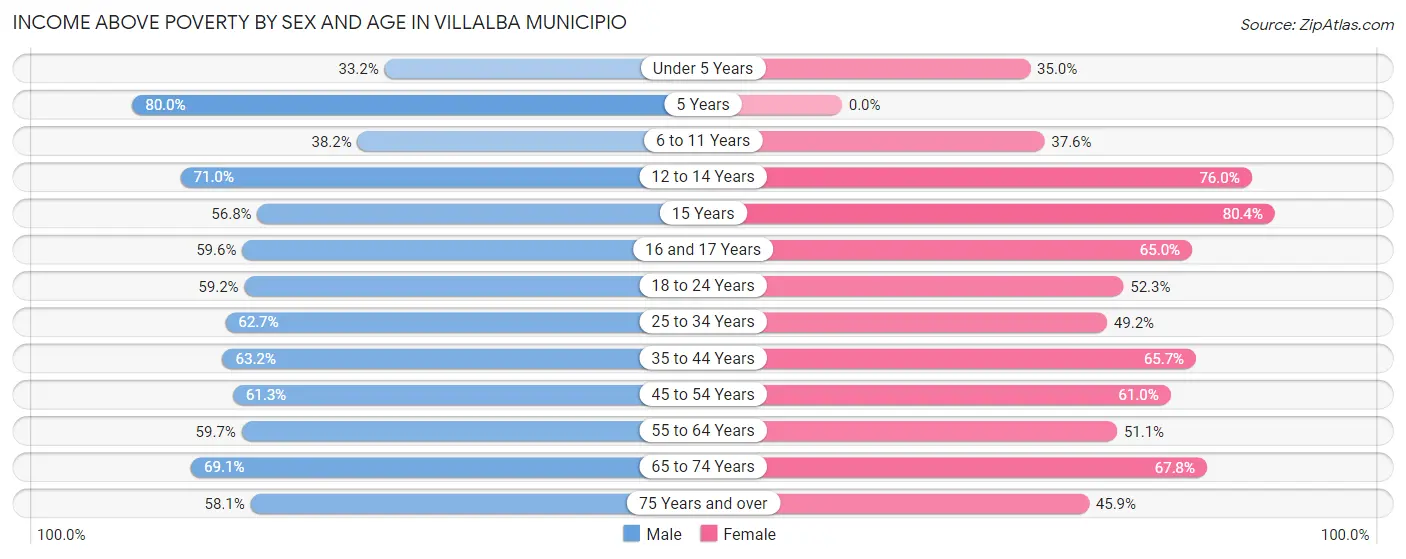
| Age Bracket | Male | Female |
| Under 5 Years | 154 (33.2%) | 159 (34.9%) |
| 5 Years | 68 (80.0%) | 0 (0.0%) |
| 6 to 11 Years | 288 (38.2%) | 291 (37.6%) |
| 12 to 14 Years | 287 (71.0%) | 292 (76.0%) |
| 15 Years | 92 (56.8%) | 135 (80.4%) |
| 16 and 17 Years | 149 (59.6%) | 154 (65.0%) |
| 18 to 24 Years | 666 (59.2%) | 546 (52.2%) |
| 25 to 34 Years | 823 (62.7%) | 689 (49.2%) |
| 35 to 44 Years | 719 (63.2%) | 838 (65.7%) |
| 45 to 54 Years | 842 (61.3%) | 888 (61.0%) |
| 55 to 64 Years | 910 (59.7%) | 880 (51.1%) |
| 65 to 74 Years | 858 (69.1%) | 941 (67.7%) |
| 75 Years and over | 404 (58.1%) | 443 (45.9%) |
| Total | 6,260 (59.5%) | 6,256 (55.2%) |
Income Below Poverty Among Married-Couple Families in Villalba Municipio
The poverty statistics for married-couple families in Villalba Municipio show that 27.1% or 855 of the total 3,161 families live below the poverty line. Families with 3 or 4 children have the highest poverty rate of 33.8%, comprising of 54 families. On the other hand, families with 5 or more children have the lowest poverty rate of 0.0%, which includes 0 families.
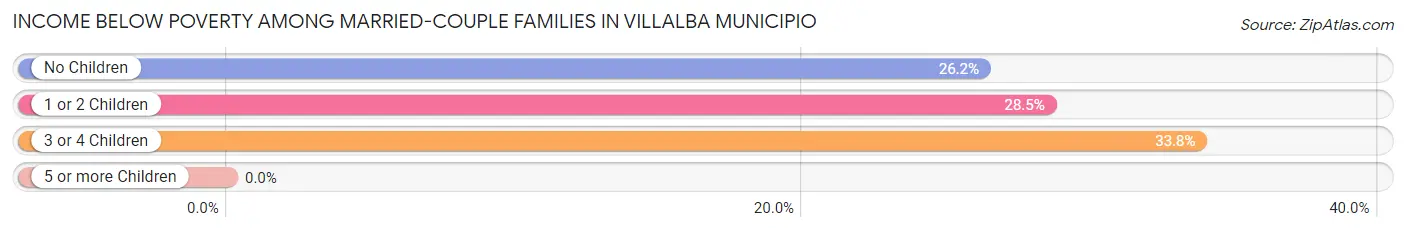
| Children | Above Poverty | Below Poverty |
| No Children | 1,596 (73.8%) | 567 (26.2%) |
| 1 or 2 Children | 587 (71.5%) | 234 (28.5%) |
| 3 or 4 Children | 106 (66.2%) | 54 (33.8%) |
| 5 or more Children | 17 (100.0%) | 0 (0.0%) |
| Total | 2,306 (73.0%) | 855 (27.1%) |
Income Below Poverty Among Single-Parent Households in Villalba Municipio
According to the poverty data in Villalba Municipio, 50.9% or 486 single-father households and 55.4% or 966 single-mother households are living below the poverty line. Among single-father households, those with 3 or 4 children have the highest poverty rate, with 15 households (100.0%) experiencing poverty. Likewise, among single-mother households, those with 3 or 4 children have the highest poverty rate, with 191 households (91.8%) falling below the poverty line.
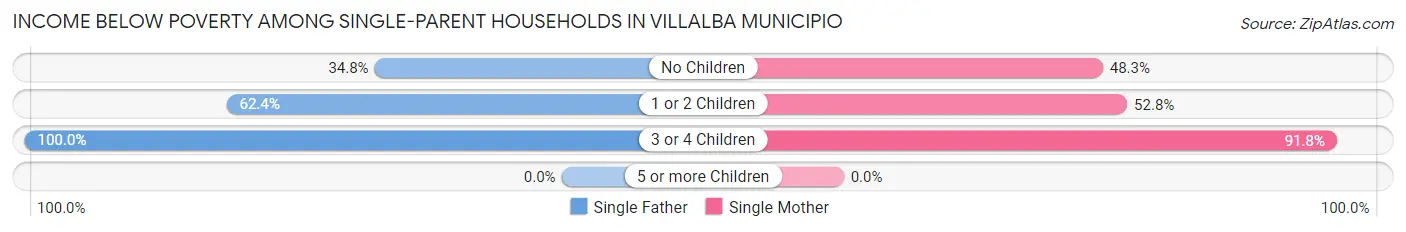
| Children | Single Father | Single Mother |
| No Children | 146 (34.8%) | 388 (48.3%) |
| 1 or 2 Children | 325 (62.4%) | 387 (52.8%) |
| 3 or 4 Children | 15 (100.0%) | 191 (91.8%) |
| 5 or more Children | 0 (0.0%) | 0 (0.0%) |
| Total | 486 (50.9%) | 966 (55.4%) |
Income Below Poverty Among Married-Couple vs Single-Parent Households in Villalba Municipio
The poverty data for Villalba Municipio shows that 855 of the married-couple family households (27.1%) and 1,452 of the single-parent households (53.8%) are living below the poverty level. Within the married-couple family households, those with 3 or 4 children have the highest poverty rate, with 54 households (33.8%) falling below the poverty line. Among the single-parent households, those with 3 or 4 children have the highest poverty rate, with 206 household (92.4%) living below poverty.
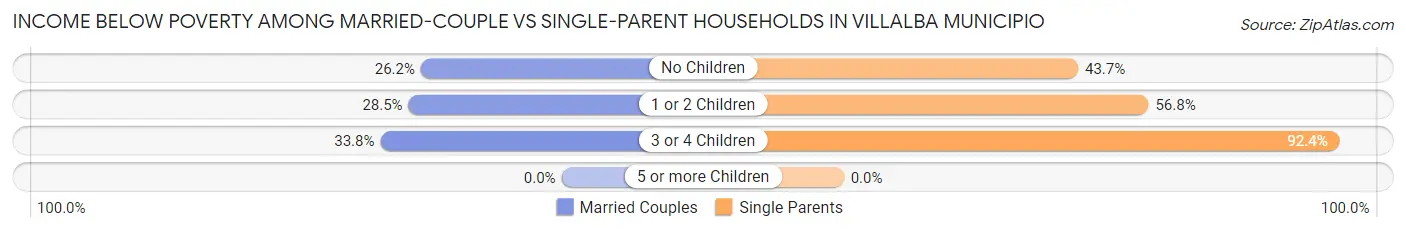
| Children | Married-Couple Families | Single-Parent Households |
| No Children | 567 (26.2%) | 534 (43.7%) |
| 1 or 2 Children | 234 (28.5%) | 712 (56.8%) |
| 3 or 4 Children | 54 (33.8%) | 206 (92.4%) |
| 5 or more Children | 0 (0.0%) | 0 (0.0%) |
| Total | 855 (27.1%) | 1,452 (53.8%) |
Race in Villalba Municipio
The most populous races in Villalba Municipio are Hispanic or Latino (21,905 | 99.6%), White / Caucasian (8,732 | 39.7%), and Two or more Races (8,479 | 38.6%).
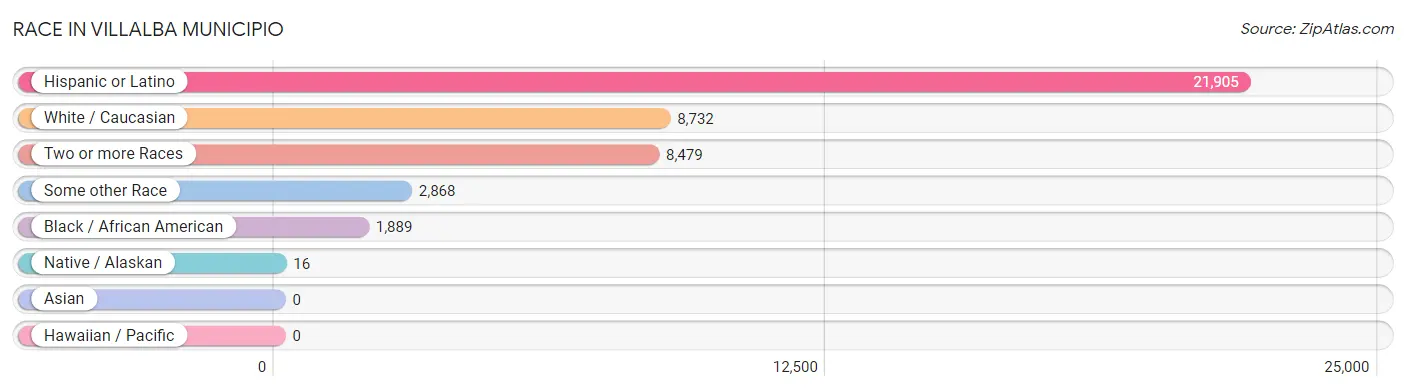
| Race | # Population | % Population |
| Asian | 0 | 0.0% |
| Black / African American | 1,889 | 8.6% |
| Hawaiian / Pacific | 0 | 0.0% |
| Hispanic or Latino | 21,905 | 99.6% |
| Native / Alaskan | 16 | 0.1% |
| White / Caucasian | 8,732 | 39.7% |
| Two or more Races | 8,479 | 38.6% |
| Some other Race | 2,868 | 13.1% |
| Total | 21,984 | 100.0% |
Ancestry in Villalba Municipio
The most populous ancestries reported in Villalba Municipio are Puerto Rican (21,797 | 99.2%), American (143 | 0.6%), Italian (53 | 0.2%), Mexican (31 | 0.1%), and Spaniard (22 | 0.1%), together accounting for 100.3% of all Villalba Municipio residents.
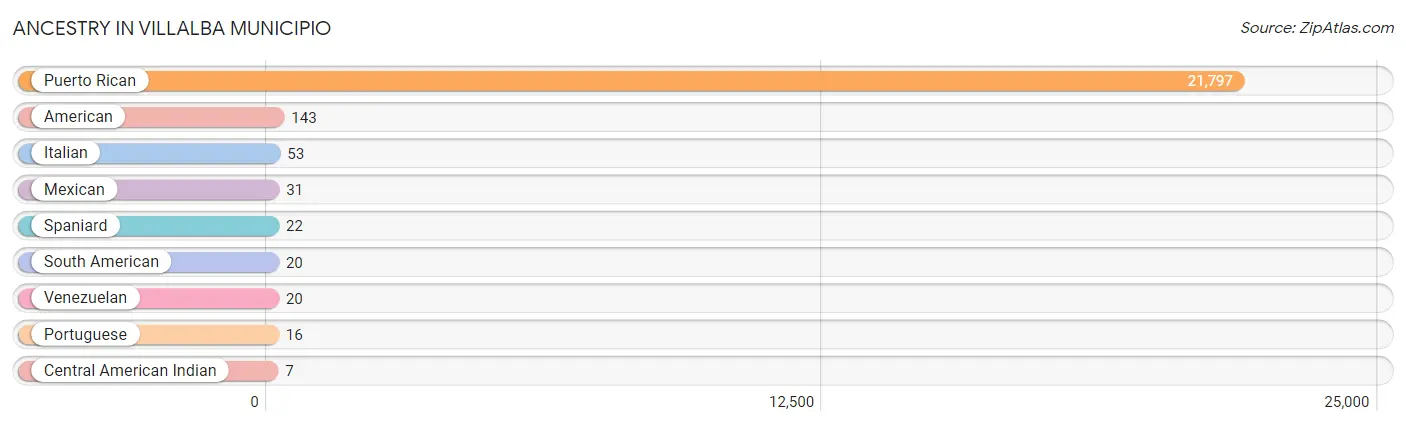
| Ancestry | # Population | % Population |
| American | 143 | 0.6% |
| Central American Indian | 7 | 0.0% |
| Italian | 53 | 0.2% |
| Mexican | 31 | 0.1% |
| Portuguese | 16 | 0.1% |
| Puerto Rican | 21,797 | 99.2% |
| South American | 20 | 0.1% |
| Spaniard | 22 | 0.1% |
| Venezuelan | 20 | 0.1% | View All 9 Rows |
Immigrants in Villalba Municipio

| Immigration Origin | # Population | % Population | View All 0 Rows |
Sex and Age in Villalba Municipio
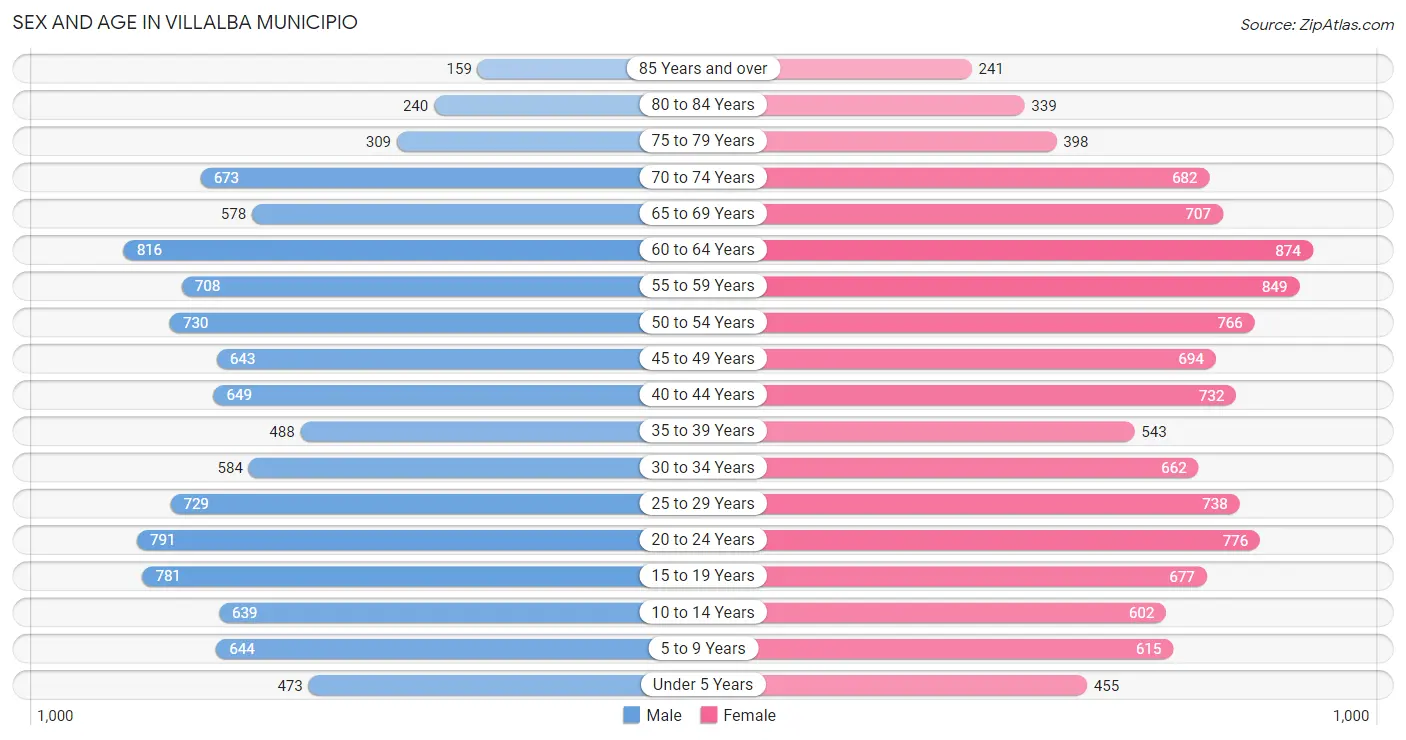
Sex and Age in Villalba Municipio
The most populous age groups in Villalba Municipio are 60 to 64 Years (816 | 7.7%) for men and 60 to 64 Years (874 | 7.7%) for women.
| Age Bracket | Male | Female |
| Under 5 Years | 473 (4.4%) | 455 (4.0%) |
| 5 to 9 Years | 644 (6.1%) | 615 (5.4%) |
| 10 to 14 Years | 639 (6.0%) | 602 (5.3%) |
| 15 to 19 Years | 781 (7.3%) | 677 (6.0%) |
| 20 to 24 Years | 791 (7.4%) | 776 (6.8%) |
| 25 to 29 Years | 729 (6.9%) | 738 (6.5%) |
| 30 to 34 Years | 584 (5.5%) | 662 (5.8%) |
| 35 to 39 Years | 488 (4.6%) | 543 (4.8%) |
| 40 to 44 Years | 649 (6.1%) | 732 (6.5%) |
| 45 to 49 Years | 643 (6.0%) | 694 (6.1%) |
| 50 to 54 Years | 730 (6.9%) | 766 (6.8%) |
| 55 to 59 Years | 708 (6.7%) | 849 (7.5%) |
| 60 to 64 Years | 816 (7.7%) | 874 (7.7%) |
| 65 to 69 Years | 578 (5.4%) | 707 (6.2%) |
| 70 to 74 Years | 673 (6.3%) | 682 (6.0%) |
| 75 to 79 Years | 309 (2.9%) | 398 (3.5%) |
| 80 to 84 Years | 240 (2.3%) | 339 (3.0%) |
| 85 Years and over | 159 (1.5%) | 241 (2.1%) |
| Total | 10,634 (100.0%) | 11,350 (100.0%) |
Families and Households in Villalba Municipio
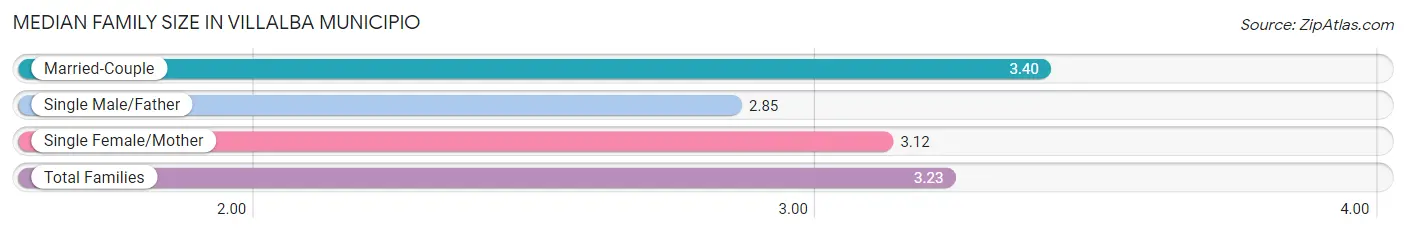
Median Family Size in Villalba Municipio
The median family size in Villalba Municipio is 3.23 persons per family, with married-couple families (3,161 | 53.9%) accounting for the largest median family size of 3.4 persons per family. On the other hand, single male/father families (955 | 16.3%) represent the smallest median family size with 2.85 persons per family.
| Family Type | # Families | Family Size |
| Married-Couple | 3,161 (53.9%) | 3.40 |
| Single Male/Father | 955 (16.3%) | 2.85 |
| Single Female/Mother | 1,745 (29.8%) | 3.12 |
| Total Families | 5,861 (100.0%) | 3.23 |
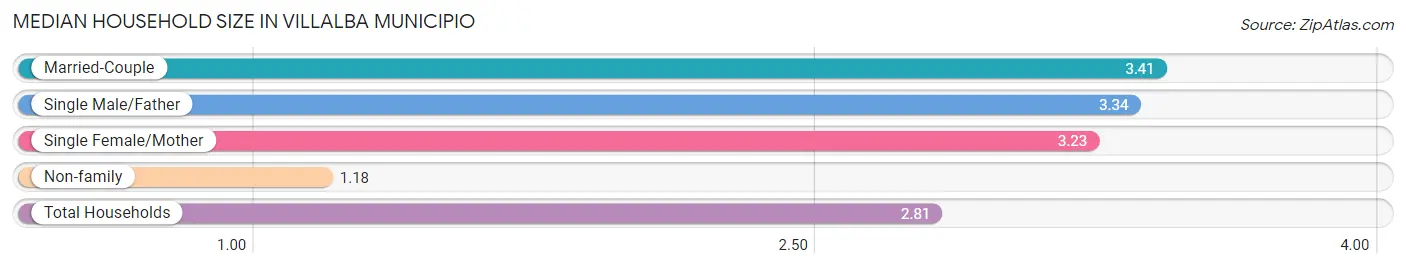
Median Household Size in Villalba Municipio
The median household size in Villalba Municipio is 2.81 persons per household, with married-couple households (3,161 | 40.7%) accounting for the largest median household size of 3.41 persons per household. non-family households (1,900 | 24.5%) represent the smallest median household size with 1.18 persons per household.
| Household Type | # Households | Household Size |
| Married-Couple | 3,161 (40.7%) | 3.41 |
| Single Male/Father | 955 (12.3%) | 3.34 |
| Single Female/Mother | 1,745 (22.5%) | 3.23 |
| Non-family | 1,900 (24.5%) | 1.18 |
| Total Households | 7,761 (100.0%) | 2.81 |
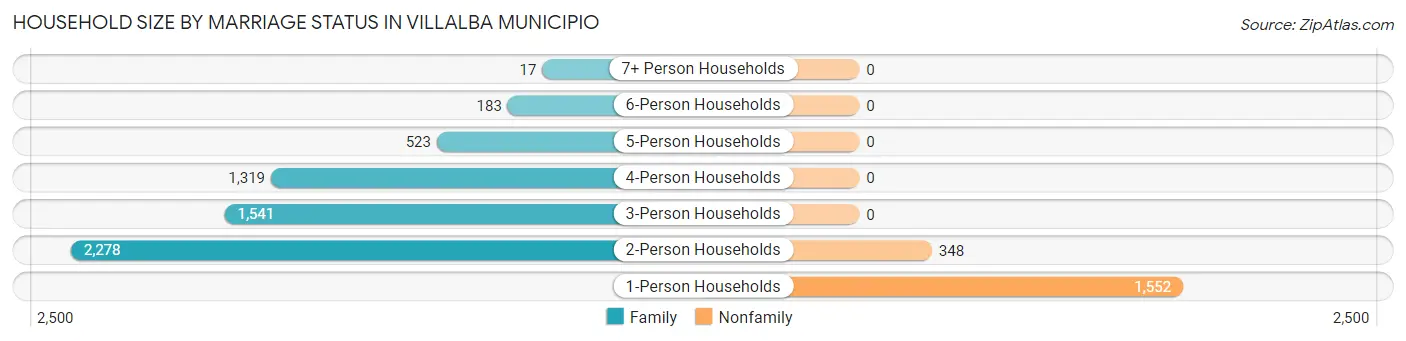
Household Size by Marriage Status in Villalba Municipio
Out of a total of 7,761 households in Villalba Municipio, 5,861 (75.5%) are family households, while 1,900 (24.5%) are nonfamily households. The most numerous type of family households are 2-person households, comprising 2,278, and the most common type of nonfamily households are 1-person households, comprising 1,552.
| Household Size | Family Households | Nonfamily Households |
| 1-Person Households | - | 1,552 (20.0%) |
| 2-Person Households | 2,278 (29.3%) | 348 (4.5%) |
| 3-Person Households | 1,541 (19.9%) | 0 (0.0%) |
| 4-Person Households | 1,319 (17.0%) | 0 (0.0%) |
| 5-Person Households | 523 (6.7%) | 0 (0.0%) |
| 6-Person Households | 183 (2.4%) | 0 (0.0%) |
| 7+ Person Households | 17 (0.2%) | 0 (0.0%) |
| Total | 5,861 (75.5%) | 1,900 (24.5%) |
Female Fertility in Villalba Municipio
Fertility by Age in Villalba Municipio
Average fertility rate in Villalba Municipio is 62.0 births per 1,000 women. Women in the age bracket of 20 to 34 years have the highest fertility rate with 109.0 births per 1,000 women. Women in the age bracket of 20 to 34 years acount for 76.7% of all women with births.
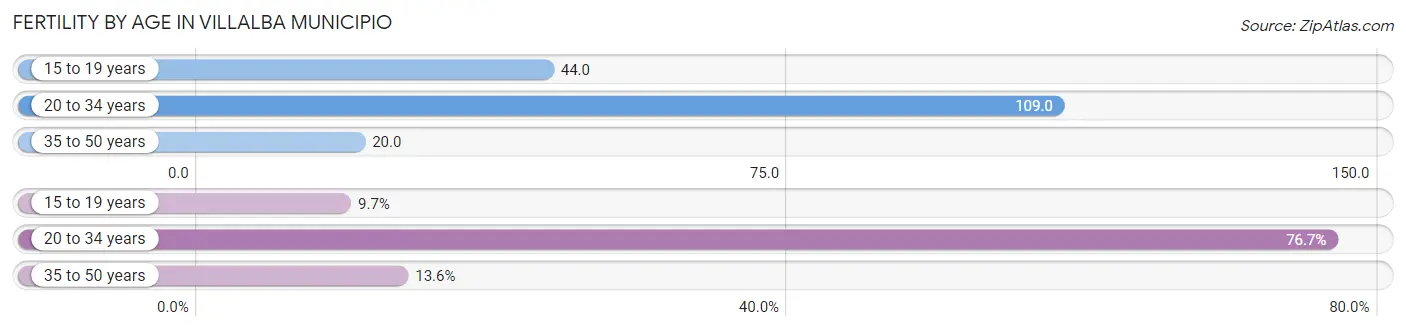
| Age Bracket | Women with Births | Births / 1,000 Women |
| 15 to 19 years | 30 (9.7%) | 44.0 |
| 20 to 34 years | 237 (76.7%) | 109.0 |
| 35 to 50 years | 42 (13.6%) | 20.0 |
| Total | 309 (100.0%) | 62.0 |
Fertility by Age by Marriage Status in Villalba Municipio
69.9% of women with births (309) in Villalba Municipio are married. The highest percentage of unmarried women with births falls into 15 to 19 years age bracket with 56.7% of them unmarried at the time of birth, while the lowest percentage of unmarried women with births belong to 20 to 34 years age bracket with 25.3% of them unmarried.
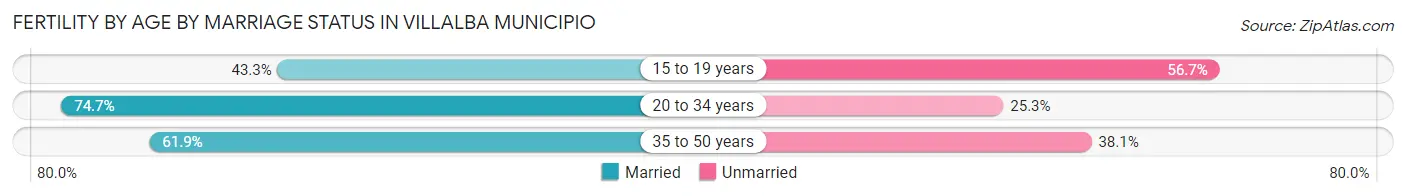
| Age Bracket | Married | Unmarried |
| 15 to 19 years | 13 (43.3%) | 17 (56.7%) |
| 20 to 34 years | 177 (74.7%) | 60 (25.3%) |
| 35 to 50 years | 26 (61.9%) | 16 (38.1%) |
| Total | 216 (69.9%) | 93 (30.1%) |
Fertility by Education in Villalba Municipio
Average fertility rate in Villalba Municipio is 62.0 births per 1,000 women. Women with the education attainment of college or associate's degree have the highest fertility rate of 94.0 births per 1,000 women, while women with the education attainment of less than high school have the lowest fertility at 21.0 births per 1,000 women. Women with the education attainment of college or associate's degree represent 58.6% of all women with births.
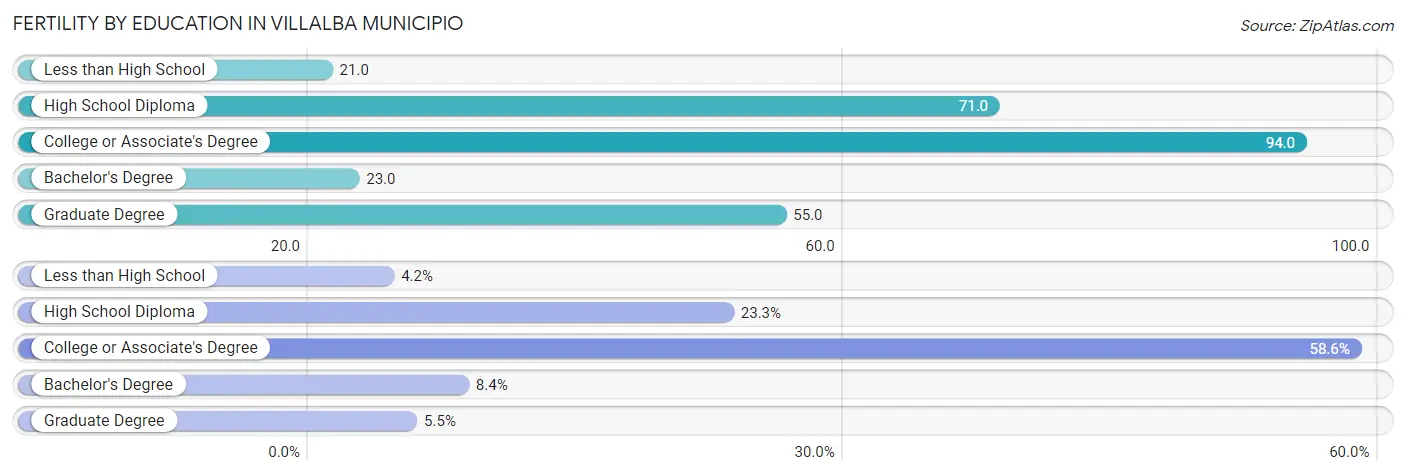
| Educational Attainment | Women with Births | Births / 1,000 Women |
| Less than High School | 13 (4.2%) | 21.0 |
| High School Diploma | 72 (23.3%) | 71.0 |
| College or Associate's Degree | 181 (58.6%) | 94.0 |
| Bachelor's Degree | 26 (8.4%) | 23.0 |
| Graduate Degree | 17 (5.5%) | 55.0 |
| Total | 309 (100.0%) | 62.0 |
Fertility by Education by Marriage Status in Villalba Municipio
30.1% of women with births in Villalba Municipio are unmarried. Women with the educational attainment of less than high school are most likely to be married with 100.0% of them married at childbirth, while women with the educational attainment of high school diploma are least likely to be married with 66.7% of them unmarried at childbirth.
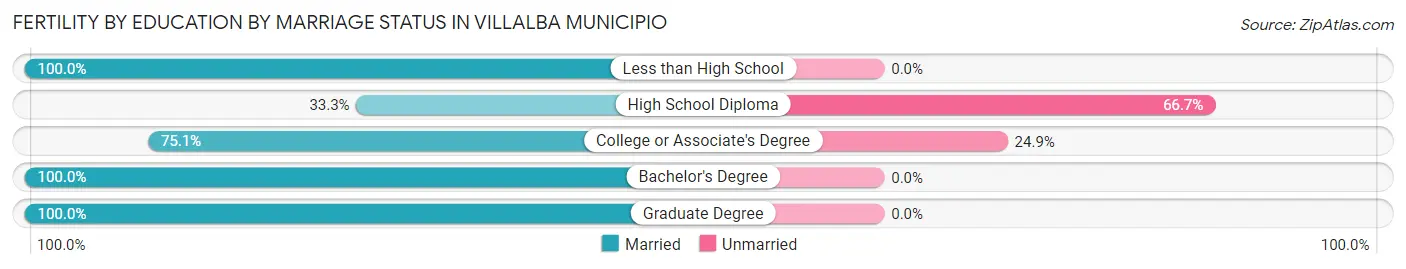
| Educational Attainment | Married | Unmarried |
| Less than High School | 13 (100.0%) | 0 (0.0%) |
| High School Diploma | 24 (33.3%) | 48 (66.7%) |
| College or Associate's Degree | 136 (75.1%) | 45 (24.9%) |
| Bachelor's Degree | 26 (100.0%) | 0 (0.0%) |
| Graduate Degree | 17 (100.0%) | 0 (0.0%) |
| Total | 216 (69.9%) | 93 (30.1%) |
Employment Characteristics in Villalba Municipio
Employment by Class of Employer in Villalba Municipio
Among the 6,513 employed individuals in Villalba Municipio, private company employees (3,877 | 59.5%), state government employees (1,210 | 18.6%), and self-employed (not incorporated) (500 | 7.7%) make up the most common classes of employment.
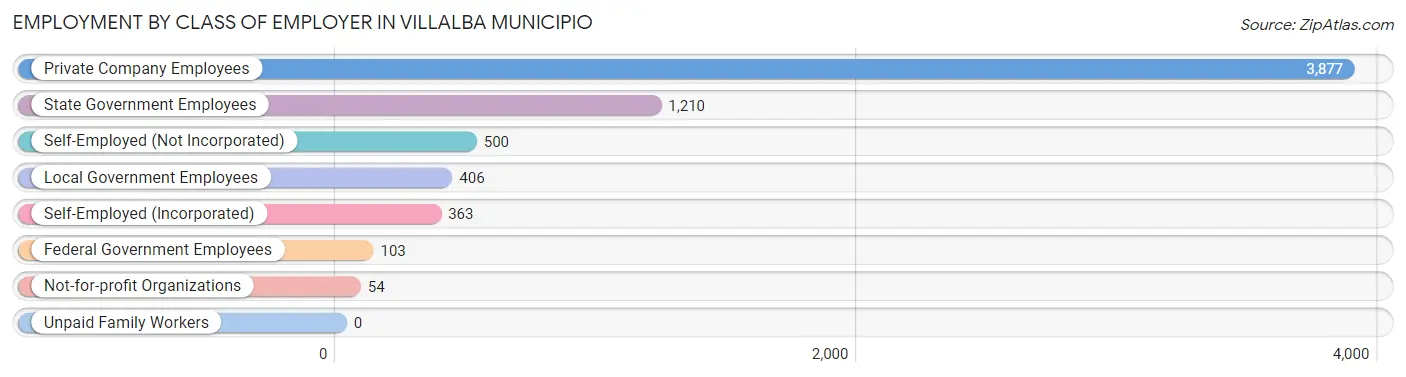
| Employer Class | # Employees | % Employees |
| Private Company Employees | 3,877 | 59.5% |
| Self-Employed (Incorporated) | 363 | 5.6% |
| Self-Employed (Not Incorporated) | 500 | 7.7% |
| Not-for-profit Organizations | 54 | 0.8% |
| Local Government Employees | 406 | 6.2% |
| State Government Employees | 1,210 | 18.6% |
| Federal Government Employees | 103 | 1.6% |
| Unpaid Family Workers | 0 | 0.0% |
| Total | 6,513 | 100.0% |
Employment Status by Age in Villalba Municipio
According to the labor force statistics for Villalba Municipio, out of the total population over 16 years of age (18,226), 42.8% or 7,801 individuals are in the labor force, with 13.9% or 1,084 of them unemployed. The age group with the highest labor force participation rate is 35 to 44 years, with 76.0% or 1,833 individuals in the labor force. Within the labor force, the 16 to 19 years age range has the highest percentage of unemployed individuals, with 45.2% or 71 of them being unemployed.
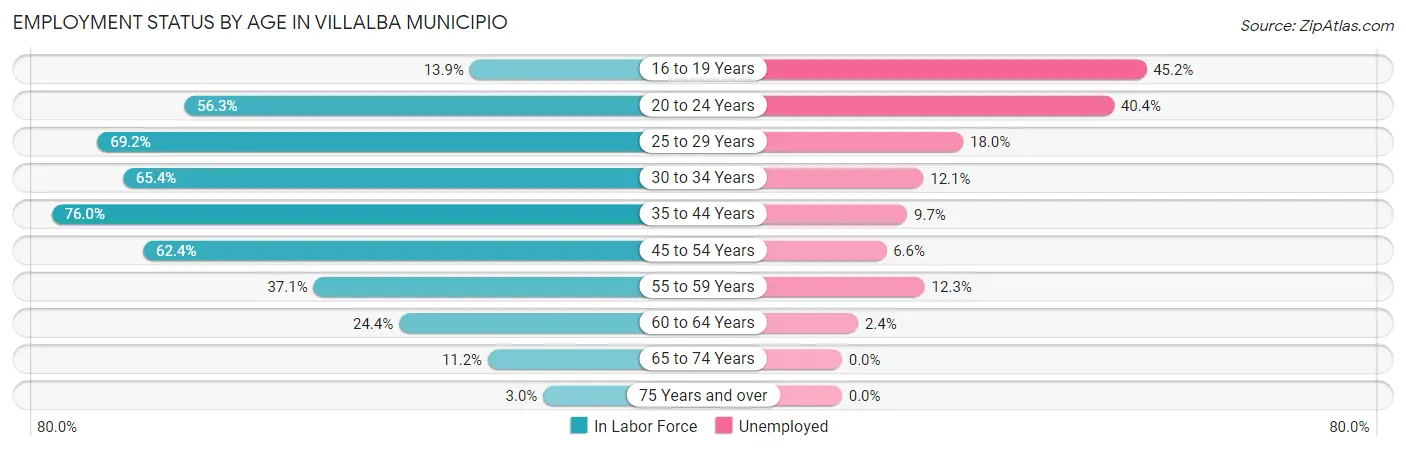
| Age Bracket | In Labor Force | Unemployed |
| 16 to 19 Years | 157 (13.9%) | 71 (45.2%) |
| 20 to 24 Years | 882 (56.3%) | 356 (40.4%) |
| 25 to 29 Years | 1,015 (69.2%) | 183 (18.0%) |
| 30 to 34 Years | 815 (65.4%) | 99 (12.1%) |
| 35 to 44 Years | 1,833 (76.0%) | 178 (9.7%) |
| 45 to 54 Years | 1,768 (62.4%) | 117 (6.6%) |
| 55 to 59 Years | 578 (37.1%) | 71 (12.3%) |
| 60 to 64 Years | 412 (24.4%) | 10 (2.4%) |
| 65 to 74 Years | 296 (11.2%) | 0 (0.0%) |
| 75 Years and over | 51 (3.0%) | 0 (0.0%) |
| Total | 7,801 (42.8%) | 1,084 (13.9%) |
Employment Status by Educational Attainment in Villalba Municipio
According to labor force statistics for Villalba Municipio, 57.3% of individuals (6,420) out of the total population between 25 and 64 years of age (11,205) are in the labor force, with 10.3% or 661 of them being unemployed. The group with the highest labor force participation rate are those with the educational attainment of college / associate degree, with 68.1% or 2,196 individuals in the labor force. Within the labor force, individuals with less than high school education have the highest percentage of unemployment, with 25.0% or 79 of them being unemployed.
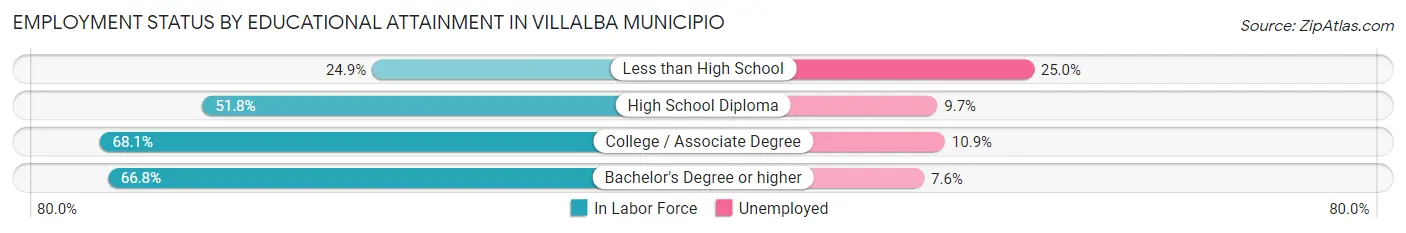
| Educational Attainment | In Labor Force | Unemployed |
| Less than High School | 316 (24.9%) | 318 (25.0%) |
| High School Diploma | 1,993 (51.8%) | 373 (9.7%) |
| College / Associate Degree | 2,196 (68.1%) | 351 (10.9%) |
| Bachelor's Degree or higher | 1,912 (66.8%) | 218 (7.6%) |
| Total | 6,420 (57.3%) | 1,154 (10.3%) |
Employment Occupations by Sex in Villalba Municipio
Management, Business, Science and Arts Occupations
The most common Management, Business, Science and Arts occupations in Villalba Municipio are Community & Social Service (772 | 11.5%), Health Diagnosing & Treating (652 | 9.7%), Education Instruction & Library (459 | 6.9%), Management (456 | 6.8%), and Health Technologists (443 | 6.6%).
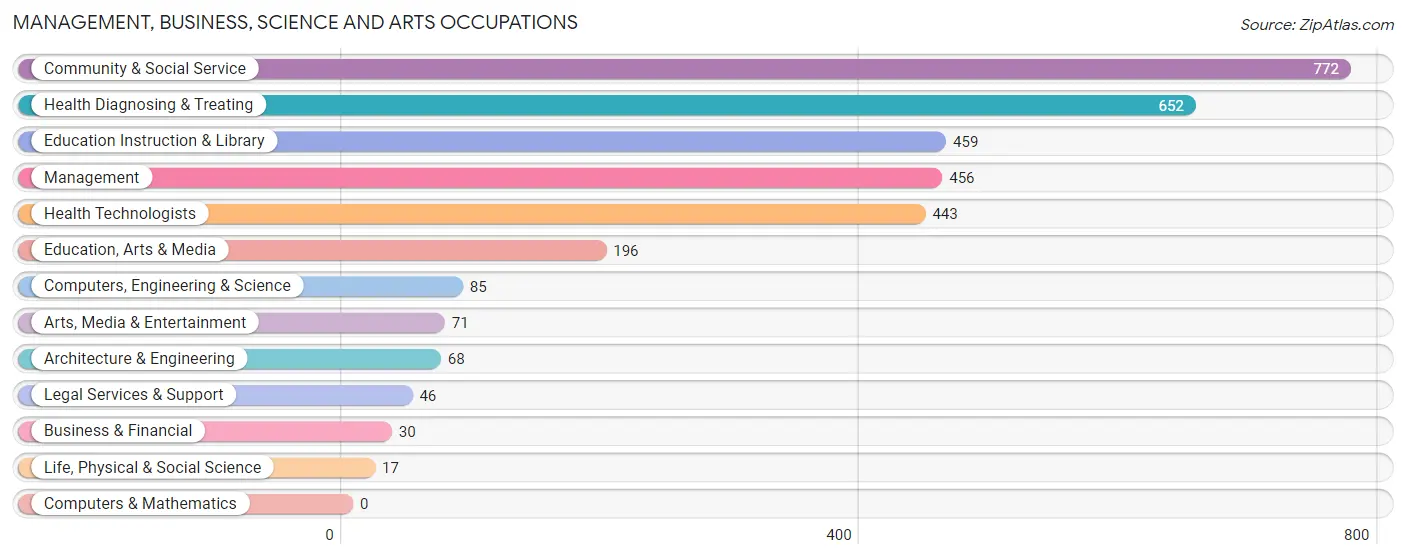
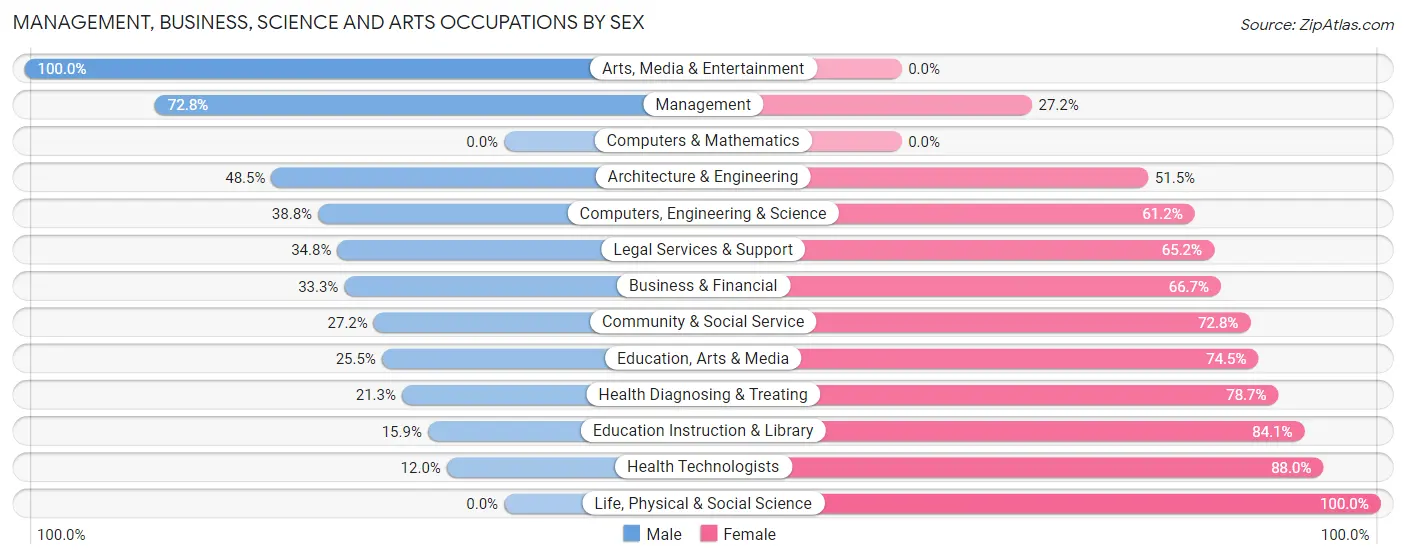
Management, Business, Science and Arts Occupations by Sex
Within the Management, Business, Science and Arts occupations in Villalba Municipio, the most male-oriented occupations are Arts, Media & Entertainment (100.0%), Management (72.8%), and Architecture & Engineering (48.5%), while the most female-oriented occupations are Life, Physical & Social Science (100.0%), Health Technologists (88.0%), and Education Instruction & Library (84.1%).
| Occupation | Male | Female |
| Management | 332 (72.8%) | 124 (27.2%) |
| Business & Financial | 10 (33.3%) | 20 (66.7%) |
| Computers, Engineering & Science | 33 (38.8%) | 52 (61.2%) |
| Computers & Mathematics | 0 (0.0%) | 0 (0.0%) |
| Architecture & Engineering | 33 (48.5%) | 35 (51.5%) |
| Life, Physical & Social Science | 0 (0.0%) | 17 (100.0%) |
| Community & Social Service | 210 (27.2%) | 562 (72.8%) |
| Education, Arts & Media | 50 (25.5%) | 146 (74.5%) |
| Legal Services & Support | 16 (34.8%) | 30 (65.2%) |
| Education Instruction & Library | 73 (15.9%) | 386 (84.1%) |
| Arts, Media & Entertainment | 71 (100.0%) | 0 (0.0%) |
| Health Diagnosing & Treating | 139 (21.3%) | 513 (78.7%) |
| Health Technologists | 53 (12.0%) | 390 (88.0%) |
| Total (Category) | 724 (36.3%) | 1,271 (63.7%) |
| Total (Overall) | 3,602 (53.8%) | 3,098 (46.2%) |
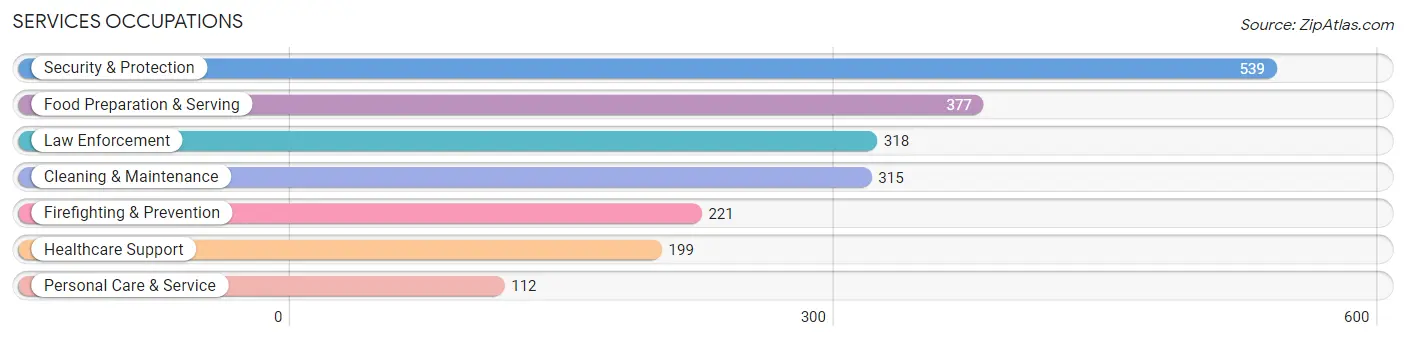
Services Occupations
The most common Services occupations in Villalba Municipio are Security & Protection (539 | 8.0%), Food Preparation & Serving (377 | 5.6%), Law Enforcement (318 | 4.8%), Cleaning & Maintenance (315 | 4.7%), and Firefighting & Prevention (221 | 3.3%).
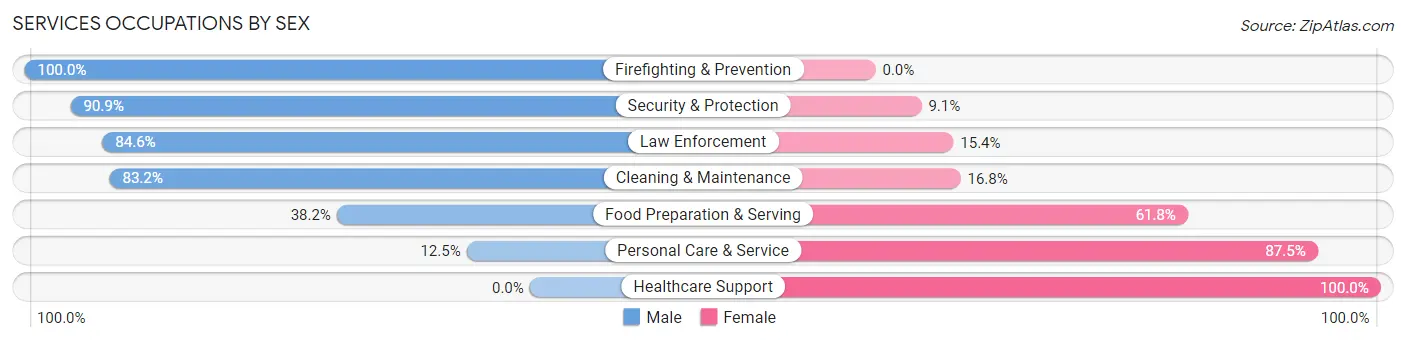
Services Occupations by Sex
Within the Services occupations in Villalba Municipio, the most male-oriented occupations are Firefighting & Prevention (100.0%), Security & Protection (90.9%), and Law Enforcement (84.6%), while the most female-oriented occupations are Healthcare Support (100.0%), Personal Care & Service (87.5%), and Food Preparation & Serving (61.8%).
| Occupation | Male | Female |
| Healthcare Support | 0 (0.0%) | 199 (100.0%) |
| Security & Protection | 490 (90.9%) | 49 (9.1%) |
| Firefighting & Prevention | 221 (100.0%) | 0 (0.0%) |
| Law Enforcement | 269 (84.6%) | 49 (15.4%) |
| Food Preparation & Serving | 144 (38.2%) | 233 (61.8%) |
| Cleaning & Maintenance | 262 (83.2%) | 53 (16.8%) |
| Personal Care & Service | 14 (12.5%) | 98 (87.5%) |
| Total (Category) | 910 (59.0%) | 632 (41.0%) |
| Total (Overall) | 3,602 (53.8%) | 3,098 (46.2%) |
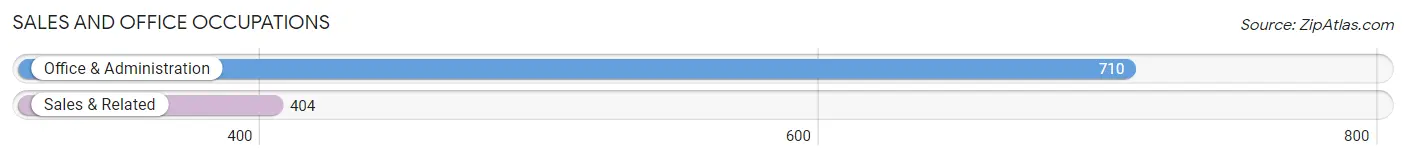
Sales and Office Occupations
The most common Sales and Office occupations in Villalba Municipio are Office & Administration (710 | 10.6%), and Sales & Related (404 | 6.0%).
Sales and Office Occupations by Sex
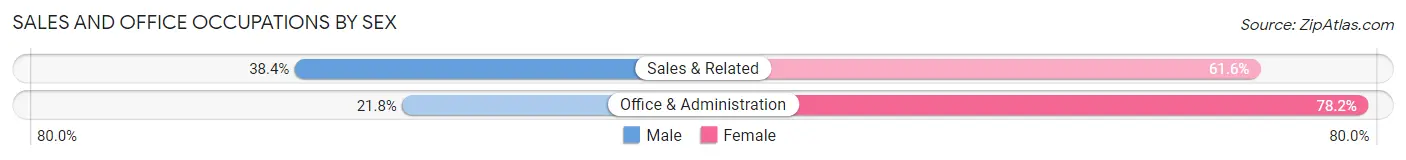
| Occupation | Male | Female |
| Sales & Related | 155 (38.4%) | 249 (61.6%) |
| Office & Administration | 155 (21.8%) | 555 (78.2%) |
| Total (Category) | 310 (27.8%) | 804 (72.2%) |
| Total (Overall) | 3,602 (53.8%) | 3,098 (46.2%) |
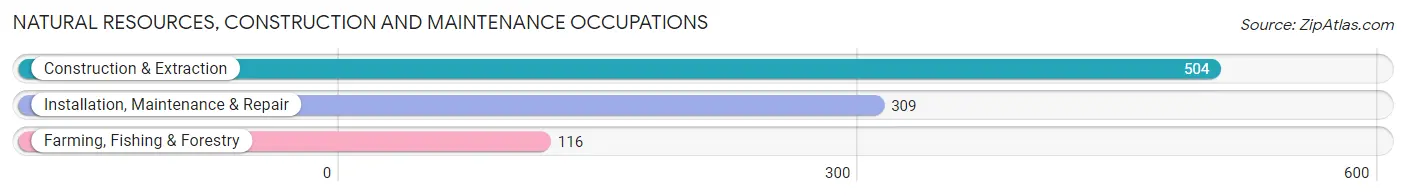
Natural Resources, Construction and Maintenance Occupations
The most common Natural Resources, Construction and Maintenance occupations in Villalba Municipio are Construction & Extraction (504 | 7.5%), Installation, Maintenance & Repair (309 | 4.6%), and Farming, Fishing & Forestry (116 | 1.7%).
Natural Resources, Construction and Maintenance Occupations by Sex
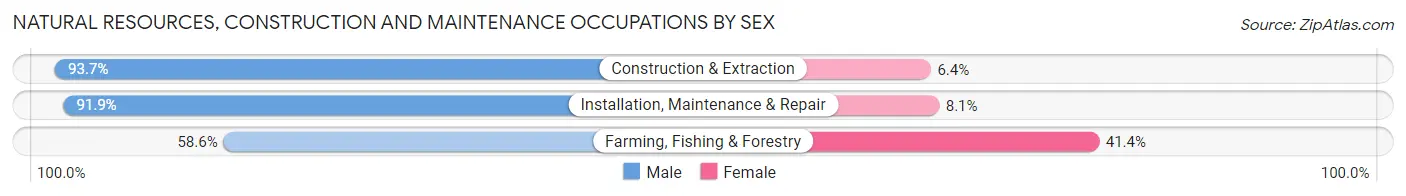
| Occupation | Male | Female |
| Farming, Fishing & Forestry | 68 (58.6%) | 48 (41.4%) |
| Construction & Extraction | 472 (93.6%) | 32 (6.4%) |
| Installation, Maintenance & Repair | 284 (91.9%) | 25 (8.1%) |
| Total (Category) | 824 (88.7%) | 105 (11.3%) |
| Total (Overall) | 3,602 (53.8%) | 3,098 (46.2%) |
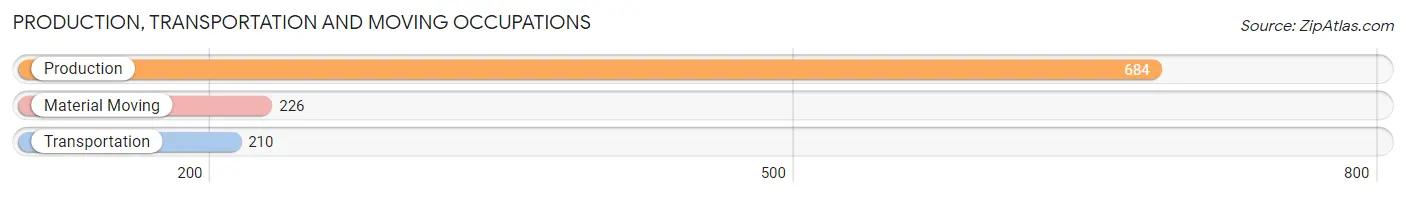
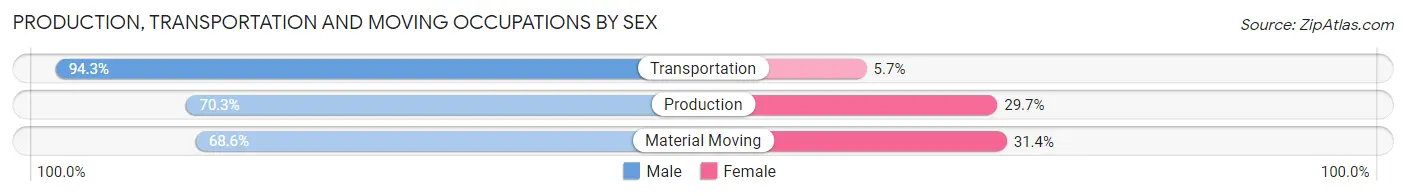
Production, Transportation and Moving Occupations
The most common Production, Transportation and Moving occupations in Villalba Municipio are Production (684 | 10.2%), Material Moving (226 | 3.4%), and Transportation (210 | 3.1%).
Production, Transportation and Moving Occupations by Sex
| Occupation | Male | Female |
| Production | 481 (70.3%) | 203 (29.7%) |
| Transportation | 198 (94.3%) | 12 (5.7%) |
| Material Moving | 155 (68.6%) | 71 (31.4%) |
| Total (Category) | 834 (74.5%) | 286 (25.5%) |
| Total (Overall) | 3,602 (53.8%) | 3,098 (46.2%) |
Employment Industries by Sex in Villalba Municipio
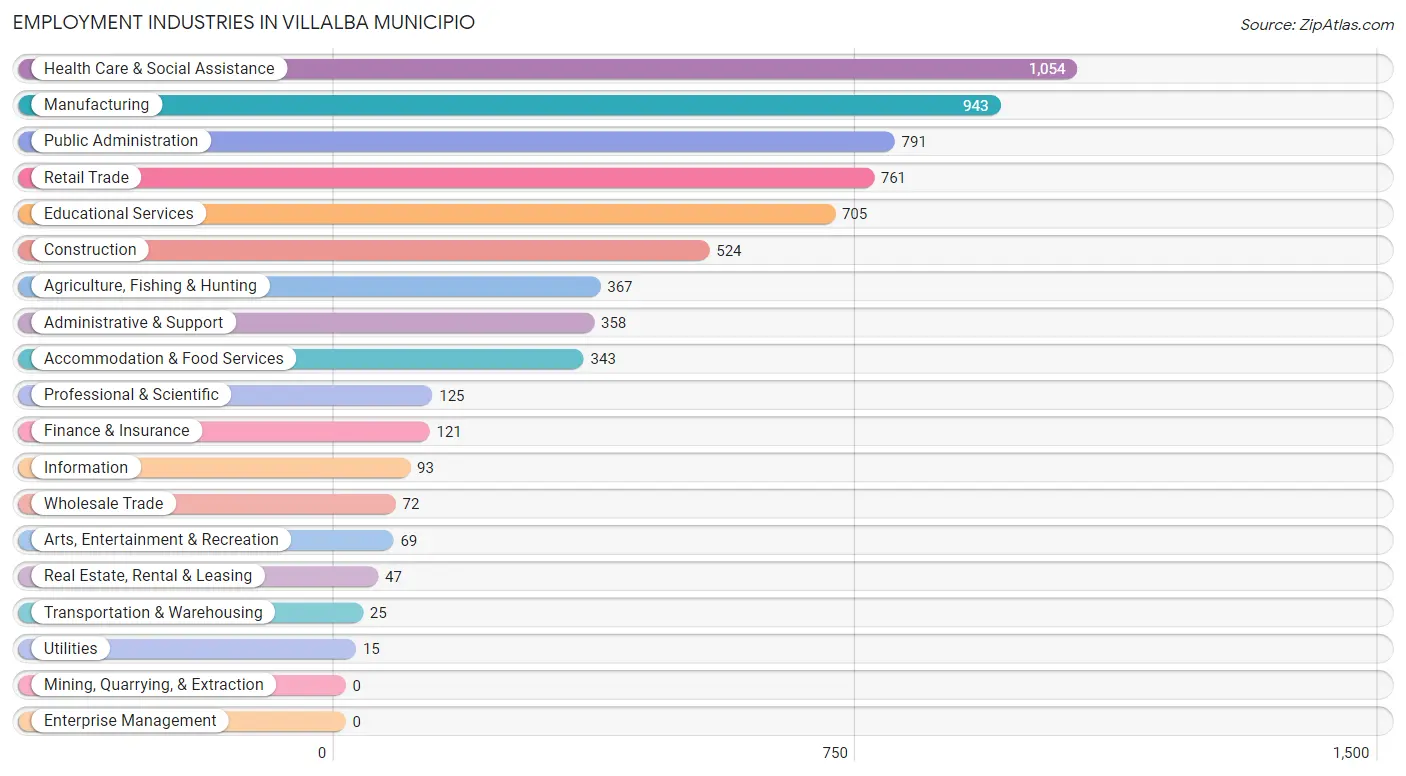
Employment Industries in Villalba Municipio
The major employment industries in Villalba Municipio include Health Care & Social Assistance (1,054 | 15.7%), Manufacturing (943 | 14.1%), Public Administration (791 | 11.8%), Retail Trade (761 | 11.4%), and Educational Services (705 | 10.5%).
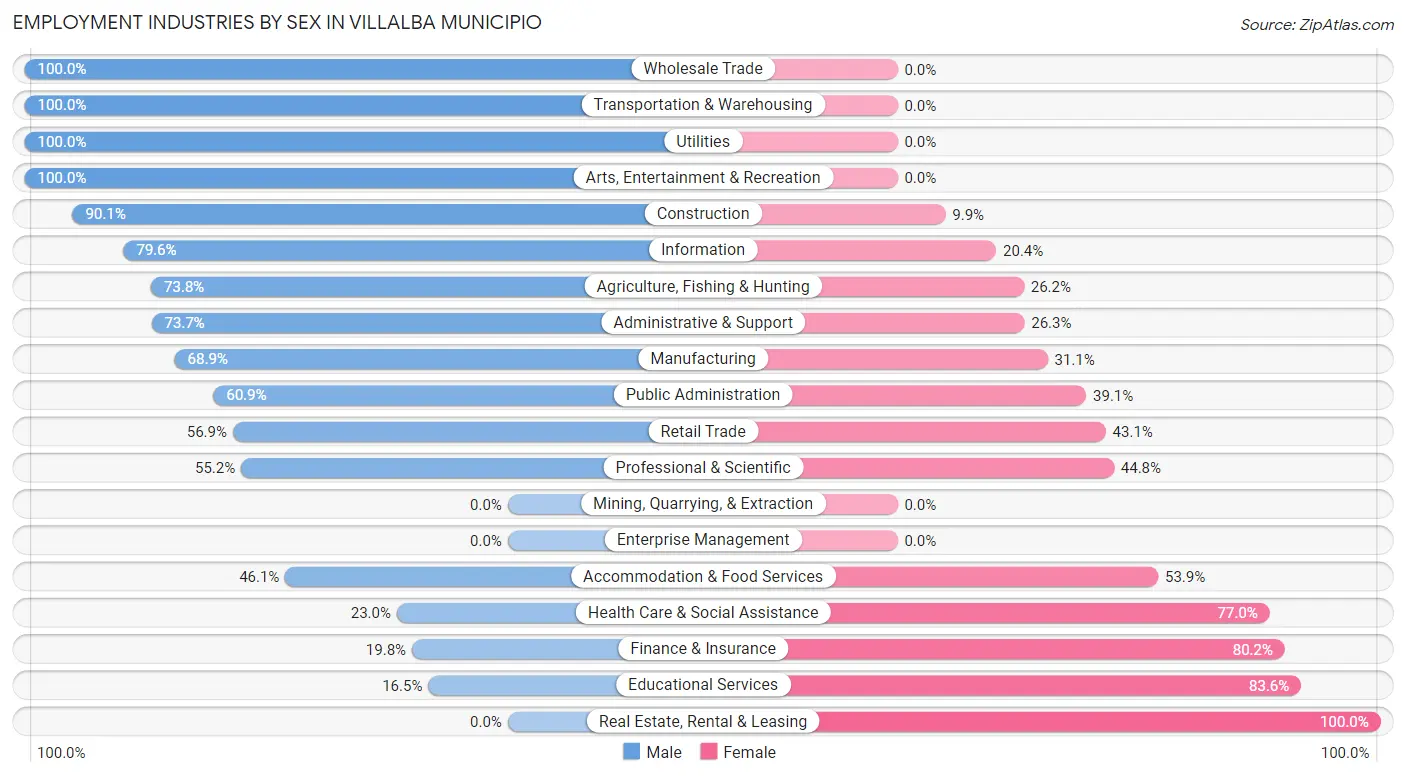
Employment Industries by Sex in Villalba Municipio
The Villalba Municipio industries that see more men than women are Wholesale Trade (100.0%), Transportation & Warehousing (100.0%), and Utilities (100.0%), whereas the industries that tend to have a higher number of women are Real Estate, Rental & Leasing (100.0%), Educational Services (83.6%), and Finance & Insurance (80.2%).
| Industry | Male | Female |
| Agriculture, Fishing & Hunting | 271 (73.8%) | 96 (26.2%) |
| Mining, Quarrying, & Extraction | 0 (0.0%) | 0 (0.0%) |
| Construction | 472 (90.1%) | 52 (9.9%) |
| Manufacturing | 650 (68.9%) | 293 (31.1%) |
| Wholesale Trade | 72 (100.0%) | 0 (0.0%) |
| Retail Trade | 433 (56.9%) | 328 (43.1%) |
| Transportation & Warehousing | 25 (100.0%) | 0 (0.0%) |
| Utilities | 15 (100.0%) | 0 (0.0%) |
| Information | 74 (79.6%) | 19 (20.4%) |
| Finance & Insurance | 24 (19.8%) | 97 (80.2%) |
| Real Estate, Rental & Leasing | 0 (0.0%) | 47 (100.0%) |
| Professional & Scientific | 69 (55.2%) | 56 (44.8%) |
| Enterprise Management | 0 (0.0%) | 0 (0.0%) |
| Administrative & Support | 264 (73.7%) | 94 (26.3%) |
| Educational Services | 116 (16.5%) | 589 (83.6%) |
| Health Care & Social Assistance | 242 (23.0%) | 812 (77.0%) |
| Arts, Entertainment & Recreation | 69 (100.0%) | 0 (0.0%) |
| Accommodation & Food Services | 158 (46.1%) | 185 (53.9%) |
| Public Administration | 482 (60.9%) | 309 (39.1%) |
| Total | 3,602 (53.8%) | 3,098 (46.2%) |
Education in Villalba Municipio
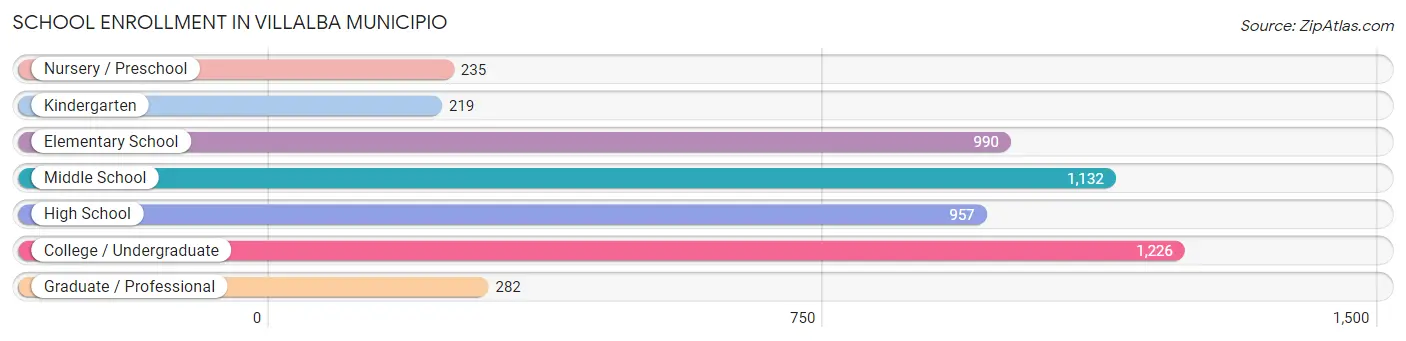
School Enrollment in Villalba Municipio
The most common levels of schooling among the 5,041 students in Villalba Municipio are college / undergraduate (1,226 | 24.3%), middle school (1,132 | 22.5%), and elementary school (990 | 19.6%).
| School Level | # Students | % Students |
| Nursery / Preschool | 235 | 4.7% |
| Kindergarten | 219 | 4.3% |
| Elementary School | 990 | 19.6% |
| Middle School | 1,132 | 22.5% |
| High School | 957 | 19.0% |
| College / Undergraduate | 1,226 | 24.3% |
| Graduate / Professional | 282 | 5.6% |
| Total | 5,041 | 100.0% |
School Enrollment by Age by Funding Source in Villalba Municipio
Out of a total of 5,041 students who are enrolled in schools in Villalba Municipio, 1,583 (31.4%) attend a private institution, while the remaining 3,458 (68.6%) are enrolled in public schools. The age group of 25 to 34 year olds has the highest likelihood of being enrolled in private schools, with 269 (87.6% in the age bracket) enrolled. Conversely, the age group of 3 to 4 year olds has the lowest likelihood of being enrolled in a private school, with 217 (89.3% in the age bracket) attending a public institution.
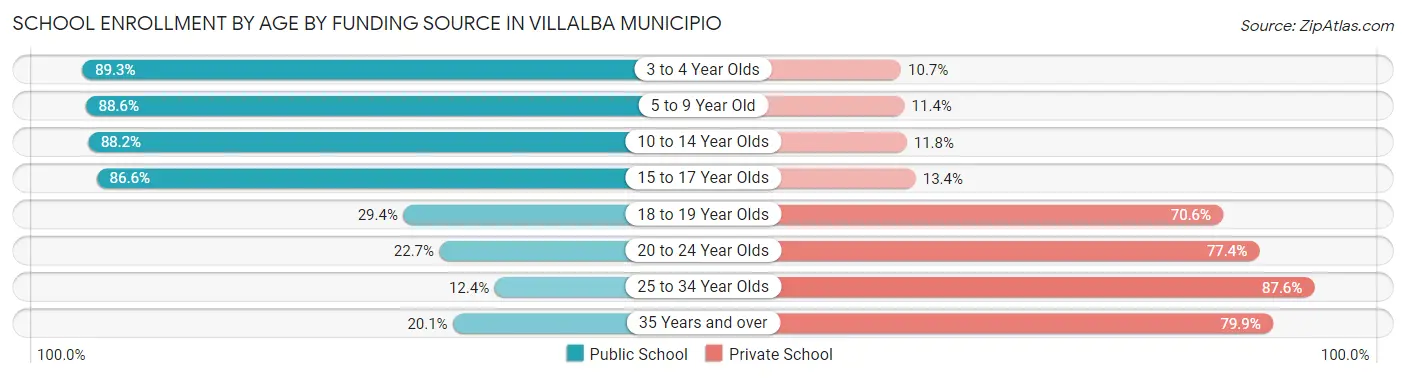
| Age Bracket | Public School | Private School |
| 3 to 4 Year Olds | 217 (89.3%) | 26 (10.7%) |
| 5 to 9 Year Old | 1,116 (88.6%) | 143 (11.4%) |
| 10 to 14 Year Olds | 1,095 (88.2%) | 146 (11.8%) |
| 15 to 17 Year Olds | 709 (86.6%) | 110 (13.4%) |
| 18 to 19 Year Olds | 99 (29.4%) | 238 (70.6%) |
| 20 to 24 Year Olds | 152 (22.7%) | 519 (77.3%) |
| 25 to 34 Year Olds | 38 (12.4%) | 269 (87.6%) |
| 35 Years and over | 33 (20.1%) | 131 (79.9%) |
| Total | 3,458 (68.6%) | 1,583 (31.4%) |
Educational Attainment by Field of Study in Villalba Municipio
Business (835 | 24.9%), education (829 | 24.7%), science & technology (661 | 19.7%), arts & humanities (321 | 9.6%), and psychology (173 | 5.1%) are the most common fields of study among 3,358 individuals in Villalba Municipio who have obtained a bachelor's degree or higher.
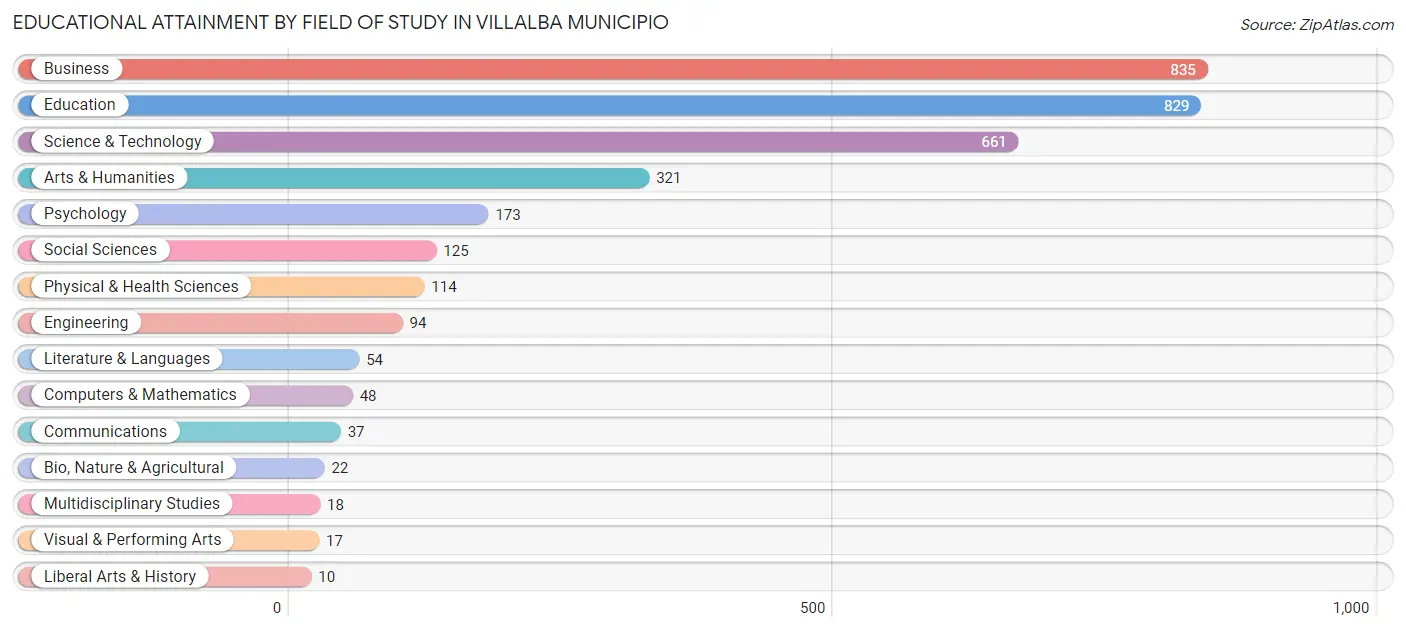
| Field of Study | # Graduates | % Graduates |
| Computers & Mathematics | 48 | 1.4% |
| Bio, Nature & Agricultural | 22 | 0.7% |
| Physical & Health Sciences | 114 | 3.4% |
| Psychology | 173 | 5.1% |
| Social Sciences | 125 | 3.7% |
| Engineering | 94 | 2.8% |
| Multidisciplinary Studies | 18 | 0.5% |
| Science & Technology | 661 | 19.7% |
| Business | 835 | 24.9% |
| Education | 829 | 24.7% |
| Literature & Languages | 54 | 1.6% |
| Liberal Arts & History | 10 | 0.3% |
| Visual & Performing Arts | 17 | 0.5% |
| Communications | 37 | 1.1% |
| Arts & Humanities | 321 | 9.6% |
| Total | 3,358 | 100.0% |
Transportation & Commute in Villalba Municipio
Vehicle Availability by Sex in Villalba Municipio
The most prevalent vehicle ownership categories in Villalba Municipio are males with 2 vehicles (1,288, accounting for 36.5%) and females with 2 vehicles (1,060, making up 43.2%).
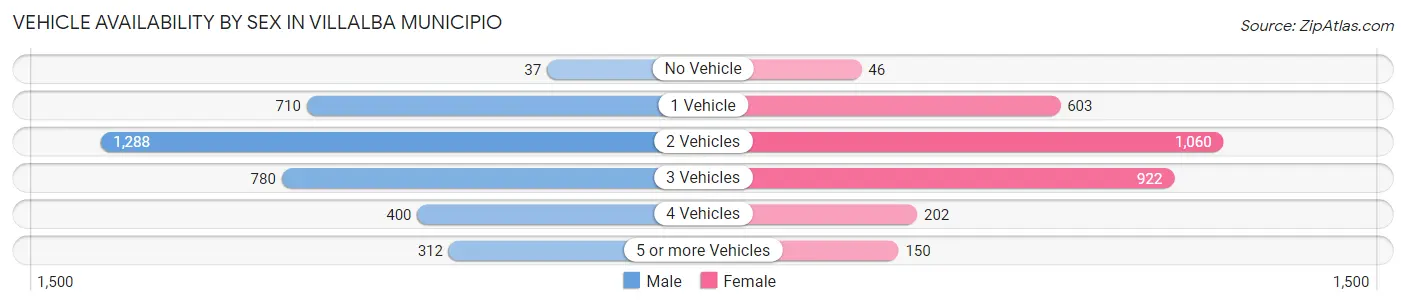
| Vehicles Available | Male | Female |
| No Vehicle | 37 (1.1%) | 46 (1.5%) |
| 1 Vehicle | 710 (20.1%) | 603 (20.2%) |
| 2 Vehicles | 1,288 (36.5%) | 1,060 (35.5%) |
| 3 Vehicles | 780 (22.1%) | 922 (30.9%) |
| 4 Vehicles | 400 (11.3%) | 202 (6.8%) |
| 5 or more Vehicles | 312 (8.8%) | 150 (5.0%) |
| Total | 3,527 (100.0%) | 2,983 (100.0%) |
Commute Time in Villalba Municipio
The most frequently occuring commute durations in Villalba Municipio are 15 to 19 minutes (938 commuters, 14.4%), 10 to 14 minutes (895 commuters, 13.8%), and 40 to 44 minutes (753 commuters, 11.6%).
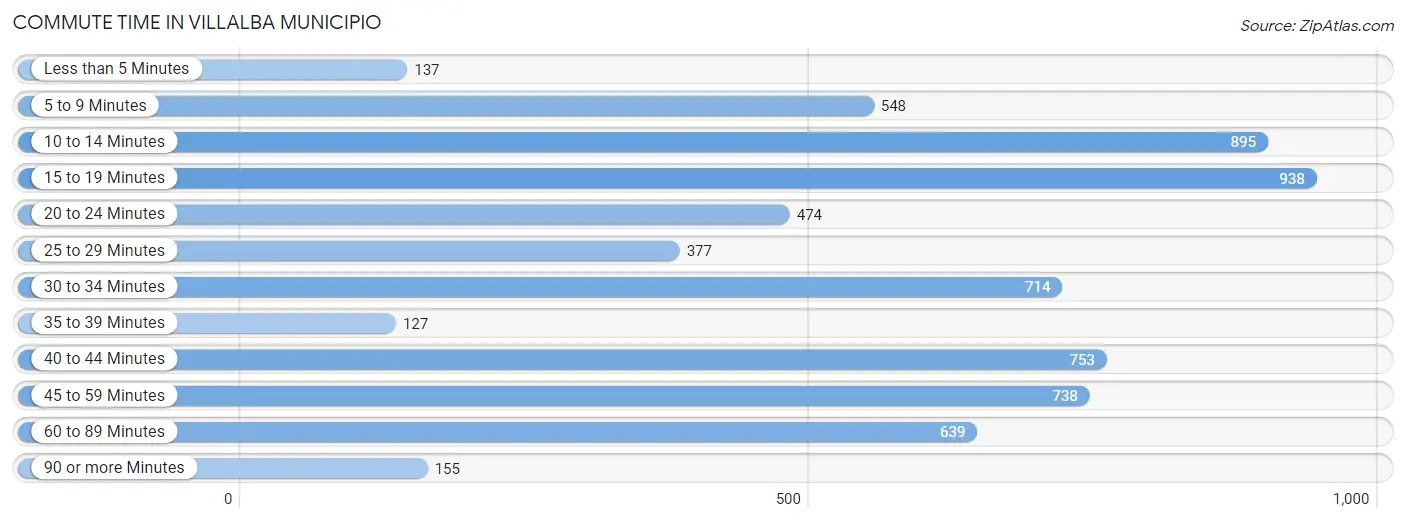
| Commute Time | # Commuters | % Commuters |
| Less than 5 Minutes | 137 | 2.1% |
| 5 to 9 Minutes | 548 | 8.4% |
| 10 to 14 Minutes | 895 | 13.8% |
| 15 to 19 Minutes | 938 | 14.4% |
| 20 to 24 Minutes | 474 | 7.3% |
| 25 to 29 Minutes | 377 | 5.8% |
| 30 to 34 Minutes | 714 | 11.0% |
| 35 to 39 Minutes | 127 | 2.0% |
| 40 to 44 Minutes | 753 | 11.6% |
| 45 to 59 Minutes | 738 | 11.4% |
| 60 to 89 Minutes | 639 | 9.8% |
| 90 or more Minutes | 155 | 2.4% |
Commute Time by Sex in Villalba Municipio
The most common commute times in Villalba Municipio are 10 to 14 minutes (554 commuters, 15.8%) for males and 15 to 19 minutes (463 commuters, 15.5%) for females.
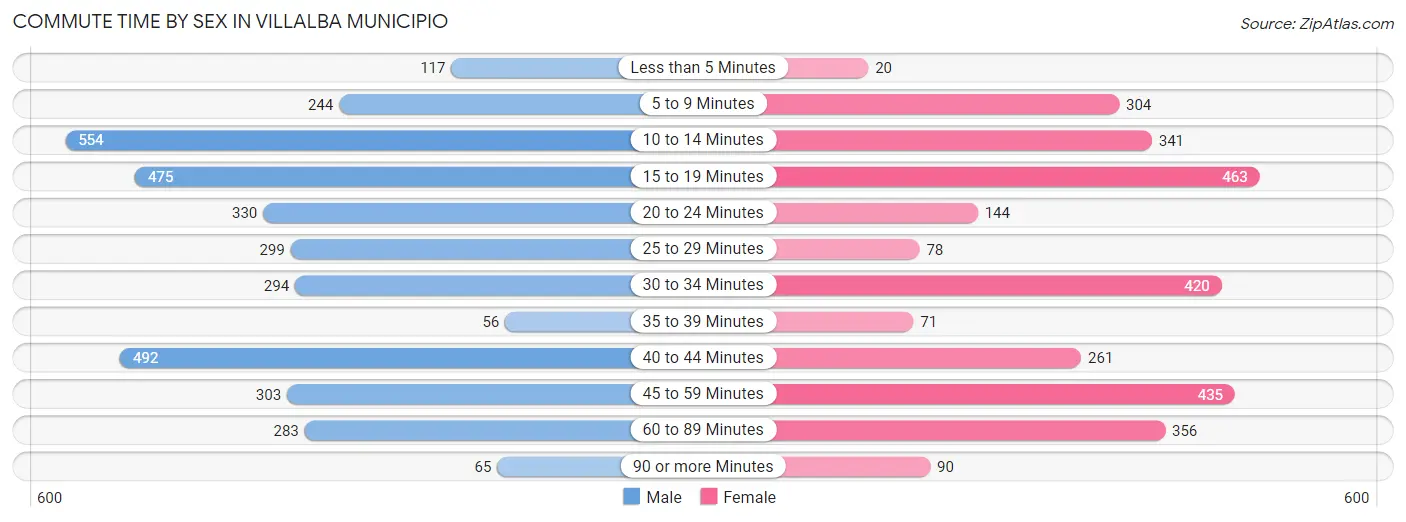
| Commute Time | Male | Female |
| Less than 5 Minutes | 117 (3.3%) | 20 (0.7%) |
| 5 to 9 Minutes | 244 (7.0%) | 304 (10.2%) |
| 10 to 14 Minutes | 554 (15.8%) | 341 (11.4%) |
| 15 to 19 Minutes | 475 (13.5%) | 463 (15.5%) |
| 20 to 24 Minutes | 330 (9.4%) | 144 (4.8%) |
| 25 to 29 Minutes | 299 (8.5%) | 78 (2.6%) |
| 30 to 34 Minutes | 294 (8.4%) | 420 (14.1%) |
| 35 to 39 Minutes | 56 (1.6%) | 71 (2.4%) |
| 40 to 44 Minutes | 492 (14.0%) | 261 (8.7%) |
| 45 to 59 Minutes | 303 (8.6%) | 435 (14.6%) |
| 60 to 89 Minutes | 283 (8.1%) | 356 (11.9%) |
| 90 or more Minutes | 65 (1.8%) | 90 (3.0%) |
Time of Departure to Work by Sex in Villalba Municipio
The most frequent times of departure to work in Villalba Municipio are 5:00 AM to 5:29 AM (491, 14.0%) for males and 7:00 AM to 7:29 AM (740, 24.8%) for females.
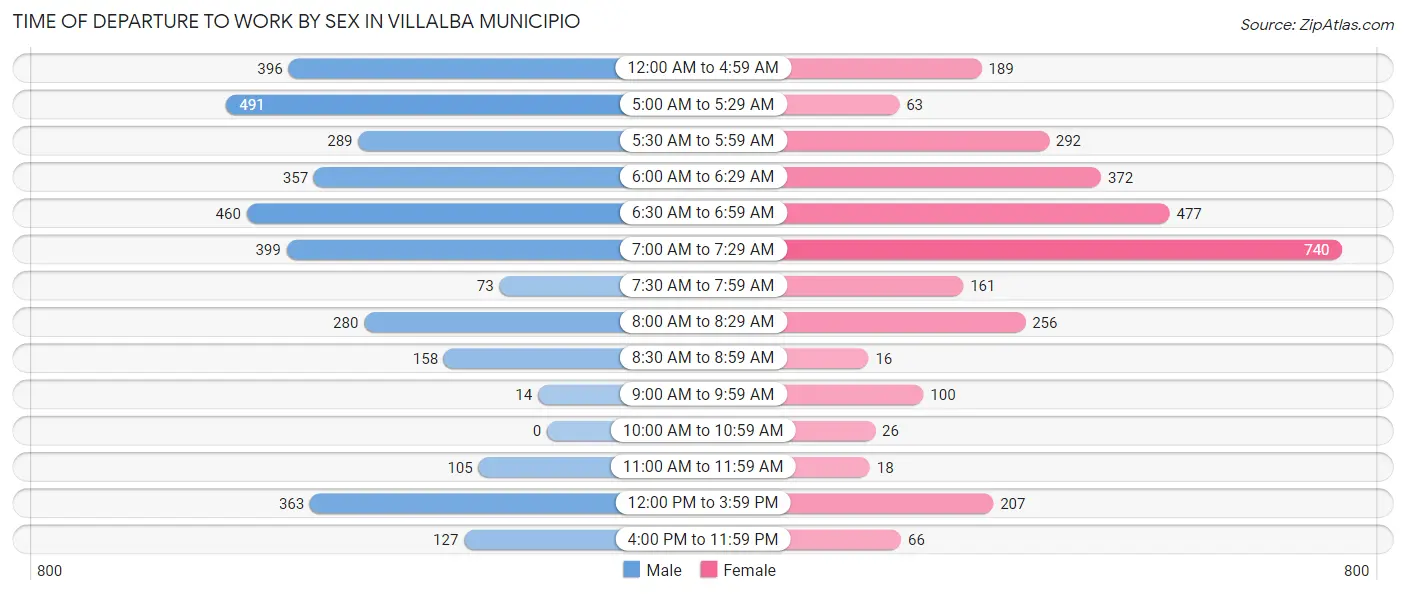
| Time of Departure | Male | Female |
| 12:00 AM to 4:59 AM | 396 (11.3%) | 189 (6.3%) |
| 5:00 AM to 5:29 AM | 491 (14.0%) | 63 (2.1%) |
| 5:30 AM to 5:59 AM | 289 (8.2%) | 292 (9.8%) |
| 6:00 AM to 6:29 AM | 357 (10.2%) | 372 (12.5%) |
| 6:30 AM to 6:59 AM | 460 (13.1%) | 477 (16.0%) |
| 7:00 AM to 7:29 AM | 399 (11.4%) | 740 (24.8%) |
| 7:30 AM to 7:59 AM | 73 (2.1%) | 161 (5.4%) |
| 8:00 AM to 8:29 AM | 280 (8.0%) | 256 (8.6%) |
| 8:30 AM to 8:59 AM | 158 (4.5%) | 16 (0.5%) |
| 9:00 AM to 9:59 AM | 14 (0.4%) | 100 (3.4%) |
| 10:00 AM to 10:59 AM | 0 (0.0%) | 26 (0.9%) |
| 11:00 AM to 11:59 AM | 105 (3.0%) | 18 (0.6%) |
| 12:00 PM to 3:59 PM | 363 (10.3%) | 207 (6.9%) |
| 4:00 PM to 11:59 PM | 127 (3.6%) | 66 (2.2%) |
| Total | 3,512 (100.0%) | 2,983 (100.0%) |
Housing Occupancy in Villalba Municipio
Occupancy by Ownership in Villalba Municipio
Of the total 7,761 dwellings in Villalba Municipio, owner-occupied units account for 5,961 (76.8%), while renter-occupied units make up 1,800 (23.2%).
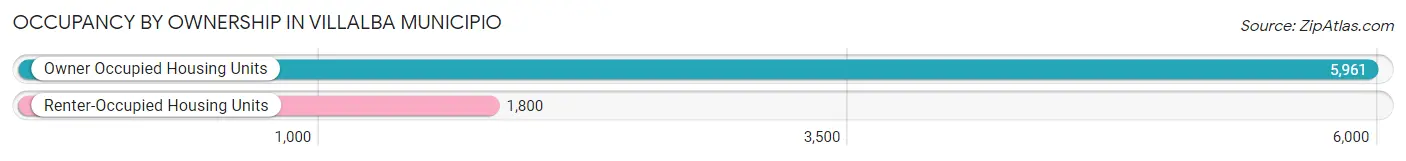
| Occupancy | # Housing Units | % Housing Units |
| Owner Occupied Housing Units | 5,961 | 76.8% |
| Renter-Occupied Housing Units | 1,800 | 23.2% |
| Total Occupied Housing Units | 7,761 | 100.0% |
Occupancy by Household Size in Villalba Municipio
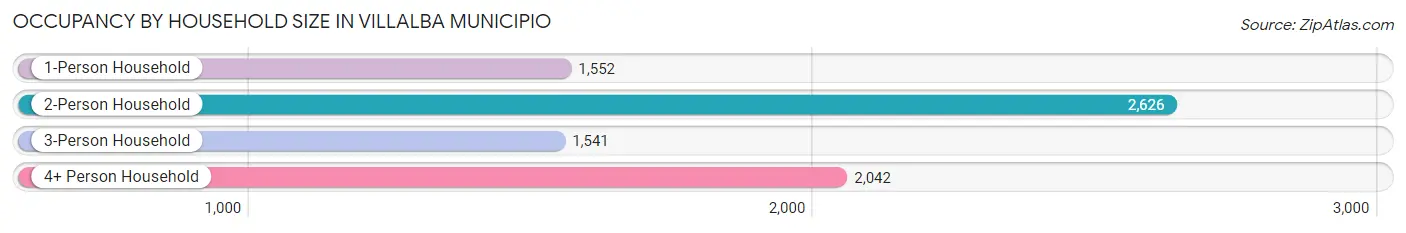
| Household Size | # Housing Units | % Housing Units |
| 1-Person Household | 1,552 | 20.0% |
| 2-Person Household | 2,626 | 33.8% |
| 3-Person Household | 1,541 | 19.9% |
| 4+ Person Household | 2,042 | 26.3% |
| Total Housing Units | 7,761 | 100.0% |
Occupancy by Ownership by Household Size in Villalba Municipio
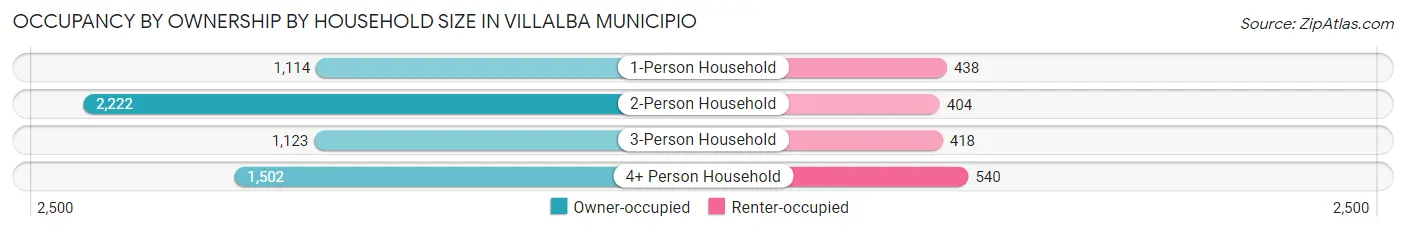
| Household Size | Owner-occupied | Renter-occupied |
| 1-Person Household | 1,114 (71.8%) | 438 (28.2%) |
| 2-Person Household | 2,222 (84.6%) | 404 (15.4%) |
| 3-Person Household | 1,123 (72.9%) | 418 (27.1%) |
| 4+ Person Household | 1,502 (73.6%) | 540 (26.4%) |
| Total Housing Units | 5,961 (76.8%) | 1,800 (23.2%) |
Occupancy by Educational Attainment in Villalba Municipio
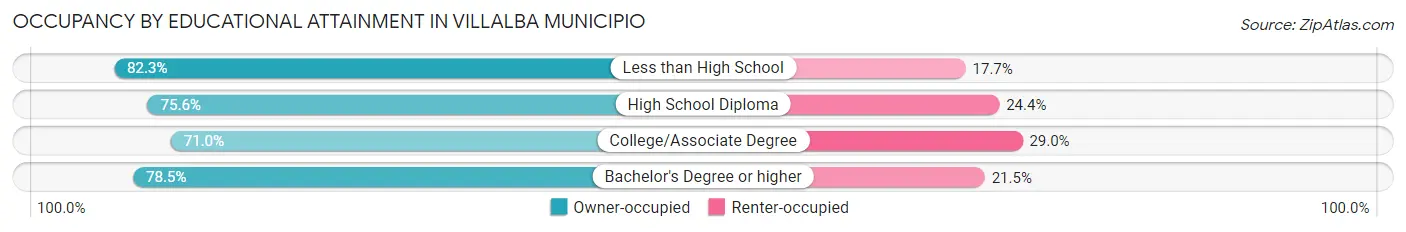
| Household Size | Owner-occupied | Renter-occupied |
| Less than High School | 1,489 (82.3%) | 321 (17.7%) |
| High School Diploma | 2,005 (75.6%) | 647 (24.4%) |
| College/Associate Degree | 1,158 (71.0%) | 473 (29.0%) |
| Bachelor's Degree or higher | 1,309 (78.5%) | 359 (21.5%) |
Occupancy by Age of Householder in Villalba Municipio
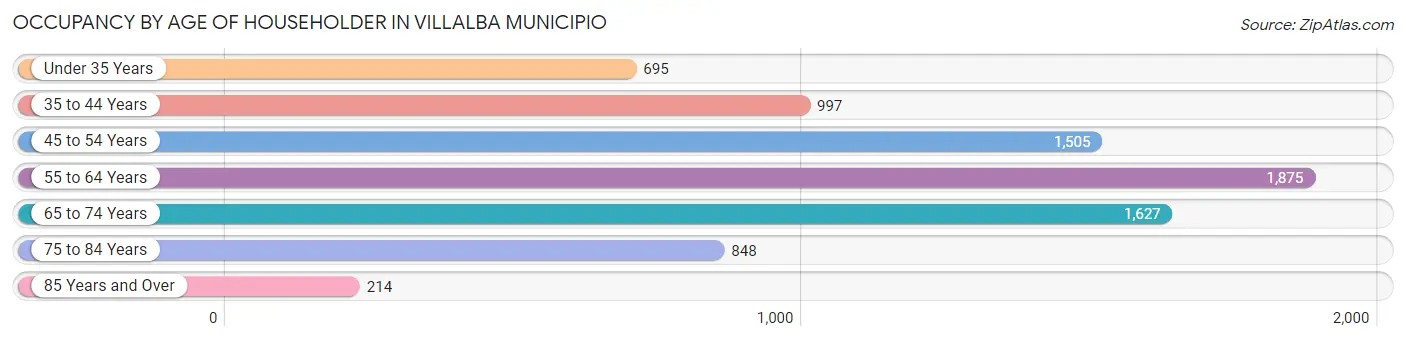
| Age Bracket | # Households | % Households |
| Under 35 Years | 695 | 9.0% |
| 35 to 44 Years | 997 | 12.9% |
| 45 to 54 Years | 1,505 | 19.4% |
| 55 to 64 Years | 1,875 | 24.2% |
| 65 to 74 Years | 1,627 | 21.0% |
| 75 to 84 Years | 848 | 10.9% |
| 85 Years and Over | 214 | 2.8% |
| Total | 7,761 | 100.0% |
Housing Finances in Villalba Municipio
Median Income by Occupancy in Villalba Municipio
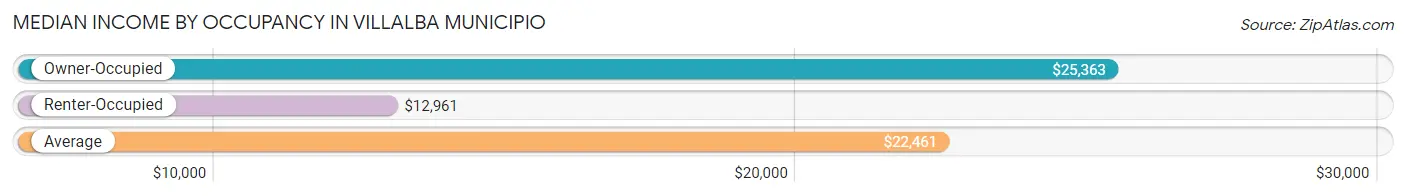
| Occupancy Type | # Households | Median Income |
| Owner-Occupied | 5,961 (76.8%) | $25,363 |
| Renter-Occupied | 1,800 (23.2%) | $12,961 |
| Average | 7,761 (100.0%) | $22,461 |
Occupancy by Householder Income Bracket in Villalba Municipio
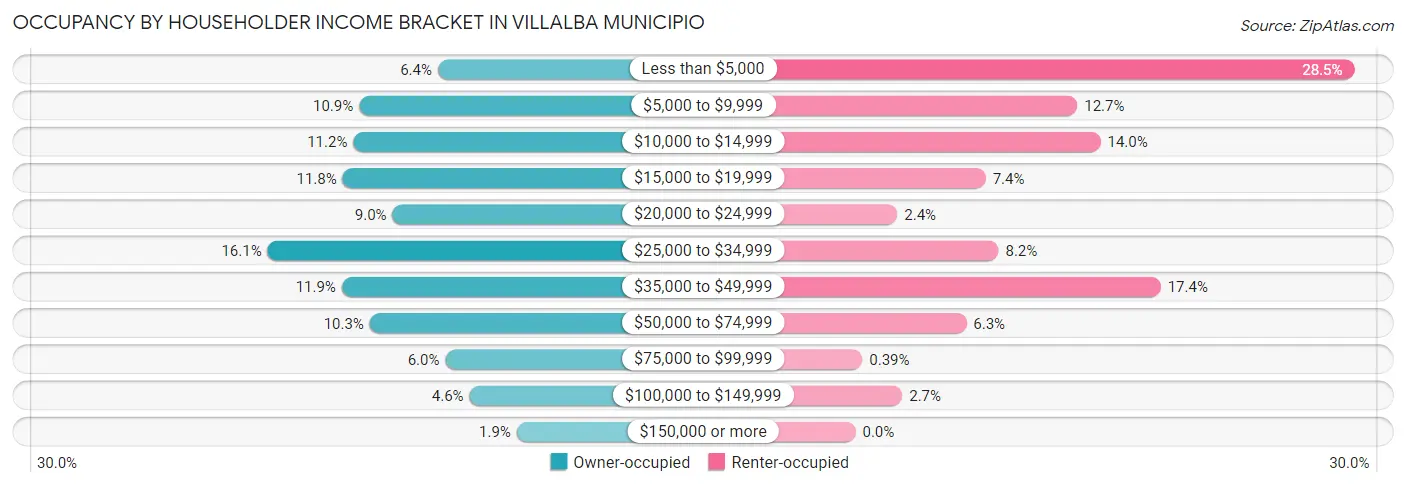
| Income Bracket | Owner-occupied | Renter-occupied |
| Less than $5,000 | 381 (6.4%) | 513 (28.5%) |
| $5,000 to $9,999 | 649 (10.9%) | 228 (12.7%) |
| $10,000 to $14,999 | 669 (11.2%) | 252 (14.0%) |
| $15,000 to $19,999 | 705 (11.8%) | 134 (7.4%) |
| $20,000 to $24,999 | 535 (9.0%) | 43 (2.4%) |
| $25,000 to $34,999 | 961 (16.1%) | 147 (8.2%) |
| $35,000 to $49,999 | 708 (11.9%) | 314 (17.4%) |
| $50,000 to $74,999 | 613 (10.3%) | 114 (6.3%) |
| $75,000 to $99,999 | 355 (6.0%) | 7 (0.4%) |
| $100,000 to $149,999 | 273 (4.6%) | 48 (2.7%) |
| $150,000 or more | 112 (1.9%) | 0 (0.0%) |
| Total | 5,961 (100.0%) | 1,800 (100.0%) |
Monthly Housing Cost Tiers in Villalba Municipio
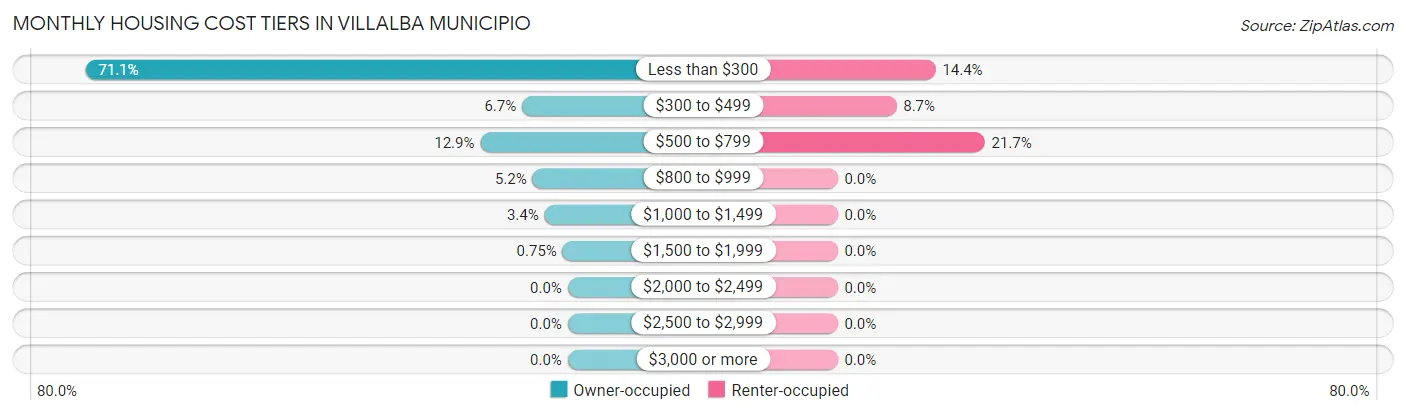
| Monthly Cost | Owner-occupied | Renter-occupied |
| Less than $300 | 4,235 (71.1%) | 260 (14.4%) |
| $300 to $499 | 401 (6.7%) | 156 (8.7%) |
| $500 to $799 | 768 (12.9%) | 390 (21.7%) |
| $800 to $999 | 308 (5.2%) | 0 (0.0%) |
| $1,000 to $1,499 | 204 (3.4%) | 0 (0.0%) |
| $1,500 to $1,999 | 45 (0.7%) | 0 (0.0%) |
| $2,000 to $2,499 | 0 (0.0%) | 0 (0.0%) |
| $2,500 to $2,999 | 0 (0.0%) | 0 (0.0%) |
| $3,000 or more | 0 (0.0%) | 0 (0.0%) |
| Total | 5,961 (100.0%) | 1,800 (100.0%) |
Physical Housing Characteristics in Villalba Municipio
Housing Structures in Villalba Municipio
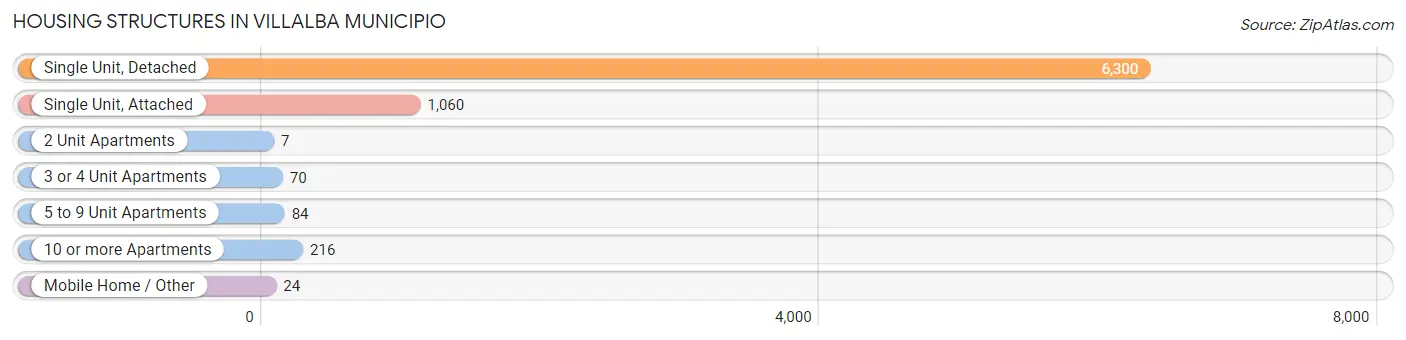
| Structure Type | # Housing Units | % Housing Units |
| Single Unit, Detached | 6,300 | 81.2% |
| Single Unit, Attached | 1,060 | 13.7% |
| 2 Unit Apartments | 7 | 0.1% |
| 3 or 4 Unit Apartments | 70 | 0.9% |
| 5 to 9 Unit Apartments | 84 | 1.1% |
| 10 or more Apartments | 216 | 2.8% |
| Mobile Home / Other | 24 | 0.3% |
| Total | 7,761 | 100.0% |
Housing Structures by Occupancy in Villalba Municipio
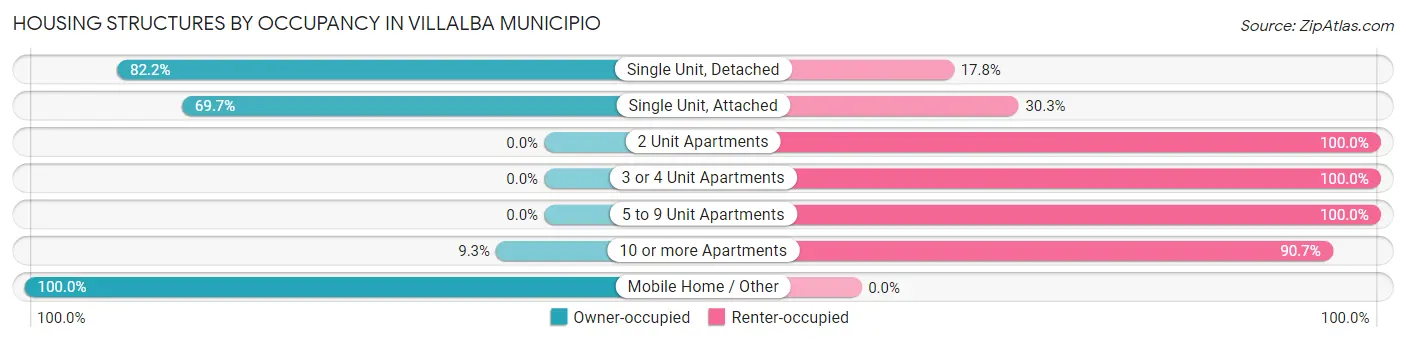
| Structure Type | Owner-occupied | Renter-occupied |
| Single Unit, Detached | 5,178 (82.2%) | 1,122 (17.8%) |
| Single Unit, Attached | 739 (69.7%) | 321 (30.3%) |
| 2 Unit Apartments | 0 (0.0%) | 7 (100.0%) |
| 3 or 4 Unit Apartments | 0 (0.0%) | 70 (100.0%) |
| 5 to 9 Unit Apartments | 0 (0.0%) | 84 (100.0%) |
| 10 or more Apartments | 20 (9.3%) | 196 (90.7%) |
| Mobile Home / Other | 24 (100.0%) | 0 (0.0%) |
| Total | 5,961 (76.8%) | 1,800 (23.2%) |
Housing Structures by Number of Rooms in Villalba Municipio
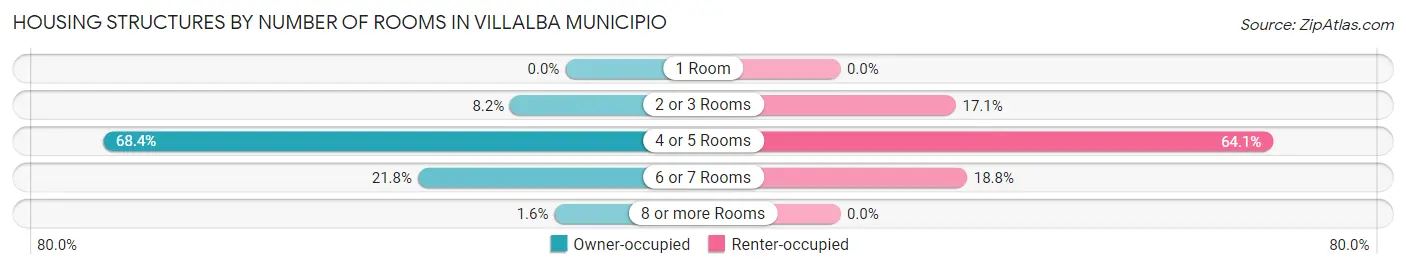
| Number of Rooms | Owner-occupied | Renter-occupied |
| 1 Room | 0 (0.0%) | 0 (0.0%) |
| 2 or 3 Rooms | 487 (8.2%) | 308 (17.1%) |
| 4 or 5 Rooms | 4,078 (68.4%) | 1,154 (64.1%) |
| 6 or 7 Rooms | 1,300 (21.8%) | 338 (18.8%) |
| 8 or more Rooms | 96 (1.6%) | 0 (0.0%) |
| Total | 5,961 (100.0%) | 1,800 (100.0%) |
Housing Structure by Heating Type in Villalba Municipio
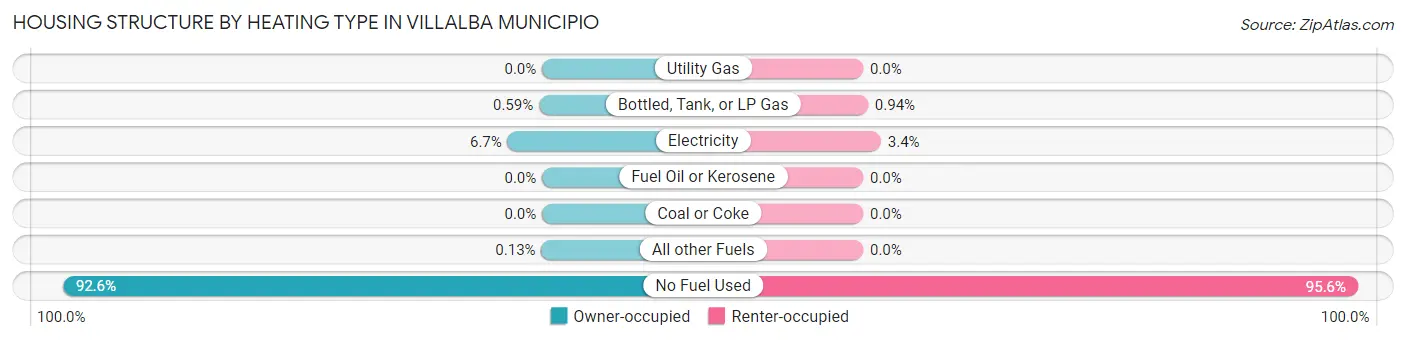
| Heating Type | Owner-occupied | Renter-occupied |
| Utility Gas | 0 (0.0%) | 0 (0.0%) |
| Bottled, Tank, or LP Gas | 35 (0.6%) | 17 (0.9%) |
| Electricity | 397 (6.7%) | 62 (3.4%) |
| Fuel Oil or Kerosene | 0 (0.0%) | 0 (0.0%) |
| Coal or Coke | 0 (0.0%) | 0 (0.0%) |
| All other Fuels | 8 (0.1%) | 0 (0.0%) |
| No Fuel Used | 5,521 (92.6%) | 1,721 (95.6%) |
| Total | 5,961 (100.0%) | 1,800 (100.0%) |
Household Vehicle Usage in Villalba Municipio
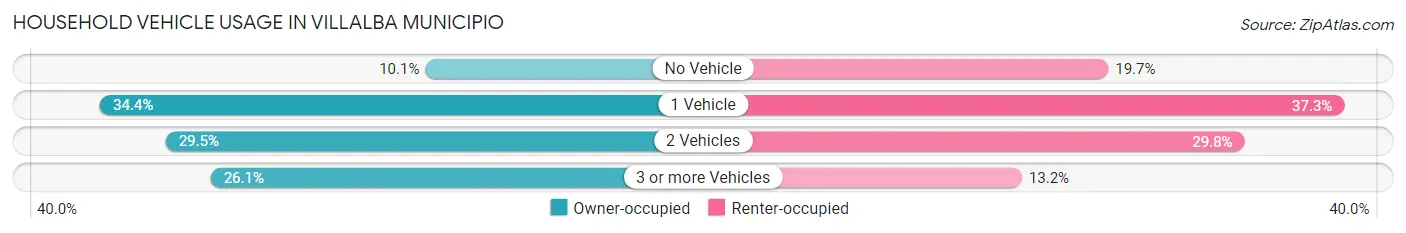
| Vehicles per Household | Owner-occupied | Renter-occupied |
| No Vehicle | 601 (10.1%) | 354 (19.7%) |
| 1 Vehicle | 2,048 (34.4%) | 671 (37.3%) |
| 2 Vehicles | 1,756 (29.5%) | 537 (29.8%) |
| 3 or more Vehicles | 1,556 (26.1%) | 238 (13.2%) |
| Total | 5,961 (100.0%) | 1,800 (100.0%) |
Real Estate & Mortgages in Villalba Municipio
Real Estate and Mortgage Overview in Villalba Municipio
| Characteristic | Without Mortgage | With Mortgage |
| Housing Units | 4,756 | 1,205 |
| Median Property Value | $94,300 | $142,300 |
| Median Household Income | $20,599 | $39 |
| Monthly Housing Costs | $146 | $0 |
| Real Estate Taxes | - | - |
Property Value by Mortgage Status in Villalba Municipio
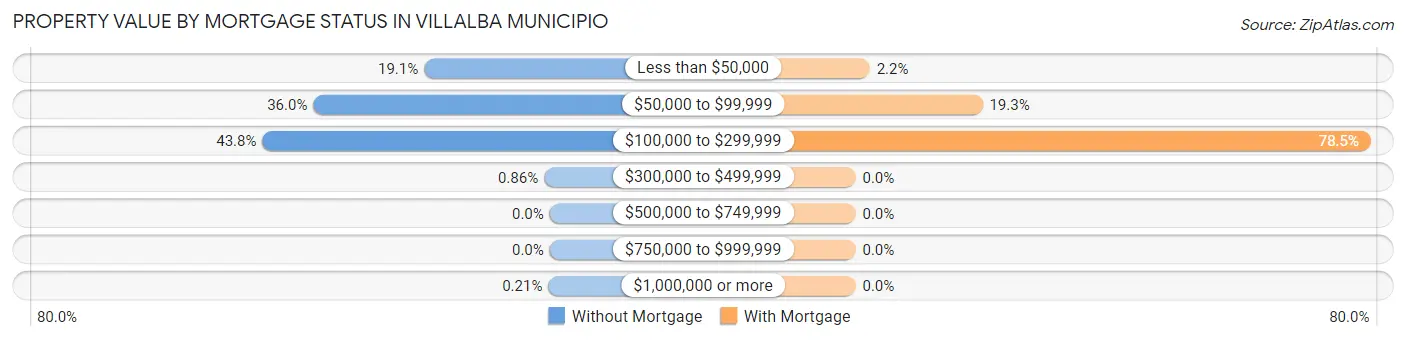
| Property Value | Without Mortgage | With Mortgage |
| Less than $50,000 | 910 (19.1%) | 26 (2.2%) |
| $50,000 to $99,999 | 1,713 (36.0%) | 233 (19.3%) |
| $100,000 to $299,999 | 2,082 (43.8%) | 946 (78.5%) |
| $300,000 to $499,999 | 41 (0.9%) | 0 (0.0%) |
| $500,000 to $749,999 | 0 (0.0%) | 0 (0.0%) |
| $750,000 to $999,999 | 0 (0.0%) | 0 (0.0%) |
| $1,000,000 or more | 10 (0.2%) | 0 (0.0%) |
| Total | 4,756 (100.0%) | 1,205 (100.0%) |
Household Income by Mortgage Status in Villalba Municipio
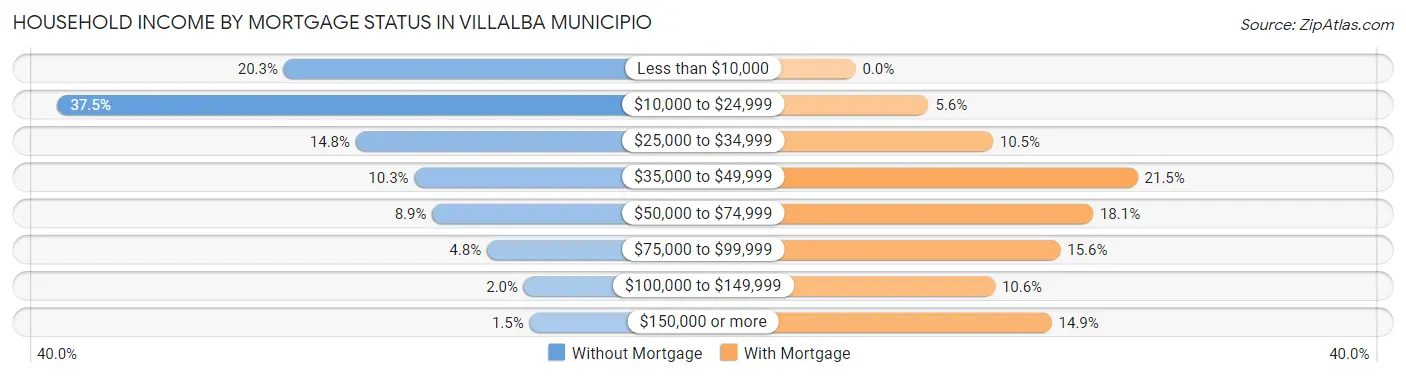
| Household Income | Without Mortgage | With Mortgage |
| Less than $10,000 | 963 (20.3%) | 0 (0.0%) |
| $10,000 to $24,999 | 1,783 (37.5%) | 67 (5.6%) |
| $25,000 to $34,999 | 702 (14.8%) | 126 (10.5%) |
| $35,000 to $49,999 | 490 (10.3%) | 259 (21.5%) |
| $50,000 to $74,999 | 425 (8.9%) | 218 (18.1%) |
| $75,000 to $99,999 | 227 (4.8%) | 188 (15.6%) |
| $100,000 to $149,999 | 93 (2.0%) | 128 (10.6%) |
| $150,000 or more | 73 (1.5%) | 180 (14.9%) |
| Total | 4,756 (100.0%) | 1,205 (100.0%) |
Property Value to Household Income Ratio in Villalba Municipio
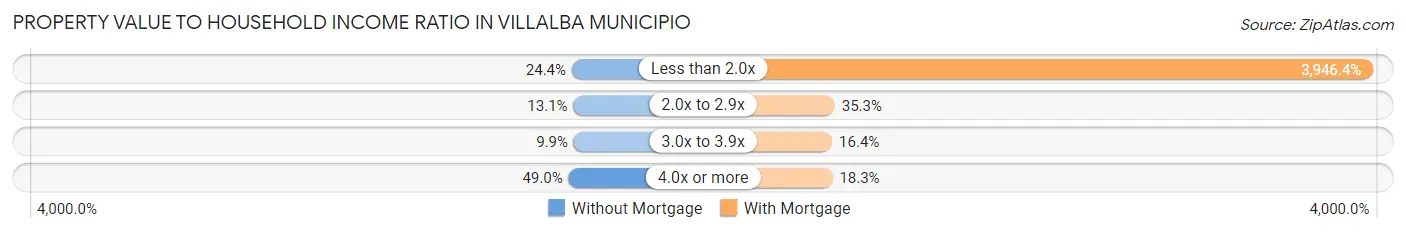
| Value-to-Income Ratio | Without Mortgage | With Mortgage |
| Less than 2.0x | 1,162 (24.4%) | 47,554 (3,946.4%) |
| 2.0x to 2.9x | 624 (13.1%) | 425 (35.3%) |
| 3.0x to 3.9x | 471 (9.9%) | 197 (16.4%) |
| 4.0x or more | 2,329 (49.0%) | 221 (18.3%) |
| Total | 4,756 (100.0%) | 1,205 (100.0%) |
Real Estate Taxes by Mortgage Status in Villalba Municipio
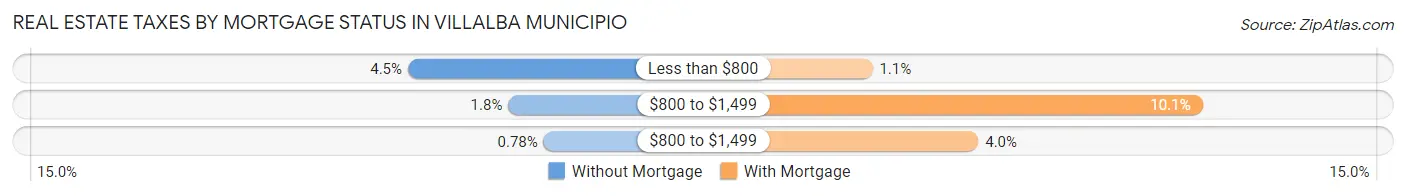
| Property Taxes | Without Mortgage | With Mortgage |
| Less than $800 | 214 (4.5%) | 13 (1.1%) |
| $800 to $1,499 | 83 (1.8%) | 122 (10.1%) |
| $800 to $1,499 | 37 (0.8%) | 48 (4.0%) |
| Total | 4,756 (100.0%) | 1,205 (100.0%) |
Health & Disability in Villalba Municipio
Health Insurance Coverage by Age in Villalba Municipio
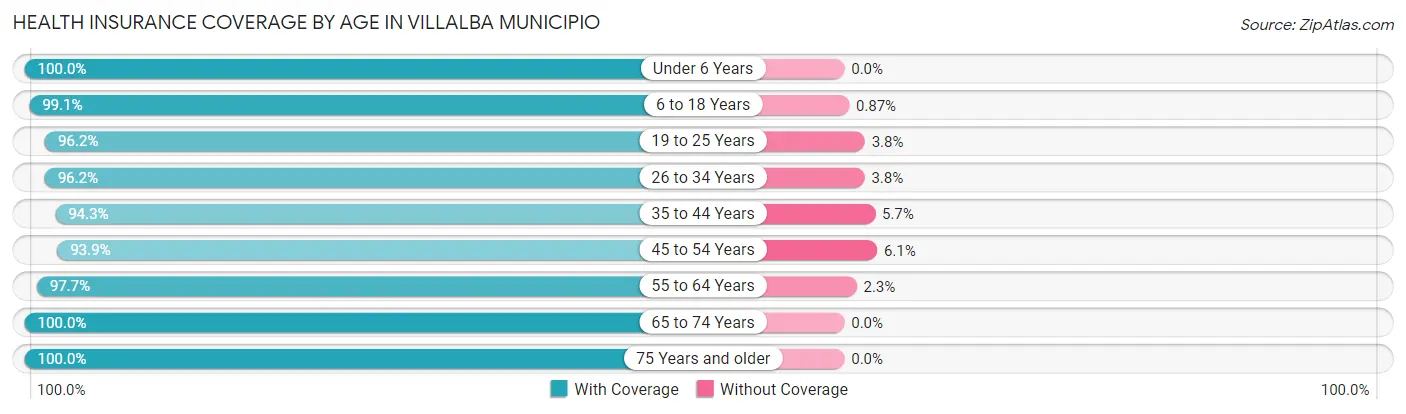
| Age Bracket | With Coverage | Without Coverage |
| Under 6 Years | 1,063 (100.0%) | 0 (0.0%) |
| 6 to 18 Years | 3,417 (99.1%) | 30 (0.9%) |
| 19 to 25 Years | 2,017 (96.2%) | 80 (3.8%) |
| 26 to 34 Years | 2,378 (96.2%) | 93 (3.8%) |
| 35 to 44 Years | 2,274 (94.3%) | 138 (5.7%) |
| 45 to 54 Years | 2,638 (93.9%) | 171 (6.1%) |
| 55 to 64 Years | 3,173 (97.7%) | 74 (2.3%) |
| 65 to 74 Years | 2,631 (100.0%) | 0 (0.0%) |
| 75 Years and older | 1,662 (100.0%) | 0 (0.0%) |
| Total | 21,253 (97.3%) | 586 (2.7%) |
Health Insurance Coverage by Citizenship Status in Villalba Municipio
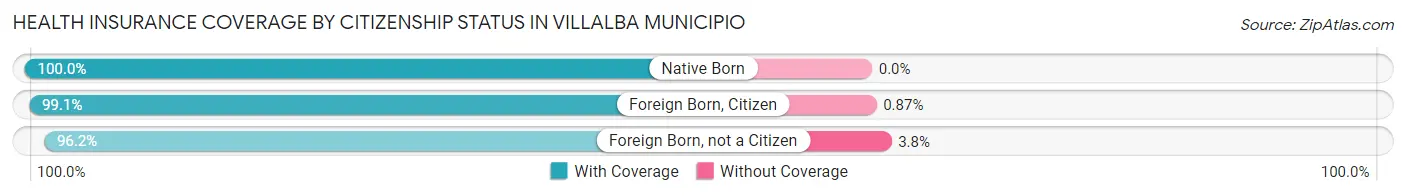
| Citizenship Status | With Coverage | Without Coverage |
| Native Born | 1,063 (100.0%) | 0 (0.0%) |
| Foreign Born, Citizen | 3,417 (99.1%) | 30 (0.9%) |
| Foreign Born, not a Citizen | 2,017 (96.2%) | 80 (3.8%) |
Health Insurance Coverage by Household Income in Villalba Municipio
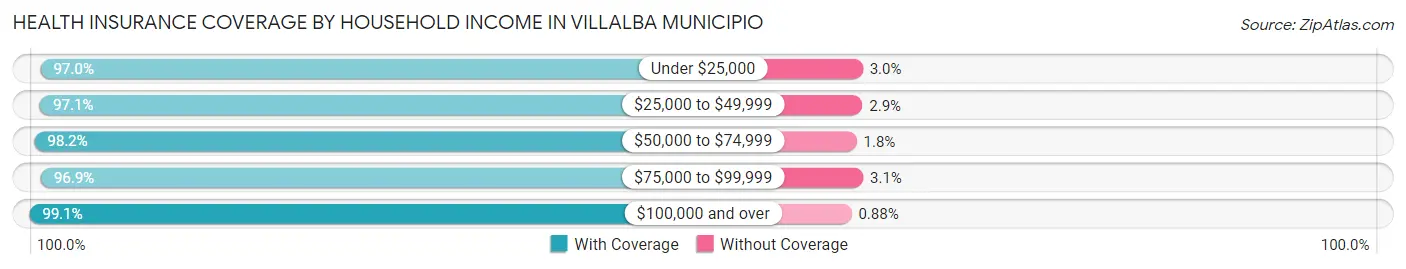
| Household Income | With Coverage | Without Coverage |
| Under $25,000 | 9,360 (97.0%) | 287 (3.0%) |
| $25,000 to $49,999 | 6,240 (97.1%) | 188 (2.9%) |
| $50,000 to $74,999 | 2,410 (98.2%) | 45 (1.8%) |
| $75,000 to $99,999 | 1,647 (96.9%) | 52 (3.1%) |
| $100,000 and over | 1,580 (99.1%) | 14 (0.9%) |
Public vs Private Health Insurance Coverage by Age in Villalba Municipio
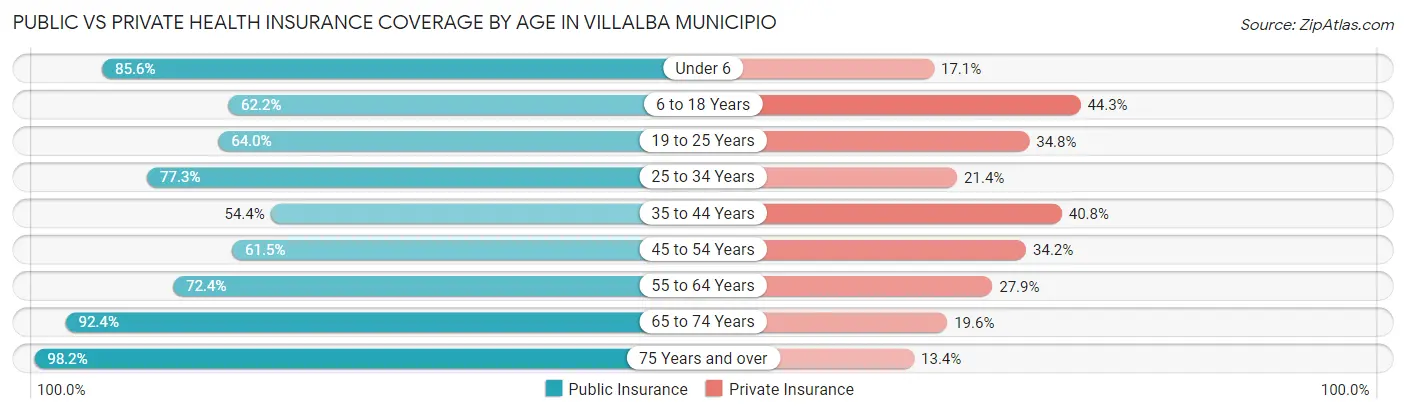
| Age Bracket | Public Insurance | Private Insurance |
| Under 6 | 910 (85.6%) | 182 (17.1%) |
| 6 to 18 Years | 2,145 (62.2%) | 1,527 (44.3%) |
| 19 to 25 Years | 1,343 (64.0%) | 730 (34.8%) |
| 25 to 34 Years | 1,909 (77.3%) | 529 (21.4%) |
| 35 to 44 Years | 1,311 (54.3%) | 985 (40.8%) |
| 45 to 54 Years | 1,727 (61.5%) | 961 (34.2%) |
| 55 to 64 Years | 2,352 (72.4%) | 907 (27.9%) |
| 65 to 74 Years | 2,431 (92.4%) | 515 (19.6%) |
| 75 Years and over | 1,632 (98.2%) | 223 (13.4%) |
| Total | 15,760 (72.2%) | 6,559 (30.0%) |
Disability Status by Sex by Age in Villalba Municipio
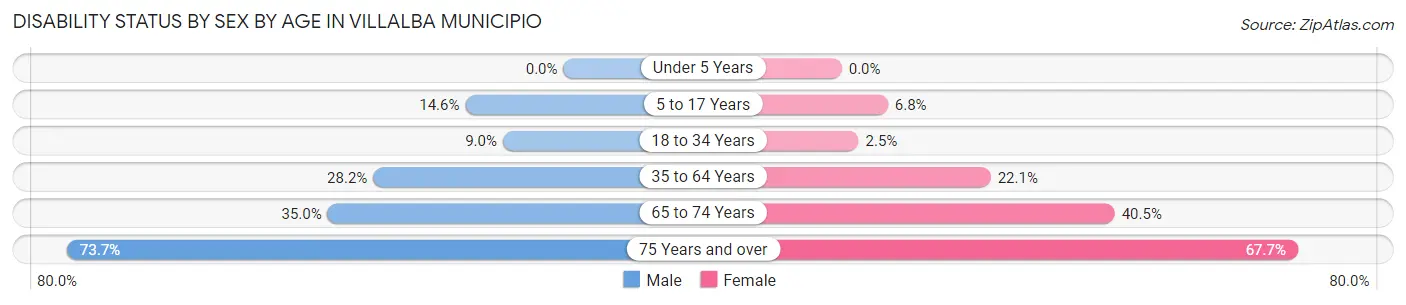
| Age Bracket | Male | Female |
| Under 5 Years | 0 (0.0%) | 0 (0.0%) |
| 5 to 17 Years | 241 (14.6%) | 111 (6.8%) |
| 18 to 34 Years | 219 (9.0%) | 61 (2.5%) |
| 35 to 64 Years | 1,134 (28.2%) | 985 (22.1%) |
| 65 to 74 Years | 435 (35.0%) | 563 (40.5%) |
| 75 Years and over | 513 (73.7%) | 654 (67.7%) |
Disability Class by Sex by Age in Villalba Municipio
Disability Class: Hearing Difficulty
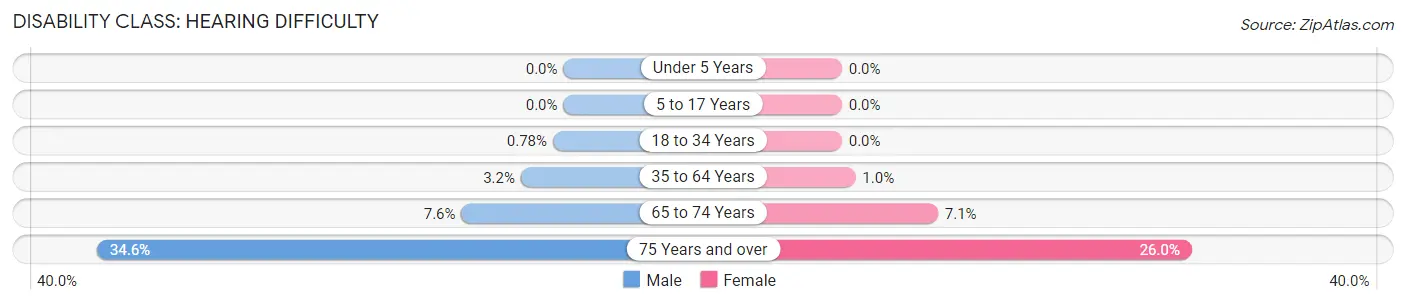
| Age Bracket | Male | Female |
| Under 5 Years | 0 (0.0%) | 0 (0.0%) |
| 5 to 17 Years | 0 (0.0%) | 0 (0.0%) |
| 18 to 34 Years | 19 (0.8%) | 0 (0.0%) |
| 35 to 64 Years | 127 (3.2%) | 45 (1.0%) |
| 65 to 74 Years | 94 (7.6%) | 99 (7.1%) |
| 75 Years and over | 241 (34.6%) | 251 (26.0%) |
Disability Class: Vision Difficulty
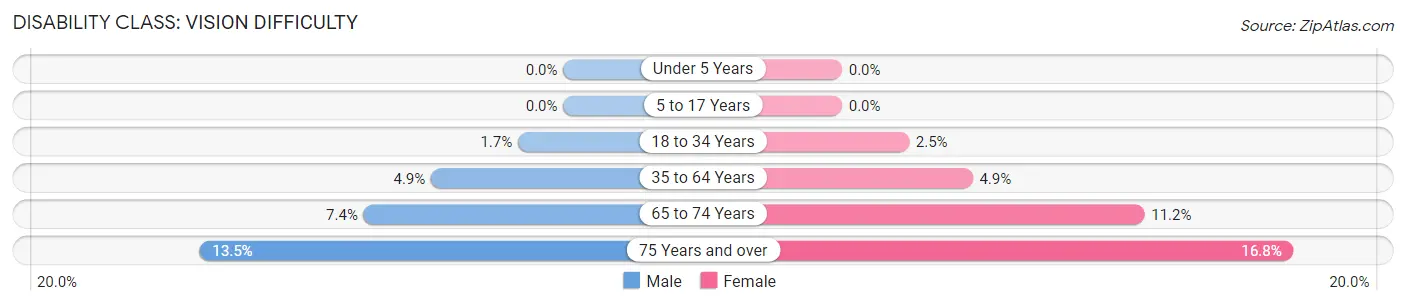
| Age Bracket | Male | Female |
| Under 5 Years | 0 (0.0%) | 0 (0.0%) |
| 5 to 17 Years | 0 (0.0%) | 0 (0.0%) |
| 18 to 34 Years | 41 (1.7%) | 61 (2.5%) |
| 35 to 64 Years | 197 (4.9%) | 216 (4.9%) |
| 65 to 74 Years | 92 (7.4%) | 156 (11.2%) |
| 75 Years and over | 94 (13.5%) | 162 (16.8%) |
Disability Class: Cognitive Difficulty
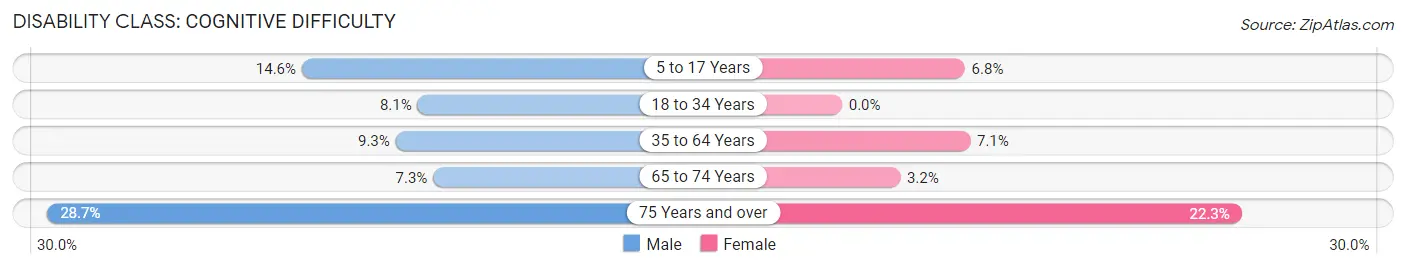
| Age Bracket | Male | Female |
| 5 to 17 Years | 241 (14.6%) | 111 (6.8%) |
| 18 to 34 Years | 198 (8.1%) | 0 (0.0%) |
| 35 to 64 Years | 375 (9.3%) | 318 (7.1%) |
| 65 to 74 Years | 90 (7.2%) | 45 (3.2%) |
| 75 Years and over | 200 (28.7%) | 215 (22.3%) |
Disability Class: Ambulatory Difficulty
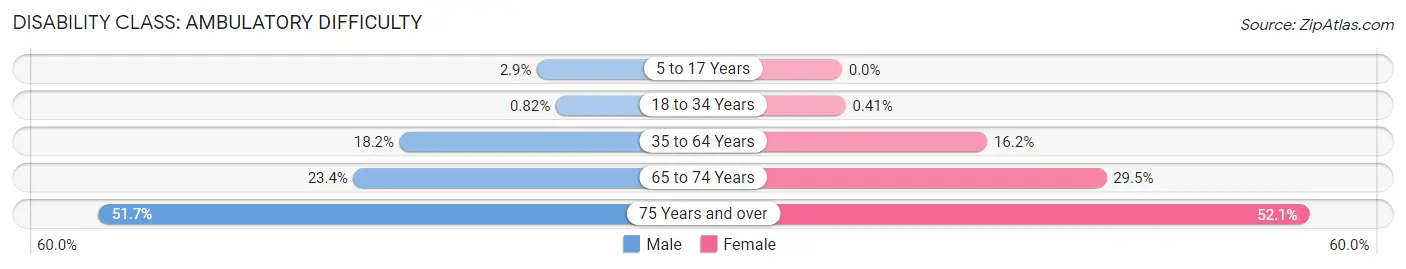
| Age Bracket | Male | Female |
| 5 to 17 Years | 48 (2.9%) | 0 (0.0%) |
| 18 to 34 Years | 20 (0.8%) | 10 (0.4%) |
| 35 to 64 Years | 731 (18.2%) | 720 (16.2%) |
| 65 to 74 Years | 290 (23.4%) | 409 (29.4%) |
| 75 Years and over | 360 (51.7%) | 503 (52.1%) |
Disability Class: Self-Care Difficulty
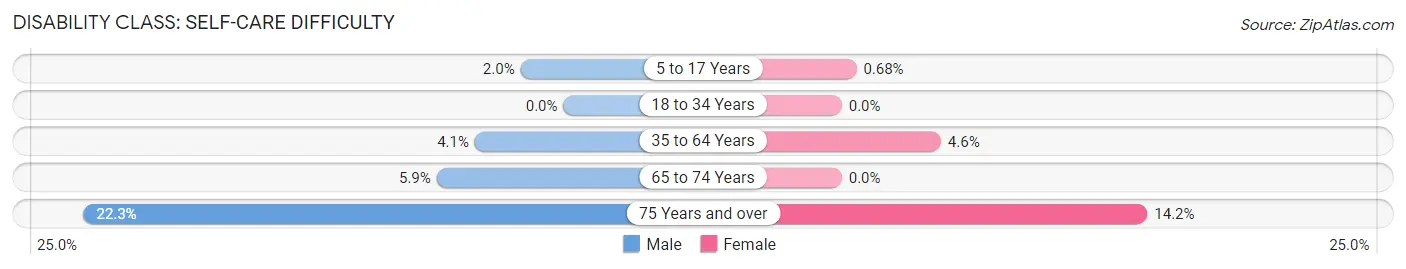
| Age Bracket | Male | Female |
| 5 to 17 Years | 33 (2.0%) | 11 (0.7%) |
| 18 to 34 Years | 0 (0.0%) | 0 (0.0%) |
| 35 to 64 Years | 165 (4.1%) | 205 (4.6%) |
| 65 to 74 Years | 73 (5.9%) | 0 (0.0%) |
| 75 Years and over | 155 (22.3%) | 137 (14.2%) |
Technology Access in Villalba Municipio
Computing Device Access in Villalba Municipio
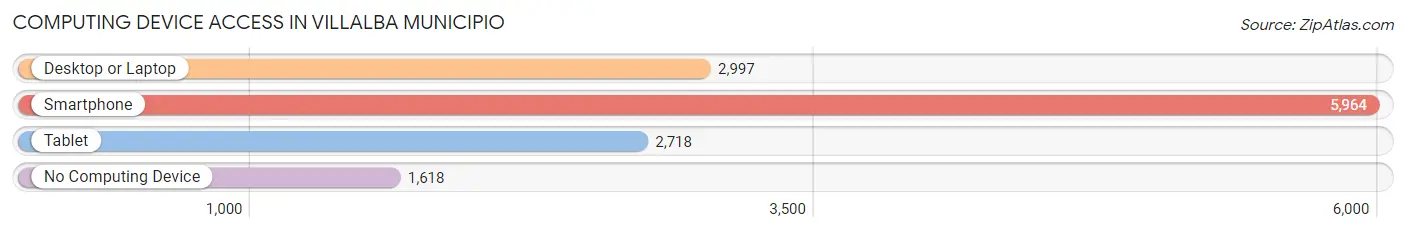
| Device Type | # Households | % Households |
| Desktop or Laptop | 2,997 | 38.6% |
| Smartphone | 5,964 | 76.8% |
| Tablet | 2,718 | 35.0% |
| No Computing Device | 1,618 | 20.8% |
| Total | 7,761 | 100.0% |
Internet Access in Villalba Municipio
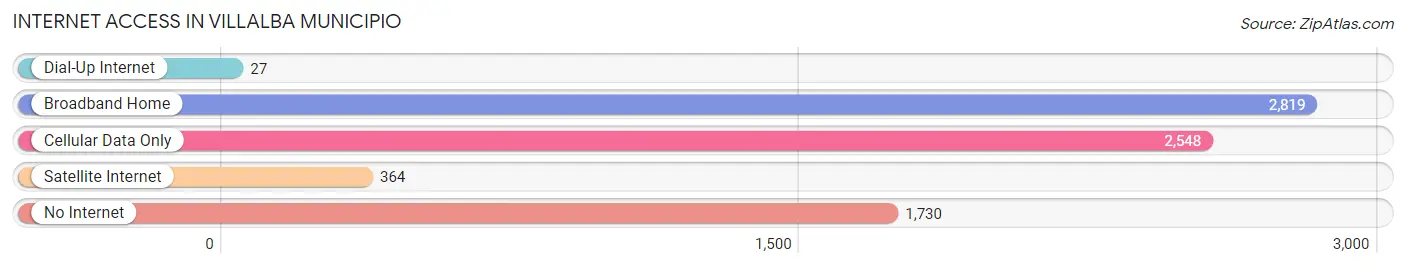
| Internet Type | # Households | % Households |
| Dial-Up Internet | 27 | 0.4% |
| Broadband Home | 2,819 | 36.3% |
| Cellular Data Only | 2,548 | 32.8% |
| Satellite Internet | 364 | 4.7% |
| No Internet | 1,730 | 22.3% |
| Total | 7,761 | 100.0% |
Villalba Municipio Summary
Villalba Municipio is a municipality located in the central region of Puerto Rico. It is part of the Ponce Metropolitan Statistical Area. The municipality is located in the central mountain range of the island, and is bordered by the municipalities of Coamo, Orocovis, Jayuya, and Ponce. As of the 2010 census, the population of Villalba was 28,845.
Geography
Villalba Municipio is located in the central mountain range of Puerto Rico, and is bordered by the municipalities of Coamo, Orocovis, Jayuya, and Ponce. The municipality covers an area of approximately 75 square miles, and is located at an elevation of 1,000 feet above sea level. The terrain is mostly mountainous, with some flat areas in the lower elevations. The highest point in the municipality is Cerro de Punta, which is located at an elevation of 3,087 feet.
The climate in Villalba Municipio is tropical, with temperatures ranging from the mid-70s to the mid-80s. The average annual precipitation is approximately 50 inches.
History
The area that is now Villalba Municipio was originally inhabited by the Taíno people. The first European settlers arrived in the area in the early 16th century, and the area was officially established as a municipality in 1878.
The economy of Villalba Municipio has traditionally been based on agriculture, with coffee, sugar cane, and tobacco being the main crops. In recent years, the economy has diversified to include manufacturing, tourism, and services.
Demographics
As of the 2010 census, the population of Villalba Municipio was 28,845, with a population density of 384.7 people per square mile. The racial makeup of the municipality was 79.3% White, 12.2% Black or African American, 0.3% Native American, 0.7% Asian, and 7.5% from other races. The median household income was $14,945, and the median family income was $17,945.
The largest ancestry groups in Villalba Municipio were Puerto Rican (77.3%), African (12.2%), and Spanish (7.5%). The primary language spoken in the municipality is Spanish, with English being the second most common language. The majority of the population is Roman Catholic (90.2%), with other religious affiliations including Protestant (7.2%), and other (2.6%).
Common Questions
What is Per Capita Income in Villalba Municipio?
Per Capita income in Villalba Municipio is $12,133.
What is the Median Family Income in Villalba Municipio?
Median Family Income in Villalba Municipio is $26,868.
What is the Median Household income in Villalba Municipio?
Median Household Income in Villalba Municipio is $22,461.
What is Income or Wage Gap in Villalba Municipio?
Income or Wage Gap in Villalba Municipio is 11.7%.
Women in Villalba Municipio earn 88.3 cents for every dollar earned by a man.
What is Family Income Deficit in Villalba Municipio?
Family Income Deficit in Villalba Municipio is $12,675.
Families that are below poverty line in Villalba Municipio earn $12,675 less on average than the poverty threshold level.
What is Inequality or Gini Index in Villalba Municipio?
Inequality or Gini Index in Villalba Municipio is 0.50.
What is the Total Population of Villalba Municipio?
Total Population of Villalba Municipio is 21,984.
What is the Total Male Population of Villalba Municipio?
Total Male Population of Villalba Municipio is 10,634.
What is the Total Female Population of Villalba Municipio?
Total Female Population of Villalba Municipio is 11,350.
What is the Ratio of Males per 100 Females in Villalba Municipio?
There are 93.69 Males per 100 Females in Villalba Municipio.
What is the Ratio of Females per 100 Males in Villalba Municipio?
There are 106.73 Females per 100 Males in Villalba Municipio.
What is the Median Population Age in Villalba Municipio?
Median Population Age in Villalba Municipio is 43.0 Years.
What is the Average Family Size in Villalba Municipio
Average Family Size in Villalba Municipio is 3.2 People.
What is the Average Household Size in Villalba Municipio
Average Household Size in Villalba Municipio is 2.8 People.
How Large is the Labor Force in Villalba Municipio?
There are 7,801 People in the Labor Forcein in Villalba Municipio.
What is the Percentage of People in the Labor Force in Villalba Municipio?
42.8% of People are in the Labor Force in Villalba Municipio.
What is the Unemployment Rate in Villalba Municipio?
Unemployment Rate in Villalba Municipio is 13.9%.