Vieques Municipio, PR Map & Demographics
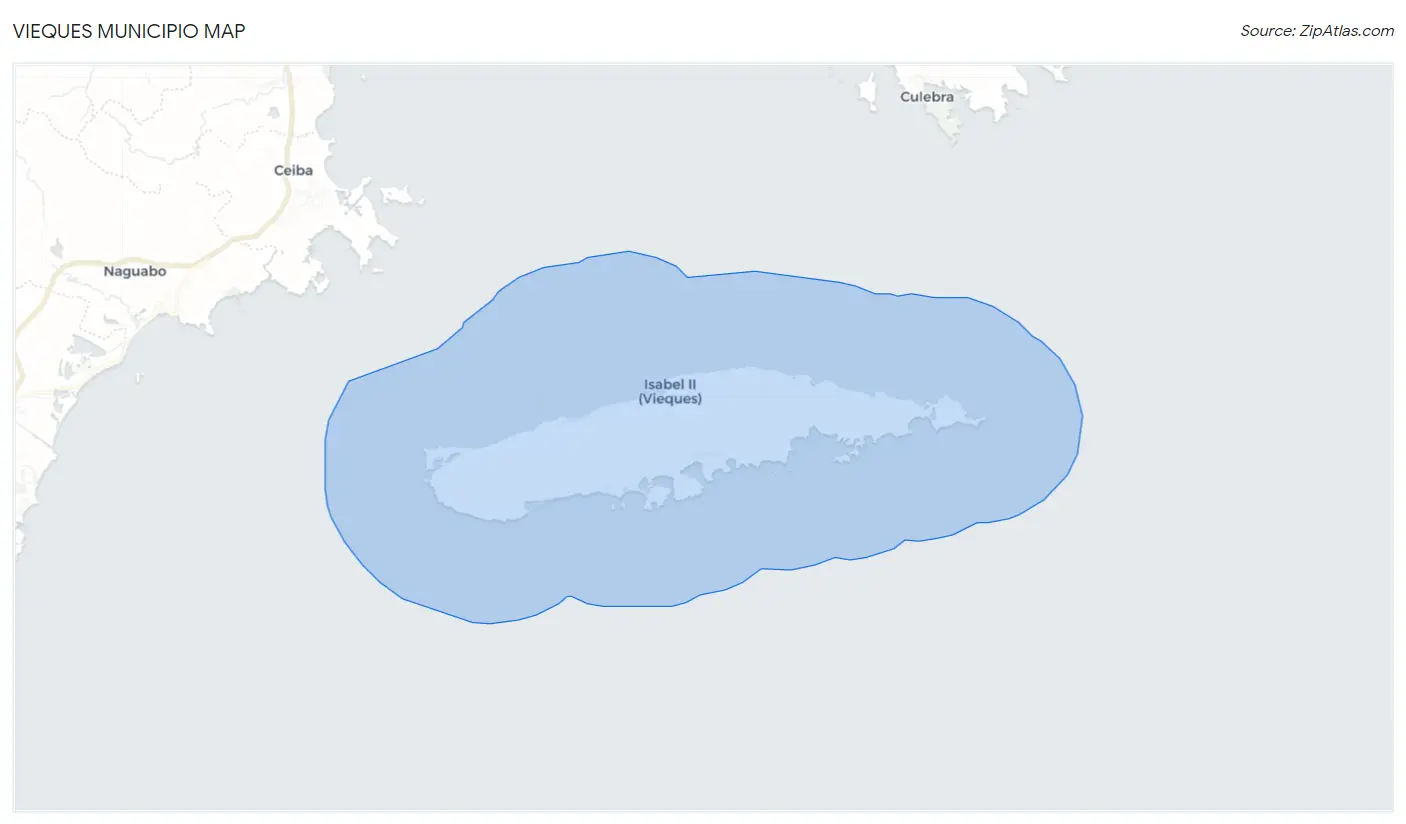
Vieques Municipio Map
Vieques Municipio Overview
$9,193
PER CAPITA INCOME
$20,134
AVG FAMILY INCOME
$17,062
AVG HOUSEHOLD INCOME
11.4%
WAGE / INCOME GAP [ % ]
88.6¢/ $1
WAGE / INCOME GAP [ $ ]
$11,244
FAMILY INCOME DEFICIT
0.42
INEQUALITY / GINI INDEX
8,199
TOTAL POPULATION
4,179
MALE POPULATION
4,020
FEMALE POPULATION
103.96
MALES / 100 FEMALES
96.20
FEMALES / 100 MALES
45.3
MEDIAN AGE
4.3
AVG FAMILY SIZE
3.1
AVG HOUSEHOLD SIZE
2,392
LABOR FORCE [ PEOPLE ]
34.6%
PERCENT IN LABOR FORCE
13.1%
UNEMPLOYMENT RATE
Vieques Municipio Area Codes
Income in Vieques Municipio
Income Overview in Vieques Municipio
Per Capita Income in Vieques Municipio is $9,193, while median incomes of families and households are $20,134 and $17,062 respectively.
| Characteristic | Number | Measure |
| Per Capita Income | 8,199 | $9,193 |
| Median Family Income | 1,588 | $20,134 |
| Mean Family Income | 1,588 | $23,382 |
| Median Household Income | 2,608 | $17,062 |
| Mean Household Income | 2,608 | $21,821 |
| Income Deficit | 1,588 | $11,244 |
| Wage / Income Gap (%) | 8,199 | 11.39% |
| Wage / Income Gap ($) | 8,199 | 88.61¢ per $1 |
| Gini / Inequality Index | 8,199 | 0.42 |
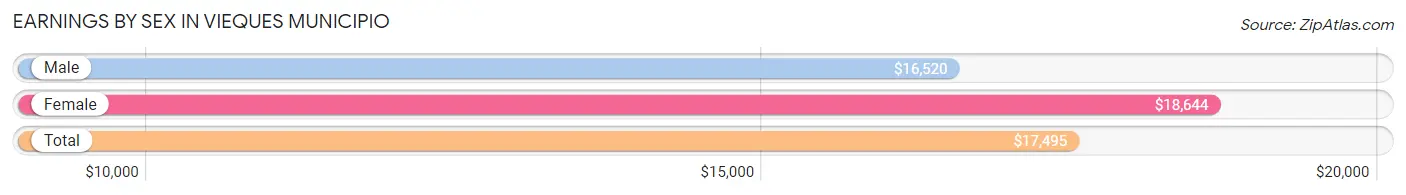
Earnings by Sex in Vieques Municipio
Average Earnings in Vieques Municipio are $17,495, $16,520 for men and $18,644 for women, a difference of 11.4%.
| Sex | Number | Average Earnings |
| Male | 1,592 (65.1%) | $16,520 |
| Female | 853 (34.9%) | $18,644 |
| Total | 2,445 (100.0%) | $17,495 |
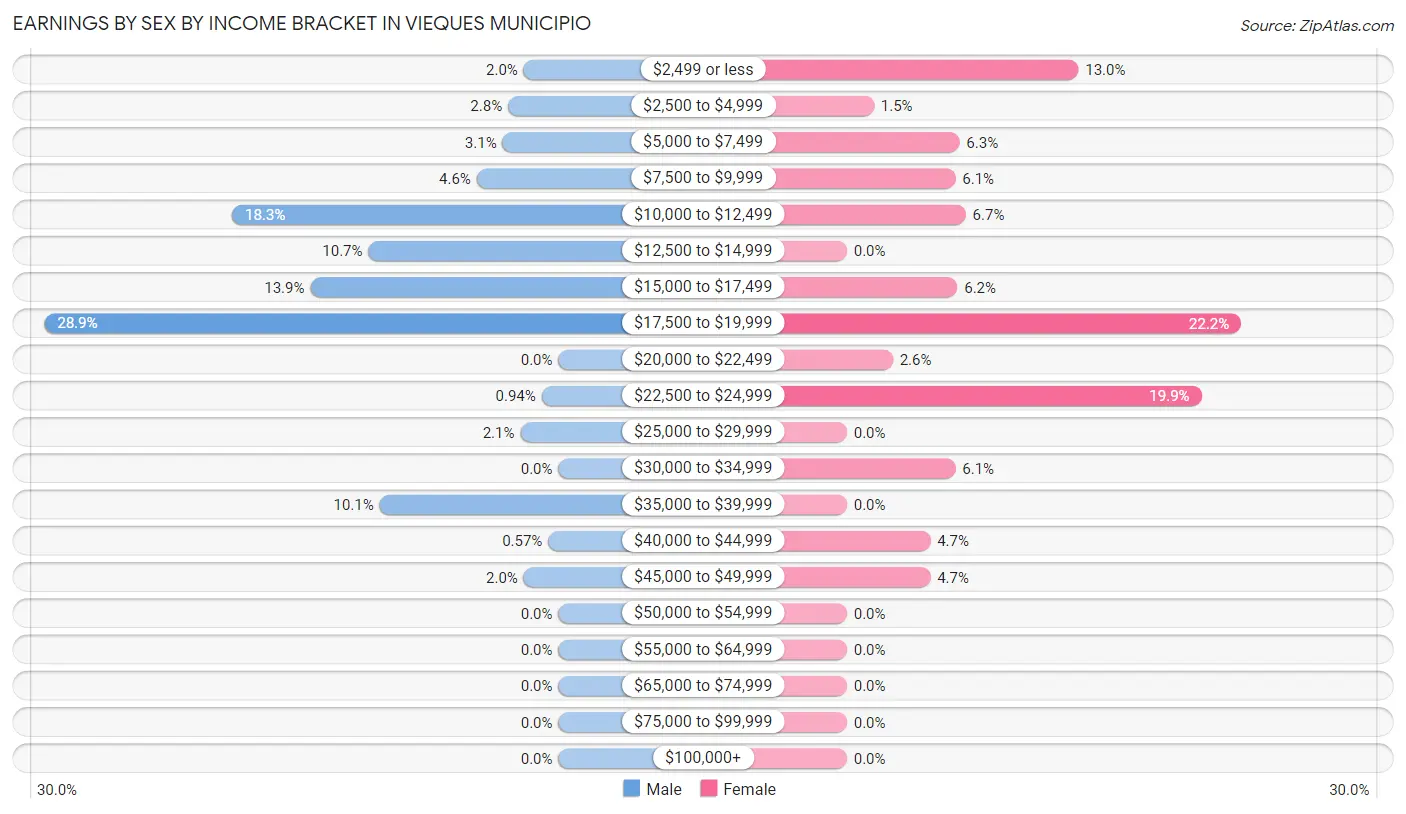
Earnings by Sex by Income Bracket in Vieques Municipio
The most common earnings brackets in Vieques Municipio are $17,500 to $19,999 for men (460 | 28.9%) and $17,500 to $19,999 for women (189 | 22.2%).
| Income | Male | Female |
| $2,499 or less | 31 (1.9%) | 111 (13.0%) |
| $2,500 to $4,999 | 45 (2.8%) | 13 (1.5%) |
| $5,000 to $7,499 | 50 (3.1%) | 54 (6.3%) |
| $7,500 to $9,999 | 73 (4.6%) | 52 (6.1%) |
| $10,000 to $12,499 | 292 (18.3%) | 57 (6.7%) |
| $12,500 to $14,999 | 170 (10.7%) | 0 (0.0%) |
| $15,000 to $17,499 | 222 (13.9%) | 53 (6.2%) |
| $17,500 to $19,999 | 460 (28.9%) | 189 (22.2%) |
| $20,000 to $22,499 | 0 (0.0%) | 22 (2.6%) |
| $22,500 to $24,999 | 15 (0.9%) | 170 (19.9%) |
| $25,000 to $29,999 | 34 (2.1%) | 0 (0.0%) |
| $30,000 to $34,999 | 0 (0.0%) | 52 (6.1%) |
| $35,000 to $39,999 | 160 (10.1%) | 0 (0.0%) |
| $40,000 to $44,999 | 9 (0.6%) | 40 (4.7%) |
| $45,000 to $49,999 | 31 (1.9%) | 40 (4.7%) |
| $50,000 to $54,999 | 0 (0.0%) | 0 (0.0%) |
| $55,000 to $64,999 | 0 (0.0%) | 0 (0.0%) |
| $65,000 to $74,999 | 0 (0.0%) | 0 (0.0%) |
| $75,000 to $99,999 | 0 (0.0%) | 0 (0.0%) |
| $100,000+ | 0 (0.0%) | 0 (0.0%) |
| Total | 1,592 (100.0%) | 853 (100.0%) |
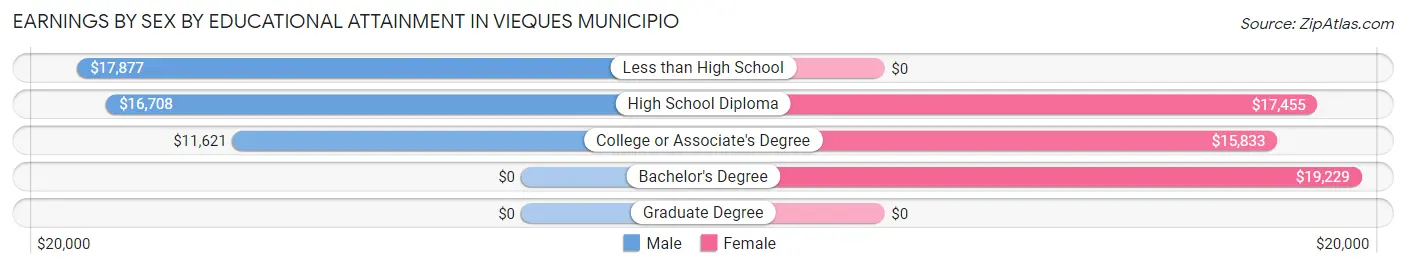
Earnings by Sex by Educational Attainment in Vieques Municipio
Average earnings in Vieques Municipio are $16,149 for men and $18,763 for women, a difference of 13.9%. Men with an educational attainment of less than high school enjoy the highest average annual earnings of $17,877, while those with college or associate's degree education earn the least with $11,621. Women with an educational attainment of bachelor's degree earn the most with the average annual earnings of $19,229, while those with college or associate's degree education have the smallest earnings of $15,833.
| Educational Attainment | Male Income | Female Income |
| Less than High School | $17,877 | $0 |
| High School Diploma | $16,708 | $17,455 |
| College or Associate's Degree | $11,621 | $15,833 |
| Bachelor's Degree | - | - |
| Graduate Degree | - | - |
| Total | $16,149 | $18,763 |
Family Income in Vieques Municipio
Family Income Brackets in Vieques Municipio
According to the Vieques Municipio family income data, there are 472 families falling into the $15,000 to $24,999 income range, which is the most common income bracket and makes up 29.7% of all families.
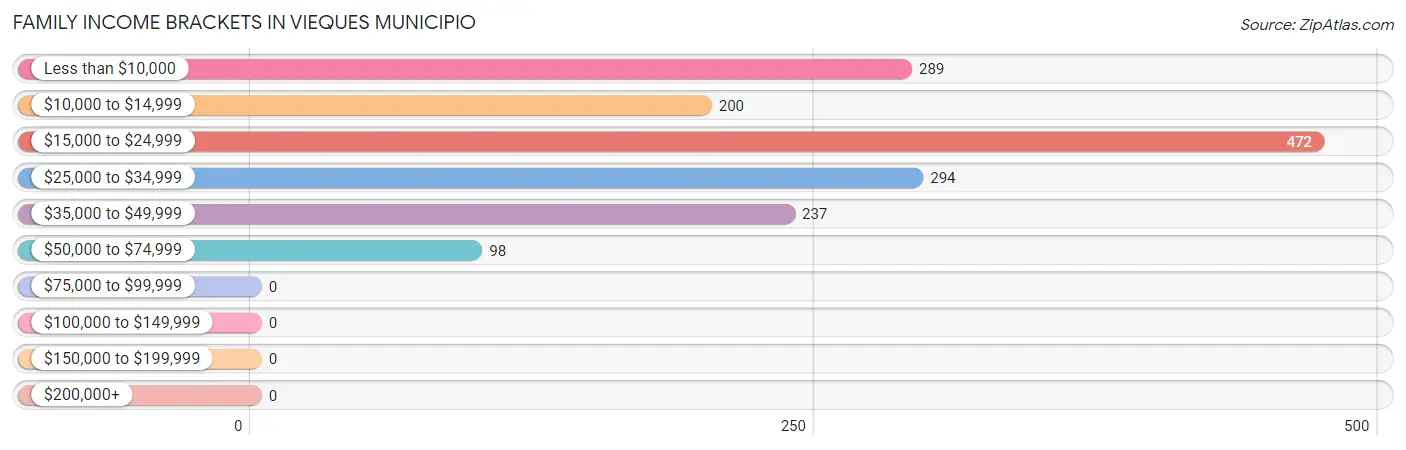
| Income Bracket | # Families | % Families |
| Less than $10,000 | 289 | 18.2% |
| $10,000 to $14,999 | 200 | 12.6% |
| $15,000 to $24,999 | 472 | 29.7% |
| $25,000 to $34,999 | 294 | 18.5% |
| $35,000 to $49,999 | 237 | 14.9% |
| $50,000 to $74,999 | 98 | 6.2% |
| $75,000 to $99,999 | 0 | 0.0% |
| $100,000 to $149,999 | 0 | 0.0% |
| $150,000 to $199,999 | 0 | 0.0% |
| $200,000+ | 0 | 0.0% |
Family Income by Famaliy Size in Vieques Municipio
2-person families (1,054 | 66.4%) account for the highest median family income in Vieques Municipio with $20,940 per family, while 2-person families (1,054 | 66.4%) have the highest median income of $10,470 per family member.
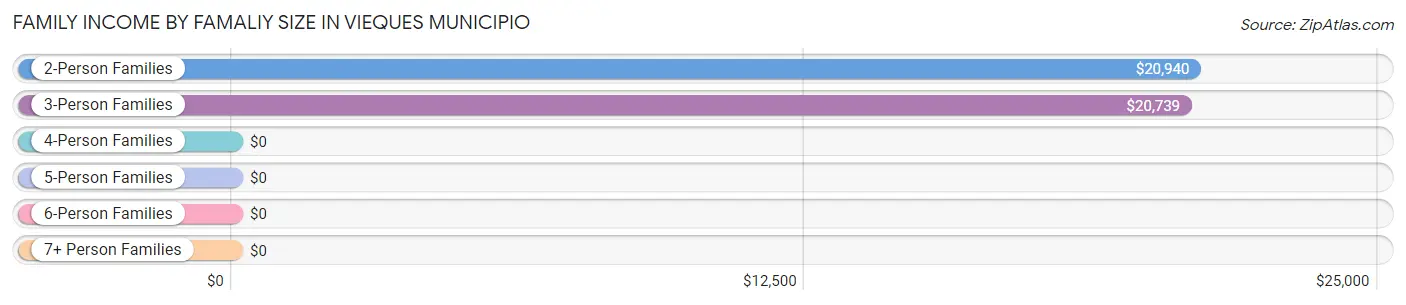
| Income Bracket | # Families | Median Income |
| 2-Person Families | 1,054 (66.4%) | $20,940 |
| 3-Person Families | 293 (18.4%) | $20,739 |
| 4-Person Families | 146 (9.2%) | $0 |
| 5-Person Families | 76 (4.8%) | $0 |
| 6-Person Families | 0 (0.0%) | $0 |
| 7+ Person Families | 19 (1.2%) | $0 |
| Total | 1,588 (100.0%) | $20,134 |
Family Income by Number of Earners in Vieques Municipio
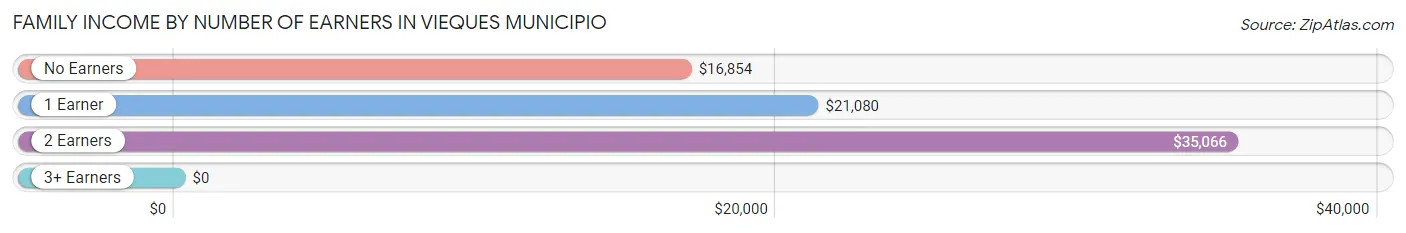
| Number of Earners | # Families | Median Income |
| No Earners | 767 (48.3%) | $16,854 |
| 1 Earner | 717 (45.2%) | $21,080 |
| 2 Earners | 92 (5.8%) | $35,066 |
| 3+ Earners | 12 (0.8%) | $0 |
| Total | 1,588 (100.0%) | $20,134 |
Household Income in Vieques Municipio
Household Income Brackets in Vieques Municipio
With 876 households falling in the category, the $15,000 to $24,999 income range is the most frequent in Vieques Municipio, accounting for 33.6% of all households.
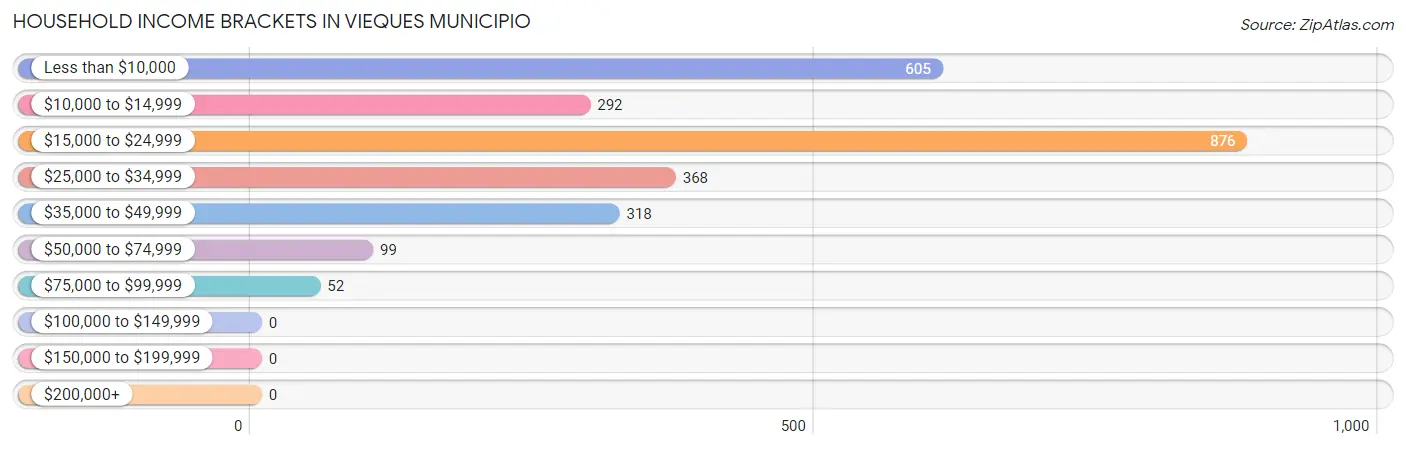
| Income Bracket | # Households | % Households |
| Less than $10,000 | 605 | 23.2% |
| $10,000 to $14,999 | 292 | 11.2% |
| $15,000 to $24,999 | 876 | 33.6% |
| $25,000 to $34,999 | 368 | 14.1% |
| $35,000 to $49,999 | 318 | 12.2% |
| $50,000 to $74,999 | 99 | 3.8% |
| $75,000 to $99,999 | 52 | 2.0% |
| $100,000 to $149,999 | 0 | 0.0% |
| $150,000 to $199,999 | 0 | 0.0% |
| $200,000+ | 0 | 0.0% |
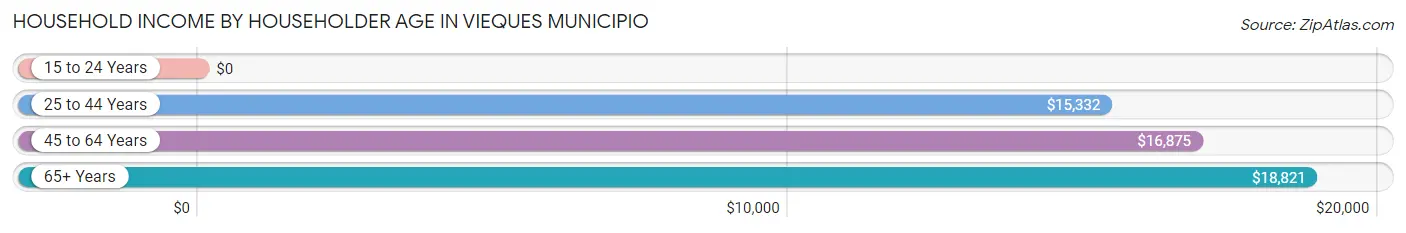
Household Income by Householder Age in Vieques Municipio
The median household income in Vieques Municipio is $17,062, with the highest median household income of $18,821 found in the 65+ years age bracket for the primary householder. A total of 1,156 households (44.3%) fall into this category. Meanwhile, the 15 to 24 years age bracket for the primary householder has the lowest median household income of $0, with 38 households (1.5%) in this group.
| Income Bracket | # Households | Median Income |
| 15 to 24 Years | 38 (1.5%) | $0 |
| 25 to 44 Years | 377 (14.5%) | $15,332 |
| 45 to 64 Years | 1,037 (39.8%) | $16,875 |
| 65+ Years | 1,156 (44.3%) | $18,821 |
| Total | 2,608 (100.0%) | $17,062 |
Poverty in Vieques Municipio
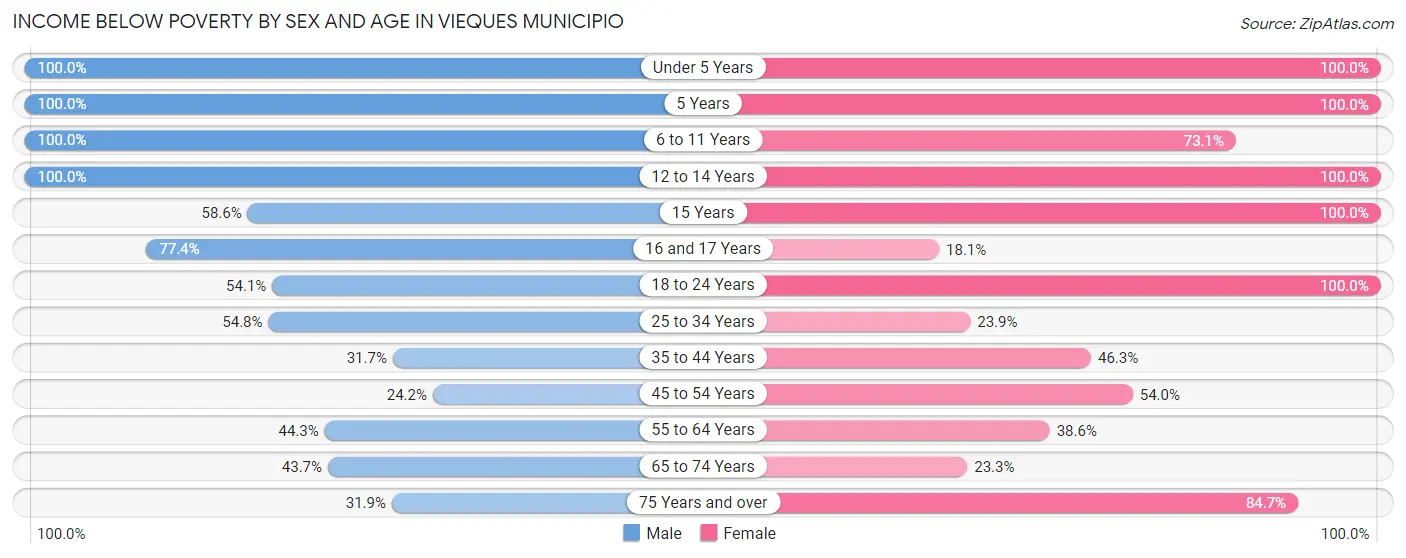
Income Below Poverty by Sex and Age in Vieques Municipio
With 50.6% poverty level for males and 57.7% for females among the residents of Vieques Municipio, under 5 year old males and under 5 year old females are the most vulnerable to poverty, with 211 males (100.0%) and 110 females (100.0%) in their respective age groups living below the poverty level.
| Age Bracket | Male | Female |
| Under 5 Years | 211 (100.0%) | 110 (100.0%) |
| 5 Years | 77 (100.0%) | 46 (100.0%) |
| 6 to 11 Years | 206 (100.0%) | 234 (73.1%) |
| 12 to 14 Years | 136 (100.0%) | 109 (100.0%) |
| 15 Years | 17 (58.6%) | 43 (100.0%) |
| 16 and 17 Years | 89 (77.4%) | 13 (18.1%) |
| 18 to 24 Years | 160 (54.0%) | 412 (100.0%) |
| 25 to 34 Years | 265 (54.7%) | 62 (23.8%) |
| 35 to 44 Years | 209 (31.7%) | 217 (46.3%) |
| 45 to 54 Years | 87 (24.2%) | 296 (54.0%) |
| 55 to 64 Years | 296 (44.3%) | 242 (38.6%) |
| 65 to 74 Years | 233 (43.7%) | 120 (23.3%) |
| 75 Years and over | 129 (31.9%) | 414 (84.7%) |
| Total | 2,115 (50.6%) | 2,318 (57.7%) |
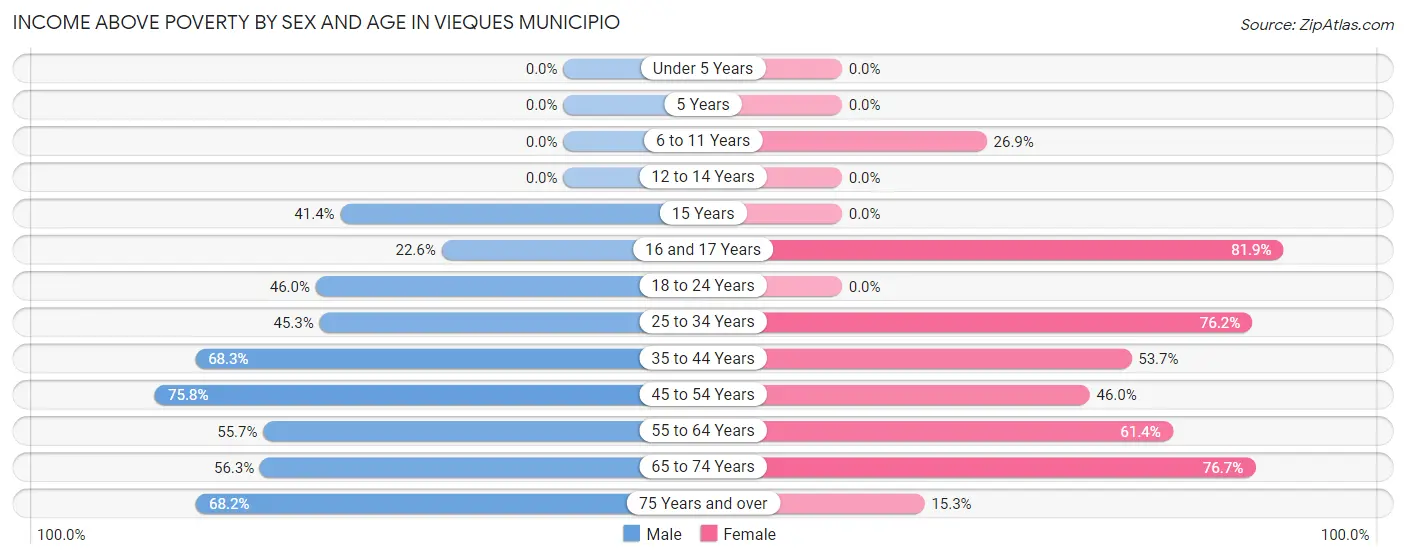
Income Above Poverty by Sex and Age in Vieques Municipio
According to the poverty statistics in Vieques Municipio, males aged 45 to 54 years and females aged 16 and 17 years are the age groups that are most secure financially, with 75.8% of males and 81.9% of females in these age groups living above the poverty line.
| Age Bracket | Male | Female |
| Under 5 Years | 0 (0.0%) | 0 (0.0%) |
| 5 Years | 0 (0.0%) | 0 (0.0%) |
| 6 to 11 Years | 0 (0.0%) | 86 (26.9%) |
| 12 to 14 Years | 0 (0.0%) | 0 (0.0%) |
| 15 Years | 12 (41.4%) | 0 (0.0%) |
| 16 and 17 Years | 26 (22.6%) | 59 (81.9%) |
| 18 to 24 Years | 136 (46.0%) | 0 (0.0%) |
| 25 to 34 Years | 219 (45.3%) | 198 (76.1%) |
| 35 to 44 Years | 451 (68.3%) | 252 (53.7%) |
| 45 to 54 Years | 272 (75.8%) | 252 (46.0%) |
| 55 to 64 Years | 372 (55.7%) | 385 (61.4%) |
| 65 to 74 Years | 300 (56.3%) | 395 (76.7%) |
| 75 Years and over | 276 (68.1%) | 75 (15.3%) |
| Total | 2,064 (49.4%) | 1,702 (42.3%) |
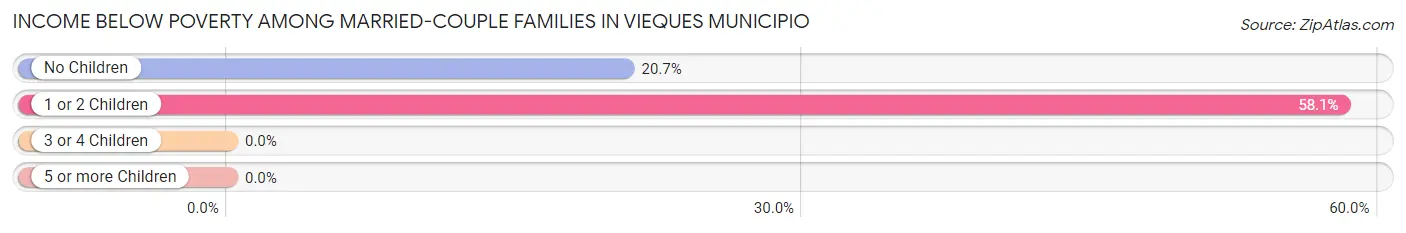
Income Below Poverty Among Married-Couple Families in Vieques Municipio
The poverty statistics for married-couple families in Vieques Municipio show that 25.9% or 196 of the total 757 families live below the poverty line. Families with 1 or 2 children have the highest poverty rate of 58.1%, comprising of 61 families. On the other hand, families with no children have the lowest poverty rate of 20.7%, which includes 135 families.
| Children | Above Poverty | Below Poverty |
| No Children | 517 (79.3%) | 135 (20.7%) |
| 1 or 2 Children | 44 (41.9%) | 61 (58.1%) |
| 3 or 4 Children | 0 (0.0%) | 0 (0.0%) |
| 5 or more Children | 0 (0.0%) | 0 (0.0%) |
| Total | 561 (74.1%) | 196 (25.9%) |
Income Below Poverty Among Single-Parent Households in Vieques Municipio
According to the poverty data in Vieques Municipio, 62.2% or 110 single-father households and 72.2% or 472 single-mother households are living below the poverty line. Among single-father households, those with 1 or 2 children have the highest poverty rate, with 24 households (100.0%) experiencing poverty. Likewise, among single-mother households, those with 3 or 4 children have the highest poverty rate, with 70 households (100.0%) falling below the poverty line.
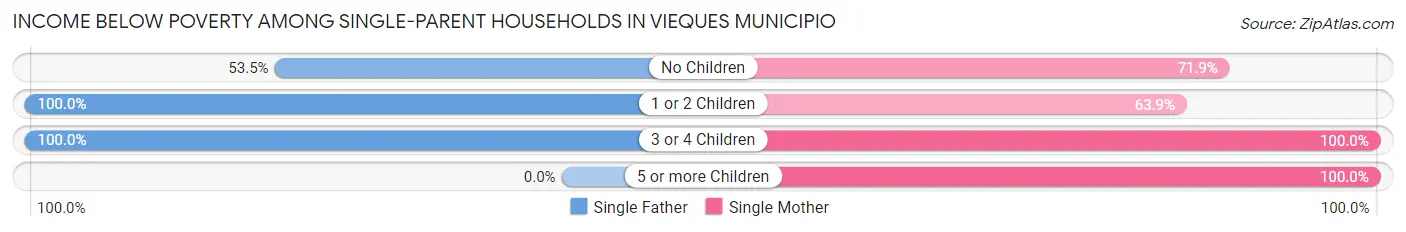
| Children | Single Father | Single Mother |
| No Children | 77 (53.5%) | 197 (71.9%) |
| 1 or 2 Children | 24 (100.0%) | 186 (63.9%) |
| 3 or 4 Children | 9 (100.0%) | 70 (100.0%) |
| 5 or more Children | 0 (0.0%) | 19 (100.0%) |
| Total | 110 (62.2%) | 472 (72.2%) |
Income Below Poverty Among Married-Couple vs Single-Parent Households in Vieques Municipio
The poverty data for Vieques Municipio shows that 196 of the married-couple family households (25.9%) and 582 of the single-parent households (70.0%) are living below the poverty level. Within the married-couple family households, those with 1 or 2 children have the highest poverty rate, with 61 households (58.1%) falling below the poverty line. Among the single-parent households, those with 3 or 4 children have the highest poverty rate, with 79 household (100.0%) living below poverty.
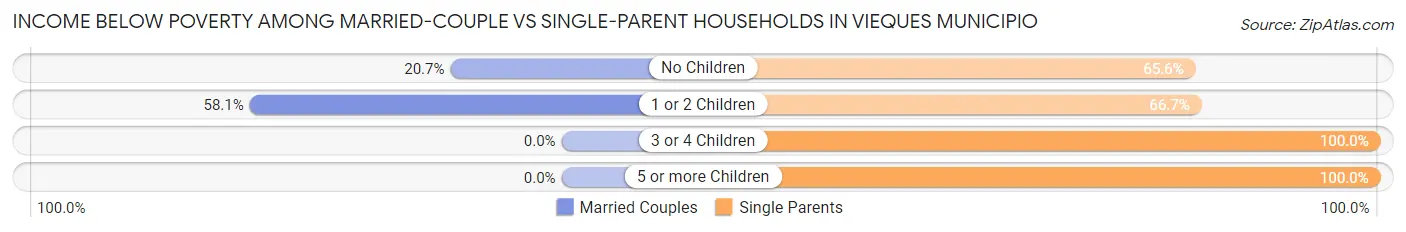
| Children | Married-Couple Families | Single-Parent Households |
| No Children | 135 (20.7%) | 274 (65.5%) |
| 1 or 2 Children | 61 (58.1%) | 210 (66.7%) |
| 3 or 4 Children | 0 (0.0%) | 79 (100.0%) |
| 5 or more Children | 0 (0.0%) | 19 (100.0%) |
| Total | 196 (25.9%) | 582 (70.0%) |
Race in Vieques Municipio
The most populous races in Vieques Municipio are Hispanic or Latino (7,744 | 94.5%), Some other Race (5,234 | 63.8%), and White / Caucasian (1,813 | 22.1%).
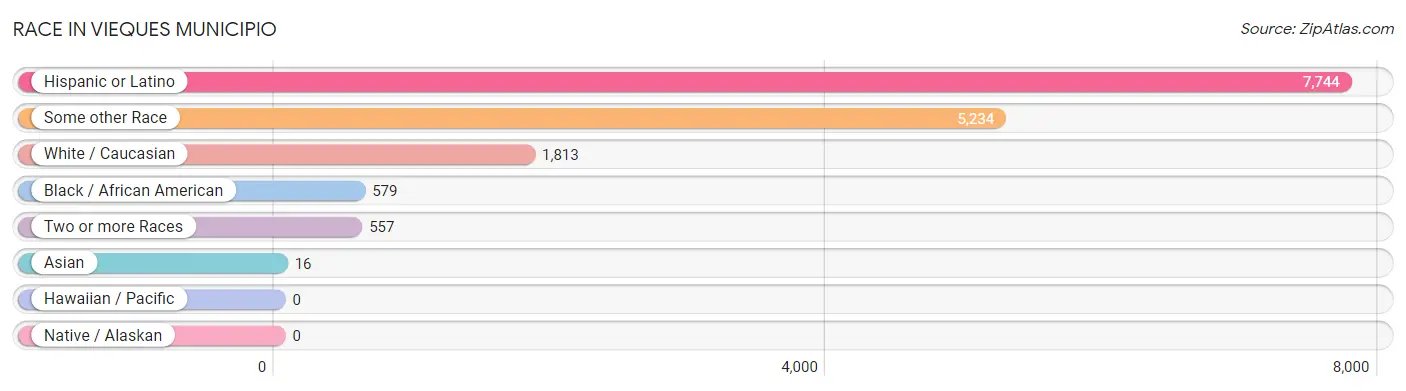
| Race | # Population | % Population |
| Asian | 16 | 0.2% |
| Black / African American | 579 | 7.1% |
| Hawaiian / Pacific | 0 | 0.0% |
| Hispanic or Latino | 7,744 | 94.5% |
| Native / Alaskan | 0 | 0.0% |
| White / Caucasian | 1,813 | 22.1% |
| Two or more Races | 557 | 6.8% |
| Some other Race | 5,234 | 63.8% |
| Total | 8,199 | 100.0% |
Ancestry in Vieques Municipio
The most populous ancestries reported in Vieques Municipio are Puerto Rican (7,499 | 91.5%), American (237 | 2.9%), Ecuadorian (186 | 2.3%), South American (186 | 2.3%), and European (80 | 1.0%), together accounting for 99.9% of all Vieques Municipio residents.
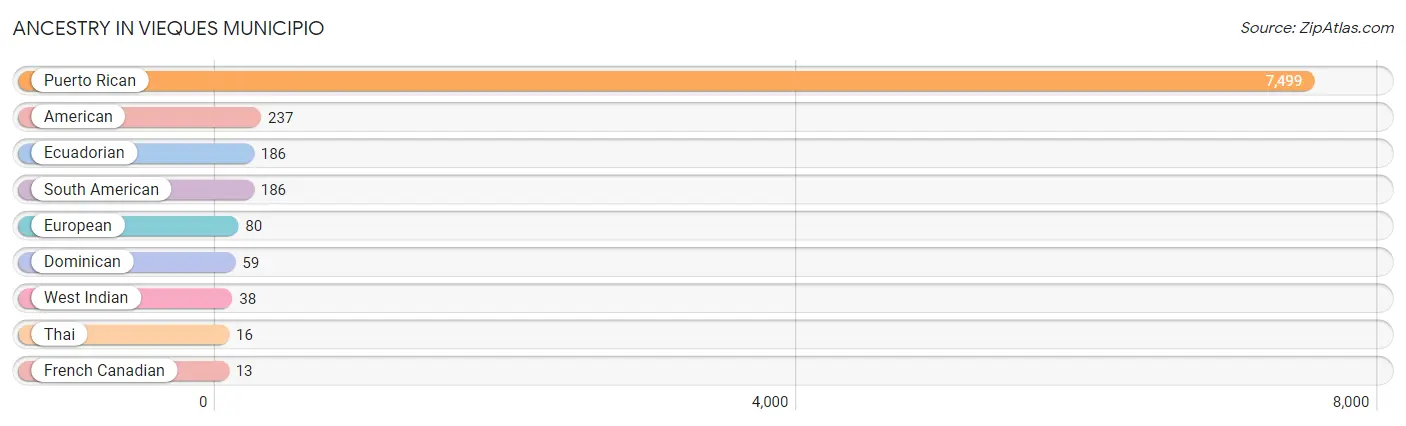
| Ancestry | # Population | % Population |
| American | 237 | 2.9% |
| Dominican | 59 | 0.7% |
| Ecuadorian | 186 | 2.3% |
| European | 80 | 1.0% |
| French Canadian | 13 | 0.2% |
| Puerto Rican | 7,499 | 91.5% |
| South American | 186 | 2.3% |
| Thai | 16 | 0.2% |
| West Indian | 38 | 0.5% | View All 9 Rows |
Immigrants in Vieques Municipio

| Immigration Origin | # Population | % Population | View All 0 Rows |
Sex and Age in Vieques Municipio
Sex and Age in Vieques Municipio
The most populous age groups in Vieques Municipio are 65 to 69 Years (386 | 9.2%) for men and 55 to 59 Years (461 | 11.5%) for women.
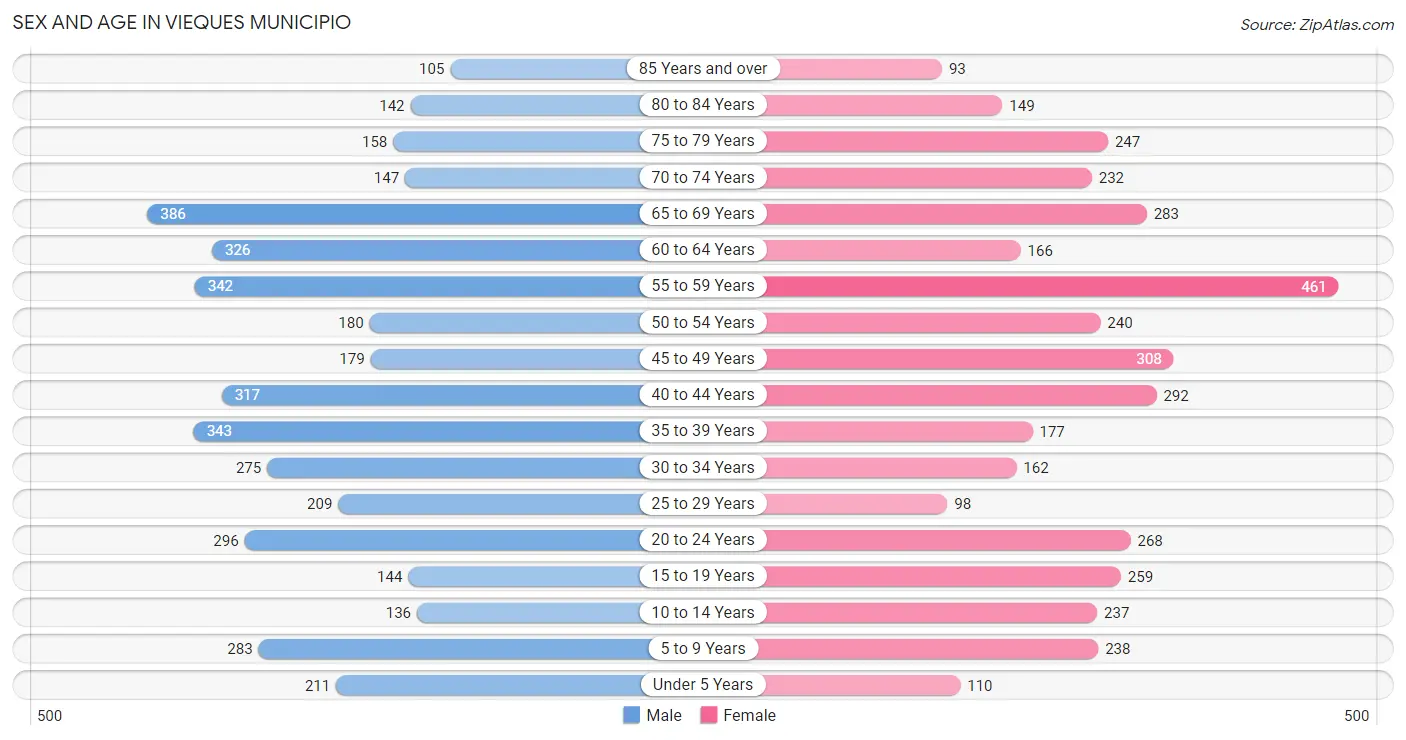
| Age Bracket | Male | Female |
| Under 5 Years | 211 (5.1%) | 110 (2.7%) |
| 5 to 9 Years | 283 (6.8%) | 238 (5.9%) |
| 10 to 14 Years | 136 (3.3%) | 237 (5.9%) |
| 15 to 19 Years | 144 (3.5%) | 259 (6.4%) |
| 20 to 24 Years | 296 (7.1%) | 268 (6.7%) |
| 25 to 29 Years | 209 (5.0%) | 98 (2.4%) |
| 30 to 34 Years | 275 (6.6%) | 162 (4.0%) |
| 35 to 39 Years | 343 (8.2%) | 177 (4.4%) |
| 40 to 44 Years | 317 (7.6%) | 292 (7.3%) |
| 45 to 49 Years | 179 (4.3%) | 308 (7.7%) |
| 50 to 54 Years | 180 (4.3%) | 240 (6.0%) |
| 55 to 59 Years | 342 (8.2%) | 461 (11.5%) |
| 60 to 64 Years | 326 (7.8%) | 166 (4.1%) |
| 65 to 69 Years | 386 (9.2%) | 283 (7.0%) |
| 70 to 74 Years | 147 (3.5%) | 232 (5.8%) |
| 75 to 79 Years | 158 (3.8%) | 247 (6.1%) |
| 80 to 84 Years | 142 (3.4%) | 149 (3.7%) |
| 85 Years and over | 105 (2.5%) | 93 (2.3%) |
| Total | 4,179 (100.0%) | 4,020 (100.0%) |
Families and Households in Vieques Municipio
Median Family Size in Vieques Municipio
The median family size in Vieques Municipio is 4.26 persons per family, with single male/father families (177 | 11.2%) accounting for the largest median family size of 5.44 persons per family. On the other hand, married-couple families (757 | 47.7%) represent the smallest median family size with 3.03 persons per family.
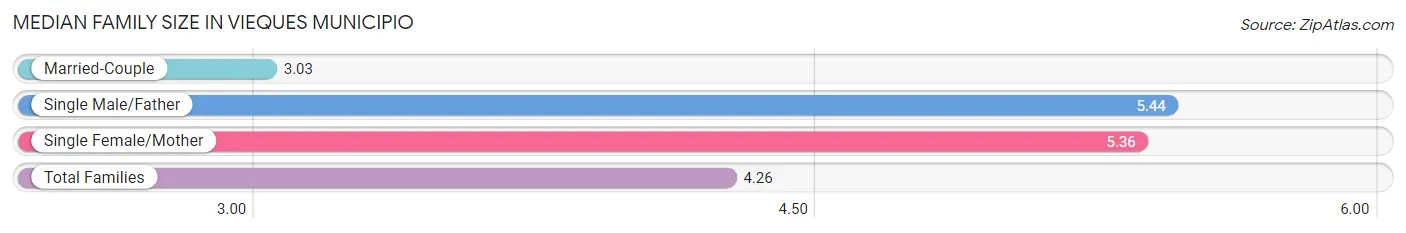
| Family Type | # Families | Family Size |
| Married-Couple | 757 (47.7%) | 3.03 |
| Single Male/Father | 177 (11.2%) | 5.44 |
| Single Female/Mother | 654 (41.2%) | 5.36 |
| Total Families | 1,588 (100.0%) | 4.26 |
Median Household Size in Vieques Municipio
The median household size in Vieques Municipio is 3.14 persons per household, with single male/father households (177 | 6.8%) accounting for the largest median household size of 5.88 persons per household. non-family households (1,020 | 39.1%) represent the smallest median household size with 1.25 persons per household.
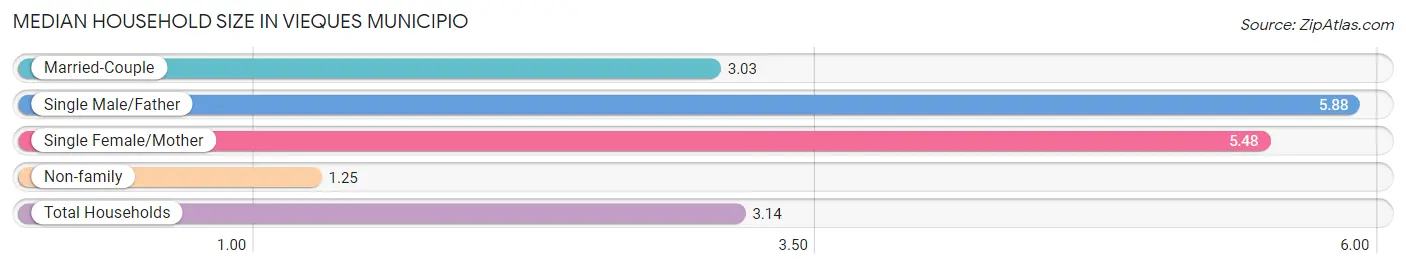
| Household Type | # Households | Household Size |
| Married-Couple | 757 (29.0%) | 3.03 |
| Single Male/Father | 177 (6.8%) | 5.88 |
| Single Female/Mother | 654 (25.1%) | 5.48 |
| Non-family | 1,020 (39.1%) | 1.25 |
| Total Households | 2,608 (100.0%) | 3.14 |
Household Size by Marriage Status in Vieques Municipio
Out of a total of 2,608 households in Vieques Municipio, 1,588 (60.9%) are family households, while 1,020 (39.1%) are nonfamily households. The most numerous type of family households are 2-person households, comprising 956, and the most common type of nonfamily households are 1-person households, comprising 878.
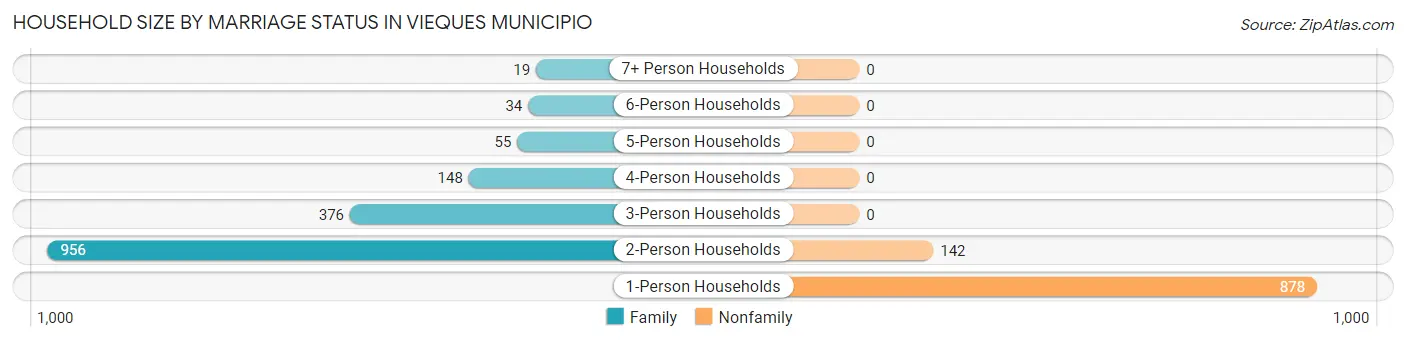
| Household Size | Family Households | Nonfamily Households |
| 1-Person Households | - | 878 (33.7%) |
| 2-Person Households | 956 (36.7%) | 142 (5.4%) |
| 3-Person Households | 376 (14.4%) | 0 (0.0%) |
| 4-Person Households | 148 (5.7%) | 0 (0.0%) |
| 5-Person Households | 55 (2.1%) | 0 (0.0%) |
| 6-Person Households | 34 (1.3%) | 0 (0.0%) |
| 7+ Person Households | 19 (0.7%) | 0 (0.0%) |
| Total | 1,588 (60.9%) | 1,020 (39.1%) |
Female Fertility in Vieques Municipio
Fertility by Age in Vieques Municipio
| Age Bracket | Women with Births | Births / 1,000 Women |
| 15 to 19 years | 0 (0.0%) | 0.0 |
| 20 to 34 years | 0 (0.0%) | 0.0 |
| 35 to 50 years | 0 (0.0%) | 0.0 |
| Total | 0 (0.0%) | 0.0 |
Fertility by Age by Marriage Status in Vieques Municipio
| Age Bracket | Married | Unmarried |
| 15 to 19 years | 0 (0.0%) | 0 (0.0%) |
| 20 to 34 years | 0 (0.0%) | 0 (0.0%) |
| 35 to 50 years | 0 (0.0%) | 0 (0.0%) |
| Total | 0 (0.0%) | 0 (0.0%) |
Fertility by Education in Vieques Municipio
| Educational Attainment | Women with Births | Births / 1,000 Women |
| Less than High School | 0 (0.0%) | 0.0 |
| High School Diploma | 0 (0.0%) | 0.0 |
| College or Associate's Degree | 0 (0.0%) | 0.0 |
| Bachelor's Degree | 0 (0.0%) | 0.0 |
| Graduate Degree | 0 (0.0%) | 0.0 |
| Total | 0 (0.0%) | 0.0 |
Fertility by Education by Marriage Status in Vieques Municipio
| Educational Attainment | Married | Unmarried |
| Less than High School | 0 (0.0%) | 0 (0.0%) |
| High School Diploma | 0 (0.0%) | 0 (0.0%) |
| College or Associate's Degree | 0 (0.0%) | 0 (0.0%) |
| Bachelor's Degree | 0 (0.0%) | 0 (0.0%) |
| Graduate Degree | 0 (0.0%) | 0 (0.0%) |
| Total | 0 (0.0%) | 0 (0.0%) |
Employment Characteristics in Vieques Municipio
Employment by Class of Employer in Vieques Municipio
Among the 2,075 employed individuals in Vieques Municipio, private company employees (536 | 25.8%), self-employed (not incorporated) (527 | 25.4%), and local government employees (439 | 21.2%) make up the most common classes of employment.
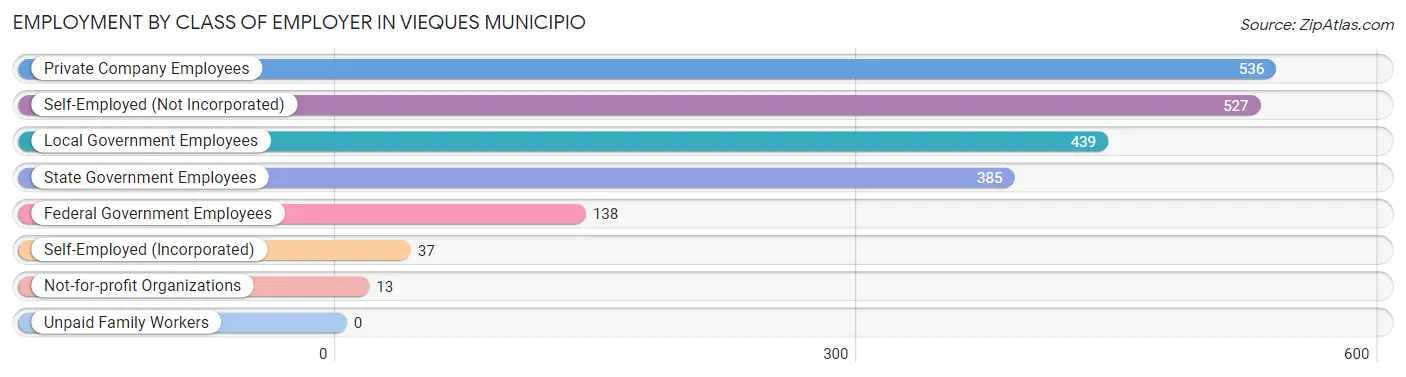
| Employer Class | # Employees | % Employees |
| Private Company Employees | 536 | 25.8% |
| Self-Employed (Incorporated) | 37 | 1.8% |
| Self-Employed (Not Incorporated) | 527 | 25.4% |
| Not-for-profit Organizations | 13 | 0.6% |
| Local Government Employees | 439 | 21.2% |
| State Government Employees | 385 | 18.5% |
| Federal Government Employees | 138 | 6.7% |
| Unpaid Family Workers | 0 | 0.0% |
| Total | 2,075 | 100.0% |
Employment Status by Age in Vieques Municipio
According to the labor force statistics for Vieques Municipio, out of the total population over 16 years of age (6,912), 34.6% or 2,392 individuals are in the labor force, with 13.1% or 313 of them unemployed. The age group with the highest labor force participation rate is 30 to 34 years, with 63.6% or 278 individuals in the labor force. Within the labor force, the 20 to 24 years age range has the highest percentage of unemployed individuals, with 53.9% or 193 of them being unemployed.
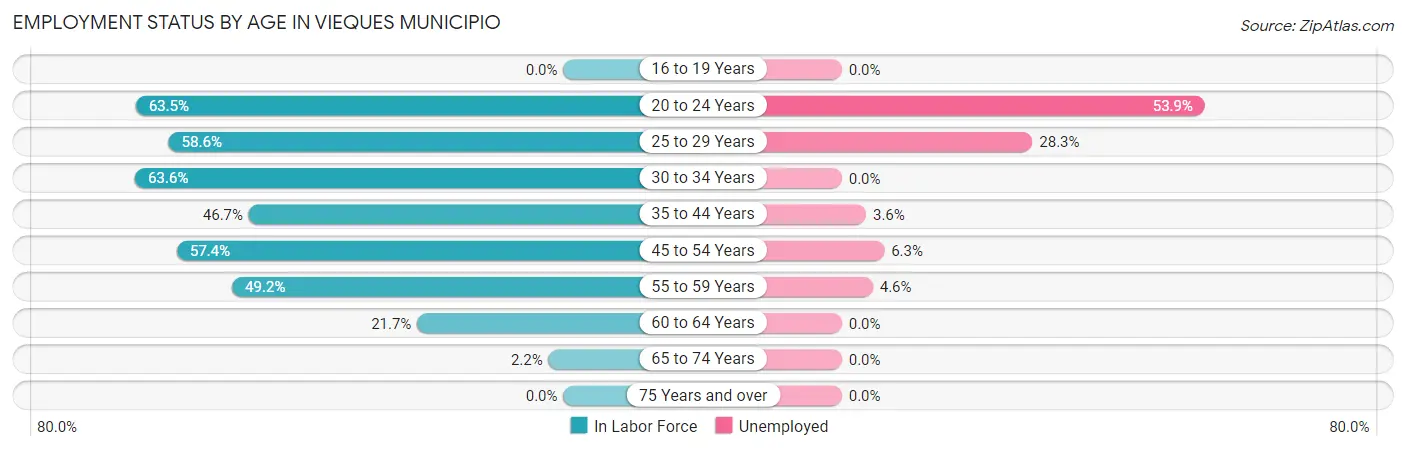
| Age Bracket | In Labor Force | Unemployed |
| 16 to 19 Years | 0 (0.0%) | 0 (0.0%) |
| 20 to 24 Years | 358 (63.5%) | 193 (53.9%) |
| 25 to 29 Years | 180 (58.6%) | 51 (28.3%) |
| 30 to 34 Years | 278 (63.6%) | 0 (0.0%) |
| 35 to 44 Years | 527 (46.7%) | 19 (3.6%) |
| 45 to 54 Years | 521 (57.4%) | 33 (6.3%) |
| 55 to 59 Years | 395 (49.2%) | 18 (4.6%) |
| 60 to 64 Years | 107 (21.7%) | 0 (0.0%) |
| 65 to 74 Years | 23 (2.2%) | 0 (0.0%) |
| 75 Years and over | 0 (0.0%) | 0 (0.0%) |
| Total | 2,392 (34.6%) | 313 (13.1%) |
Employment Status by Educational Attainment in Vieques Municipio
According to labor force statistics for Vieques Municipio, 49.3% of individuals (2,009) out of the total population between 25 and 64 years of age (4,075) are in the labor force, with 6.0% or 121 of them being unemployed. The group with the highest labor force participation rate are those with the educational attainment of bachelor's degree or higher, with 81.4% or 566 individuals in the labor force. Within the labor force, individuals with high school diploma education have the highest percentage of unemployment, with 15.6% or 121 of them being unemployed.
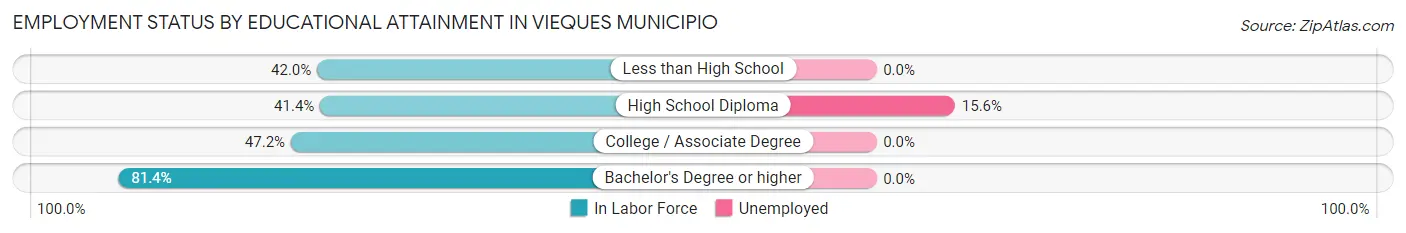
| Educational Attainment | In Labor Force | Unemployed |
| Less than High School | 356 (42.0%) | 0 (0.0%) |
| High School Diploma | 777 (41.4%) | 293 (15.6%) |
| College / Associate Degree | 309 (47.2%) | 0 (0.0%) |
| Bachelor's Degree or higher | 566 (81.4%) | 0 (0.0%) |
| Total | 2,009 (49.3%) | 244 (6.0%) |
Employment Occupations by Sex in Vieques Municipio
Management, Business, Science and Arts Occupations
The most common Management, Business, Science and Arts occupations in Vieques Municipio are Community & Social Service (237 | 11.4%), Education Instruction & Library (199 | 9.6%), Health Diagnosing & Treating (138 | 6.7%), Health Technologists (138 | 6.7%), and Management (71 | 3.4%).
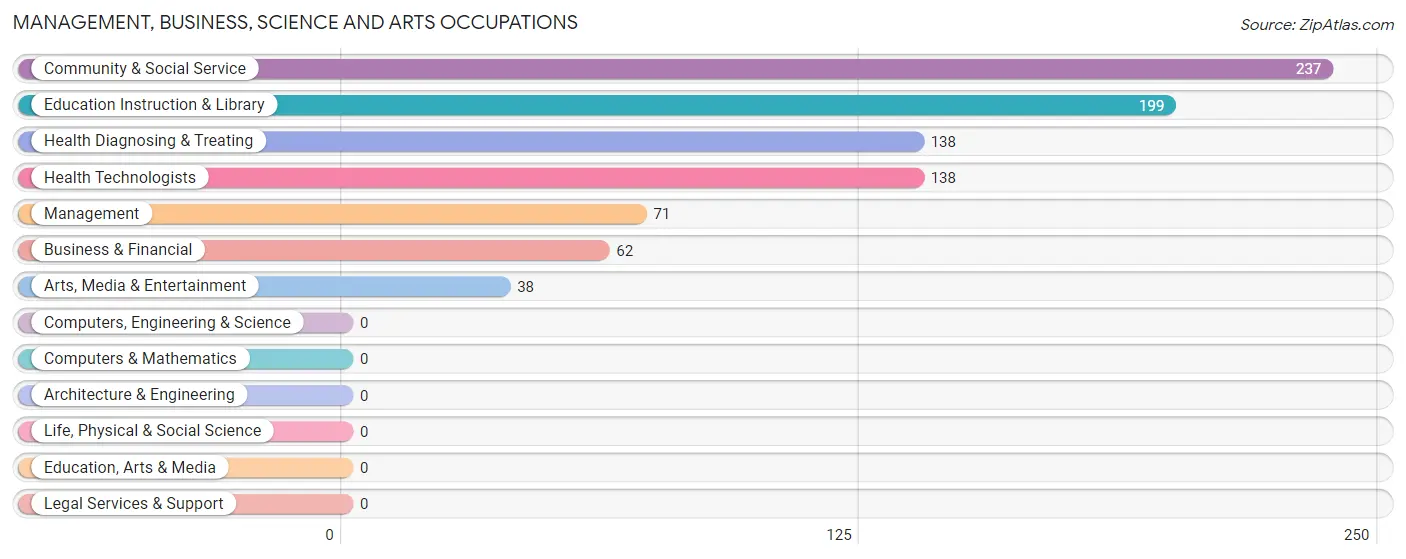
Management, Business, Science and Arts Occupations by Sex
Within the Management, Business, Science and Arts occupations in Vieques Municipio, the most male-oriented occupations are Arts, Media & Entertainment (100.0%), Health Diagnosing & Treating (100.0%), and Health Technologists (100.0%), while the most female-oriented occupations are Business & Financial (100.0%), Education Instruction & Library (100.0%), and Community & Social Service (84.0%).
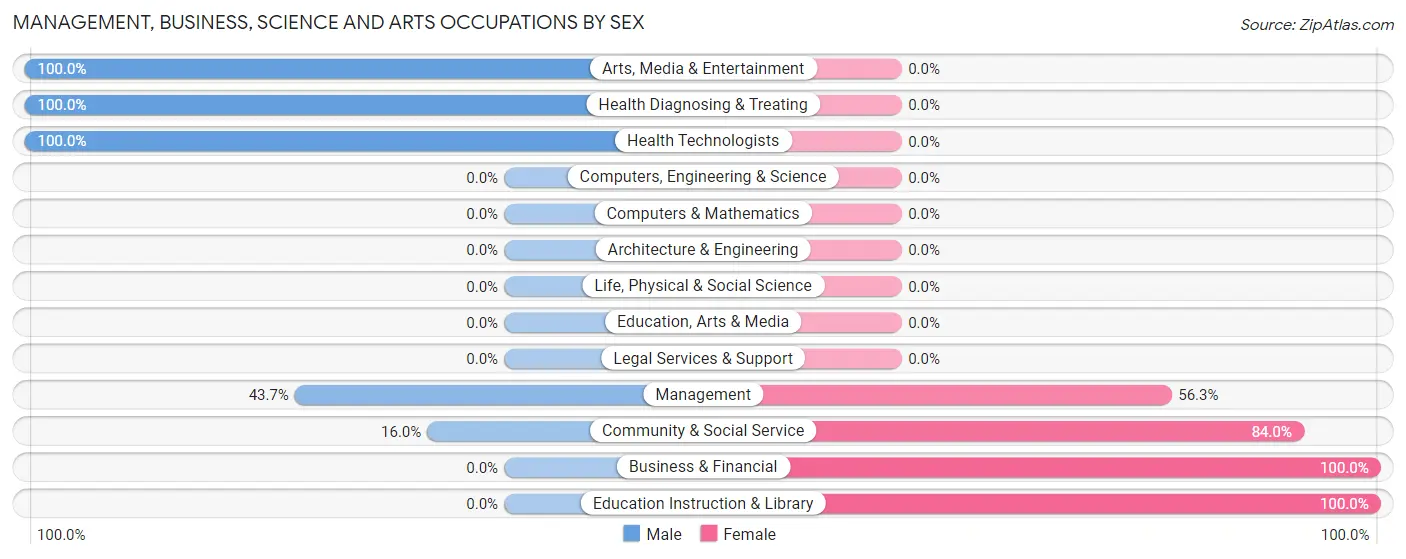
| Occupation | Male | Female |
| Management | 31 (43.7%) | 40 (56.3%) |
| Business & Financial | 0 (0.0%) | 62 (100.0%) |
| Computers, Engineering & Science | 0 (0.0%) | 0 (0.0%) |
| Computers & Mathematics | 0 (0.0%) | 0 (0.0%) |
| Architecture & Engineering | 0 (0.0%) | 0 (0.0%) |
| Life, Physical & Social Science | 0 (0.0%) | 0 (0.0%) |
| Community & Social Service | 38 (16.0%) | 199 (84.0%) |
| Education, Arts & Media | 0 (0.0%) | 0 (0.0%) |
| Legal Services & Support | 0 (0.0%) | 0 (0.0%) |
| Education Instruction & Library | 0 (0.0%) | 199 (100.0%) |
| Arts, Media & Entertainment | 38 (100.0%) | 0 (0.0%) |
| Health Diagnosing & Treating | 138 (100.0%) | 0 (0.0%) |
| Health Technologists | 138 (100.0%) | 0 (0.0%) |
| Total (Category) | 207 (40.7%) | 301 (59.3%) |
| Total (Overall) | 1,230 (59.3%) | 845 (40.7%) |
Services Occupations
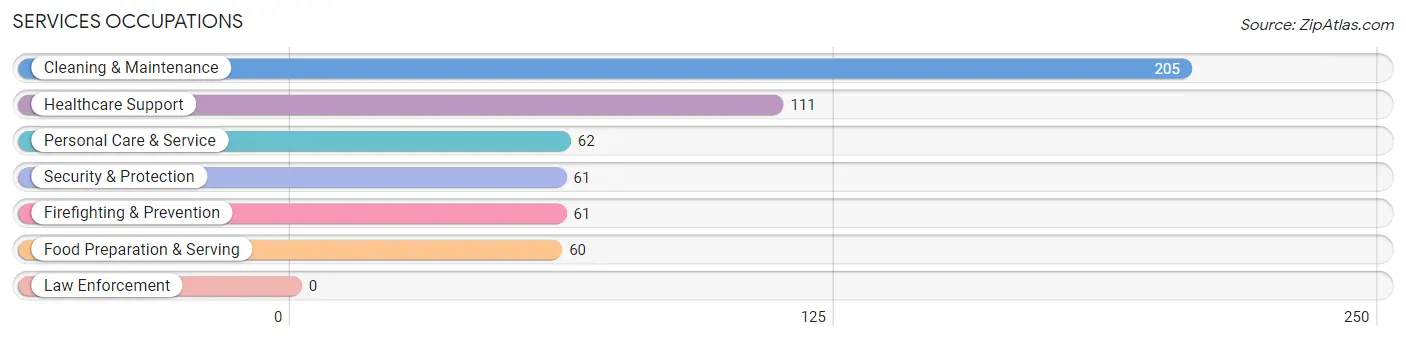
The most common Services occupations in Vieques Municipio are Cleaning & Maintenance (205 | 9.9%), Healthcare Support (111 | 5.3%), Personal Care & Service (62 | 3.0%), Security & Protection (61 | 2.9%), and Firefighting & Prevention (61 | 2.9%).
Services Occupations by Sex
Within the Services occupations in Vieques Municipio, the most male-oriented occupations are Security & Protection (100.0%), Firefighting & Prevention (100.0%), and Personal Care & Service (100.0%), while the most female-oriented occupations are Healthcare Support (100.0%), Food Preparation & Serving (100.0%), and Cleaning & Maintenance (72.7%).
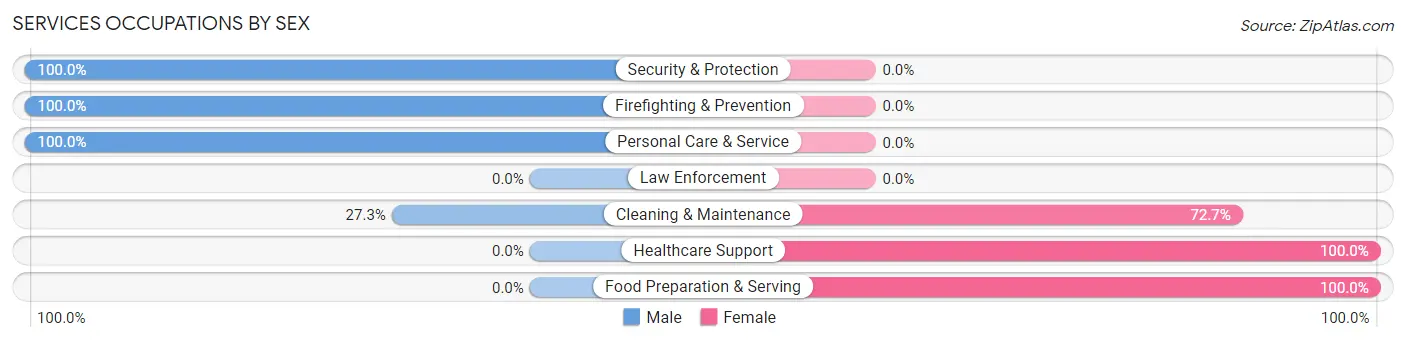
| Occupation | Male | Female |
| Healthcare Support | 0 (0.0%) | 111 (100.0%) |
| Security & Protection | 61 (100.0%) | 0 (0.0%) |
| Firefighting & Prevention | 61 (100.0%) | 0 (0.0%) |
| Law Enforcement | 0 (0.0%) | 0 (0.0%) |
| Food Preparation & Serving | 0 (0.0%) | 60 (100.0%) |
| Cleaning & Maintenance | 56 (27.3%) | 149 (72.7%) |
| Personal Care & Service | 62 (100.0%) | 0 (0.0%) |
| Total (Category) | 179 (35.9%) | 320 (64.1%) |
| Total (Overall) | 1,230 (59.3%) | 845 (40.7%) |
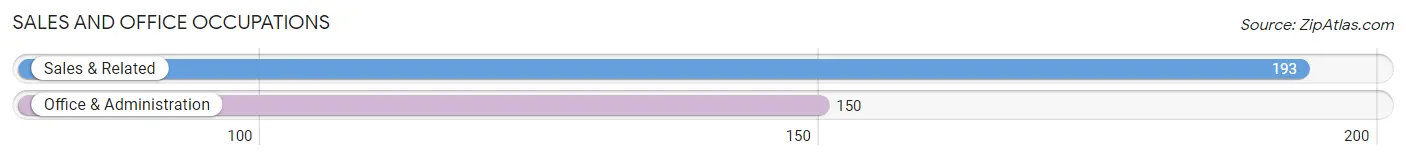
Sales and Office Occupations
The most common Sales and Office occupations in Vieques Municipio are Sales & Related (193 | 9.3%), and Office & Administration (150 | 7.2%).
Sales and Office Occupations by Sex
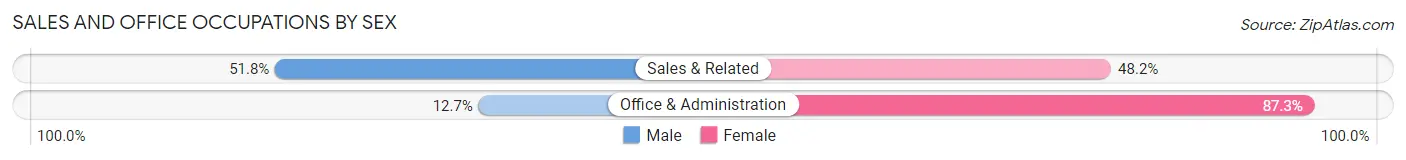
| Occupation | Male | Female |
| Sales & Related | 100 (51.8%) | 93 (48.2%) |
| Office & Administration | 19 (12.7%) | 131 (87.3%) |
| Total (Category) | 119 (34.7%) | 224 (65.3%) |
| Total (Overall) | 1,230 (59.3%) | 845 (40.7%) |
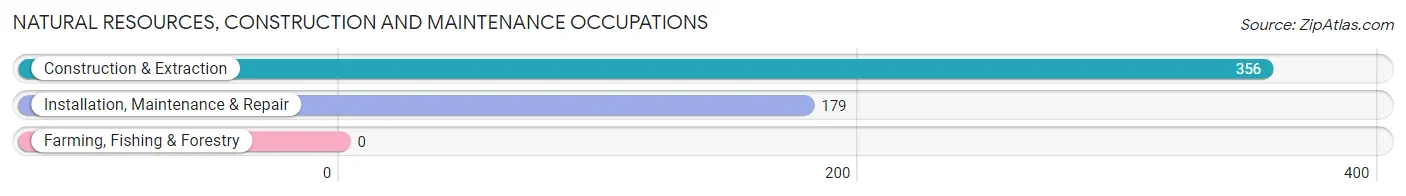
Natural Resources, Construction and Maintenance Occupations
The most common Natural Resources, Construction and Maintenance occupations in Vieques Municipio are Construction & Extraction (356 | 17.2%), and Installation, Maintenance & Repair (179 | 8.6%).
Natural Resources, Construction and Maintenance Occupations by Sex
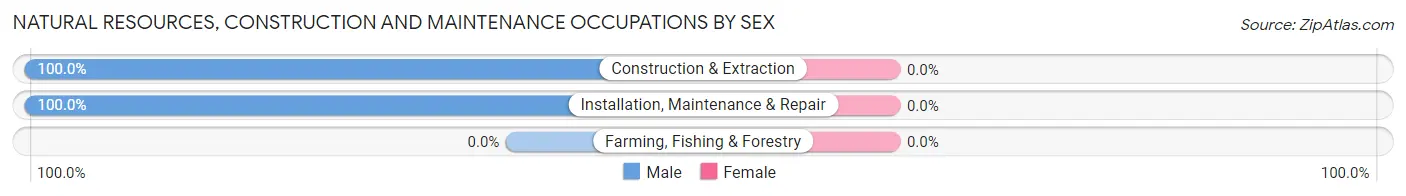
| Occupation | Male | Female |
| Farming, Fishing & Forestry | 0 (0.0%) | 0 (0.0%) |
| Construction & Extraction | 356 (100.0%) | 0 (0.0%) |
| Installation, Maintenance & Repair | 179 (100.0%) | 0 (0.0%) |
| Total (Category) | 535 (100.0%) | 0 (0.0%) |
| Total (Overall) | 1,230 (59.3%) | 845 (40.7%) |
Production, Transportation and Moving Occupations
The most common Production, Transportation and Moving occupations in Vieques Municipio are Transportation (96 | 4.6%), and Production (94 | 4.5%).
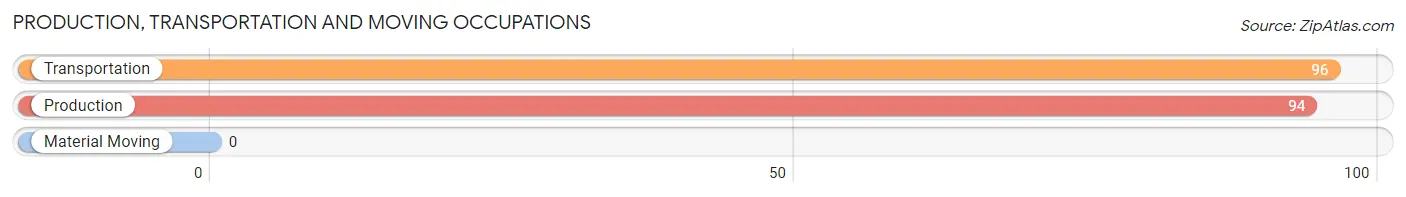
Production, Transportation and Moving Occupations by Sex
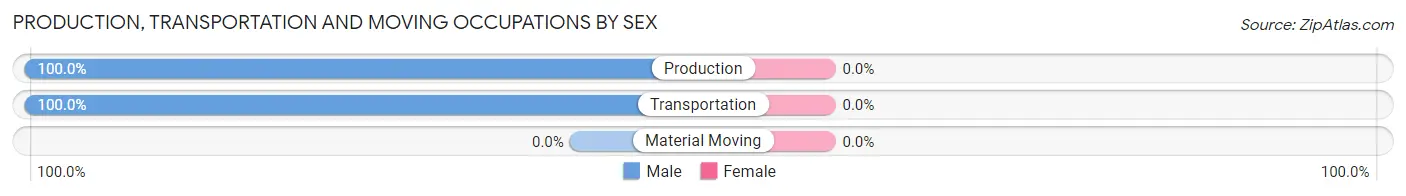
| Occupation | Male | Female |
| Production | 94 (100.0%) | 0 (0.0%) |
| Transportation | 96 (100.0%) | 0 (0.0%) |
| Material Moving | 0 (0.0%) | 0 (0.0%) |
| Total (Category) | 190 (100.0%) | 0 (0.0%) |
| Total (Overall) | 1,230 (59.3%) | 845 (40.7%) |
Employment Industries by Sex in Vieques Municipio
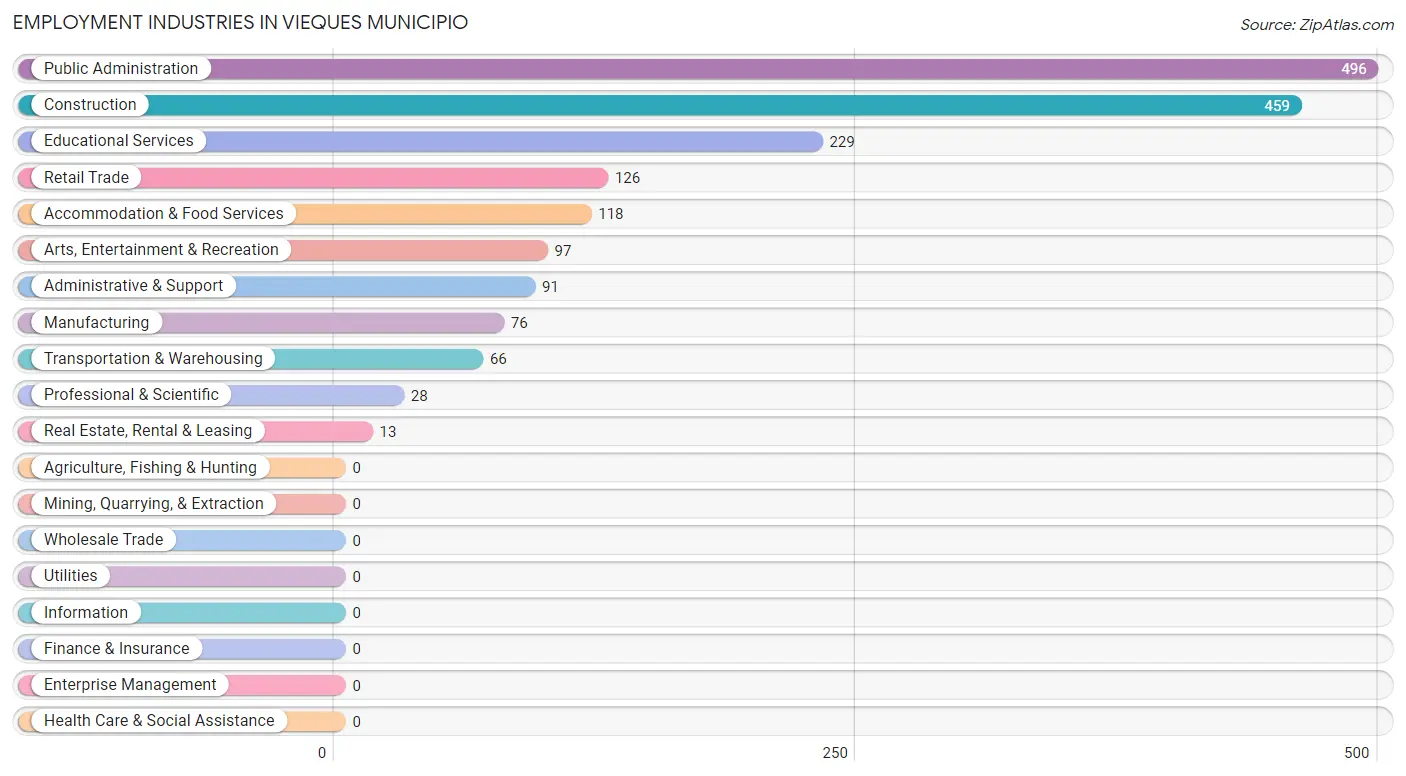
Employment Industries in Vieques Municipio
The major employment industries in Vieques Municipio include Public Administration (496 | 23.9%), Construction (459 | 22.1%), Educational Services (229 | 11.0%), Retail Trade (126 | 6.1%), and Accommodation & Food Services (118 | 5.7%).
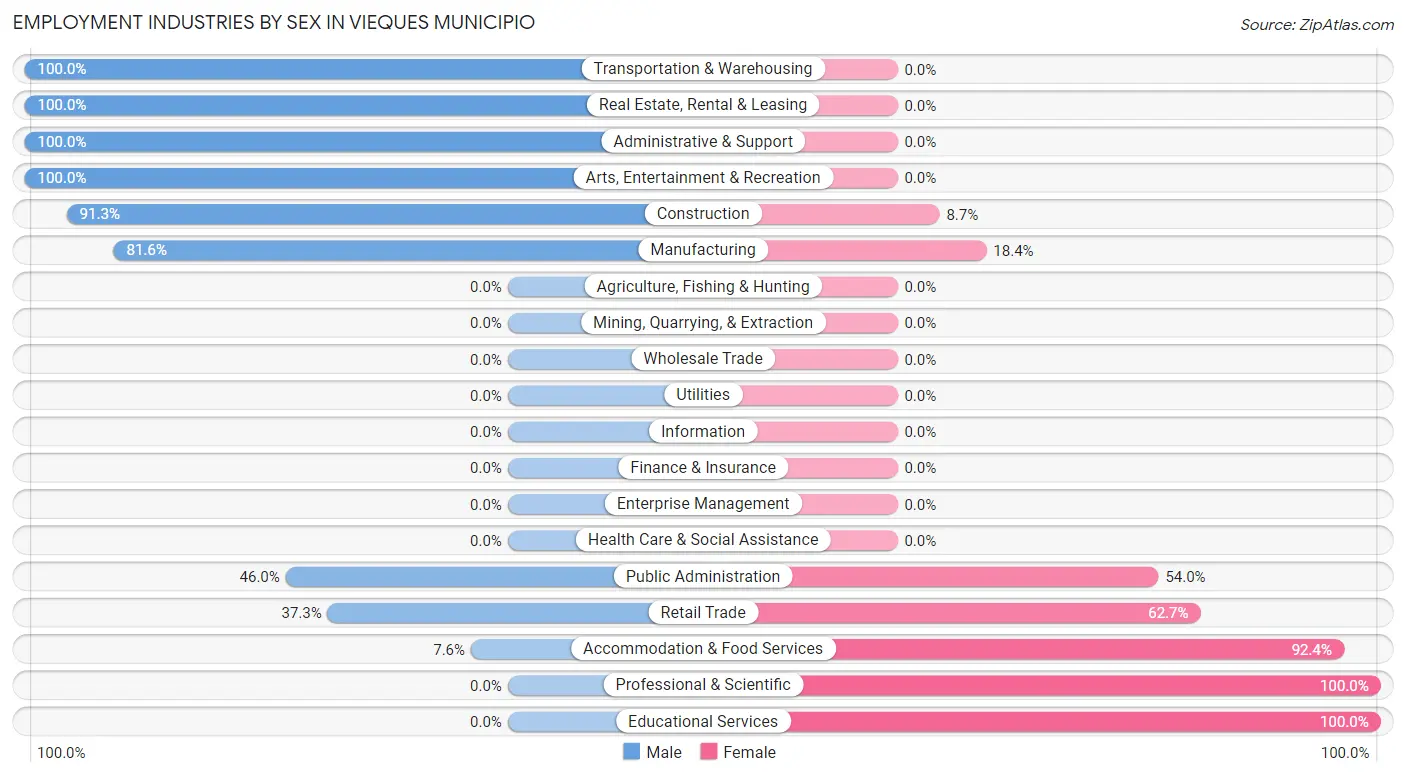
Employment Industries by Sex in Vieques Municipio
The Vieques Municipio industries that see more men than women are Transportation & Warehousing (100.0%), Real Estate, Rental & Leasing (100.0%), and Administrative & Support (100.0%), whereas the industries that tend to have a higher number of women are Professional & Scientific (100.0%), Educational Services (100.0%), and Accommodation & Food Services (92.4%).
| Industry | Male | Female |
| Agriculture, Fishing & Hunting | 0 (0.0%) | 0 (0.0%) |
| Mining, Quarrying, & Extraction | 0 (0.0%) | 0 (0.0%) |
| Construction | 419 (91.3%) | 40 (8.7%) |
| Manufacturing | 62 (81.6%) | 14 (18.4%) |
| Wholesale Trade | 0 (0.0%) | 0 (0.0%) |
| Retail Trade | 47 (37.3%) | 79 (62.7%) |
| Transportation & Warehousing | 66 (100.0%) | 0 (0.0%) |
| Utilities | 0 (0.0%) | 0 (0.0%) |
| Information | 0 (0.0%) | 0 (0.0%) |
| Finance & Insurance | 0 (0.0%) | 0 (0.0%) |
| Real Estate, Rental & Leasing | 13 (100.0%) | 0 (0.0%) |
| Professional & Scientific | 0 (0.0%) | 28 (100.0%) |
| Enterprise Management | 0 (0.0%) | 0 (0.0%) |
| Administrative & Support | 91 (100.0%) | 0 (0.0%) |
| Educational Services | 0 (0.0%) | 229 (100.0%) |
| Health Care & Social Assistance | 0 (0.0%) | 0 (0.0%) |
| Arts, Entertainment & Recreation | 97 (100.0%) | 0 (0.0%) |
| Accommodation & Food Services | 9 (7.6%) | 109 (92.4%) |
| Public Administration | 228 (46.0%) | 268 (54.0%) |
| Total | 1,230 (59.3%) | 845 (40.7%) |
Education in Vieques Municipio
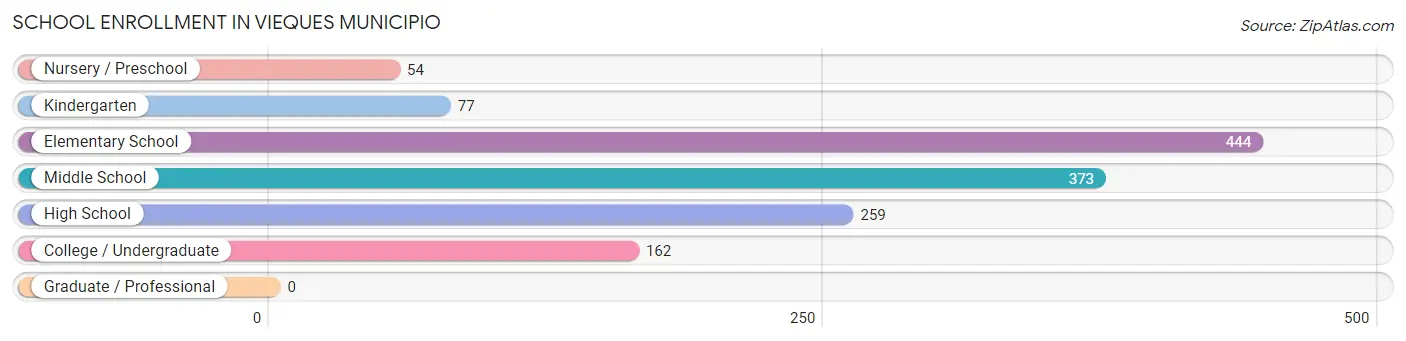
School Enrollment in Vieques Municipio
The most common levels of schooling among the 1,369 students in Vieques Municipio are elementary school (444 | 32.4%), middle school (373 | 27.3%), and high school (259 | 18.9%).
| School Level | # Students | % Students |
| Nursery / Preschool | 54 | 3.9% |
| Kindergarten | 77 | 5.6% |
| Elementary School | 444 | 32.4% |
| Middle School | 373 | 27.3% |
| High School | 259 | 18.9% |
| College / Undergraduate | 162 | 11.8% |
| Graduate / Professional | 0 | 0.0% |
| Total | 1,369 | 100.0% |
School Enrollment by Age by Funding Source in Vieques Municipio
Out of a total of 1,369 students who are enrolled in schools in Vieques Municipio, 162 (11.8%) attend a private institution, while the remaining 1,207 (88.2%) are enrolled in public schools. The age group of 25 to 34 year olds has the highest likelihood of being enrolled in private schools, with 45 (100.0% in the age bracket) enrolled. Conversely, the age group of 3 to 4 year olds has the lowest likelihood of being enrolled in a private school, with 54 (100.0% in the age bracket) attending a public institution.
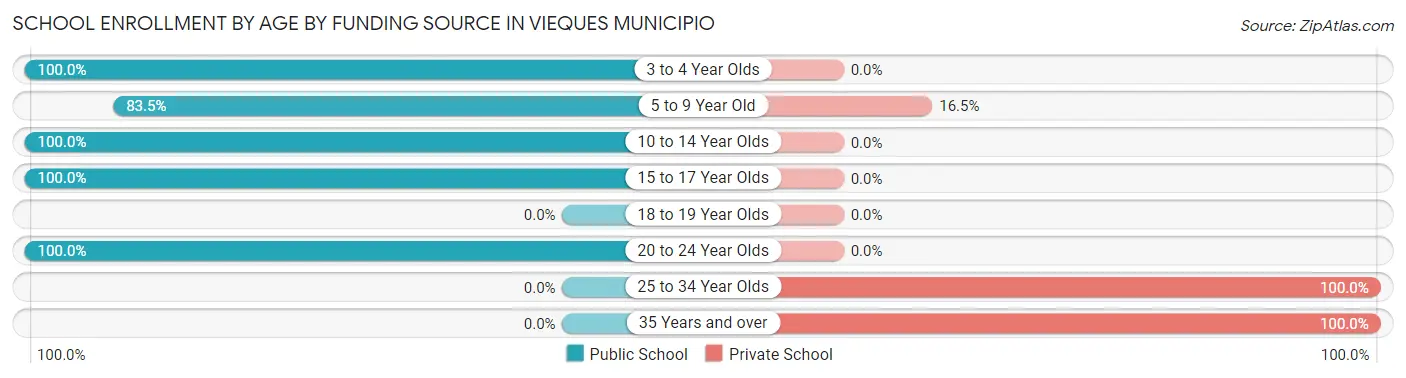
| Age Bracket | Public School | Private School |
| 3 to 4 Year Olds | 54 (100.0%) | 0 (0.0%) |
| 5 to 9 Year Old | 435 (83.5%) | 86 (16.5%) |
| 10 to 14 Year Olds | 373 (100.0%) | 0 (0.0%) |
| 15 to 17 Year Olds | 259 (100.0%) | 0 (0.0%) |
| 18 to 19 Year Olds | 0 (0.0%) | 0 (0.0%) |
| 20 to 24 Year Olds | 86 (100.0%) | 0 (0.0%) |
| 25 to 34 Year Olds | 0 (0.0%) | 45 (100.0%) |
| 35 Years and over | 0 (0.0%) | 31 (100.0%) |
| Total | 1,207 (88.2%) | 162 (11.8%) |
Educational Attainment by Field of Study in Vieques Municipio
Education (350 | 38.3%), bio, nature & agricultural (138 | 15.1%), business (124 | 13.6%), science & technology (89 | 9.7%), and literature & languages (67 | 7.3%) are the most common fields of study among 915 individuals in Vieques Municipio who have obtained a bachelor's degree or higher.
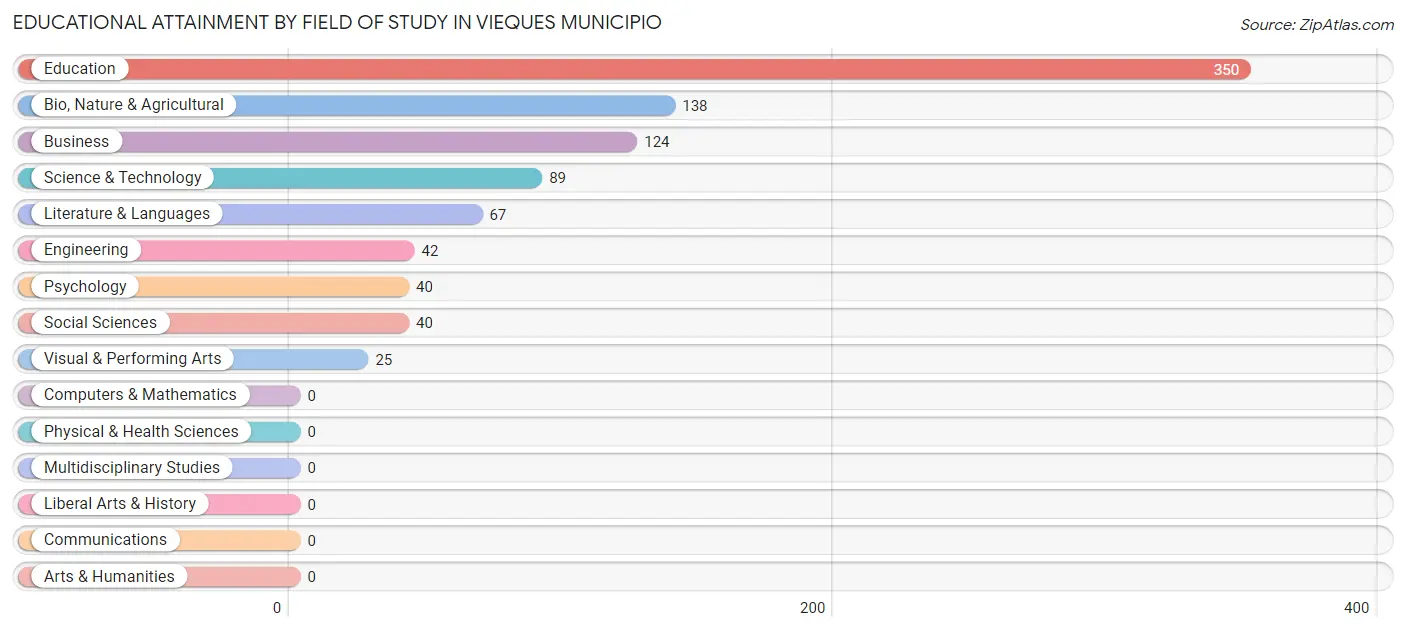
| Field of Study | # Graduates | % Graduates |
| Computers & Mathematics | 0 | 0.0% |
| Bio, Nature & Agricultural | 138 | 15.1% |
| Physical & Health Sciences | 0 | 0.0% |
| Psychology | 40 | 4.4% |
| Social Sciences | 40 | 4.4% |
| Engineering | 42 | 4.6% |
| Multidisciplinary Studies | 0 | 0.0% |
| Science & Technology | 89 | 9.7% |
| Business | 124 | 13.6% |
| Education | 350 | 38.3% |
| Literature & Languages | 67 | 7.3% |
| Liberal Arts & History | 0 | 0.0% |
| Visual & Performing Arts | 25 | 2.7% |
| Communications | 0 | 0.0% |
| Arts & Humanities | 0 | 0.0% |
| Total | 915 | 100.0% |
Transportation & Commute in Vieques Municipio
Vehicle Availability by Sex in Vieques Municipio
The most prevalent vehicle ownership categories in Vieques Municipio are males with 2 vehicles (683, accounting for 55.5%) and females with 2 vehicles (382, making up 80.8%).
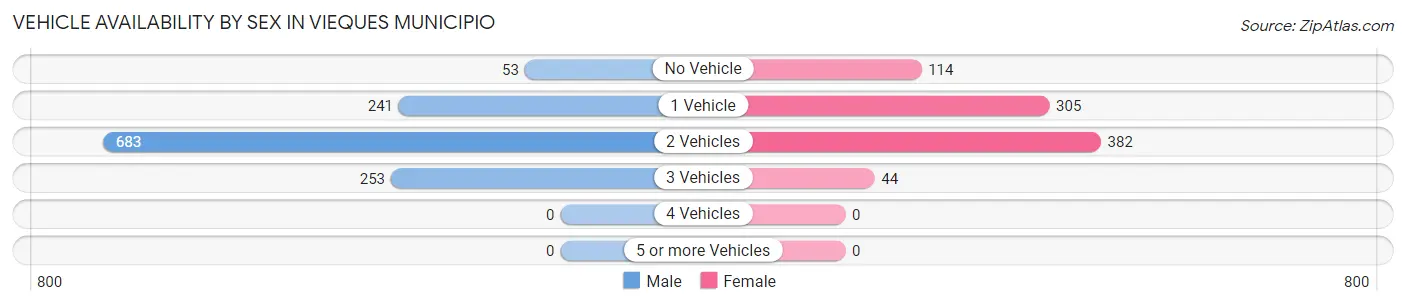
| Vehicles Available | Male | Female |
| No Vehicle | 53 (4.3%) | 114 (13.5%) |
| 1 Vehicle | 241 (19.6%) | 305 (36.1%) |
| 2 Vehicles | 683 (55.5%) | 382 (45.2%) |
| 3 Vehicles | 253 (20.6%) | 44 (5.2%) |
| 4 Vehicles | 0 (0.0%) | 0 (0.0%) |
| 5 or more Vehicles | 0 (0.0%) | 0 (0.0%) |
| Total | 1,230 (100.0%) | 845 (100.0%) |
Commute Time in Vieques Municipio
The most frequently occuring commute durations in Vieques Municipio are 15 to 19 minutes (881 commuters, 59.0%), 10 to 14 minutes (485 commuters, 32.5%), and 20 to 24 minutes (77 commuters, 5.2%).
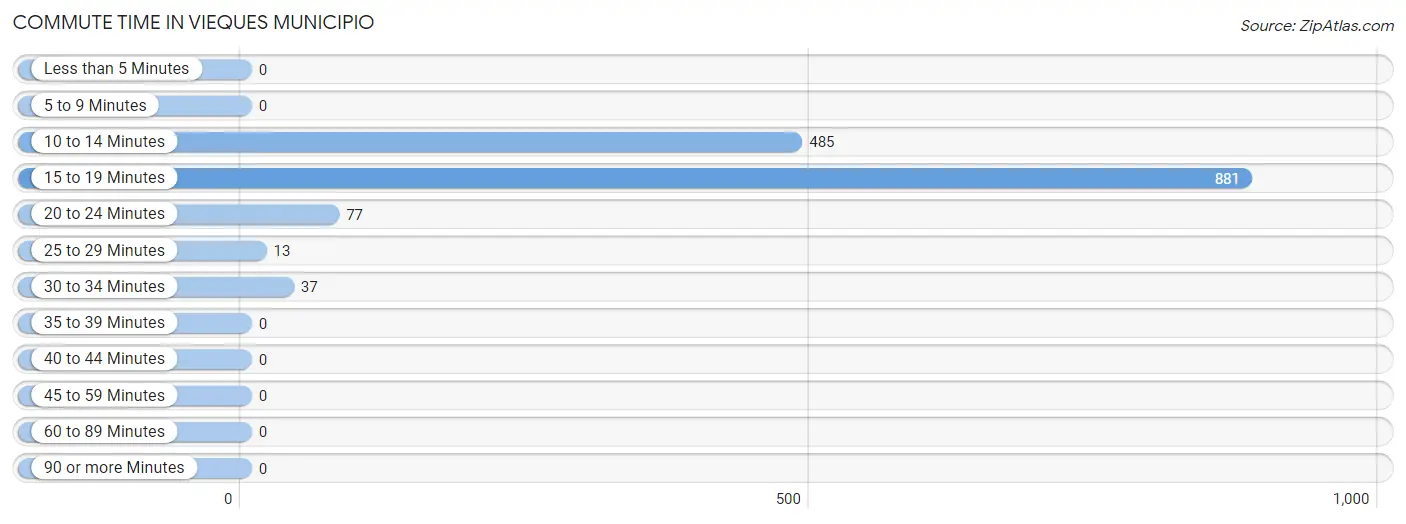
| Commute Time | # Commuters | % Commuters |
| Less than 5 Minutes | 0 | 0.0% |
| 5 to 9 Minutes | 0 | 0.0% |
| 10 to 14 Minutes | 485 | 32.5% |
| 15 to 19 Minutes | 881 | 59.0% |
| 20 to 24 Minutes | 77 | 5.2% |
| 25 to 29 Minutes | 13 | 0.9% |
| 30 to 34 Minutes | 37 | 2.5% |
| 35 to 39 Minutes | 0 | 0.0% |
| 40 to 44 Minutes | 0 | 0.0% |
| 45 to 59 Minutes | 0 | 0.0% |
| 60 to 89 Minutes | 0 | 0.0% |
| 90 or more Minutes | 0 | 0.0% |
Commute Time by Sex in Vieques Municipio
The most common commute times in Vieques Municipio are 15 to 19 minutes (664 commuters, 68.9%) for males and 10 to 14 minutes (288 commuters, 54.4%) for females.
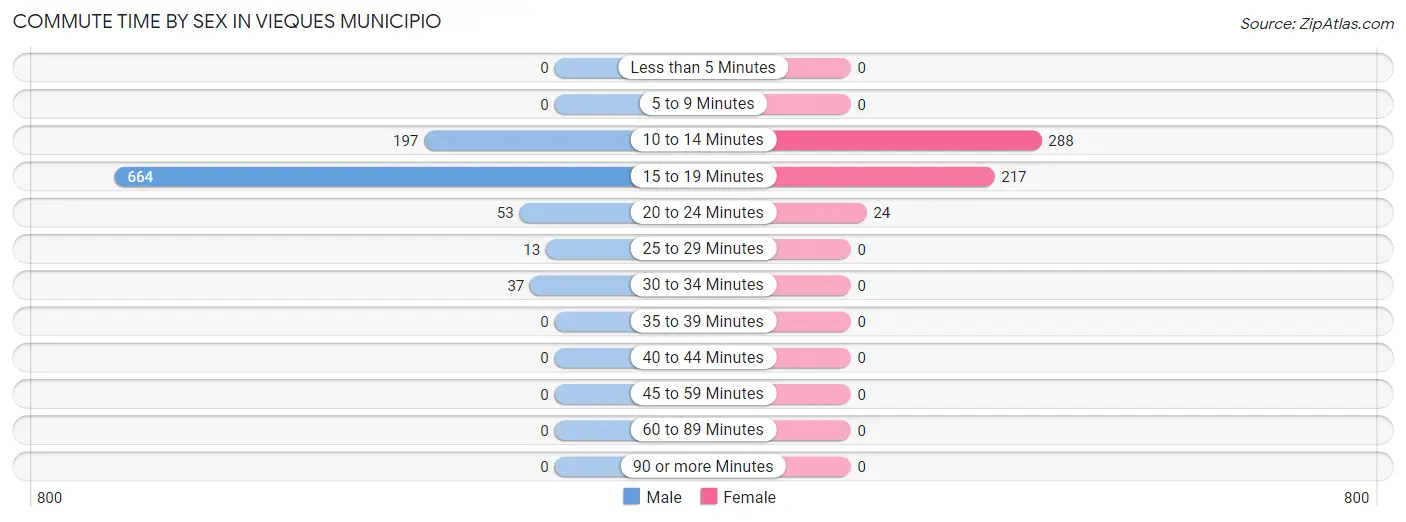
| Commute Time | Male | Female |
| Less than 5 Minutes | 0 (0.0%) | 0 (0.0%) |
| 5 to 9 Minutes | 0 (0.0%) | 0 (0.0%) |
| 10 to 14 Minutes | 197 (20.4%) | 288 (54.4%) |
| 15 to 19 Minutes | 664 (68.9%) | 217 (41.0%) |
| 20 to 24 Minutes | 53 (5.5%) | 24 (4.5%) |
| 25 to 29 Minutes | 13 (1.3%) | 0 (0.0%) |
| 30 to 34 Minutes | 37 (3.8%) | 0 (0.0%) |
| 35 to 39 Minutes | 0 (0.0%) | 0 (0.0%) |
| 40 to 44 Minutes | 0 (0.0%) | 0 (0.0%) |
| 45 to 59 Minutes | 0 (0.0%) | 0 (0.0%) |
| 60 to 89 Minutes | 0 (0.0%) | 0 (0.0%) |
| 90 or more Minutes | 0 (0.0%) | 0 (0.0%) |
Time of Departure to Work by Sex in Vieques Municipio
The most frequent times of departure to work in Vieques Municipio are 8:00 AM to 8:29 AM (291, 30.2%) for males and 7:00 AM to 7:29 AM (111, 21.0%) for females.
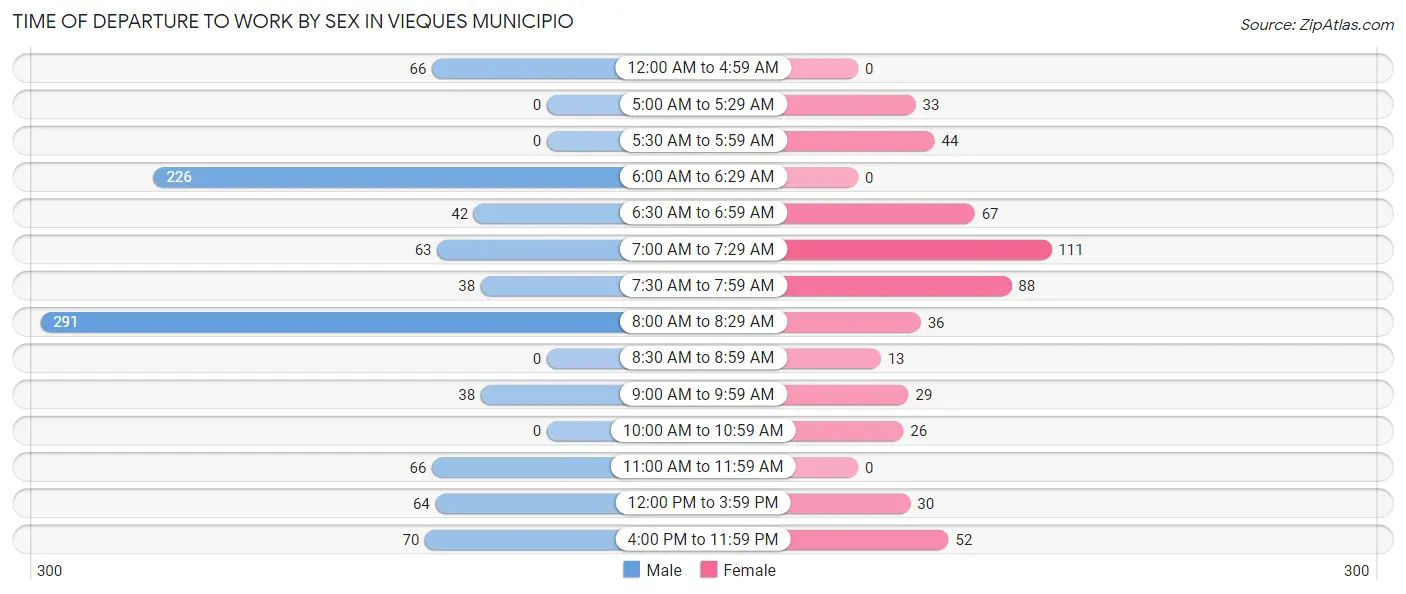
| Time of Departure | Male | Female |
| 12:00 AM to 4:59 AM | 66 (6.9%) | 0 (0.0%) |
| 5:00 AM to 5:29 AM | 0 (0.0%) | 33 (6.2%) |
| 5:30 AM to 5:59 AM | 0 (0.0%) | 44 (8.3%) |
| 6:00 AM to 6:29 AM | 226 (23.4%) | 0 (0.0%) |
| 6:30 AM to 6:59 AM | 42 (4.4%) | 67 (12.7%) |
| 7:00 AM to 7:29 AM | 63 (6.5%) | 111 (21.0%) |
| 7:30 AM to 7:59 AM | 38 (3.9%) | 88 (16.6%) |
| 8:00 AM to 8:29 AM | 291 (30.2%) | 36 (6.8%) |
| 8:30 AM to 8:59 AM | 0 (0.0%) | 13 (2.5%) |
| 9:00 AM to 9:59 AM | 38 (3.9%) | 29 (5.5%) |
| 10:00 AM to 10:59 AM | 0 (0.0%) | 26 (4.9%) |
| 11:00 AM to 11:59 AM | 66 (6.9%) | 0 (0.0%) |
| 12:00 PM to 3:59 PM | 64 (6.6%) | 30 (5.7%) |
| 4:00 PM to 11:59 PM | 70 (7.3%) | 52 (9.8%) |
| Total | 964 (100.0%) | 529 (100.0%) |
Housing Occupancy in Vieques Municipio
Occupancy by Ownership in Vieques Municipio
Of the total 2,608 dwellings in Vieques Municipio, owner-occupied units account for 1,790 (68.6%), while renter-occupied units make up 818 (31.4%).
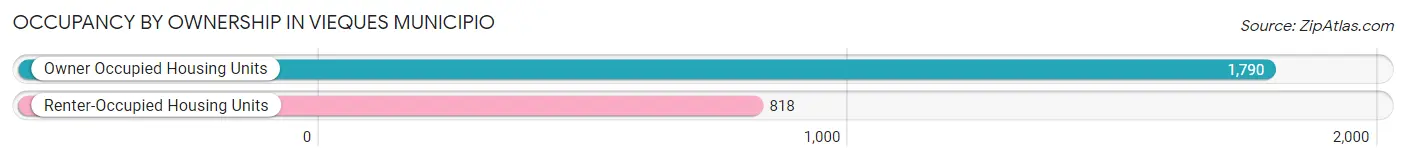
| Occupancy | # Housing Units | % Housing Units |
| Owner Occupied Housing Units | 1,790 | 68.6% |
| Renter-Occupied Housing Units | 818 | 31.4% |
| Total Occupied Housing Units | 2,608 | 100.0% |
Occupancy by Household Size in Vieques Municipio
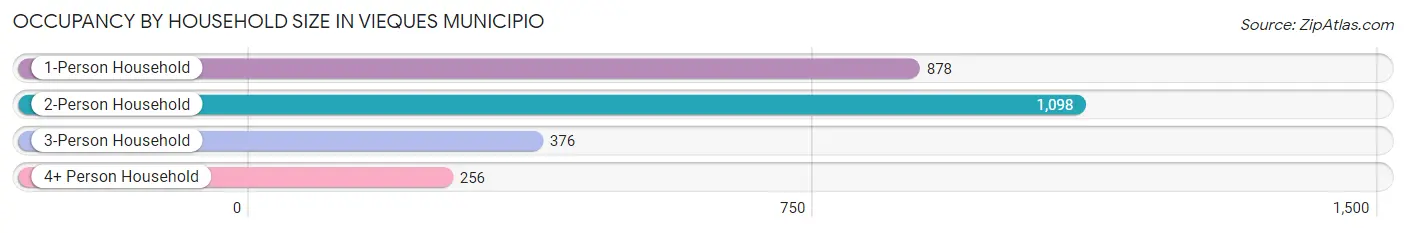
| Household Size | # Housing Units | % Housing Units |
| 1-Person Household | 878 | 33.7% |
| 2-Person Household | 1,098 | 42.1% |
| 3-Person Household | 376 | 14.4% |
| 4+ Person Household | 256 | 9.8% |
| Total Housing Units | 2,608 | 100.0% |
Occupancy by Ownership by Household Size in Vieques Municipio
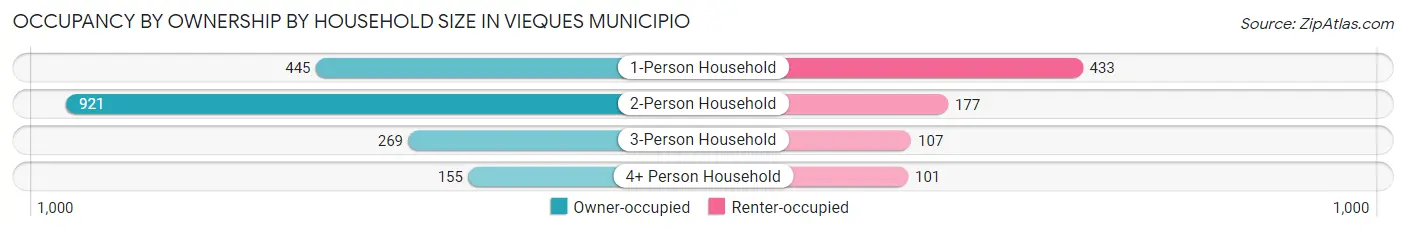
| Household Size | Owner-occupied | Renter-occupied |
| 1-Person Household | 445 (50.7%) | 433 (49.3%) |
| 2-Person Household | 921 (83.9%) | 177 (16.1%) |
| 3-Person Household | 269 (71.5%) | 107 (28.5%) |
| 4+ Person Household | 155 (60.6%) | 101 (39.5%) |
| Total Housing Units | 1,790 (68.6%) | 818 (31.4%) |
Occupancy by Educational Attainment in Vieques Municipio
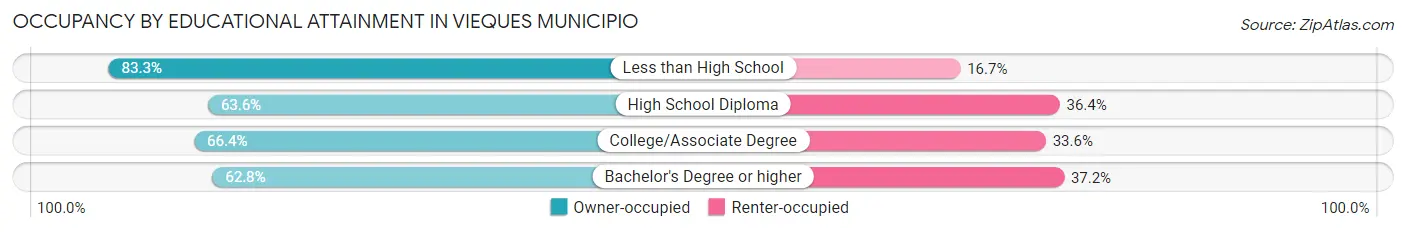
| Household Size | Owner-occupied | Renter-occupied |
| Less than High School | 540 (83.3%) | 108 (16.7%) |
| High School Diploma | 835 (63.6%) | 477 (36.4%) |
| College/Associate Degree | 152 (66.4%) | 77 (33.6%) |
| Bachelor's Degree or higher | 263 (62.8%) | 156 (37.2%) |
Occupancy by Age of Householder in Vieques Municipio
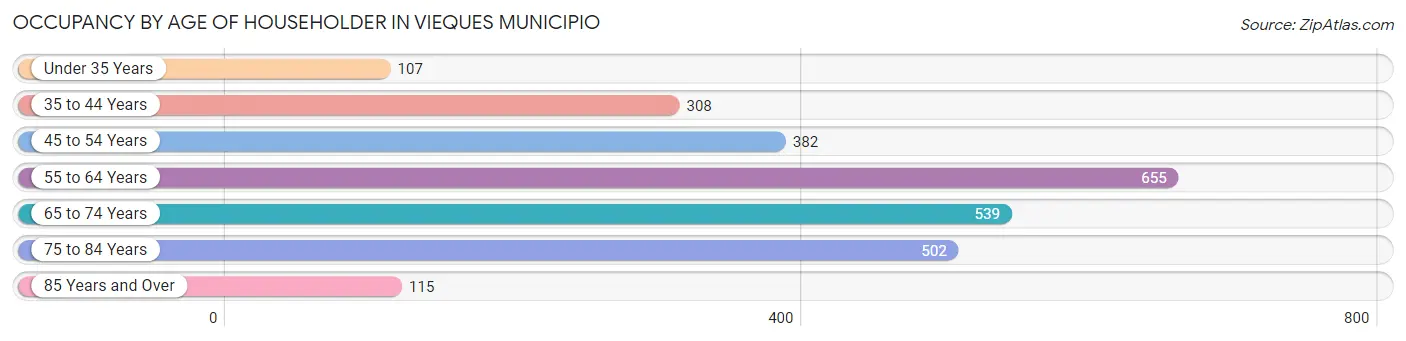
| Age Bracket | # Households | % Households |
| Under 35 Years | 107 | 4.1% |
| 35 to 44 Years | 308 | 11.8% |
| 45 to 54 Years | 382 | 14.6% |
| 55 to 64 Years | 655 | 25.1% |
| 65 to 74 Years | 539 | 20.7% |
| 75 to 84 Years | 502 | 19.3% |
| 85 Years and Over | 115 | 4.4% |
| Total | 2,608 | 100.0% |
Housing Finances in Vieques Municipio
Median Income by Occupancy in Vieques Municipio
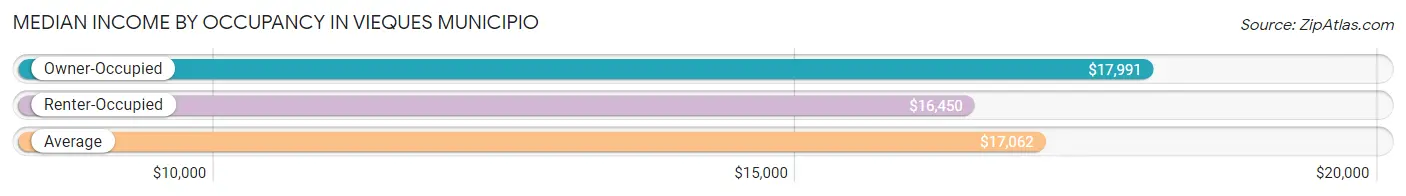
| Occupancy Type | # Households | Median Income |
| Owner-Occupied | 1,790 (68.6%) | $17,991 |
| Renter-Occupied | 818 (31.4%) | $16,450 |
| Average | 2,608 (100.0%) | $17,062 |
Occupancy by Householder Income Bracket in Vieques Municipio
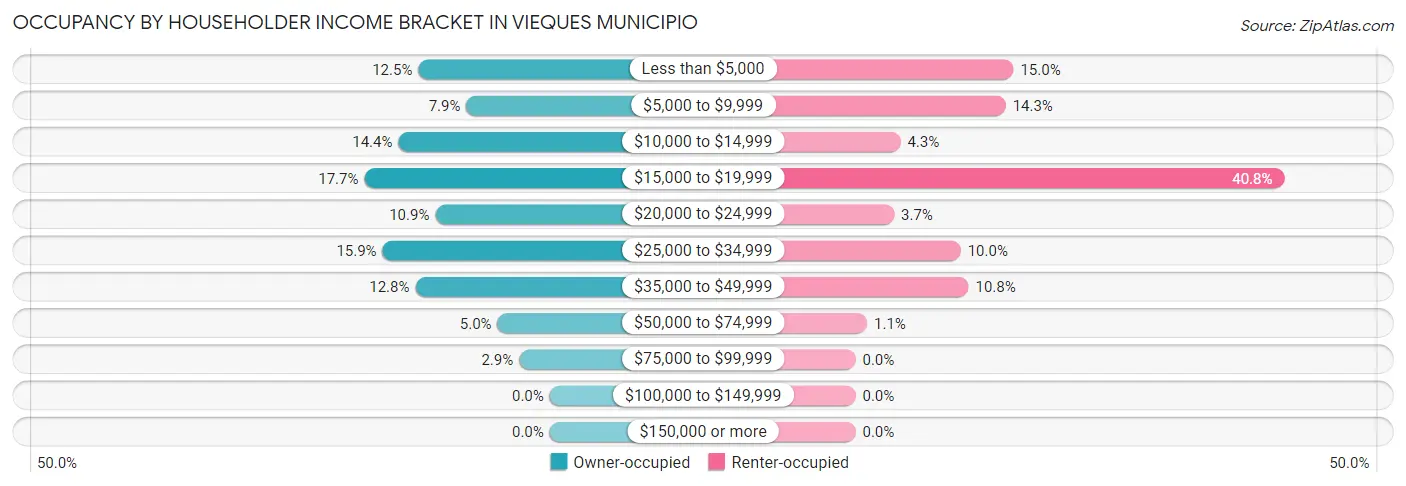
| Income Bracket | Owner-occupied | Renter-occupied |
| Less than $5,000 | 224 (12.5%) | 123 (15.0%) |
| $5,000 to $9,999 | 142 (7.9%) | 117 (14.3%) |
| $10,000 to $14,999 | 258 (14.4%) | 35 (4.3%) |
| $15,000 to $19,999 | 316 (17.6%) | 334 (40.8%) |
| $20,000 to $24,999 | 195 (10.9%) | 30 (3.7%) |
| $25,000 to $34,999 | 285 (15.9%) | 82 (10.0%) |
| $35,000 to $49,999 | 229 (12.8%) | 88 (10.8%) |
| $50,000 to $74,999 | 89 (5.0%) | 9 (1.1%) |
| $75,000 to $99,999 | 52 (2.9%) | 0 (0.0%) |
| $100,000 to $149,999 | 0 (0.0%) | 0 (0.0%) |
| $150,000 or more | 0 (0.0%) | 0 (0.0%) |
| Total | 1,790 (100.0%) | 818 (100.0%) |
Monthly Housing Cost Tiers in Vieques Municipio
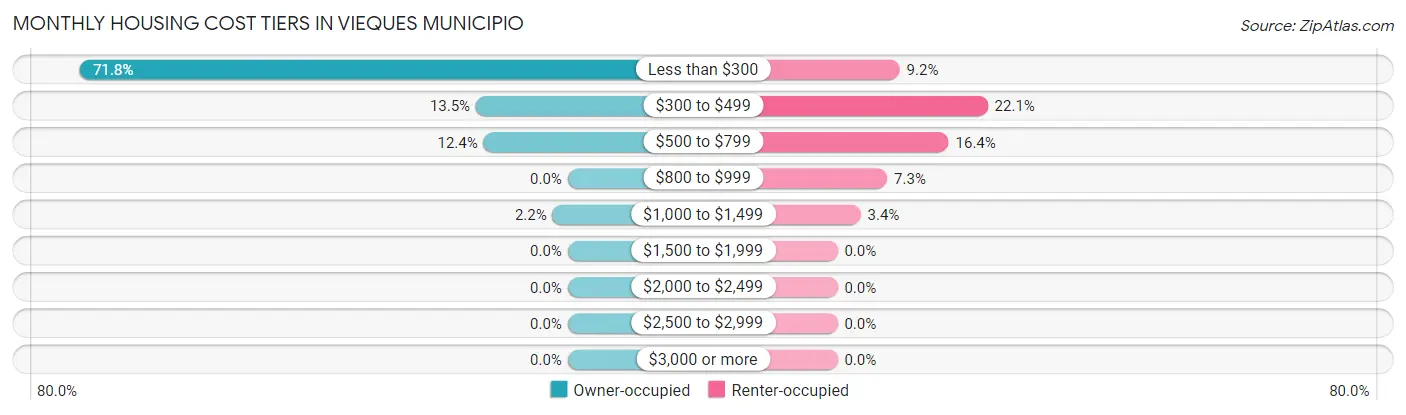
| Monthly Cost | Owner-occupied | Renter-occupied |
| Less than $300 | 1,286 (71.8%) | 75 (9.2%) |
| $300 to $499 | 242 (13.5%) | 181 (22.1%) |
| $500 to $799 | 222 (12.4%) | 134 (16.4%) |
| $800 to $999 | 0 (0.0%) | 60 (7.3%) |
| $1,000 to $1,499 | 40 (2.2%) | 28 (3.4%) |
| $1,500 to $1,999 | 0 (0.0%) | 0 (0.0%) |
| $2,000 to $2,499 | 0 (0.0%) | 0 (0.0%) |
| $2,500 to $2,999 | 0 (0.0%) | 0 (0.0%) |
| $3,000 or more | 0 (0.0%) | 0 (0.0%) |
| Total | 1,790 (100.0%) | 818 (100.0%) |
Physical Housing Characteristics in Vieques Municipio
Housing Structures in Vieques Municipio
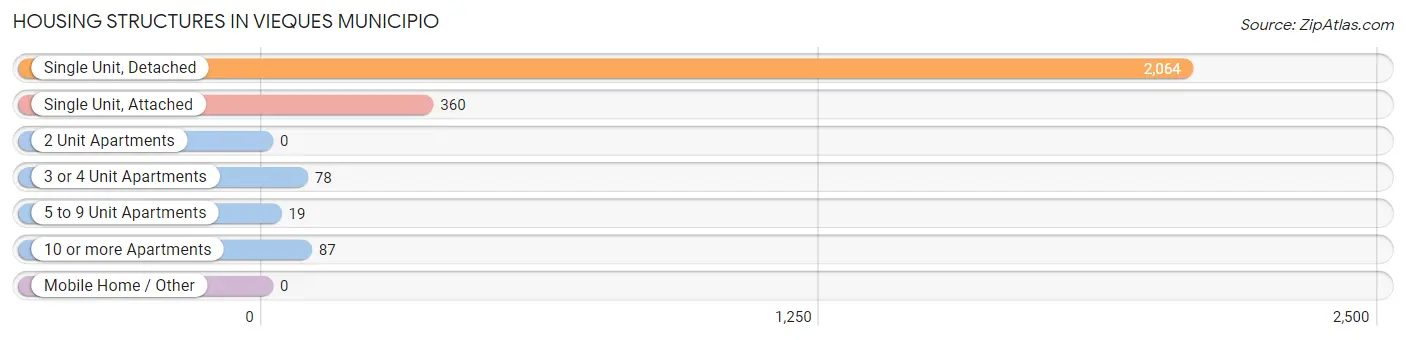
| Structure Type | # Housing Units | % Housing Units |
| Single Unit, Detached | 2,064 | 79.1% |
| Single Unit, Attached | 360 | 13.8% |
| 2 Unit Apartments | 0 | 0.0% |
| 3 or 4 Unit Apartments | 78 | 3.0% |
| 5 to 9 Unit Apartments | 19 | 0.7% |
| 10 or more Apartments | 87 | 3.3% |
| Mobile Home / Other | 0 | 0.0% |
| Total | 2,608 | 100.0% |
Housing Structures by Occupancy in Vieques Municipio
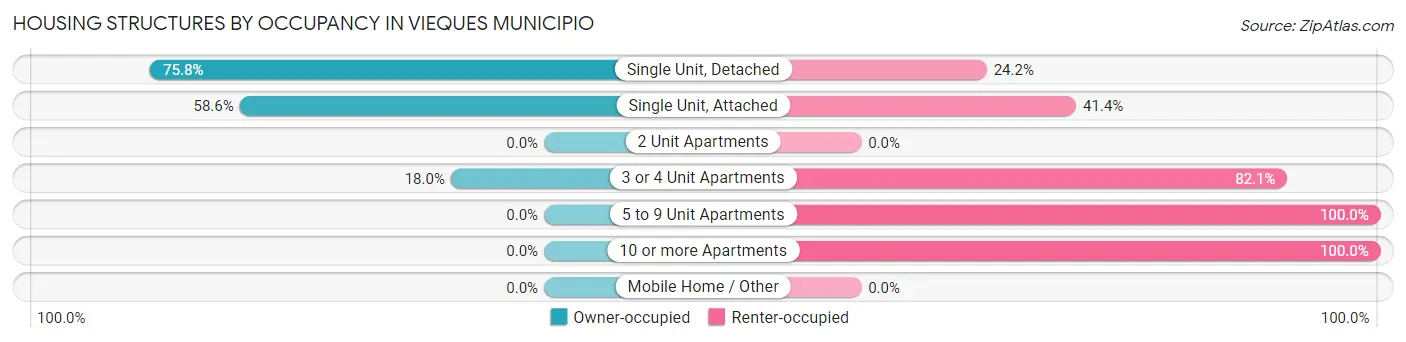
| Structure Type | Owner-occupied | Renter-occupied |
| Single Unit, Detached | 1,565 (75.8%) | 499 (24.2%) |
| Single Unit, Attached | 211 (58.6%) | 149 (41.4%) |
| 2 Unit Apartments | 0 (0.0%) | 0 (0.0%) |
| 3 or 4 Unit Apartments | 14 (17.9%) | 64 (82.1%) |
| 5 to 9 Unit Apartments | 0 (0.0%) | 19 (100.0%) |
| 10 or more Apartments | 0 (0.0%) | 87 (100.0%) |
| Mobile Home / Other | 0 (0.0%) | 0 (0.0%) |
| Total | 1,790 (68.6%) | 818 (31.4%) |
Housing Structures by Number of Rooms in Vieques Municipio
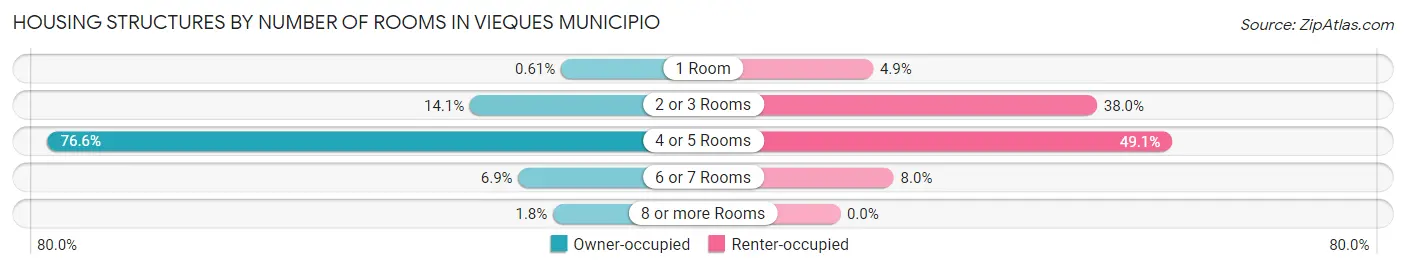
| Number of Rooms | Owner-occupied | Renter-occupied |
| 1 Room | 11 (0.6%) | 40 (4.9%) |
| 2 or 3 Rooms | 252 (14.1%) | 311 (38.0%) |
| 4 or 5 Rooms | 1,371 (76.6%) | 402 (49.1%) |
| 6 or 7 Rooms | 124 (6.9%) | 65 (8.0%) |
| 8 or more Rooms | 32 (1.8%) | 0 (0.0%) |
| Total | 1,790 (100.0%) | 818 (100.0%) |
Housing Structure by Heating Type in Vieques Municipio
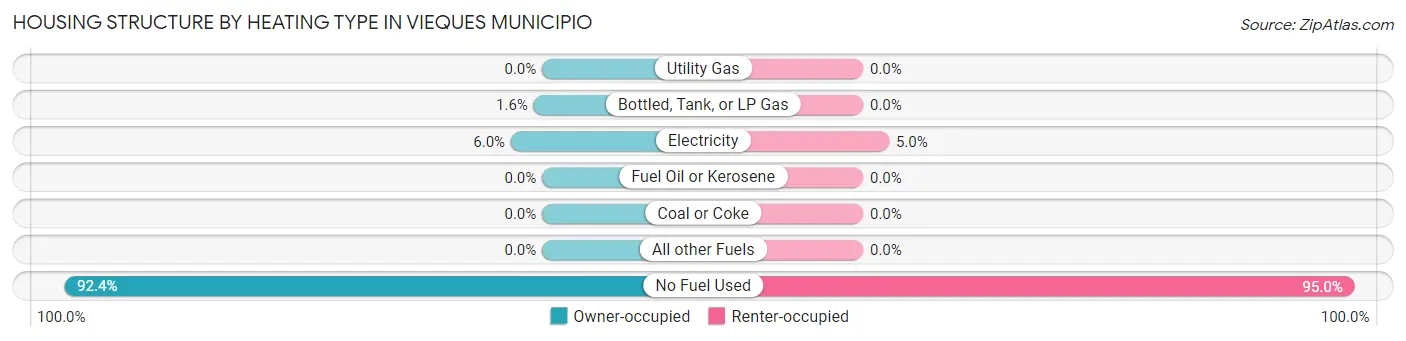
| Heating Type | Owner-occupied | Renter-occupied |
| Utility Gas | 0 (0.0%) | 0 (0.0%) |
| Bottled, Tank, or LP Gas | 29 (1.6%) | 0 (0.0%) |
| Electricity | 108 (6.0%) | 41 (5.0%) |
| Fuel Oil or Kerosene | 0 (0.0%) | 0 (0.0%) |
| Coal or Coke | 0 (0.0%) | 0 (0.0%) |
| All other Fuels | 0 (0.0%) | 0 (0.0%) |
| No Fuel Used | 1,653 (92.3%) | 777 (95.0%) |
| Total | 1,790 (100.0%) | 818 (100.0%) |
Household Vehicle Usage in Vieques Municipio
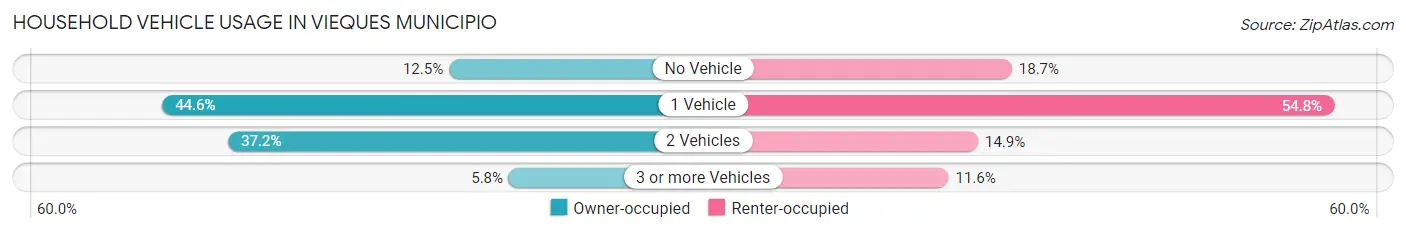
| Vehicles per Household | Owner-occupied | Renter-occupied |
| No Vehicle | 223 (12.5%) | 153 (18.7%) |
| 1 Vehicle | 798 (44.6%) | 448 (54.8%) |
| 2 Vehicles | 666 (37.2%) | 122 (14.9%) |
| 3 or more Vehicles | 103 (5.8%) | 95 (11.6%) |
| Total | 1,790 (100.0%) | 818 (100.0%) |
Real Estate & Mortgages in Vieques Municipio
Real Estate and Mortgage Overview in Vieques Municipio
| Characteristic | Without Mortgage | With Mortgage |
| Housing Units | 1,522 | 268 |
| Median Property Value | $99,800 | $178,800 |
| Median Household Income | $16,317 | $0 |
| Monthly Housing Costs | $165 | $0 |
| Real Estate Taxes | - | - |
Property Value by Mortgage Status in Vieques Municipio
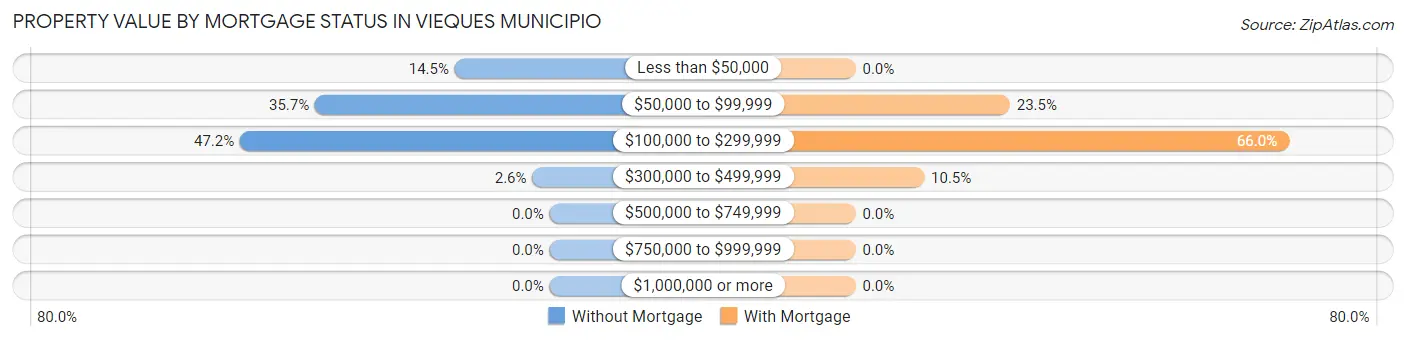
| Property Value | Without Mortgage | With Mortgage |
| Less than $50,000 | 220 (14.4%) | 0 (0.0%) |
| $50,000 to $99,999 | 544 (35.7%) | 63 (23.5%) |
| $100,000 to $299,999 | 718 (47.2%) | 177 (66.0%) |
| $300,000 to $499,999 | 40 (2.6%) | 28 (10.4%) |
| $500,000 to $749,999 | 0 (0.0%) | 0 (0.0%) |
| $750,000 to $999,999 | 0 (0.0%) | 0 (0.0%) |
| $1,000,000 or more | 0 (0.0%) | 0 (0.0%) |
| Total | 1,522 (100.0%) | 268 (100.0%) |
Household Income by Mortgage Status in Vieques Municipio
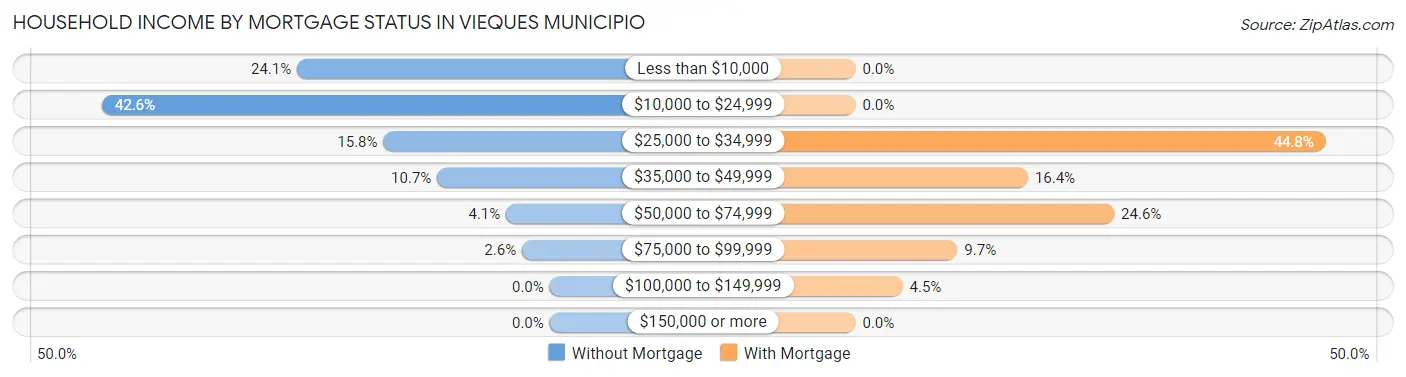
| Household Income | Without Mortgage | With Mortgage |
| Less than $10,000 | 366 (24.0%) | 0 (0.0%) |
| $10,000 to $24,999 | 649 (42.6%) | 0 (0.0%) |
| $25,000 to $34,999 | 241 (15.8%) | 120 (44.8%) |
| $35,000 to $49,999 | 163 (10.7%) | 44 (16.4%) |
| $50,000 to $74,999 | 63 (4.1%) | 66 (24.6%) |
| $75,000 to $99,999 | 40 (2.6%) | 26 (9.7%) |
| $100,000 to $149,999 | 0 (0.0%) | 12 (4.5%) |
| $150,000 or more | 0 (0.0%) | 0 (0.0%) |
| Total | 1,522 (100.0%) | 268 (100.0%) |
Property Value to Household Income Ratio in Vieques Municipio
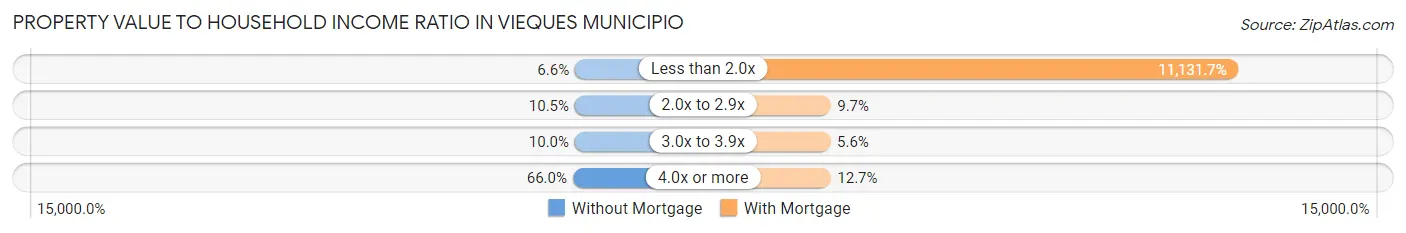
| Value-to-Income Ratio | Without Mortgage | With Mortgage |
| Less than 2.0x | 100 (6.6%) | 29,833 (11,131.7%) |
| 2.0x to 2.9x | 159 (10.4%) | 26 (9.7%) |
| 3.0x to 3.9x | 152 (10.0%) | 15 (5.6%) |
| 4.0x or more | 1,004 (66.0%) | 34 (12.7%) |
| Total | 1,522 (100.0%) | 268 (100.0%) |
Real Estate Taxes by Mortgage Status in Vieques Municipio
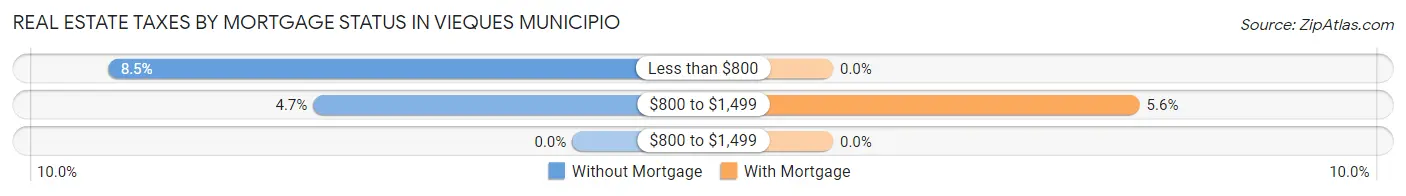
| Property Taxes | Without Mortgage | With Mortgage |
| Less than $800 | 129 (8.5%) | 0 (0.0%) |
| $800 to $1,499 | 72 (4.7%) | 15 (5.6%) |
| $800 to $1,499 | 0 (0.0%) | 0 (0.0%) |
| Total | 1,522 (100.0%) | 268 (100.0%) |
Health & Disability in Vieques Municipio
Health Insurance Coverage by Age in Vieques Municipio
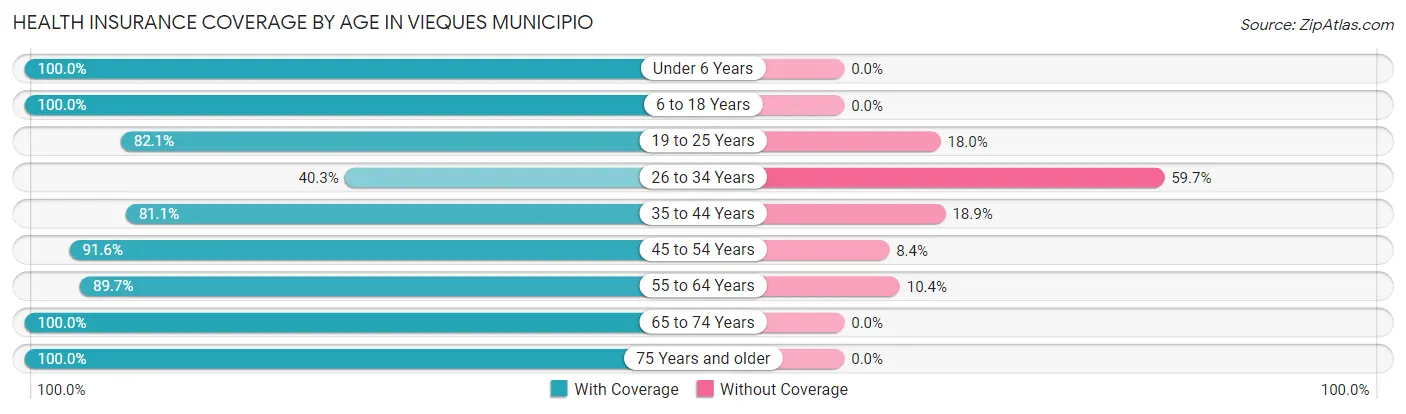
| Age Bracket | With Coverage | Without Coverage |
| Under 6 Years | 444 (100.0%) | 0 (0.0%) |
| 6 to 18 Years | 1,174 (100.0%) | 0 (0.0%) |
| 19 to 25 Years | 585 (82.1%) | 128 (17.9%) |
| 26 to 34 Years | 240 (40.3%) | 355 (59.7%) |
| 35 to 44 Years | 916 (81.1%) | 213 (18.9%) |
| 45 to 54 Years | 831 (91.6%) | 76 (8.4%) |
| 55 to 64 Years | 1,161 (89.6%) | 134 (10.3%) |
| 65 to 74 Years | 1,048 (100.0%) | 0 (0.0%) |
| 75 Years and older | 894 (100.0%) | 0 (0.0%) |
| Total | 7,293 (88.9%) | 906 (11.1%) |
Health Insurance Coverage by Citizenship Status in Vieques Municipio
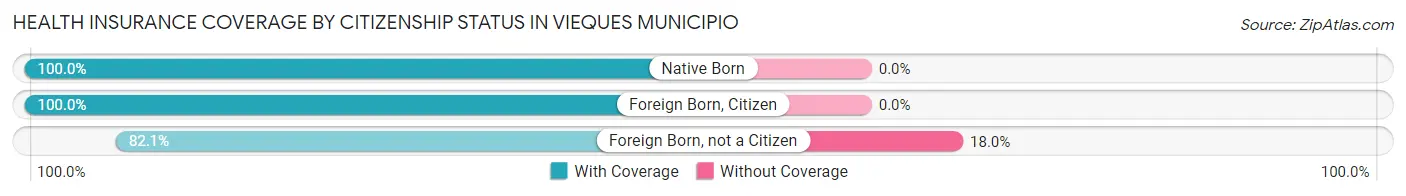
| Citizenship Status | With Coverage | Without Coverage |
| Native Born | 444 (100.0%) | 0 (0.0%) |
| Foreign Born, Citizen | 1,174 (100.0%) | 0 (0.0%) |
| Foreign Born, not a Citizen | 585 (82.1%) | 128 (17.9%) |
Health Insurance Coverage by Household Income in Vieques Municipio
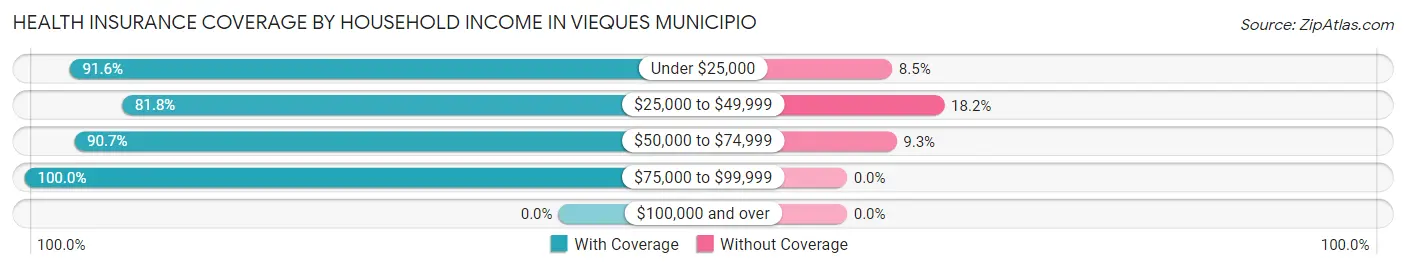
| Household Income | With Coverage | Without Coverage |
| Under $25,000 | 4,780 (91.5%) | 441 (8.5%) |
| $25,000 to $49,999 | 1,856 (81.8%) | 414 (18.2%) |
| $50,000 to $74,999 | 498 (90.7%) | 51 (9.3%) |
| $75,000 to $99,999 | 159 (100.0%) | 0 (0.0%) |
| $100,000 and over | 0 (0.0%) | 0 (0.0%) |
Public vs Private Health Insurance Coverage by Age in Vieques Municipio
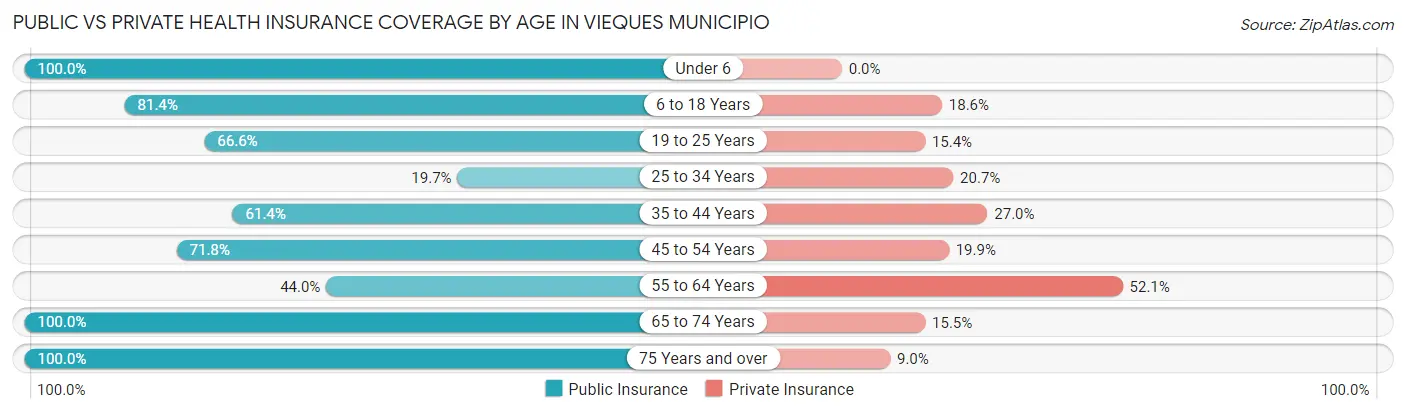
| Age Bracket | Public Insurance | Private Insurance |
| Under 6 | 444 (100.0%) | 0 (0.0%) |
| 6 to 18 Years | 956 (81.4%) | 218 (18.6%) |
| 19 to 25 Years | 475 (66.6%) | 110 (15.4%) |
| 25 to 34 Years | 117 (19.7%) | 123 (20.7%) |
| 35 to 44 Years | 693 (61.4%) | 305 (27.0%) |
| 45 to 54 Years | 651 (71.8%) | 180 (19.9%) |
| 55 to 64 Years | 570 (44.0%) | 675 (52.1%) |
| 65 to 74 Years | 1,048 (100.0%) | 162 (15.5%) |
| 75 Years and over | 894 (100.0%) | 80 (8.9%) |
| Total | 5,848 (71.3%) | 1,853 (22.6%) |
Disability Status by Sex by Age in Vieques Municipio
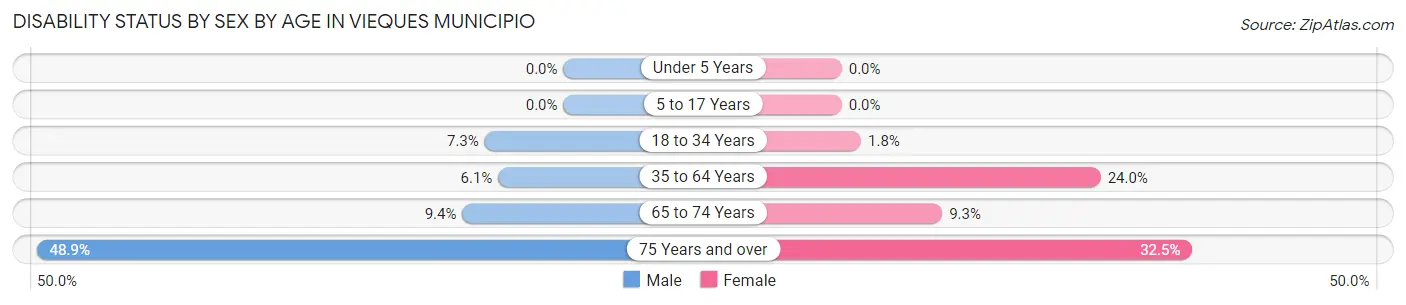
| Age Bracket | Male | Female |
| Under 5 Years | 0 (0.0%) | 0 (0.0%) |
| 5 to 17 Years | 0 (0.0%) | 0 (0.0%) |
| 18 to 34 Years | 57 (7.3%) | 12 (1.8%) |
| 35 to 64 Years | 102 (6.0%) | 395 (24.0%) |
| 65 to 74 Years | 50 (9.4%) | 48 (9.3%) |
| 75 Years and over | 198 (48.9%) | 159 (32.5%) |
Disability Class by Sex by Age in Vieques Municipio
Disability Class: Hearing Difficulty
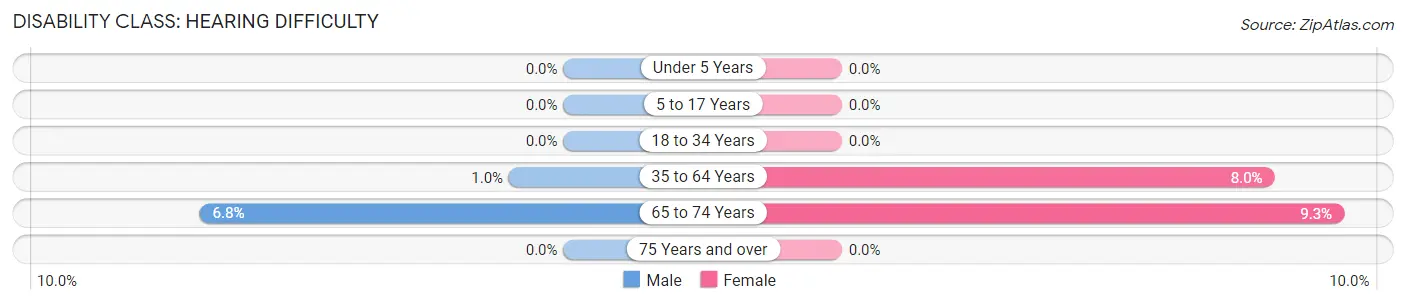
| Age Bracket | Male | Female |
| Under 5 Years | 0 (0.0%) | 0 (0.0%) |
| 5 to 17 Years | 0 (0.0%) | 0 (0.0%) |
| 18 to 34 Years | 0 (0.0%) | 0 (0.0%) |
| 35 to 64 Years | 17 (1.0%) | 132 (8.0%) |
| 65 to 74 Years | 36 (6.8%) | 48 (9.3%) |
| 75 Years and over | 0 (0.0%) | 0 (0.0%) |
Disability Class: Vision Difficulty
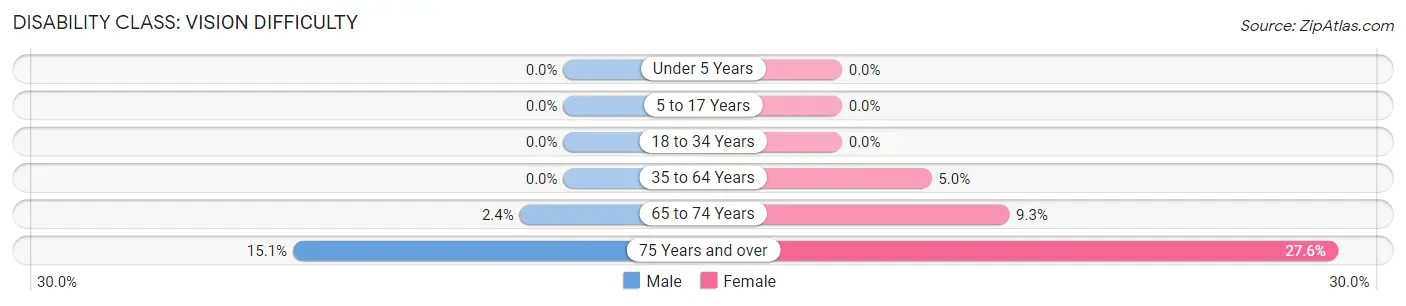
| Age Bracket | Male | Female |
| Under 5 Years | 0 (0.0%) | 0 (0.0%) |
| 5 to 17 Years | 0 (0.0%) | 0 (0.0%) |
| 18 to 34 Years | 0 (0.0%) | 0 (0.0%) |
| 35 to 64 Years | 0 (0.0%) | 82 (5.0%) |
| 65 to 74 Years | 13 (2.4%) | 48 (9.3%) |
| 75 Years and over | 61 (15.1%) | 135 (27.6%) |
Disability Class: Cognitive Difficulty
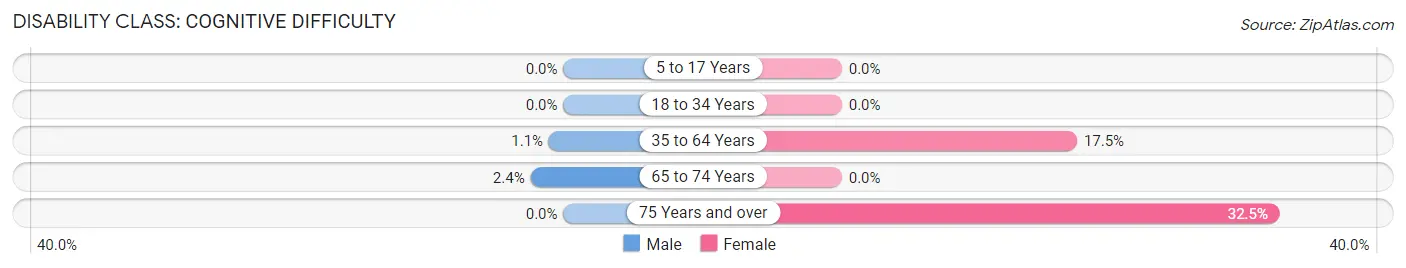
| Age Bracket | Male | Female |
| 5 to 17 Years | 0 (0.0%) | 0 (0.0%) |
| 18 to 34 Years | 0 (0.0%) | 0 (0.0%) |
| 35 to 64 Years | 18 (1.1%) | 287 (17.5%) |
| 65 to 74 Years | 13 (2.4%) | 0 (0.0%) |
| 75 Years and over | 0 (0.0%) | 159 (32.5%) |
Disability Class: Ambulatory Difficulty
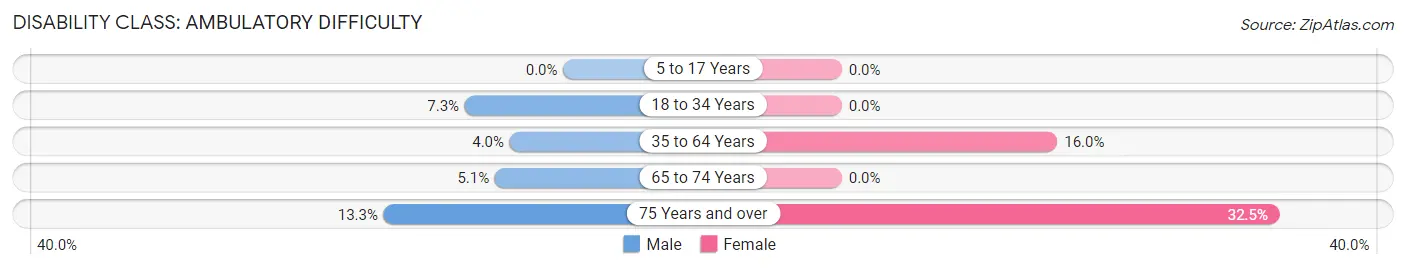
| Age Bracket | Male | Female |
| 5 to 17 Years | 0 (0.0%) | 0 (0.0%) |
| 18 to 34 Years | 57 (7.3%) | 0 (0.0%) |
| 35 to 64 Years | 67 (4.0%) | 263 (16.0%) |
| 65 to 74 Years | 27 (5.1%) | 0 (0.0%) |
| 75 Years and over | 54 (13.3%) | 159 (32.5%) |
Disability Class: Self-Care Difficulty
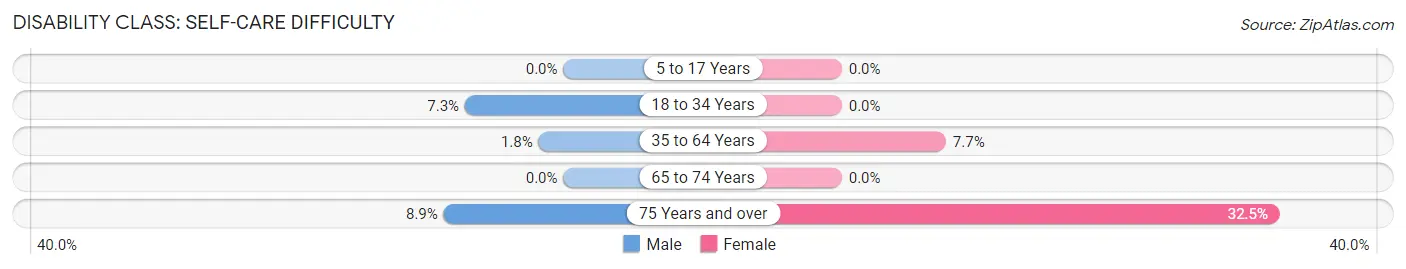
| Age Bracket | Male | Female |
| 5 to 17 Years | 0 (0.0%) | 0 (0.0%) |
| 18 to 34 Years | 57 (7.3%) | 0 (0.0%) |
| 35 to 64 Years | 31 (1.8%) | 127 (7.7%) |
| 65 to 74 Years | 0 (0.0%) | 0 (0.0%) |
| 75 Years and over | 36 (8.9%) | 159 (32.5%) |
Technology Access in Vieques Municipio
Computing Device Access in Vieques Municipio
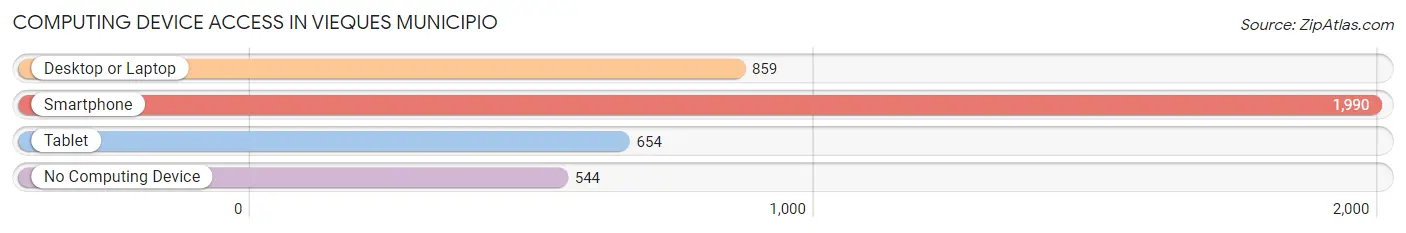
| Device Type | # Households | % Households |
| Desktop or Laptop | 859 | 32.9% |
| Smartphone | 1,990 | 76.3% |
| Tablet | 654 | 25.1% |
| No Computing Device | 544 | 20.9% |
| Total | 2,608 | 100.0% |
Internet Access in Vieques Municipio
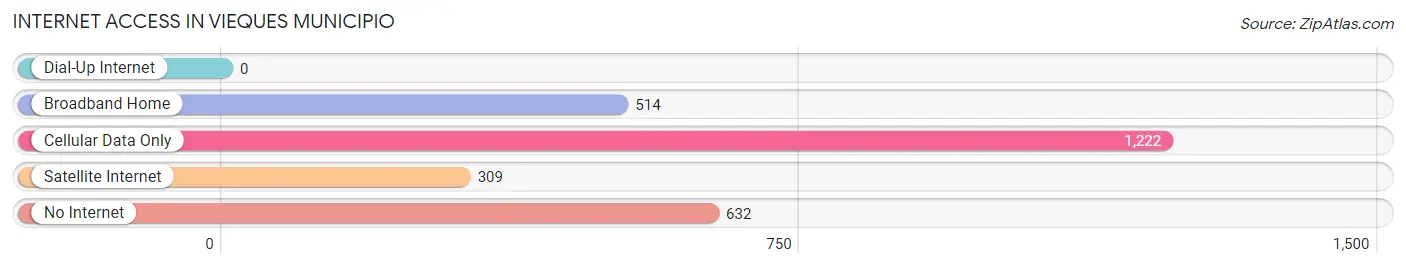
| Internet Type | # Households | % Households |
| Dial-Up Internet | 0 | 0.0% |
| Broadband Home | 514 | 19.7% |
| Cellular Data Only | 1,222 | 46.9% |
| Satellite Internet | 309 | 11.8% |
| No Internet | 632 | 24.2% |
| Total | 2,608 | 100.0% |
Vieques Municipio Summary
Vieques Municipio is a municipality located in the eastern Caribbean Sea, off the coast of Puerto Rico. It is part of the archipelago of the Virgin Islands and is the smallest of the three main islands of Puerto Rico. The municipality is composed of two main islands, Vieques and Culebra, and several smaller islands and cays. The total land area of the municipality is approximately 100 square miles.
Vieques Municipio is located in the eastern Caribbean Sea, approximately 8 miles east of the main island of Puerto Rico. It is bordered by the Caribbean Sea to the north, the Atlantic Ocean to the east, and the Virgin Islands to the south. The municipality is composed of two main islands, Vieques and Culebra, and several smaller islands and cays. The total land area of the municipality is approximately 100 square miles.
The population of Vieques Municipio was 9,301 in 2000, with a population density of 93 people per square mile. The population is predominantly of Hispanic origin, with a small minority of African-American and other ethnicities. The median age of the population is 33.5 years, and the median household income is $17,845.
The economy of Vieques Municipio is largely based on tourism and fishing. The municipality is home to several resorts and hotels, as well as a number of restaurants and bars. Fishing is also an important part of the economy, with the main catches being tuna, mahi-mahi, and snapper. Agriculture is also an important part of the economy, with the main crops being sugarcane, plantains, and bananas.
Vieques Municipio is home to a number of protected areas, including the Vieques National Wildlife Refuge, the Vieques National Forest, and the Vieques National Marine Sanctuary. The municipality is also home to a number of historic sites, including the Fortín de San Carlos Borromeo, the Fuerte de Vieques, and the Castillo de San Cristóbal.
Vieques Municipio is a popular tourist destination, with its beautiful beaches, lush forests, and vibrant culture. The municipality is also home to a number of festivals and events, including the Vieques Music Festival, the Vieques International Film Festival, and the Vieques Arts and Crafts Fair.
Vieques Municipio is a vibrant and diverse municipality, with a rich history and culture. The municipality is home to a number of protected areas, historic sites, and festivals, making it a popular tourist destination. The economy of the municipality is largely based on tourism and fishing, with agriculture also playing an important role. The population of the municipality is predominantly of Hispanic origin, with a small minority of African-American and other ethnicities.
Common Questions
What is Per Capita Income in Vieques Municipio?
Per Capita income in Vieques Municipio is $9,193.
What is the Median Family Income in Vieques Municipio?
Median Family Income in Vieques Municipio is $20,134.
What is the Median Household income in Vieques Municipio?
Median Household Income in Vieques Municipio is $17,062.
What is Income or Wage Gap in Vieques Municipio?
Income or Wage Gap in Vieques Municipio is 11.4%.
Women in Vieques Municipio earn 88.6 cents for every dollar earned by a man.
What is Family Income Deficit in Vieques Municipio?
Family Income Deficit in Vieques Municipio is $11,244.
Families that are below poverty line in Vieques Municipio earn $11,244 less on average than the poverty threshold level.
What is Inequality or Gini Index in Vieques Municipio?
Inequality or Gini Index in Vieques Municipio is 0.42.
What is the Total Population of Vieques Municipio?
Total Population of Vieques Municipio is 8,199.
What is the Total Male Population of Vieques Municipio?
Total Male Population of Vieques Municipio is 4,179.
What is the Total Female Population of Vieques Municipio?
Total Female Population of Vieques Municipio is 4,020.
What is the Ratio of Males per 100 Females in Vieques Municipio?
There are 103.96 Males per 100 Females in Vieques Municipio.
What is the Ratio of Females per 100 Males in Vieques Municipio?
There are 96.20 Females per 100 Males in Vieques Municipio.
What is the Median Population Age in Vieques Municipio?
Median Population Age in Vieques Municipio is 45.3 Years.
What is the Average Family Size in Vieques Municipio
Average Family Size in Vieques Municipio is 4.3 People.
What is the Average Household Size in Vieques Municipio
Average Household Size in Vieques Municipio is 3.1 People.
How Large is the Labor Force in Vieques Municipio?
There are 2,392 People in the Labor Forcein in Vieques Municipio.
What is the Percentage of People in the Labor Force in Vieques Municipio?
34.6% of People are in the Labor Force in Vieques Municipio.
What is the Unemployment Rate in Vieques Municipio?
Unemployment Rate in Vieques Municipio is 13.1%.