Vega Baja Municipio, PR Map & Demographics
Vega Baja Municipio Map
Vega Baja Municipio Overview
$14,818
PER CAPITA INCOME
$28,648
AVG FAMILY INCOME
$23,701
AVG HOUSEHOLD INCOME
1.9%
WAGE / INCOME GAP [ % ]
98.1¢/ $1
WAGE / INCOME GAP [ $ ]
$11,940
FAMILY INCOME DEFICIT
0.54
INEQUALITY / GINI INDEX
54,182
TOTAL POPULATION
25,849
MALE POPULATION
28,333
FEMALE POPULATION
91.23
MALES / 100 FEMALES
109.61
FEMALES / 100 MALES
43.9
MEDIAN AGE
3.3
AVG FAMILY SIZE
2.7
AVG HOUSEHOLD SIZE
20,272
LABOR FORCE [ PEOPLE ]
44.1%
PERCENT IN LABOR FORCE
16.3%
UNEMPLOYMENT RATE
Vega Baja Municipio Area Codes
Income in Vega Baja Municipio
Income Overview in Vega Baja Municipio
Per Capita Income in Vega Baja Municipio is $14,818, while median incomes of families and households are $28,648 and $23,701 respectively.
| Characteristic | Number | Measure |
| Per Capita Income | 54,182 | $14,818 |
| Median Family Income | 13,088 | $28,648 |
| Mean Family Income | 13,088 | $43,183 |
| Median Household Income | 20,098 | $23,701 |
| Mean Household Income | 20,098 | $37,287 |
| Income Deficit | 13,088 | $11,940 |
| Wage / Income Gap (%) | 54,182 | 1.90% |
| Wage / Income Gap ($) | 54,182 | 98.10¢ per $1 |
| Gini / Inequality Index | 54,182 | 0.54 |
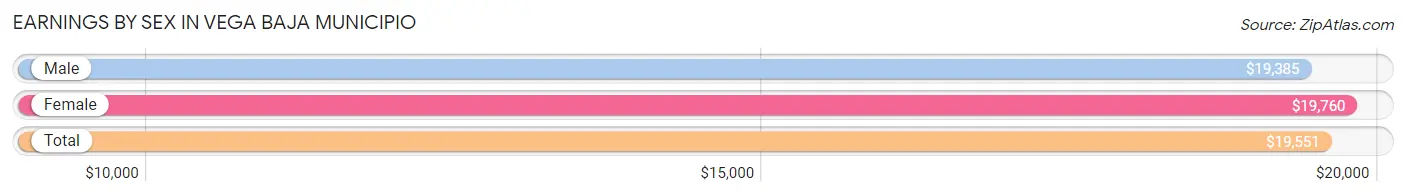
Earnings by Sex in Vega Baja Municipio
Average Earnings in Vega Baja Municipio are $19,551, $19,385 for men and $19,760 for women, a difference of 1.9%.
| Sex | Number | Average Earnings |
| Male | 9,788 (53.6%) | $19,385 |
| Female | 8,483 (46.4%) | $19,760 |
| Total | 18,271 (100.0%) | $19,551 |
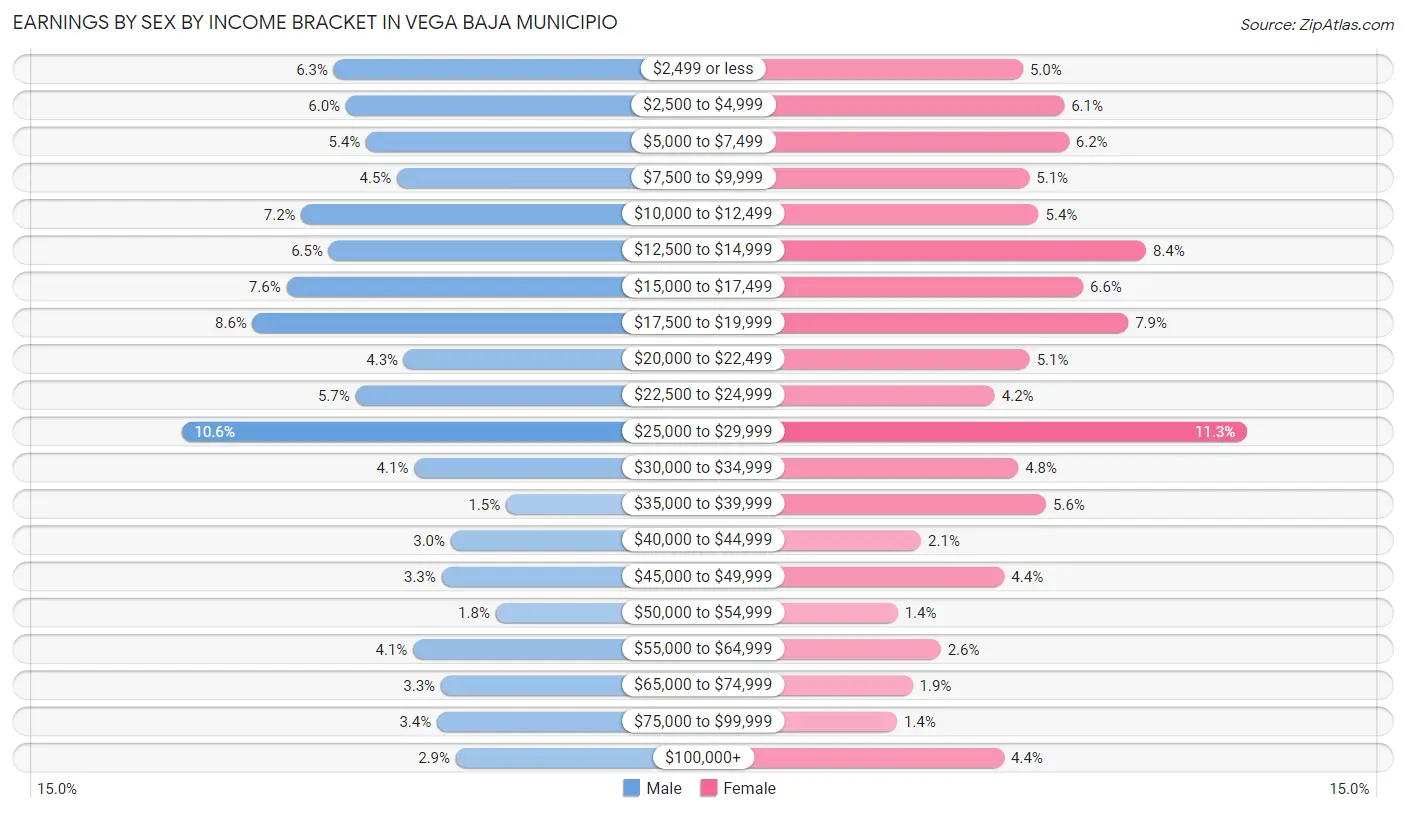
Earnings by Sex by Income Bracket in Vega Baja Municipio
The most common earnings brackets in Vega Baja Municipio are $25,000 to $29,999 for men (1,037 | 10.6%) and $25,000 to $29,999 for women (954 | 11.3%).
| Income | Male | Female |
| $2,499 or less | 618 (6.3%) | 420 (5.0%) |
| $2,500 to $4,999 | 584 (6.0%) | 518 (6.1%) |
| $5,000 to $7,499 | 529 (5.4%) | 529 (6.2%) |
| $7,500 to $9,999 | 443 (4.5%) | 435 (5.1%) |
| $10,000 to $12,499 | 707 (7.2%) | 457 (5.4%) |
| $12,500 to $14,999 | 631 (6.5%) | 713 (8.4%) |
| $15,000 to $17,499 | 748 (7.6%) | 563 (6.6%) |
| $17,500 to $19,999 | 841 (8.6%) | 671 (7.9%) |
| $20,000 to $22,499 | 425 (4.3%) | 436 (5.1%) |
| $22,500 to $24,999 | 558 (5.7%) | 353 (4.2%) |
| $25,000 to $29,999 | 1,037 (10.6%) | 954 (11.3%) |
| $30,000 to $34,999 | 396 (4.1%) | 409 (4.8%) |
| $35,000 to $39,999 | 144 (1.5%) | 475 (5.6%) |
| $40,000 to $44,999 | 296 (3.0%) | 177 (2.1%) |
| $45,000 to $49,999 | 321 (3.3%) | 376 (4.4%) |
| $50,000 to $54,999 | 172 (1.8%) | 121 (1.4%) |
| $55,000 to $64,999 | 399 (4.1%) | 224 (2.6%) |
| $65,000 to $74,999 | 323 (3.3%) | 157 (1.8%) |
| $75,000 to $99,999 | 334 (3.4%) | 120 (1.4%) |
| $100,000+ | 282 (2.9%) | 375 (4.4%) |
| Total | 9,788 (100.0%) | 8,483 (100.0%) |
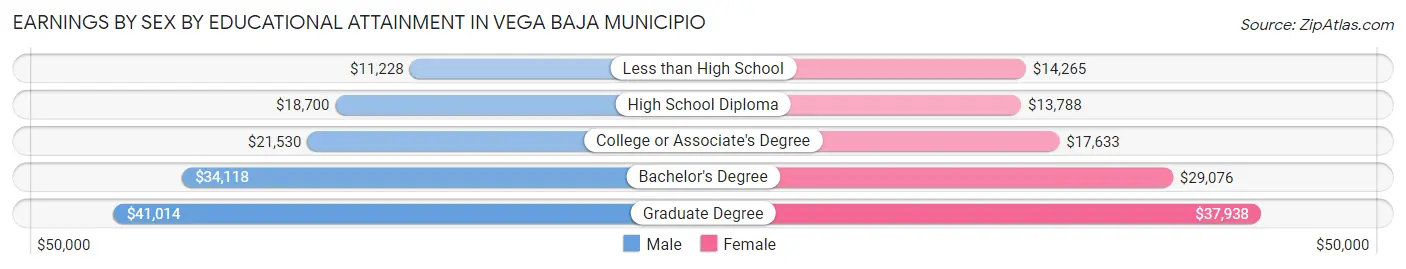
Earnings by Sex by Educational Attainment in Vega Baja Municipio
Average earnings in Vega Baja Municipio are $21,003 for men and $21,712 for women, a difference of 3.3%. Men with an educational attainment of graduate degree enjoy the highest average annual earnings of $41,014, while those with less than high school education earn the least with $11,228. Women with an educational attainment of graduate degree earn the most with the average annual earnings of $37,938, while those with high school diploma education have the smallest earnings of $13,788.
| Educational Attainment | Male Income | Female Income |
| Less than High School | $11,228 | $14,265 |
| High School Diploma | $18,700 | $13,788 |
| College or Associate's Degree | $21,530 | $17,633 |
| Bachelor's Degree | $34,118 | $29,076 |
| Graduate Degree | $41,014 | $37,938 |
| Total | $21,003 | $21,712 |
Family Income in Vega Baja Municipio
Family Income Brackets in Vega Baja Municipio
According to the Vega Baja Municipio family income data, there are 2,290 families falling into the $15,000 to $24,999 income range, which is the most common income bracket and makes up 17.5% of all families. Conversely, the $150,000 to $199,999 income bracket is the least frequent group with only 79 families (0.6%) belonging to this category.
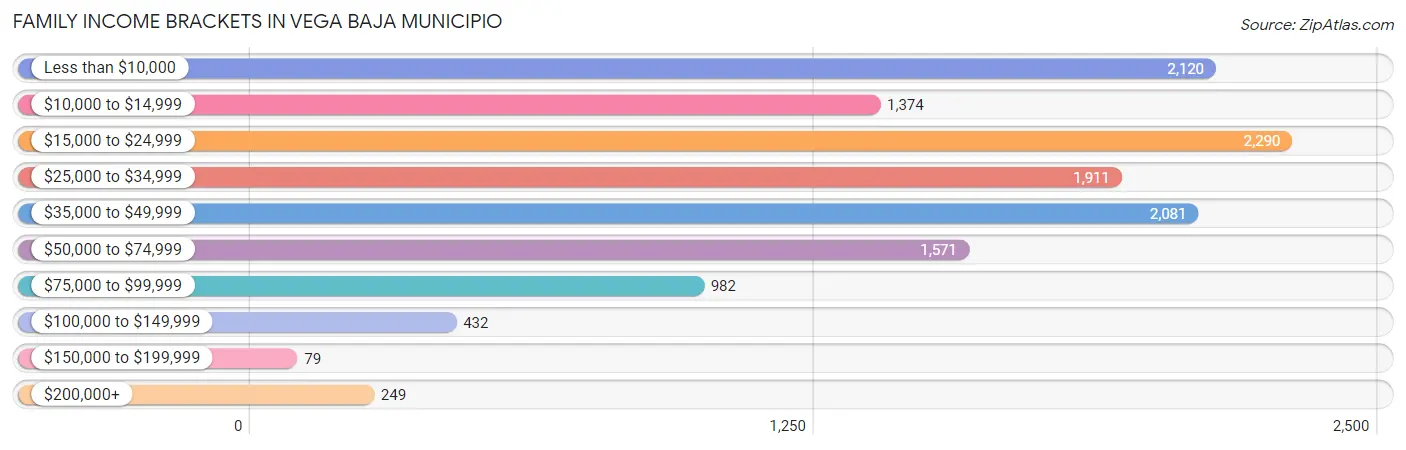
| Income Bracket | # Families | % Families |
| Less than $10,000 | 2,120 | 16.2% |
| $10,000 to $14,999 | 1,374 | 10.5% |
| $15,000 to $24,999 | 2,290 | 17.5% |
| $25,000 to $34,999 | 1,911 | 14.6% |
| $35,000 to $49,999 | 2,081 | 15.9% |
| $50,000 to $74,999 | 1,571 | 12.0% |
| $75,000 to $99,999 | 982 | 7.5% |
| $100,000 to $149,999 | 432 | 3.3% |
| $150,000 to $199,999 | 79 | 0.6% |
| $200,000+ | 249 | 1.9% |
Family Income by Famaliy Size in Vega Baja Municipio
5-person families (696 | 5.3%) account for the highest median family income in Vega Baja Municipio with $40,720 per family, while 2-person families (5,855 | 44.7%) have the highest median income of $12,407 per family member.
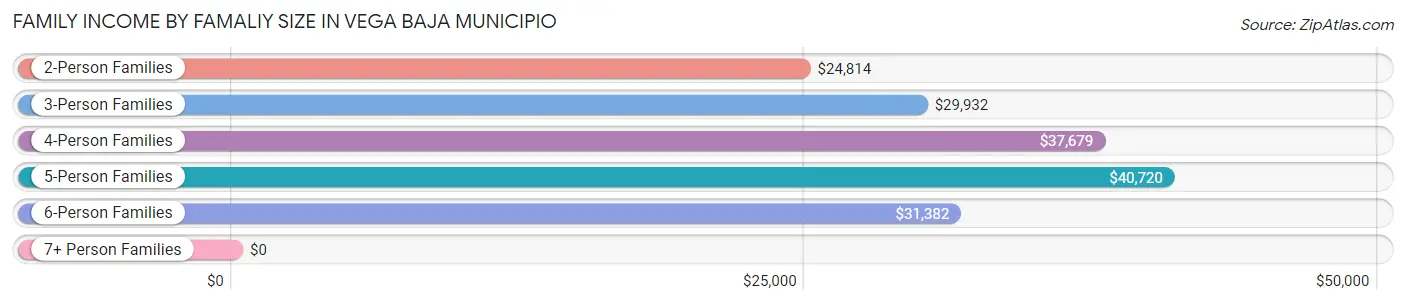
| Income Bracket | # Families | Median Income |
| 2-Person Families | 5,855 (44.7%) | $24,814 |
| 3-Person Families | 4,137 (31.6%) | $29,932 |
| 4-Person Families | 2,253 (17.2%) | $37,679 |
| 5-Person Families | 696 (5.3%) | $40,720 |
| 6-Person Families | 99 (0.8%) | $31,382 |
| 7+ Person Families | 48 (0.4%) | $0 |
| Total | 13,088 (100.0%) | $28,648 |
Family Income by Number of Earners in Vega Baja Municipio
The median family income in Vega Baja Municipio is $28,648, with families comprising 3+ earners (406) having the highest median family income of $61,250, while families with no earners (4,536) have the lowest median family income of $17,965, accounting for 3.1% and 34.7% of families, respectively.
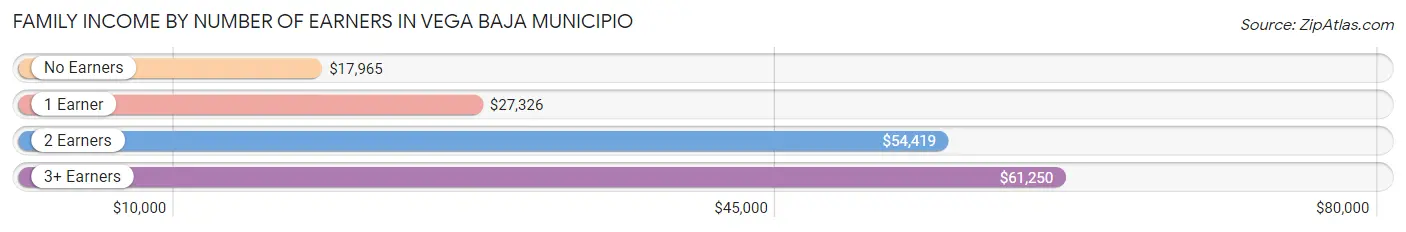
| Number of Earners | # Families | Median Income |
| No Earners | 4,536 (34.7%) | $17,965 |
| 1 Earner | 5,582 (42.6%) | $27,326 |
| 2 Earners | 2,564 (19.6%) | $54,419 |
| 3+ Earners | 406 (3.1%) | $61,250 |
| Total | 13,088 (100.0%) | $28,648 |
Household Income in Vega Baja Municipio
Household Income Brackets in Vega Baja Municipio
With 4,221 households falling in the category, the less than $10,000 income range is the most frequent in Vega Baja Municipio, accounting for 21.0% of all households. In contrast, only 141 households (0.7%) fall into the $150,000 to $199,999 income bracket, making it the least populous group.
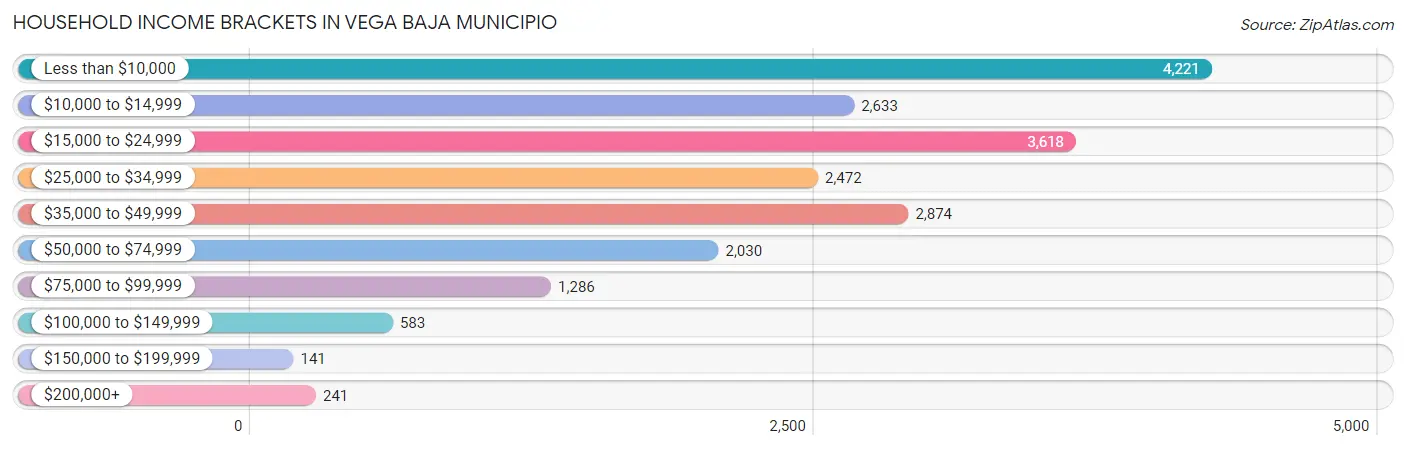
| Income Bracket | # Households | % Households |
| Less than $10,000 | 4,221 | 21.0% |
| $10,000 to $14,999 | 2,633 | 13.1% |
| $15,000 to $24,999 | 3,618 | 18.0% |
| $25,000 to $34,999 | 2,472 | 12.3% |
| $35,000 to $49,999 | 2,874 | 14.3% |
| $50,000 to $74,999 | 2,030 | 10.1% |
| $75,000 to $99,999 | 1,286 | 6.4% |
| $100,000 to $149,999 | 583 | 2.9% |
| $150,000 to $199,999 | 141 | 0.7% |
| $200,000+ | 241 | 1.2% |
Household Income by Householder Age in Vega Baja Municipio
The median household income in Vega Baja Municipio is $23,701, with the highest median household income of $30,252 found in the 25 to 44 years age bracket for the primary householder. A total of 4,844 households (24.1%) fall into this category. Meanwhile, the 15 to 24 years age bracket for the primary householder has the lowest median household income of $15,362, with 231 households (1.1%) in this group.
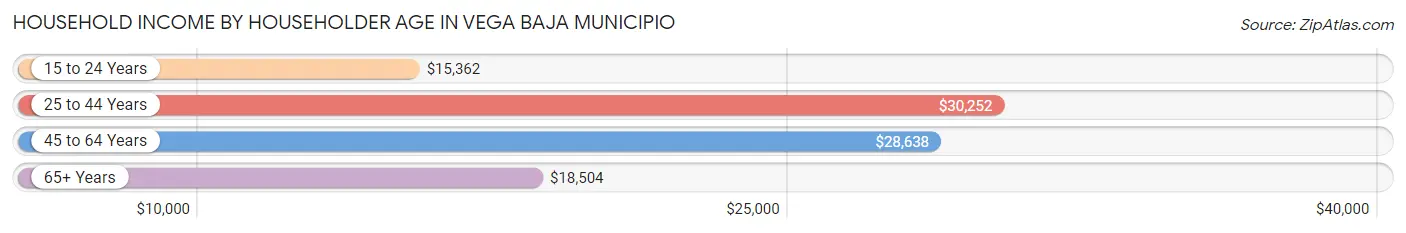
| Income Bracket | # Households | Median Income |
| 15 to 24 Years | 231 (1.1%) | $15,362 |
| 25 to 44 Years | 4,844 (24.1%) | $30,252 |
| 45 to 64 Years | 7,586 (37.8%) | $28,638 |
| 65+ Years | 7,437 (37.0%) | $18,504 |
| Total | 20,098 (100.0%) | $23,701 |
Poverty in Vega Baja Municipio
Income Below Poverty by Sex and Age in Vega Baja Municipio
With 41.3% poverty level for males and 45.0% for females among the residents of Vega Baja Municipio, 16 and 17 year old males and 15 year old females are the most vulnerable to poverty, with 474 males (73.6%) and 244 females (74.4%) in their respective age groups living below the poverty level.
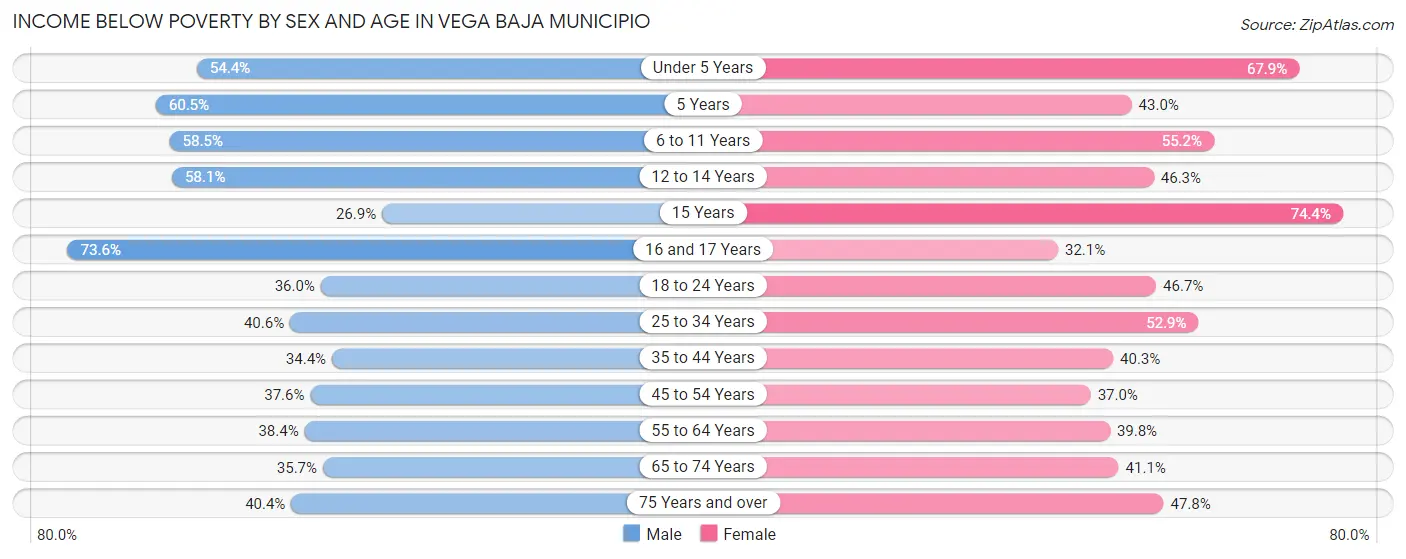
| Age Bracket | Male | Female |
| Under 5 Years | 561 (54.4%) | 628 (67.9%) |
| 5 Years | 72 (60.5%) | 102 (43.0%) |
| 6 to 11 Years | 1,012 (58.5%) | 739 (55.2%) |
| 12 to 14 Years | 516 (58.1%) | 494 (46.3%) |
| 15 Years | 101 (26.9%) | 244 (74.4%) |
| 16 and 17 Years | 474 (73.6%) | 193 (32.1%) |
| 18 to 24 Years | 892 (36.0%) | 1,117 (46.7%) |
| 25 to 34 Years | 1,428 (40.6%) | 1,883 (52.9%) |
| 35 to 44 Years | 1,053 (34.4%) | 1,402 (40.3%) |
| 45 to 54 Years | 1,242 (37.6%) | 1,352 (37.0%) |
| 55 to 64 Years | 1,299 (38.4%) | 1,612 (39.8%) |
| 65 to 74 Years | 1,003 (35.7%) | 1,385 (41.1%) |
| 75 Years and over | 935 (40.4%) | 1,526 (47.8%) |
| Total | 10,588 (41.3%) | 12,677 (45.0%) |
Income Above Poverty by Sex and Age in Vega Baja Municipio
According to the poverty statistics in Vega Baja Municipio, males aged 15 years and females aged 16 and 17 years are the age groups that are most secure financially, with 73.1% of males and 67.9% of females in these age groups living above the poverty line.
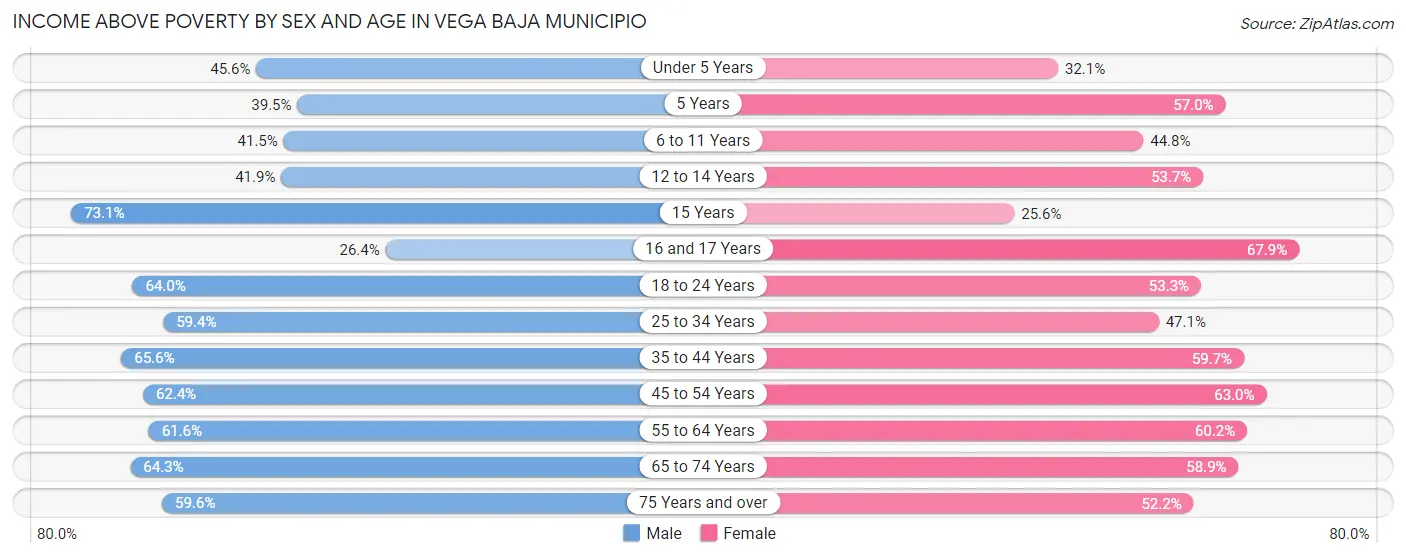
| Age Bracket | Male | Female |
| Under 5 Years | 470 (45.6%) | 297 (32.1%) |
| 5 Years | 47 (39.5%) | 135 (57.0%) |
| 6 to 11 Years | 719 (41.5%) | 599 (44.8%) |
| 12 to 14 Years | 372 (41.9%) | 572 (53.7%) |
| 15 Years | 274 (73.1%) | 84 (25.6%) |
| 16 and 17 Years | 170 (26.4%) | 408 (67.9%) |
| 18 to 24 Years | 1,584 (64.0%) | 1,276 (53.3%) |
| 25 to 34 Years | 2,090 (59.4%) | 1,674 (47.1%) |
| 35 to 44 Years | 2,011 (65.6%) | 2,078 (59.7%) |
| 45 to 54 Years | 2,063 (62.4%) | 2,306 (63.0%) |
| 55 to 64 Years | 2,080 (61.6%) | 2,436 (60.2%) |
| 65 to 74 Years | 1,806 (64.3%) | 1,984 (58.9%) |
| 75 Years and over | 1,379 (59.6%) | 1,668 (52.2%) |
| Total | 15,065 (58.7%) | 15,517 (55.0%) |
Income Below Poverty Among Married-Couple Families in Vega Baja Municipio
The poverty statistics for married-couple families in Vega Baja Municipio show that 26.6% or 1,897 of the total 7,145 families live below the poverty line. Families with 3 or 4 children have the highest poverty rate of 39.4%, comprising of 67 families. On the other hand, families with no children have the lowest poverty rate of 22.1%, which includes 1,104 families.
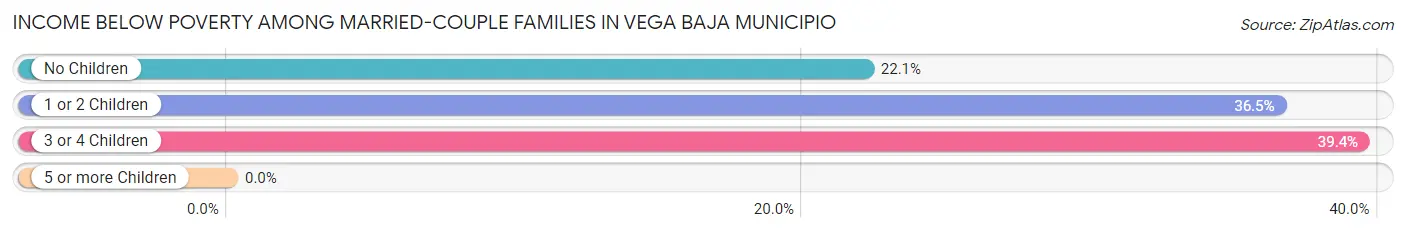
| Children | Above Poverty | Below Poverty |
| No Children | 3,882 (77.9%) | 1,104 (22.1%) |
| 1 or 2 Children | 1,263 (63.5%) | 726 (36.5%) |
| 3 or 4 Children | 103 (60.6%) | 67 (39.4%) |
| 5 or more Children | 0 (0.0%) | 0 (0.0%) |
| Total | 5,248 (73.5%) | 1,897 (26.6%) |
Income Below Poverty Among Single-Parent Households in Vega Baja Municipio
According to the poverty data in Vega Baja Municipio, 44.8% or 865 single-father households and 55.8% or 2,239 single-mother households are living below the poverty line. Among single-father households, those with 3 or 4 children have the highest poverty rate, with 83 households (100.0%) experiencing poverty. Likewise, among single-mother households, those with 3 or 4 children have the highest poverty rate, with 228 households (100.0%) falling below the poverty line.
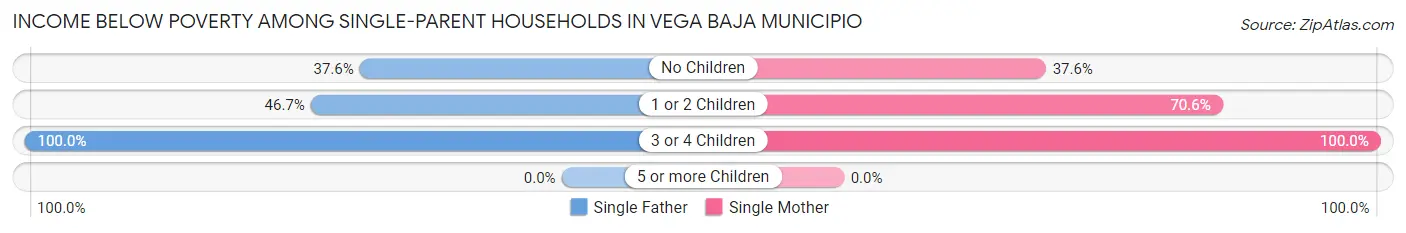
| Children | Single Father | Single Mother |
| No Children | 340 (37.6%) | 751 (37.6%) |
| 1 or 2 Children | 442 (46.7%) | 1,260 (70.6%) |
| 3 or 4 Children | 83 (100.0%) | 228 (100.0%) |
| 5 or more Children | 0 (0.0%) | 0 (0.0%) |
| Total | 865 (44.8%) | 2,239 (55.8%) |
Income Below Poverty Among Married-Couple vs Single-Parent Households in Vega Baja Municipio
The poverty data for Vega Baja Municipio shows that 1,897 of the married-couple family households (26.6%) and 3,104 of the single-parent households (52.2%) are living below the poverty level. Within the married-couple family households, those with 3 or 4 children have the highest poverty rate, with 67 households (39.4%) falling below the poverty line. Among the single-parent households, those with 3 or 4 children have the highest poverty rate, with 311 household (100.0%) living below poverty.
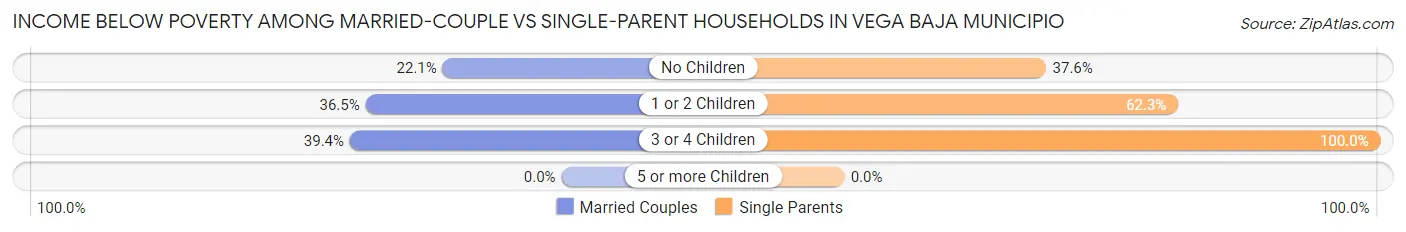
| Children | Married-Couple Families | Single-Parent Households |
| No Children | 1,104 (22.1%) | 1,091 (37.6%) |
| 1 or 2 Children | 726 (36.5%) | 1,702 (62.3%) |
| 3 or 4 Children | 67 (39.4%) | 311 (100.0%) |
| 5 or more Children | 0 (0.0%) | 0 (0.0%) |
| Total | 1,897 (26.6%) | 3,104 (52.2%) |
Race in Vega Baja Municipio
The most populous races in Vega Baja Municipio are Hispanic or Latino (53,023 | 97.9%), White / Caucasian (21,954 | 40.5%), and Two or more Races (19,964 | 36.8%).
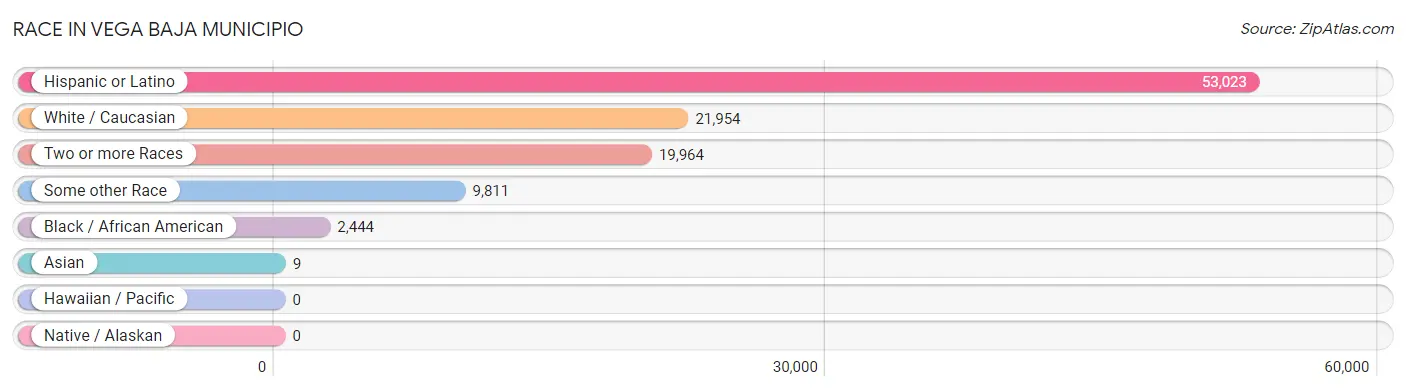
| Race | # Population | % Population |
| Asian | 9 | 0.0% |
| Black / African American | 2,444 | 4.5% |
| Hawaiian / Pacific | 0 | 0.0% |
| Hispanic or Latino | 53,023 | 97.9% |
| Native / Alaskan | 0 | 0.0% |
| White / Caucasian | 21,954 | 40.5% |
| Two or more Races | 19,964 | 36.8% |
| Some other Race | 9,811 | 18.1% |
| Total | 54,182 | 100.0% |
Ancestry in Vega Baja Municipio
The most populous ancestries reported in Vega Baja Municipio are Puerto Rican (52,069 | 96.1%), American (485 | 0.9%), Mexican (263 | 0.5%), South American (227 | 0.4%), and Colombian (198 | 0.4%), together accounting for 98.3% of all Vega Baja Municipio residents.
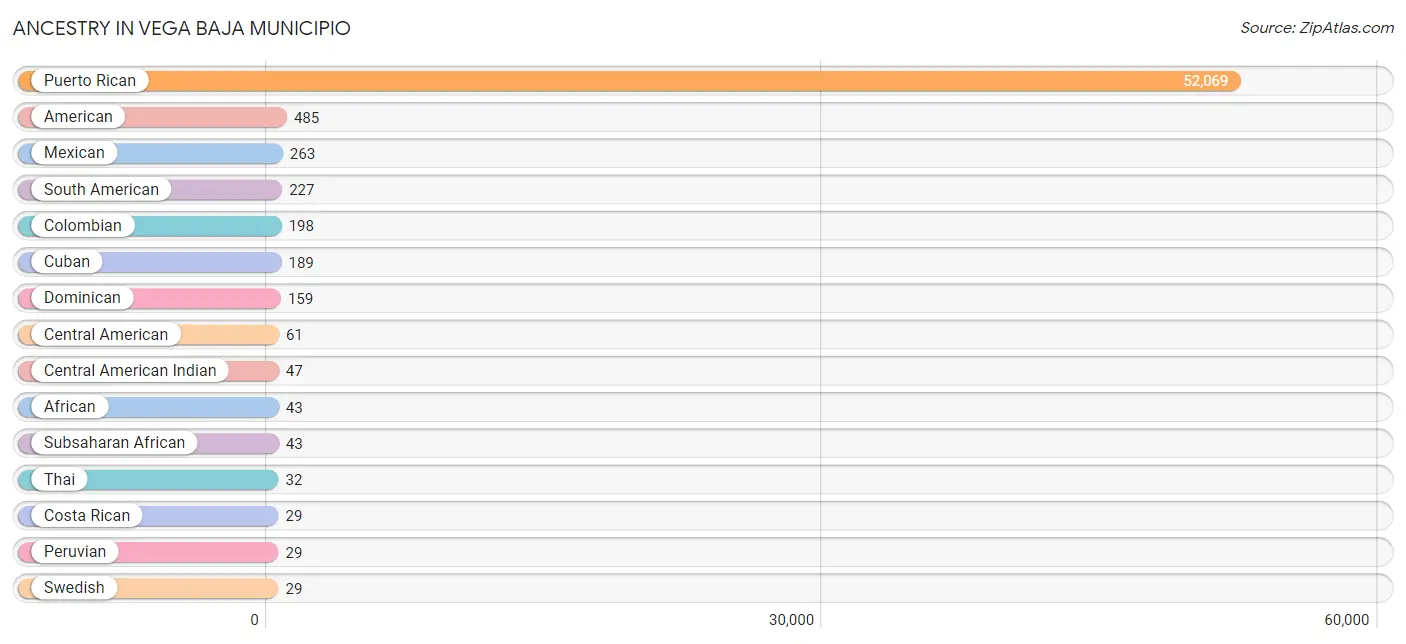
| Ancestry | # Population | % Population |
| African | 43 | 0.1% |
| American | 485 | 0.9% |
| Arab | 20 | 0.0% |
| Bhutanese | 11 | 0.0% |
| Central American | 61 | 0.1% |
| Central American Indian | 47 | 0.1% |
| Colombian | 198 | 0.4% |
| Costa Rican | 29 | 0.1% |
| Cuban | 189 | 0.4% |
| Dominican | 159 | 0.3% |
| Guatemalan | 11 | 0.0% |
| Mexican | 263 | 0.5% |
| Panamanian | 21 | 0.0% |
| Peruvian | 29 | 0.1% |
| Puerto Rican | 52,069 | 96.1% |
| South American | 227 | 0.4% |
| Spaniard | 8 | 0.0% |
| Subsaharan African | 43 | 0.1% |
| Swedish | 29 | 0.1% |
| Thai | 32 | 0.1% |
| Trinidadian and Tobagonian | 26 | 0.1% |
| West Indian | 6 | 0.0% | View All 22 Rows |
Immigrants in Vega Baja Municipio

| Immigration Origin | # Population | % Population | View All 0 Rows |
Sex and Age in Vega Baja Municipio
Sex and Age in Vega Baja Municipio
The most populous age groups in Vega Baja Municipio are 25 to 29 Years (1,888 | 7.3%) for men and 55 to 59 Years (2,301 | 8.1%) for women.
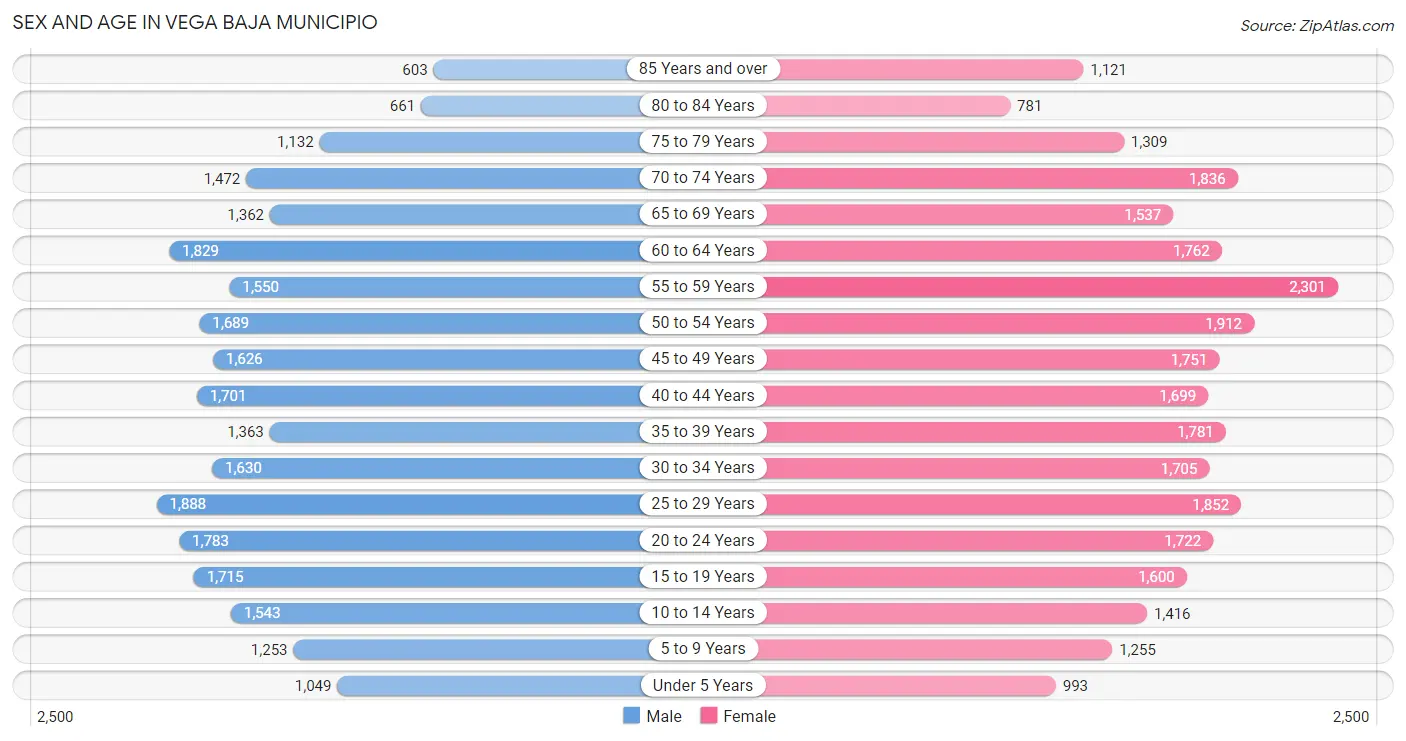
| Age Bracket | Male | Female |
| Under 5 Years | 1,049 (4.1%) | 993 (3.5%) |
| 5 to 9 Years | 1,253 (4.9%) | 1,255 (4.4%) |
| 10 to 14 Years | 1,543 (6.0%) | 1,416 (5.0%) |
| 15 to 19 Years | 1,715 (6.6%) | 1,600 (5.7%) |
| 20 to 24 Years | 1,783 (6.9%) | 1,722 (6.1%) |
| 25 to 29 Years | 1,888 (7.3%) | 1,852 (6.5%) |
| 30 to 34 Years | 1,630 (6.3%) | 1,705 (6.0%) |
| 35 to 39 Years | 1,363 (5.3%) | 1,781 (6.3%) |
| 40 to 44 Years | 1,701 (6.6%) | 1,699 (6.0%) |
| 45 to 49 Years | 1,626 (6.3%) | 1,751 (6.2%) |
| 50 to 54 Years | 1,689 (6.5%) | 1,912 (6.8%) |
| 55 to 59 Years | 1,550 (6.0%) | 2,301 (8.1%) |
| 60 to 64 Years | 1,829 (7.1%) | 1,762 (6.2%) |
| 65 to 69 Years | 1,362 (5.3%) | 1,537 (5.4%) |
| 70 to 74 Years | 1,472 (5.7%) | 1,836 (6.5%) |
| 75 to 79 Years | 1,132 (4.4%) | 1,309 (4.6%) |
| 80 to 84 Years | 661 (2.6%) | 781 (2.8%) |
| 85 Years and over | 603 (2.3%) | 1,121 (4.0%) |
| Total | 25,849 (100.0%) | 28,333 (100.0%) |
Families and Households in Vega Baja Municipio
Median Family Size in Vega Baja Municipio
The median family size in Vega Baja Municipio is 3.31 persons per family, with married-couple families (7,145 | 54.6%) accounting for the largest median family size of 3.37 persons per family. On the other hand, single male/father families (1,933 | 14.8%) represent the smallest median family size with 3.21 persons per family.
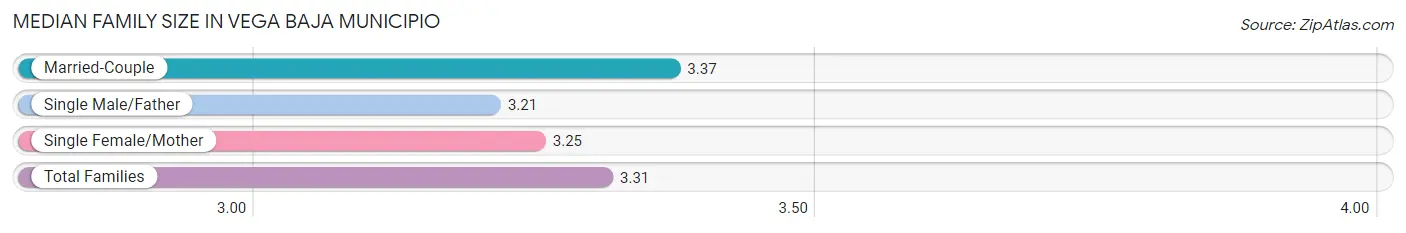
| Family Type | # Families | Family Size |
| Married-Couple | 7,145 (54.6%) | 3.37 |
| Single Male/Father | 1,933 (14.8%) | 3.21 |
| Single Female/Mother | 4,010 (30.6%) | 3.25 |
| Total Families | 13,088 (100.0%) | 3.31 |
Median Household Size in Vega Baja Municipio
The median household size in Vega Baja Municipio is 2.68 persons per household, with single male/father households (1,933 | 9.6%) accounting for the largest median household size of 3.82 persons per household. non-family households (7,010 | 34.9%) represent the smallest median household size with 1.16 persons per household.
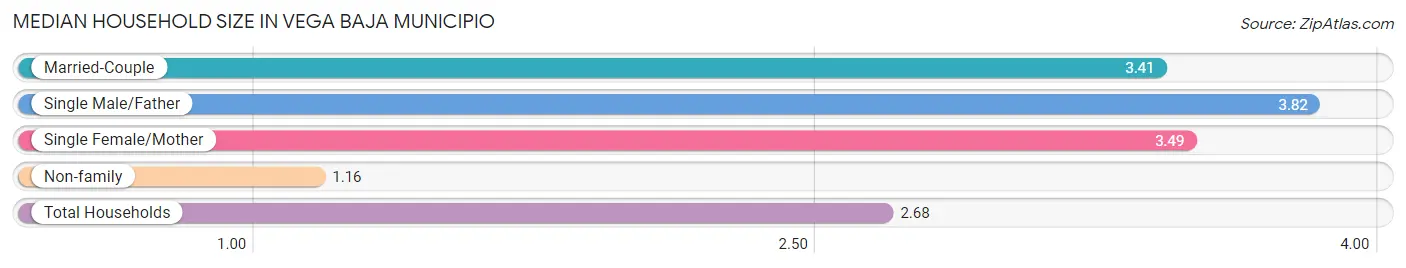
| Household Type | # Households | Household Size |
| Married-Couple | 7,145 (35.5%) | 3.41 |
| Single Male/Father | 1,933 (9.6%) | 3.82 |
| Single Female/Mother | 4,010 (20.0%) | 3.49 |
| Non-family | 7,010 (34.9%) | 1.16 |
| Total Households | 20,098 (100.0%) | 2.68 |
Household Size by Marriage Status in Vega Baja Municipio
Out of a total of 20,098 households in Vega Baja Municipio, 13,088 (65.1%) are family households, while 7,010 (34.9%) are nonfamily households. The most numerous type of family households are 2-person households, comprising 5,007, and the most common type of nonfamily households are 1-person households, comprising 5,928.
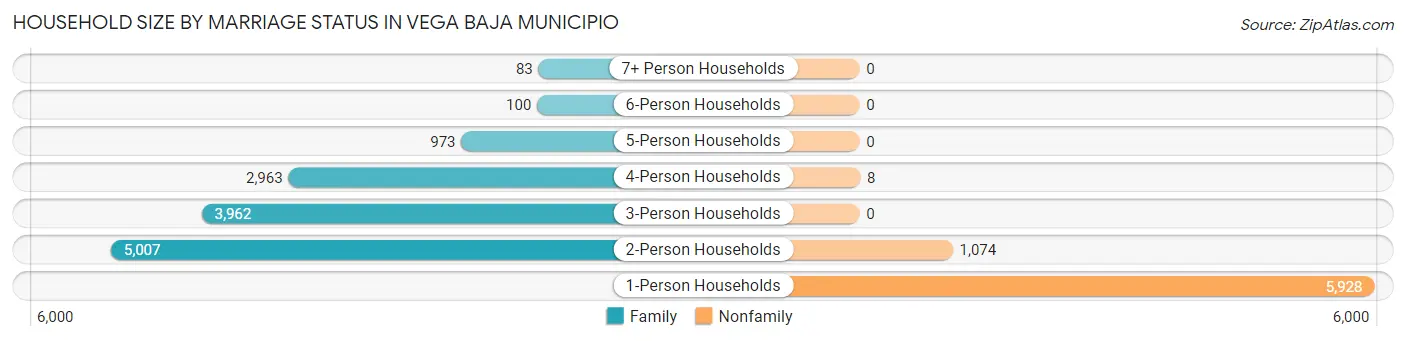
| Household Size | Family Households | Nonfamily Households |
| 1-Person Households | - | 5,928 (29.5%) |
| 2-Person Households | 5,007 (24.9%) | 1,074 (5.3%) |
| 3-Person Households | 3,962 (19.7%) | 0 (0.0%) |
| 4-Person Households | 2,963 (14.7%) | 8 (0.0%) |
| 5-Person Households | 973 (4.8%) | 0 (0.0%) |
| 6-Person Households | 100 (0.5%) | 0 (0.0%) |
| 7+ Person Households | 83 (0.4%) | 0 (0.0%) |
| Total | 13,088 (65.1%) | 7,010 (34.9%) |
Female Fertility in Vega Baja Municipio
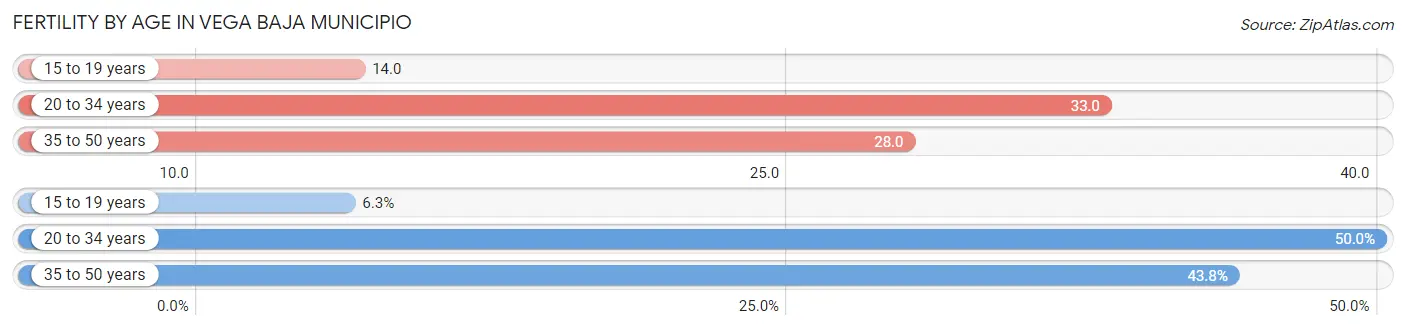
Fertility by Age in Vega Baja Municipio
Average fertility rate in Vega Baja Municipio is 28.0 births per 1,000 women. Women in the age bracket of 20 to 34 years have the highest fertility rate with 33.0 births per 1,000 women. Women in the age bracket of 20 to 34 years acount for 50.0% of all women with births.
| Age Bracket | Women with Births | Births / 1,000 Women |
| 15 to 19 years | 22 (6.2%) | 14.0 |
| 20 to 34 years | 176 (50.0%) | 33.0 |
| 35 to 50 years | 154 (43.8%) | 28.0 |
| Total | 352 (100.0%) | 28.0 |
Fertility by Age by Marriage Status in Vega Baja Municipio
58.0% of women with births (352) in Vega Baja Municipio are married. The highest percentage of unmarried women with births falls into 15 to 19 years age bracket with 100.0% of them unmarried at the time of birth, while the lowest percentage of unmarried women with births belong to 35 to 50 years age bracket with 0.0% of them unmarried.

| Age Bracket | Married | Unmarried |
| 15 to 19 years | 0 (0.0%) | 22 (100.0%) |
| 20 to 34 years | 50 (28.4%) | 126 (71.6%) |
| 35 to 50 years | 154 (100.0%) | 0 (0.0%) |
| Total | 204 (58.0%) | 148 (42.0%) |
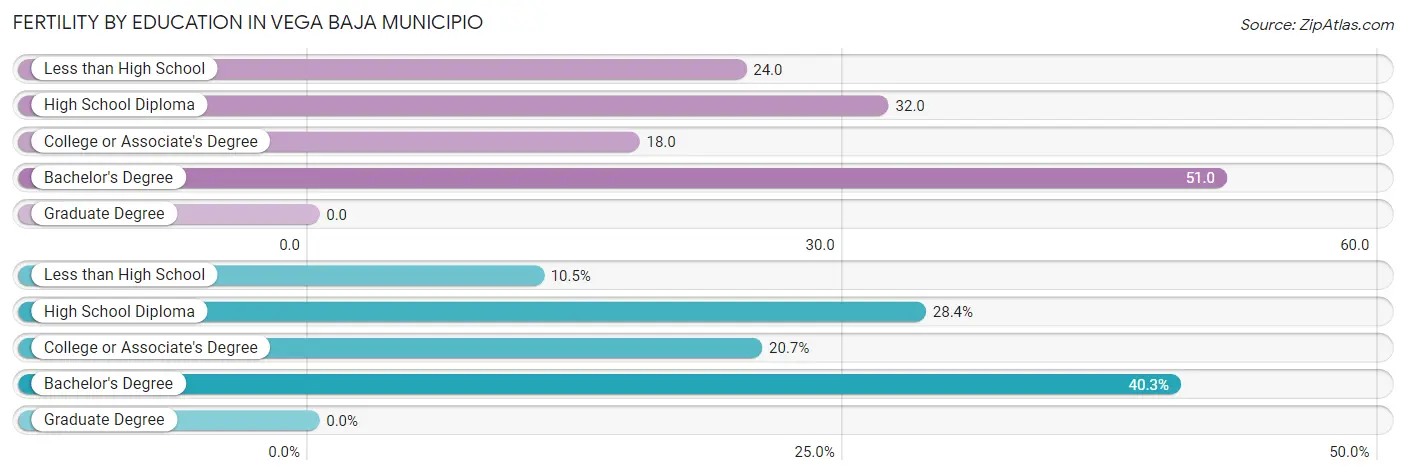
Fertility by Education in Vega Baja Municipio
| Educational Attainment | Women with Births | Births / 1,000 Women |
| Less than High School | 37 (10.5%) | 24.0 |
| High School Diploma | 100 (28.4%) | 32.0 |
| College or Associate's Degree | 73 (20.7%) | 18.0 |
| Bachelor's Degree | 142 (40.3%) | 51.0 |
| Graduate Degree | 0 (0.0%) | 0.0 |
| Total | 352 (100.0%) | 28.0 |
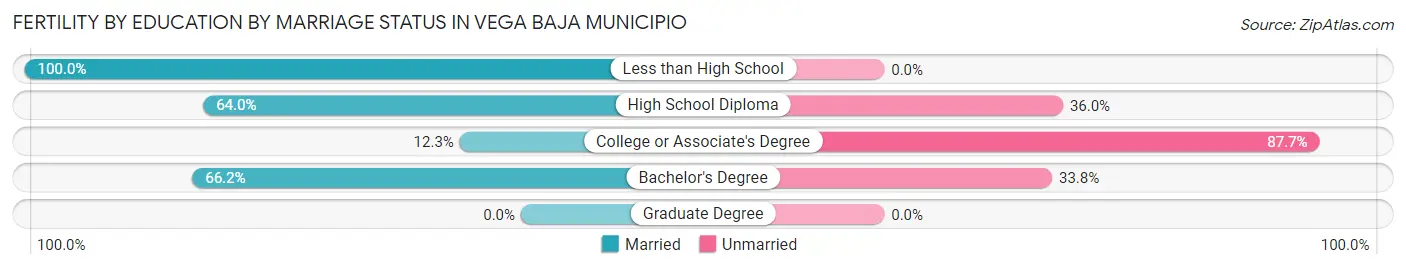
Fertility by Education by Marriage Status in Vega Baja Municipio
42.0% of women with births in Vega Baja Municipio are unmarried. Women with the educational attainment of less than high school are most likely to be married with 100.0% of them married at childbirth, while women with the educational attainment of college or associate's degree are least likely to be married with 87.7% of them unmarried at childbirth.
| Educational Attainment | Married | Unmarried |
| Less than High School | 37 (100.0%) | 0 (0.0%) |
| High School Diploma | 64 (64.0%) | 36 (36.0%) |
| College or Associate's Degree | 9 (12.3%) | 64 (87.7%) |
| Bachelor's Degree | 94 (66.2%) | 48 (33.8%) |
| Graduate Degree | 0 (0.0%) | 0 (0.0%) |
| Total | 204 (58.0%) | 148 (42.0%) |
Employment Characteristics in Vega Baja Municipio
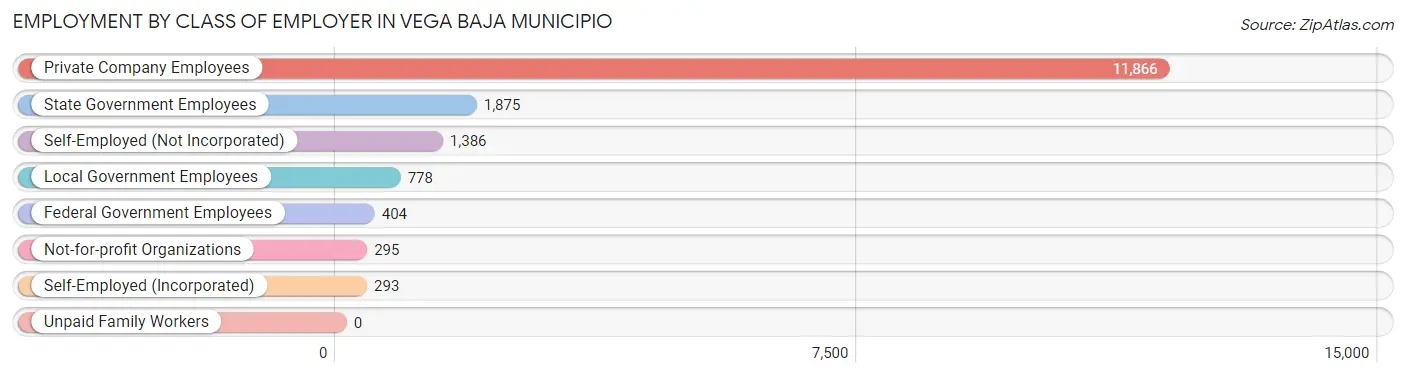
Employment by Class of Employer in Vega Baja Municipio
Among the 16,897 employed individuals in Vega Baja Municipio, private company employees (11,866 | 70.2%), state government employees (1,875 | 11.1%), and self-employed (not incorporated) (1,386 | 8.2%) make up the most common classes of employment.
| Employer Class | # Employees | % Employees |
| Private Company Employees | 11,866 | 70.2% |
| Self-Employed (Incorporated) | 293 | 1.7% |
| Self-Employed (Not Incorporated) | 1,386 | 8.2% |
| Not-for-profit Organizations | 295 | 1.8% |
| Local Government Employees | 778 | 4.6% |
| State Government Employees | 1,875 | 11.1% |
| Federal Government Employees | 404 | 2.4% |
| Unpaid Family Workers | 0 | 0.0% |
| Total | 16,897 | 100.0% |
Employment Status by Age in Vega Baja Municipio
According to the labor force statistics for Vega Baja Municipio, out of the total population over 16 years of age (45,969), 44.1% or 20,272 individuals are in the labor force, with 16.3% or 3,304 of them unemployed. The age group with the highest labor force participation rate is 35 to 44 years, with 77.7% or 5,085 individuals in the labor force. Within the labor force, the 16 to 19 years age range has the highest percentage of unemployed individuals, with 60.0% or 277 of them being unemployed.
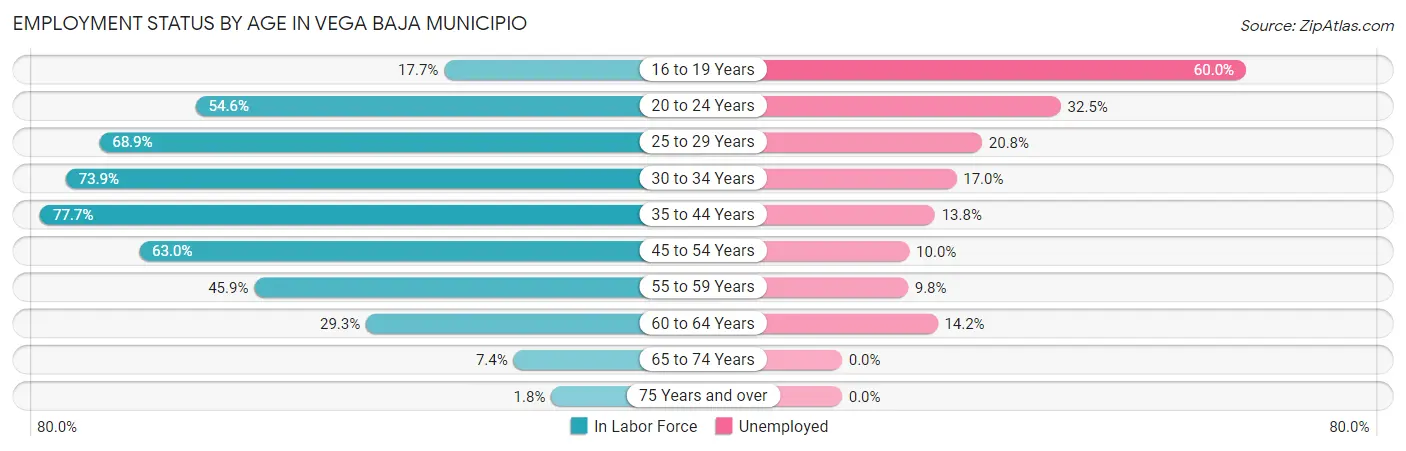
| Age Bracket | In Labor Force | Unemployed |
| 16 to 19 Years | 462 (17.7%) | 277 (60.0%) |
| 20 to 24 Years | 1,914 (54.6%) | 622 (32.5%) |
| 25 to 29 Years | 2,577 (68.9%) | 536 (20.8%) |
| 30 to 34 Years | 2,465 (73.9%) | 419 (17.0%) |
| 35 to 44 Years | 5,085 (77.7%) | 702 (13.8%) |
| 45 to 54 Years | 4,396 (63.0%) | 440 (10.0%) |
| 55 to 59 Years | 1,768 (45.9%) | 173 (9.8%) |
| 60 to 64 Years | 1,052 (29.3%) | 149 (14.2%) |
| 65 to 74 Years | 459 (7.4%) | 0 (0.0%) |
| 75 Years and over | 101 (1.8%) | 0 (0.0%) |
| Total | 20,272 (44.1%) | 3,304 (16.3%) |
Employment Status by Educational Attainment in Vega Baja Municipio
According to labor force statistics for Vega Baja Municipio, 61.8% of individuals (17,328) out of the total population between 25 and 64 years of age (28,039) are in the labor force, with 13.9% or 2,409 of them being unemployed. The group with the highest labor force participation rate are those with the educational attainment of bachelor's degree or higher, with 75.6% or 6,137 individuals in the labor force. Within the labor force, individuals with less than high school education have the highest percentage of unemployment, with 36.4% or 633 of them being unemployed.
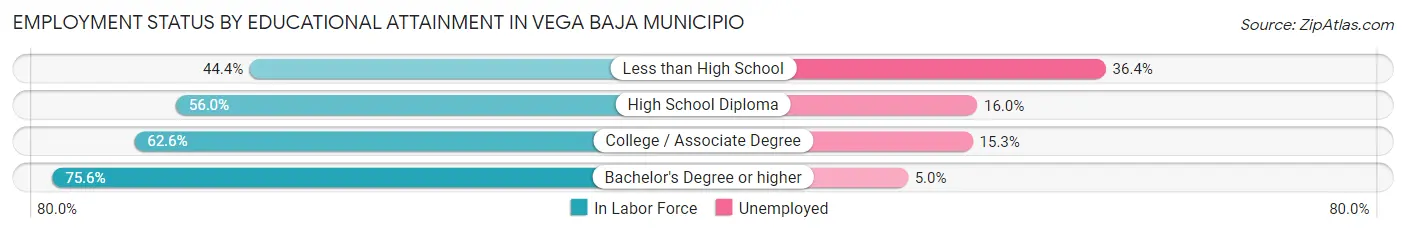
| Educational Attainment | In Labor Force | Unemployed |
| Less than High School | 1,739 (44.4%) | 1,425 (36.4%) |
| High School Diploma | 4,773 (56.0%) | 1,364 (16.0%) |
| College / Associate Degree | 4,683 (62.6%) | 1,145 (15.3%) |
| Bachelor's Degree or higher | 6,137 (75.6%) | 406 (5.0%) |
| Total | 17,328 (61.8%) | 3,897 (13.9%) |
Employment Occupations by Sex in Vega Baja Municipio
Management, Business, Science and Arts Occupations
The most common Management, Business, Science and Arts occupations in Vega Baja Municipio are Community & Social Service (1,598 | 9.4%), Education Instruction & Library (1,147 | 6.8%), Health Diagnosing & Treating (1,027 | 6.1%), Management (1,004 | 5.9%), and Business & Financial (953 | 5.6%).

Management, Business, Science and Arts Occupations by Sex
Within the Management, Business, Science and Arts occupations in Vega Baja Municipio, the most male-oriented occupations are Computers & Mathematics (100.0%), Arts, Media & Entertainment (90.4%), and Computers, Engineering & Science (72.6%), while the most female-oriented occupations are Health Diagnosing & Treating (86.1%), Health Technologists (85.5%), and Education, Arts & Media (85.1%).
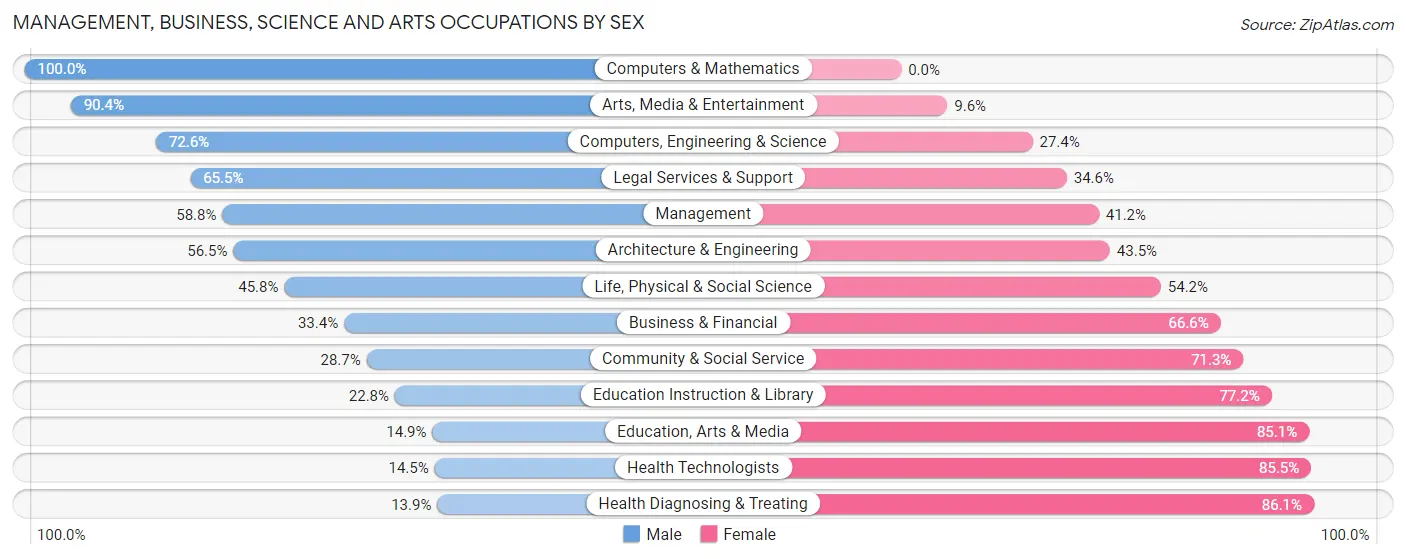
| Occupation | Male | Female |
| Management | 590 (58.8%) | 414 (41.2%) |
| Business & Financial | 318 (33.4%) | 635 (66.6%) |
| Computers, Engineering & Science | 347 (72.6%) | 131 (27.4%) |
| Computers & Mathematics | 183 (100.0%) | 0 (0.0%) |
| Architecture & Engineering | 153 (56.5%) | 118 (43.5%) |
| Life, Physical & Social Science | 11 (45.8%) | 13 (54.2%) |
| Community & Social Service | 458 (28.7%) | 1,140 (71.3%) |
| Education, Arts & Media | 39 (14.9%) | 222 (85.1%) |
| Legal Services & Support | 36 (65.4%) | 19 (34.5%) |
| Education Instruction & Library | 261 (22.8%) | 886 (77.2%) |
| Arts, Media & Entertainment | 122 (90.4%) | 13 (9.6%) |
| Health Diagnosing & Treating | 143 (13.9%) | 884 (86.1%) |
| Health Technologists | 101 (14.5%) | 596 (85.5%) |
| Total (Category) | 1,856 (36.7%) | 3,204 (63.3%) |
| Total (Overall) | 8,924 (52.6%) | 8,025 (47.3%) |
Services Occupations
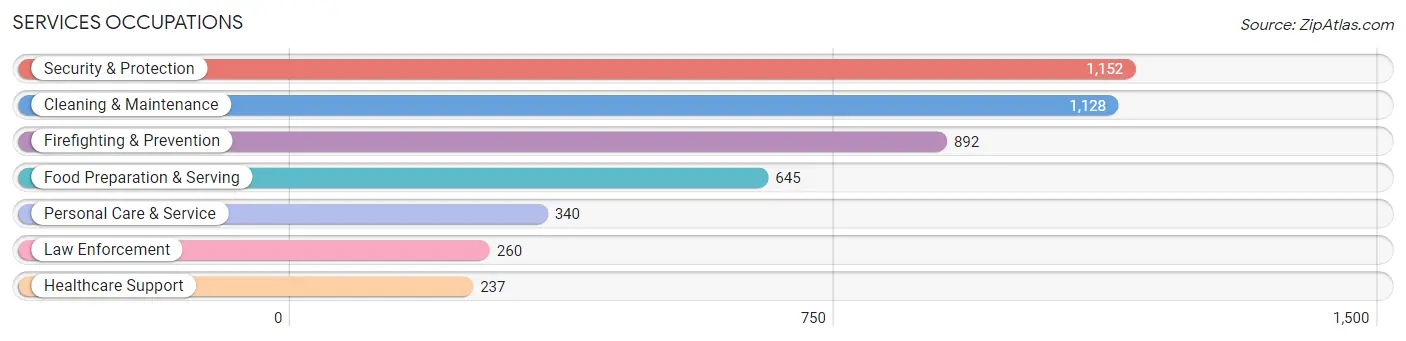
The most common Services occupations in Vega Baja Municipio are Security & Protection (1,152 | 6.8%), Cleaning & Maintenance (1,128 | 6.7%), Firefighting & Prevention (892 | 5.3%), Food Preparation & Serving (645 | 3.8%), and Personal Care & Service (340 | 2.0%).
Services Occupations by Sex
Within the Services occupations in Vega Baja Municipio, the most male-oriented occupations are Firefighting & Prevention (78.8%), Security & Protection (76.1%), and Law Enforcement (66.9%), while the most female-oriented occupations are Healthcare Support (83.1%), Food Preparation & Serving (71.3%), and Personal Care & Service (63.5%).
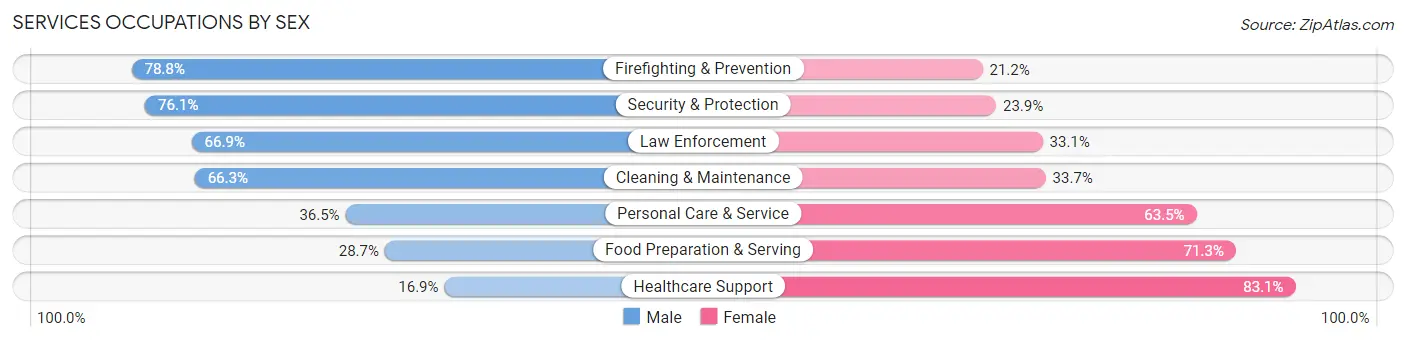
| Occupation | Male | Female |
| Healthcare Support | 40 (16.9%) | 197 (83.1%) |
| Security & Protection | 877 (76.1%) | 275 (23.9%) |
| Firefighting & Prevention | 703 (78.8%) | 189 (21.2%) |
| Law Enforcement | 174 (66.9%) | 86 (33.1%) |
| Food Preparation & Serving | 185 (28.7%) | 460 (71.3%) |
| Cleaning & Maintenance | 748 (66.3%) | 380 (33.7%) |
| Personal Care & Service | 124 (36.5%) | 216 (63.5%) |
| Total (Category) | 1,974 (56.4%) | 1,528 (43.6%) |
| Total (Overall) | 8,924 (52.6%) | 8,025 (47.3%) |
Sales and Office Occupations
The most common Sales and Office occupations in Vega Baja Municipio are Office & Administration (2,181 | 12.9%), and Sales & Related (1,938 | 11.4%).

Sales and Office Occupations by Sex

| Occupation | Male | Female |
| Sales & Related | 970 (50.0%) | 968 (49.9%) |
| Office & Administration | 561 (25.7%) | 1,620 (74.3%) |
| Total (Category) | 1,531 (37.2%) | 2,588 (62.8%) |
| Total (Overall) | 8,924 (52.6%) | 8,025 (47.3%) |
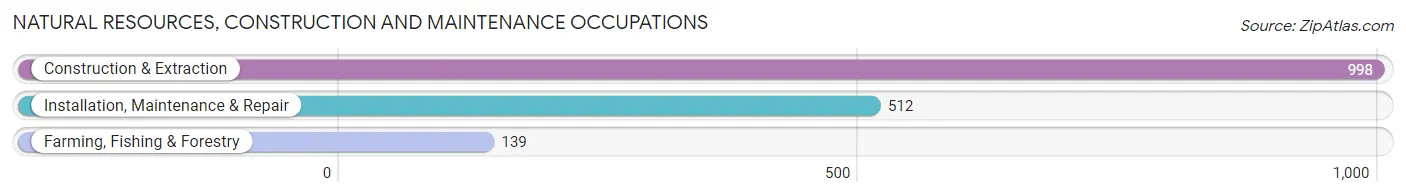
Natural Resources, Construction and Maintenance Occupations
The most common Natural Resources, Construction and Maintenance occupations in Vega Baja Municipio are Construction & Extraction (998 | 5.9%), Installation, Maintenance & Repair (512 | 3.0%), and Farming, Fishing & Forestry (139 | 0.8%).
Natural Resources, Construction and Maintenance Occupations by Sex
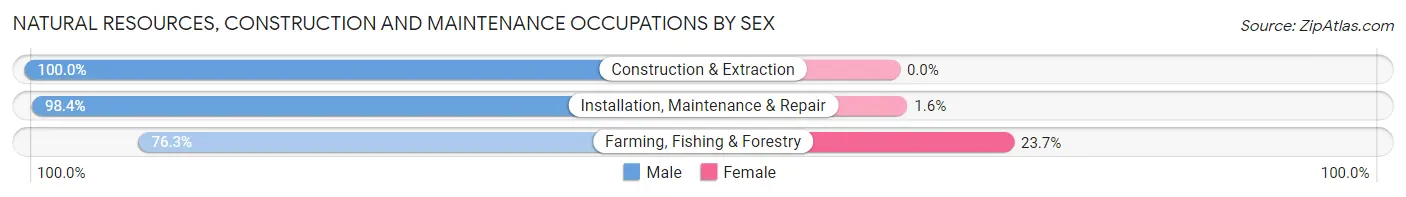
| Occupation | Male | Female |
| Farming, Fishing & Forestry | 106 (76.3%) | 33 (23.7%) |
| Construction & Extraction | 998 (100.0%) | 0 (0.0%) |
| Installation, Maintenance & Repair | 504 (98.4%) | 8 (1.6%) |
| Total (Category) | 1,608 (97.5%) | 41 (2.5%) |
| Total (Overall) | 8,924 (52.6%) | 8,025 (47.3%) |
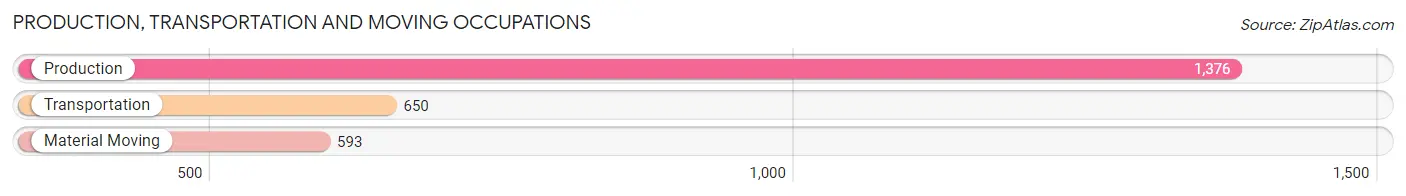
Production, Transportation and Moving Occupations
The most common Production, Transportation and Moving occupations in Vega Baja Municipio are Production (1,376 | 8.1%), Transportation (650 | 3.8%), and Material Moving (593 | 3.5%).
Production, Transportation and Moving Occupations by Sex
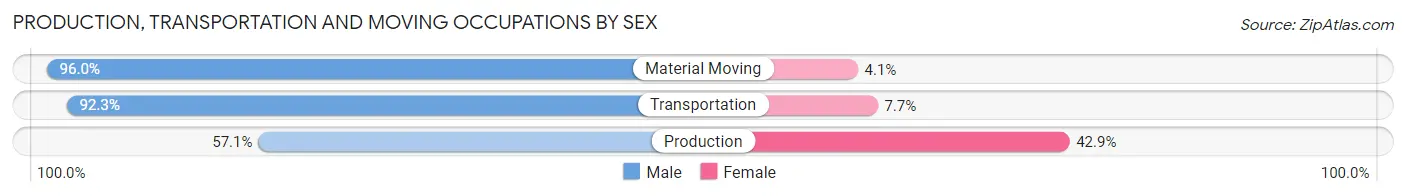
| Occupation | Male | Female |
| Production | 786 (57.1%) | 590 (42.9%) |
| Transportation | 600 (92.3%) | 50 (7.7%) |
| Material Moving | 569 (96.0%) | 24 (4.1%) |
| Total (Category) | 1,955 (74.7%) | 664 (25.4%) |
| Total (Overall) | 8,924 (52.6%) | 8,025 (47.3%) |
Employment Industries by Sex in Vega Baja Municipio
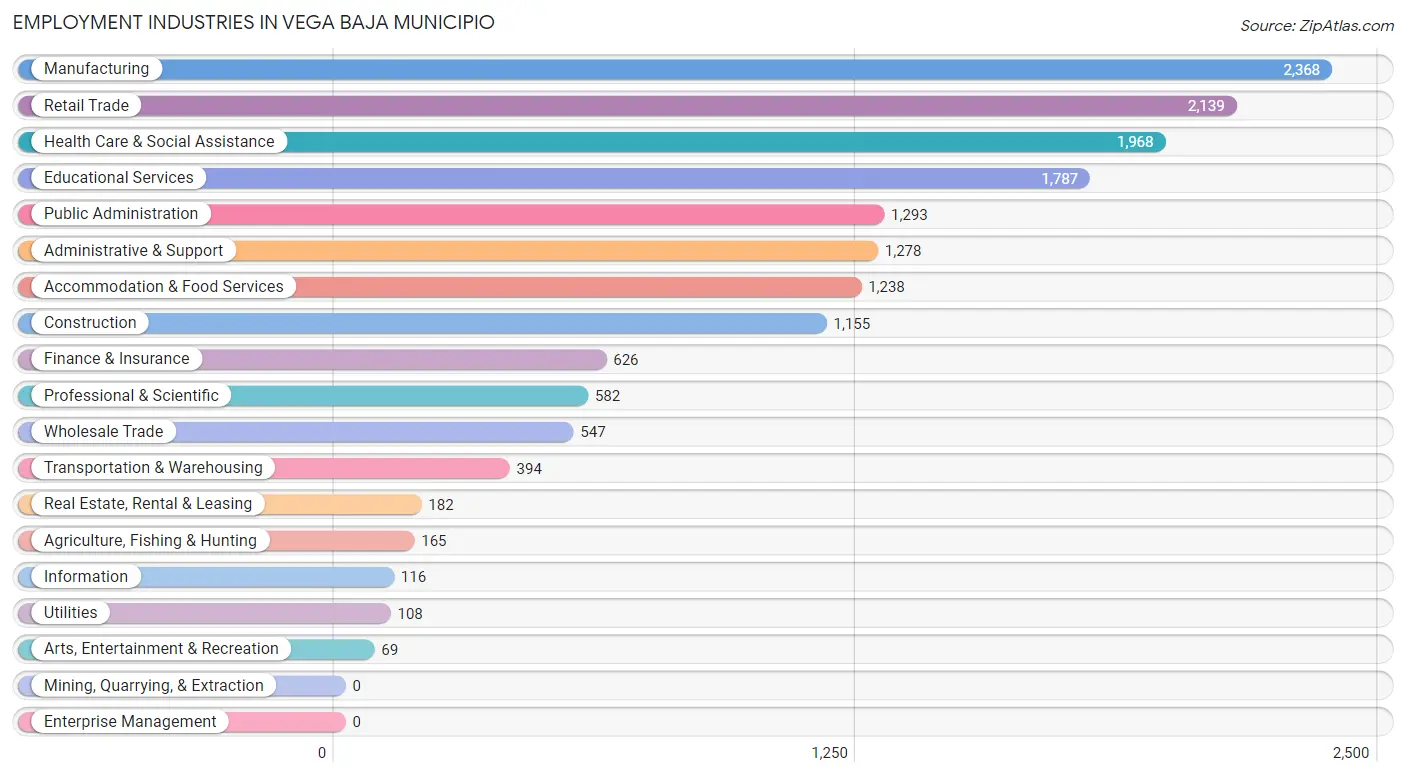
Employment Industries in Vega Baja Municipio
The major employment industries in Vega Baja Municipio include Manufacturing (2,368 | 14.0%), Retail Trade (2,139 | 12.6%), Health Care & Social Assistance (1,968 | 11.6%), Educational Services (1,787 | 10.5%), and Public Administration (1,293 | 7.6%).
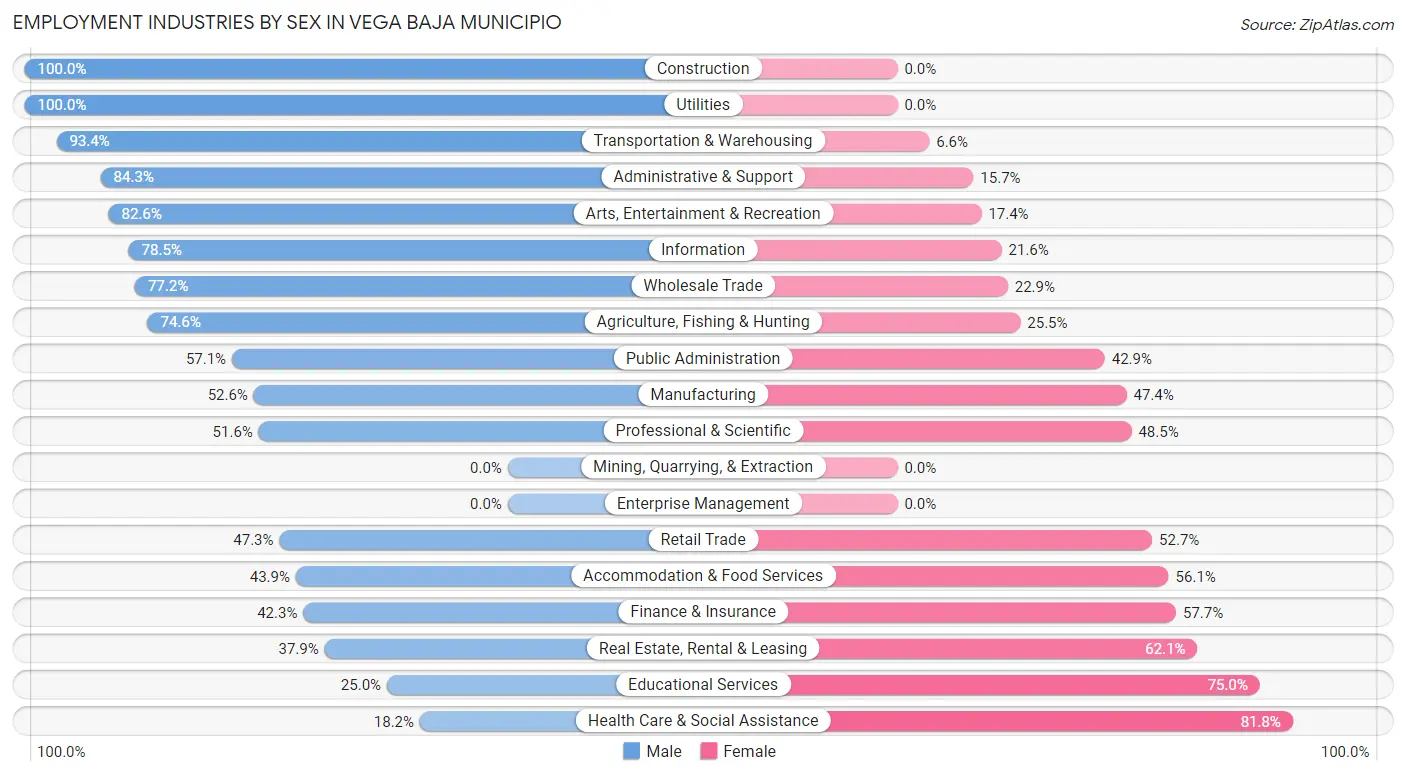
Employment Industries by Sex in Vega Baja Municipio
The Vega Baja Municipio industries that see more men than women are Construction (100.0%), Utilities (100.0%), and Transportation & Warehousing (93.4%), whereas the industries that tend to have a higher number of women are Health Care & Social Assistance (81.8%), Educational Services (75.0%), and Real Estate, Rental & Leasing (62.1%).
| Industry | Male | Female |
| Agriculture, Fishing & Hunting | 123 (74.6%) | 42 (25.5%) |
| Mining, Quarrying, & Extraction | 0 (0.0%) | 0 (0.0%) |
| Construction | 1,155 (100.0%) | 0 (0.0%) |
| Manufacturing | 1,245 (52.6%) | 1,123 (47.4%) |
| Wholesale Trade | 422 (77.1%) | 125 (22.9%) |
| Retail Trade | 1,011 (47.3%) | 1,128 (52.7%) |
| Transportation & Warehousing | 368 (93.4%) | 26 (6.6%) |
| Utilities | 108 (100.0%) | 0 (0.0%) |
| Information | 91 (78.4%) | 25 (21.5%) |
| Finance & Insurance | 265 (42.3%) | 361 (57.7%) |
| Real Estate, Rental & Leasing | 69 (37.9%) | 113 (62.1%) |
| Professional & Scientific | 300 (51.5%) | 282 (48.4%) |
| Enterprise Management | 0 (0.0%) | 0 (0.0%) |
| Administrative & Support | 1,077 (84.3%) | 201 (15.7%) |
| Educational Services | 447 (25.0%) | 1,340 (75.0%) |
| Health Care & Social Assistance | 358 (18.2%) | 1,610 (81.8%) |
| Arts, Entertainment & Recreation | 57 (82.6%) | 12 (17.4%) |
| Accommodation & Food Services | 543 (43.9%) | 695 (56.1%) |
| Public Administration | 738 (57.1%) | 555 (42.9%) |
| Total | 8,924 (52.6%) | 8,025 (47.3%) |
Education in Vega Baja Municipio
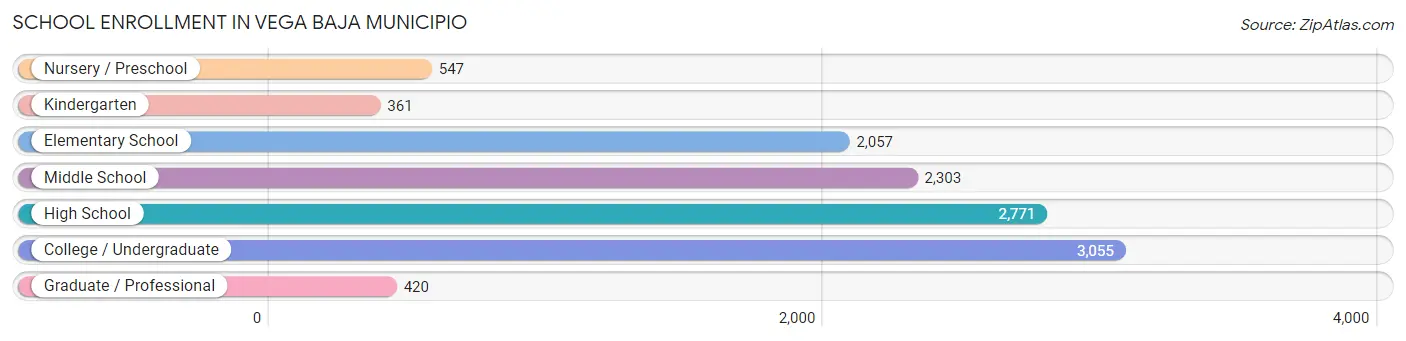
School Enrollment in Vega Baja Municipio
The most common levels of schooling among the 11,514 students in Vega Baja Municipio are college / undergraduate (3,055 | 26.5%), high school (2,771 | 24.1%), and middle school (2,303 | 20.0%).
| School Level | # Students | % Students |
| Nursery / Preschool | 547 | 4.8% |
| Kindergarten | 361 | 3.1% |
| Elementary School | 2,057 | 17.9% |
| Middle School | 2,303 | 20.0% |
| High School | 2,771 | 24.1% |
| College / Undergraduate | 3,055 | 26.5% |
| Graduate / Professional | 420 | 3.6% |
| Total | 11,514 | 100.0% |
School Enrollment by Age by Funding Source in Vega Baja Municipio
Out of a total of 11,514 students who are enrolled in schools in Vega Baja Municipio, 4,732 (41.1%) attend a private institution, while the remaining 6,782 (58.9%) are enrolled in public schools. The age group of 25 to 34 year olds has the highest likelihood of being enrolled in private schools, with 509 (72.5% in the age bracket) enrolled. Conversely, the age group of 3 to 4 year olds has the lowest likelihood of being enrolled in a private school, with 394 (76.4% in the age bracket) attending a public institution.
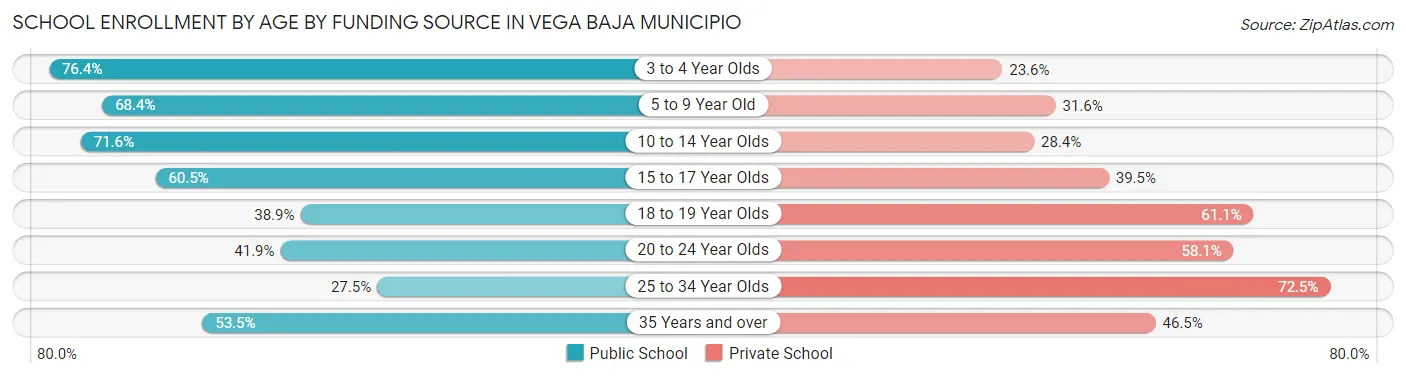
| Age Bracket | Public School | Private School |
| 3 to 4 Year Olds | 394 (76.4%) | 122 (23.6%) |
| 5 to 9 Year Old | 1,680 (68.4%) | 775 (31.6%) |
| 10 to 14 Year Olds | 2,107 (71.6%) | 835 (28.4%) |
| 15 to 17 Year Olds | 1,138 (60.5%) | 743 (39.5%) |
| 18 to 19 Year Olds | 395 (38.9%) | 620 (61.1%) |
| 20 to 24 Year Olds | 702 (41.9%) | 974 (58.1%) |
| 25 to 34 Year Olds | 193 (27.5%) | 509 (72.5%) |
| 35 Years and over | 175 (53.5%) | 152 (46.5%) |
| Total | 6,782 (58.9%) | 4,732 (41.1%) |
Educational Attainment by Field of Study in Vega Baja Municipio
Business (2,850 | 28.0%), education (1,825 | 17.9%), science & technology (1,233 | 12.1%), arts & humanities (889 | 8.7%), and engineering (697 | 6.9%) are the most common fields of study among 10,175 individuals in Vega Baja Municipio who have obtained a bachelor's degree or higher.
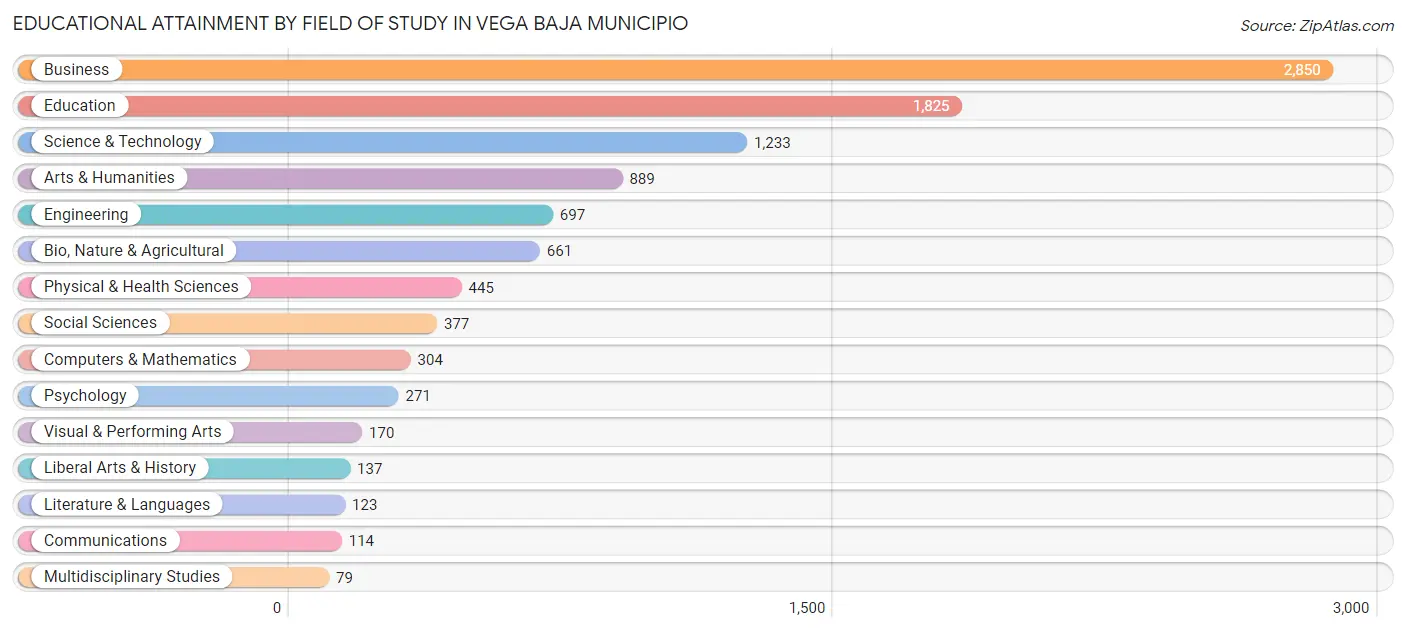
| Field of Study | # Graduates | % Graduates |
| Computers & Mathematics | 304 | 3.0% |
| Bio, Nature & Agricultural | 661 | 6.5% |
| Physical & Health Sciences | 445 | 4.4% |
| Psychology | 271 | 2.7% |
| Social Sciences | 377 | 3.7% |
| Engineering | 697 | 6.9% |
| Multidisciplinary Studies | 79 | 0.8% |
| Science & Technology | 1,233 | 12.1% |
| Business | 2,850 | 28.0% |
| Education | 1,825 | 17.9% |
| Literature & Languages | 123 | 1.2% |
| Liberal Arts & History | 137 | 1.3% |
| Visual & Performing Arts | 170 | 1.7% |
| Communications | 114 | 1.1% |
| Arts & Humanities | 889 | 8.7% |
| Total | 10,175 | 100.0% |
Transportation & Commute in Vega Baja Municipio
Vehicle Availability by Sex in Vega Baja Municipio
The most prevalent vehicle ownership categories in Vega Baja Municipio are males with 2 vehicles (4,373, accounting for 49.2%) and females with 2 vehicles (3,157, making up 54.8%).
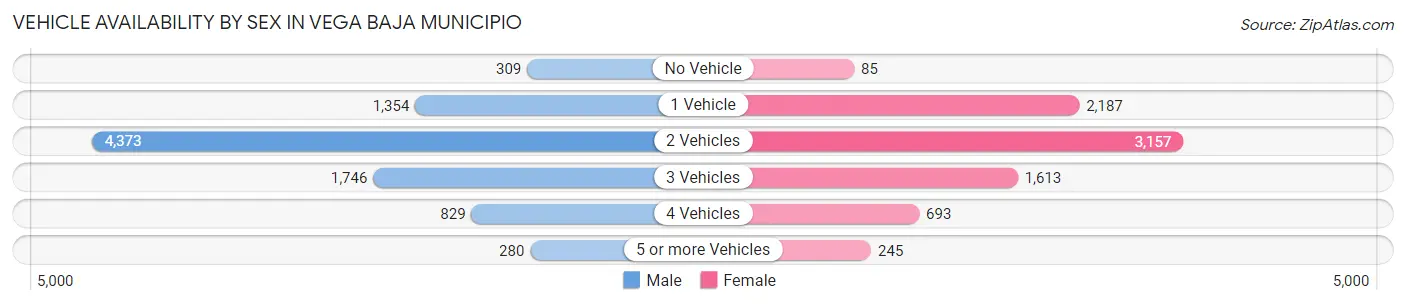
| Vehicles Available | Male | Female |
| No Vehicle | 309 (3.5%) | 85 (1.1%) |
| 1 Vehicle | 1,354 (15.2%) | 2,187 (27.4%) |
| 2 Vehicles | 4,373 (49.2%) | 3,157 (39.6%) |
| 3 Vehicles | 1,746 (19.6%) | 1,613 (20.2%) |
| 4 Vehicles | 829 (9.3%) | 693 (8.7%) |
| 5 or more Vehicles | 280 (3.2%) | 245 (3.1%) |
| Total | 8,891 (100.0%) | 7,980 (100.0%) |
Commute Time in Vega Baja Municipio
The most frequently occuring commute durations in Vega Baja Municipio are 20 to 24 minutes (3,555 commuters, 21.4%), 30 to 34 minutes (2,351 commuters, 14.2%), and 15 to 19 minutes (1,642 commuters, 9.9%).
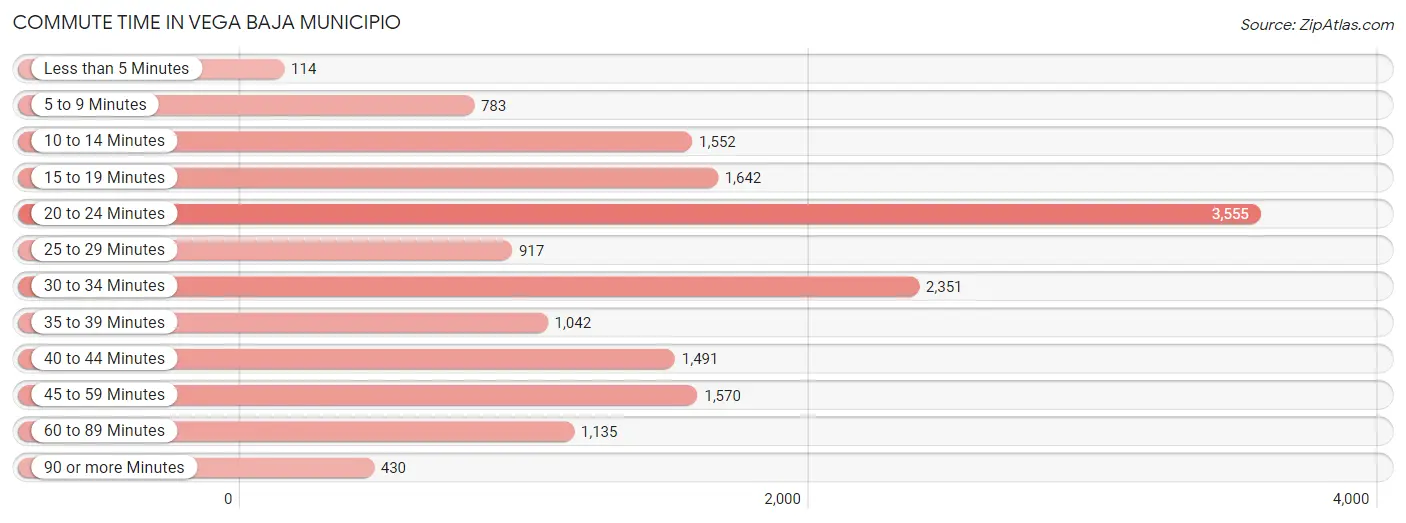
| Commute Time | # Commuters | % Commuters |
| Less than 5 Minutes | 114 | 0.7% |
| 5 to 9 Minutes | 783 | 4.7% |
| 10 to 14 Minutes | 1,552 | 9.4% |
| 15 to 19 Minutes | 1,642 | 9.9% |
| 20 to 24 Minutes | 3,555 | 21.4% |
| 25 to 29 Minutes | 917 | 5.5% |
| 30 to 34 Minutes | 2,351 | 14.2% |
| 35 to 39 Minutes | 1,042 | 6.3% |
| 40 to 44 Minutes | 1,491 | 9.0% |
| 45 to 59 Minutes | 1,570 | 9.5% |
| 60 to 89 Minutes | 1,135 | 6.8% |
| 90 or more Minutes | 430 | 2.6% |
Commute Time by Sex in Vega Baja Municipio
The most common commute times in Vega Baja Municipio are 20 to 24 minutes (1,501 commuters, 17.1%) for males and 20 to 24 minutes (2,054 commuters, 26.3%) for females.
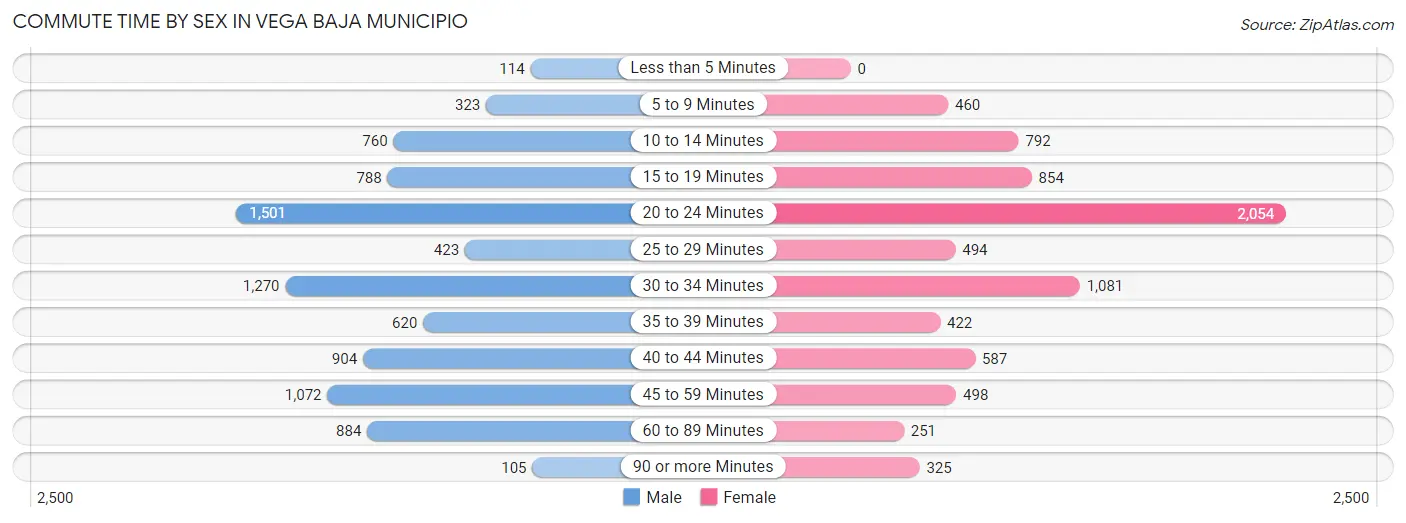
| Commute Time | Male | Female |
| Less than 5 Minutes | 114 (1.3%) | 0 (0.0%) |
| 5 to 9 Minutes | 323 (3.7%) | 460 (5.9%) |
| 10 to 14 Minutes | 760 (8.7%) | 792 (10.1%) |
| 15 to 19 Minutes | 788 (9.0%) | 854 (10.9%) |
| 20 to 24 Minutes | 1,501 (17.1%) | 2,054 (26.3%) |
| 25 to 29 Minutes | 423 (4.8%) | 494 (6.3%) |
| 30 to 34 Minutes | 1,270 (14.5%) | 1,081 (13.8%) |
| 35 to 39 Minutes | 620 (7.1%) | 422 (5.4%) |
| 40 to 44 Minutes | 904 (10.3%) | 587 (7.5%) |
| 45 to 59 Minutes | 1,072 (12.2%) | 498 (6.4%) |
| 60 to 89 Minutes | 884 (10.1%) | 251 (3.2%) |
| 90 or more Minutes | 105 (1.2%) | 325 (4.2%) |
Time of Departure to Work by Sex in Vega Baja Municipio
The most frequent times of departure to work in Vega Baja Municipio are 7:00 AM to 7:29 AM (1,562, 17.8%) for males and 7:00 AM to 7:29 AM (1,655, 21.2%) for females.
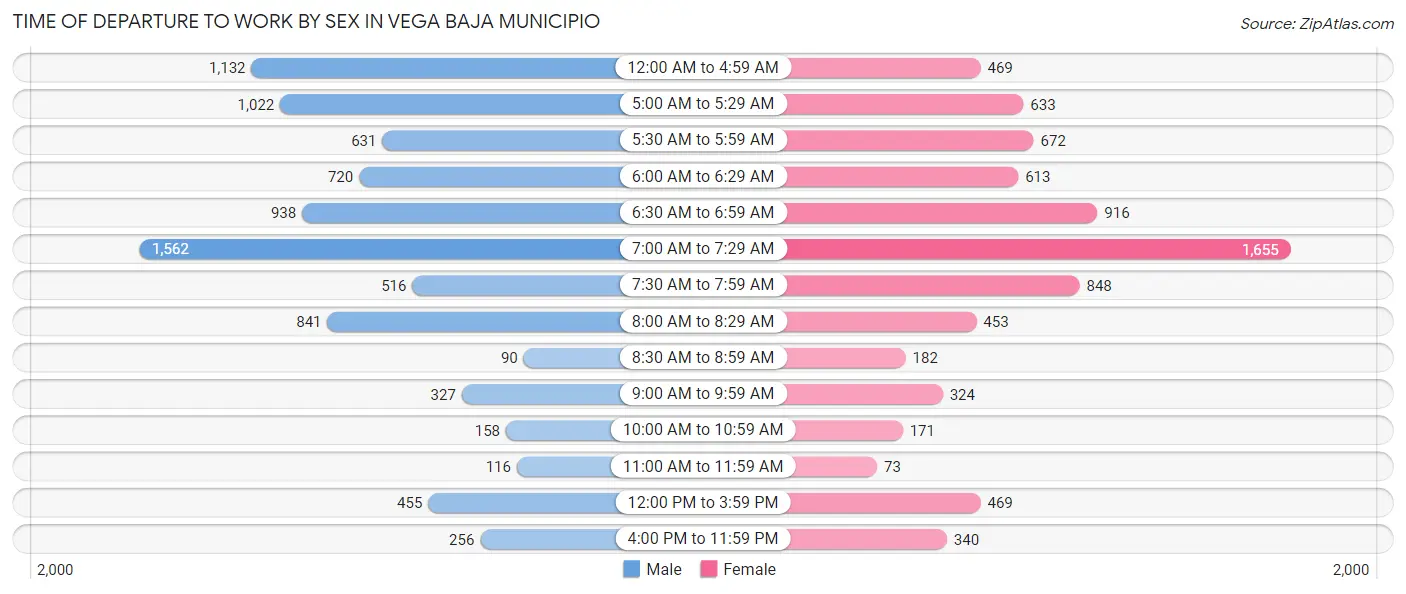
| Time of Departure | Male | Female |
| 12:00 AM to 4:59 AM | 1,132 (12.9%) | 469 (6.0%) |
| 5:00 AM to 5:29 AM | 1,022 (11.7%) | 633 (8.1%) |
| 5:30 AM to 5:59 AM | 631 (7.2%) | 672 (8.6%) |
| 6:00 AM to 6:29 AM | 720 (8.2%) | 613 (7.8%) |
| 6:30 AM to 6:59 AM | 938 (10.7%) | 916 (11.7%) |
| 7:00 AM to 7:29 AM | 1,562 (17.8%) | 1,655 (21.2%) |
| 7:30 AM to 7:59 AM | 516 (5.9%) | 848 (10.8%) |
| 8:00 AM to 8:29 AM | 841 (9.6%) | 453 (5.8%) |
| 8:30 AM to 8:59 AM | 90 (1.0%) | 182 (2.3%) |
| 9:00 AM to 9:59 AM | 327 (3.7%) | 324 (4.1%) |
| 10:00 AM to 10:59 AM | 158 (1.8%) | 171 (2.2%) |
| 11:00 AM to 11:59 AM | 116 (1.3%) | 73 (0.9%) |
| 12:00 PM to 3:59 PM | 455 (5.2%) | 469 (6.0%) |
| 4:00 PM to 11:59 PM | 256 (2.9%) | 340 (4.3%) |
| Total | 8,764 (100.0%) | 7,818 (100.0%) |
Housing Occupancy in Vega Baja Municipio
Occupancy by Ownership in Vega Baja Municipio
Of the total 20,098 dwellings in Vega Baja Municipio, owner-occupied units account for 15,176 (75.5%), while renter-occupied units make up 4,922 (24.5%).
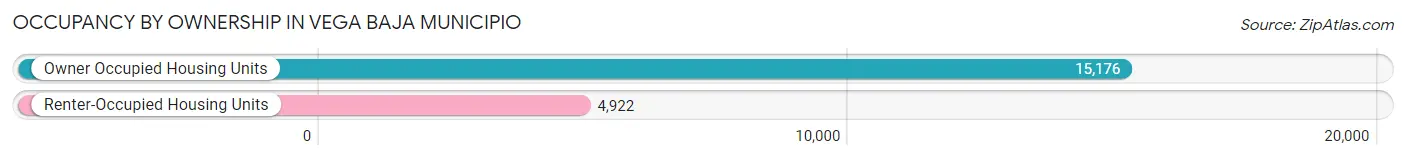
| Occupancy | # Housing Units | % Housing Units |
| Owner Occupied Housing Units | 15,176 | 75.5% |
| Renter-Occupied Housing Units | 4,922 | 24.5% |
| Total Occupied Housing Units | 20,098 | 100.0% |
Occupancy by Household Size in Vega Baja Municipio
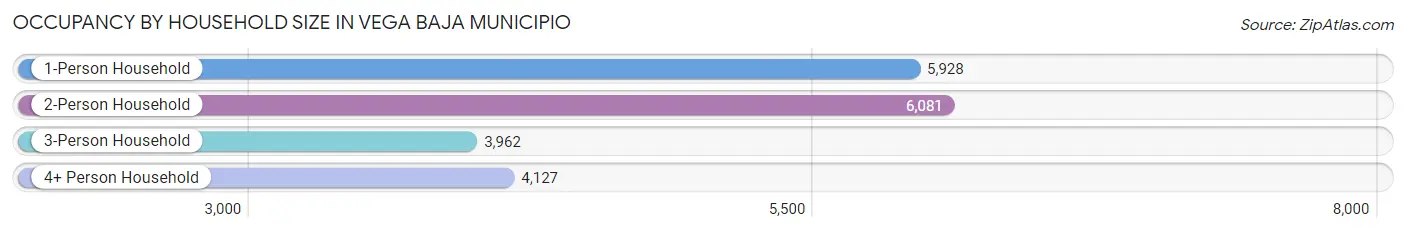
| Household Size | # Housing Units | % Housing Units |
| 1-Person Household | 5,928 | 29.5% |
| 2-Person Household | 6,081 | 30.3% |
| 3-Person Household | 3,962 | 19.7% |
| 4+ Person Household | 4,127 | 20.5% |
| Total Housing Units | 20,098 | 100.0% |
Occupancy by Ownership by Household Size in Vega Baja Municipio
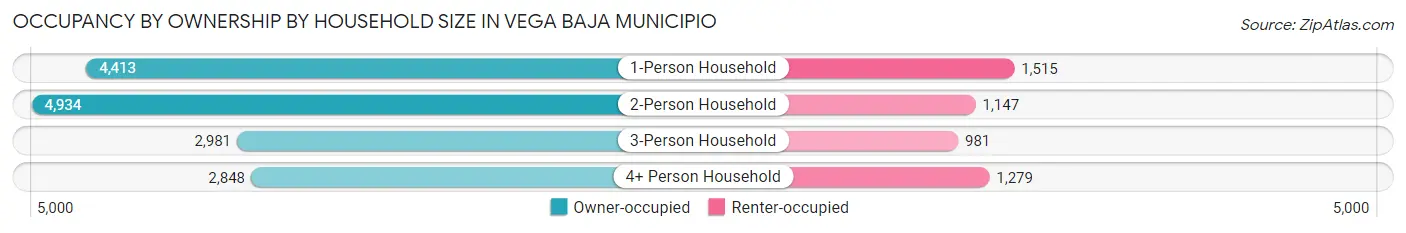
| Household Size | Owner-occupied | Renter-occupied |
| 1-Person Household | 4,413 (74.4%) | 1,515 (25.6%) |
| 2-Person Household | 4,934 (81.1%) | 1,147 (18.9%) |
| 3-Person Household | 2,981 (75.2%) | 981 (24.8%) |
| 4+ Person Household | 2,848 (69.0%) | 1,279 (31.0%) |
| Total Housing Units | 15,176 (75.5%) | 4,922 (24.5%) |
Occupancy by Educational Attainment in Vega Baja Municipio
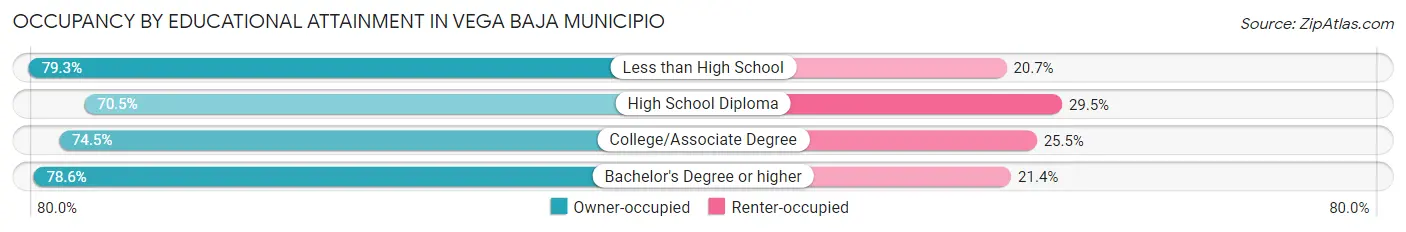
| Household Size | Owner-occupied | Renter-occupied |
| Less than High School | 3,841 (79.3%) | 1,000 (20.7%) |
| High School Diploma | 4,249 (70.5%) | 1,775 (29.5%) |
| College/Associate Degree | 3,136 (74.5%) | 1,071 (25.5%) |
| Bachelor's Degree or higher | 3,950 (78.6%) | 1,076 (21.4%) |
Occupancy by Age of Householder in Vega Baja Municipio
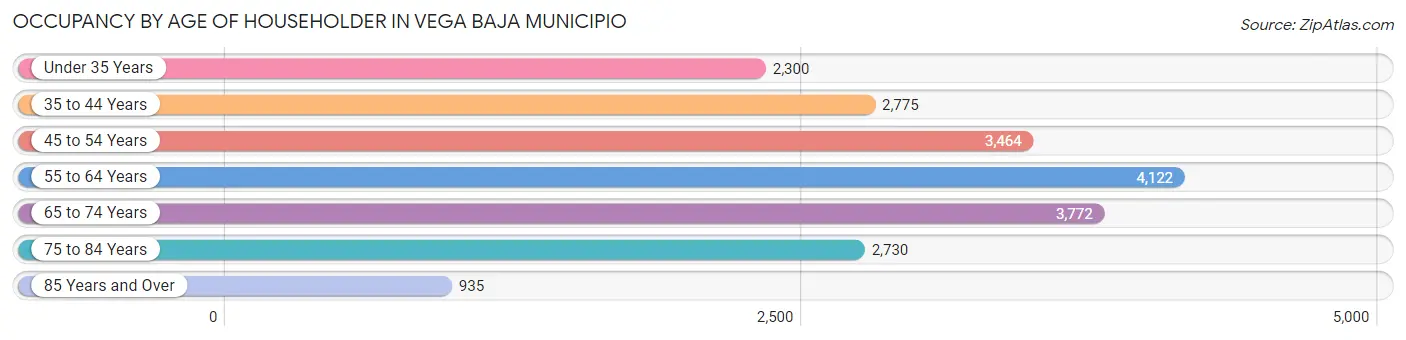
| Age Bracket | # Households | % Households |
| Under 35 Years | 2,300 | 11.4% |
| 35 to 44 Years | 2,775 | 13.8% |
| 45 to 54 Years | 3,464 | 17.2% |
| 55 to 64 Years | 4,122 | 20.5% |
| 65 to 74 Years | 3,772 | 18.8% |
| 75 to 84 Years | 2,730 | 13.6% |
| 85 Years and Over | 935 | 4.6% |
| Total | 20,098 | 100.0% |
Housing Finances in Vega Baja Municipio
Median Income by Occupancy in Vega Baja Municipio
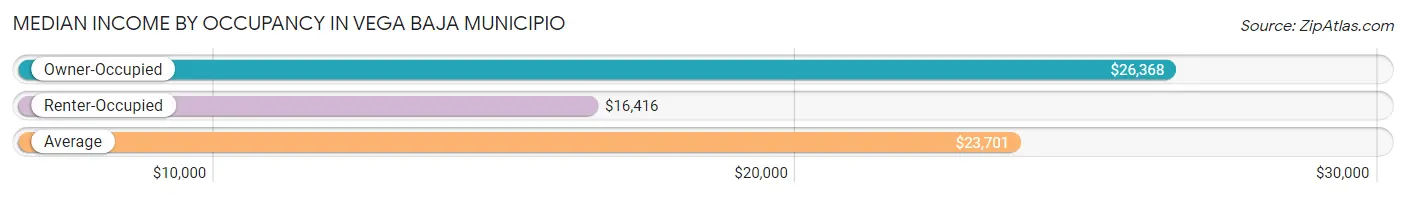
| Occupancy Type | # Households | Median Income |
| Owner-Occupied | 15,176 (75.5%) | $26,368 |
| Renter-Occupied | 4,922 (24.5%) | $16,416 |
| Average | 20,098 (100.0%) | $23,701 |
Occupancy by Householder Income Bracket in Vega Baja Municipio
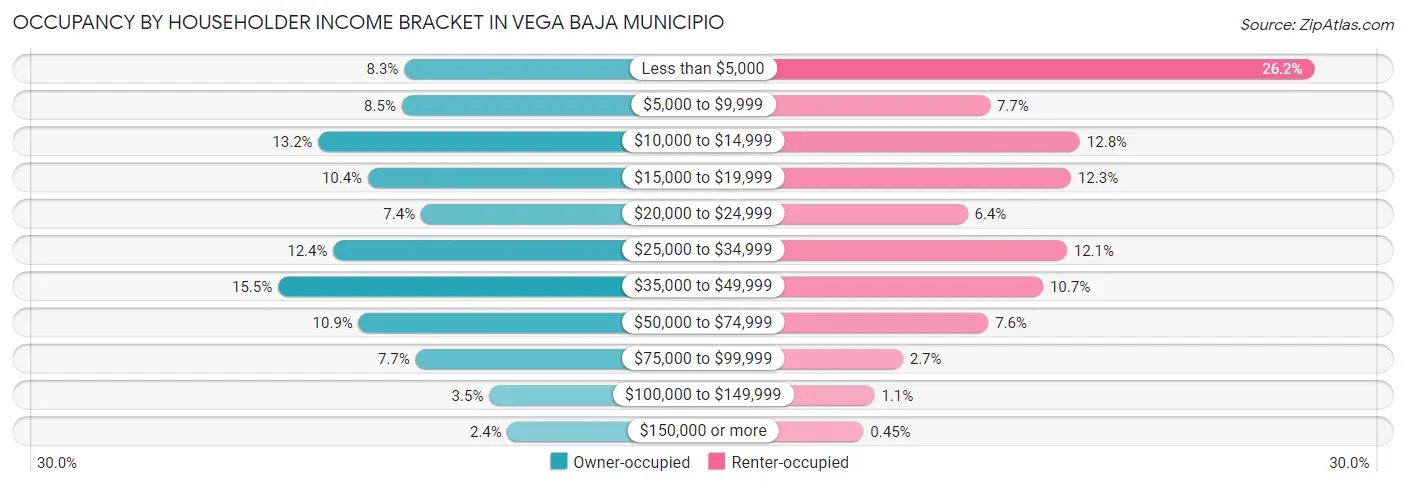
| Income Bracket | Owner-occupied | Renter-occupied |
| Less than $5,000 | 1,261 (8.3%) | 1,290 (26.2%) |
| $5,000 to $9,999 | 1,283 (8.5%) | 378 (7.7%) |
| $10,000 to $14,999 | 2,005 (13.2%) | 631 (12.8%) |
| $15,000 to $19,999 | 1,575 (10.4%) | 606 (12.3%) |
| $20,000 to $24,999 | 1,116 (7.3%) | 315 (6.4%) |
| $25,000 to $34,999 | 1,875 (12.4%) | 594 (12.1%) |
| $35,000 to $49,999 | 2,355 (15.5%) | 527 (10.7%) |
| $50,000 to $74,999 | 1,656 (10.9%) | 373 (7.6%) |
| $75,000 to $99,999 | 1,162 (7.7%) | 133 (2.7%) |
| $100,000 to $149,999 | 524 (3.5%) | 53 (1.1%) |
| $150,000 or more | 364 (2.4%) | 22 (0.4%) |
| Total | 15,176 (100.0%) | 4,922 (100.0%) |
Monthly Housing Cost Tiers in Vega Baja Municipio
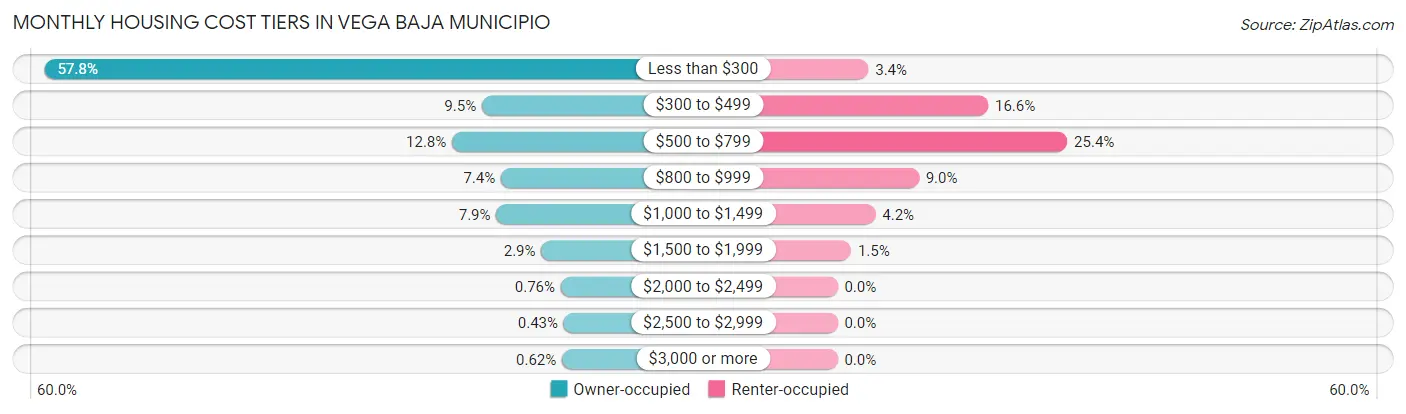
| Monthly Cost | Owner-occupied | Renter-occupied |
| Less than $300 | 8,771 (57.8%) | 168 (3.4%) |
| $300 to $499 | 1,437 (9.5%) | 819 (16.6%) |
| $500 to $799 | 1,938 (12.8%) | 1,249 (25.4%) |
| $800 to $999 | 1,118 (7.4%) | 442 (9.0%) |
| $1,000 to $1,499 | 1,196 (7.9%) | 206 (4.2%) |
| $1,500 to $1,999 | 441 (2.9%) | 74 (1.5%) |
| $2,000 to $2,499 | 116 (0.8%) | 0 (0.0%) |
| $2,500 to $2,999 | 65 (0.4%) | 0 (0.0%) |
| $3,000 or more | 94 (0.6%) | 0 (0.0%) |
| Total | 15,176 (100.0%) | 4,922 (100.0%) |
Physical Housing Characteristics in Vega Baja Municipio
Housing Structures in Vega Baja Municipio
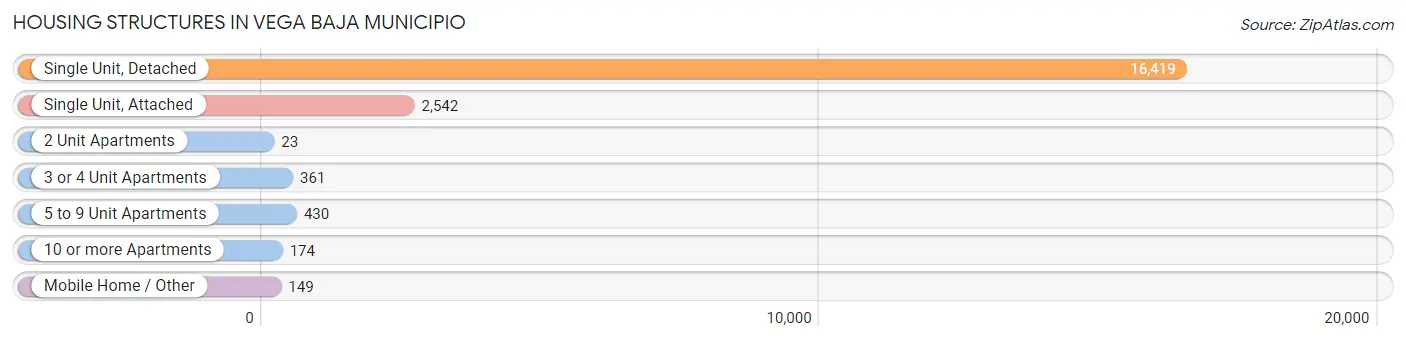
| Structure Type | # Housing Units | % Housing Units |
| Single Unit, Detached | 16,419 | 81.7% |
| Single Unit, Attached | 2,542 | 12.7% |
| 2 Unit Apartments | 23 | 0.1% |
| 3 or 4 Unit Apartments | 361 | 1.8% |
| 5 to 9 Unit Apartments | 430 | 2.1% |
| 10 or more Apartments | 174 | 0.9% |
| Mobile Home / Other | 149 | 0.7% |
| Total | 20,098 | 100.0% |
Housing Structures by Occupancy in Vega Baja Municipio
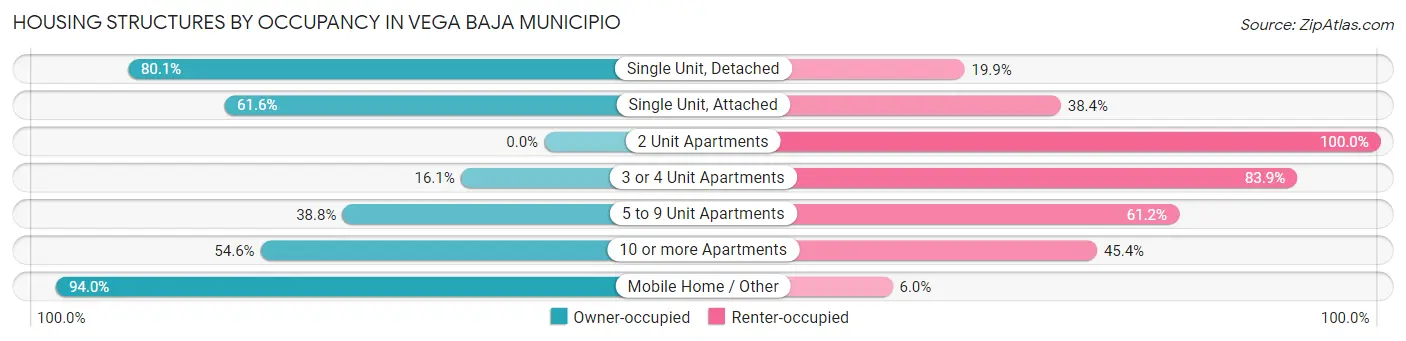
| Structure Type | Owner-occupied | Renter-occupied |
| Single Unit, Detached | 13,151 (80.1%) | 3,268 (19.9%) |
| Single Unit, Attached | 1,565 (61.6%) | 977 (38.4%) |
| 2 Unit Apartments | 0 (0.0%) | 23 (100.0%) |
| 3 or 4 Unit Apartments | 58 (16.1%) | 303 (83.9%) |
| 5 to 9 Unit Apartments | 167 (38.8%) | 263 (61.2%) |
| 10 or more Apartments | 95 (54.6%) | 79 (45.4%) |
| Mobile Home / Other | 140 (94.0%) | 9 (6.0%) |
| Total | 15,176 (75.5%) | 4,922 (24.5%) |
Housing Structures by Number of Rooms in Vega Baja Municipio
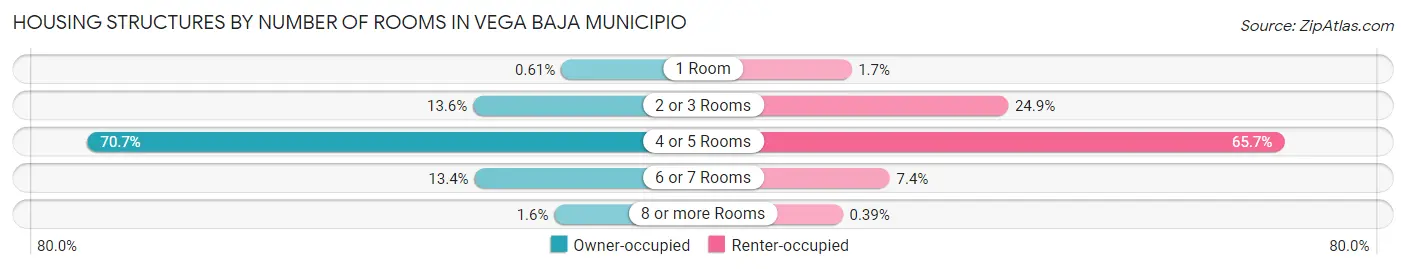
| Number of Rooms | Owner-occupied | Renter-occupied |
| 1 Room | 92 (0.6%) | 82 (1.7%) |
| 2 or 3 Rooms | 2,070 (13.6%) | 1,224 (24.9%) |
| 4 or 5 Rooms | 10,730 (70.7%) | 3,235 (65.7%) |
| 6 or 7 Rooms | 2,040 (13.4%) | 362 (7.3%) |
| 8 or more Rooms | 244 (1.6%) | 19 (0.4%) |
| Total | 15,176 (100.0%) | 4,922 (100.0%) |
Housing Structure by Heating Type in Vega Baja Municipio
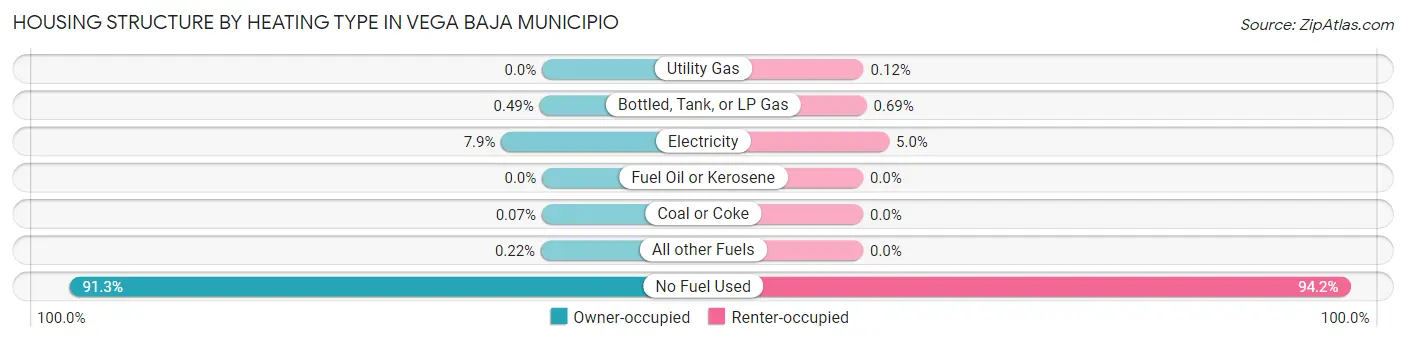
| Heating Type | Owner-occupied | Renter-occupied |
| Utility Gas | 0 (0.0%) | 6 (0.1%) |
| Bottled, Tank, or LP Gas | 75 (0.5%) | 34 (0.7%) |
| Electricity | 1,198 (7.9%) | 248 (5.0%) |
| Fuel Oil or Kerosene | 0 (0.0%) | 0 (0.0%) |
| Coal or Coke | 11 (0.1%) | 0 (0.0%) |
| All other Fuels | 34 (0.2%) | 0 (0.0%) |
| No Fuel Used | 13,858 (91.3%) | 4,634 (94.2%) |
| Total | 15,176 (100.0%) | 4,922 (100.0%) |
Household Vehicle Usage in Vega Baja Municipio
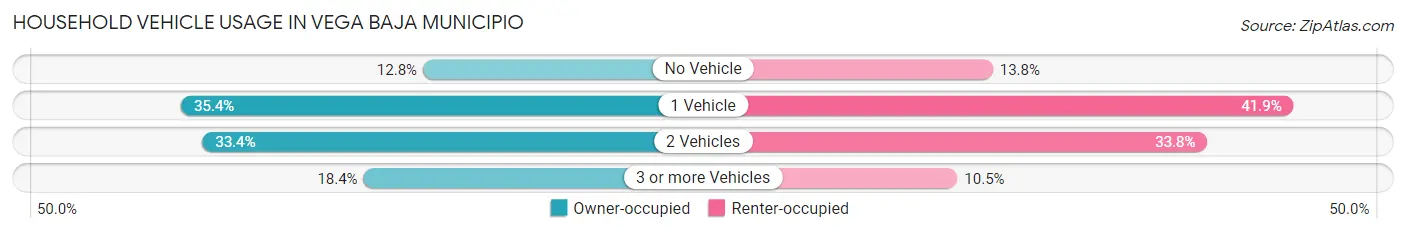
| Vehicles per Household | Owner-occupied | Renter-occupied |
| No Vehicle | 1,946 (12.8%) | 679 (13.8%) |
| 1 Vehicle | 5,372 (35.4%) | 2,061 (41.9%) |
| 2 Vehicles | 5,070 (33.4%) | 1,665 (33.8%) |
| 3 or more Vehicles | 2,788 (18.4%) | 517 (10.5%) |
| Total | 15,176 (100.0%) | 4,922 (100.0%) |
Real Estate & Mortgages in Vega Baja Municipio
Real Estate and Mortgage Overview in Vega Baja Municipio
| Characteristic | Without Mortgage | With Mortgage |
| Housing Units | 10,378 | 4,798 |
| Median Property Value | $105,200 | $141,700 |
| Median Household Income | $19,900 | $179 |
| Monthly Housing Costs | $166 | $94 |
| Real Estate Taxes | $383 | $4,531 |
Property Value by Mortgage Status in Vega Baja Municipio
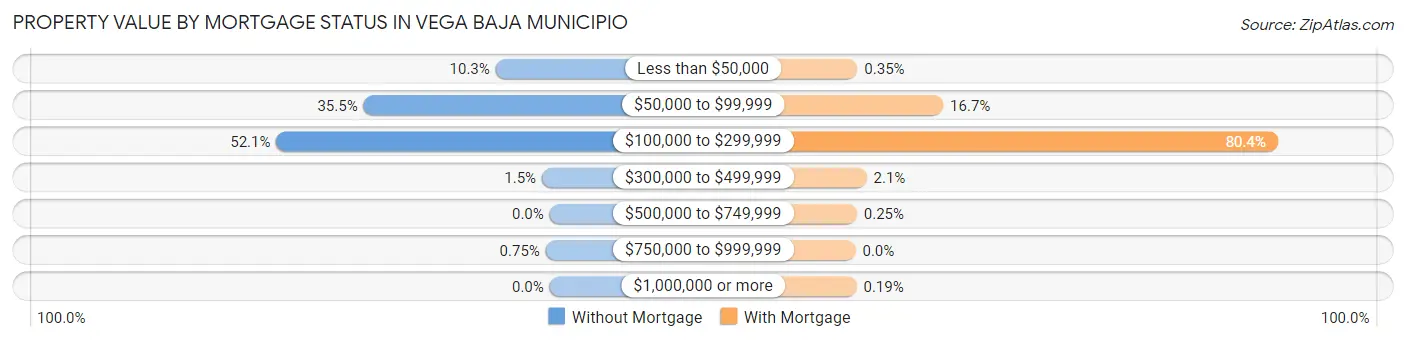
| Property Value | Without Mortgage | With Mortgage |
| Less than $50,000 | 1,067 (10.3%) | 17 (0.4%) |
| $50,000 to $99,999 | 3,679 (35.4%) | 801 (16.7%) |
| $100,000 to $299,999 | 5,402 (52.0%) | 3,858 (80.4%) |
| $300,000 to $499,999 | 152 (1.5%) | 101 (2.1%) |
| $500,000 to $749,999 | 0 (0.0%) | 12 (0.3%) |
| $750,000 to $999,999 | 78 (0.7%) | 0 (0.0%) |
| $1,000,000 or more | 0 (0.0%) | 9 (0.2%) |
| Total | 10,378 (100.0%) | 4,798 (100.0%) |
Household Income by Mortgage Status in Vega Baja Municipio
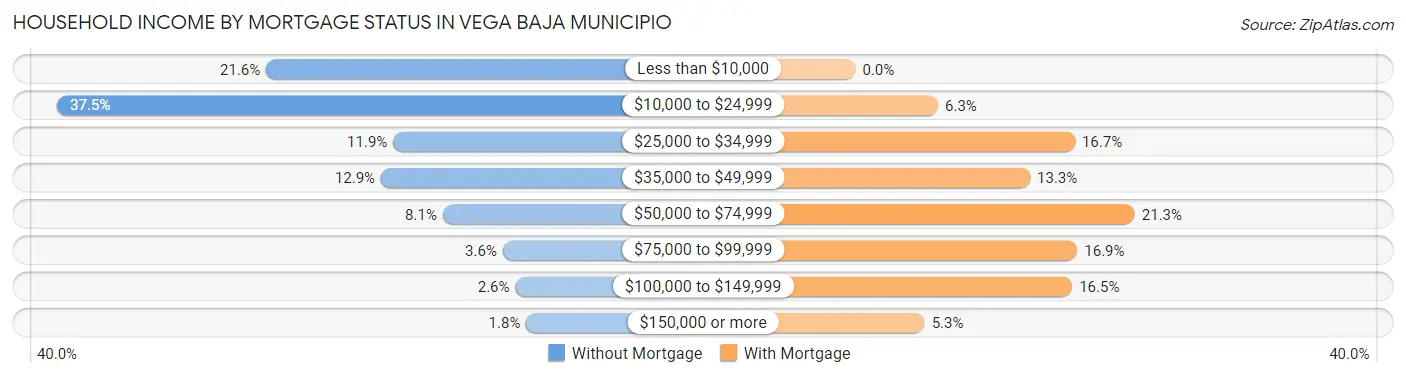
| Household Income | Without Mortgage | With Mortgage |
| Less than $10,000 | 2,242 (21.6%) | 0 (0.0%) |
| $10,000 to $24,999 | 3,894 (37.5%) | 302 (6.3%) |
| $25,000 to $34,999 | 1,237 (11.9%) | 802 (16.7%) |
| $35,000 to $49,999 | 1,334 (12.9%) | 638 (13.3%) |
| $50,000 to $74,999 | 845 (8.1%) | 1,021 (21.3%) |
| $75,000 to $99,999 | 370 (3.6%) | 811 (16.9%) |
| $100,000 to $149,999 | 271 (2.6%) | 792 (16.5%) |
| $150,000 or more | 185 (1.8%) | 253 (5.3%) |
| Total | 10,378 (100.0%) | 4,798 (100.0%) |
Property Value to Household Income Ratio in Vega Baja Municipio
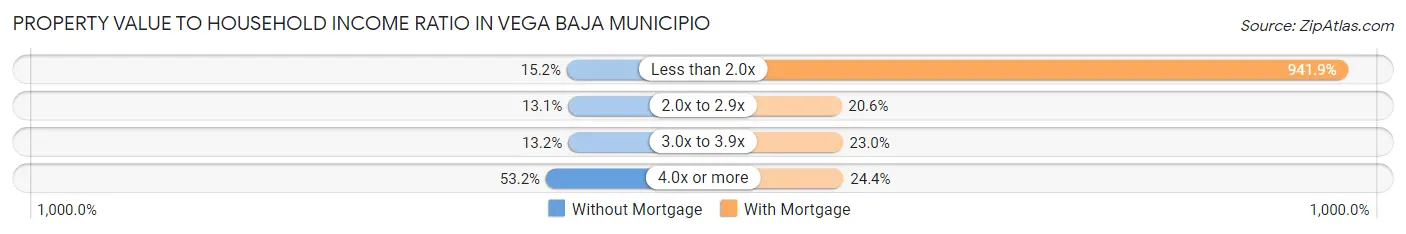
| Value-to-Income Ratio | Without Mortgage | With Mortgage |
| Less than 2.0x | 1,573 (15.2%) | 45,192 (941.9%) |
| 2.0x to 2.9x | 1,361 (13.1%) | 989 (20.6%) |
| 3.0x to 3.9x | 1,365 (13.2%) | 1,104 (23.0%) |
| 4.0x or more | 5,522 (53.2%) | 1,171 (24.4%) |
| Total | 10,378 (100.0%) | 4,798 (100.0%) |
Real Estate Taxes by Mortgage Status in Vega Baja Municipio
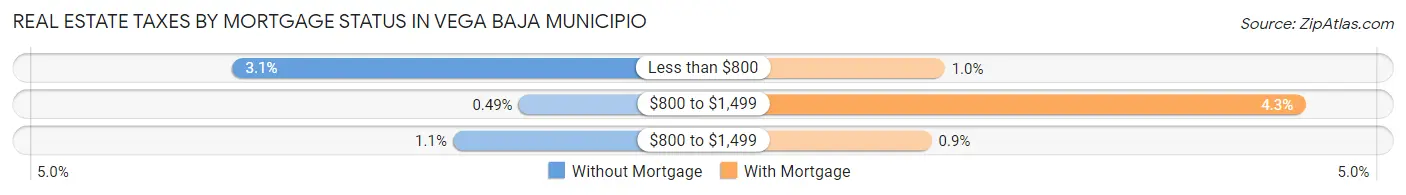
| Property Taxes | Without Mortgage | With Mortgage |
| Less than $800 | 322 (3.1%) | 49 (1.0%) |
| $800 to $1,499 | 51 (0.5%) | 207 (4.3%) |
| $800 to $1,499 | 113 (1.1%) | 43 (0.9%) |
| Total | 10,378 (100.0%) | 4,798 (100.0%) |
Health & Disability in Vega Baja Municipio
Health Insurance Coverage by Age in Vega Baja Municipio
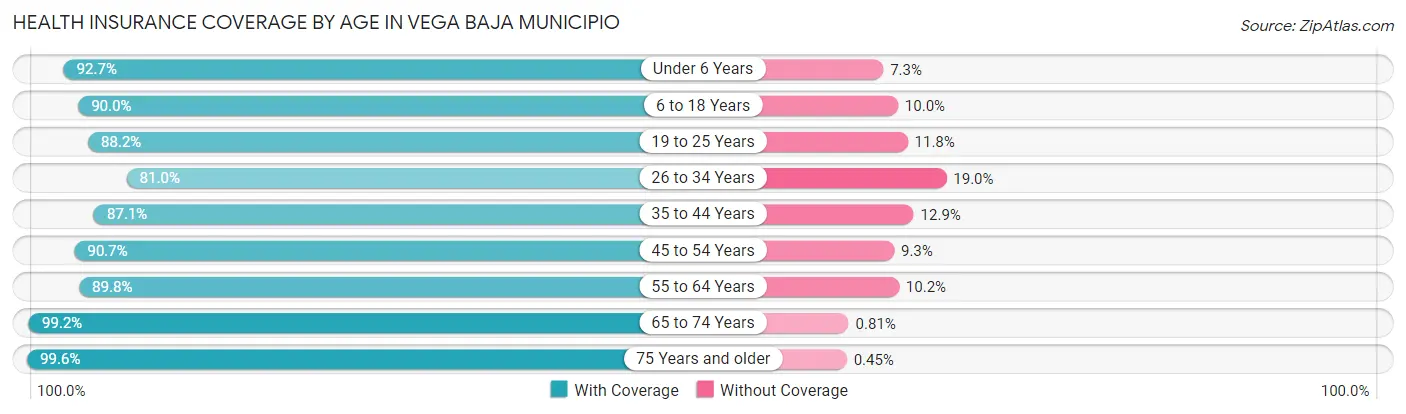
| Age Bracket | With Coverage | Without Coverage |
| Under 6 Years | 2,223 (92.7%) | 174 (7.3%) |
| 6 to 18 Years | 7,008 (90.0%) | 779 (10.0%) |
| 19 to 25 Years | 4,226 (88.2%) | 566 (11.8%) |
| 26 to 34 Years | 5,184 (81.0%) | 1,218 (19.0%) |
| 35 to 44 Years | 5,698 (87.1%) | 846 (12.9%) |
| 45 to 54 Years | 6,317 (90.7%) | 646 (9.3%) |
| 55 to 64 Years | 6,671 (89.8%) | 756 (10.2%) |
| 65 to 74 Years | 6,128 (99.2%) | 50 (0.8%) |
| 75 Years and older | 5,483 (99.6%) | 25 (0.4%) |
| Total | 48,938 (90.6%) | 5,060 (9.4%) |
Health Insurance Coverage by Citizenship Status in Vega Baja Municipio
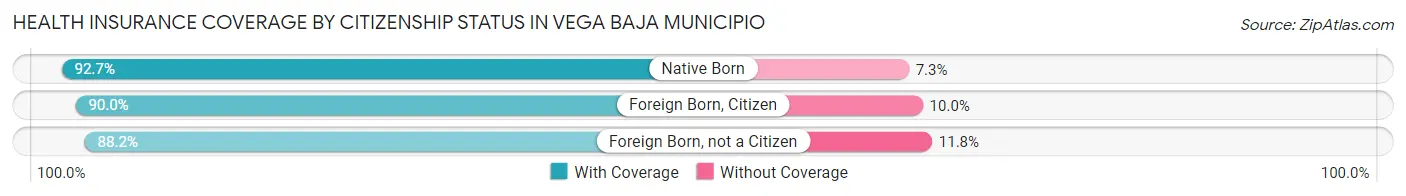
| Citizenship Status | With Coverage | Without Coverage |
| Native Born | 2,223 (92.7%) | 174 (7.3%) |
| Foreign Born, Citizen | 7,008 (90.0%) | 779 (10.0%) |
| Foreign Born, not a Citizen | 4,226 (88.2%) | 566 (11.8%) |
Health Insurance Coverage by Household Income in Vega Baja Municipio
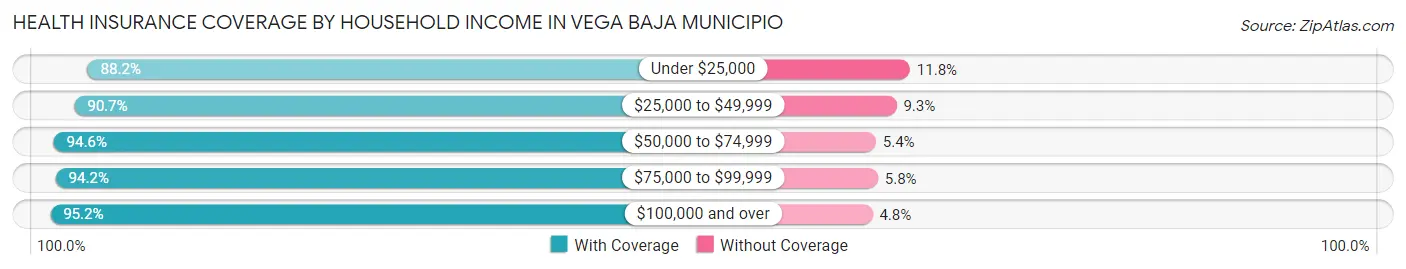
| Household Income | With Coverage | Without Coverage |
| Under $25,000 | 20,887 (88.2%) | 2,800 (11.8%) |
| $25,000 to $49,999 | 14,025 (90.7%) | 1,439 (9.3%) |
| $50,000 to $74,999 | 6,463 (94.6%) | 372 (5.4%) |
| $75,000 to $99,999 | 4,047 (94.2%) | 250 (5.8%) |
| $100,000 and over | 3,401 (95.2%) | 172 (4.8%) |
Public vs Private Health Insurance Coverage by Age in Vega Baja Municipio
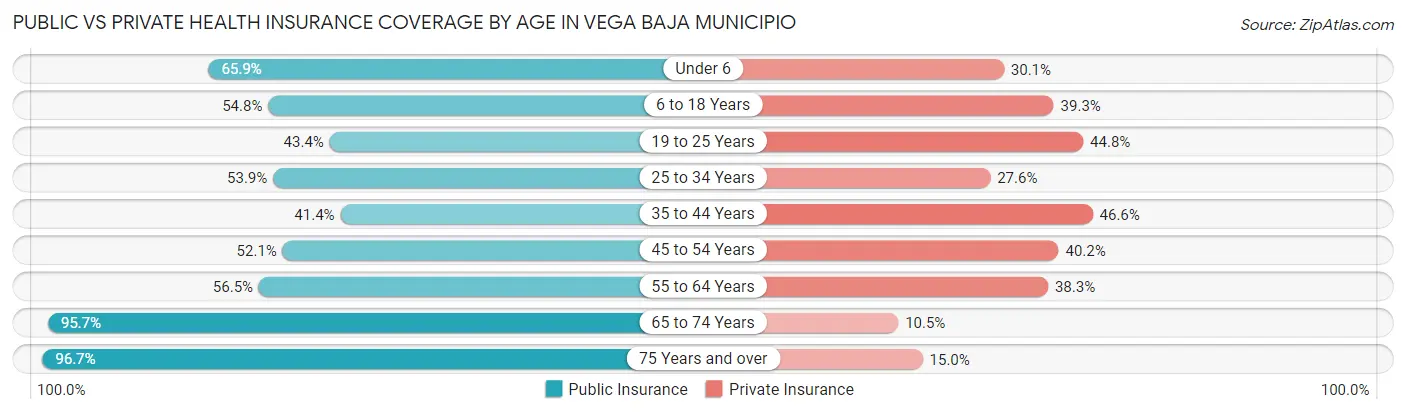
| Age Bracket | Public Insurance | Private Insurance |
| Under 6 | 1,579 (65.9%) | 721 (30.1%) |
| 6 to 18 Years | 4,266 (54.8%) | 3,062 (39.3%) |
| 19 to 25 Years | 2,079 (43.4%) | 2,147 (44.8%) |
| 25 to 34 Years | 3,449 (53.9%) | 1,764 (27.6%) |
| 35 to 44 Years | 2,708 (41.4%) | 3,046 (46.6%) |
| 45 to 54 Years | 3,628 (52.1%) | 2,802 (40.2%) |
| 55 to 64 Years | 4,197 (56.5%) | 2,842 (38.3%) |
| 65 to 74 Years | 5,912 (95.7%) | 647 (10.5%) |
| 75 Years and over | 5,326 (96.7%) | 826 (15.0%) |
| Total | 33,144 (61.4%) | 17,857 (33.1%) |
Disability Status by Sex by Age in Vega Baja Municipio
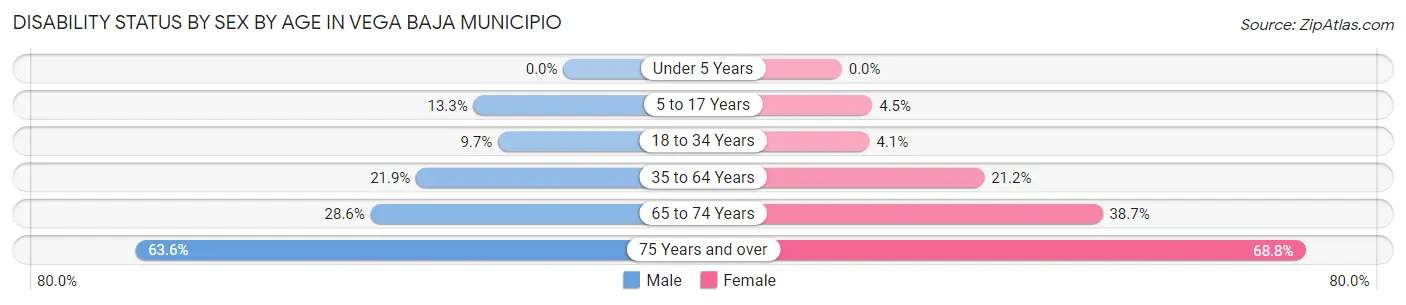
| Age Bracket | Male | Female |
| Under 5 Years | 0 (0.0%) | 0 (0.0%) |
| 5 to 17 Years | 508 (13.3%) | 163 (4.5%) |
| 18 to 34 Years | 579 (9.7%) | 245 (4.1%) |
| 35 to 64 Years | 2,130 (21.8%) | 2,366 (21.1%) |
| 65 to 74 Years | 804 (28.6%) | 1,304 (38.7%) |
| 75 Years and over | 1,471 (63.6%) | 2,198 (68.8%) |
Disability Class by Sex by Age in Vega Baja Municipio
Disability Class: Hearing Difficulty
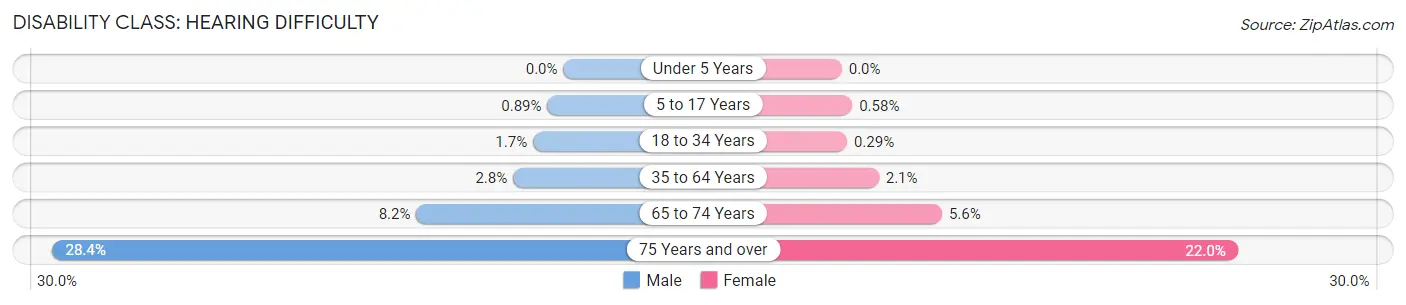
| Age Bracket | Male | Female |
| Under 5 Years | 0 (0.0%) | 0 (0.0%) |
| 5 to 17 Years | 34 (0.9%) | 21 (0.6%) |
| 18 to 34 Years | 101 (1.7%) | 17 (0.3%) |
| 35 to 64 Years | 273 (2.8%) | 230 (2.1%) |
| 65 to 74 Years | 230 (8.2%) | 188 (5.6%) |
| 75 Years and over | 658 (28.4%) | 704 (22.0%) |
Disability Class: Vision Difficulty
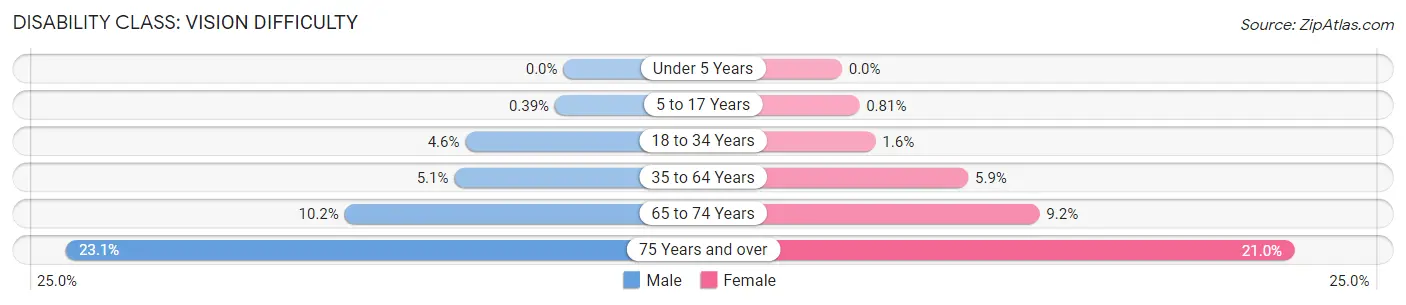
| Age Bracket | Male | Female |
| Under 5 Years | 0 (0.0%) | 0 (0.0%) |
| 5 to 17 Years | 15 (0.4%) | 29 (0.8%) |
| 18 to 34 Years | 272 (4.5%) | 93 (1.6%) |
| 35 to 64 Years | 493 (5.1%) | 655 (5.9%) |
| 65 to 74 Years | 285 (10.2%) | 309 (9.2%) |
| 75 Years and over | 534 (23.1%) | 670 (21.0%) |
Disability Class: Cognitive Difficulty
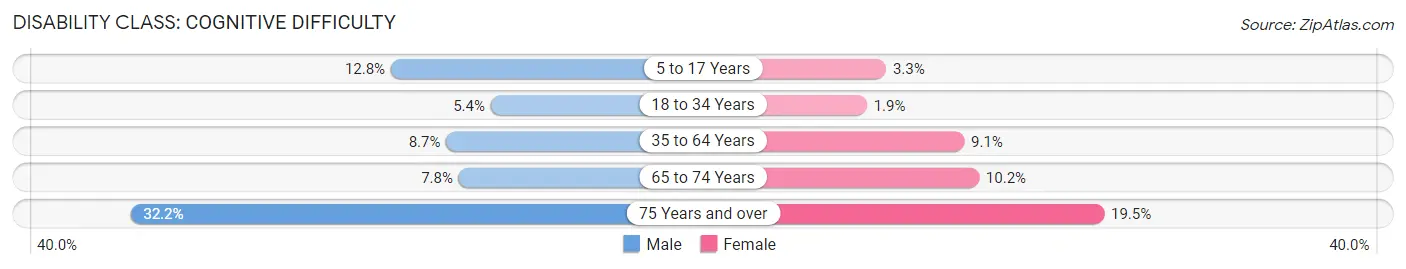
| Age Bracket | Male | Female |
| 5 to 17 Years | 488 (12.8%) | 118 (3.3%) |
| 18 to 34 Years | 322 (5.4%) | 110 (1.8%) |
| 35 to 64 Years | 847 (8.7%) | 1,016 (9.1%) |
| 65 to 74 Years | 218 (7.8%) | 343 (10.2%) |
| 75 Years and over | 744 (32.2%) | 622 (19.5%) |
Disability Class: Ambulatory Difficulty
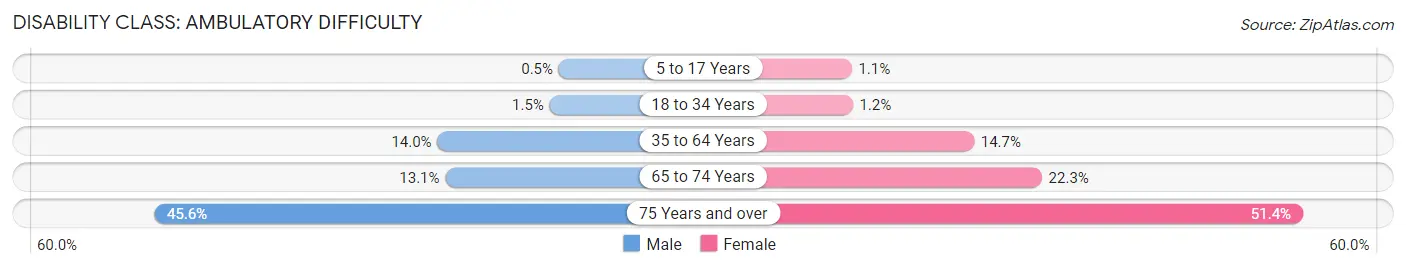
| Age Bracket | Male | Female |
| 5 to 17 Years | 19 (0.5%) | 39 (1.1%) |
| 18 to 34 Years | 91 (1.5%) | 71 (1.2%) |
| 35 to 64 Years | 1,367 (14.0%) | 1,644 (14.7%) |
| 65 to 74 Years | 369 (13.1%) | 750 (22.3%) |
| 75 Years and over | 1,055 (45.6%) | 1,640 (51.3%) |
Disability Class: Self-Care Difficulty

| Age Bracket | Male | Female |
| 5 to 17 Years | 19 (0.5%) | 30 (0.8%) |
| 18 to 34 Years | 91 (1.5%) | 97 (1.6%) |
| 35 to 64 Years | 562 (5.8%) | 904 (8.1%) |
| 65 to 74 Years | 156 (5.6%) | 387 (11.5%) |
| 75 Years and over | 589 (25.5%) | 1,018 (31.9%) |
Technology Access in Vega Baja Municipio
Computing Device Access in Vega Baja Municipio
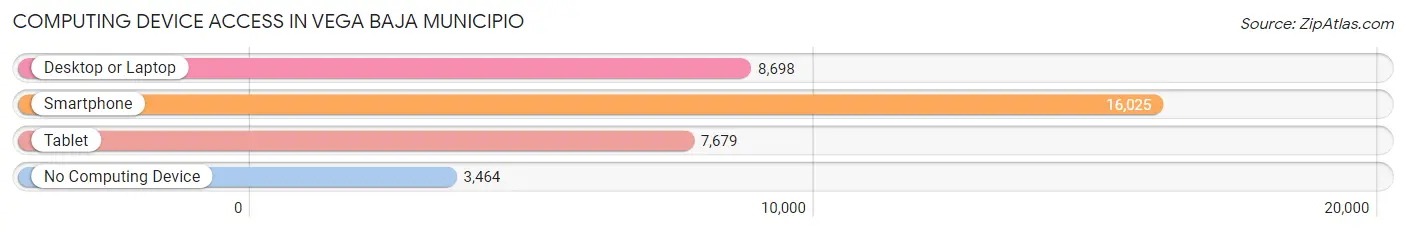
| Device Type | # Households | % Households |
| Desktop or Laptop | 8,698 | 43.3% |
| Smartphone | 16,025 | 79.7% |
| Tablet | 7,679 | 38.2% |
| No Computing Device | 3,464 | 17.2% |
| Total | 20,098 | 100.0% |
Internet Access in Vega Baja Municipio
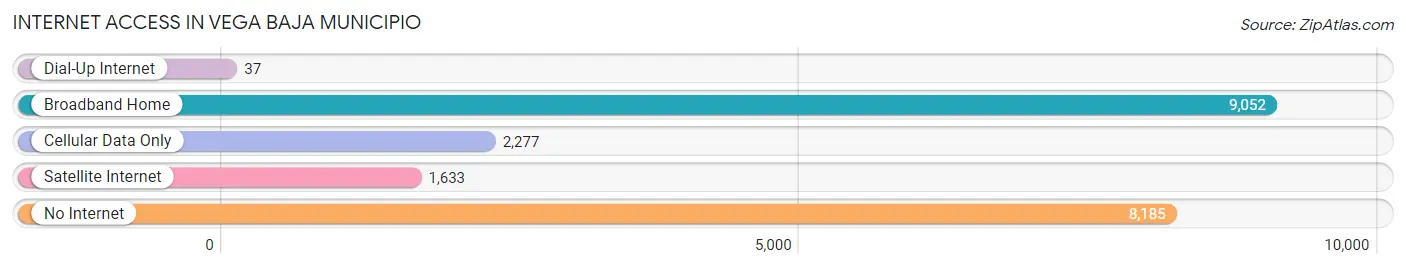
| Internet Type | # Households | % Households |
| Dial-Up Internet | 37 | 0.2% |
| Broadband Home | 9,052 | 45.0% |
| Cellular Data Only | 2,277 | 11.3% |
| Satellite Internet | 1,633 | 8.1% |
| No Internet | 8,185 | 40.7% |
| Total | 20,098 | 100.0% |
Vega Baja Municipio Summary
Vega Baja is a municipality located in the northern coast of Puerto Rico, in the northern part of the island. It is part of the San Juan-Caguas-Guaynabo Metropolitan Statistical Area. The municipality is bordered by the municipalities of Dorado, Toa Alta, Toa Baja, Manatí, and Vega Alta. As of the 2010 census, the population of Vega Baja was 44,039.
Geography
Vega Baja is located in the northern coast of Puerto Rico, in the northern part of the island. It is bordered by the municipalities of Dorado, Toa Alta, Toa Baja, Manatí, and Vega Alta. The municipality is located in the northern part of the island, and is part of the San Juan-Caguas-Guaynabo Metropolitan Statistical Area. The municipality is divided into two regions: the coastal region and the interior region. The coastal region is located along the northern coast of the island, and is characterized by its beaches and coastal plains. The interior region is located in the central part of the municipality, and is characterized by its hills and valleys.
The municipality has a total area of 39.9 square miles, of which 39.3 square miles is land and 0.6 square miles is water. The municipality is located in the northern part of the island, and is part of the San Juan-Caguas-Guaynabo Metropolitan Statistical Area.
History
The area of Vega Baja was originally inhabited by the Taíno Indians. The area was later colonized by the Spanish in the 16th century. The municipality was founded in 1702, and was originally part of the municipality of Bayamón. In 1831, the municipality was separated from Bayamón and became an independent municipality.
Economy
The economy of Vega Baja is mainly based on agriculture and tourism. The municipality is home to several agricultural products, such as sugar cane, coffee, and tobacco. The municipality is also home to several tourist attractions, such as the Vega Baja Beach, the Vega Baja River, and the Vega Baja Nature Reserve.
Demographics
As of the 2010 census, the population of Vega Baja was 44,039. The population is mostly of Hispanic origin, with a small percentage of African and Asian descent. The median household income in the municipality is $20,845, and the median age is 38.7 years. The unemployment rate in the municipality is 11.3%.
Conclusion
Vega Baja is a municipality located in the northern coast of Puerto Rico, in the northern part of the island. It is part of the San Juan-Caguas-Guaynabo Metropolitan Statistical Area. The municipality is bordered by the municipalities of Dorado, Toa Alta, Toa Baja, Manatí, and Vega Alta. The economy of Vega Baja is mainly based on agriculture and tourism. As of the 2010 census, the population of Vega Baja was 44,039. The population is mostly of Hispanic origin, with a small percentage of African and Asian descent. The median household income in the municipality is $20,845, and the median age is 38.7 years. The unemployment rate in the municipality is 11.3%.
Common Questions
What is Per Capita Income in Vega Baja Municipio?
Per Capita income in Vega Baja Municipio is $14,818.
What is the Median Family Income in Vega Baja Municipio?
Median Family Income in Vega Baja Municipio is $28,648.
What is the Median Household income in Vega Baja Municipio?
Median Household Income in Vega Baja Municipio is $23,701.
What is Income or Wage Gap in Vega Baja Municipio?
Income or Wage Gap in Vega Baja Municipio is 1.9%.
Women in Vega Baja Municipio earn 98.1 cents for every dollar earned by a man.
What is Family Income Deficit in Vega Baja Municipio?
Family Income Deficit in Vega Baja Municipio is $11,940.
Families that are below poverty line in Vega Baja Municipio earn $11,940 less on average than the poverty threshold level.
What is Inequality or Gini Index in Vega Baja Municipio?
Inequality or Gini Index in Vega Baja Municipio is 0.54.
What is the Total Population of Vega Baja Municipio?
Total Population of Vega Baja Municipio is 54,182.
What is the Total Male Population of Vega Baja Municipio?
Total Male Population of Vega Baja Municipio is 25,849.
What is the Total Female Population of Vega Baja Municipio?
Total Female Population of Vega Baja Municipio is 28,333.
What is the Ratio of Males per 100 Females in Vega Baja Municipio?
There are 91.23 Males per 100 Females in Vega Baja Municipio.
What is the Ratio of Females per 100 Males in Vega Baja Municipio?
There are 109.61 Females per 100 Males in Vega Baja Municipio.
What is the Median Population Age in Vega Baja Municipio?
Median Population Age in Vega Baja Municipio is 43.9 Years.
What is the Average Family Size in Vega Baja Municipio
Average Family Size in Vega Baja Municipio is 3.3 People.
What is the Average Household Size in Vega Baja Municipio
Average Household Size in Vega Baja Municipio is 2.7 People.
How Large is the Labor Force in Vega Baja Municipio?
There are 20,272 People in the Labor Forcein in Vega Baja Municipio.
What is the Percentage of People in the Labor Force in Vega Baja Municipio?
44.1% of People are in the Labor Force in Vega Baja Municipio.
What is the Unemployment Rate in Vega Baja Municipio?
Unemployment Rate in Vega Baja Municipio is 16.3%.