San Sebastian Municipio, PR Map & Demographics
San Sebastian Municipio Overview
$11,370
PER CAPITA INCOME
$21,658
AVG FAMILY INCOME
$17,557
AVG HOUSEHOLD INCOME
2.5%
WAGE / INCOME GAP [ % ]
97.5¢/ $1
WAGE / INCOME GAP [ $ ]
$10,506
FAMILY INCOME DEFICIT
0.52
INEQUALITY / GINI INDEX
39,183
TOTAL POPULATION
19,051
MALE POPULATION
20,132
FEMALE POPULATION
94.63
MALES / 100 FEMALES
105.67
FEMALES / 100 MALES
46.0
MEDIAN AGE
3.4
AVG FAMILY SIZE
2.8
AVG HOUSEHOLD SIZE
12,832
LABOR FORCE [ PEOPLE ]
38.4%
PERCENT IN LABOR FORCE
14.9%
UNEMPLOYMENT RATE
San Sebastian Municipio Area Codes
Income in San Sebastian Municipio
Income Overview in San Sebastian Municipio
Per Capita Income in San Sebastian Municipio is $11,370, while median incomes of families and households are $21,658 and $17,557 respectively.
| Characteristic | Number | Measure |
| Per Capita Income | 39,183 | $11,370 |
| Median Family Income | 9,552 | $21,658 |
| Mean Family Income | 9,552 | $31,003 |
| Median Household Income | 13,978 | $17,557 |
| Mean Household Income | 13,978 | $27,277 |
| Income Deficit | 9,552 | $10,506 |
| Wage / Income Gap (%) | 39,183 | 2.47% |
| Wage / Income Gap ($) | 39,183 | 97.53¢ per $1 |
| Gini / Inequality Index | 39,183 | 0.52 |
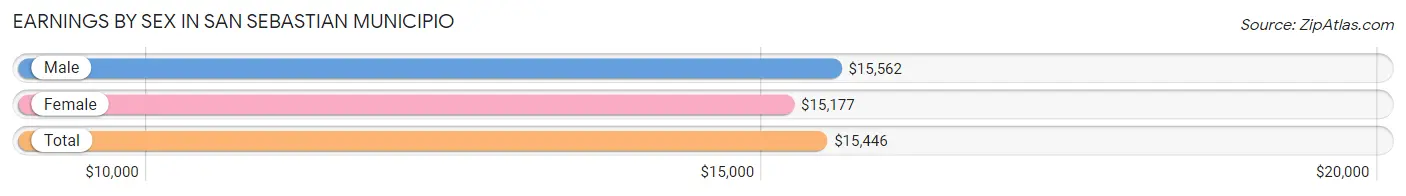
Earnings by Sex in San Sebastian Municipio
Average Earnings in San Sebastian Municipio are $15,446, $15,562 for men and $15,177 for women, a difference of 2.5%.
| Sex | Number | Average Earnings |
| Male | 7,230 (58.4%) | $15,562 |
| Female | 5,145 (41.6%) | $15,177 |
| Total | 12,375 (100.0%) | $15,446 |
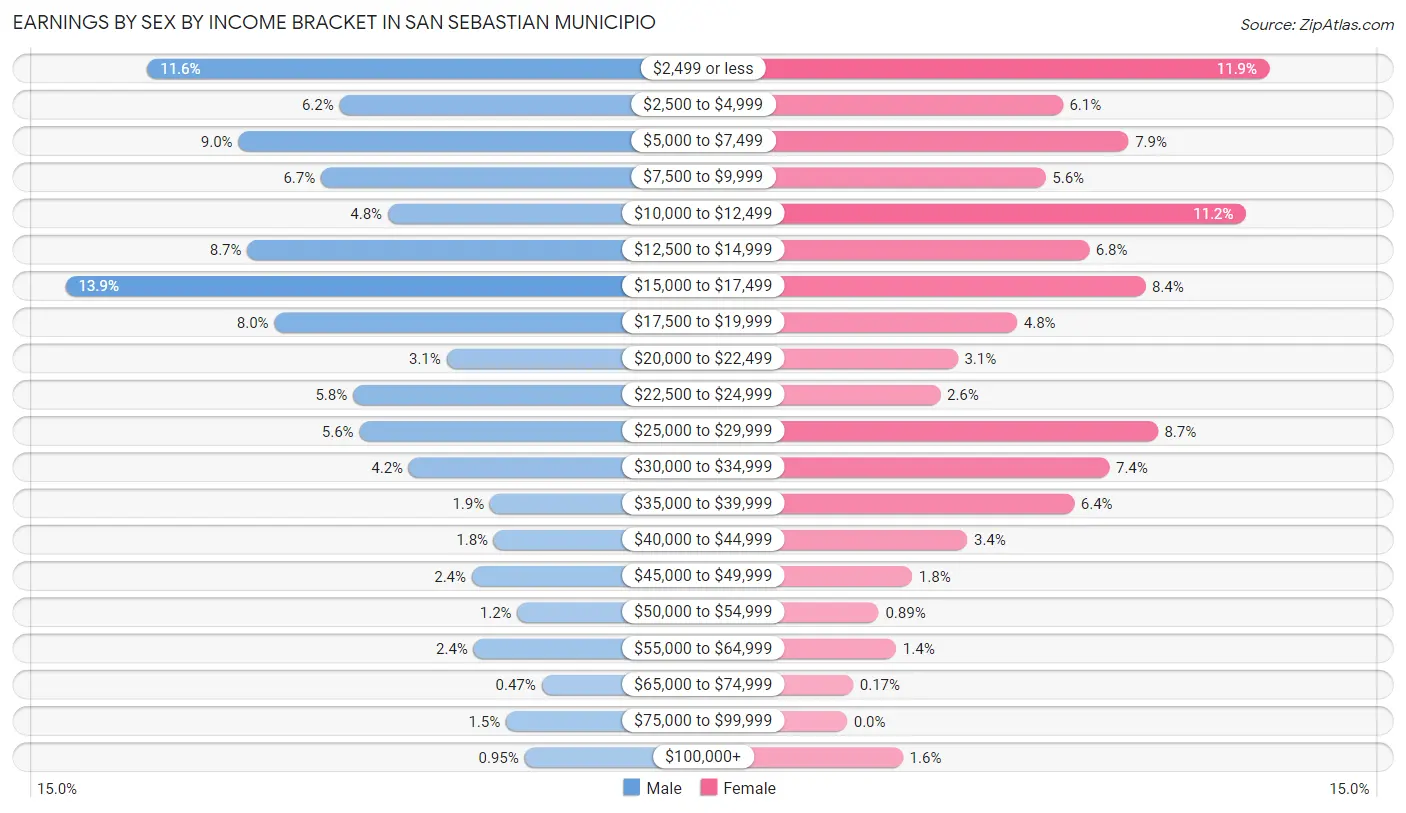
Earnings by Sex by Income Bracket in San Sebastian Municipio
The most common earnings brackets in San Sebastian Municipio are $15,000 to $17,499 for men (1,001 | 13.9%) and $2,499 or less for women (610 | 11.9%).
| Income | Male | Female |
| $2,499 or less | 835 (11.6%) | 610 (11.9%) |
| $2,500 to $4,999 | 445 (6.1%) | 312 (6.1%) |
| $5,000 to $7,499 | 650 (9.0%) | 407 (7.9%) |
| $7,500 to $9,999 | 482 (6.7%) | 287 (5.6%) |
| $10,000 to $12,499 | 346 (4.8%) | 576 (11.2%) |
| $12,500 to $14,999 | 632 (8.7%) | 350 (6.8%) |
| $15,000 to $17,499 | 1,001 (13.9%) | 431 (8.4%) |
| $17,500 to $19,999 | 577 (8.0%) | 246 (4.8%) |
| $20,000 to $22,499 | 227 (3.1%) | 160 (3.1%) |
| $22,500 to $24,999 | 417 (5.8%) | 135 (2.6%) |
| $25,000 to $29,999 | 404 (5.6%) | 449 (8.7%) |
| $30,000 to $34,999 | 304 (4.2%) | 379 (7.4%) |
| $35,000 to $39,999 | 139 (1.9%) | 328 (6.4%) |
| $40,000 to $44,999 | 131 (1.8%) | 174 (3.4%) |
| $45,000 to $49,999 | 176 (2.4%) | 94 (1.8%) |
| $50,000 to $54,999 | 83 (1.1%) | 46 (0.9%) |
| $55,000 to $64,999 | 172 (2.4%) | 71 (1.4%) |
| $65,000 to $74,999 | 34 (0.5%) | 9 (0.2%) |
| $75,000 to $99,999 | 106 (1.5%) | 0 (0.0%) |
| $100,000+ | 69 (0.9%) | 81 (1.6%) |
| Total | 7,230 (100.0%) | 5,145 (100.0%) |
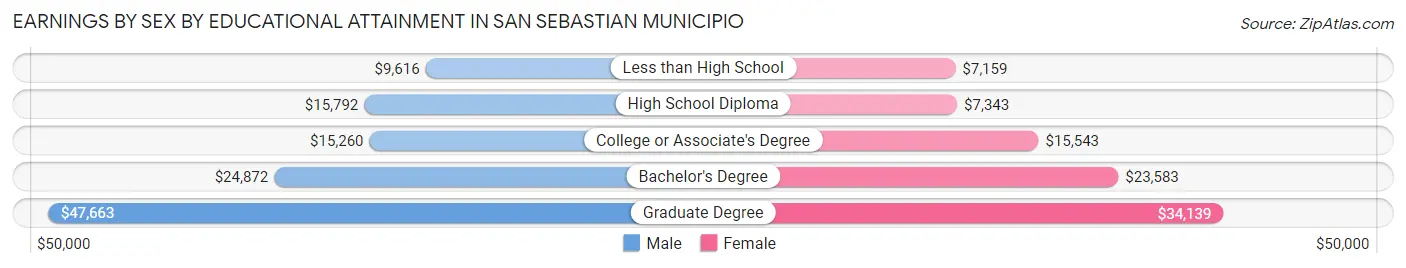
Earnings by Sex by Educational Attainment in San Sebastian Municipio
Average earnings in San Sebastian Municipio are $16,094 for men and $16,454 for women, a difference of 2.2%. Men with an educational attainment of graduate degree enjoy the highest average annual earnings of $47,663, while those with less than high school education earn the least with $9,616. Women with an educational attainment of graduate degree earn the most with the average annual earnings of $34,139, while those with less than high school education have the smallest earnings of $7,159.
| Educational Attainment | Male Income | Female Income |
| Less than High School | $9,616 | $7,159 |
| High School Diploma | $15,792 | $7,343 |
| College or Associate's Degree | $15,260 | $15,543 |
| Bachelor's Degree | $24,872 | $23,583 |
| Graduate Degree | $47,663 | $34,139 |
| Total | $16,094 | $16,454 |
Family Income in San Sebastian Municipio
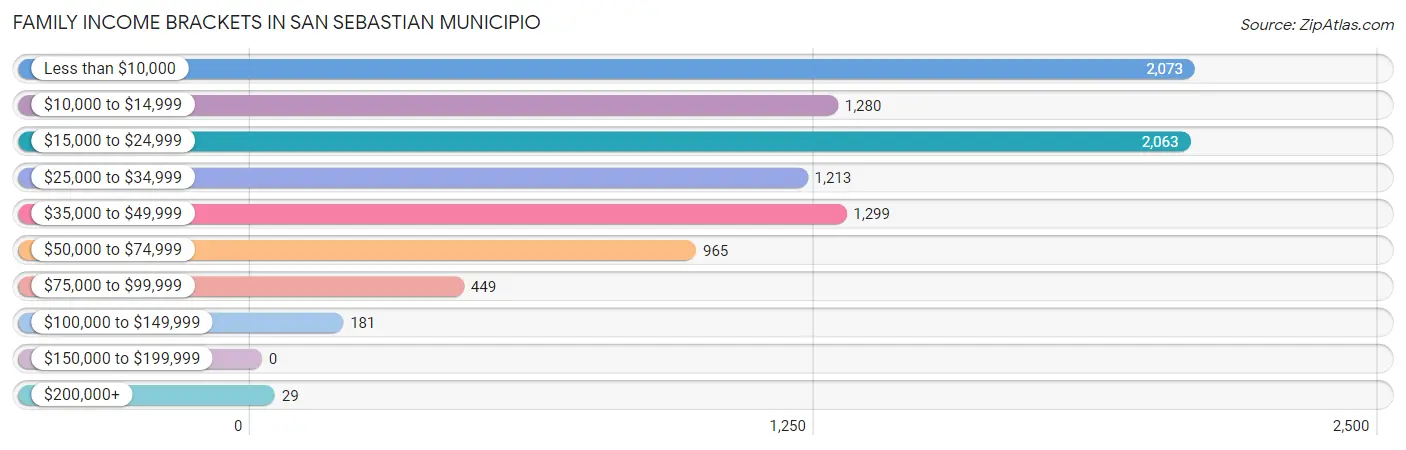
Family Income Brackets in San Sebastian Municipio
According to the San Sebastian Municipio family income data, there are 2,073 families falling into the less than $10,000 income range, which is the most common income bracket and makes up 21.7% of all families.
| Income Bracket | # Families | % Families |
| Less than $10,000 | 2,073 | 21.7% |
| $10,000 to $14,999 | 1,280 | 13.4% |
| $15,000 to $24,999 | 2,063 | 21.6% |
| $25,000 to $34,999 | 1,213 | 12.7% |
| $35,000 to $49,999 | 1,299 | 13.6% |
| $50,000 to $74,999 | 965 | 10.1% |
| $75,000 to $99,999 | 449 | 4.7% |
| $100,000 to $149,999 | 181 | 1.9% |
| $150,000 to $199,999 | 0 | 0.0% |
| $200,000+ | 29 | 0.3% |
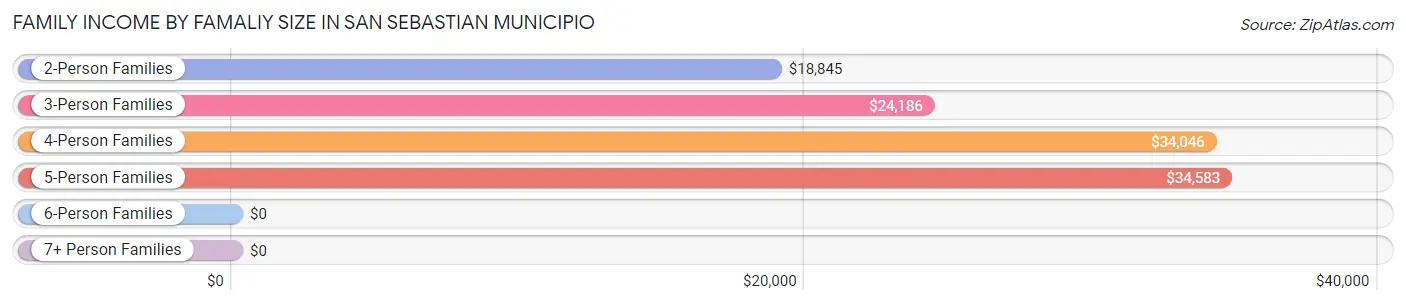
Family Income by Famaliy Size in San Sebastian Municipio
5-person families (274 | 2.9%) account for the highest median family income in San Sebastian Municipio with $34,583 per family, while 2-person families (5,513 | 57.7%) have the highest median income of $9,422 per family member.
| Income Bracket | # Families | Median Income |
| 2-Person Families | 5,513 (57.7%) | $18,845 |
| 3-Person Families | 2,336 (24.5%) | $24,186 |
| 4-Person Families | 1,351 (14.1%) | $34,046 |
| 5-Person Families | 274 (2.9%) | $34,583 |
| 6-Person Families | 46 (0.5%) | $0 |
| 7+ Person Families | 32 (0.3%) | $0 |
| Total | 9,552 (100.0%) | $21,658 |
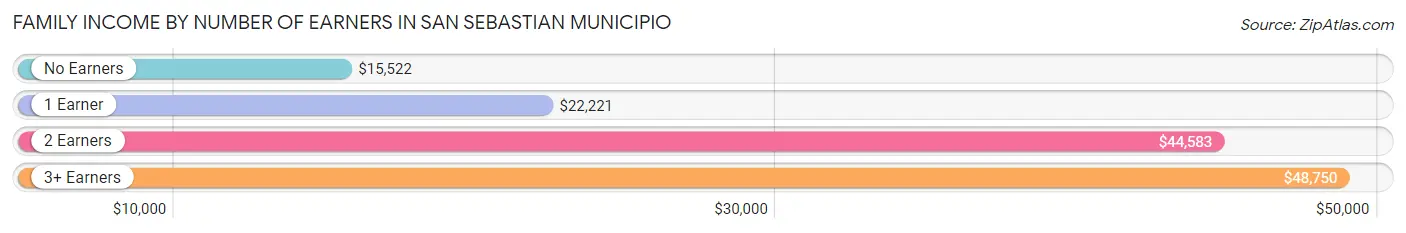
Family Income by Number of Earners in San Sebastian Municipio
The median family income in San Sebastian Municipio is $21,658, with families comprising 3+ earners (342) having the highest median family income of $48,750, while families with no earners (4,179) have the lowest median family income of $15,522, accounting for 3.6% and 43.8% of families, respectively.
| Number of Earners | # Families | Median Income |
| No Earners | 4,179 (43.8%) | $15,522 |
| 1 Earner | 3,363 (35.2%) | $22,221 |
| 2 Earners | 1,668 (17.5%) | $44,583 |
| 3+ Earners | 342 (3.6%) | $48,750 |
| Total | 9,552 (100.0%) | $21,658 |
Household Income in San Sebastian Municipio
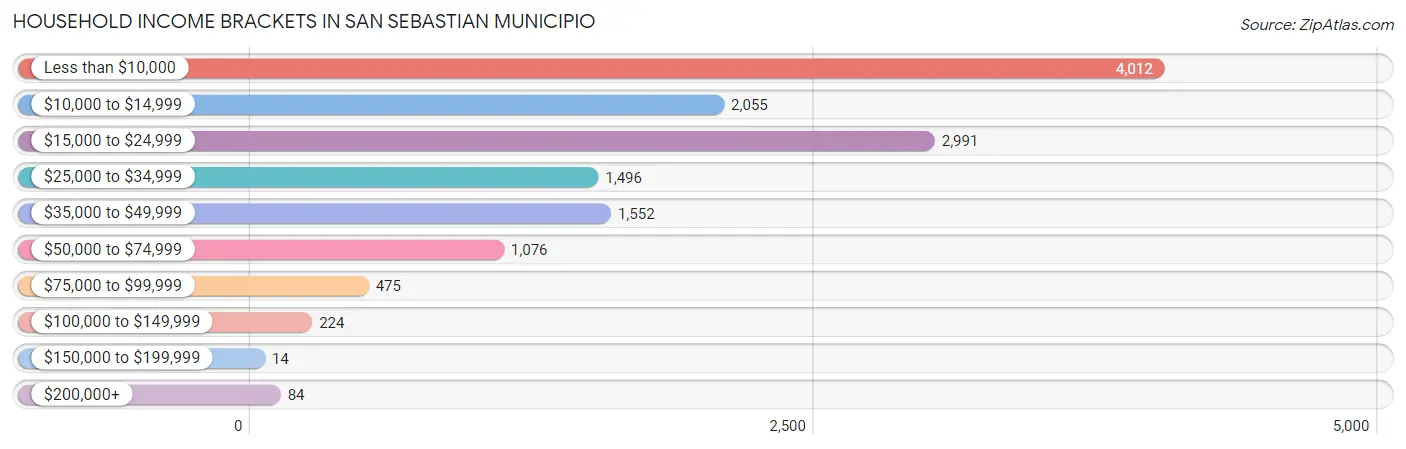
Household Income Brackets in San Sebastian Municipio
With 4,012 households falling in the category, the less than $10,000 income range is the most frequent in San Sebastian Municipio, accounting for 28.7% of all households. In contrast, only 14 households (0.1%) fall into the $150,000 to $199,999 income bracket, making it the least populous group.
| Income Bracket | # Households | % Households |
| Less than $10,000 | 4,012 | 28.7% |
| $10,000 to $14,999 | 2,055 | 14.7% |
| $15,000 to $24,999 | 2,991 | 21.4% |
| $25,000 to $34,999 | 1,496 | 10.7% |
| $35,000 to $49,999 | 1,552 | 11.1% |
| $50,000 to $74,999 | 1,076 | 7.7% |
| $75,000 to $99,999 | 475 | 3.4% |
| $100,000 to $149,999 | 224 | 1.6% |
| $150,000 to $199,999 | 14 | 0.1% |
| $200,000+ | 84 | 0.6% |
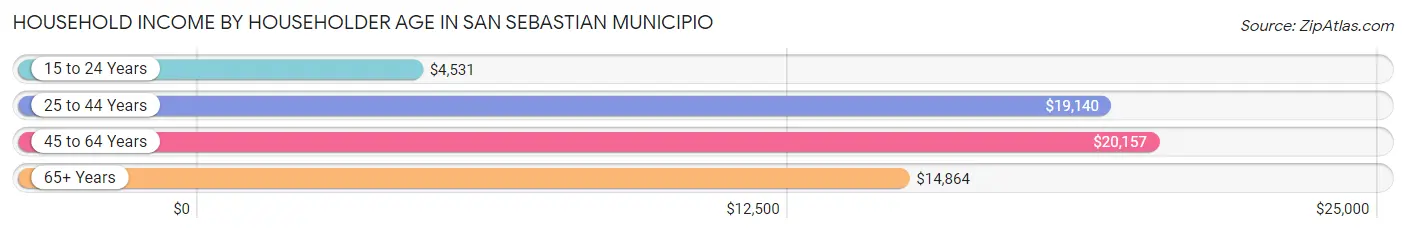
Household Income by Householder Age in San Sebastian Municipio
The median household income in San Sebastian Municipio is $17,557, with the highest median household income of $20,157 found in the 45 to 64 years age bracket for the primary householder. A total of 4,966 households (35.5%) fall into this category. Meanwhile, the 15 to 24 years age bracket for the primary householder has the lowest median household income of $4,531, with 57 households (0.4%) in this group.
| Income Bracket | # Households | Median Income |
| 15 to 24 Years | 57 (0.4%) | $4,531 |
| 25 to 44 Years | 3,149 (22.5%) | $19,140 |
| 45 to 64 Years | 4,966 (35.5%) | $20,157 |
| 65+ Years | 5,806 (41.5%) | $14,864 |
| Total | 13,978 (100.0%) | $17,557 |
Poverty in San Sebastian Municipio
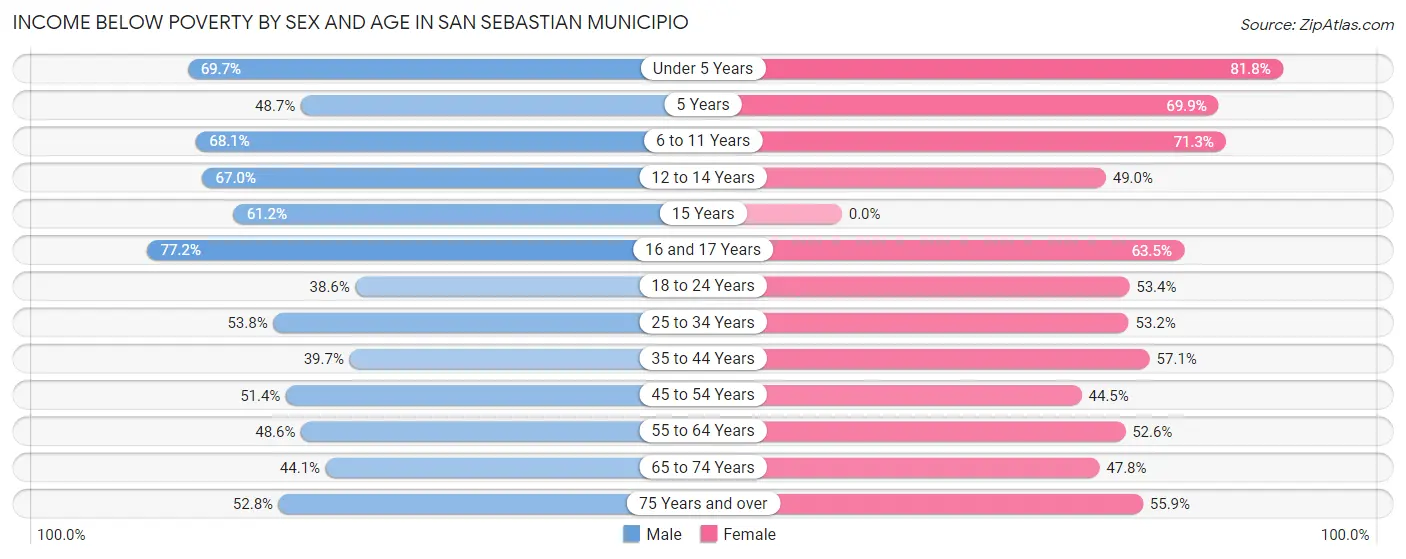
Income Below Poverty by Sex and Age in San Sebastian Municipio
With 50.9% poverty level for males and 53.9% for females among the residents of San Sebastian Municipio, 16 and 17 year old males and under 5 year old females are the most vulnerable to poverty, with 294 males (77.2%) and 521 females (81.8%) in their respective age groups living below the poverty level.
| Age Bracket | Male | Female |
| Under 5 Years | 465 (69.7%) | 521 (81.8%) |
| 5 Years | 73 (48.7%) | 86 (69.9%) |
| 6 to 11 Years | 835 (68.1%) | 726 (71.3%) |
| 12 to 14 Years | 468 (66.9%) | 419 (49.0%) |
| 15 Years | 197 (61.2%) | 0 (0.0%) |
| 16 and 17 Years | 294 (77.2%) | 389 (63.5%) |
| 18 to 24 Years | 661 (38.6%) | 807 (53.4%) |
| 25 to 34 Years | 1,197 (53.8%) | 1,159 (53.2%) |
| 35 to 44 Years | 900 (39.7%) | 1,329 (57.1%) |
| 45 to 54 Years | 1,180 (51.4%) | 1,138 (44.5%) |
| 55 to 64 Years | 1,249 (48.6%) | 1,569 (52.6%) |
| 65 to 74 Years | 1,108 (44.1%) | 1,345 (47.8%) |
| 75 Years and over | 1,055 (52.8%) | 1,279 (55.9%) |
| Total | 9,682 (50.9%) | 10,767 (53.9%) |
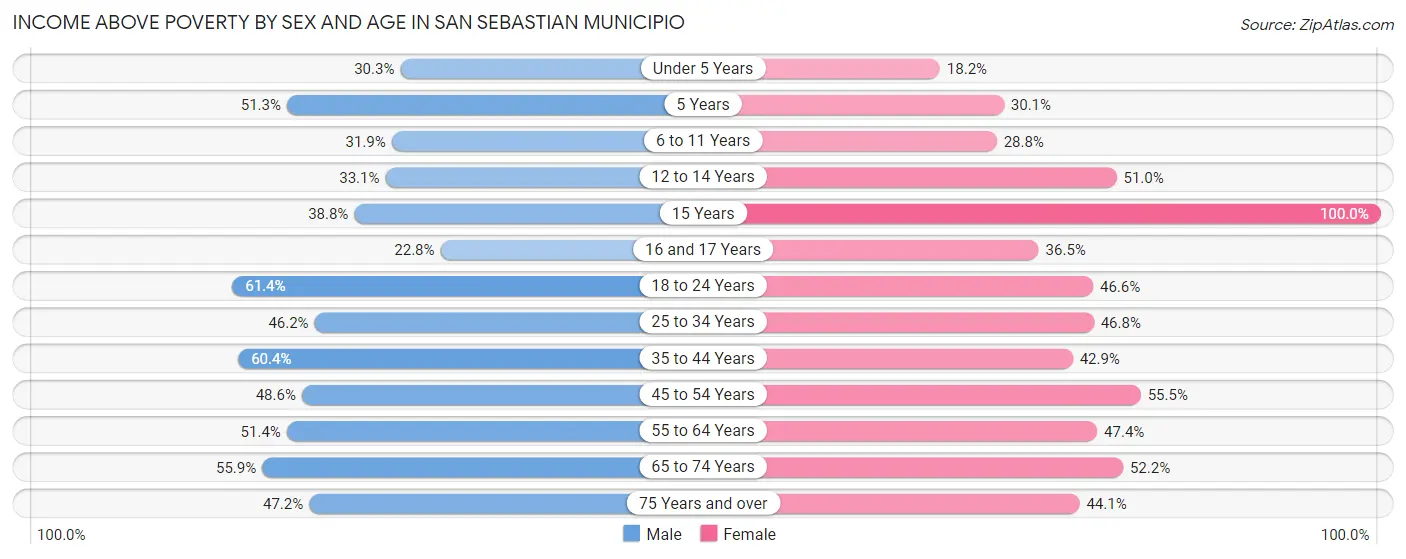
Income Above Poverty by Sex and Age in San Sebastian Municipio
According to the poverty statistics in San Sebastian Municipio, males aged 18 to 24 years and females aged 15 years are the age groups that are most secure financially, with 61.4% of males and 100.0% of females in these age groups living above the poverty line.
| Age Bracket | Male | Female |
| Under 5 Years | 202 (30.3%) | 116 (18.2%) |
| 5 Years | 77 (51.3%) | 37 (30.1%) |
| 6 to 11 Years | 391 (31.9%) | 293 (28.7%) |
| 12 to 14 Years | 231 (33.1%) | 436 (51.0%) |
| 15 Years | 125 (38.8%) | 61 (100.0%) |
| 16 and 17 Years | 87 (22.8%) | 224 (36.5%) |
| 18 to 24 Years | 1,053 (61.4%) | 705 (46.6%) |
| 25 to 34 Years | 1,028 (46.2%) | 1,018 (46.8%) |
| 35 to 44 Years | 1,370 (60.4%) | 997 (42.9%) |
| 45 to 54 Years | 1,114 (48.6%) | 1,419 (55.5%) |
| 55 to 64 Years | 1,319 (51.4%) | 1,414 (47.4%) |
| 65 to 74 Years | 1,406 (55.9%) | 1,468 (52.2%) |
| 75 Years and over | 943 (47.2%) | 1,010 (44.1%) |
| Total | 9,346 (49.1%) | 9,198 (46.1%) |
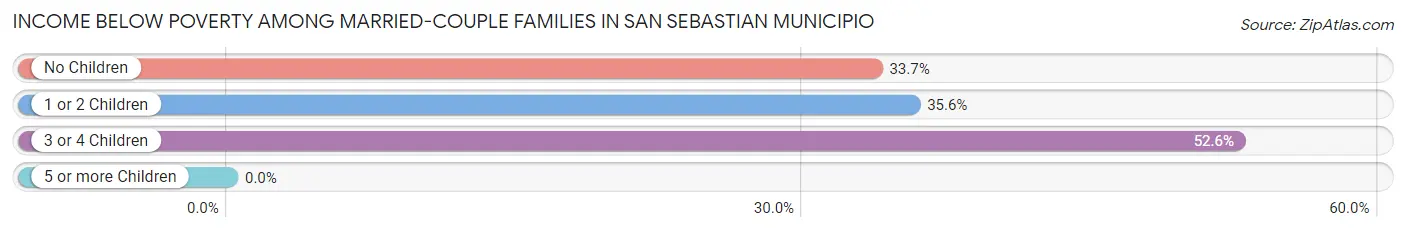
Income Below Poverty Among Married-Couple Families in San Sebastian Municipio
The poverty statistics for married-couple families in San Sebastian Municipio show that 34.3% or 2,098 of the total 6,109 families live below the poverty line. Families with 3 or 4 children have the highest poverty rate of 52.6%, comprising of 40 families. On the other hand, families with no children have the lowest poverty rate of 33.7%, which includes 1,562 families.
| Children | Above Poverty | Below Poverty |
| No Children | 3,079 (66.3%) | 1,562 (33.7%) |
| 1 or 2 Children | 896 (64.4%) | 496 (35.6%) |
| 3 or 4 Children | 36 (47.4%) | 40 (52.6%) |
| 5 or more Children | 0 (0.0%) | 0 (0.0%) |
| Total | 4,011 (65.7%) | 2,098 (34.3%) |
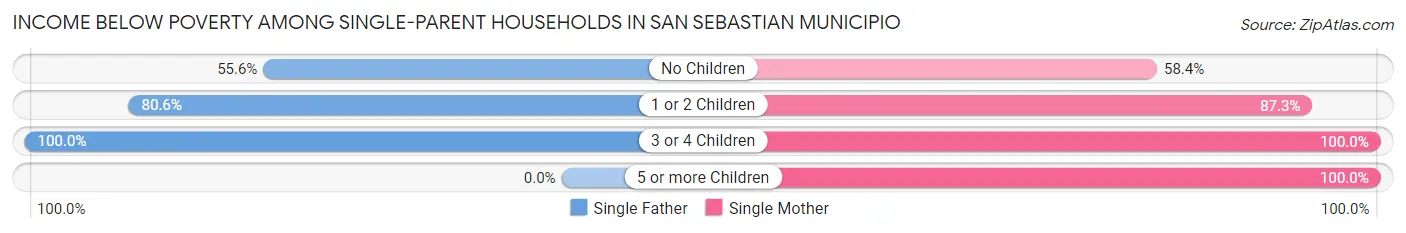
Income Below Poverty Among Single-Parent Households in San Sebastian Municipio
According to the poverty data in San Sebastian Municipio, 71.5% or 801 single-father households and 72.7% or 1,688 single-mother households are living below the poverty line. Among single-father households, those with 3 or 4 children have the highest poverty rate, with 21 households (100.0%) experiencing poverty. Likewise, among single-mother households, those with 3 or 4 children have the highest poverty rate, with 113 households (100.0%) falling below the poverty line.
| Children | Single Father | Single Mother |
| No Children | 235 (55.6%) | 718 (58.4%) |
| 1 or 2 Children | 545 (80.6%) | 843 (87.3%) |
| 3 or 4 Children | 21 (100.0%) | 113 (100.0%) |
| 5 or more Children | 0 (0.0%) | 14 (100.0%) |
| Total | 801 (71.5%) | 1,688 (72.7%) |
Income Below Poverty Among Married-Couple vs Single-Parent Households in San Sebastian Municipio
The poverty data for San Sebastian Municipio shows that 2,098 of the married-couple family households (34.3%) and 2,489 of the single-parent households (72.3%) are living below the poverty level. Within the married-couple family households, those with 3 or 4 children have the highest poverty rate, with 40 households (52.6%) falling below the poverty line. Among the single-parent households, those with 3 or 4 children have the highest poverty rate, with 134 household (100.0%) living below poverty.
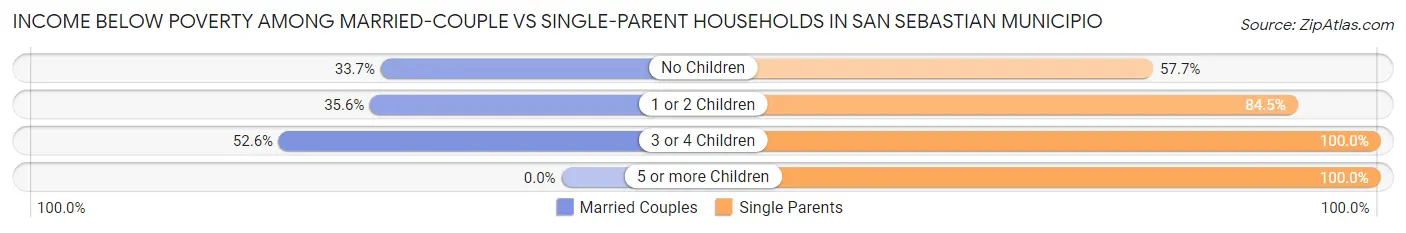
| Children | Married-Couple Families | Single-Parent Households |
| No Children | 1,562 (33.7%) | 953 (57.7%) |
| 1 or 2 Children | 496 (35.6%) | 1,388 (84.5%) |
| 3 or 4 Children | 40 (52.6%) | 134 (100.0%) |
| 5 or more Children | 0 (0.0%) | 14 (100.0%) |
| Total | 2,098 (34.3%) | 2,489 (72.3%) |
Race in San Sebastian Municipio
The most populous races in San Sebastian Municipio are Hispanic or Latino (37,534 | 95.8%), White / Caucasian (28,422 | 72.5%), and Some other Race (6,006 | 15.3%).
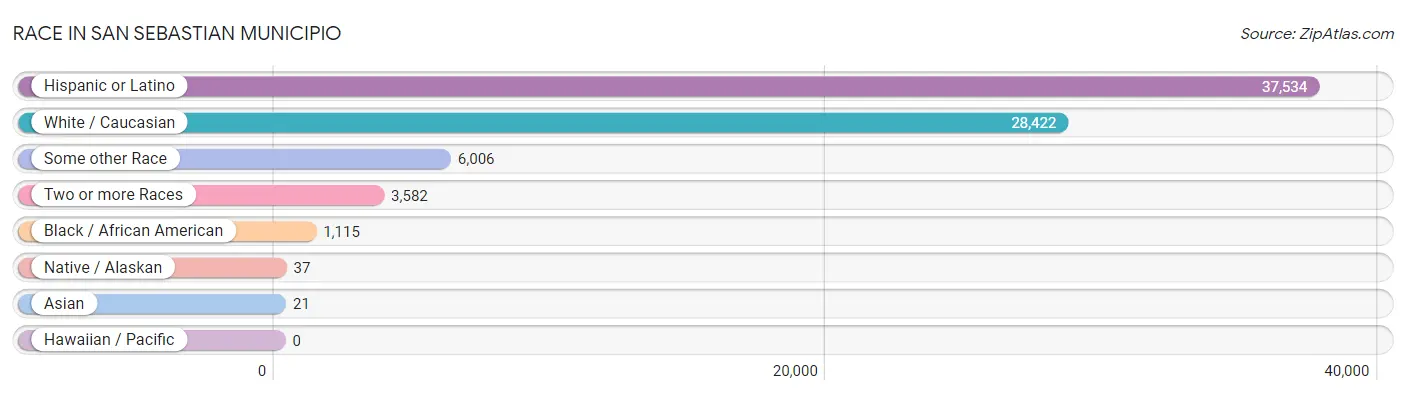
| Race | # Population | % Population |
| Asian | 21 | 0.1% |
| Black / African American | 1,115 | 2.9% |
| Hawaiian / Pacific | 0 | 0.0% |
| Hispanic or Latino | 37,534 | 95.8% |
| Native / Alaskan | 37 | 0.1% |
| White / Caucasian | 28,422 | 72.5% |
| Two or more Races | 3,582 | 9.1% |
| Some other Race | 6,006 | 15.3% |
| Total | 39,183 | 100.0% |
Ancestry in San Sebastian Municipio
The most populous ancestries reported in San Sebastian Municipio are Puerto Rican (37,023 | 94.5%), Central American Indian (1,269 | 3.2%), American (1,090 | 2.8%), Mexican (285 | 0.7%), and Dominican (160 | 0.4%), together accounting for 101.6% of all San Sebastian Municipio residents.
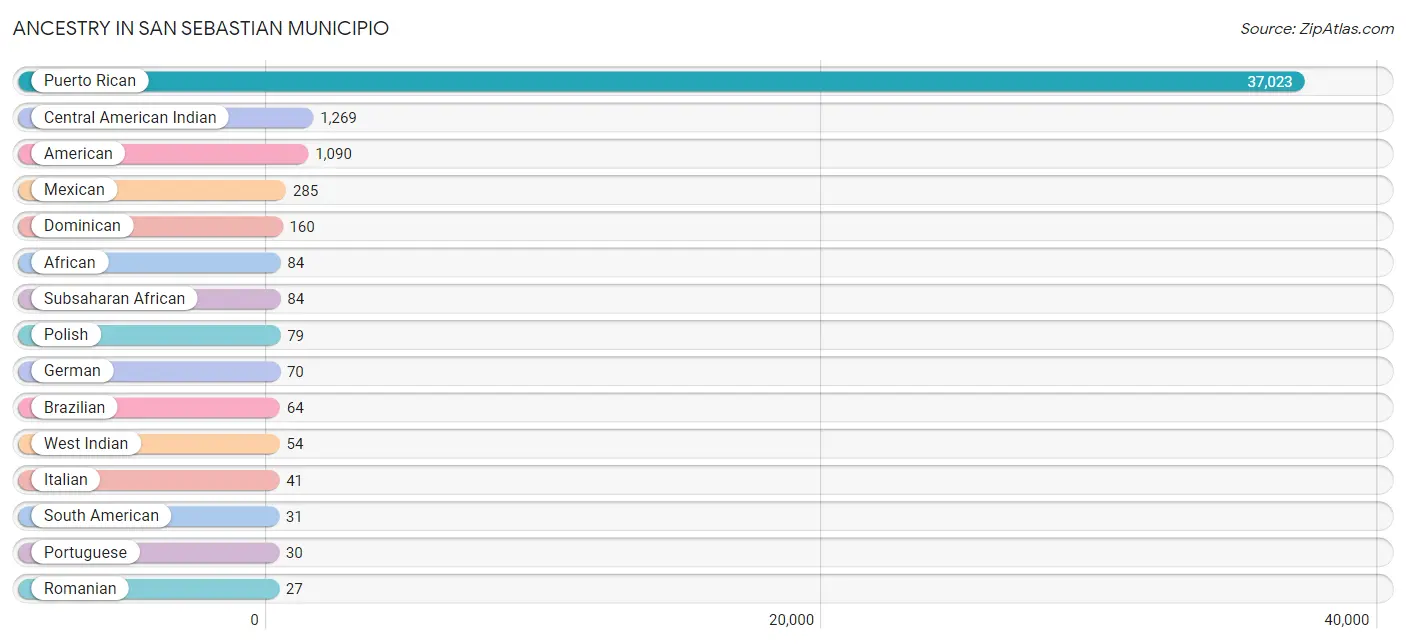
| Ancestry | # Population | % Population |
| African | 84 | 0.2% |
| American | 1,090 | 2.8% |
| Brazilian | 64 | 0.2% |
| Burmese | 21 | 0.1% |
| Central American | 1 | 0.0% |
| Central American Indian | 1,269 | 3.2% |
| Colombian | 17 | 0.0% |
| Cuban | 11 | 0.0% |
| Dominican | 160 | 0.4% |
| Ecuadorian | 13 | 0.0% |
| German | 70 | 0.2% |
| Honduran | 1 | 0.0% |
| Irish | 16 | 0.0% |
| Italian | 41 | 0.1% |
| Mexican | 285 | 0.7% |
| Polish | 79 | 0.2% |
| Portuguese | 30 | 0.1% |
| Puerto Rican | 37,023 | 94.5% |
| Romanian | 27 | 0.1% |
| South American | 31 | 0.1% |
| Spaniard | 23 | 0.1% |
| Subsaharan African | 84 | 0.2% |
| Venezuelan | 1 | 0.0% |
| West Indian | 54 | 0.1% | View All 24 Rows |
Immigrants in San Sebastian Municipio

| Immigration Origin | # Population | % Population | View All 0 Rows |
Sex and Age in San Sebastian Municipio
Sex and Age in San Sebastian Municipio
The most populous age groups in San Sebastian Municipio are 40 to 44 Years (1,405 | 7.4%) for men and 40 to 44 Years (1,598 | 7.9%) for women.
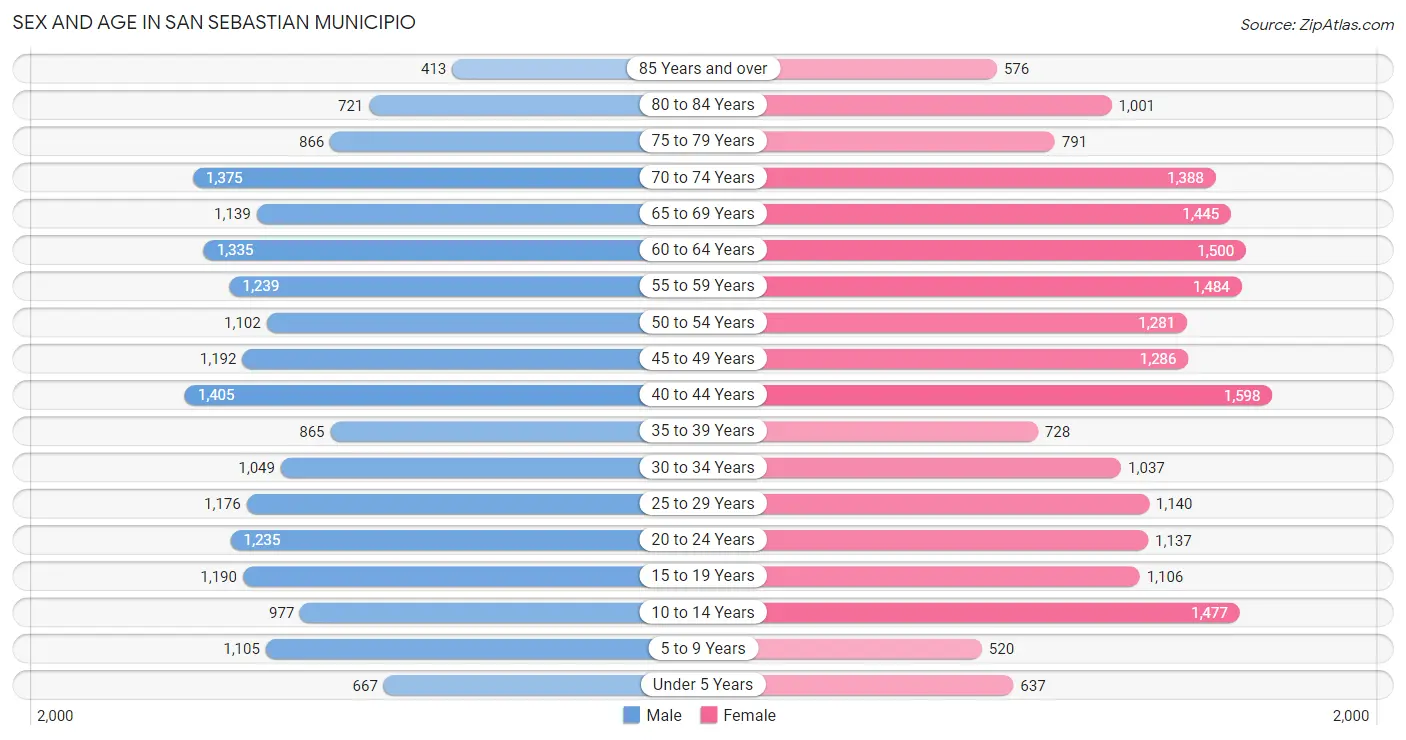
| Age Bracket | Male | Female |
| Under 5 Years | 667 (3.5%) | 637 (3.2%) |
| 5 to 9 Years | 1,105 (5.8%) | 520 (2.6%) |
| 10 to 14 Years | 977 (5.1%) | 1,477 (7.3%) |
| 15 to 19 Years | 1,190 (6.2%) | 1,106 (5.5%) |
| 20 to 24 Years | 1,235 (6.5%) | 1,137 (5.7%) |
| 25 to 29 Years | 1,176 (6.2%) | 1,140 (5.7%) |
| 30 to 34 Years | 1,049 (5.5%) | 1,037 (5.1%) |
| 35 to 39 Years | 865 (4.5%) | 728 (3.6%) |
| 40 to 44 Years | 1,405 (7.4%) | 1,598 (7.9%) |
| 45 to 49 Years | 1,192 (6.3%) | 1,286 (6.4%) |
| 50 to 54 Years | 1,102 (5.8%) | 1,281 (6.4%) |
| 55 to 59 Years | 1,239 (6.5%) | 1,484 (7.4%) |
| 60 to 64 Years | 1,335 (7.0%) | 1,500 (7.4%) |
| 65 to 69 Years | 1,139 (6.0%) | 1,445 (7.2%) |
| 70 to 74 Years | 1,375 (7.2%) | 1,388 (6.9%) |
| 75 to 79 Years | 866 (4.5%) | 791 (3.9%) |
| 80 to 84 Years | 721 (3.8%) | 1,001 (5.0%) |
| 85 Years and over | 413 (2.2%) | 576 (2.9%) |
| Total | 19,051 (100.0%) | 20,132 (100.0%) |
Families and Households in San Sebastian Municipio
Median Family Size in San Sebastian Municipio
The median family size in San Sebastian Municipio is 3.42 persons per family, with single female/mother families (2,323 | 24.3%) accounting for the largest median family size of 3.91 persons per family. On the other hand, married-couple families (6,109 | 64.0%) represent the smallest median family size with 3.22 persons per family.
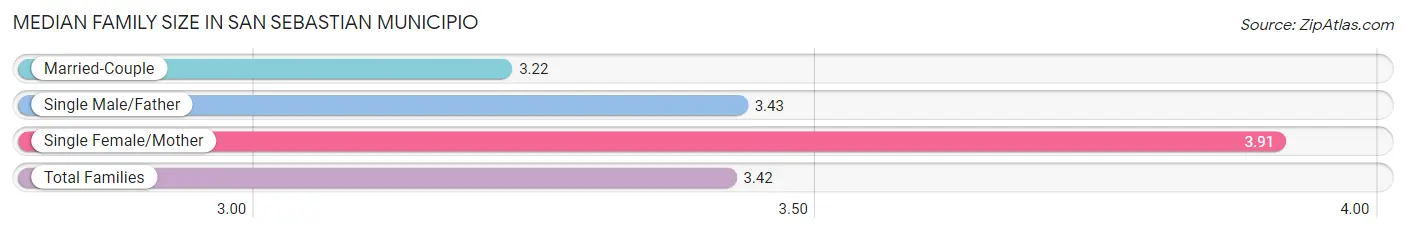
| Family Type | # Families | Family Size |
| Married-Couple | 6,109 (64.0%) | 3.22 |
| Single Male/Father | 1,120 (11.7%) | 3.43 |
| Single Female/Mother | 2,323 (24.3%) | 3.91 |
| Total Families | 9,552 (100.0%) | 3.42 |
Median Household Size in San Sebastian Municipio
The median household size in San Sebastian Municipio is 2.78 persons per household, with single male/father households (1,120 | 8.0%) accounting for the largest median household size of 4.12 persons per household. non-family households (4,426 | 31.7%) represent the smallest median household size with 1.16 persons per household.
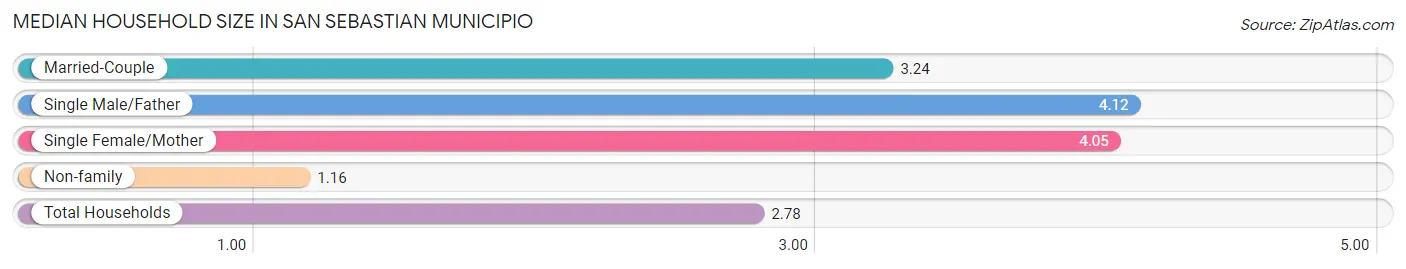
| Household Type | # Households | Household Size |
| Married-Couple | 6,109 (43.7%) | 3.24 |
| Single Male/Father | 1,120 (8.0%) | 4.12 |
| Single Female/Mother | 2,323 (16.6%) | 4.05 |
| Non-family | 4,426 (31.7%) | 1.16 |
| Total Households | 13,978 (100.0%) | 2.78 |
Household Size by Marriage Status in San Sebastian Municipio
Out of a total of 13,978 households in San Sebastian Municipio, 9,552 (68.3%) are family households, while 4,426 (31.7%) are nonfamily households. The most numerous type of family households are 2-person households, comprising 4,944, and the most common type of nonfamily households are 1-person households, comprising 3,840.
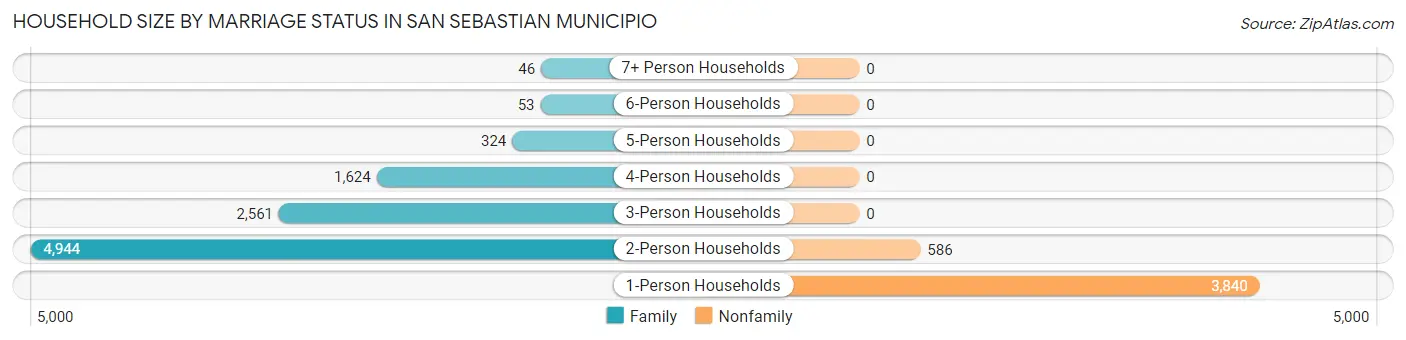
| Household Size | Family Households | Nonfamily Households |
| 1-Person Households | - | 3,840 (27.5%) |
| 2-Person Households | 4,944 (35.4%) | 586 (4.2%) |
| 3-Person Households | 2,561 (18.3%) | 0 (0.0%) |
| 4-Person Households | 1,624 (11.6%) | 0 (0.0%) |
| 5-Person Households | 324 (2.3%) | 0 (0.0%) |
| 6-Person Households | 53 (0.4%) | 0 (0.0%) |
| 7+ Person Households | 46 (0.3%) | 0 (0.0%) |
| Total | 9,552 (68.3%) | 4,426 (31.7%) |
Female Fertility in San Sebastian Municipio
Fertility by Age in San Sebastian Municipio
Average fertility rate in San Sebastian Municipio is 32.0 births per 1,000 women. Women in the age bracket of 20 to 34 years have the highest fertility rate with 61.0 births per 1,000 women. Women in the age bracket of 20 to 34 years acount for 74.8% of all women with births.
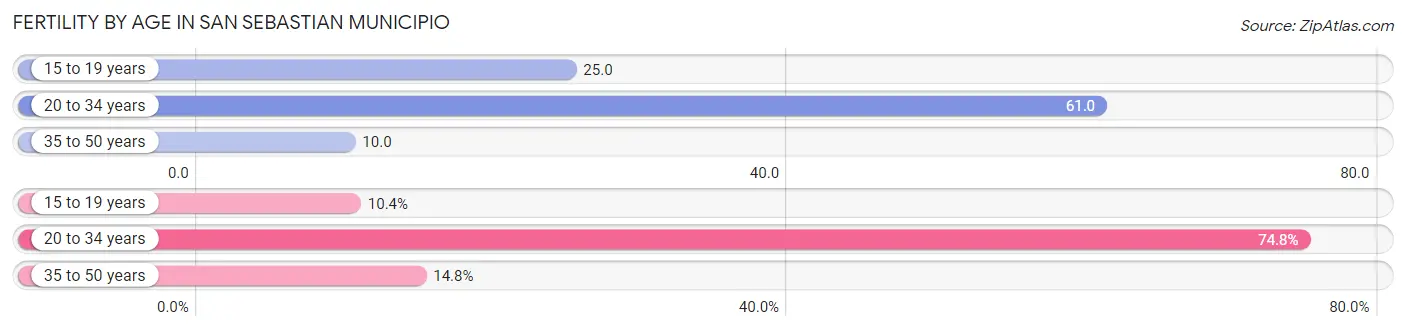
| Age Bracket | Women with Births | Births / 1,000 Women |
| 15 to 19 years | 28 (10.4%) | 25.0 |
| 20 to 34 years | 202 (74.8%) | 61.0 |
| 35 to 50 years | 40 (14.8%) | 10.0 |
| Total | 270 (100.0%) | 32.0 |
Fertility by Age by Marriage Status in San Sebastian Municipio
45.2% of women with births (270) in San Sebastian Municipio are married. The highest percentage of unmarried women with births falls into 15 to 19 years age bracket with 100.0% of them unmarried at the time of birth, while the lowest percentage of unmarried women with births belong to 35 to 50 years age bracket with 47.5% of them unmarried.
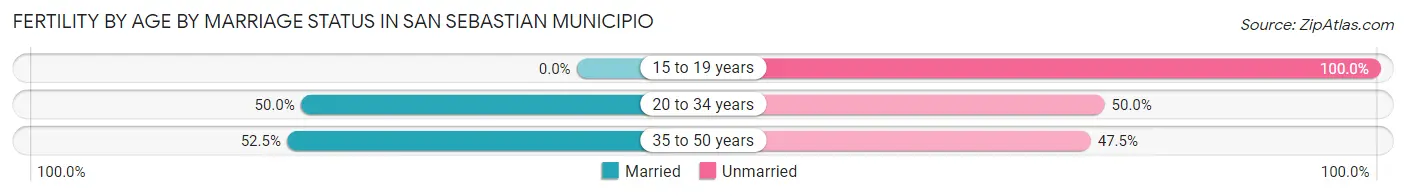
| Age Bracket | Married | Unmarried |
| 15 to 19 years | 0 (0.0%) | 28 (100.0%) |
| 20 to 34 years | 101 (50.0%) | 101 (50.0%) |
| 35 to 50 years | 21 (52.5%) | 19 (47.5%) |
| Total | 122 (45.2%) | 148 (54.8%) |
Fertility by Education in San Sebastian Municipio
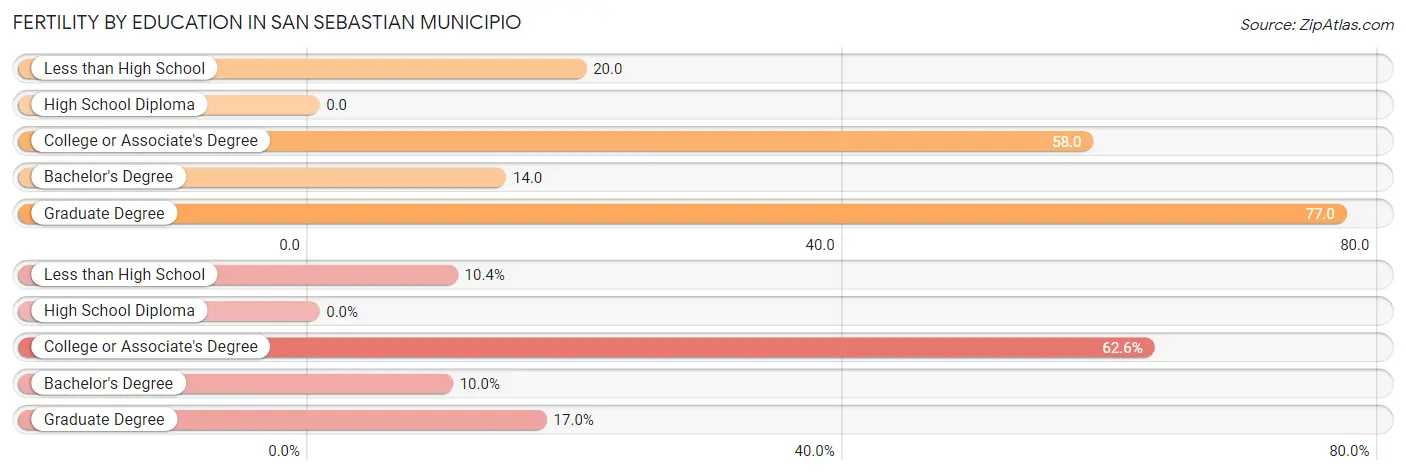
| Educational Attainment | Women with Births | Births / 1,000 Women |
| Less than High School | 28 (10.4%) | 20.0 |
| High School Diploma | 0 (0.0%) | 0.0 |
| College or Associate's Degree | 169 (62.6%) | 58.0 |
| Bachelor's Degree | 27 (10.0%) | 14.0 |
| Graduate Degree | 46 (17.0%) | 77.0 |
| Total | 270 (100.0%) | 32.0 |
Fertility by Education by Marriage Status in San Sebastian Municipio
54.8% of women with births in San Sebastian Municipio are unmarried. Women with the educational attainment of bachelor's degree are most likely to be married with 100.0% of them married at childbirth, while women with the educational attainment of less than high school are least likely to be married with 100.0% of them unmarried at childbirth.
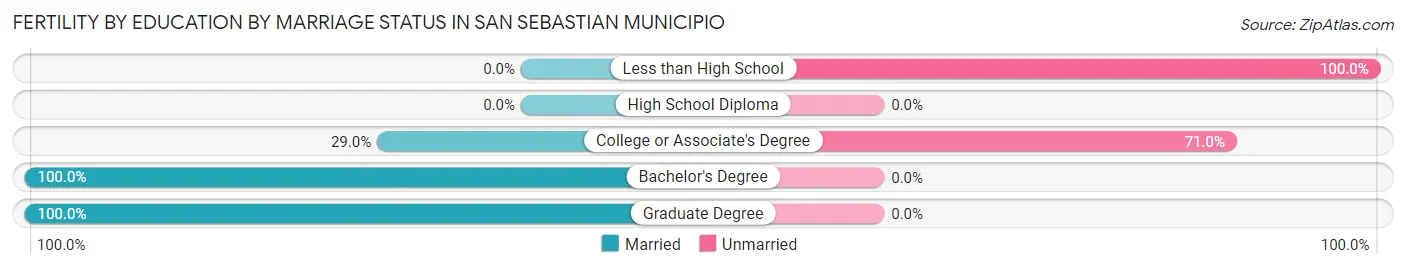
| Educational Attainment | Married | Unmarried |
| Less than High School | 0 (0.0%) | 28 (100.0%) |
| High School Diploma | 0 (0.0%) | 0 (0.0%) |
| College or Associate's Degree | 49 (29.0%) | 120 (71.0%) |
| Bachelor's Degree | 27 (100.0%) | 0 (0.0%) |
| Graduate Degree | 46 (100.0%) | 0 (0.0%) |
| Total | 122 (45.2%) | 148 (54.8%) |
Employment Characteristics in San Sebastian Municipio
Employment by Class of Employer in San Sebastian Municipio
Among the 10,571 employed individuals in San Sebastian Municipio, private company employees (6,126 | 58.0%), self-employed (not incorporated) (1,604 | 15.2%), and state government employees (1,387 | 13.1%) make up the most common classes of employment.
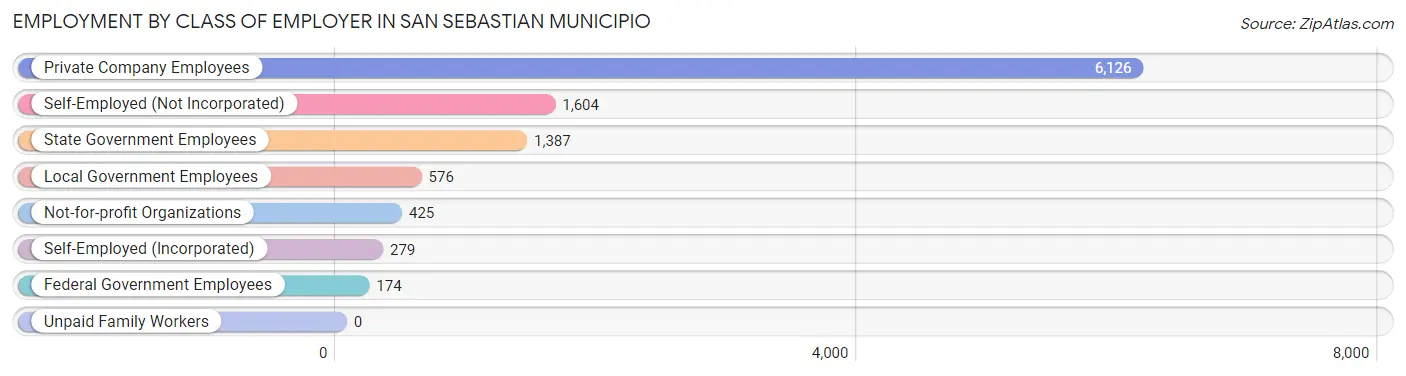
| Employer Class | # Employees | % Employees |
| Private Company Employees | 6,126 | 58.0% |
| Self-Employed (Incorporated) | 279 | 2.6% |
| Self-Employed (Not Incorporated) | 1,604 | 15.2% |
| Not-for-profit Organizations | 425 | 4.0% |
| Local Government Employees | 576 | 5.4% |
| State Government Employees | 1,387 | 13.1% |
| Federal Government Employees | 174 | 1.7% |
| Unpaid Family Workers | 0 | 0.0% |
| Total | 10,571 | 100.0% |
Employment Status by Age in San Sebastian Municipio
According to the labor force statistics for San Sebastian Municipio, out of the total population over 16 years of age (33,416), 38.4% or 12,832 individuals are in the labor force, with 14.9% or 1,912 of them unemployed. The age group with the highest labor force participation rate is 35 to 44 years, with 71.3% or 3,277 individuals in the labor force. Within the labor force, the 25 to 29 years age range has the highest percentage of unemployed individuals, with 26.1% or 410 of them being unemployed.
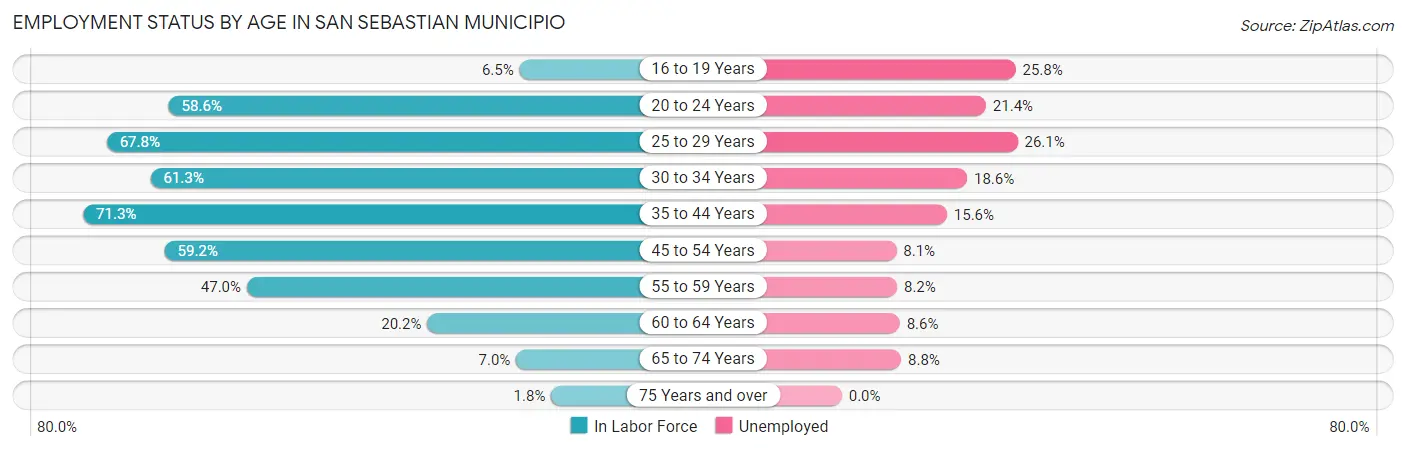
| Age Bracket | In Labor Force | Unemployed |
| 16 to 19 Years | 124 (6.5%) | 32 (25.8%) |
| 20 to 24 Years | 1,390 (58.6%) | 297 (21.4%) |
| 25 to 29 Years | 1,570 (67.8%) | 410 (26.1%) |
| 30 to 34 Years | 1,279 (61.3%) | 238 (18.6%) |
| 35 to 44 Years | 3,277 (71.3%) | 511 (15.6%) |
| 45 to 54 Years | 2,878 (59.2%) | 233 (8.1%) |
| 55 to 59 Years | 1,280 (47.0%) | 105 (8.2%) |
| 60 to 64 Years | 573 (20.2%) | 49 (8.6%) |
| 65 to 74 Years | 374 (7.0%) | 33 (8.8%) |
| 75 Years and over | 79 (1.8%) | 0 (0.0%) |
| Total | 12,832 (38.4%) | 1,912 (14.9%) |
Employment Status by Educational Attainment in San Sebastian Municipio
According to labor force statistics for San Sebastian Municipio, 55.9% of individuals (10,854) out of the total population between 25 and 64 years of age (19,417) are in the labor force, with 14.2% or 1,541 of them being unemployed. The group with the highest labor force participation rate are those with the educational attainment of bachelor's degree or higher, with 74.2% or 3,655 individuals in the labor force. Within the labor force, individuals with less than high school education have the highest percentage of unemployment, with 17.7% or 197 of them being unemployed.
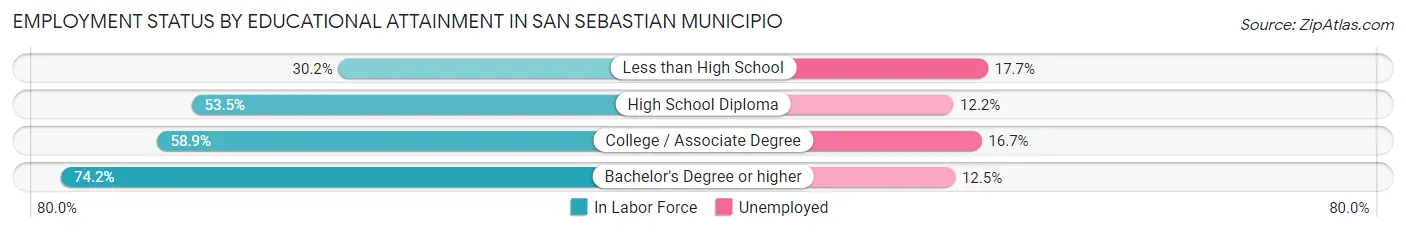
| Educational Attainment | In Labor Force | Unemployed |
| Less than High School | 1,113 (30.2%) | 652 (17.7%) |
| High School Diploma | 2,782 (53.5%) | 634 (12.2%) |
| College / Associate Degree | 3,302 (58.9%) | 936 (16.7%) |
| Bachelor's Degree or higher | 3,655 (74.2%) | 616 (12.5%) |
| Total | 10,854 (55.9%) | 2,757 (14.2%) |
Employment Occupations by Sex in San Sebastian Municipio
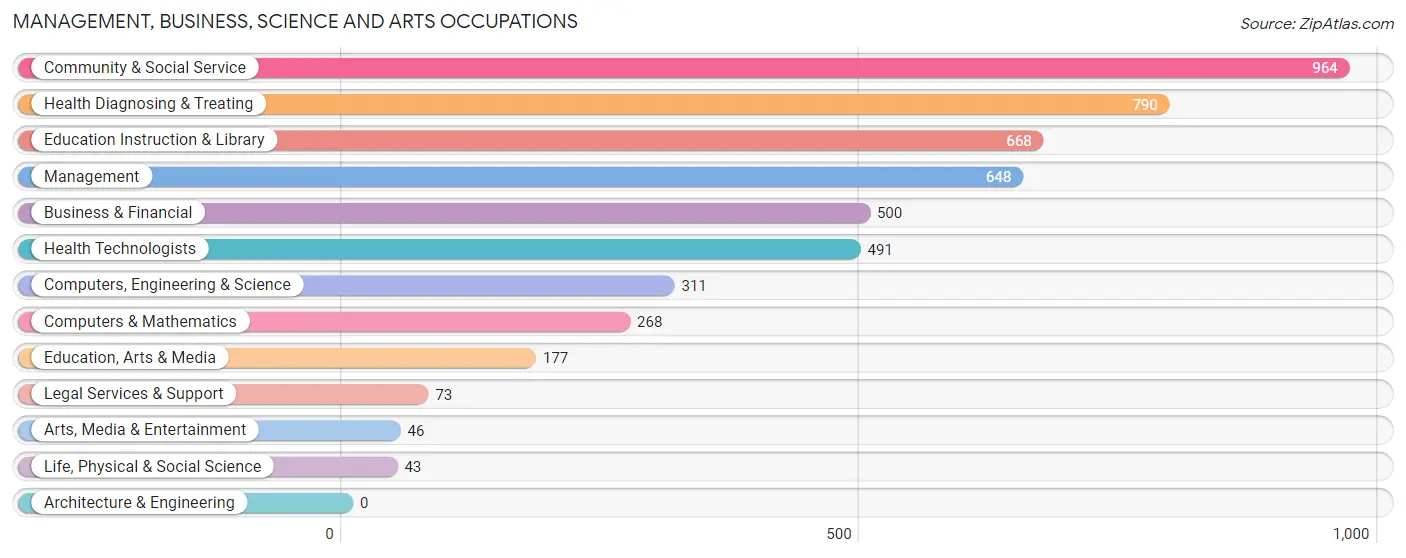
Management, Business, Science and Arts Occupations
The most common Management, Business, Science and Arts occupations in San Sebastian Municipio are Community & Social Service (964 | 8.8%), Health Diagnosing & Treating (790 | 7.2%), Education Instruction & Library (668 | 6.1%), Management (648 | 5.9%), and Business & Financial (500 | 4.6%).
Management, Business, Science and Arts Occupations by Sex
Within the Management, Business, Science and Arts occupations in San Sebastian Municipio, the most male-oriented occupations are Computers & Mathematics (100.0%), Computers, Engineering & Science (97.8%), and Life, Physical & Social Science (83.7%), while the most female-oriented occupations are Health Technologists (89.4%), Arts, Media & Entertainment (84.8%), and Education Instruction & Library (82.2%).
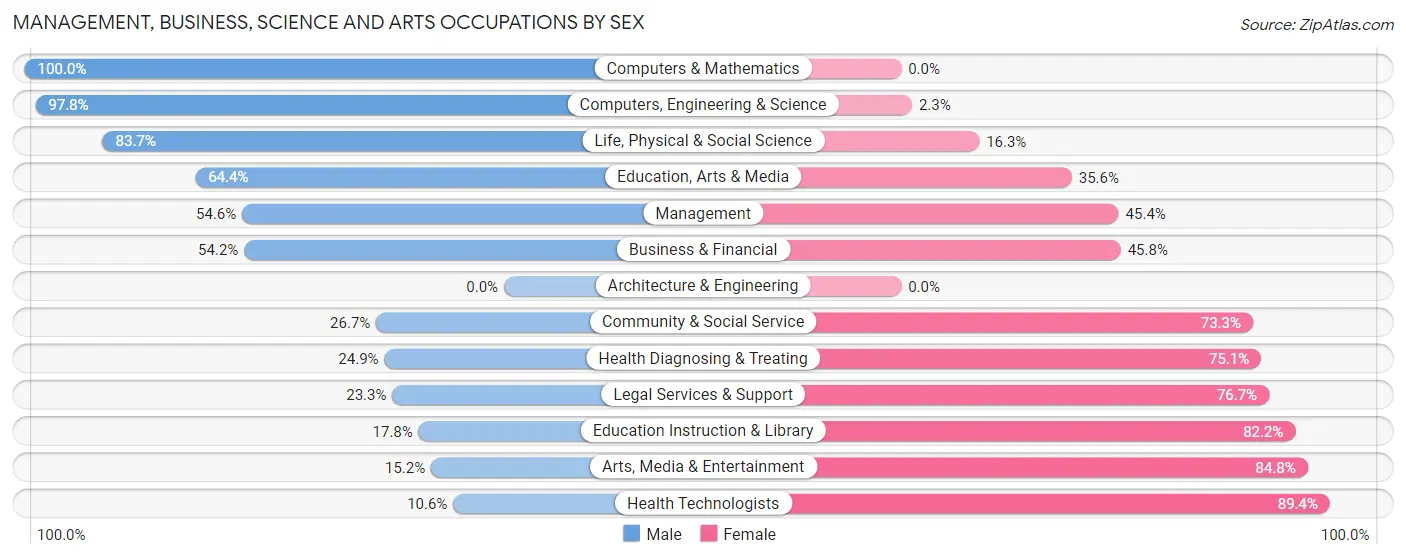
| Occupation | Male | Female |
| Management | 354 (54.6%) | 294 (45.4%) |
| Business & Financial | 271 (54.2%) | 229 (45.8%) |
| Computers, Engineering & Science | 304 (97.8%) | 7 (2.2%) |
| Computers & Mathematics | 268 (100.0%) | 0 (0.0%) |
| Architecture & Engineering | 0 (0.0%) | 0 (0.0%) |
| Life, Physical & Social Science | 36 (83.7%) | 7 (16.3%) |
| Community & Social Service | 257 (26.7%) | 707 (73.3%) |
| Education, Arts & Media | 114 (64.4%) | 63 (35.6%) |
| Legal Services & Support | 17 (23.3%) | 56 (76.7%) |
| Education Instruction & Library | 119 (17.8%) | 549 (82.2%) |
| Arts, Media & Entertainment | 7 (15.2%) | 39 (84.8%) |
| Health Diagnosing & Treating | 197 (24.9%) | 593 (75.1%) |
| Health Technologists | 52 (10.6%) | 439 (89.4%) |
| Total (Category) | 1,383 (43.0%) | 1,830 (57.0%) |
| Total (Overall) | 6,447 (59.2%) | 4,448 (40.8%) |
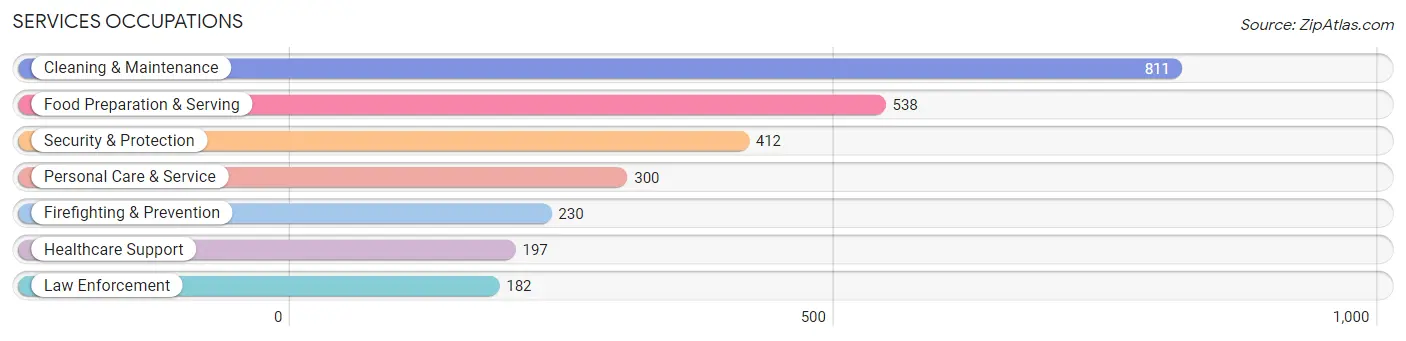
Services Occupations
The most common Services occupations in San Sebastian Municipio are Cleaning & Maintenance (811 | 7.4%), Food Preparation & Serving (538 | 4.9%), Security & Protection (412 | 3.8%), Personal Care & Service (300 | 2.8%), and Firefighting & Prevention (230 | 2.1%).
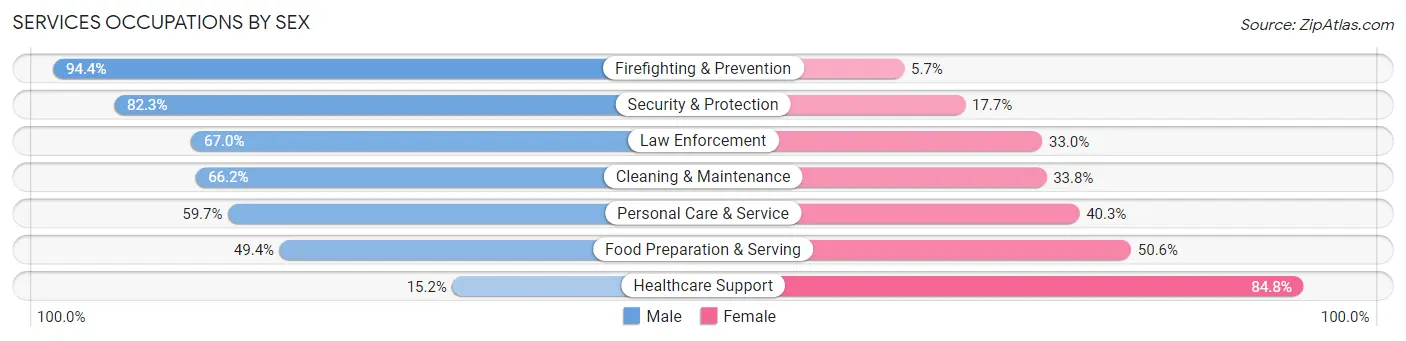
Services Occupations by Sex
Within the Services occupations in San Sebastian Municipio, the most male-oriented occupations are Firefighting & Prevention (94.4%), Security & Protection (82.3%), and Law Enforcement (67.0%), while the most female-oriented occupations are Healthcare Support (84.8%), Food Preparation & Serving (50.6%), and Personal Care & Service (40.3%).
| Occupation | Male | Female |
| Healthcare Support | 30 (15.2%) | 167 (84.8%) |
| Security & Protection | 339 (82.3%) | 73 (17.7%) |
| Firefighting & Prevention | 217 (94.4%) | 13 (5.7%) |
| Law Enforcement | 122 (67.0%) | 60 (33.0%) |
| Food Preparation & Serving | 266 (49.4%) | 272 (50.6%) |
| Cleaning & Maintenance | 537 (66.2%) | 274 (33.8%) |
| Personal Care & Service | 179 (59.7%) | 121 (40.3%) |
| Total (Category) | 1,351 (59.8%) | 907 (40.2%) |
| Total (Overall) | 6,447 (59.2%) | 4,448 (40.8%) |
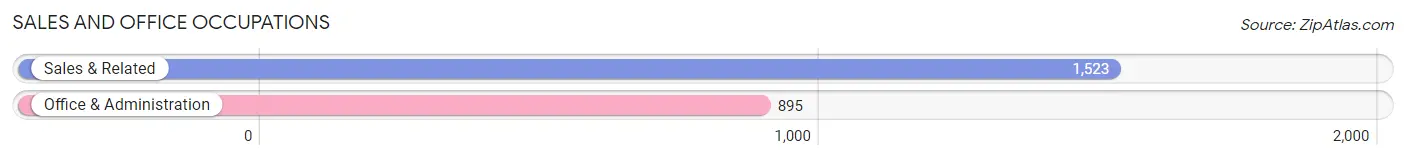
Sales and Office Occupations
The most common Sales and Office occupations in San Sebastian Municipio are Sales & Related (1,523 | 14.0%), and Office & Administration (895 | 8.2%).
Sales and Office Occupations by Sex
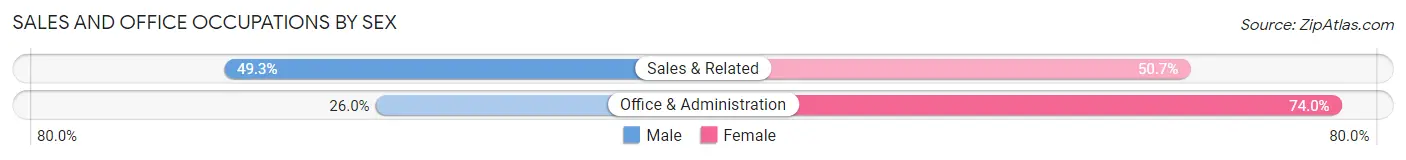
| Occupation | Male | Female |
| Sales & Related | 751 (49.3%) | 772 (50.7%) |
| Office & Administration | 233 (26.0%) | 662 (74.0%) |
| Total (Category) | 984 (40.7%) | 1,434 (59.3%) |
| Total (Overall) | 6,447 (59.2%) | 4,448 (40.8%) |
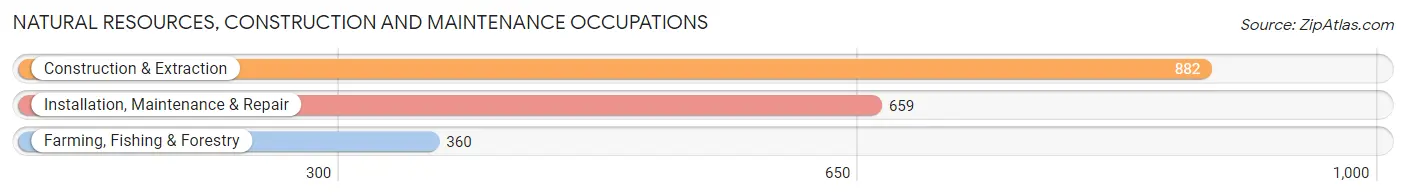
Natural Resources, Construction and Maintenance Occupations
The most common Natural Resources, Construction and Maintenance occupations in San Sebastian Municipio are Construction & Extraction (882 | 8.1%), Installation, Maintenance & Repair (659 | 6.0%), and Farming, Fishing & Forestry (360 | 3.3%).
Natural Resources, Construction and Maintenance Occupations by Sex
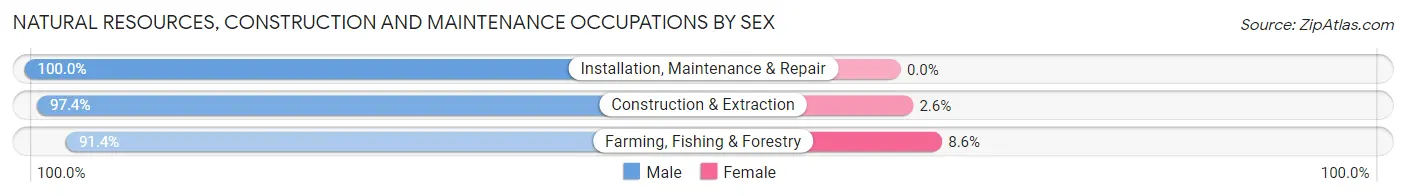
| Occupation | Male | Female |
| Farming, Fishing & Forestry | 329 (91.4%) | 31 (8.6%) |
| Construction & Extraction | 859 (97.4%) | 23 (2.6%) |
| Installation, Maintenance & Repair | 659 (100.0%) | 0 (0.0%) |
| Total (Category) | 1,847 (97.2%) | 54 (2.8%) |
| Total (Overall) | 6,447 (59.2%) | 4,448 (40.8%) |
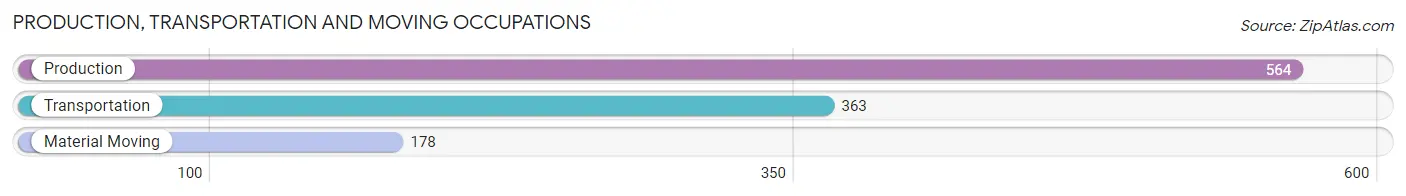
Production, Transportation and Moving Occupations
The most common Production, Transportation and Moving occupations in San Sebastian Municipio are Production (564 | 5.2%), Transportation (363 | 3.3%), and Material Moving (178 | 1.6%).
Production, Transportation and Moving Occupations by Sex
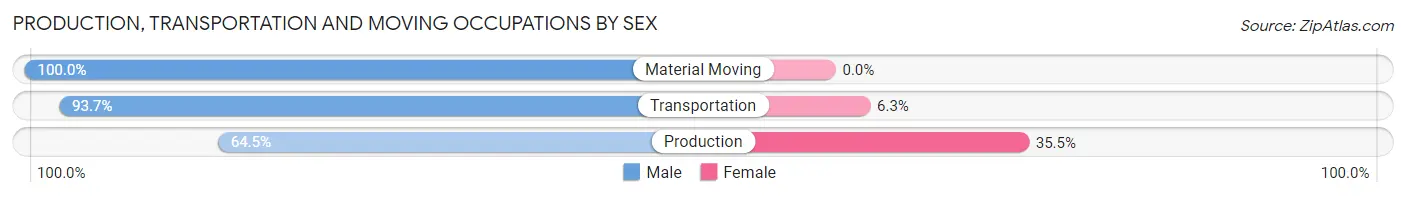
| Occupation | Male | Female |
| Production | 364 (64.5%) | 200 (35.5%) |
| Transportation | 340 (93.7%) | 23 (6.3%) |
| Material Moving | 178 (100.0%) | 0 (0.0%) |
| Total (Category) | 882 (79.8%) | 223 (20.2%) |
| Total (Overall) | 6,447 (59.2%) | 4,448 (40.8%) |
Employment Industries by Sex in San Sebastian Municipio
Employment Industries in San Sebastian Municipio
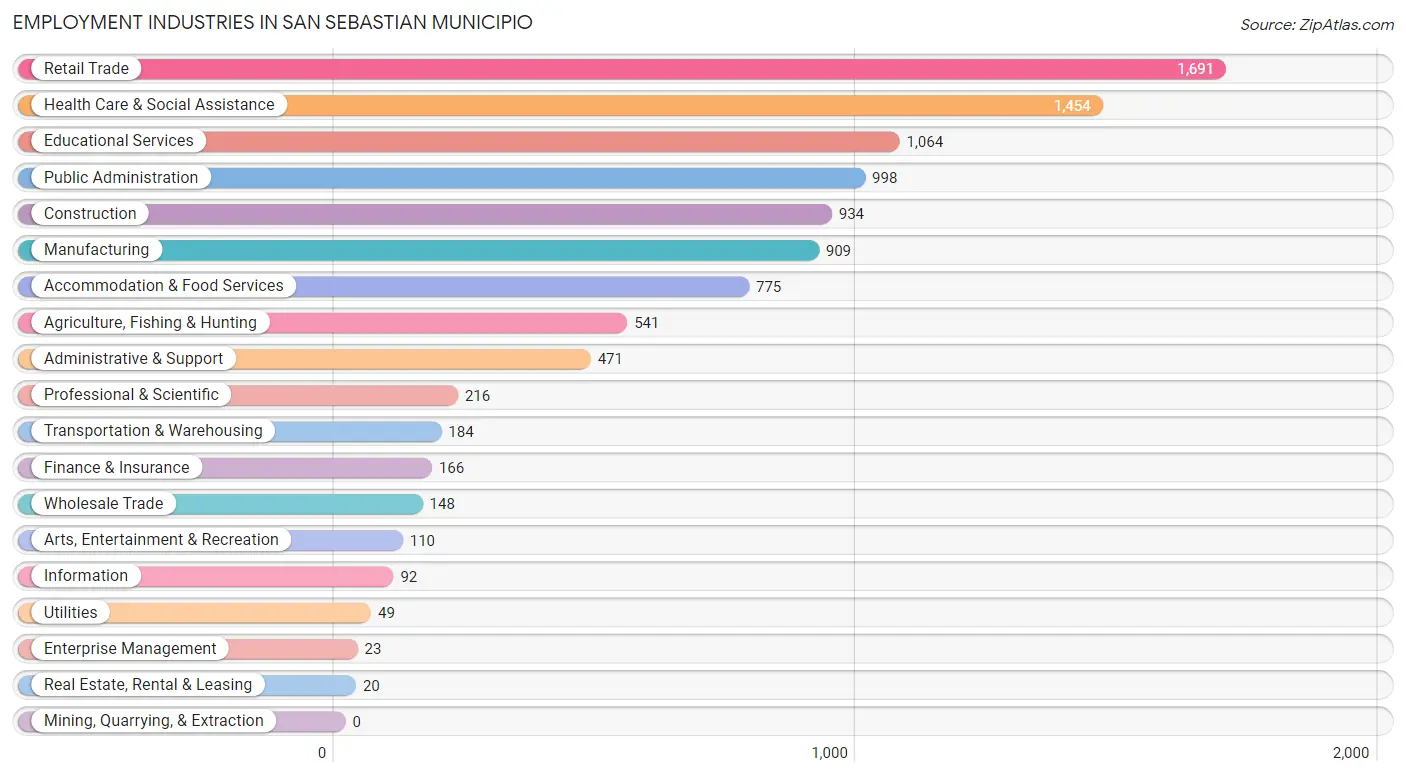
The major employment industries in San Sebastian Municipio include Retail Trade (1,691 | 15.5%), Health Care & Social Assistance (1,454 | 13.4%), Educational Services (1,064 | 9.8%), Public Administration (998 | 9.2%), and Construction (934 | 8.6%).
Employment Industries by Sex in San Sebastian Municipio
The San Sebastian Municipio industries that see more men than women are Real Estate, Rental & Leasing (100.0%), Enterprise Management (100.0%), and Construction (90.6%), whereas the industries that tend to have a higher number of women are Health Care & Social Assistance (68.4%), Professional & Scientific (67.6%), and Finance & Insurance (66.3%).
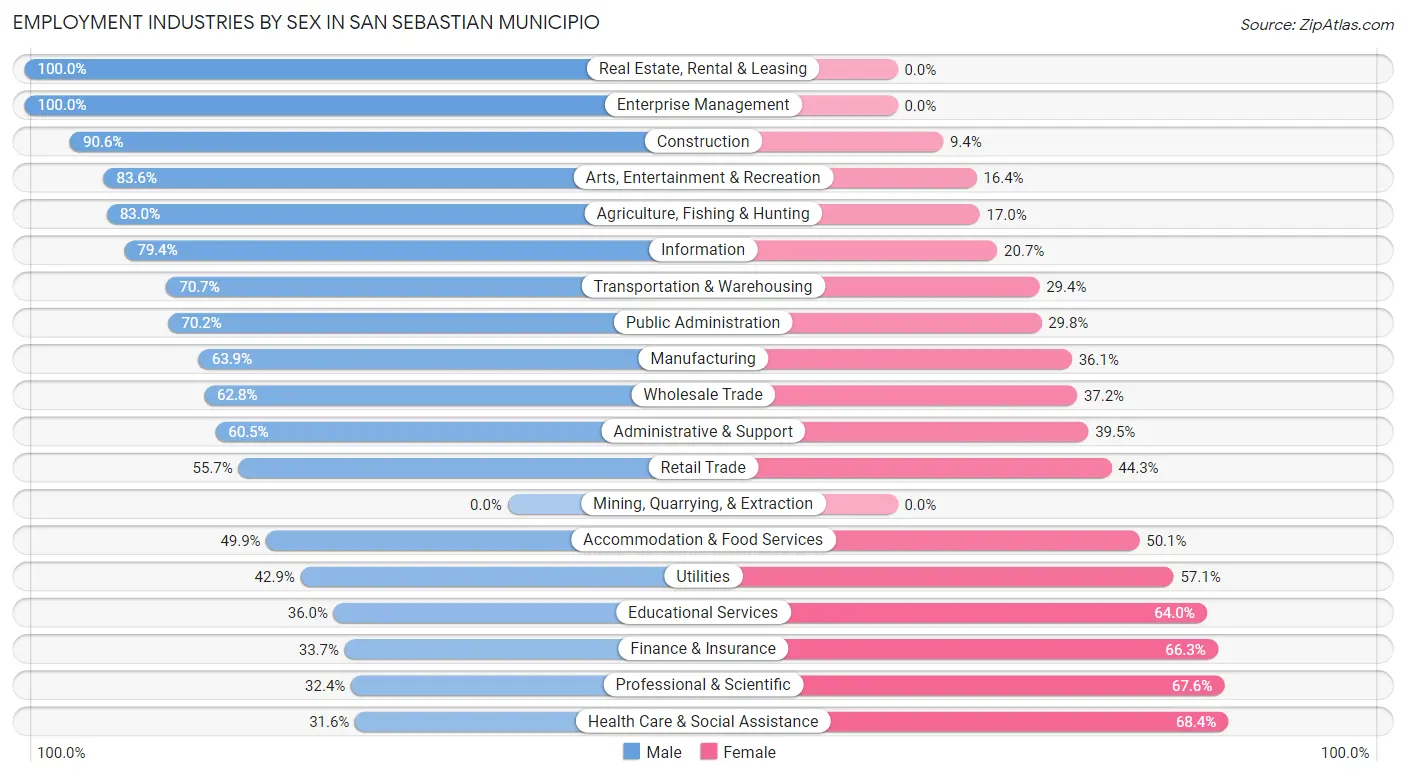
| Industry | Male | Female |
| Agriculture, Fishing & Hunting | 449 (83.0%) | 92 (17.0%) |
| Mining, Quarrying, & Extraction | 0 (0.0%) | 0 (0.0%) |
| Construction | 846 (90.6%) | 88 (9.4%) |
| Manufacturing | 581 (63.9%) | 328 (36.1%) |
| Wholesale Trade | 93 (62.8%) | 55 (37.2%) |
| Retail Trade | 942 (55.7%) | 749 (44.3%) |
| Transportation & Warehousing | 130 (70.7%) | 54 (29.3%) |
| Utilities | 21 (42.9%) | 28 (57.1%) |
| Information | 73 (79.3%) | 19 (20.6%) |
| Finance & Insurance | 56 (33.7%) | 110 (66.3%) |
| Real Estate, Rental & Leasing | 20 (100.0%) | 0 (0.0%) |
| Professional & Scientific | 70 (32.4%) | 146 (67.6%) |
| Enterprise Management | 23 (100.0%) | 0 (0.0%) |
| Administrative & Support | 285 (60.5%) | 186 (39.5%) |
| Educational Services | 383 (36.0%) | 681 (64.0%) |
| Health Care & Social Assistance | 459 (31.6%) | 995 (68.4%) |
| Arts, Entertainment & Recreation | 92 (83.6%) | 18 (16.4%) |
| Accommodation & Food Services | 387 (49.9%) | 388 (50.1%) |
| Public Administration | 701 (70.2%) | 297 (29.8%) |
| Total | 6,447 (59.2%) | 4,448 (40.8%) |
Education in San Sebastian Municipio
School Enrollment in San Sebastian Municipio
The most common levels of schooling among the 8,001 students in San Sebastian Municipio are middle school (2,011 | 25.1%), college / undergraduate (1,881 | 23.5%), and high school (1,844 | 23.1%).
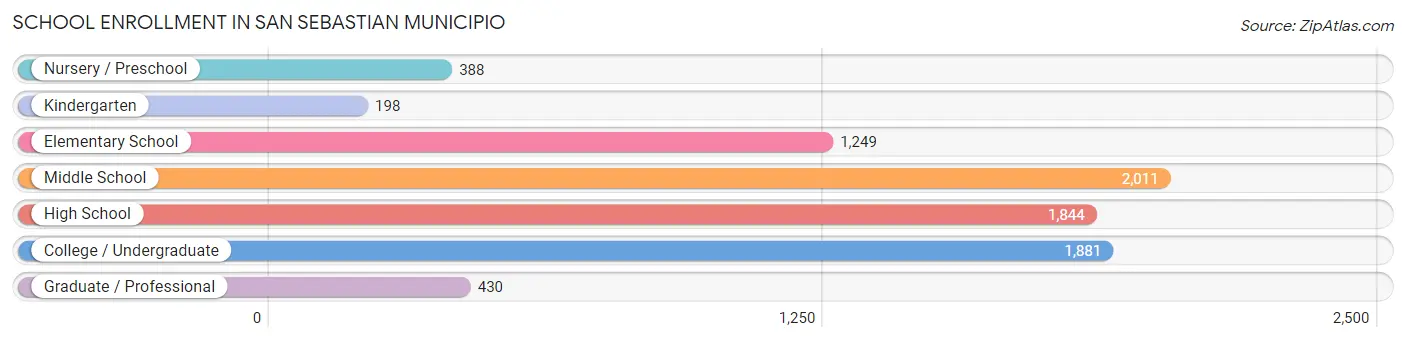
| School Level | # Students | % Students |
| Nursery / Preschool | 388 | 4.9% |
| Kindergarten | 198 | 2.5% |
| Elementary School | 1,249 | 15.6% |
| Middle School | 2,011 | 25.1% |
| High School | 1,844 | 23.1% |
| College / Undergraduate | 1,881 | 23.5% |
| Graduate / Professional | 430 | 5.4% |
| Total | 8,001 | 100.0% |
School Enrollment by Age by Funding Source in San Sebastian Municipio
Out of a total of 8,001 students who are enrolled in schools in San Sebastian Municipio, 2,528 (31.6%) attend a private institution, while the remaining 5,473 (68.4%) are enrolled in public schools. The age group of 25 to 34 year olds has the highest likelihood of being enrolled in private schools, with 427 (92.0% in the age bracket) enrolled. Conversely, the age group of 15 to 17 year olds has the lowest likelihood of being enrolled in a private school, with 1,207 (92.1% in the age bracket) attending a public institution.
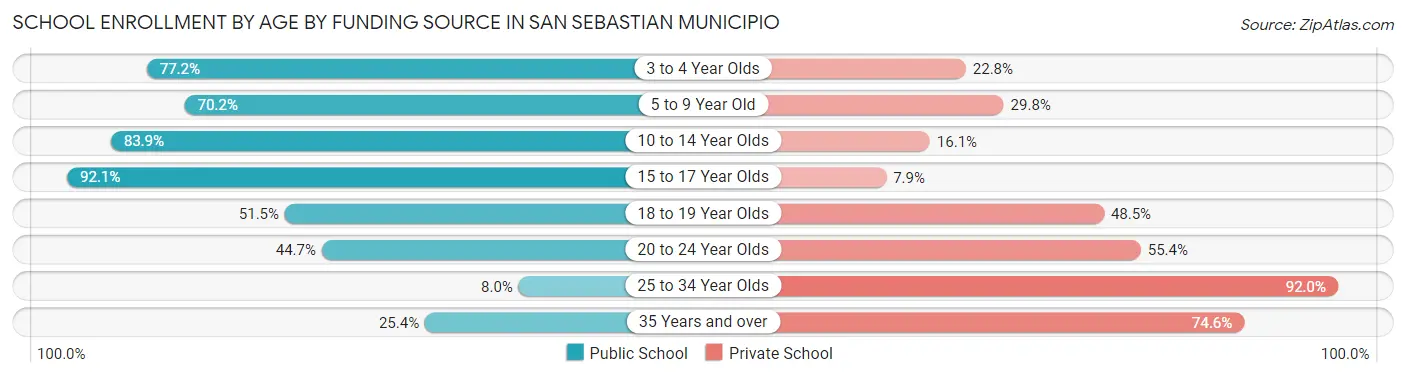
| Age Bracket | Public School | Private School |
| 3 to 4 Year Olds | 207 (77.2%) | 61 (22.8%) |
| 5 to 9 Year Old | 1,100 (70.2%) | 467 (29.8%) |
| 10 to 14 Year Olds | 2,060 (83.9%) | 394 (16.1%) |
| 15 to 17 Year Olds | 1,207 (92.1%) | 104 (7.9%) |
| 18 to 19 Year Olds | 340 (51.5%) | 320 (48.5%) |
| 20 to 24 Year Olds | 463 (44.7%) | 574 (55.3%) |
| 25 to 34 Year Olds | 37 (8.0%) | 427 (92.0%) |
| 35 Years and over | 61 (25.4%) | 179 (74.6%) |
| Total | 5,473 (68.4%) | 2,528 (31.6%) |
Educational Attainment by Field of Study in San Sebastian Municipio
Business (1,920 | 30.3%), education (1,365 | 21.5%), science & technology (872 | 13.8%), arts & humanities (431 | 6.8%), and bio, nature & agricultural (424 | 6.7%) are the most common fields of study among 6,336 individuals in San Sebastian Municipio who have obtained a bachelor's degree or higher.
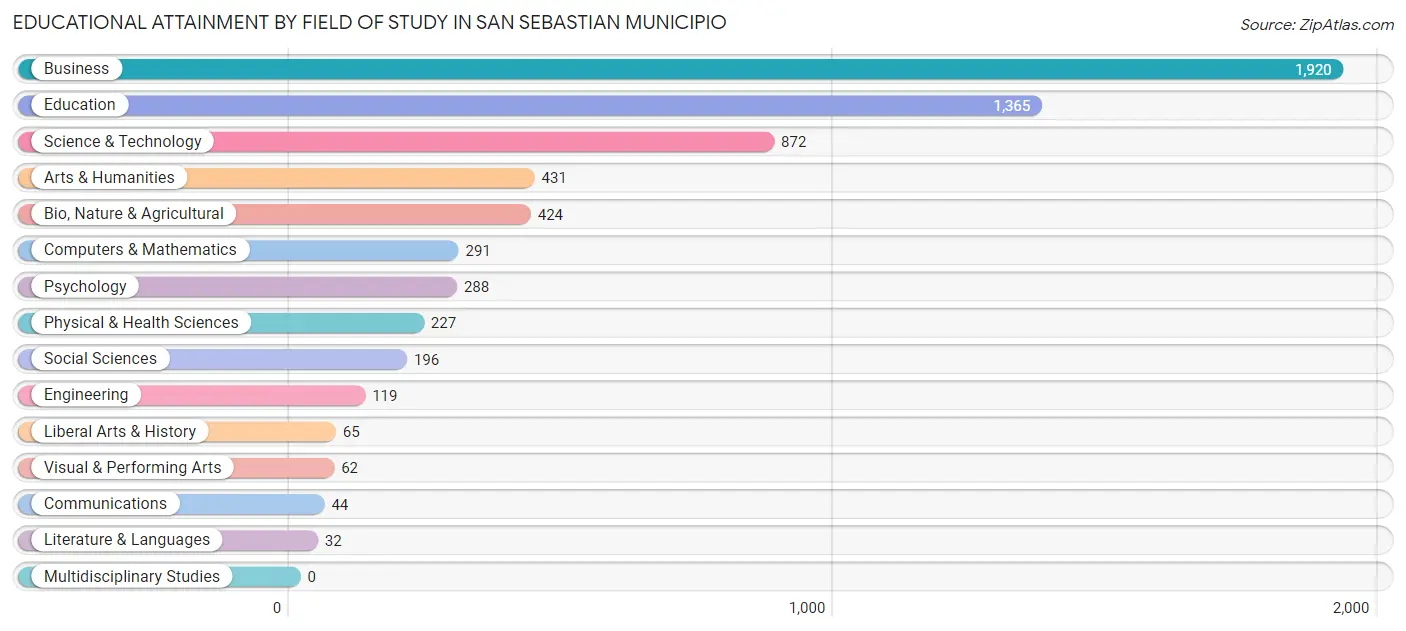
| Field of Study | # Graduates | % Graduates |
| Computers & Mathematics | 291 | 4.6% |
| Bio, Nature & Agricultural | 424 | 6.7% |
| Physical & Health Sciences | 227 | 3.6% |
| Psychology | 288 | 4.5% |
| Social Sciences | 196 | 3.1% |
| Engineering | 119 | 1.9% |
| Multidisciplinary Studies | 0 | 0.0% |
| Science & Technology | 872 | 13.8% |
| Business | 1,920 | 30.3% |
| Education | 1,365 | 21.5% |
| Literature & Languages | 32 | 0.5% |
| Liberal Arts & History | 65 | 1.0% |
| Visual & Performing Arts | 62 | 1.0% |
| Communications | 44 | 0.7% |
| Arts & Humanities | 431 | 6.8% |
| Total | 6,336 | 100.0% |
Transportation & Commute in San Sebastian Municipio
Vehicle Availability by Sex in San Sebastian Municipio
The most prevalent vehicle ownership categories in San Sebastian Municipio are males with 2 vehicles (2,849, accounting for 45.5%) and females with 2 vehicles (1,798, making up 66.6%).
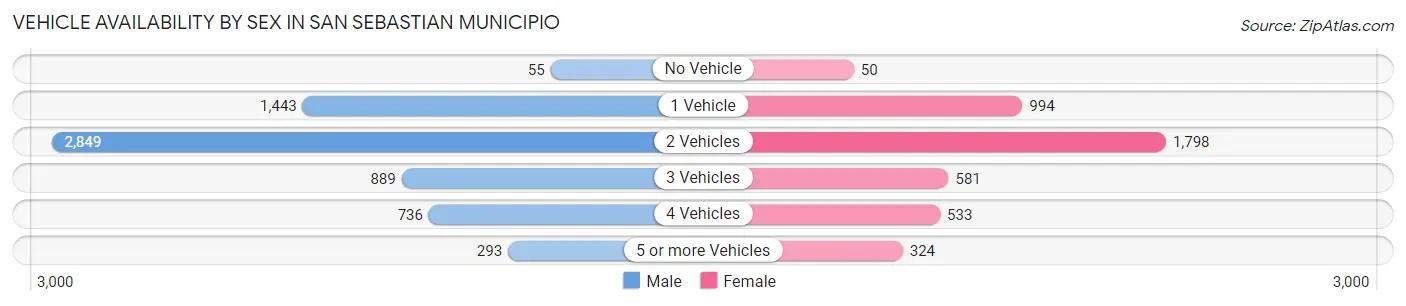
| Vehicles Available | Male | Female |
| No Vehicle | 55 (0.9%) | 50 (1.2%) |
| 1 Vehicle | 1,443 (23.0%) | 994 (23.2%) |
| 2 Vehicles | 2,849 (45.5%) | 1,798 (42.0%) |
| 3 Vehicles | 889 (14.2%) | 581 (13.6%) |
| 4 Vehicles | 736 (11.7%) | 533 (12.4%) |
| 5 or more Vehicles | 293 (4.7%) | 324 (7.6%) |
| Total | 6,265 (100.0%) | 4,280 (100.0%) |
Commute Time in San Sebastian Municipio
The most frequently occuring commute durations in San Sebastian Municipio are 10 to 14 minutes (1,662 commuters, 16.3%), 15 to 19 minutes (1,580 commuters, 15.5%), and 5 to 9 minutes (1,531 commuters, 15.0%).
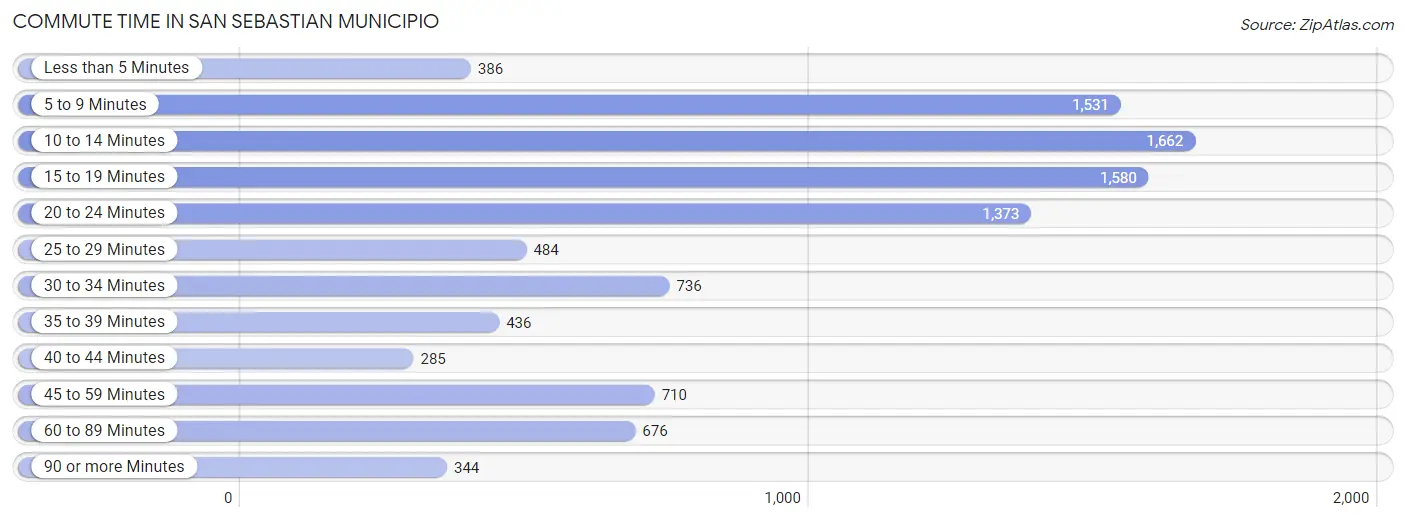
| Commute Time | # Commuters | % Commuters |
| Less than 5 Minutes | 386 | 3.8% |
| 5 to 9 Minutes | 1,531 | 15.0% |
| 10 to 14 Minutes | 1,662 | 16.3% |
| 15 to 19 Minutes | 1,580 | 15.5% |
| 20 to 24 Minutes | 1,373 | 13.5% |
| 25 to 29 Minutes | 484 | 4.7% |
| 30 to 34 Minutes | 736 | 7.2% |
| 35 to 39 Minutes | 436 | 4.3% |
| 40 to 44 Minutes | 285 | 2.8% |
| 45 to 59 Minutes | 710 | 7.0% |
| 60 to 89 Minutes | 676 | 6.6% |
| 90 or more Minutes | 344 | 3.4% |
Commute Time by Sex in San Sebastian Municipio
The most common commute times in San Sebastian Municipio are 10 to 14 minutes (956 commuters, 15.9%) for males and 20 to 24 minutes (718 commuters, 17.2%) for females.
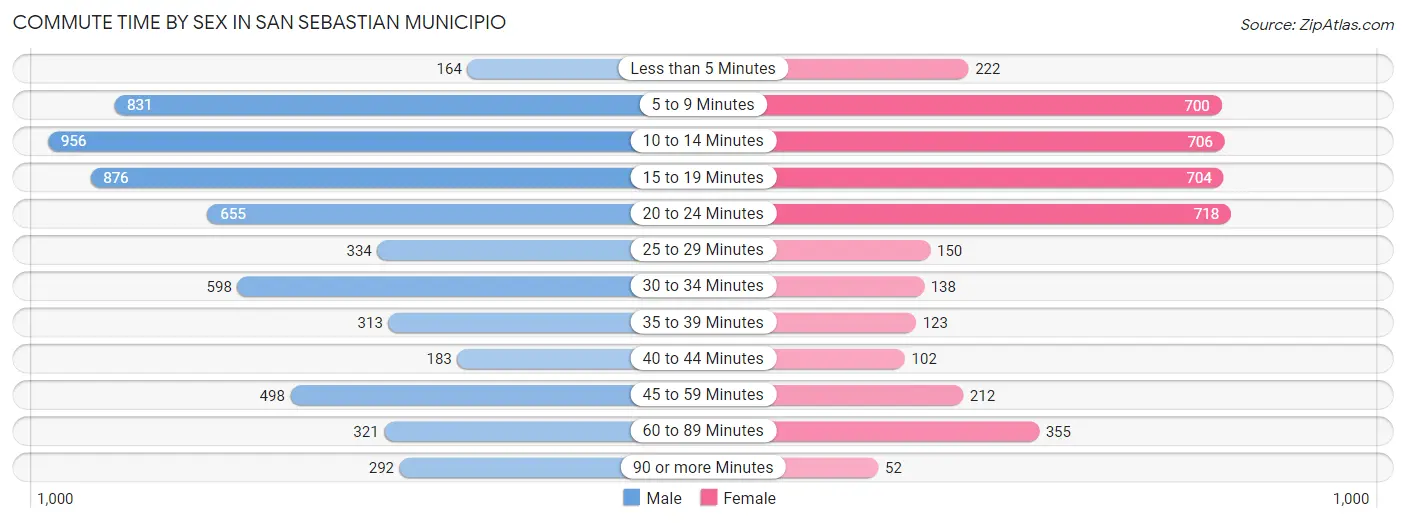
| Commute Time | Male | Female |
| Less than 5 Minutes | 164 (2.7%) | 222 (5.3%) |
| 5 to 9 Minutes | 831 (13.8%) | 700 (16.7%) |
| 10 to 14 Minutes | 956 (15.9%) | 706 (16.9%) |
| 15 to 19 Minutes | 876 (14.5%) | 704 (16.8%) |
| 20 to 24 Minutes | 655 (10.9%) | 718 (17.2%) |
| 25 to 29 Minutes | 334 (5.6%) | 150 (3.6%) |
| 30 to 34 Minutes | 598 (9.9%) | 138 (3.3%) |
| 35 to 39 Minutes | 313 (5.2%) | 123 (2.9%) |
| 40 to 44 Minutes | 183 (3.0%) | 102 (2.4%) |
| 45 to 59 Minutes | 498 (8.3%) | 212 (5.1%) |
| 60 to 89 Minutes | 321 (5.3%) | 355 (8.5%) |
| 90 or more Minutes | 292 (4.9%) | 52 (1.2%) |
Time of Departure to Work by Sex in San Sebastian Municipio
The most frequent times of departure to work in San Sebastian Municipio are 7:00 AM to 7:29 AM (860, 14.3%) for males and 7:00 AM to 7:29 AM (1,156, 27.6%) for females.
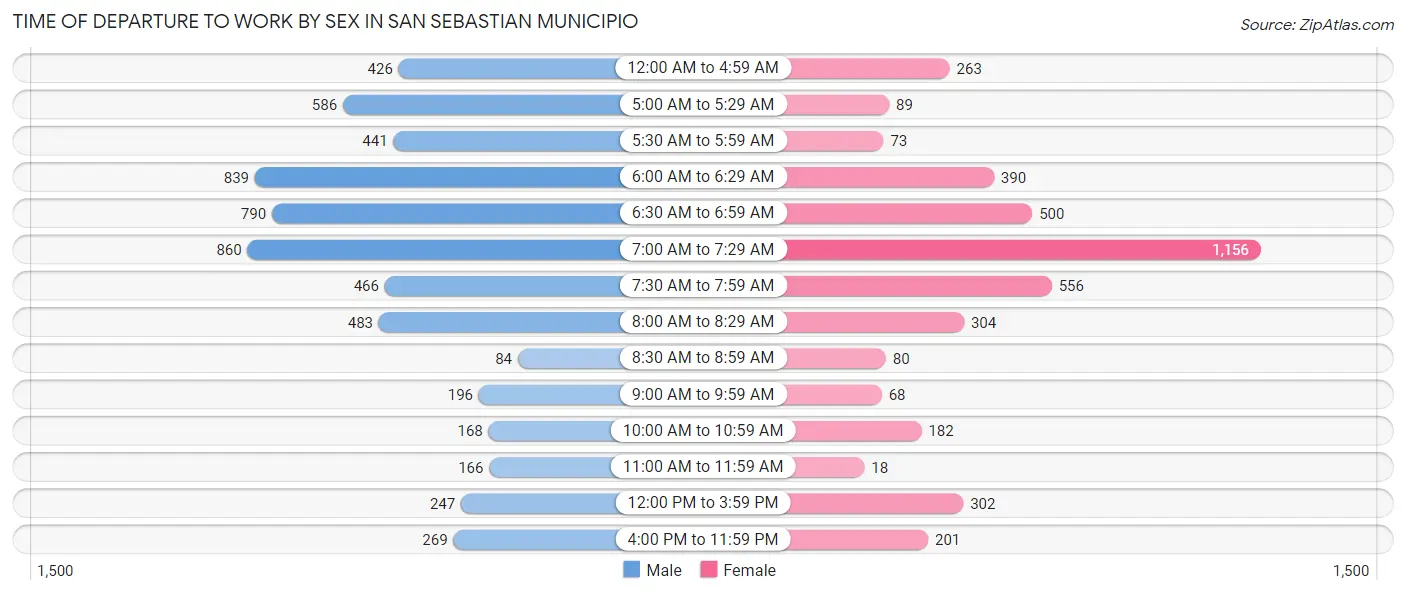
| Time of Departure | Male | Female |
| 12:00 AM to 4:59 AM | 426 (7.1%) | 263 (6.3%) |
| 5:00 AM to 5:29 AM | 586 (9.7%) | 89 (2.1%) |
| 5:30 AM to 5:59 AM | 441 (7.3%) | 73 (1.8%) |
| 6:00 AM to 6:29 AM | 839 (13.9%) | 390 (9.3%) |
| 6:30 AM to 6:59 AM | 790 (13.1%) | 500 (12.0%) |
| 7:00 AM to 7:29 AM | 860 (14.3%) | 1,156 (27.6%) |
| 7:30 AM to 7:59 AM | 466 (7.7%) | 556 (13.3%) |
| 8:00 AM to 8:29 AM | 483 (8.0%) | 304 (7.3%) |
| 8:30 AM to 8:59 AM | 84 (1.4%) | 80 (1.9%) |
| 9:00 AM to 9:59 AM | 196 (3.3%) | 68 (1.6%) |
| 10:00 AM to 10:59 AM | 168 (2.8%) | 182 (4.3%) |
| 11:00 AM to 11:59 AM | 166 (2.8%) | 18 (0.4%) |
| 12:00 PM to 3:59 PM | 247 (4.1%) | 302 (7.2%) |
| 4:00 PM to 11:59 PM | 269 (4.5%) | 201 (4.8%) |
| Total | 6,021 (100.0%) | 4,182 (100.0%) |
Housing Occupancy in San Sebastian Municipio
Occupancy by Ownership in San Sebastian Municipio
Of the total 13,978 dwellings in San Sebastian Municipio, owner-occupied units account for 9,901 (70.8%), while renter-occupied units make up 4,077 (29.2%).
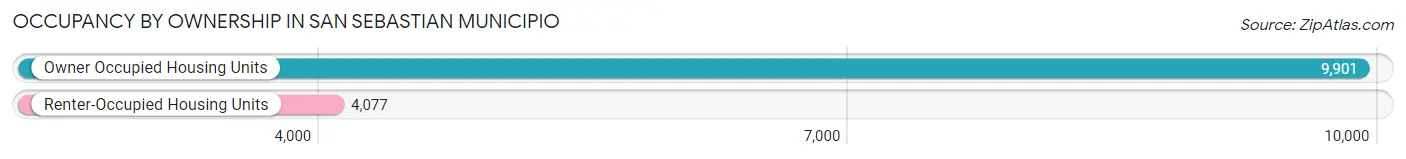
| Occupancy | # Housing Units | % Housing Units |
| Owner Occupied Housing Units | 9,901 | 70.8% |
| Renter-Occupied Housing Units | 4,077 | 29.2% |
| Total Occupied Housing Units | 13,978 | 100.0% |
Occupancy by Household Size in San Sebastian Municipio
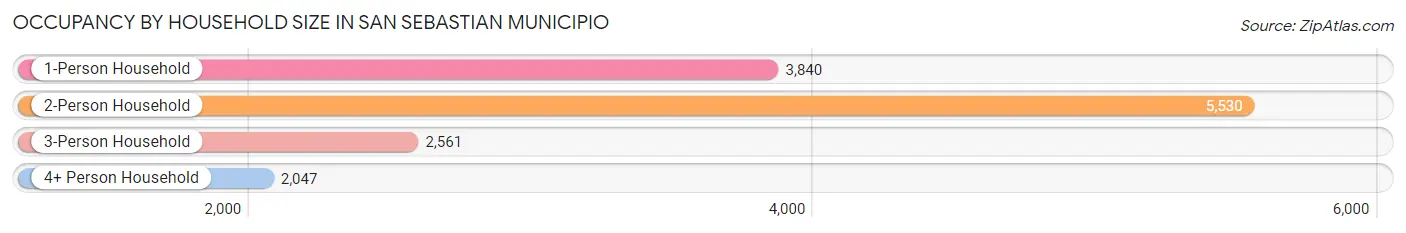
| Household Size | # Housing Units | % Housing Units |
| 1-Person Household | 3,840 | 27.5% |
| 2-Person Household | 5,530 | 39.6% |
| 3-Person Household | 2,561 | 18.3% |
| 4+ Person Household | 2,047 | 14.6% |
| Total Housing Units | 13,978 | 100.0% |
Occupancy by Ownership by Household Size in San Sebastian Municipio
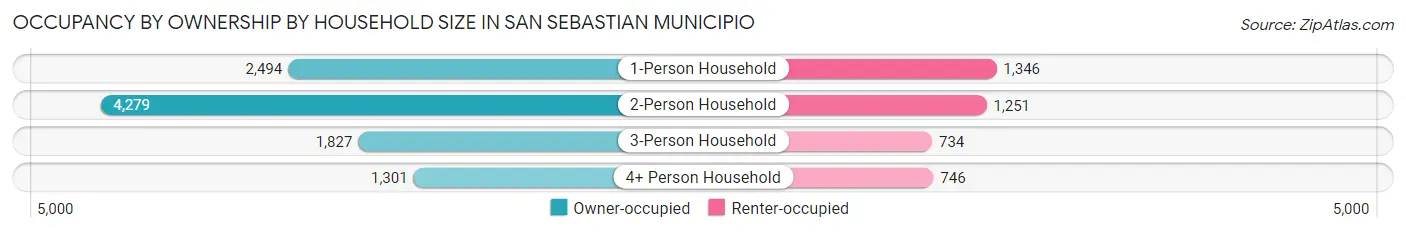
| Household Size | Owner-occupied | Renter-occupied |
| 1-Person Household | 2,494 (64.9%) | 1,346 (35.0%) |
| 2-Person Household | 4,279 (77.4%) | 1,251 (22.6%) |
| 3-Person Household | 1,827 (71.3%) | 734 (28.7%) |
| 4+ Person Household | 1,301 (63.6%) | 746 (36.4%) |
| Total Housing Units | 9,901 (70.8%) | 4,077 (29.2%) |
Occupancy by Educational Attainment in San Sebastian Municipio
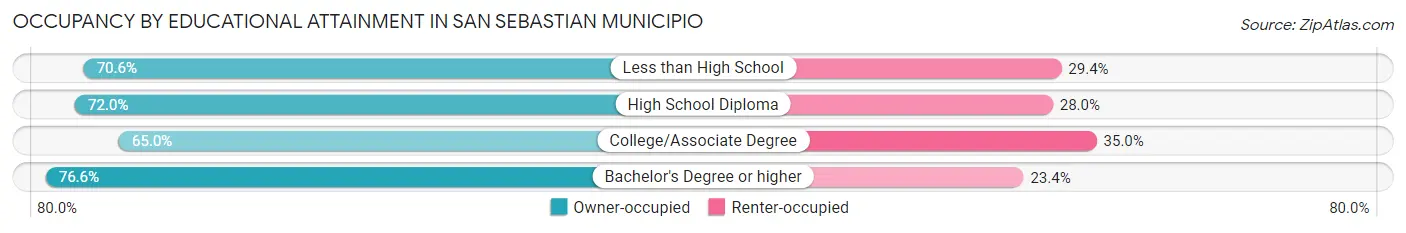
| Household Size | Owner-occupied | Renter-occupied |
| Less than High School | 3,440 (70.6%) | 1,431 (29.4%) |
| High School Diploma | 2,545 (72.0%) | 990 (28.0%) |
| College/Associate Degree | 1,985 (65.0%) | 1,067 (35.0%) |
| Bachelor's Degree or higher | 1,931 (76.6%) | 589 (23.4%) |
Occupancy by Age of Householder in San Sebastian Municipio
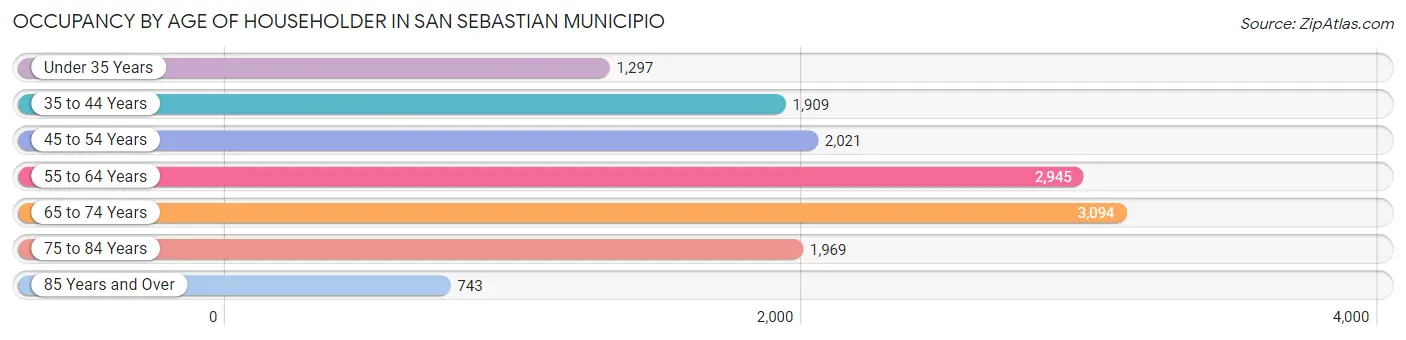
| Age Bracket | # Households | % Households |
| Under 35 Years | 1,297 | 9.3% |
| 35 to 44 Years | 1,909 | 13.7% |
| 45 to 54 Years | 2,021 | 14.5% |
| 55 to 64 Years | 2,945 | 21.1% |
| 65 to 74 Years | 3,094 | 22.1% |
| 75 to 84 Years | 1,969 | 14.1% |
| 85 Years and Over | 743 | 5.3% |
| Total | 13,978 | 100.0% |
Housing Finances in San Sebastian Municipio
Median Income by Occupancy in San Sebastian Municipio
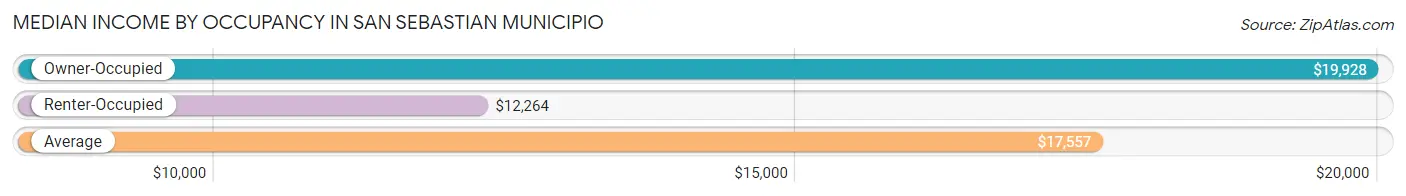
| Occupancy Type | # Households | Median Income |
| Owner-Occupied | 9,901 (70.8%) | $19,928 |
| Renter-Occupied | 4,077 (29.2%) | $12,264 |
| Average | 13,978 (100.0%) | $17,557 |
Occupancy by Householder Income Bracket in San Sebastian Municipio
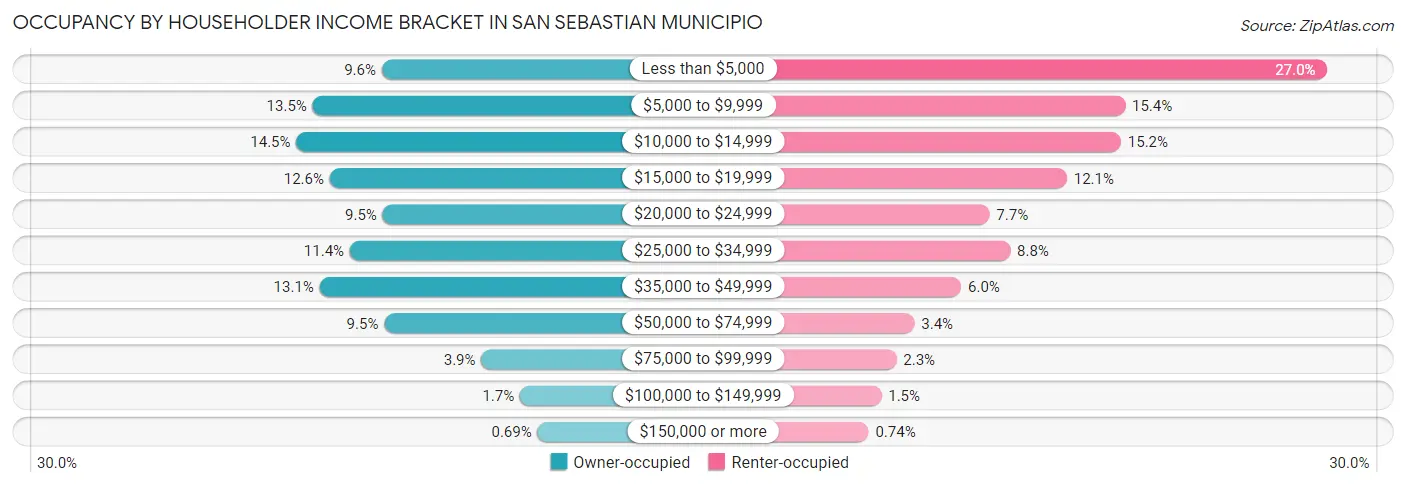
| Income Bracket | Owner-occupied | Renter-occupied |
| Less than $5,000 | 950 (9.6%) | 1,099 (27.0%) |
| $5,000 to $9,999 | 1,341 (13.5%) | 628 (15.4%) |
| $10,000 to $14,999 | 1,433 (14.5%) | 618 (15.2%) |
| $15,000 to $19,999 | 1,244 (12.6%) | 492 (12.1%) |
| $20,000 to $24,999 | 945 (9.5%) | 312 (7.6%) |
| $25,000 to $34,999 | 1,130 (11.4%) | 360 (8.8%) |
| $35,000 to $49,999 | 1,301 (13.1%) | 246 (6.0%) |
| $50,000 to $74,999 | 936 (9.5%) | 137 (3.4%) |
| $75,000 to $99,999 | 386 (3.9%) | 95 (2.3%) |
| $100,000 to $149,999 | 167 (1.7%) | 60 (1.5%) |
| $150,000 or more | 68 (0.7%) | 30 (0.7%) |
| Total | 9,901 (100.0%) | 4,077 (100.0%) |
Monthly Housing Cost Tiers in San Sebastian Municipio
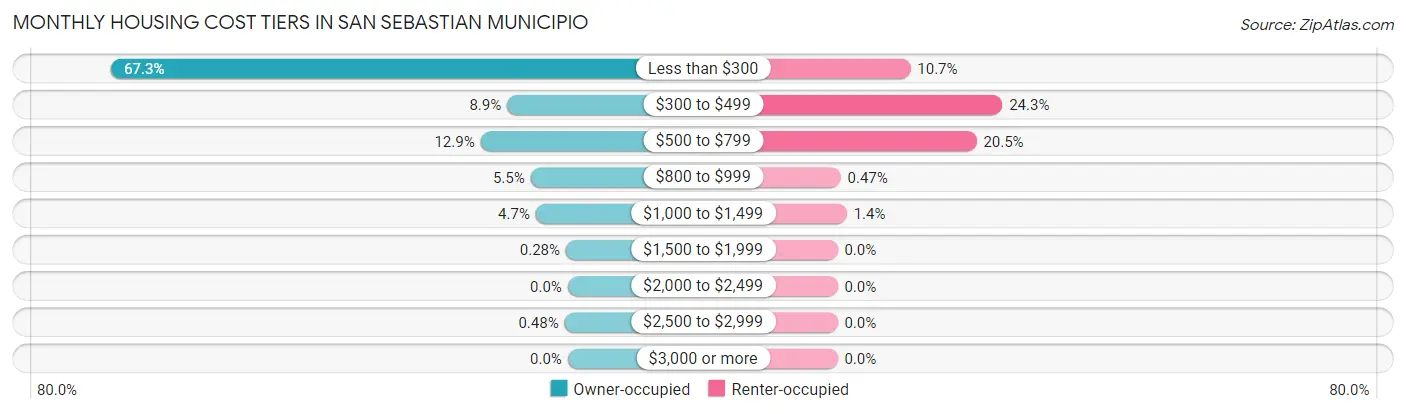
| Monthly Cost | Owner-occupied | Renter-occupied |
| Less than $300 | 6,660 (67.3%) | 438 (10.7%) |
| $300 to $499 | 885 (8.9%) | 990 (24.3%) |
| $500 to $799 | 1,272 (12.9%) | 835 (20.5%) |
| $800 to $999 | 542 (5.5%) | 19 (0.5%) |
| $1,000 to $1,499 | 466 (4.7%) | 56 (1.4%) |
| $1,500 to $1,999 | 28 (0.3%) | 0 (0.0%) |
| $2,000 to $2,499 | 0 (0.0%) | 0 (0.0%) |
| $2,500 to $2,999 | 48 (0.5%) | 0 (0.0%) |
| $3,000 or more | 0 (0.0%) | 0 (0.0%) |
| Total | 9,901 (100.0%) | 4,077 (100.0%) |
Physical Housing Characteristics in San Sebastian Municipio
Housing Structures in San Sebastian Municipio
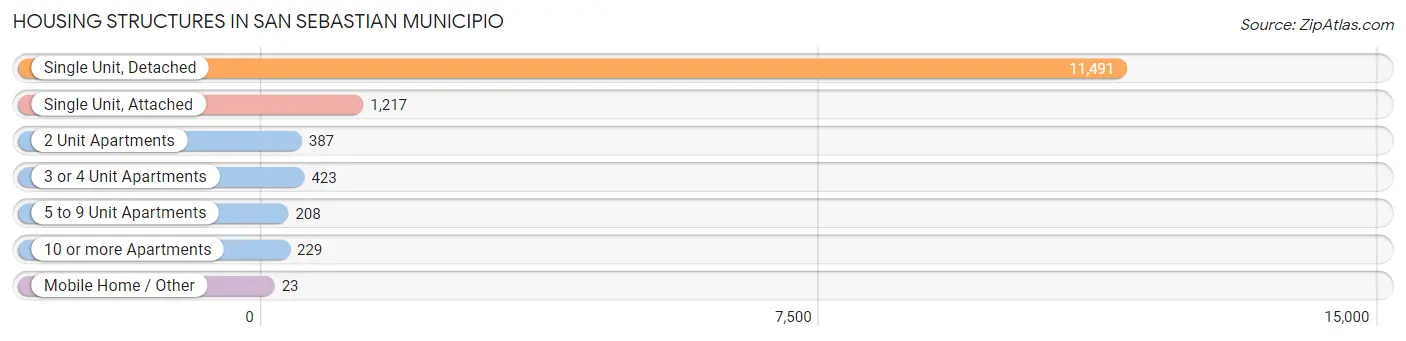
| Structure Type | # Housing Units | % Housing Units |
| Single Unit, Detached | 11,491 | 82.2% |
| Single Unit, Attached | 1,217 | 8.7% |
| 2 Unit Apartments | 387 | 2.8% |
| 3 or 4 Unit Apartments | 423 | 3.0% |
| 5 to 9 Unit Apartments | 208 | 1.5% |
| 10 or more Apartments | 229 | 1.6% |
| Mobile Home / Other | 23 | 0.2% |
| Total | 13,978 | 100.0% |
Housing Structures by Occupancy in San Sebastian Municipio
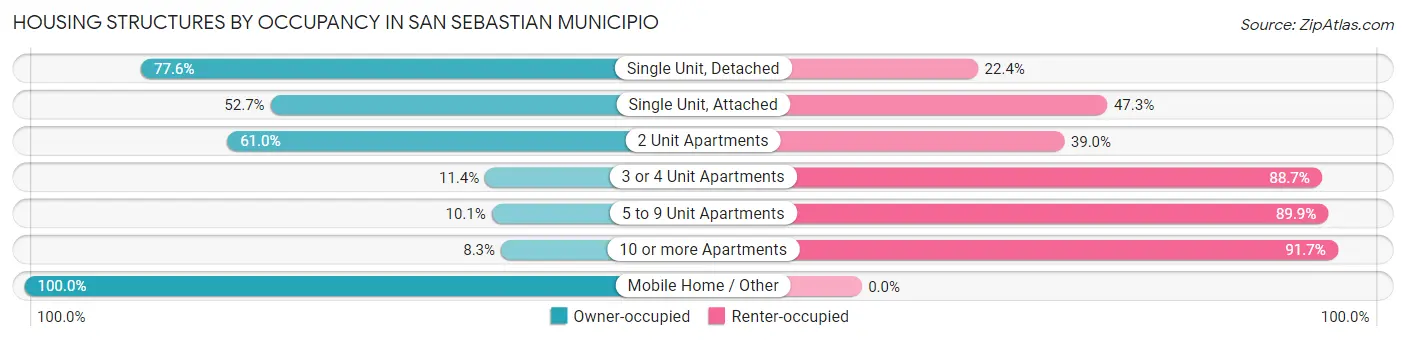
| Structure Type | Owner-occupied | Renter-occupied |
| Single Unit, Detached | 8,913 (77.6%) | 2,578 (22.4%) |
| Single Unit, Attached | 641 (52.7%) | 576 (47.3%) |
| 2 Unit Apartments | 236 (61.0%) | 151 (39.0%) |
| 3 or 4 Unit Apartments | 48 (11.4%) | 375 (88.6%) |
| 5 to 9 Unit Apartments | 21 (10.1%) | 187 (89.9%) |
| 10 or more Apartments | 19 (8.3%) | 210 (91.7%) |
| Mobile Home / Other | 23 (100.0%) | 0 (0.0%) |
| Total | 9,901 (70.8%) | 4,077 (29.2%) |
Housing Structures by Number of Rooms in San Sebastian Municipio
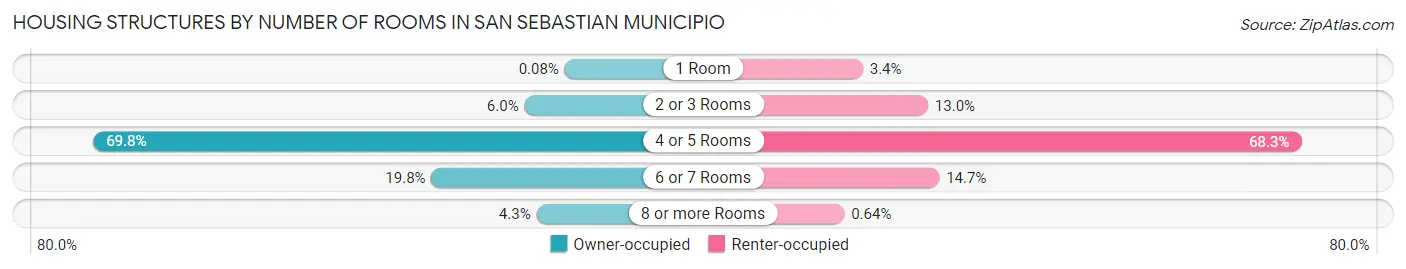
| Number of Rooms | Owner-occupied | Renter-occupied |
| 1 Room | 8 (0.1%) | 138 (3.4%) |
| 2 or 3 Rooms | 597 (6.0%) | 531 (13.0%) |
| 4 or 5 Rooms | 6,915 (69.8%) | 2,783 (68.3%) |
| 6 or 7 Rooms | 1,960 (19.8%) | 599 (14.7%) |
| 8 or more Rooms | 421 (4.3%) | 26 (0.6%) |
| Total | 9,901 (100.0%) | 4,077 (100.0%) |
Housing Structure by Heating Type in San Sebastian Municipio
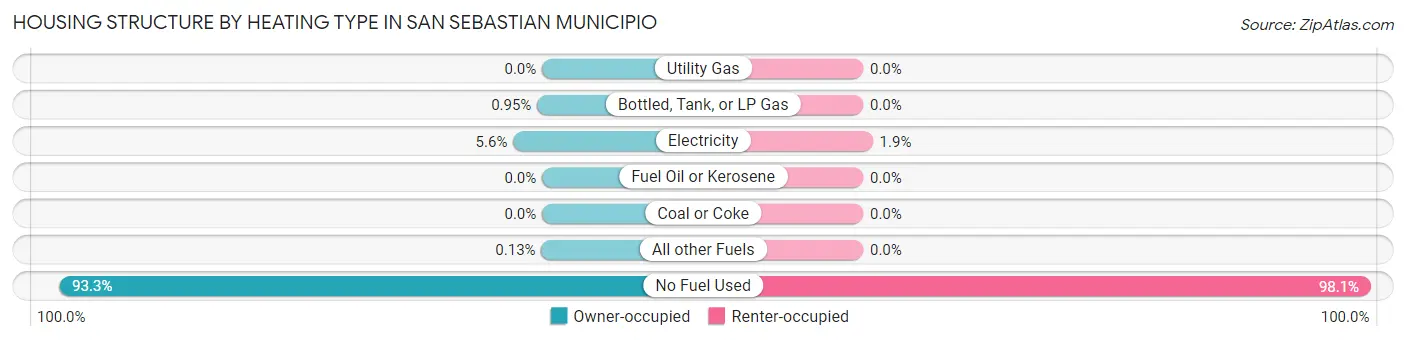
| Heating Type | Owner-occupied | Renter-occupied |
| Utility Gas | 0 (0.0%) | 0 (0.0%) |
| Bottled, Tank, or LP Gas | 94 (0.9%) | 0 (0.0%) |
| Electricity | 552 (5.6%) | 76 (1.9%) |
| Fuel Oil or Kerosene | 0 (0.0%) | 0 (0.0%) |
| Coal or Coke | 0 (0.0%) | 0 (0.0%) |
| All other Fuels | 13 (0.1%) | 0 (0.0%) |
| No Fuel Used | 9,242 (93.3%) | 4,001 (98.1%) |
| Total | 9,901 (100.0%) | 4,077 (100.0%) |
Household Vehicle Usage in San Sebastian Municipio
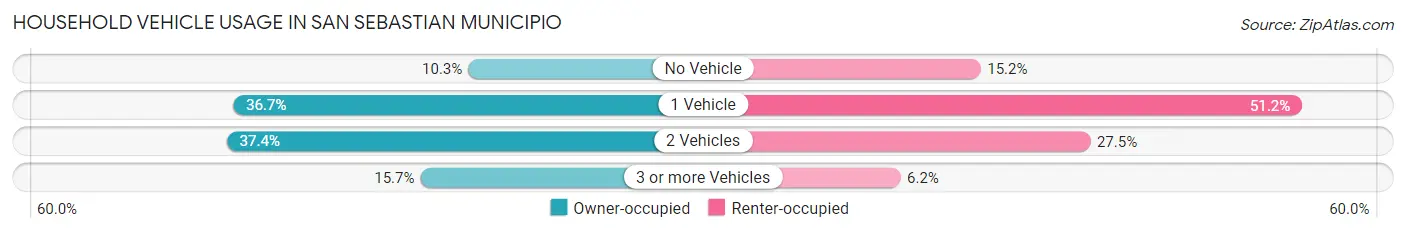
| Vehicles per Household | Owner-occupied | Renter-occupied |
| No Vehicle | 1,022 (10.3%) | 618 (15.2%) |
| 1 Vehicle | 3,629 (36.6%) | 2,088 (51.2%) |
| 2 Vehicles | 3,699 (37.4%) | 1,119 (27.5%) |
| 3 or more Vehicles | 1,551 (15.7%) | 252 (6.2%) |
| Total | 9,901 (100.0%) | 4,077 (100.0%) |
Real Estate & Mortgages in San Sebastian Municipio
Real Estate and Mortgage Overview in San Sebastian Municipio
| Characteristic | Without Mortgage | With Mortgage |
| Housing Units | 7,298 | 2,603 |
| Median Property Value | $92,700 | $133,300 |
| Median Household Income | $17,874 | $49 |
| Monthly Housing Costs | $133 | $0 |
| Real Estate Taxes | $359 | $2,209 |
Property Value by Mortgage Status in San Sebastian Municipio
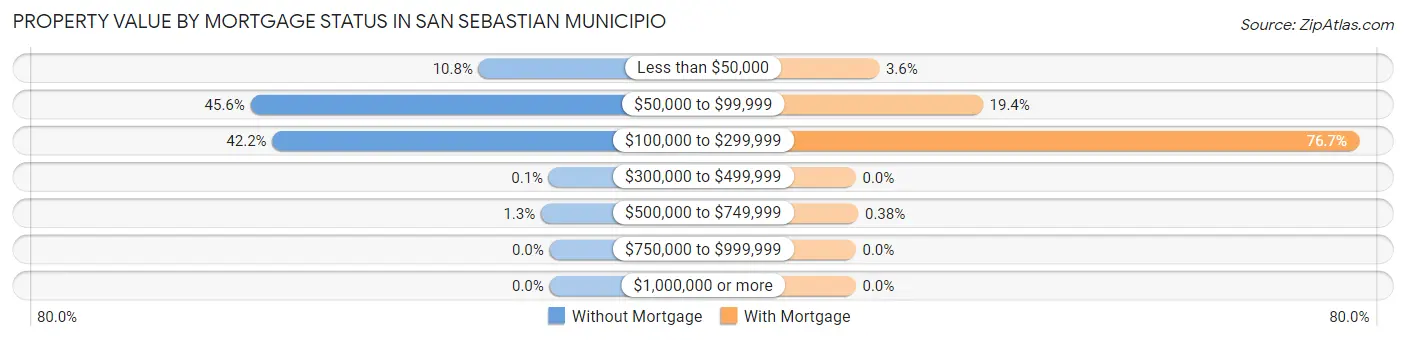
| Property Value | Without Mortgage | With Mortgage |
| Less than $50,000 | 788 (10.8%) | 93 (3.6%) |
| $50,000 to $99,999 | 3,325 (45.6%) | 504 (19.4%) |
| $100,000 to $299,999 | 3,083 (42.2%) | 1,996 (76.7%) |
| $300,000 to $499,999 | 7 (0.1%) | 0 (0.0%) |
| $500,000 to $749,999 | 95 (1.3%) | 10 (0.4%) |
| $750,000 to $999,999 | 0 (0.0%) | 0 (0.0%) |
| $1,000,000 or more | 0 (0.0%) | 0 (0.0%) |
| Total | 7,298 (100.0%) | 2,603 (100.0%) |
Household Income by Mortgage Status in San Sebastian Municipio
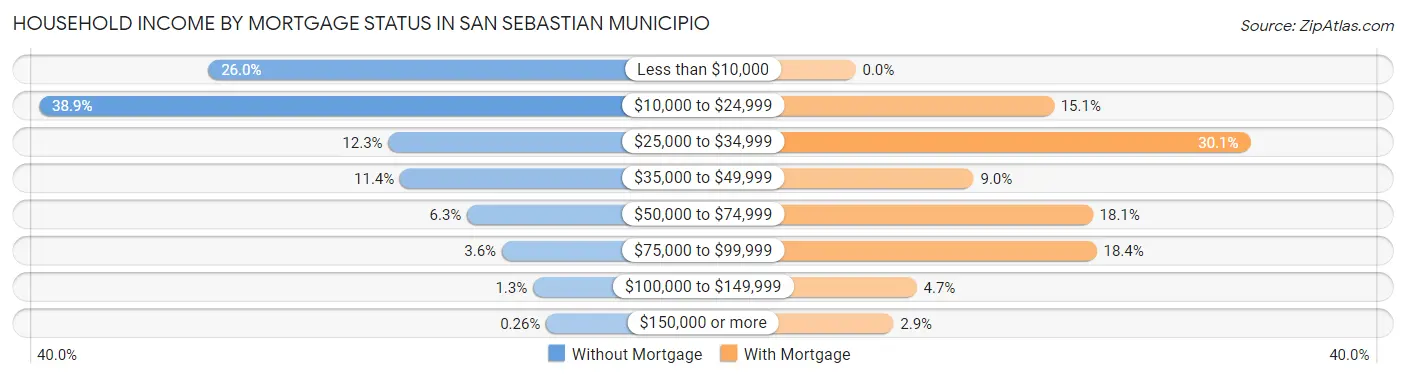
| Household Income | Without Mortgage | With Mortgage |
| Less than $10,000 | 1,898 (26.0%) | 0 (0.0%) |
| $10,000 to $24,999 | 2,839 (38.9%) | 393 (15.1%) |
| $25,000 to $34,999 | 896 (12.3%) | 783 (30.1%) |
| $35,000 to $49,999 | 831 (11.4%) | 234 (9.0%) |
| $50,000 to $74,999 | 458 (6.3%) | 470 (18.1%) |
| $75,000 to $99,999 | 265 (3.6%) | 478 (18.4%) |
| $100,000 to $149,999 | 92 (1.3%) | 121 (4.6%) |
| $150,000 or more | 19 (0.3%) | 75 (2.9%) |
| Total | 7,298 (100.0%) | 2,603 (100.0%) |
Property Value to Household Income Ratio in San Sebastian Municipio
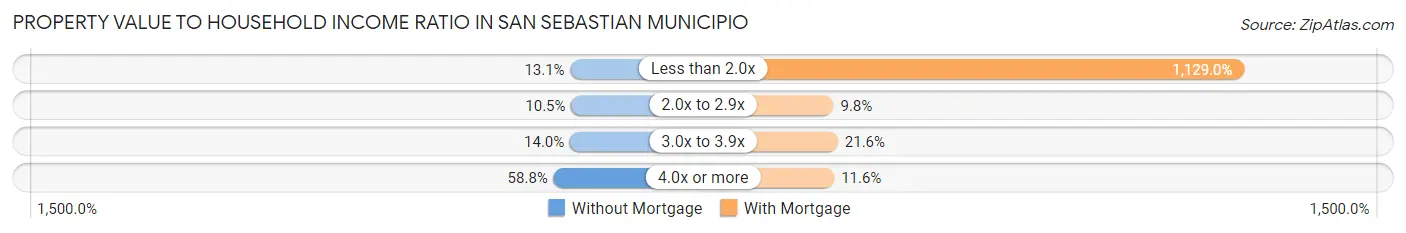
| Value-to-Income Ratio | Without Mortgage | With Mortgage |
| Less than 2.0x | 954 (13.1%) | 29,387 (1,129.0%) |
| 2.0x to 2.9x | 766 (10.5%) | 256 (9.8%) |
| 3.0x to 3.9x | 1,020 (14.0%) | 563 (21.6%) |
| 4.0x or more | 4,289 (58.8%) | 302 (11.6%) |
| Total | 7,298 (100.0%) | 2,603 (100.0%) |
Real Estate Taxes by Mortgage Status in San Sebastian Municipio
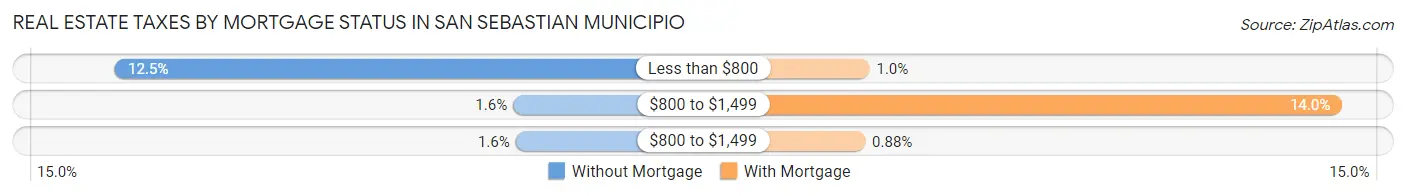
| Property Taxes | Without Mortgage | With Mortgage |
| Less than $800 | 914 (12.5%) | 26 (1.0%) |
| $800 to $1,499 | 118 (1.6%) | 363 (14.0%) |
| $800 to $1,499 | 113 (1.5%) | 23 (0.9%) |
| Total | 7,298 (100.0%) | 2,603 (100.0%) |
Health & Disability in San Sebastian Municipio
Health Insurance Coverage by Age in San Sebastian Municipio
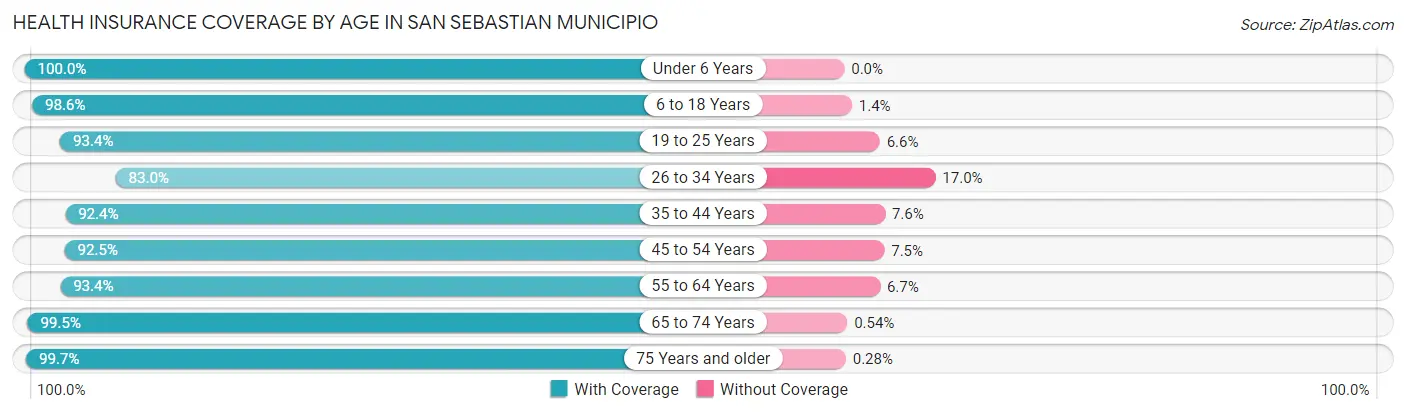
| Age Bracket | With Coverage | Without Coverage |
| Under 6 Years | 1,577 (100.0%) | 0 (0.0%) |
| 6 to 18 Years | 5,601 (98.6%) | 80 (1.4%) |
| 19 to 25 Years | 3,139 (93.4%) | 222 (6.6%) |
| 26 to 34 Years | 3,123 (83.0%) | 639 (17.0%) |
| 35 to 44 Years | 4,230 (92.4%) | 347 (7.6%) |
| 45 to 54 Years | 4,489 (92.5%) | 362 (7.5%) |
| 55 to 64 Years | 5,182 (93.3%) | 369 (6.7%) |
| 65 to 74 Years | 5,298 (99.5%) | 29 (0.5%) |
| 75 Years and older | 4,275 (99.7%) | 12 (0.3%) |
| Total | 36,914 (94.7%) | 2,060 (5.3%) |
Health Insurance Coverage by Citizenship Status in San Sebastian Municipio
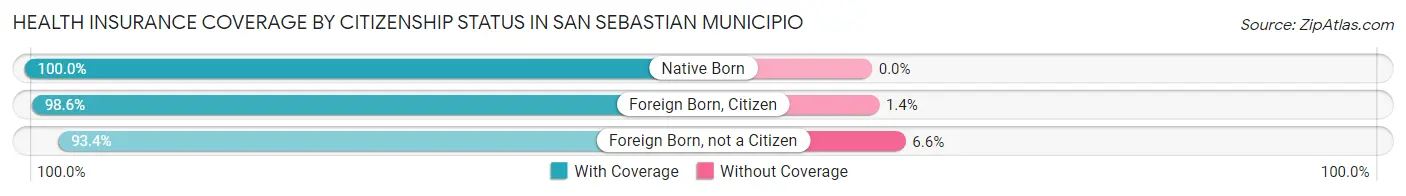
| Citizenship Status | With Coverage | Without Coverage |
| Native Born | 1,577 (100.0%) | 0 (0.0%) |
| Foreign Born, Citizen | 5,601 (98.6%) | 80 (1.4%) |
| Foreign Born, not a Citizen | 3,139 (93.4%) | 222 (6.6%) |
Health Insurance Coverage by Household Income in San Sebastian Municipio
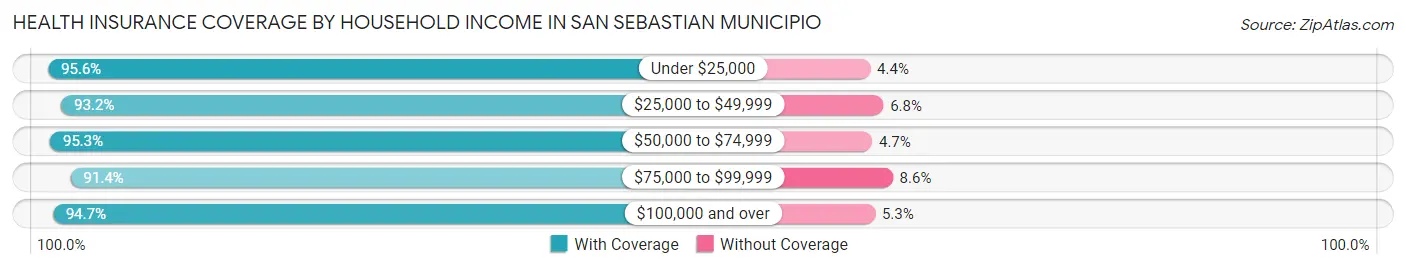
| Household Income | With Coverage | Without Coverage |
| Under $25,000 | 21,015 (95.6%) | 963 (4.4%) |
| $25,000 to $49,999 | 9,285 (93.2%) | 681 (6.8%) |
| $50,000 to $74,999 | 3,587 (95.3%) | 178 (4.7%) |
| $75,000 to $99,999 | 1,607 (91.4%) | 151 (8.6%) |
| $100,000 and over | 1,345 (94.7%) | 75 (5.3%) |
Public vs Private Health Insurance Coverage by Age in San Sebastian Municipio
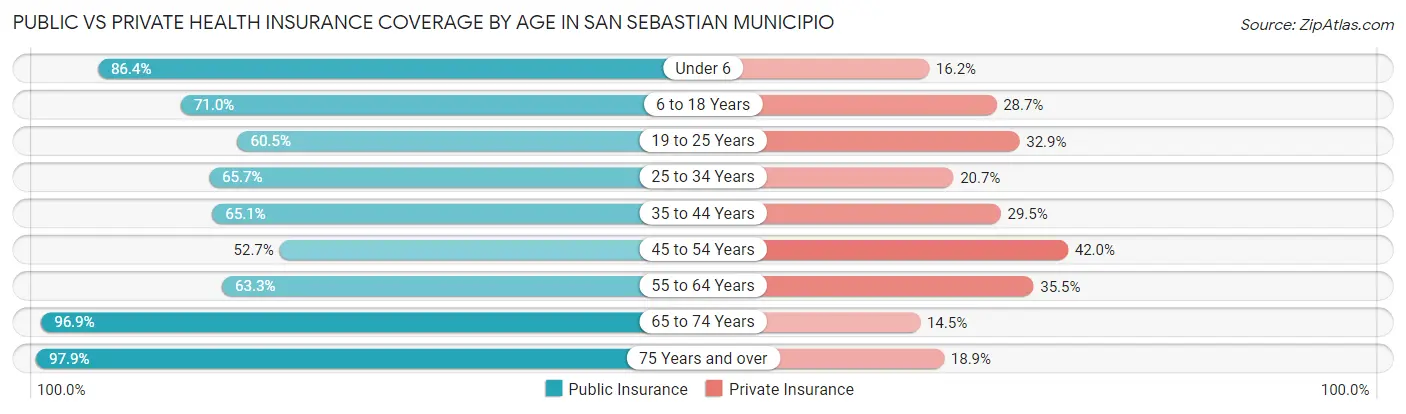
| Age Bracket | Public Insurance | Private Insurance |
| Under 6 | 1,362 (86.4%) | 255 (16.2%) |
| 6 to 18 Years | 4,032 (71.0%) | 1,628 (28.7%) |
| 19 to 25 Years | 2,032 (60.5%) | 1,107 (32.9%) |
| 25 to 34 Years | 2,473 (65.7%) | 778 (20.7%) |
| 35 to 44 Years | 2,981 (65.1%) | 1,349 (29.5%) |
| 45 to 54 Years | 2,555 (52.7%) | 2,035 (41.9%) |
| 55 to 64 Years | 3,515 (63.3%) | 1,973 (35.5%) |
| 65 to 74 Years | 5,162 (96.9%) | 773 (14.5%) |
| 75 Years and over | 4,195 (97.9%) | 812 (18.9%) |
| Total | 28,307 (72.6%) | 10,710 (27.5%) |
Disability Status by Sex by Age in San Sebastian Municipio
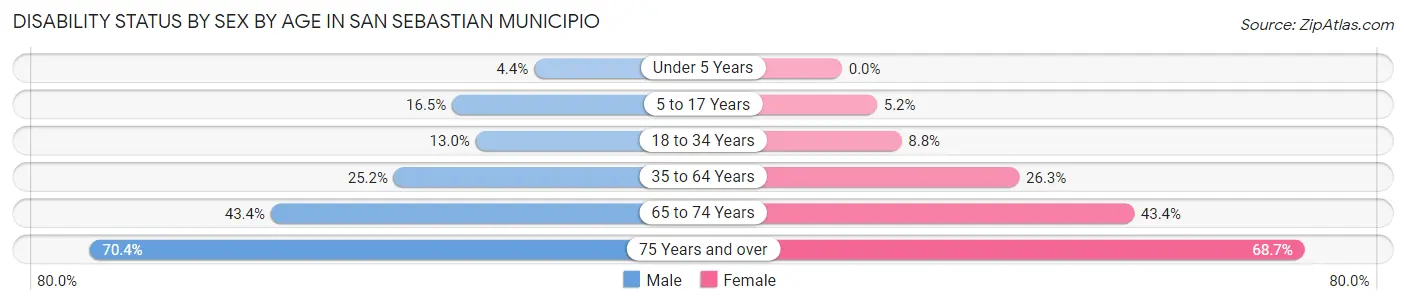
| Age Bracket | Male | Female |
| Under 5 Years | 29 (4.3%) | 0 (0.0%) |
| 5 to 17 Years | 459 (16.5%) | 139 (5.2%) |
| 18 to 34 Years | 513 (13.0%) | 326 (8.8%) |
| 35 to 64 Years | 1,791 (25.2%) | 2,071 (26.3%) |
| 65 to 74 Years | 1,092 (43.4%) | 1,220 (43.4%) |
| 75 Years and over | 1,406 (70.4%) | 1,573 (68.7%) |
Disability Class by Sex by Age in San Sebastian Municipio
Disability Class: Hearing Difficulty
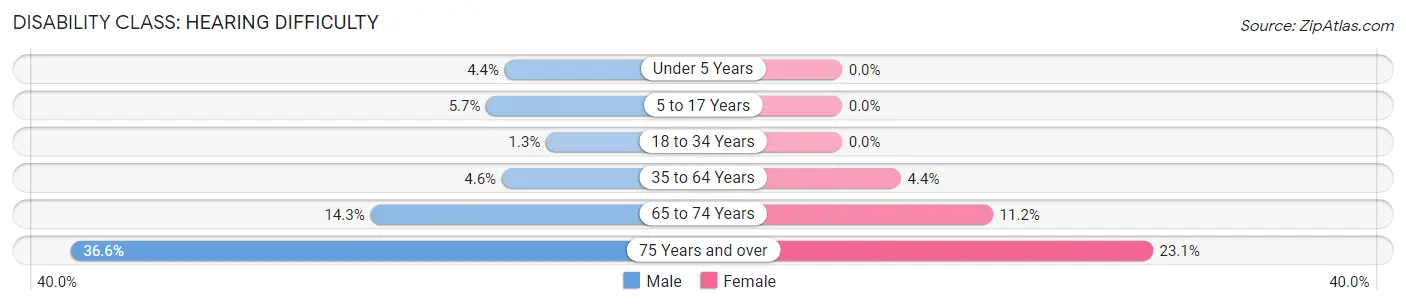
| Age Bracket | Male | Female |
| Under 5 Years | 29 (4.3%) | 0 (0.0%) |
| 5 to 17 Years | 159 (5.7%) | 0 (0.0%) |
| 18 to 34 Years | 50 (1.3%) | 0 (0.0%) |
| 35 to 64 Years | 324 (4.6%) | 344 (4.4%) |
| 65 to 74 Years | 360 (14.3%) | 315 (11.2%) |
| 75 Years and over | 731 (36.6%) | 528 (23.1%) |
Disability Class: Vision Difficulty
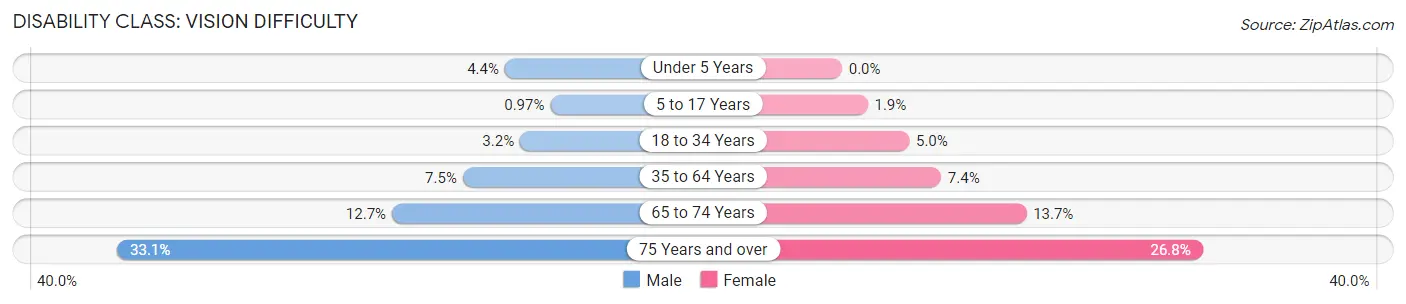
| Age Bracket | Male | Female |
| Under 5 Years | 29 (4.3%) | 0 (0.0%) |
| 5 to 17 Years | 27 (1.0%) | 51 (1.9%) |
| 18 to 34 Years | 127 (3.2%) | 184 (5.0%) |
| 35 to 64 Years | 531 (7.5%) | 579 (7.4%) |
| 65 to 74 Years | 320 (12.7%) | 385 (13.7%) |
| 75 Years and over | 662 (33.1%) | 613 (26.8%) |
Disability Class: Cognitive Difficulty
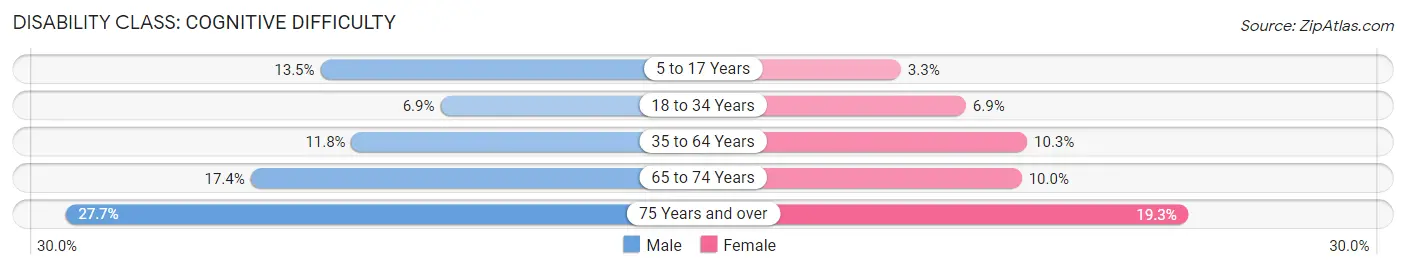
| Age Bracket | Male | Female |
| 5 to 17 Years | 376 (13.5%) | 88 (3.3%) |
| 18 to 34 Years | 270 (6.9%) | 255 (6.9%) |
| 35 to 64 Years | 839 (11.8%) | 812 (10.3%) |
| 65 to 74 Years | 438 (17.4%) | 282 (10.0%) |
| 75 Years and over | 554 (27.7%) | 442 (19.3%) |
Disability Class: Ambulatory Difficulty
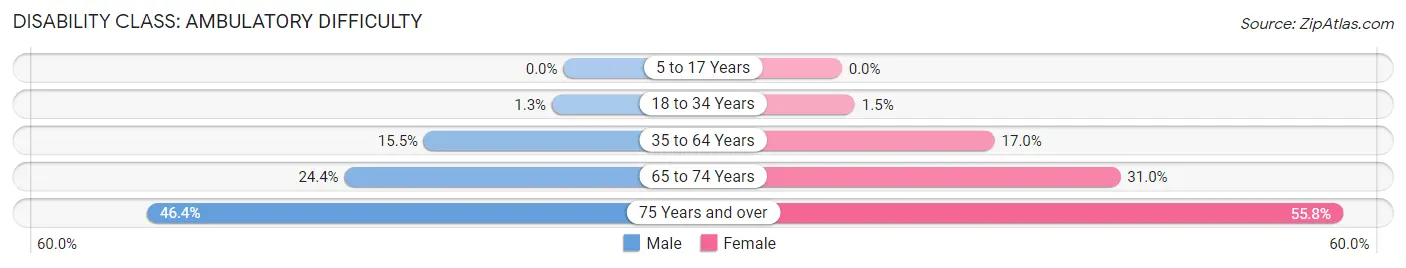
| Age Bracket | Male | Female |
| 5 to 17 Years | 0 (0.0%) | 0 (0.0%) |
| 18 to 34 Years | 50 (1.3%) | 54 (1.5%) |
| 35 to 64 Years | 1,105 (15.5%) | 1,339 (17.0%) |
| 65 to 74 Years | 613 (24.4%) | 873 (31.0%) |
| 75 Years and over | 926 (46.4%) | 1,277 (55.8%) |
Disability Class: Self-Care Difficulty
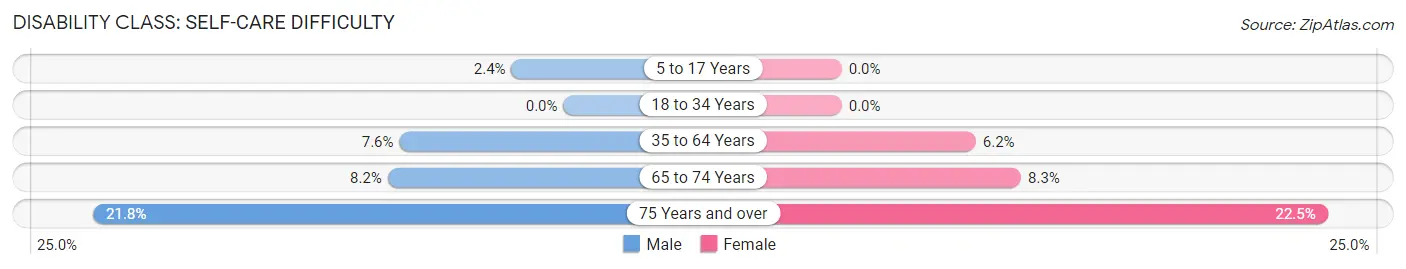
| Age Bracket | Male | Female |
| 5 to 17 Years | 67 (2.4%) | 0 (0.0%) |
| 18 to 34 Years | 0 (0.0%) | 0 (0.0%) |
| 35 to 64 Years | 541 (7.6%) | 489 (6.2%) |
| 65 to 74 Years | 205 (8.2%) | 234 (8.3%) |
| 75 Years and over | 436 (21.8%) | 516 (22.5%) |
Technology Access in San Sebastian Municipio
Computing Device Access in San Sebastian Municipio
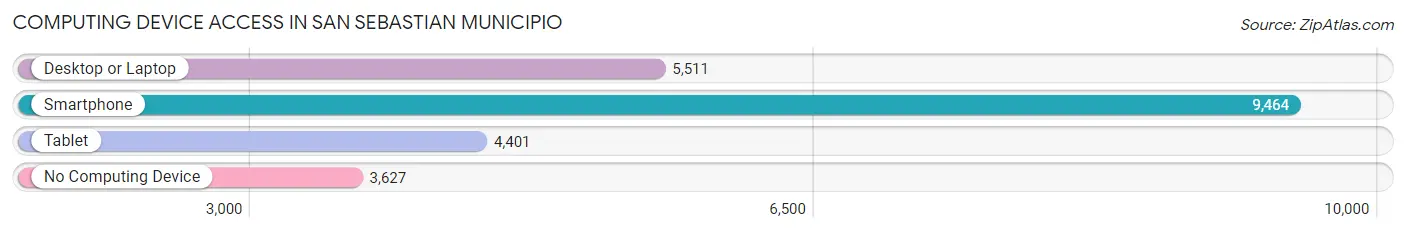
| Device Type | # Households | % Households |
| Desktop or Laptop | 5,511 | 39.4% |
| Smartphone | 9,464 | 67.7% |
| Tablet | 4,401 | 31.5% |
| No Computing Device | 3,627 | 26.0% |
| Total | 13,978 | 100.0% |
Internet Access in San Sebastian Municipio
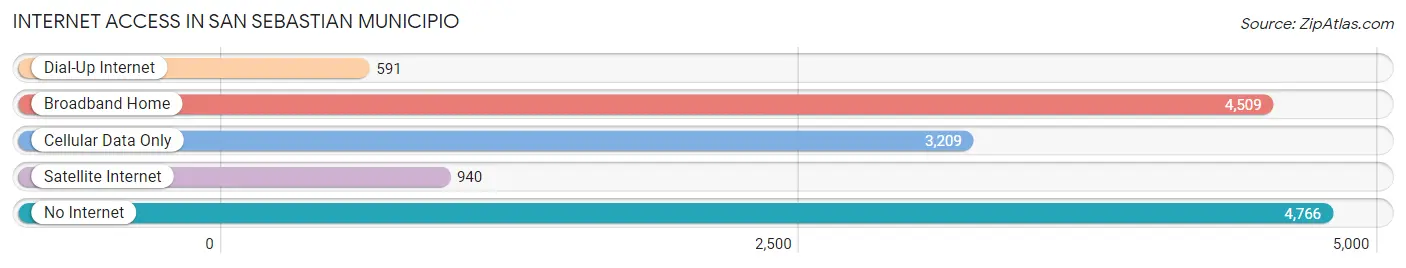
| Internet Type | # Households | % Households |
| Dial-Up Internet | 591 | 4.2% |
| Broadband Home | 4,509 | 32.3% |
| Cellular Data Only | 3,209 | 23.0% |
| Satellite Internet | 940 | 6.7% |
| No Internet | 4,766 | 34.1% |
| Total | 13,978 | 100.0% |
San Sebastian Municipio Summary
San Sebastian Municipio is a municipality located in the northwest region of Puerto Rico. It is part of the San Juan-Caguas-Guaynabo Metropolitan Statistical Area. As of the 2010 census, the municipality had a population of 33,844.
History
San Sebastian Municipio was founded in 1801 by Don Juan de la Cruz. It was originally part of the municipality of San German, but was later separated and established as its own municipality. The town was named after Saint Sebastian, the patron saint of the town.
The town was originally a small agricultural community, but in the late 19th century, it began to develop into a commercial center. The town was also known for its production of sugar cane and tobacco.
Geography
San Sebastian Municipio is located in the northwest region of Puerto Rico. It is bordered by the municipalities of San German to the east, Lajas to the south, and Mayaguez to the west. The municipality covers an area of approximately 33 square miles.
The terrain of San Sebastian Municipio is mostly flat, with some hills in the northern part of the municipality. The highest point in the municipality is Cerro de la Cruz, which has an elevation of 1,067 feet.
The climate of San Sebastian Municipio is tropical, with temperatures ranging from the mid-70s to the mid-80s. The average annual precipitation is around 50 inches.
Economy
The economy of San Sebastian Municipio is largely based on agriculture and tourism. The main agricultural products are sugar cane, tobacco, and coffee. The municipality is also home to several manufacturing plants, including a pharmaceutical plant and a plastics factory.
Tourism is an important part of the economy of San Sebastian Municipio. The municipality is home to several popular tourist attractions, including the San Sebastian Beach, the San Sebastian Castle, and the San Sebastian Cathedral.
Demographics
As of the 2010 census, the population of San Sebastian Municipio was 33,844. The population is mostly of Puerto Rican descent, with a small percentage of African and European descent. The median age of the population is 37.
The majority of the population (90%) is Roman Catholic. The other 10% of the population is divided between other Christian denominations and non-religious individuals.
The median household income in San Sebastian Municipio is $20,000. The unemployment rate is around 10%. The poverty rate is around 30%.
Common Questions
What is Per Capita Income in San Sebastian Municipio?
Per Capita income in San Sebastian Municipio is $11,370.
What is the Median Family Income in San Sebastian Municipio?
Median Family Income in San Sebastian Municipio is $21,658.
What is the Median Household income in San Sebastian Municipio?
Median Household Income in San Sebastian Municipio is $17,557.
What is Income or Wage Gap in San Sebastian Municipio?
Income or Wage Gap in San Sebastian Municipio is 2.5%.
Women in San Sebastian Municipio earn 97.5 cents for every dollar earned by a man.
What is Family Income Deficit in San Sebastian Municipio?
Family Income Deficit in San Sebastian Municipio is $10,506.
Families that are below poverty line in San Sebastian Municipio earn $10,506 less on average than the poverty threshold level.
What is Inequality or Gini Index in San Sebastian Municipio?
Inequality or Gini Index in San Sebastian Municipio is 0.52.
What is the Total Population of San Sebastian Municipio?
Total Population of San Sebastian Municipio is 39,183.
What is the Total Male Population of San Sebastian Municipio?
Total Male Population of San Sebastian Municipio is 19,051.
What is the Total Female Population of San Sebastian Municipio?
Total Female Population of San Sebastian Municipio is 20,132.
What is the Ratio of Males per 100 Females in San Sebastian Municipio?
There are 94.63 Males per 100 Females in San Sebastian Municipio.
What is the Ratio of Females per 100 Males in San Sebastian Municipio?
There are 105.67 Females per 100 Males in San Sebastian Municipio.
What is the Median Population Age in San Sebastian Municipio?
Median Population Age in San Sebastian Municipio is 46.0 Years.
What is the Average Family Size in San Sebastian Municipio
Average Family Size in San Sebastian Municipio is 3.4 People.
What is the Average Household Size in San Sebastian Municipio
Average Household Size in San Sebastian Municipio is 2.8 People.
How Large is the Labor Force in San Sebastian Municipio?
There are 12,832 People in the Labor Forcein in San Sebastian Municipio.
What is the Percentage of People in the Labor Force in San Sebastian Municipio?
38.4% of People are in the Labor Force in San Sebastian Municipio.
What is the Unemployment Rate in San Sebastian Municipio?
Unemployment Rate in San Sebastian Municipio is 14.9%.