San Juan Municipio, PR Map & Demographics
San Juan Municipio Map
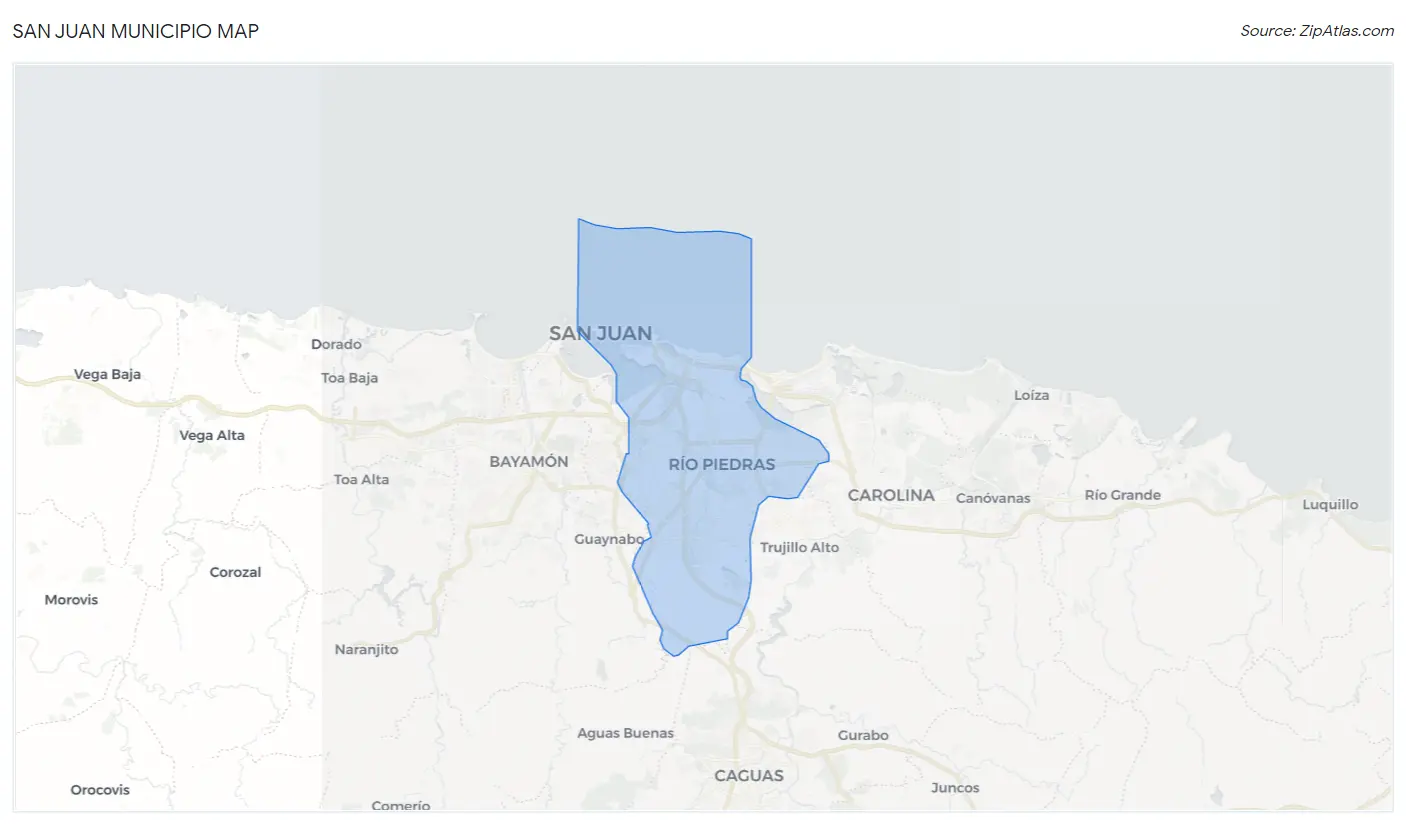
San Juan Municipio Overview
$22,553
PER CAPITA INCOME
$33,876
AVG FAMILY INCOME
$26,111
AVG HOUSEHOLD INCOME
3.7%
WAGE / INCOME GAP [ % ]
96.3¢/ $1
WAGE / INCOME GAP [ $ ]
$13,041
FAMILY INCOME DEFICIT
0.61
INEQUALITY / GINI INDEX
340,903
TOTAL POPULATION
155,775
MALE POPULATION
185,128
FEMALE POPULATION
84.14
MALES / 100 FEMALES
118.84
FEMALES / 100 MALES
45.0
MEDIAN AGE
3.1
AVG FAMILY SIZE
2.3
AVG HOUSEHOLD SIZE
153,003
LABOR FORCE [ PEOPLE ]
52.3%
PERCENT IN LABOR FORCE
15.7%
UNEMPLOYMENT RATE
Income in San Juan Municipio
Income Overview in San Juan Municipio
Per Capita Income in San Juan Municipio is $22,553, while median incomes of families and households are $33,876 and $26,111 respectively.
| Characteristic | Number | Measure |
| Per Capita Income | 340,903 | $22,553 |
| Median Family Income | 78,810 | $33,876 |
| Mean Family Income | 78,810 | $62,256 |
| Median Household Income | 147,044 | $26,111 |
| Mean Household Income | 147,044 | $49,374 |
| Income Deficit | 78,810 | $13,041 |
| Wage / Income Gap (%) | 340,903 | 3.65% |
| Wage / Income Gap ($) | 340,903 | 96.35¢ per $1 |
| Gini / Inequality Index | 340,903 | 0.61 |
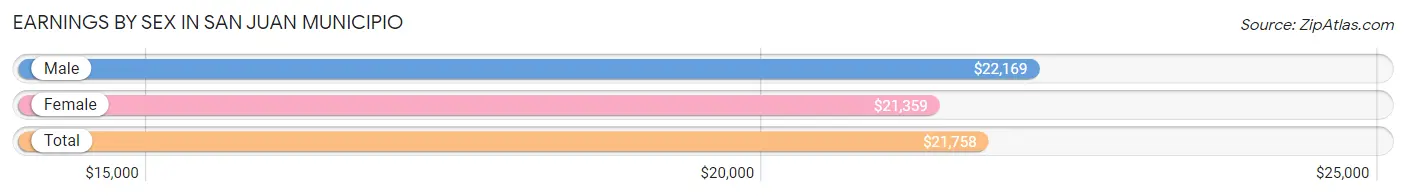
Earnings by Sex in San Juan Municipio
Average Earnings in San Juan Municipio are $21,758, $22,169 for men and $21,359 for women, a difference of 3.6%.
| Sex | Number | Average Earnings |
| Male | 72,561 (51.0%) | $22,169 |
| Female | 69,583 (48.9%) | $21,359 |
| Total | 142,144 (100.0%) | $21,758 |
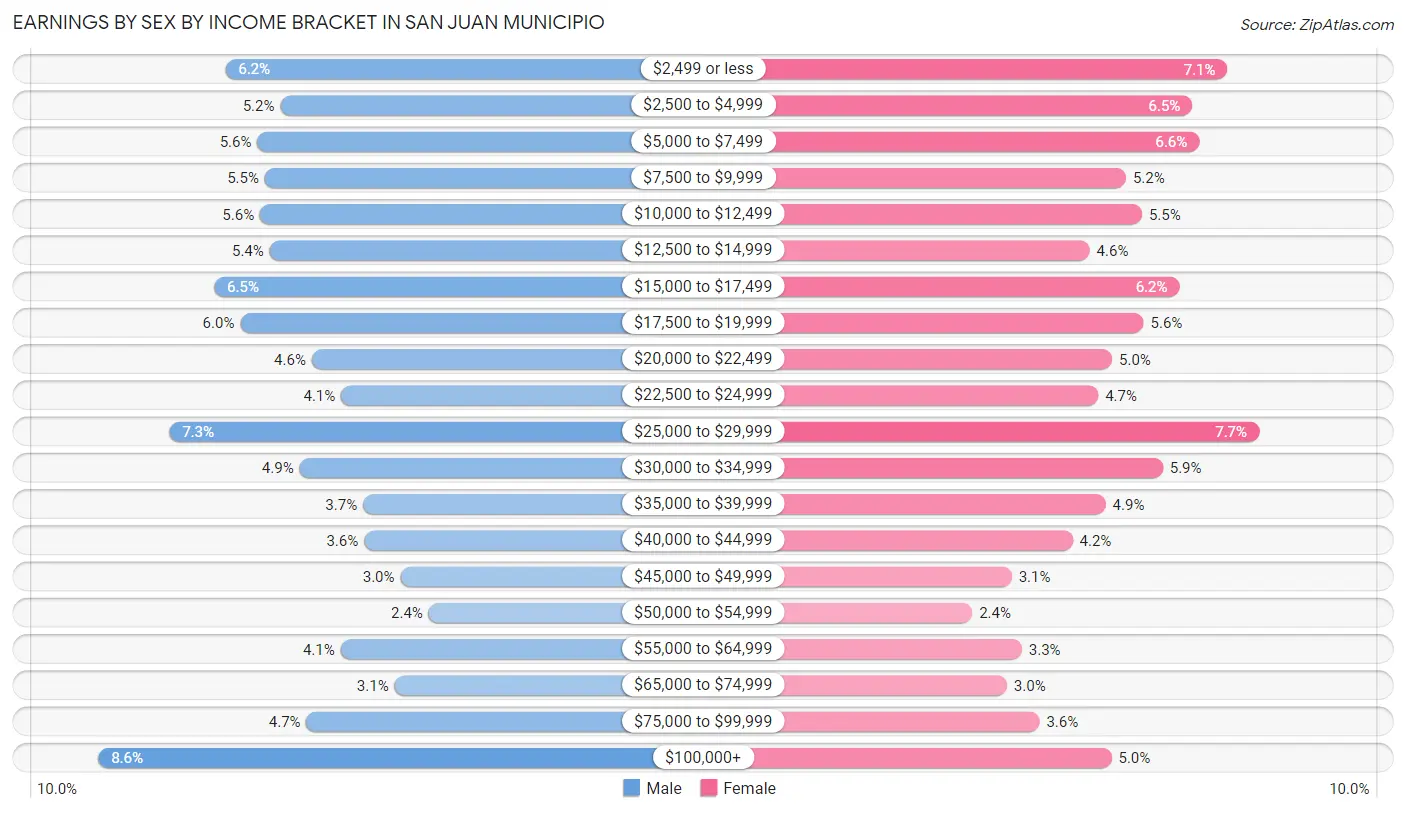
Earnings by Sex by Income Bracket in San Juan Municipio
The most common earnings brackets in San Juan Municipio are $100,000+ for men (6,253 | 8.6%) and $25,000 to $29,999 for women (5,371 | 7.7%).
| Income | Male | Female |
| $2,499 or less | 4,525 (6.2%) | 4,961 (7.1%) |
| $2,500 to $4,999 | 3,782 (5.2%) | 4,501 (6.5%) |
| $5,000 to $7,499 | 4,093 (5.6%) | 4,594 (6.6%) |
| $7,500 to $9,999 | 3,988 (5.5%) | 3,638 (5.2%) |
| $10,000 to $12,499 | 4,055 (5.6%) | 3,845 (5.5%) |
| $12,500 to $14,999 | 3,925 (5.4%) | 3,167 (4.5%) |
| $15,000 to $17,499 | 4,679 (6.5%) | 4,332 (6.2%) |
| $17,500 to $19,999 | 4,326 (6.0%) | 3,872 (5.6%) |
| $20,000 to $22,499 | 3,351 (4.6%) | 3,461 (5.0%) |
| $22,500 to $24,999 | 2,953 (4.1%) | 3,277 (4.7%) |
| $25,000 to $29,999 | 5,289 (7.3%) | 5,371 (7.7%) |
| $30,000 to $34,999 | 3,516 (4.9%) | 4,116 (5.9%) |
| $35,000 to $39,999 | 2,655 (3.7%) | 3,377 (4.9%) |
| $40,000 to $44,999 | 2,641 (3.6%) | 2,943 (4.2%) |
| $45,000 to $49,999 | 2,151 (3.0%) | 2,153 (3.1%) |
| $50,000 to $54,999 | 1,763 (2.4%) | 1,636 (2.4%) |
| $55,000 to $64,999 | 2,963 (4.1%) | 2,284 (3.3%) |
| $65,000 to $74,999 | 2,228 (3.1%) | 2,087 (3.0%) |
| $75,000 to $99,999 | 3,425 (4.7%) | 2,514 (3.6%) |
| $100,000+ | 6,253 (8.6%) | 3,454 (5.0%) |
| Total | 72,561 (100.0%) | 69,583 (100.0%) |
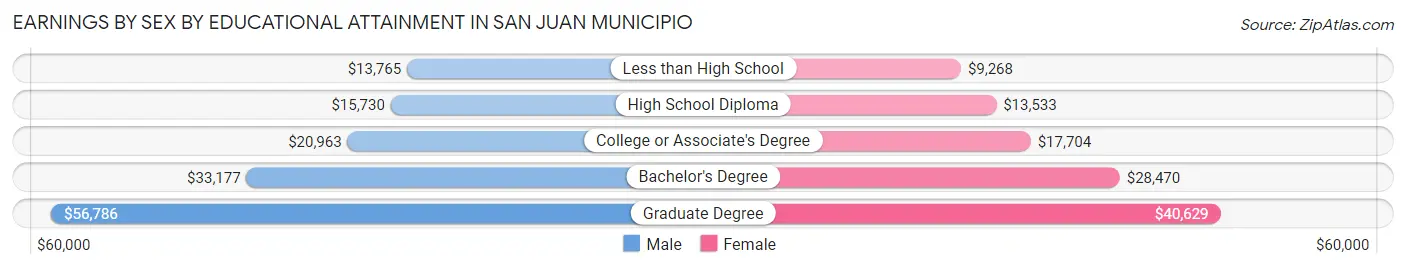
Earnings by Sex by Educational Attainment in San Juan Municipio
Average earnings in San Juan Municipio are $24,827 for men and $23,687 for women, a difference of 4.6%. Men with an educational attainment of graduate degree enjoy the highest average annual earnings of $56,786, while those with less than high school education earn the least with $13,765. Women with an educational attainment of graduate degree earn the most with the average annual earnings of $40,629, while those with less than high school education have the smallest earnings of $9,268.
| Educational Attainment | Male Income | Female Income |
| Less than High School | $13,765 | $9,268 |
| High School Diploma | $15,730 | $13,533 |
| College or Associate's Degree | $20,963 | $17,704 |
| Bachelor's Degree | $33,177 | $28,470 |
| Graduate Degree | $56,786 | $40,629 |
| Total | $24,827 | $23,687 |
Family Income in San Juan Municipio
Family Income Brackets in San Juan Municipio
According to the San Juan Municipio family income data, there are 16,235 families falling into the less than $10,000 income range, which is the most common income bracket and makes up 20.6% of all families. Conversely, the $150,000 to $199,999 income bracket is the least frequent group with only 2,443 families (3.1%) belonging to this category.
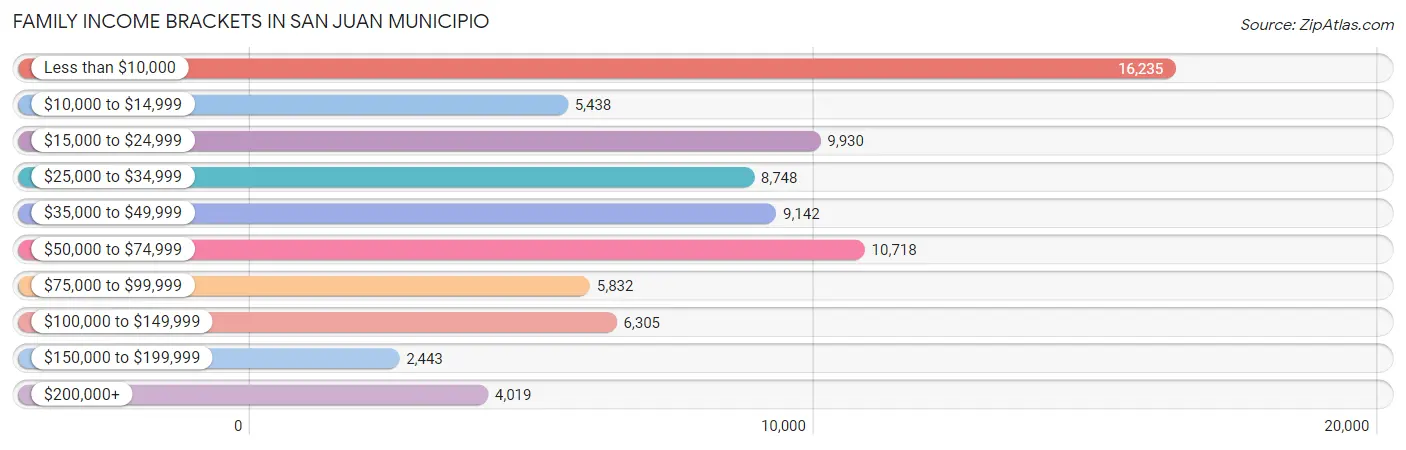
| Income Bracket | # Families | % Families |
| Less than $10,000 | 16,235 | 20.6% |
| $10,000 to $14,999 | 5,438 | 6.9% |
| $15,000 to $24,999 | 9,930 | 12.6% |
| $25,000 to $34,999 | 8,748 | 11.1% |
| $35,000 to $49,999 | 9,142 | 11.6% |
| $50,000 to $74,999 | 10,718 | 13.6% |
| $75,000 to $99,999 | 5,832 | 7.4% |
| $100,000 to $149,999 | 6,305 | 8.0% |
| $150,000 to $199,999 | 2,443 | 3.1% |
| $200,000+ | 4,019 | 5.1% |
Family Income by Famaliy Size in San Juan Municipio
7+ person families (319 | 0.4%) account for the highest median family income in San Juan Municipio with $87,898 per family, while 2-person families (41,005 | 52.0%) have the highest median income of $15,799 per family member.
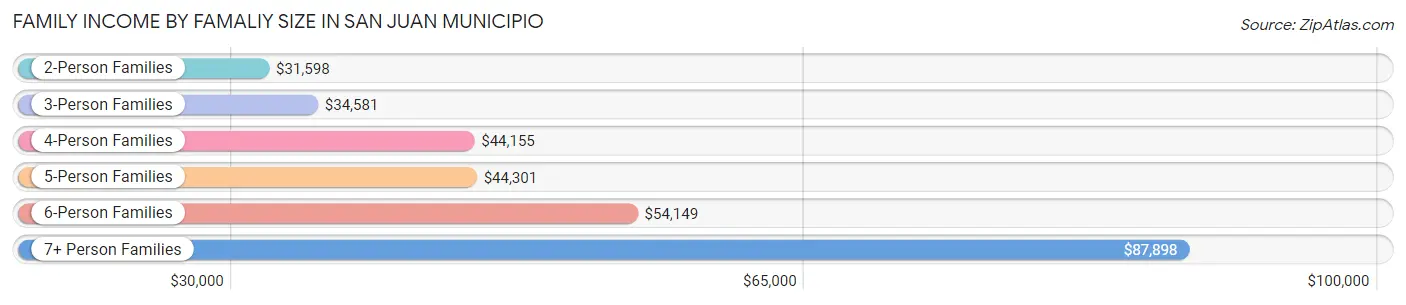
| Income Bracket | # Families | Median Income |
| 2-Person Families | 41,005 (52.0%) | $31,598 |
| 3-Person Families | 21,895 (27.8%) | $34,581 |
| 4-Person Families | 11,334 (14.4%) | $44,155 |
| 5-Person Families | 3,318 (4.2%) | $44,301 |
| 6-Person Families | 939 (1.2%) | $54,149 |
| 7+ Person Families | 319 (0.4%) | $87,898 |
| Total | 78,810 (100.0%) | $33,876 |
Family Income by Number of Earners in San Juan Municipio
The median family income in San Juan Municipio is $33,876, with families comprising 3+ earners (4,046) having the highest median family income of $91,250, while families with no earners (23,460) have the lowest median family income of $13,600, accounting for 5.1% and 29.8% of families, respectively.
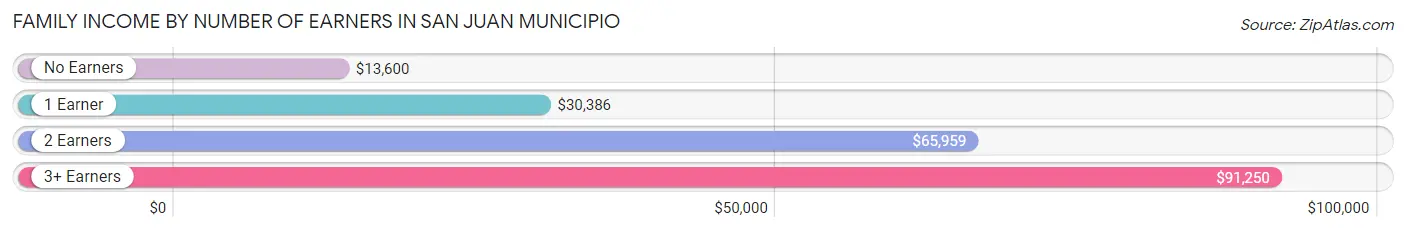
| Number of Earners | # Families | Median Income |
| No Earners | 23,460 (29.8%) | $13,600 |
| 1 Earner | 30,279 (38.4%) | $30,386 |
| 2 Earners | 21,025 (26.7%) | $65,959 |
| 3+ Earners | 4,046 (5.1%) | $91,250 |
| Total | 78,810 (100.0%) | $33,876 |
Household Income in San Juan Municipio
Household Income Brackets in San Juan Municipio
With 36,908 households falling in the category, the less than $10,000 income range is the most frequent in San Juan Municipio, accounting for 25.1% of all households. In contrast, only 3,382 households (2.3%) fall into the $150,000 to $199,999 income bracket, making it the least populous group.
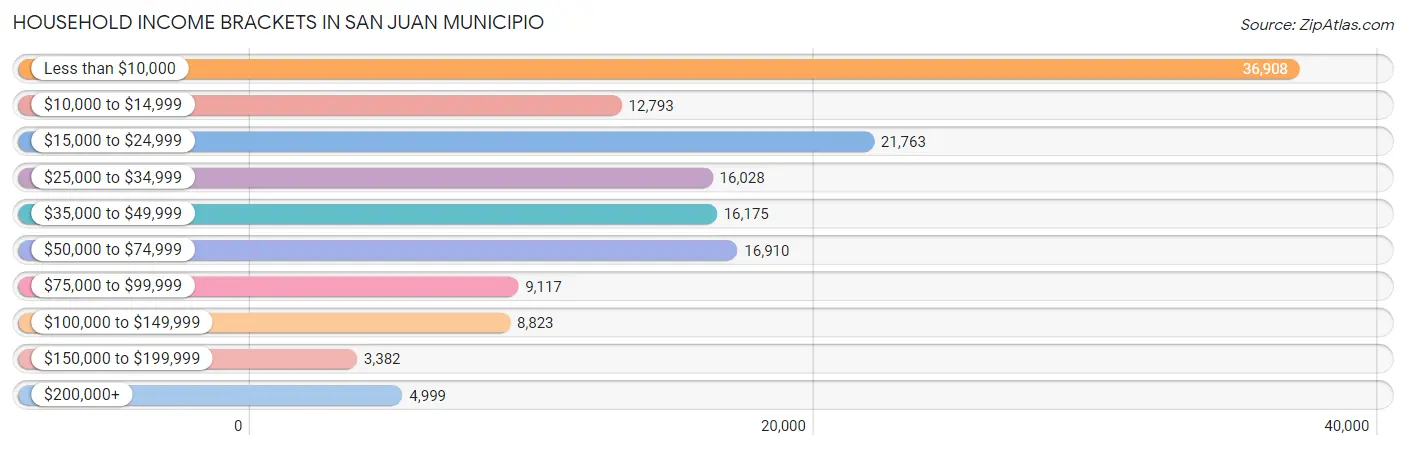
| Income Bracket | # Households | % Households |
| Less than $10,000 | 36,908 | 25.1% |
| $10,000 to $14,999 | 12,793 | 8.7% |
| $15,000 to $24,999 | 21,763 | 14.8% |
| $25,000 to $34,999 | 16,028 | 10.9% |
| $35,000 to $49,999 | 16,175 | 11.0% |
| $50,000 to $74,999 | 16,910 | 11.5% |
| $75,000 to $99,999 | 9,117 | 6.2% |
| $100,000 to $149,999 | 8,823 | 6.0% |
| $150,000 to $199,999 | 3,382 | 2.3% |
| $200,000+ | 4,999 | 3.4% |
Household Income by Householder Age in San Juan Municipio
The median household income in San Juan Municipio is $26,111, with the highest median household income of $33,600 found in the 45 to 64 years age bracket for the primary householder. A total of 51,775 households (35.2%) fall into this category. Meanwhile, the 15 to 24 years age bracket for the primary householder has the lowest median household income of $5,650, with 4,076 households (2.8%) in this group.
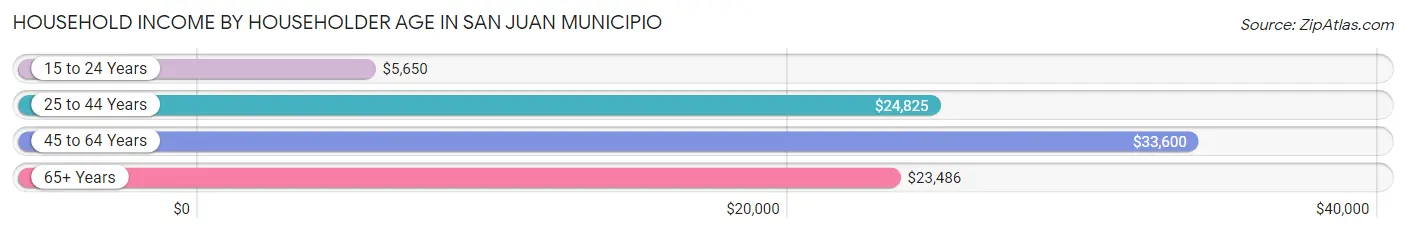
| Income Bracket | # Households | Median Income |
| 15 to 24 Years | 4,076 (2.8%) | $5,650 |
| 25 to 44 Years | 37,893 (25.8%) | $24,825 |
| 45 to 64 Years | 51,775 (35.2%) | $33,600 |
| 65+ Years | 53,300 (36.2%) | $23,486 |
| Total | 147,044 (100.0%) | $26,111 |
Poverty in San Juan Municipio
Income Below Poverty by Sex and Age in San Juan Municipio
With 37.3% poverty level for males and 41.4% for females among the residents of San Juan Municipio, 6 to 11 year old males and 12 to 14 year old females are the most vulnerable to poverty, with 5,995 males (64.5%) and 3,252 females (62.4%) in their respective age groups living below the poverty level.
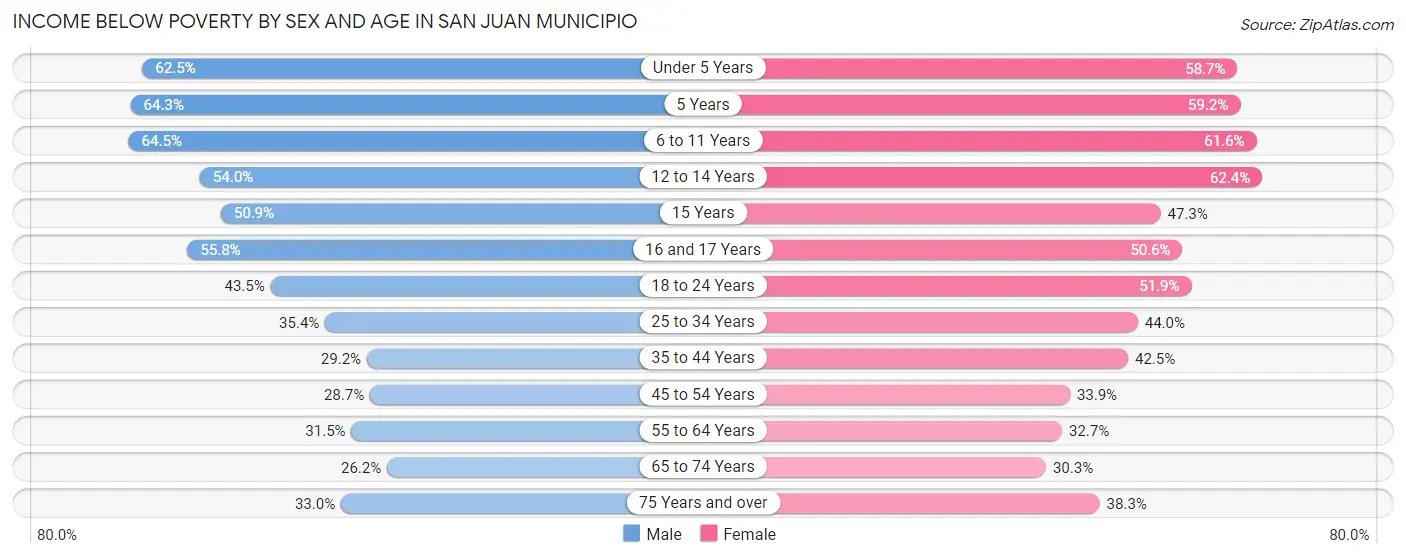
| Age Bracket | Male | Female |
| Under 5 Years | 3,921 (62.5%) | 3,483 (58.7%) |
| 5 Years | 1,037 (64.2%) | 750 (59.2%) |
| 6 to 11 Years | 5,995 (64.5%) | 5,739 (61.6%) |
| 12 to 14 Years | 2,671 (54.0%) | 3,252 (62.4%) |
| 15 Years | 1,104 (50.8%) | 998 (47.3%) |
| 16 and 17 Years | 1,941 (55.8%) | 1,837 (50.6%) |
| 18 to 24 Years | 6,487 (43.5%) | 8,238 (51.9%) |
| 25 to 34 Years | 7,199 (35.4%) | 9,877 (44.0%) |
| 35 to 44 Years | 5,195 (29.2%) | 9,040 (42.5%) |
| 45 to 54 Years | 5,562 (28.7%) | 7,552 (33.9%) |
| 55 to 64 Years | 6,433 (31.5%) | 8,271 (32.7%) |
| 65 to 74 Years | 4,404 (26.2%) | 7,095 (30.3%) |
| 75 Years and over | 5,236 (33.0%) | 9,269 (38.3%) |
| Total | 57,185 (37.3%) | 75,401 (41.4%) |
Income Above Poverty by Sex and Age in San Juan Municipio
According to the poverty statistics in San Juan Municipio, males aged 65 to 74 years and females aged 65 to 74 years are the age groups that are most secure financially, with 73.8% of males and 69.7% of females in these age groups living above the poverty line.
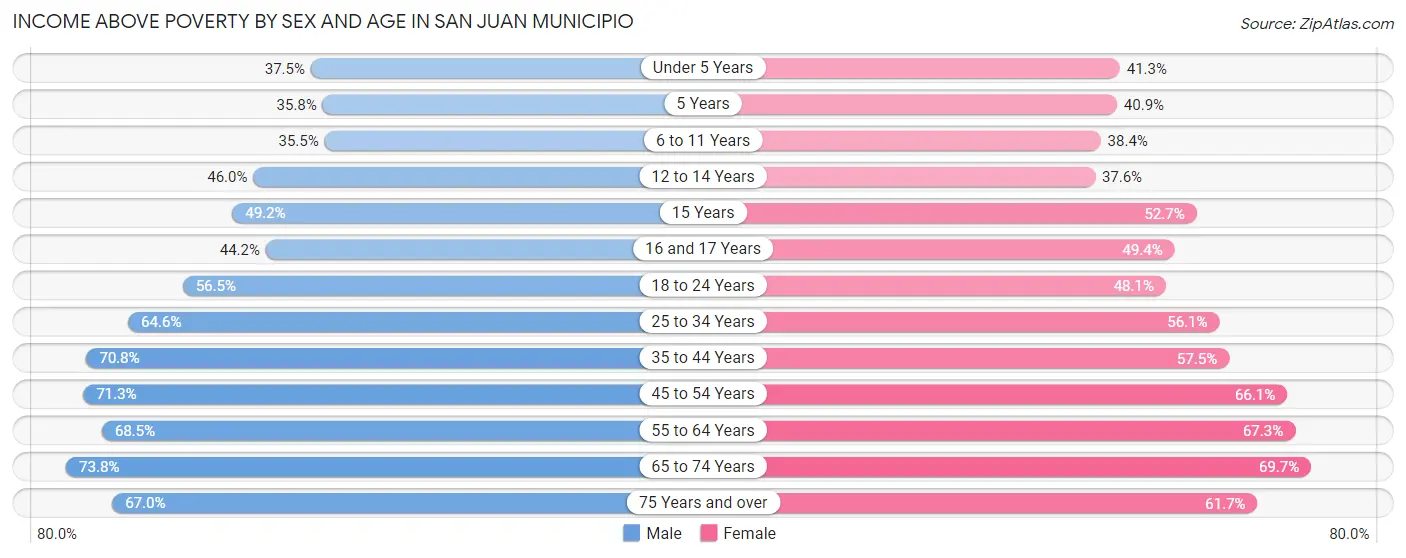
| Age Bracket | Male | Female |
| Under 5 Years | 2,353 (37.5%) | 2,449 (41.3%) |
| 5 Years | 577 (35.7%) | 518 (40.8%) |
| 6 to 11 Years | 3,294 (35.5%) | 3,584 (38.4%) |
| 12 to 14 Years | 2,279 (46.0%) | 1,959 (37.6%) |
| 15 Years | 1,067 (49.1%) | 1,110 (52.7%) |
| 16 and 17 Years | 1,536 (44.2%) | 1,795 (49.4%) |
| 18 to 24 Years | 8,431 (56.5%) | 7,636 (48.1%) |
| 25 to 34 Years | 13,152 (64.6%) | 12,598 (56.0%) |
| 35 to 44 Years | 12,615 (70.8%) | 12,231 (57.5%) |
| 45 to 54 Years | 13,814 (71.3%) | 14,738 (66.1%) |
| 55 to 64 Years | 14,010 (68.5%) | 17,011 (67.3%) |
| 65 to 74 Years | 12,415 (73.8%) | 16,304 (69.7%) |
| 75 Years and over | 10,620 (67.0%) | 14,939 (61.7%) |
| Total | 96,163 (62.7%) | 106,872 (58.6%) |
Income Below Poverty Among Married-Couple Families in San Juan Municipio
The poverty statistics for married-couple families in San Juan Municipio show that 17.7% or 6,633 of the total 37,528 families live below the poverty line. Families with 5 or more children have the highest poverty rate of 61.8%, comprising of 42 families. On the other hand, families with no children have the lowest poverty rate of 15.4%, which includes 4,200 families.
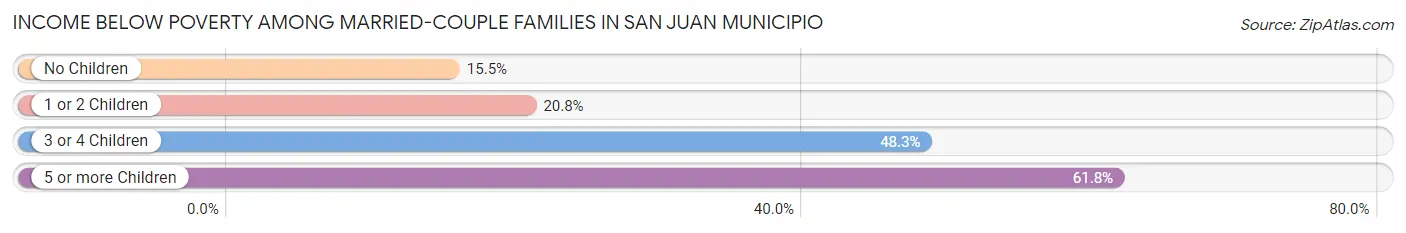
| Children | Above Poverty | Below Poverty |
| No Children | 22,989 (84.6%) | 4,200 (15.4%) |
| 1 or 2 Children | 7,398 (79.2%) | 1,940 (20.8%) |
| 3 or 4 Children | 482 (51.7%) | 451 (48.3%) |
| 5 or more Children | 26 (38.2%) | 42 (61.8%) |
| Total | 30,895 (82.3%) | 6,633 (17.7%) |
Income Below Poverty Among Single-Parent Households in San Juan Municipio
According to the poverty data in San Juan Municipio, 36.0% or 2,904 single-father households and 57.8% or 19,185 single-mother households are living below the poverty line. Among single-father households, those with 5 or more children have the highest poverty rate, with 22 households (100.0%) experiencing poverty. Likewise, among single-mother households, those with 5 or more children have the highest poverty rate, with 38 households (100.0%) falling below the poverty line.
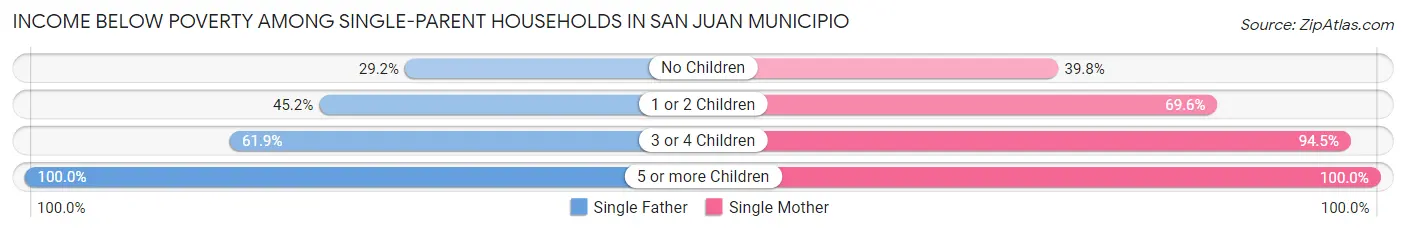
| Children | Single Father | Single Mother |
| No Children | 1,467 (29.2%) | 6,089 (39.8%) |
| 1 or 2 Children | 1,220 (45.2%) | 10,743 (69.6%) |
| 3 or 4 Children | 195 (61.9%) | 2,315 (94.5%) |
| 5 or more Children | 22 (100.0%) | 38 (100.0%) |
| Total | 2,904 (36.0%) | 19,185 (57.8%) |
Income Below Poverty Among Married-Couple vs Single-Parent Households in San Juan Municipio
The poverty data for San Juan Municipio shows that 6,633 of the married-couple family households (17.7%) and 22,089 of the single-parent households (53.5%) are living below the poverty level. Within the married-couple family households, those with 5 or more children have the highest poverty rate, with 42 households (61.8%) falling below the poverty line. Among the single-parent households, those with 5 or more children have the highest poverty rate, with 60 household (100.0%) living below poverty.
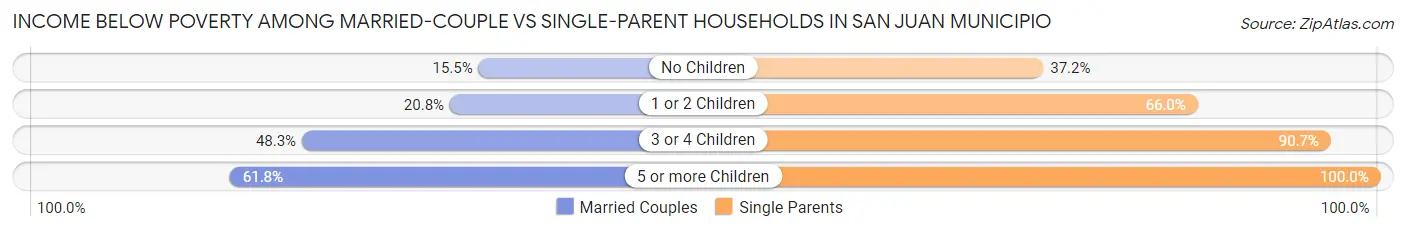
| Children | Married-Couple Families | Single-Parent Households |
| No Children | 4,200 (15.4%) | 7,556 (37.2%) |
| 1 or 2 Children | 1,940 (20.8%) | 11,963 (66.0%) |
| 3 or 4 Children | 451 (48.3%) | 2,510 (90.7%) |
| 5 or more Children | 42 (61.8%) | 60 (100.0%) |
| Total | 6,633 (17.7%) | 22,089 (53.5%) |
Race in San Juan Municipio
The most populous races in San Juan Municipio are Hispanic or Latino (333,821 | 97.9%), White / Caucasian (140,669 | 41.3%), and Some other Race (82,826 | 24.3%).
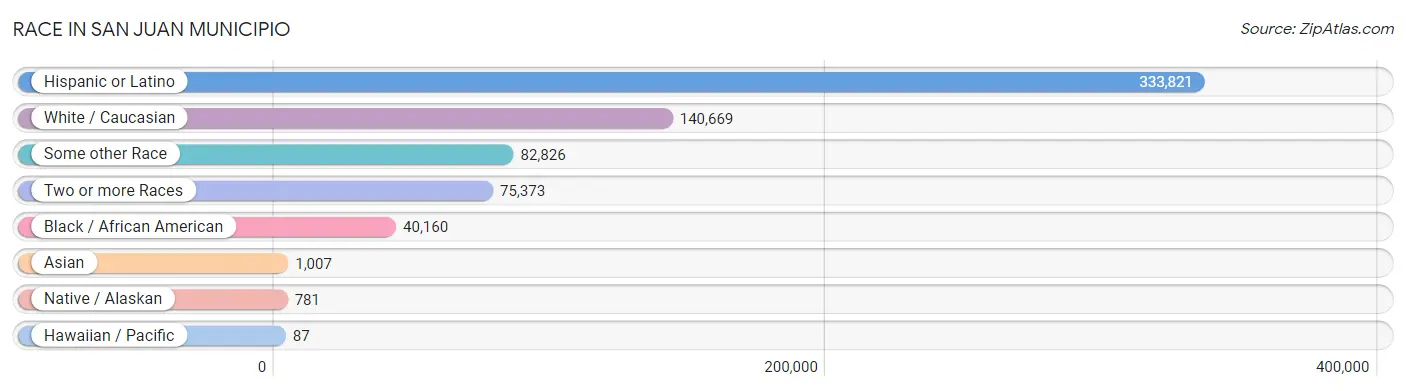
| Race | # Population | % Population |
| Asian | 1,007 | 0.3% |
| Black / African American | 40,160 | 11.8% |
| Hawaiian / Pacific | 87 | 0.0% |
| Hispanic or Latino | 333,821 | 97.9% |
| Native / Alaskan | 781 | 0.2% |
| White / Caucasian | 140,669 | 41.3% |
| Two or more Races | 75,373 | 22.1% |
| Some other Race | 82,826 | 24.3% |
| Total | 340,903 | 100.0% |
Ancestry in San Juan Municipio
The most populous ancestries reported in San Juan Municipio are Puerto Rican (291,660 | 85.6%), Dominican (29,337 | 8.6%), American (5,247 | 1.5%), Cuban (4,259 | 1.3%), and South American (3,363 | 1.0%), together accounting for 97.9% of all San Juan Municipio residents.
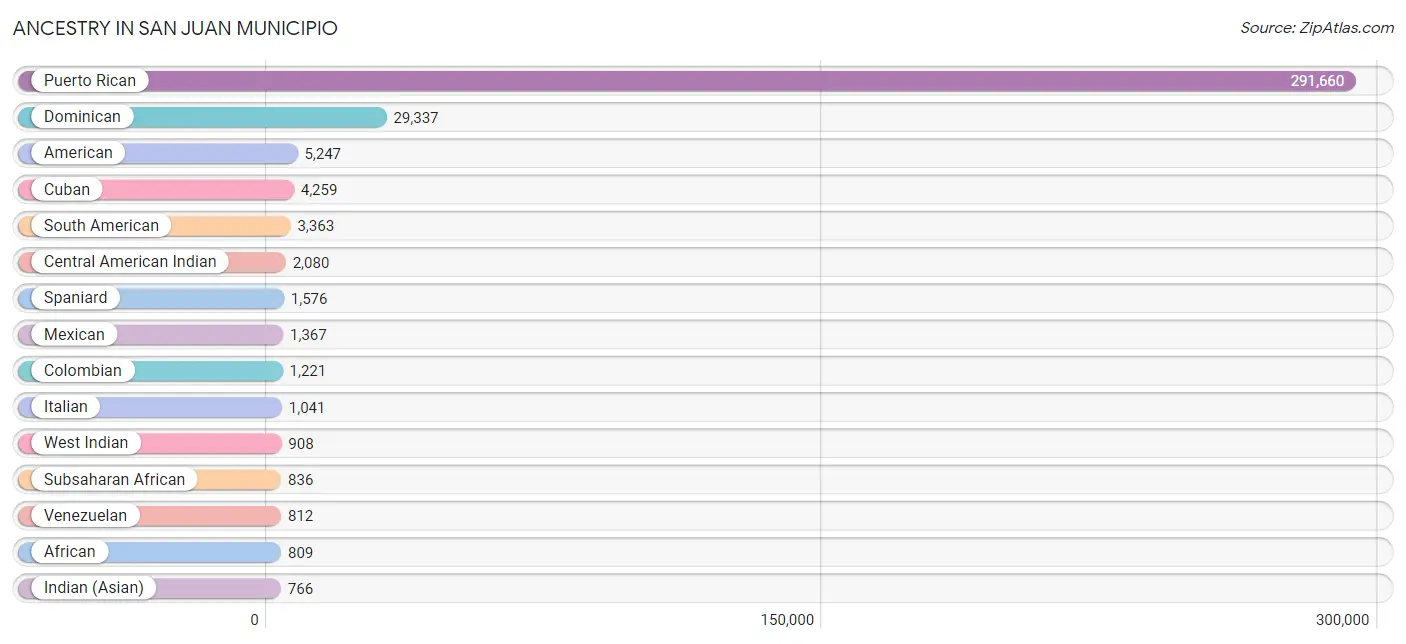
| Ancestry | # Population | % Population |
| African | 809 | 0.2% |
| American | 5,247 | 1.5% |
| Arab | 289 | 0.1% |
| Argentinean | 382 | 0.1% |
| Australian | 32 | 0.0% |
| Austrian | 12 | 0.0% |
| Barbadian | 18 | 0.0% |
| Basque | 26 | 0.0% |
| Belgian | 26 | 0.0% |
| Bhutanese | 53 | 0.0% |
| Bolivian | 12 | 0.0% |
| Brazilian | 124 | 0.0% |
| British | 154 | 0.1% |
| British West Indian | 94 | 0.0% |
| Bulgarian | 17 | 0.0% |
| Burmese | 43 | 0.0% |
| Canadian | 6 | 0.0% |
| Central American | 660 | 0.2% |
| Central American Indian | 2,080 | 0.6% |
| Chilean | 245 | 0.1% |
| Colombian | 1,221 | 0.4% |
| Costa Rican | 234 | 0.1% |
| Cuban | 4,259 | 1.3% |
| Czech | 45 | 0.0% |
| Czechoslovakian | 16 | 0.0% |
| Dominican | 29,337 | 8.6% |
| Dutch | 26 | 0.0% |
| Dutch West Indian | 18 | 0.0% |
| Ecuadorian | 197 | 0.1% |
| English | 329 | 0.1% |
| European | 521 | 0.2% |
| French | 761 | 0.2% |
| French Canadian | 48 | 0.0% |
| German | 697 | 0.2% |
| Greek | 70 | 0.0% |
| Guatemalan | 38 | 0.0% |
| Haitian | 37 | 0.0% |
| Honduran | 177 | 0.1% |
| Hungarian | 48 | 0.0% |
| Indian (Asian) | 766 | 0.2% |
| Irish | 387 | 0.1% |
| Israeli | 53 | 0.0% |
| Italian | 1,041 | 0.3% |
| Jamaican | 58 | 0.0% |
| Korean | 90 | 0.0% |
| Lebanese | 85 | 0.0% |
| Liberian | 12 | 0.0% |
| Lithuanian | 14 | 0.0% |
| Mexican | 1,367 | 0.4% |
| Mexican American Indian | 29 | 0.0% |
| Native Hawaiian | 56 | 0.0% |
| Nicaraguan | 45 | 0.0% |
| Norwegian | 35 | 0.0% |
| Palestinian | 25 | 0.0% |
| Panamanian | 104 | 0.0% |
| Peruvian | 369 | 0.1% |
| Polish | 115 | 0.0% |
| Portuguese | 121 | 0.0% |
| Pueblo | 12 | 0.0% |
| Puerto Rican | 291,660 | 85.6% |
| Russian | 36 | 0.0% |
| Salvadoran | 62 | 0.0% |
| Scotch-Irish | 17 | 0.0% |
| Scottish | 102 | 0.0% |
| Serbian | 9 | 0.0% |
| South American | 3,363 | 1.0% |
| South American Indian | 67 | 0.0% |
| Spaniard | 1,576 | 0.5% |
| Spanish | 62 | 0.0% |
| Spanish American Indian | 12 | 0.0% |
| Subsaharan African | 836 | 0.3% |
| Swedish | 50 | 0.0% |
| Swiss | 34 | 0.0% |
| Thai | 283 | 0.1% |
| Trinidadian and Tobagonian | 36 | 0.0% |
| U.S. Virgin Islander | 136 | 0.0% |
| Ukrainian | 19 | 0.0% |
| Uruguayan | 125 | 0.0% |
| Venezuelan | 812 | 0.2% |
| West Indian | 908 | 0.3% | View All 80 Rows |
Immigrants in San Juan Municipio

| Immigration Origin | # Population | % Population | View All 0 Rows |
Sex and Age in San Juan Municipio
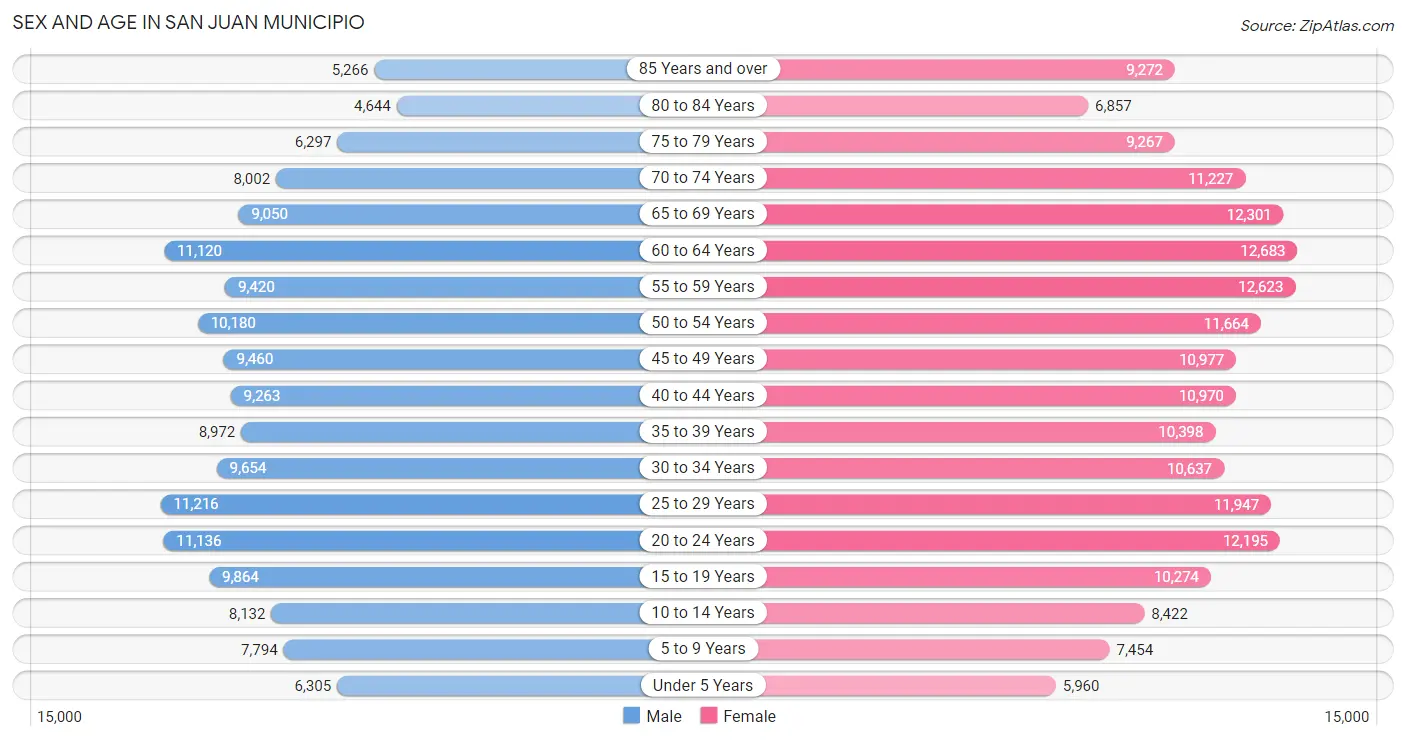
Sex and Age in San Juan Municipio
The most populous age groups in San Juan Municipio are 25 to 29 Years (11,216 | 7.2%) for men and 60 to 64 Years (12,683 | 6.9%) for women.
| Age Bracket | Male | Female |
| Under 5 Years | 6,305 (4.1%) | 5,960 (3.2%) |
| 5 to 9 Years | 7,794 (5.0%) | 7,454 (4.0%) |
| 10 to 14 Years | 8,132 (5.2%) | 8,422 (4.5%) |
| 15 to 19 Years | 9,864 (6.3%) | 10,274 (5.6%) |
| 20 to 24 Years | 11,136 (7.1%) | 12,195 (6.6%) |
| 25 to 29 Years | 11,216 (7.2%) | 11,947 (6.5%) |
| 30 to 34 Years | 9,654 (6.2%) | 10,637 (5.8%) |
| 35 to 39 Years | 8,972 (5.8%) | 10,398 (5.6%) |
| 40 to 44 Years | 9,263 (5.9%) | 10,970 (5.9%) |
| 45 to 49 Years | 9,460 (6.1%) | 10,977 (5.9%) |
| 50 to 54 Years | 10,180 (6.5%) | 11,664 (6.3%) |
| 55 to 59 Years | 9,420 (6.0%) | 12,623 (6.8%) |
| 60 to 64 Years | 11,120 (7.1%) | 12,683 (6.9%) |
| 65 to 69 Years | 9,050 (5.8%) | 12,301 (6.6%) |
| 70 to 74 Years | 8,002 (5.1%) | 11,227 (6.1%) |
| 75 to 79 Years | 6,297 (4.0%) | 9,267 (5.0%) |
| 80 to 84 Years | 4,644 (3.0%) | 6,857 (3.7%) |
| 85 Years and over | 5,266 (3.4%) | 9,272 (5.0%) |
| Total | 155,775 (100.0%) | 185,128 (100.0%) |
Families and Households in San Juan Municipio
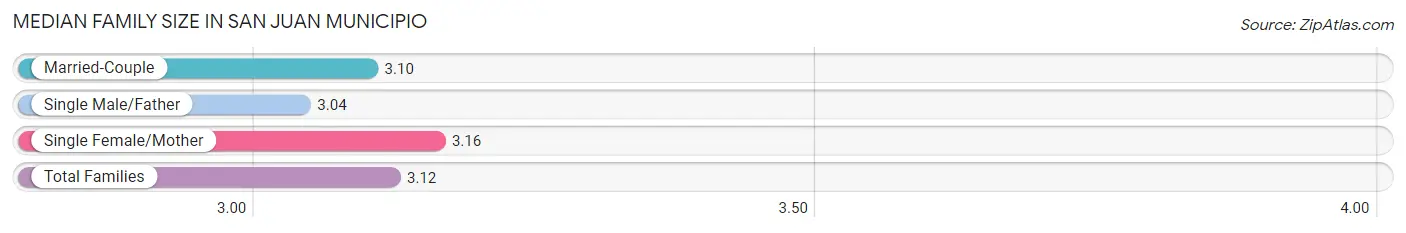
Median Family Size in San Juan Municipio
The median family size in San Juan Municipio is 3.12 persons per family, with single female/mother families (33,214 | 42.1%) accounting for the largest median family size of 3.16 persons per family. On the other hand, single male/father families (8,068 | 10.2%) represent the smallest median family size with 3.04 persons per family.
| Family Type | # Families | Family Size |
| Married-Couple | 37,528 (47.6%) | 3.10 |
| Single Male/Father | 8,068 (10.2%) | 3.04 |
| Single Female/Mother | 33,214 (42.1%) | 3.16 |
| Total Families | 78,810 (100.0%) | 3.12 |
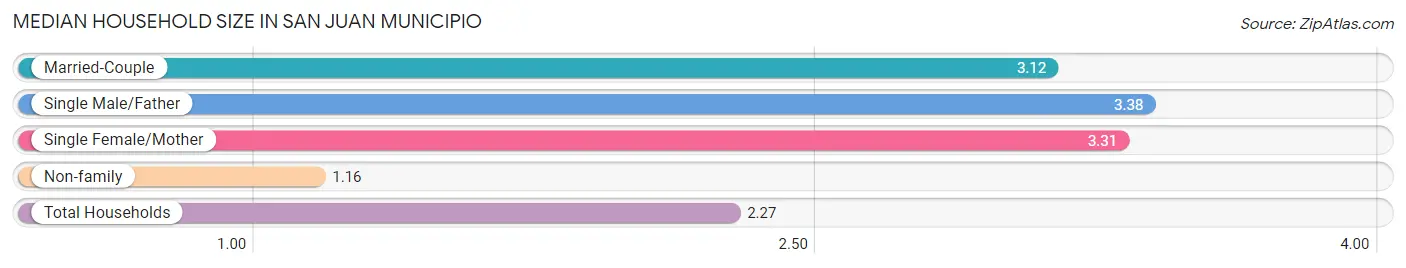
Median Household Size in San Juan Municipio
The median household size in San Juan Municipio is 2.27 persons per household, with single male/father households (8,068 | 5.5%) accounting for the largest median household size of 3.38 persons per household. non-family households (68,234 | 46.4%) represent the smallest median household size with 1.16 persons per household.
| Household Type | # Households | Household Size |
| Married-Couple | 37,528 (25.5%) | 3.12 |
| Single Male/Father | 8,068 (5.5%) | 3.38 |
| Single Female/Mother | 33,214 (22.6%) | 3.31 |
| Non-family | 68,234 (46.4%) | 1.16 |
| Total Households | 147,044 (100.0%) | 2.27 |
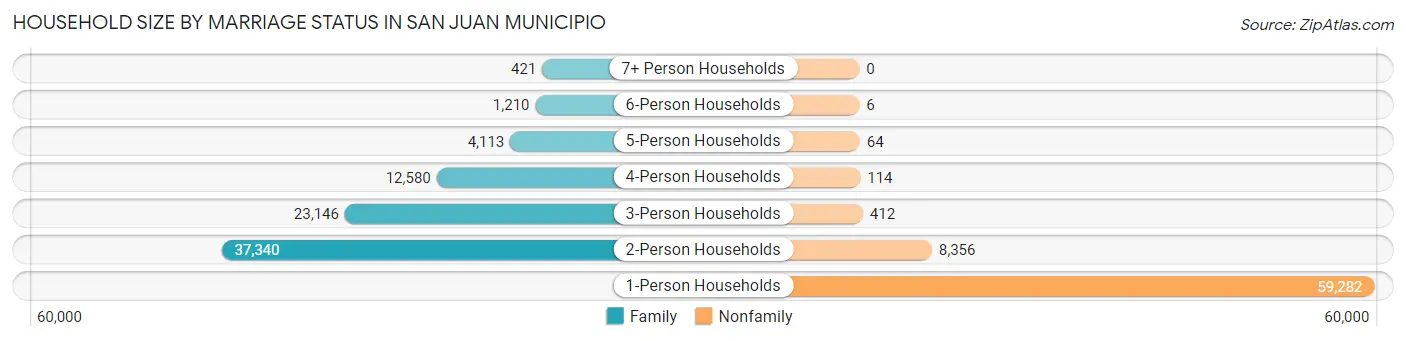
Household Size by Marriage Status in San Juan Municipio
Out of a total of 147,044 households in San Juan Municipio, 78,810 (53.6%) are family households, while 68,234 (46.4%) are nonfamily households. The most numerous type of family households are 2-person households, comprising 37,340, and the most common type of nonfamily households are 1-person households, comprising 59,282.
| Household Size | Family Households | Nonfamily Households |
| 1-Person Households | - | 59,282 (40.3%) |
| 2-Person Households | 37,340 (25.4%) | 8,356 (5.7%) |
| 3-Person Households | 23,146 (15.7%) | 412 (0.3%) |
| 4-Person Households | 12,580 (8.6%) | 114 (0.1%) |
| 5-Person Households | 4,113 (2.8%) | 64 (0.0%) |
| 6-Person Households | 1,210 (0.8%) | 6 (0.0%) |
| 7+ Person Households | 421 (0.3%) | 0 (0.0%) |
| Total | 78,810 (53.6%) | 68,234 (46.4%) |
Female Fertility in San Juan Municipio
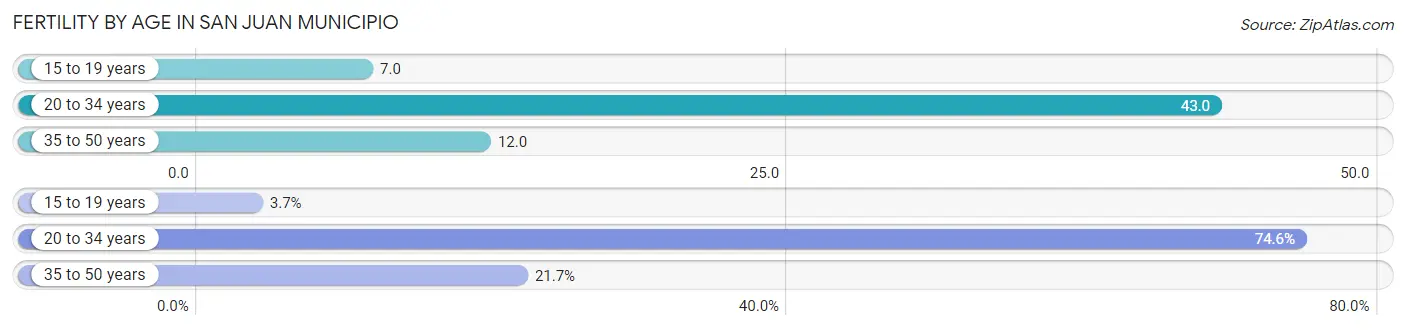
Fertility by Age in San Juan Municipio
Average fertility rate in San Juan Municipio is 25.0 births per 1,000 women. Women in the age bracket of 20 to 34 years have the highest fertility rate with 43.0 births per 1,000 women. Women in the age bracket of 20 to 34 years acount for 74.6% of all women with births.
| Age Bracket | Women with Births | Births / 1,000 Women |
| 15 to 19 years | 74 (3.7%) | 7.0 |
| 20 to 34 years | 1,484 (74.6%) | 43.0 |
| 35 to 50 years | 432 (21.7%) | 12.0 |
| Total | 1,990 (100.0%) | 25.0 |
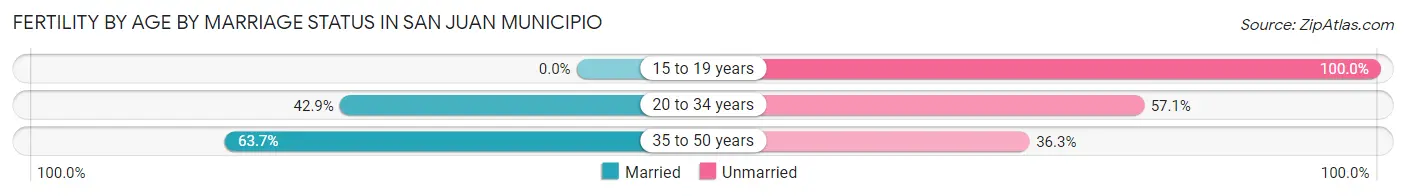
Fertility by Age by Marriage Status in San Juan Municipio
45.8% of women with births (1,990) in San Juan Municipio are married. The highest percentage of unmarried women with births falls into 15 to 19 years age bracket with 100.0% of them unmarried at the time of birth, while the lowest percentage of unmarried women with births belong to 35 to 50 years age bracket with 36.3% of them unmarried.
| Age Bracket | Married | Unmarried |
| 15 to 19 years | 0 (0.0%) | 74 (100.0%) |
| 20 to 34 years | 637 (42.9%) | 847 (57.1%) |
| 35 to 50 years | 275 (63.7%) | 157 (36.3%) |
| Total | 911 (45.8%) | 1,079 (54.2%) |
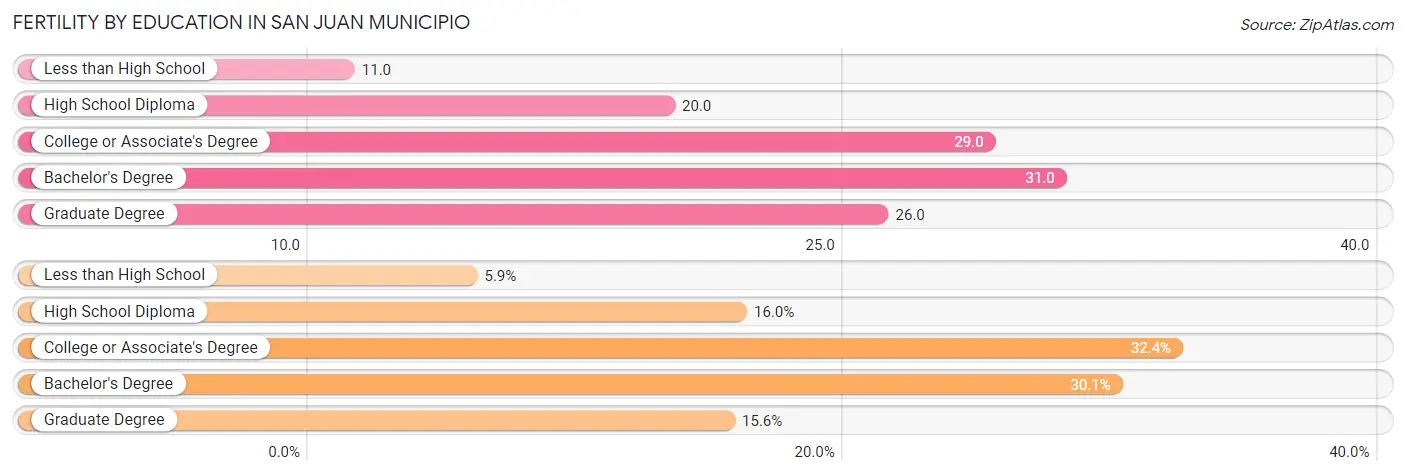
Fertility by Education in San Juan Municipio
Average fertility rate in San Juan Municipio is 25.0 births per 1,000 women. Women with the education attainment of bachelor's degree have the highest fertility rate of 31.0 births per 1,000 women, while women with the education attainment of less than high school have the lowest fertility at 11.0 births per 1,000 women. Women with the education attainment of college or associate's degree represent 32.4% of all women with births.
| Educational Attainment | Women with Births | Births / 1,000 Women |
| Less than High School | 118 (5.9%) | 11.0 |
| High School Diploma | 319 (16.0%) | 20.0 |
| College or Associate's Degree | 644 (32.4%) | 29.0 |
| Bachelor's Degree | 599 (30.1%) | 31.0 |
| Graduate Degree | 310 (15.6%) | 26.0 |
| Total | 1,990 (100.0%) | 25.0 |
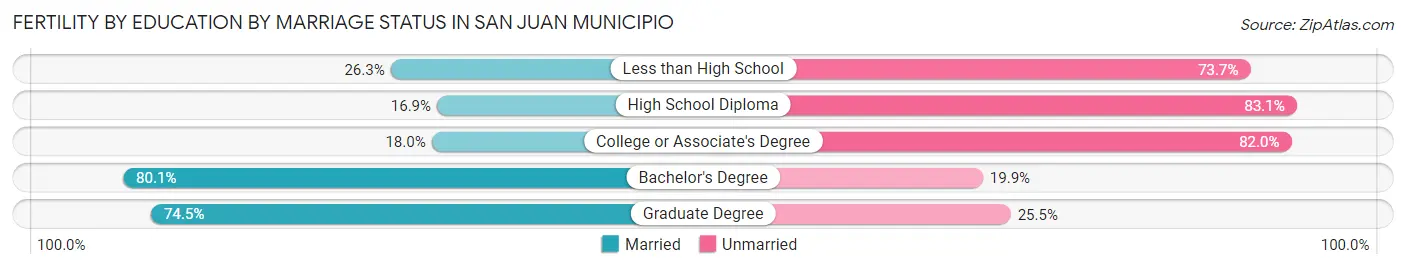
Fertility by Education by Marriage Status in San Juan Municipio
54.2% of women with births in San Juan Municipio are unmarried. Women with the educational attainment of bachelor's degree are most likely to be married with 80.1% of them married at childbirth, while women with the educational attainment of high school diploma are least likely to be married with 83.1% of them unmarried at childbirth.
| Educational Attainment | Married | Unmarried |
| Less than High School | 31 (26.3%) | 87 (73.7%) |
| High School Diploma | 54 (16.9%) | 265 (83.1%) |
| College or Associate's Degree | 116 (18.0%) | 528 (82.0%) |
| Bachelor's Degree | 480 (80.1%) | 119 (19.9%) |
| Graduate Degree | 231 (74.5%) | 79 (25.5%) |
| Total | 911 (45.8%) | 1,079 (54.2%) |
Employment Characteristics in San Juan Municipio
Employment by Class of Employer in San Juan Municipio
Among the 126,627 employed individuals in San Juan Municipio, private company employees (70,908 | 56.0%), self-employed (not incorporated) (20,691 | 16.3%), and state government employees (13,897 | 11.0%) make up the most common classes of employment.
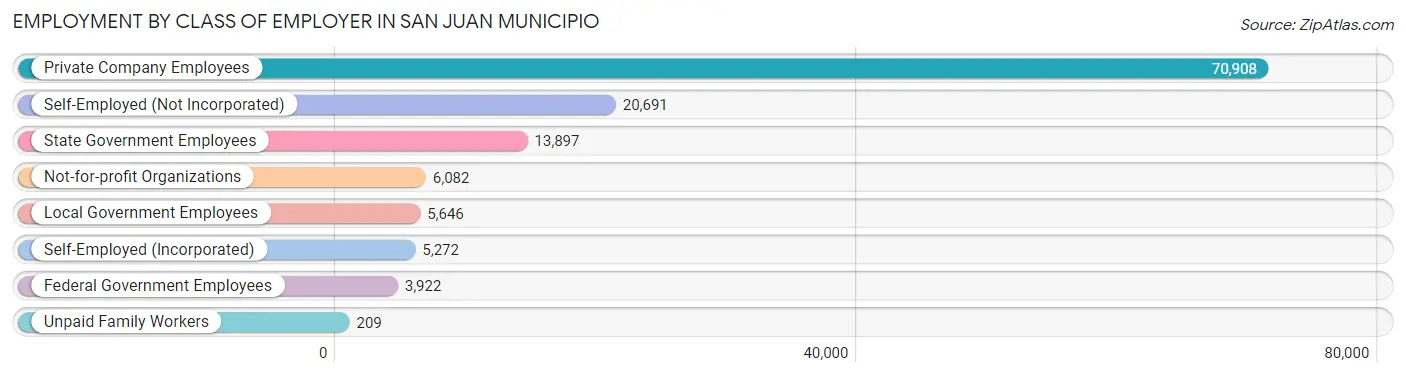
| Employer Class | # Employees | % Employees |
| Private Company Employees | 70,908 | 56.0% |
| Self-Employed (Incorporated) | 5,272 | 4.2% |
| Self-Employed (Not Incorporated) | 20,691 | 16.3% |
| Not-for-profit Organizations | 6,082 | 4.8% |
| Local Government Employees | 5,646 | 4.5% |
| State Government Employees | 13,897 | 11.0% |
| Federal Government Employees | 3,922 | 3.1% |
| Unpaid Family Workers | 209 | 0.2% |
| Total | 126,627 | 100.0% |
Employment Status by Age in San Juan Municipio
According to the labor force statistics for San Juan Municipio, out of the total population over 16 years of age (292,548), 52.3% or 153,003 individuals are in the labor force, with 15.7% or 24,021 of them unemployed. The age group with the highest labor force participation rate is 35 to 44 years, with 81.7% or 32,356 individuals in the labor force. Within the labor force, the 16 to 19 years age range has the highest percentage of unemployed individuals, with 51.0% or 1,843 of them being unemployed.
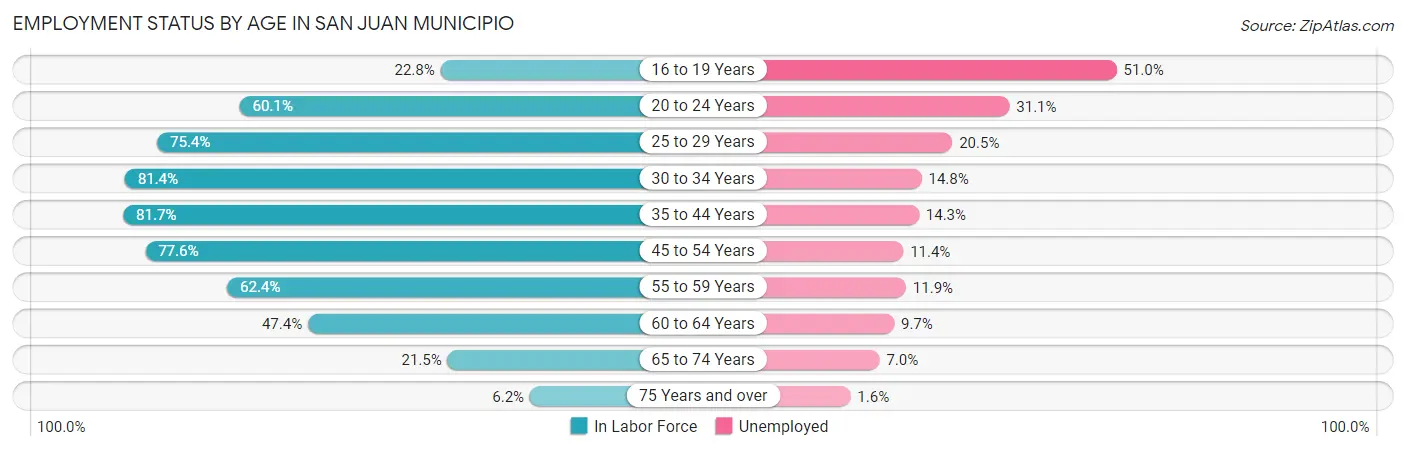
| Age Bracket | In Labor Force | Unemployed |
| 16 to 19 Years | 3,614 (22.8%) | 1,843 (51.0%) |
| 20 to 24 Years | 14,022 (60.1%) | 4,361 (31.1%) |
| 25 to 29 Years | 17,465 (75.4%) | 3,580 (20.5%) |
| 30 to 34 Years | 16,517 (81.4%) | 2,445 (14.8%) |
| 35 to 44 Years | 32,356 (81.7%) | 4,627 (14.3%) |
| 45 to 54 Years | 32,810 (77.6%) | 3,740 (11.4%) |
| 55 to 59 Years | 13,755 (62.4%) | 1,637 (11.9%) |
| 60 to 64 Years | 11,283 (47.4%) | 1,094 (9.7%) |
| 65 to 74 Years | 8,725 (21.5%) | 611 (7.0%) |
| 75 Years and over | 2,579 (6.2%) | 41 (1.6%) |
| Total | 153,003 (52.3%) | 24,021 (15.7%) |
Employment Status by Educational Attainment in San Juan Municipio
According to labor force statistics for San Juan Municipio, 72.5% of individuals (124,108) out of the total population between 25 and 64 years of age (171,184) are in the labor force, with 13.8% or 17,127 of them being unemployed. The group with the highest labor force participation rate are those with the educational attainment of bachelor's degree or higher, with 82.0% or 62,026 individuals in the labor force. Within the labor force, individuals with high school diploma education have the highest percentage of unemployment, with 24.7% or 5,693 of them being unemployed.
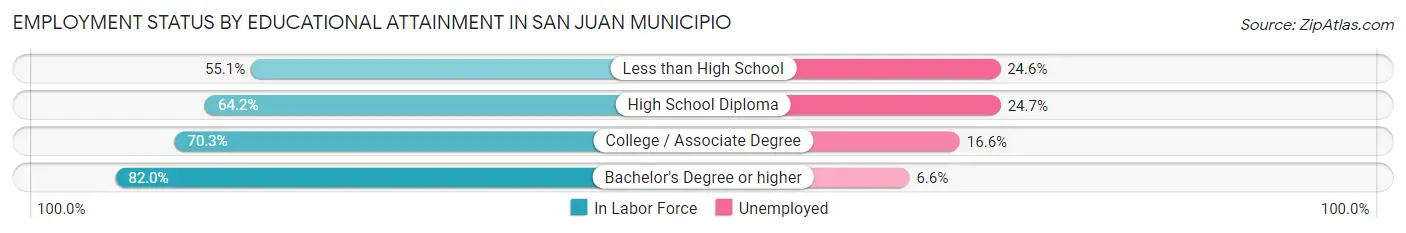
| Educational Attainment | In Labor Force | Unemployed |
| Less than High School | 10,587 (55.1%) | 4,727 (24.6%) |
| High School Diploma | 23,049 (64.2%) | 8,868 (24.7%) |
| College / Associate Degree | 28,419 (70.3%) | 6,711 (16.6%) |
| Bachelor's Degree or higher | 62,026 (82.0%) | 4,992 (6.6%) |
| Total | 124,108 (72.5%) | 23,623 (13.8%) |
Employment Occupations by Sex in San Juan Municipio
Management, Business, Science and Arts Occupations
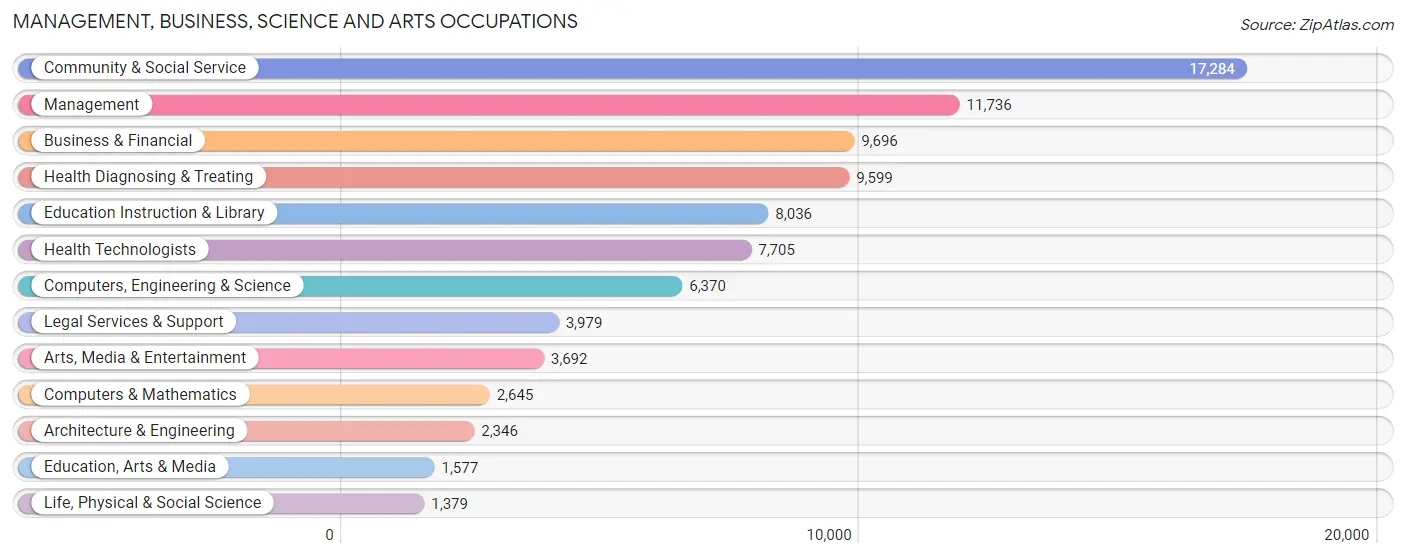
The most common Management, Business, Science and Arts occupations in San Juan Municipio are Community & Social Service (17,284 | 13.4%), Management (11,736 | 9.1%), Business & Financial (9,696 | 7.5%), Health Diagnosing & Treating (9,599 | 7.5%), and Education Instruction & Library (8,036 | 6.2%).
Management, Business, Science and Arts Occupations by Sex
Within the Management, Business, Science and Arts occupations in San Juan Municipio, the most male-oriented occupations are Architecture & Engineering (80.0%), Computers & Mathematics (69.6%), and Computers, Engineering & Science (66.1%), while the most female-oriented occupations are Life, Physical & Social Science (64.1%), Education Instruction & Library (63.5%), and Health Diagnosing & Treating (62.7%).
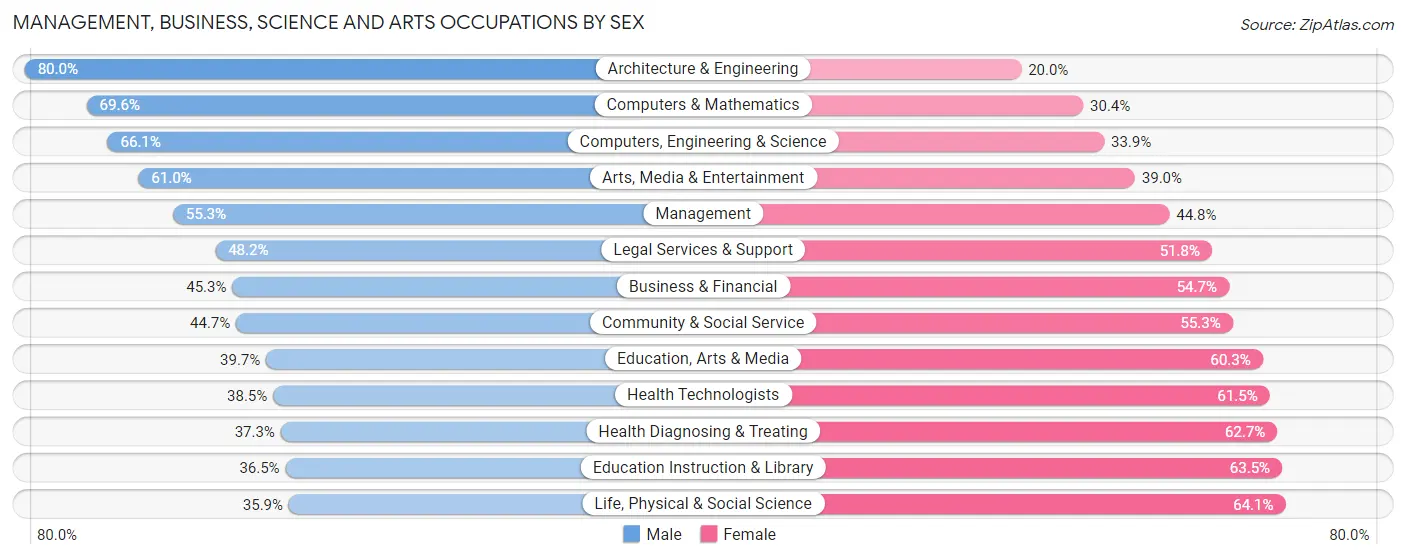
| Occupation | Male | Female |
| Management | 6,484 (55.2%) | 5,252 (44.8%) |
| Business & Financial | 4,396 (45.3%) | 5,300 (54.7%) |
| Computers, Engineering & Science | 4,213 (66.1%) | 2,157 (33.9%) |
| Computers & Mathematics | 1,842 (69.6%) | 803 (30.4%) |
| Architecture & Engineering | 1,876 (80.0%) | 470 (20.0%) |
| Life, Physical & Social Science | 495 (35.9%) | 884 (64.1%) |
| Community & Social Service | 7,726 (44.7%) | 9,558 (55.3%) |
| Education, Arts & Media | 626 (39.7%) | 951 (60.3%) |
| Legal Services & Support | 1,917 (48.2%) | 2,062 (51.8%) |
| Education Instruction & Library | 2,931 (36.5%) | 5,105 (63.5%) |
| Arts, Media & Entertainment | 2,252 (61.0%) | 1,440 (39.0%) |
| Health Diagnosing & Treating | 3,577 (37.3%) | 6,022 (62.7%) |
| Health Technologists | 2,969 (38.5%) | 4,736 (61.5%) |
| Total (Category) | 26,396 (48.3%) | 28,289 (51.7%) |
| Total (Overall) | 65,418 (50.8%) | 63,295 (49.2%) |
Services Occupations
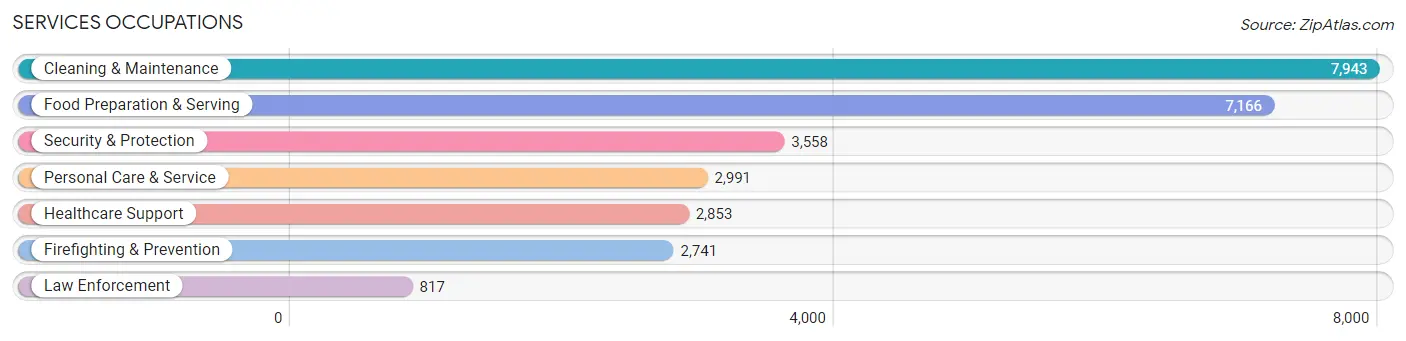
The most common Services occupations in San Juan Municipio are Cleaning & Maintenance (7,943 | 6.2%), Food Preparation & Serving (7,166 | 5.6%), Security & Protection (3,558 | 2.8%), Personal Care & Service (2,991 | 2.3%), and Healthcare Support (2,853 | 2.2%).
Services Occupations by Sex
Within the Services occupations in San Juan Municipio, the most male-oriented occupations are Law Enforcement (80.3%), Security & Protection (69.7%), and Firefighting & Prevention (66.6%), while the most female-oriented occupations are Healthcare Support (88.4%), Cleaning & Maintenance (61.6%), and Personal Care & Service (52.8%).
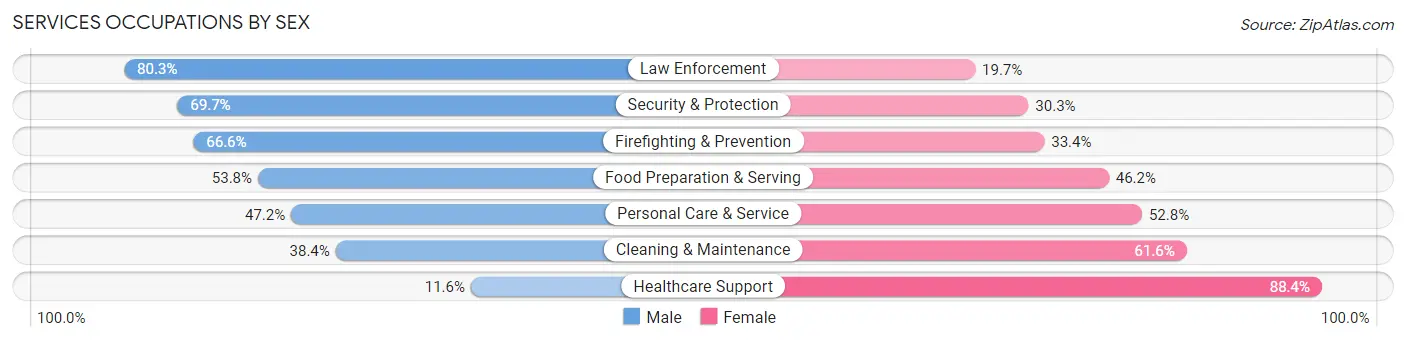
| Occupation | Male | Female |
| Healthcare Support | 332 (11.6%) | 2,521 (88.4%) |
| Security & Protection | 2,481 (69.7%) | 1,077 (30.3%) |
| Firefighting & Prevention | 1,825 (66.6%) | 916 (33.4%) |
| Law Enforcement | 656 (80.3%) | 161 (19.7%) |
| Food Preparation & Serving | 3,856 (53.8%) | 3,310 (46.2%) |
| Cleaning & Maintenance | 3,051 (38.4%) | 4,892 (61.6%) |
| Personal Care & Service | 1,413 (47.2%) | 1,578 (52.8%) |
| Total (Category) | 11,133 (45.4%) | 13,378 (54.6%) |
| Total (Overall) | 65,418 (50.8%) | 63,295 (49.2%) |
Sales and Office Occupations
The most common Sales and Office occupations in San Juan Municipio are Office & Administration (18,746 | 14.6%), and Sales & Related (13,433 | 10.4%).

Sales and Office Occupations by Sex
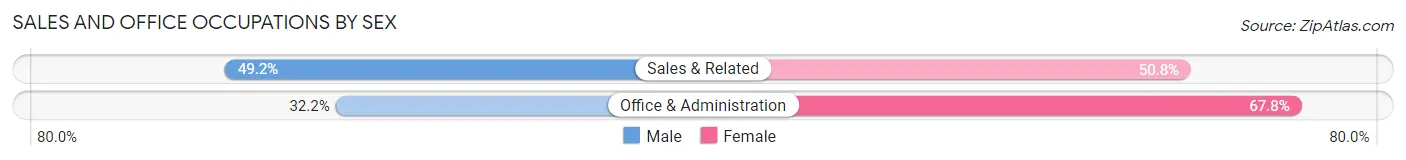
| Occupation | Male | Female |
| Sales & Related | 6,607 (49.2%) | 6,826 (50.8%) |
| Office & Administration | 6,031 (32.2%) | 12,715 (67.8%) |
| Total (Category) | 12,638 (39.3%) | 19,541 (60.7%) |
| Total (Overall) | 65,418 (50.8%) | 63,295 (49.2%) |
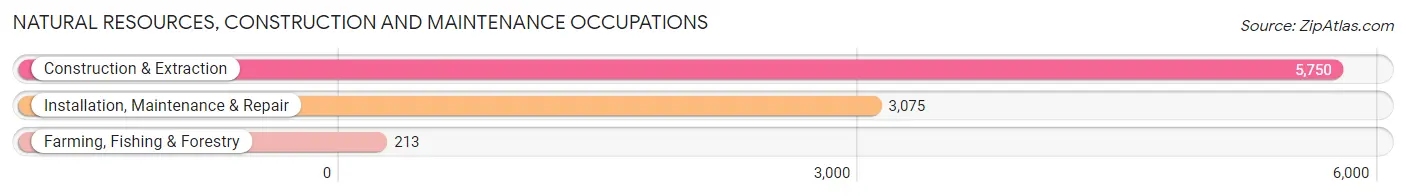
Natural Resources, Construction and Maintenance Occupations
The most common Natural Resources, Construction and Maintenance occupations in San Juan Municipio are Construction & Extraction (5,750 | 4.5%), Installation, Maintenance & Repair (3,075 | 2.4%), and Farming, Fishing & Forestry (213 | 0.2%).
Natural Resources, Construction and Maintenance Occupations by Sex
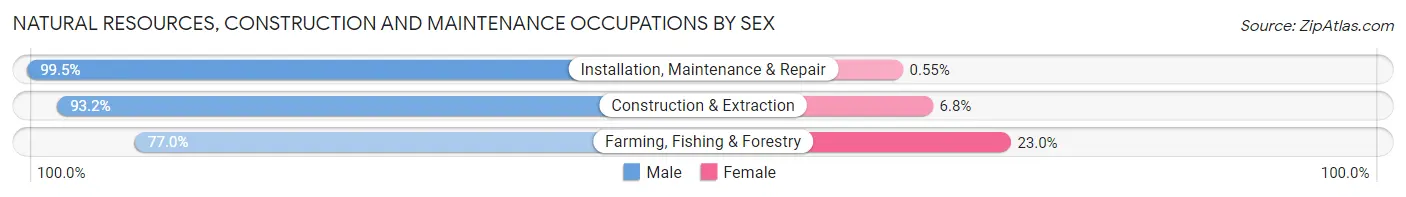
| Occupation | Male | Female |
| Farming, Fishing & Forestry | 164 (77.0%) | 49 (23.0%) |
| Construction & Extraction | 5,359 (93.2%) | 391 (6.8%) |
| Installation, Maintenance & Repair | 3,058 (99.5%) | 17 (0.5%) |
| Total (Category) | 8,581 (94.9%) | 457 (5.1%) |
| Total (Overall) | 65,418 (50.8%) | 63,295 (49.2%) |
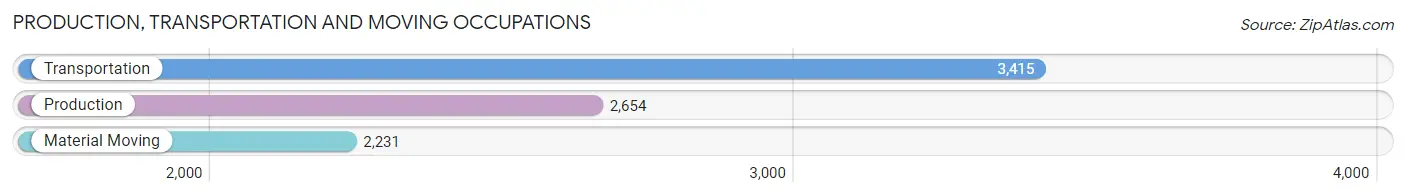
Production, Transportation and Moving Occupations
The most common Production, Transportation and Moving occupations in San Juan Municipio are Transportation (3,415 | 2.6%), Production (2,654 | 2.1%), and Material Moving (2,231 | 1.7%).
Production, Transportation and Moving Occupations by Sex
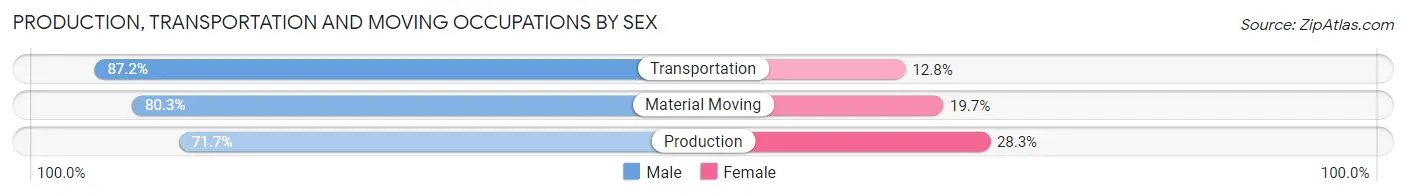
| Occupation | Male | Female |
| Production | 1,902 (71.7%) | 752 (28.3%) |
| Transportation | 2,977 (87.2%) | 438 (12.8%) |
| Material Moving | 1,791 (80.3%) | 440 (19.7%) |
| Total (Category) | 6,670 (80.4%) | 1,630 (19.6%) |
| Total (Overall) | 65,418 (50.8%) | 63,295 (49.2%) |
Employment Industries by Sex in San Juan Municipio
Employment Industries in San Juan Municipio
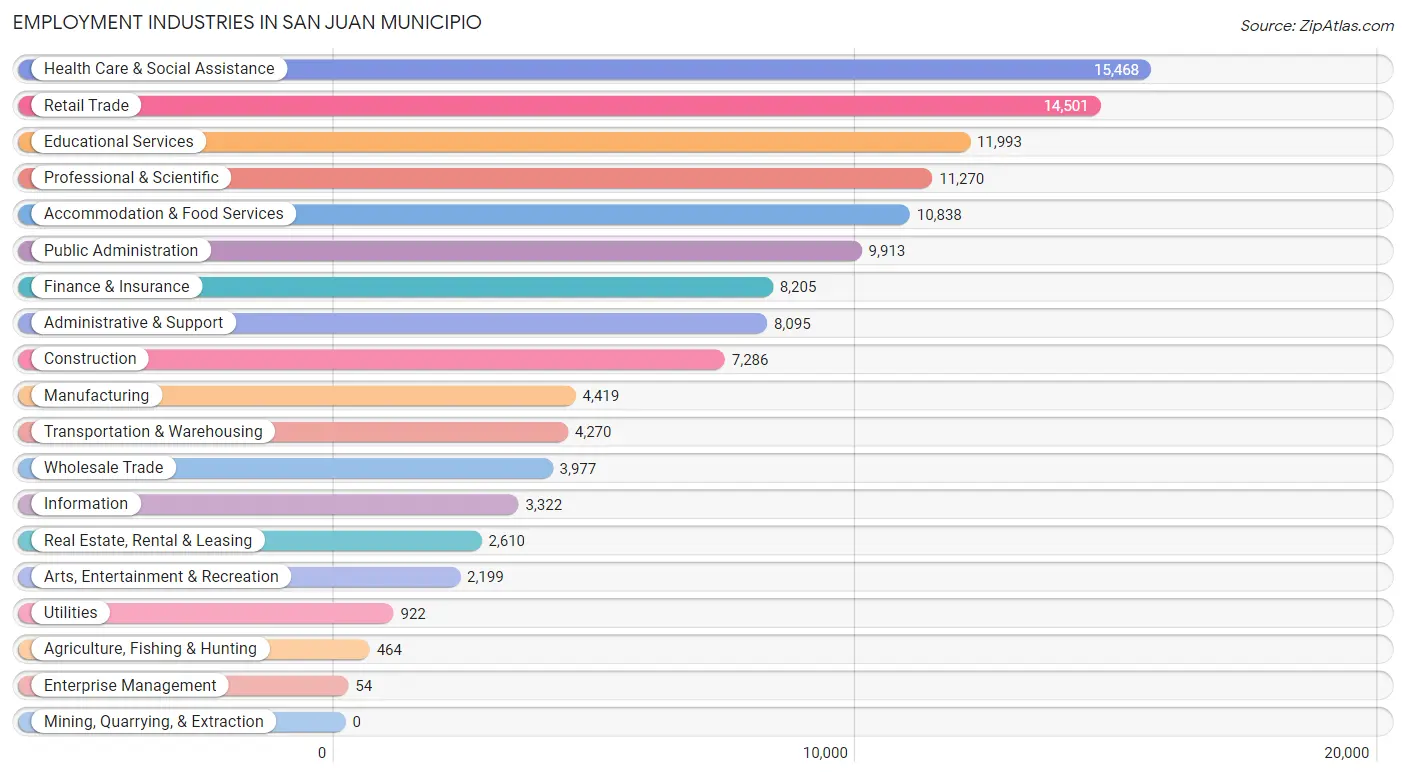
The major employment industries in San Juan Municipio include Health Care & Social Assistance (15,468 | 12.0%), Retail Trade (14,501 | 11.3%), Educational Services (11,993 | 9.3%), Professional & Scientific (11,270 | 8.8%), and Accommodation & Food Services (10,838 | 8.4%).
Employment Industries by Sex in San Juan Municipio
The San Juan Municipio industries that see more men than women are Construction (91.1%), Transportation & Warehousing (78.3%), and Agriculture, Fishing & Hunting (75.6%), whereas the industries that tend to have a higher number of women are Educational Services (68.3%), Health Care & Social Assistance (66.1%), and Finance & Insurance (58.2%).
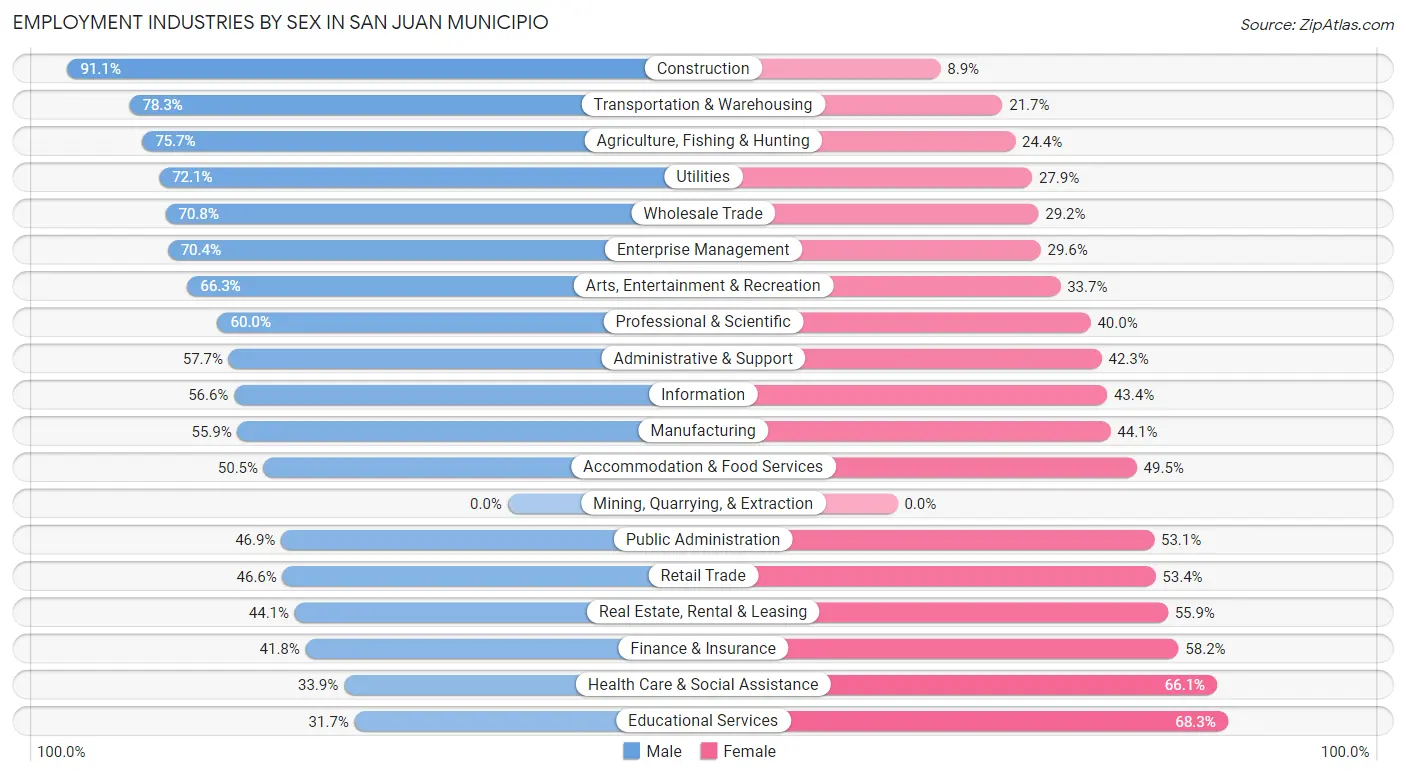
| Industry | Male | Female |
| Agriculture, Fishing & Hunting | 351 (75.6%) | 113 (24.3%) |
| Mining, Quarrying, & Extraction | 0 (0.0%) | 0 (0.0%) |
| Construction | 6,639 (91.1%) | 647 (8.9%) |
| Manufacturing | 2,471 (55.9%) | 1,948 (44.1%) |
| Wholesale Trade | 2,817 (70.8%) | 1,160 (29.2%) |
| Retail Trade | 6,757 (46.6%) | 7,744 (53.4%) |
| Transportation & Warehousing | 3,343 (78.3%) | 927 (21.7%) |
| Utilities | 665 (72.1%) | 257 (27.9%) |
| Information | 1,881 (56.6%) | 1,441 (43.4%) |
| Finance & Insurance | 3,433 (41.8%) | 4,772 (58.2%) |
| Real Estate, Rental & Leasing | 1,150 (44.1%) | 1,460 (55.9%) |
| Professional & Scientific | 6,767 (60.0%) | 4,503 (40.0%) |
| Enterprise Management | 38 (70.4%) | 16 (29.6%) |
| Administrative & Support | 4,674 (57.7%) | 3,421 (42.3%) |
| Educational Services | 3,799 (31.7%) | 8,194 (68.3%) |
| Health Care & Social Assistance | 5,241 (33.9%) | 10,227 (66.1%) |
| Arts, Entertainment & Recreation | 1,458 (66.3%) | 741 (33.7%) |
| Accommodation & Food Services | 5,471 (50.5%) | 5,367 (49.5%) |
| Public Administration | 4,648 (46.9%) | 5,265 (53.1%) |
| Total | 65,418 (50.8%) | 63,295 (49.2%) |
Education in San Juan Municipio
School Enrollment in San Juan Municipio
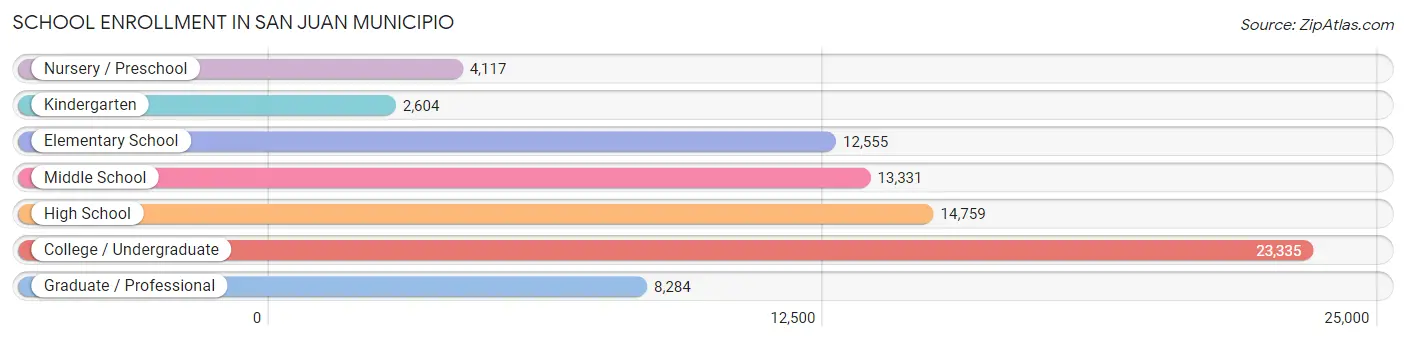
The most common levels of schooling among the 78,985 students in San Juan Municipio are college / undergraduate (23,335 | 29.5%), high school (14,759 | 18.7%), and middle school (13,331 | 16.9%).
| School Level | # Students | % Students |
| Nursery / Preschool | 4,117 | 5.2% |
| Kindergarten | 2,604 | 3.3% |
| Elementary School | 12,555 | 15.9% |
| Middle School | 13,331 | 16.9% |
| High School | 14,759 | 18.7% |
| College / Undergraduate | 23,335 | 29.5% |
| Graduate / Professional | 8,284 | 10.5% |
| Total | 78,985 | 100.0% |
School Enrollment by Age by Funding Source in San Juan Municipio
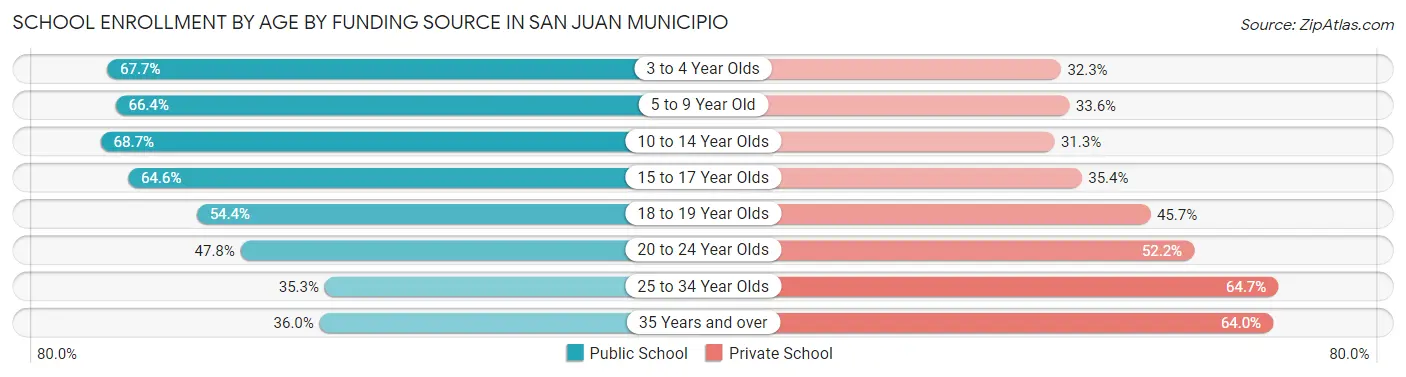
Out of a total of 78,985 students who are enrolled in schools in San Juan Municipio, 33,806 (42.8%) attend a private institution, while the remaining 45,179 (57.2%) are enrolled in public schools. The age group of 25 to 34 year olds has the highest likelihood of being enrolled in private schools, with 5,185 (64.7% in the age bracket) enrolled. Conversely, the age group of 10 to 14 year olds has the lowest likelihood of being enrolled in a private school, with 11,198 (68.7% in the age bracket) attending a public institution.
| Age Bracket | Public School | Private School |
| 3 to 4 Year Olds | 2,450 (67.7%) | 1,169 (32.3%) |
| 5 to 9 Year Old | 9,767 (66.4%) | 4,934 (33.6%) |
| 10 to 14 Year Olds | 11,198 (68.7%) | 5,111 (31.3%) |
| 15 to 17 Year Olds | 7,108 (64.6%) | 3,897 (35.4%) |
| 18 to 19 Year Olds | 3,704 (54.3%) | 3,111 (45.7%) |
| 20 to 24 Year Olds | 6,023 (47.8%) | 6,574 (52.2%) |
| 25 to 34 Year Olds | 2,825 (35.3%) | 5,185 (64.7%) |
| 35 Years and over | 2,137 (36.0%) | 3,792 (64.0%) |
| Total | 45,179 (57.2%) | 33,806 (42.8%) |
Educational Attainment by Field of Study in San Juan Municipio
Business (31,548 | 29.0%), education (12,283 | 11.3%), science & technology (12,082 | 11.1%), social sciences (7,024 | 6.5%), and engineering (6,604 | 6.1%) are the most common fields of study among 108,612 individuals in San Juan Municipio who have obtained a bachelor's degree or higher.
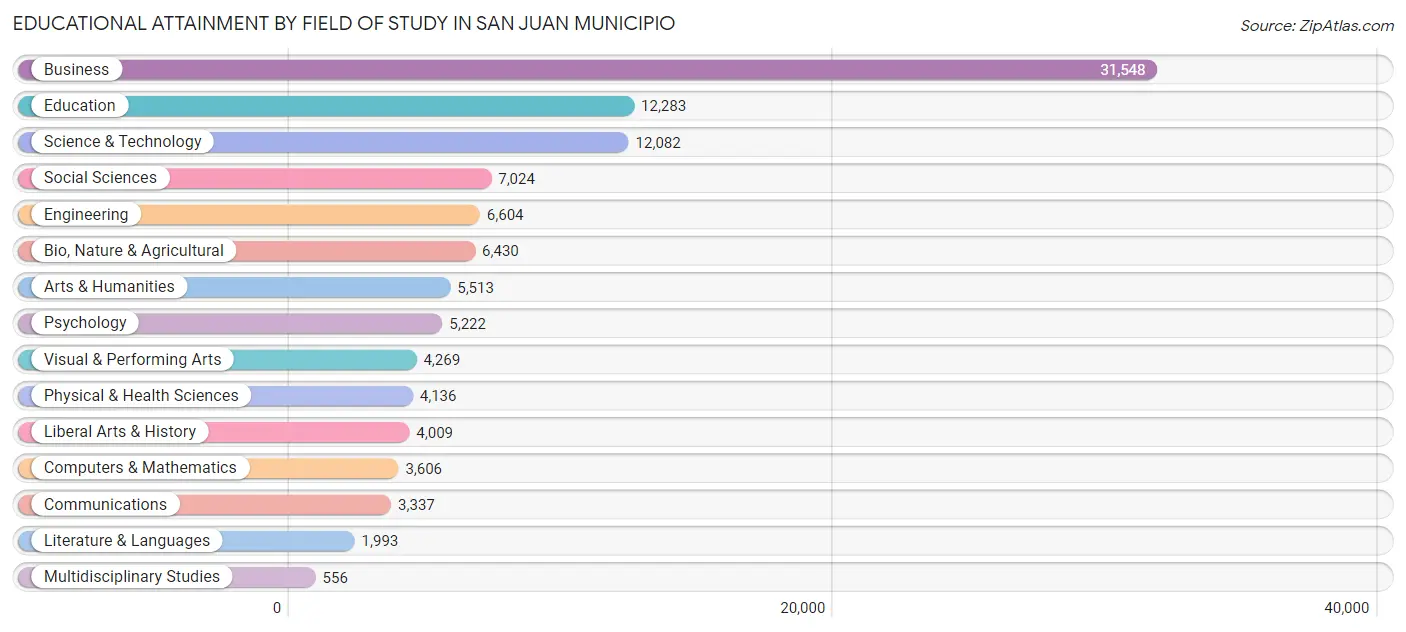
| Field of Study | # Graduates | % Graduates |
| Computers & Mathematics | 3,606 | 3.3% |
| Bio, Nature & Agricultural | 6,430 | 5.9% |
| Physical & Health Sciences | 4,136 | 3.8% |
| Psychology | 5,222 | 4.8% |
| Social Sciences | 7,024 | 6.5% |
| Engineering | 6,604 | 6.1% |
| Multidisciplinary Studies | 556 | 0.5% |
| Science & Technology | 12,082 | 11.1% |
| Business | 31,548 | 29.0% |
| Education | 12,283 | 11.3% |
| Literature & Languages | 1,993 | 1.8% |
| Liberal Arts & History | 4,009 | 3.7% |
| Visual & Performing Arts | 4,269 | 3.9% |
| Communications | 3,337 | 3.1% |
| Arts & Humanities | 5,513 | 5.1% |
| Total | 108,612 | 100.0% |
Transportation & Commute in San Juan Municipio
Vehicle Availability by Sex in San Juan Municipio
The most prevalent vehicle ownership categories in San Juan Municipio are males with 2 vehicles (25,279, accounting for 39.3%) and females with 2 vehicles (22,204, making up 41.1%).
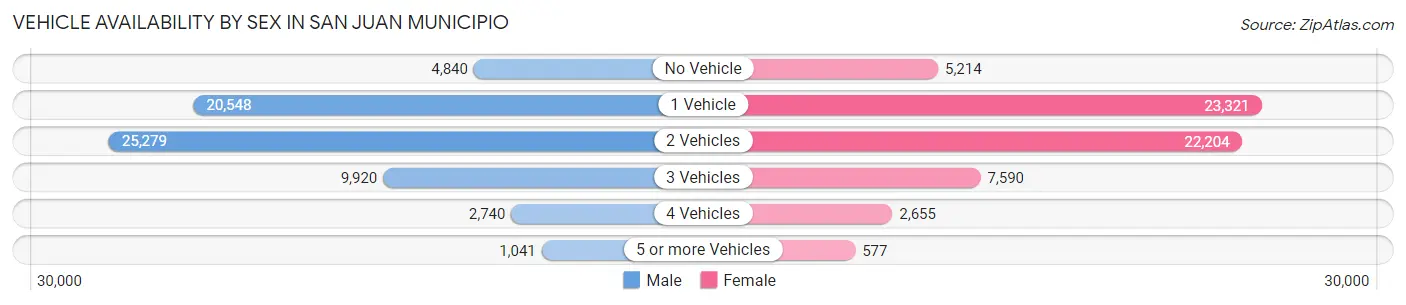
| Vehicles Available | Male | Female |
| No Vehicle | 4,840 (7.5%) | 5,214 (8.5%) |
| 1 Vehicle | 20,548 (31.9%) | 23,321 (37.9%) |
| 2 Vehicles | 25,279 (39.3%) | 22,204 (36.1%) |
| 3 Vehicles | 9,920 (15.4%) | 7,590 (12.3%) |
| 4 Vehicles | 2,740 (4.3%) | 2,655 (4.3%) |
| 5 or more Vehicles | 1,041 (1.6%) | 577 (0.9%) |
| Total | 64,368 (100.0%) | 61,561 (100.0%) |
Commute Time in San Juan Municipio
The most frequently occuring commute durations in San Juan Municipio are 30 to 34 minutes (26,621 commuters, 22.5%), 20 to 24 minutes (25,419 commuters, 21.5%), and 15 to 19 minutes (20,236 commuters, 17.1%).
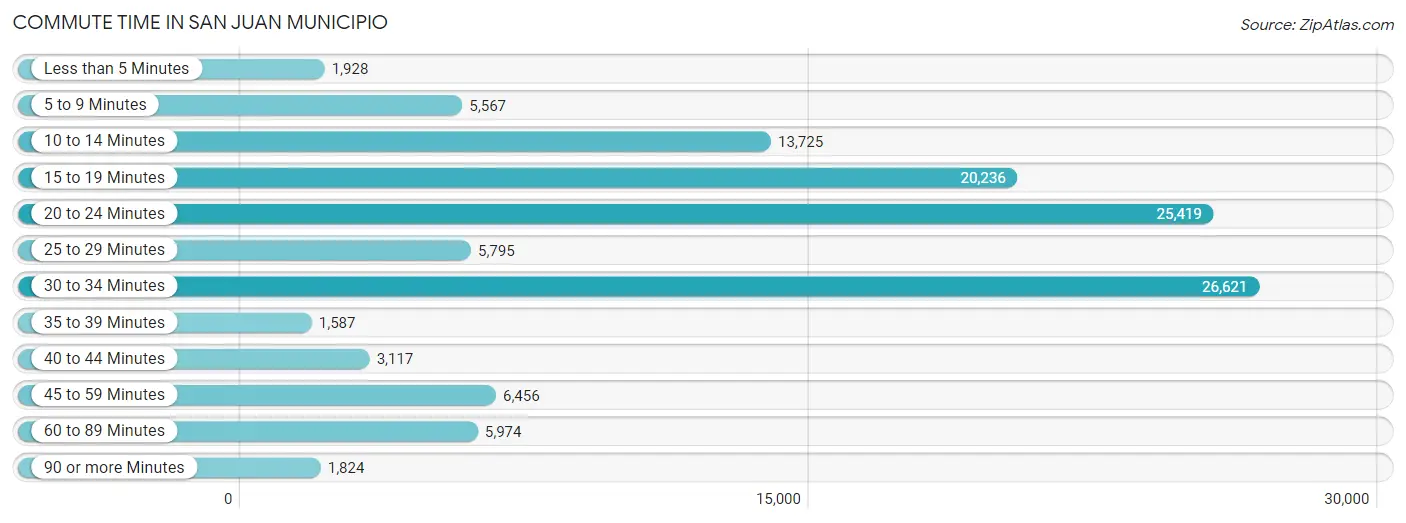
| Commute Time | # Commuters | % Commuters |
| Less than 5 Minutes | 1,928 | 1.6% |
| 5 to 9 Minutes | 5,567 | 4.7% |
| 10 to 14 Minutes | 13,725 | 11.6% |
| 15 to 19 Minutes | 20,236 | 17.1% |
| 20 to 24 Minutes | 25,419 | 21.5% |
| 25 to 29 Minutes | 5,795 | 4.9% |
| 30 to 34 Minutes | 26,621 | 22.5% |
| 35 to 39 Minutes | 1,587 | 1.3% |
| 40 to 44 Minutes | 3,117 | 2.6% |
| 45 to 59 Minutes | 6,456 | 5.5% |
| 60 to 89 Minutes | 5,974 | 5.1% |
| 90 or more Minutes | 1,824 | 1.5% |
Commute Time by Sex in San Juan Municipio
The most common commute times in San Juan Municipio are 30 to 34 minutes (13,862 commuters, 22.9%) for males and 20 to 24 minutes (13,220 commuters, 22.9%) for females.
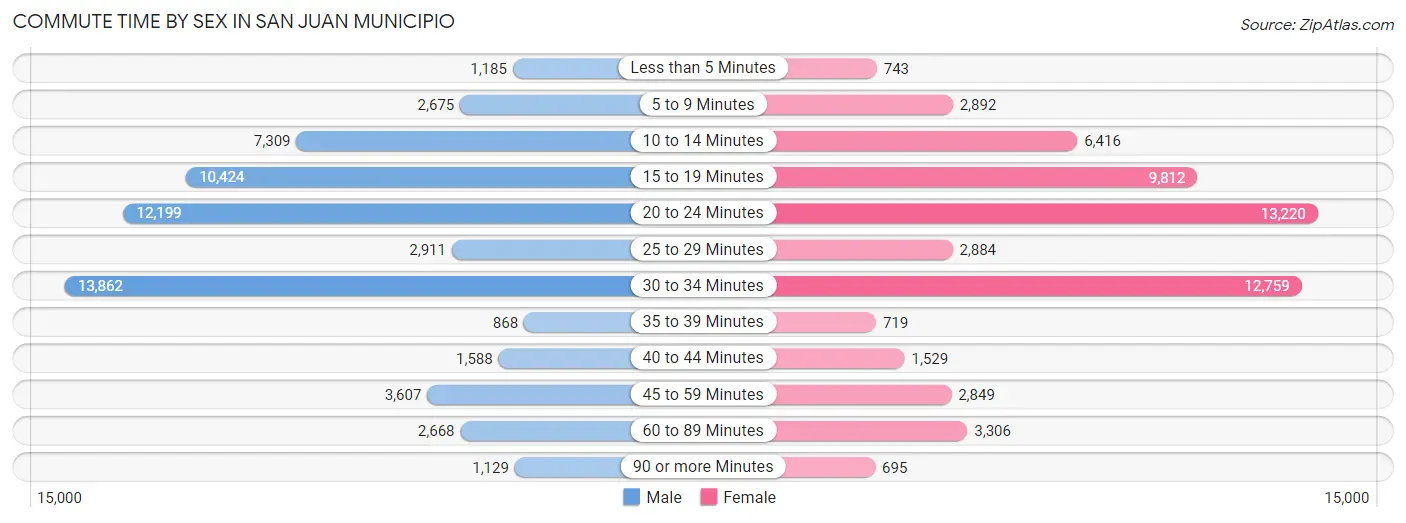
| Commute Time | Male | Female |
| Less than 5 Minutes | 1,185 (2.0%) | 743 (1.3%) |
| 5 to 9 Minutes | 2,675 (4.4%) | 2,892 (5.0%) |
| 10 to 14 Minutes | 7,309 (12.1%) | 6,416 (11.1%) |
| 15 to 19 Minutes | 10,424 (17.2%) | 9,812 (17.0%) |
| 20 to 24 Minutes | 12,199 (20.2%) | 13,220 (22.9%) |
| 25 to 29 Minutes | 2,911 (4.8%) | 2,884 (5.0%) |
| 30 to 34 Minutes | 13,862 (22.9%) | 12,759 (22.1%) |
| 35 to 39 Minutes | 868 (1.4%) | 719 (1.2%) |
| 40 to 44 Minutes | 1,588 (2.6%) | 1,529 (2.6%) |
| 45 to 59 Minutes | 3,607 (6.0%) | 2,849 (4.9%) |
| 60 to 89 Minutes | 2,668 (4.4%) | 3,306 (5.7%) |
| 90 or more Minutes | 1,129 (1.9%) | 695 (1.2%) |
Time of Departure to Work by Sex in San Juan Municipio
The most frequent times of departure to work in San Juan Municipio are 7:00 AM to 7:29 AM (12,834, 21.2%) for males and 7:00 AM to 7:29 AM (14,948, 25.9%) for females.
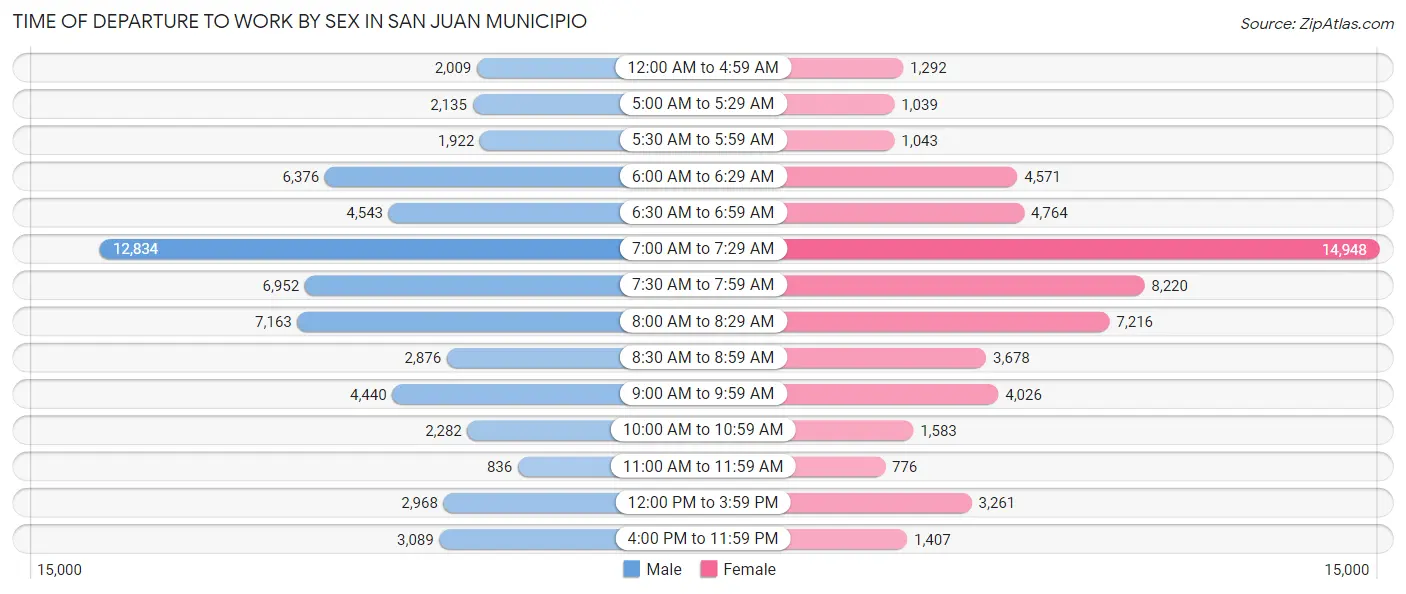
| Time of Departure | Male | Female |
| 12:00 AM to 4:59 AM | 2,009 (3.3%) | 1,292 (2.2%) |
| 5:00 AM to 5:29 AM | 2,135 (3.5%) | 1,039 (1.8%) |
| 5:30 AM to 5:59 AM | 1,922 (3.2%) | 1,043 (1.8%) |
| 6:00 AM to 6:29 AM | 6,376 (10.5%) | 4,571 (7.9%) |
| 6:30 AM to 6:59 AM | 4,543 (7.5%) | 4,764 (8.2%) |
| 7:00 AM to 7:29 AM | 12,834 (21.2%) | 14,948 (25.9%) |
| 7:30 AM to 7:59 AM | 6,952 (11.5%) | 8,220 (14.2%) |
| 8:00 AM to 8:29 AM | 7,163 (11.8%) | 7,216 (12.5%) |
| 8:30 AM to 8:59 AM | 2,876 (4.8%) | 3,678 (6.4%) |
| 9:00 AM to 9:59 AM | 4,440 (7.3%) | 4,026 (7.0%) |
| 10:00 AM to 10:59 AM | 2,282 (3.8%) | 1,583 (2.7%) |
| 11:00 AM to 11:59 AM | 836 (1.4%) | 776 (1.3%) |
| 12:00 PM to 3:59 PM | 2,968 (4.9%) | 3,261 (5.6%) |
| 4:00 PM to 11:59 PM | 3,089 (5.1%) | 1,407 (2.4%) |
| Total | 60,425 (100.0%) | 57,824 (100.0%) |
Housing Occupancy in San Juan Municipio
Occupancy by Ownership in San Juan Municipio
Of the total 147,044 dwellings in San Juan Municipio, owner-occupied units account for 79,156 (53.8%), while renter-occupied units make up 67,888 (46.2%).
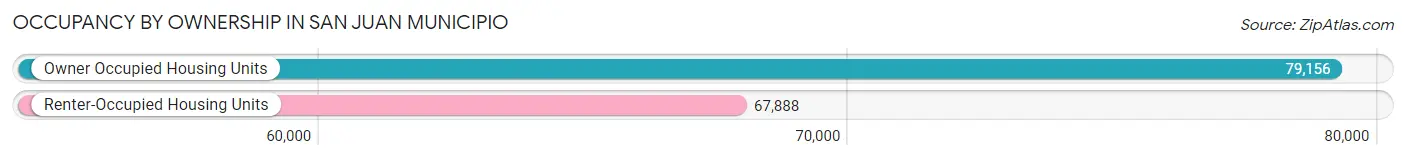
| Occupancy | # Housing Units | % Housing Units |
| Owner Occupied Housing Units | 79,156 | 53.8% |
| Renter-Occupied Housing Units | 67,888 | 46.2% |
| Total Occupied Housing Units | 147,044 | 100.0% |
Occupancy by Household Size in San Juan Municipio
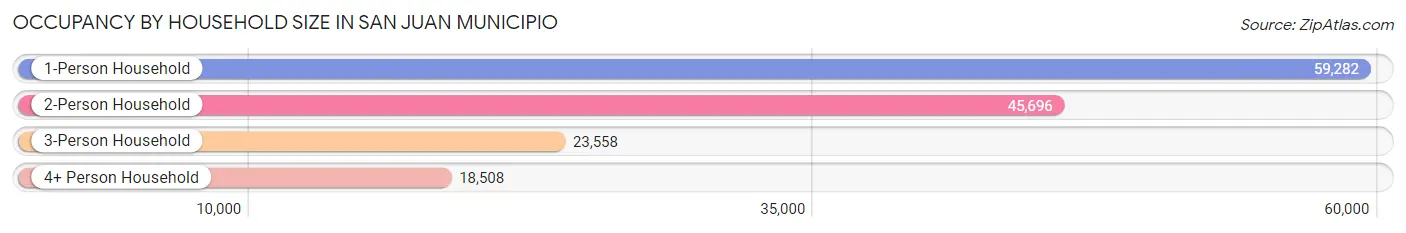
| Household Size | # Housing Units | % Housing Units |
| 1-Person Household | 59,282 | 40.3% |
| 2-Person Household | 45,696 | 31.1% |
| 3-Person Household | 23,558 | 16.0% |
| 4+ Person Household | 18,508 | 12.6% |
| Total Housing Units | 147,044 | 100.0% |
Occupancy by Ownership by Household Size in San Juan Municipio
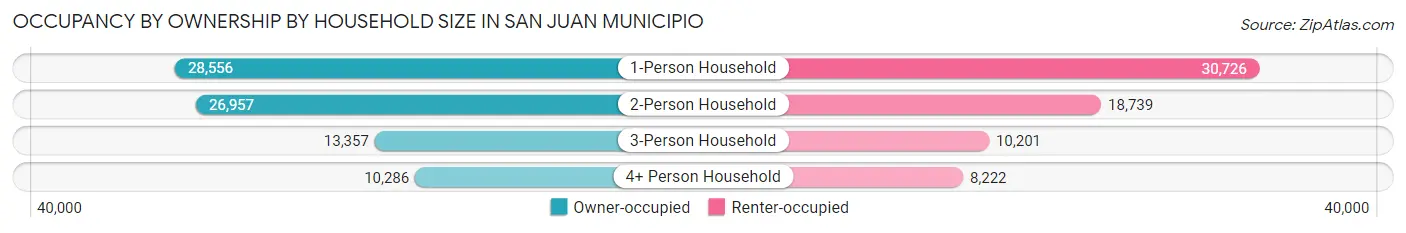
| Household Size | Owner-occupied | Renter-occupied |
| 1-Person Household | 28,556 (48.2%) | 30,726 (51.8%) |
| 2-Person Household | 26,957 (59.0%) | 18,739 (41.0%) |
| 3-Person Household | 13,357 (56.7%) | 10,201 (43.3%) |
| 4+ Person Household | 10,286 (55.6%) | 8,222 (44.4%) |
| Total Housing Units | 79,156 (53.8%) | 67,888 (46.2%) |
Occupancy by Educational Attainment in San Juan Municipio
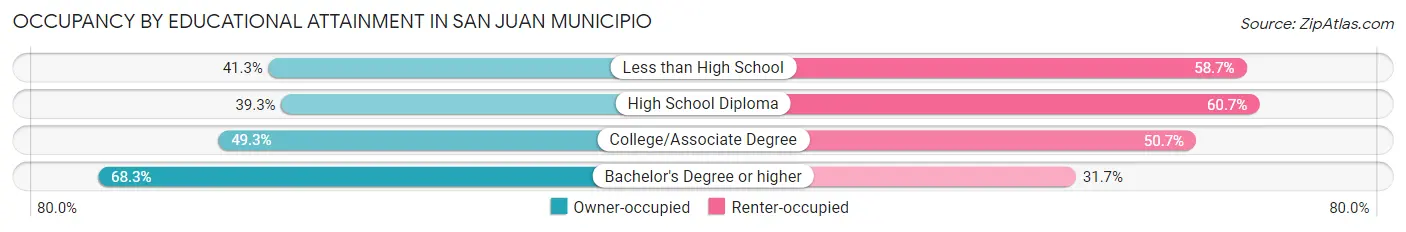
| Household Size | Owner-occupied | Renter-occupied |
| Less than High School | 9,445 (41.3%) | 13,438 (58.7%) |
| High School Diploma | 11,913 (39.3%) | 18,432 (60.7%) |
| College/Associate Degree | 16,321 (49.3%) | 16,792 (50.7%) |
| Bachelor's Degree or higher | 41,477 (68.3%) | 19,226 (31.7%) |
Occupancy by Age of Householder in San Juan Municipio
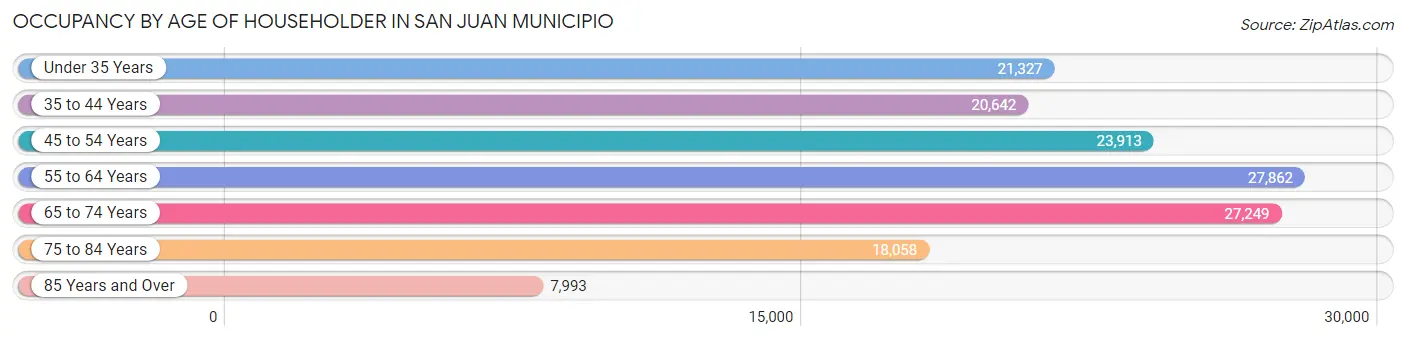
| Age Bracket | # Households | % Households |
| Under 35 Years | 21,327 | 14.5% |
| 35 to 44 Years | 20,642 | 14.0% |
| 45 to 54 Years | 23,913 | 16.3% |
| 55 to 64 Years | 27,862 | 19.0% |
| 65 to 74 Years | 27,249 | 18.5% |
| 75 to 84 Years | 18,058 | 12.3% |
| 85 Years and Over | 7,993 | 5.4% |
| Total | 147,044 | 100.0% |
Housing Finances in San Juan Municipio
Median Income by Occupancy in San Juan Municipio
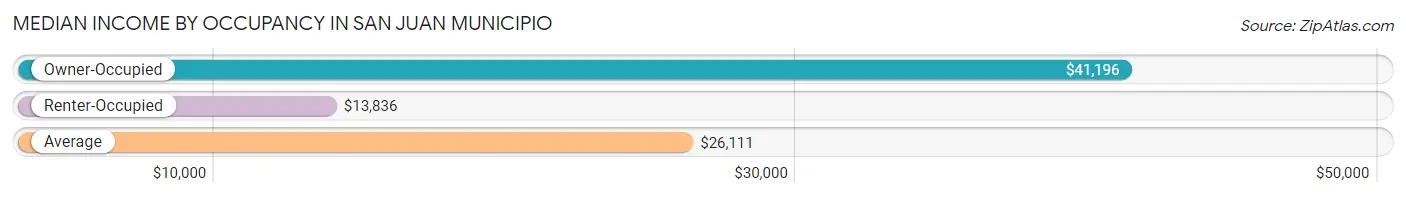
| Occupancy Type | # Households | Median Income |
| Owner-Occupied | 79,156 (53.8%) | $41,196 |
| Renter-Occupied | 67,888 (46.2%) | $13,836 |
| Average | 147,044 (100.0%) | $26,111 |
Occupancy by Householder Income Bracket in San Juan Municipio
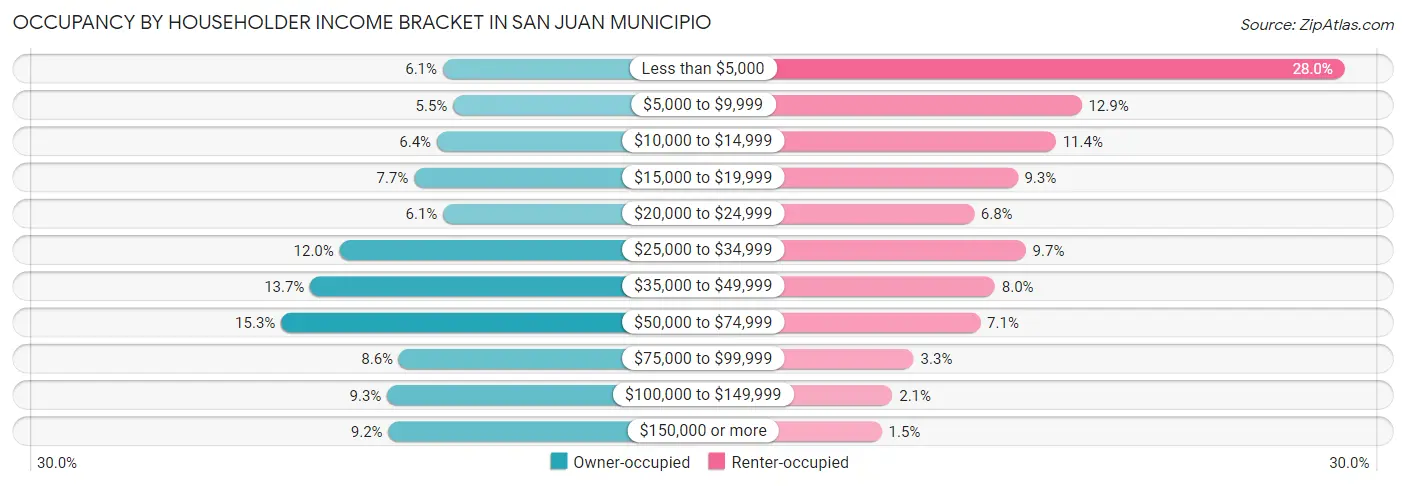
| Income Bracket | Owner-occupied | Renter-occupied |
| Less than $5,000 | 4,829 (6.1%) | 18,973 (28.0%) |
| $5,000 to $9,999 | 4,360 (5.5%) | 8,761 (12.9%) |
| $10,000 to $14,999 | 5,098 (6.4%) | 7,766 (11.4%) |
| $15,000 to $19,999 | 6,130 (7.7%) | 6,280 (9.2%) |
| $20,000 to $24,999 | 4,814 (6.1%) | 4,587 (6.8%) |
| $25,000 to $34,999 | 9,498 (12.0%) | 6,600 (9.7%) |
| $35,000 to $49,999 | 10,832 (13.7%) | 5,401 (8.0%) |
| $50,000 to $74,999 | 12,144 (15.3%) | 4,835 (7.1%) |
| $75,000 to $99,999 | 6,813 (8.6%) | 2,251 (3.3%) |
| $100,000 to $149,999 | 7,344 (9.3%) | 1,423 (2.1%) |
| $150,000 or more | 7,294 (9.2%) | 1,011 (1.5%) |
| Total | 79,156 (100.0%) | 67,888 (100.0%) |
Monthly Housing Cost Tiers in San Juan Municipio
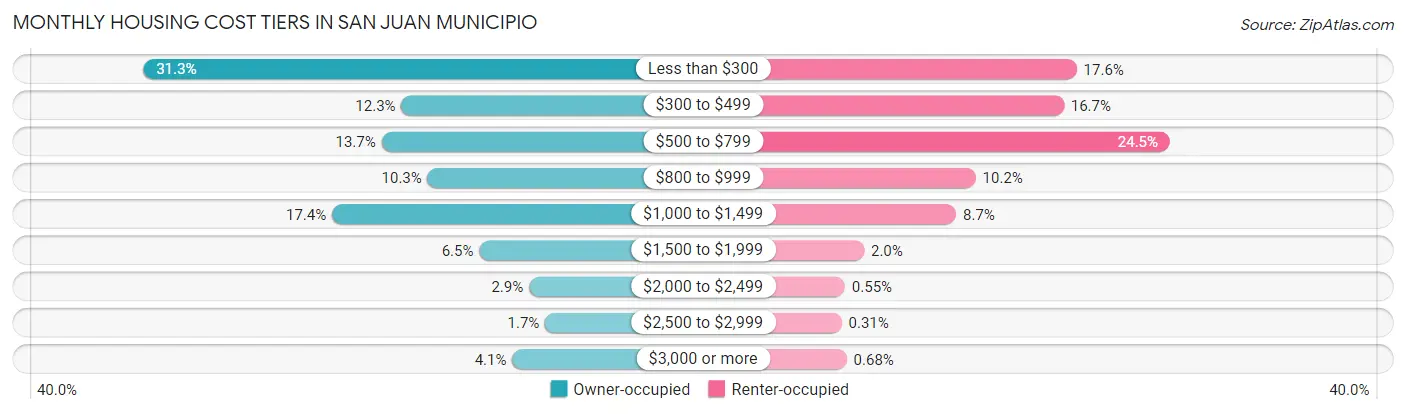
| Monthly Cost | Owner-occupied | Renter-occupied |
| Less than $300 | 24,745 (31.3%) | 11,960 (17.6%) |
| $300 to $499 | 9,695 (12.2%) | 11,316 (16.7%) |
| $500 to $799 | 10,849 (13.7%) | 16,619 (24.5%) |
| $800 to $999 | 8,169 (10.3%) | 6,914 (10.2%) |
| $1,000 to $1,499 | 13,740 (17.4%) | 5,935 (8.7%) |
| $1,500 to $1,999 | 5,155 (6.5%) | 1,329 (2.0%) |
| $2,000 to $2,499 | 2,258 (2.9%) | 373 (0.5%) |
| $2,500 to $2,999 | 1,314 (1.7%) | 208 (0.3%) |
| $3,000 or more | 3,231 (4.1%) | 462 (0.7%) |
| Total | 79,156 (100.0%) | 67,888 (100.0%) |
Physical Housing Characteristics in San Juan Municipio
Housing Structures in San Juan Municipio
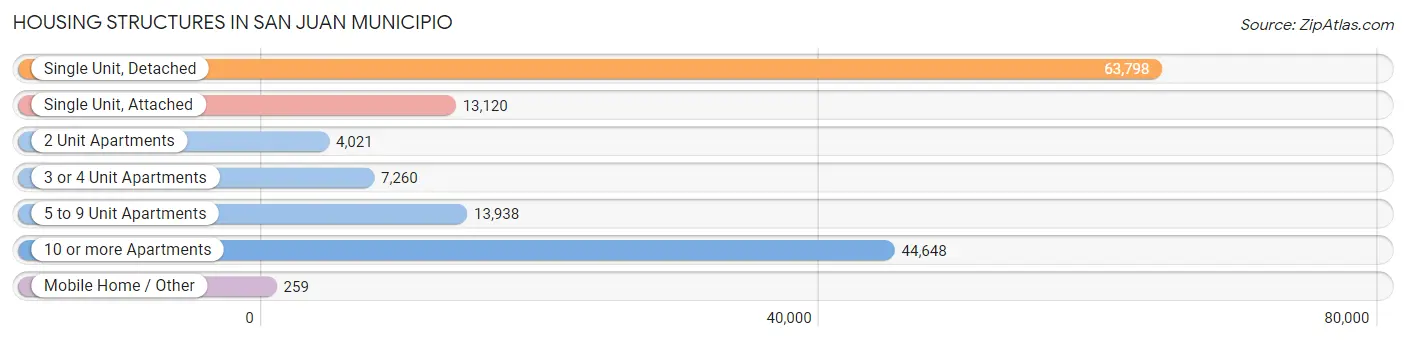
| Structure Type | # Housing Units | % Housing Units |
| Single Unit, Detached | 63,798 | 43.4% |
| Single Unit, Attached | 13,120 | 8.9% |
| 2 Unit Apartments | 4,021 | 2.7% |
| 3 or 4 Unit Apartments | 7,260 | 4.9% |
| 5 to 9 Unit Apartments | 13,938 | 9.5% |
| 10 or more Apartments | 44,648 | 30.4% |
| Mobile Home / Other | 259 | 0.2% |
| Total | 147,044 | 100.0% |
Housing Structures by Occupancy in San Juan Municipio
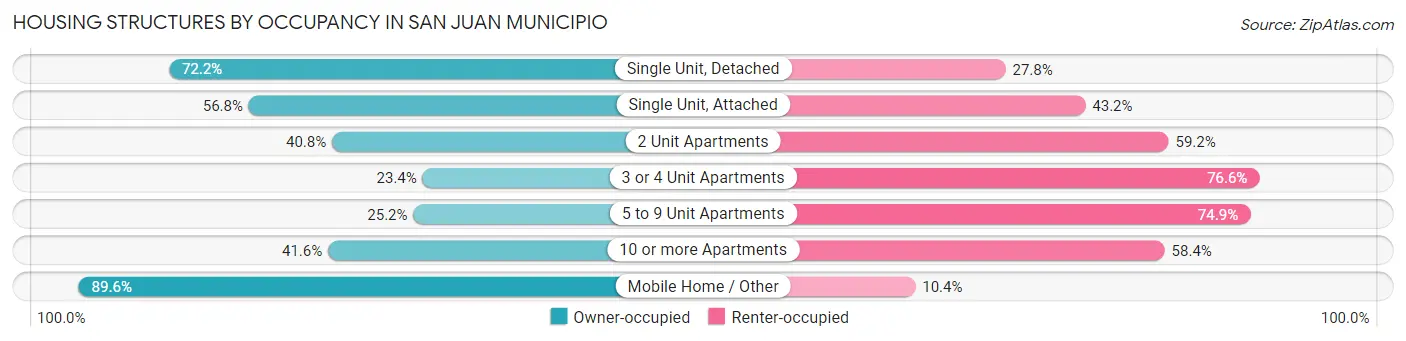
| Structure Type | Owner-occupied | Renter-occupied |
| Single Unit, Detached | 46,064 (72.2%) | 17,734 (27.8%) |
| Single Unit, Attached | 7,458 (56.8%) | 5,662 (43.2%) |
| 2 Unit Apartments | 1,641 (40.8%) | 2,380 (59.2%) |
| 3 or 4 Unit Apartments | 1,697 (23.4%) | 5,563 (76.6%) |
| 5 to 9 Unit Apartments | 3,506 (25.2%) | 10,432 (74.9%) |
| 10 or more Apartments | 18,558 (41.6%) | 26,090 (58.4%) |
| Mobile Home / Other | 232 (89.6%) | 27 (10.4%) |
| Total | 79,156 (53.8%) | 67,888 (46.2%) |
Housing Structures by Number of Rooms in San Juan Municipio
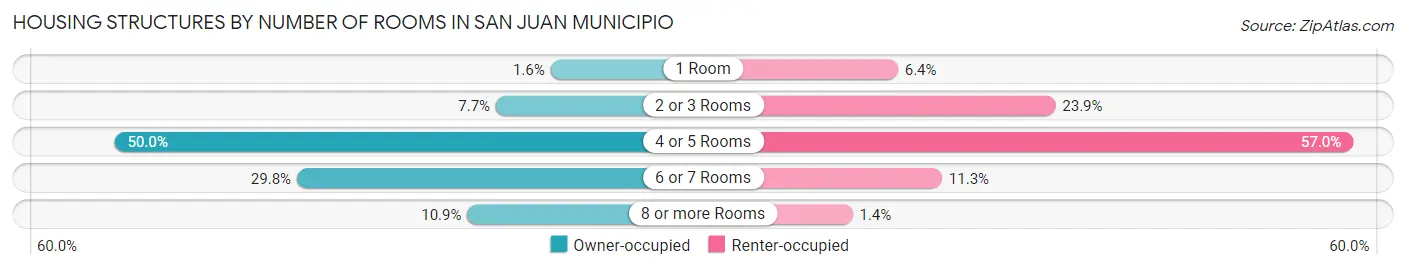
| Number of Rooms | Owner-occupied | Renter-occupied |
| 1 Room | 1,292 (1.6%) | 4,357 (6.4%) |
| 2 or 3 Rooms | 6,089 (7.7%) | 16,235 (23.9%) |
| 4 or 5 Rooms | 39,594 (50.0%) | 38,661 (57.0%) |
| 6 or 7 Rooms | 23,573 (29.8%) | 7,686 (11.3%) |
| 8 or more Rooms | 8,608 (10.9%) | 949 (1.4%) |
| Total | 79,156 (100.0%) | 67,888 (100.0%) |
Housing Structure by Heating Type in San Juan Municipio
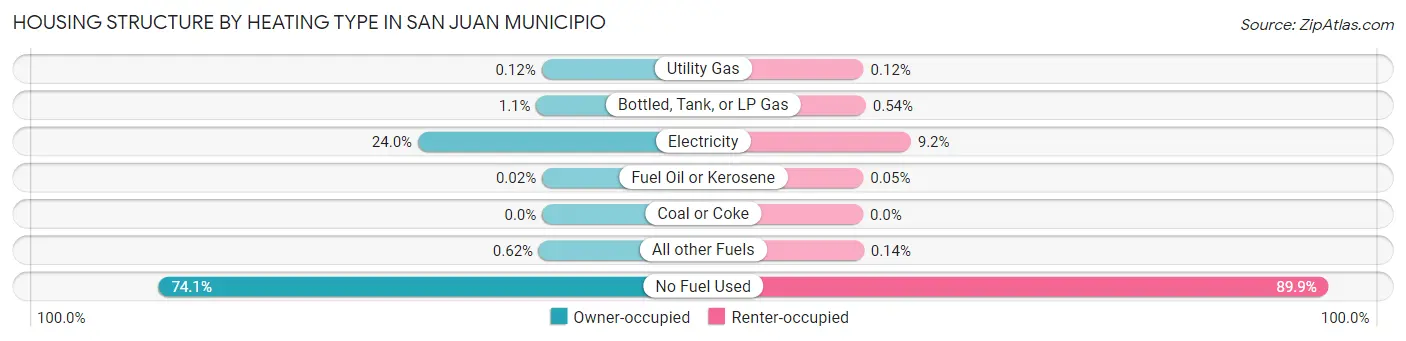
| Heating Type | Owner-occupied | Renter-occupied |
| Utility Gas | 92 (0.1%) | 80 (0.1%) |
| Bottled, Tank, or LP Gas | 879 (1.1%) | 365 (0.5%) |
| Electricity | 19,001 (24.0%) | 6,263 (9.2%) |
| Fuel Oil or Kerosene | 19 (0.0%) | 31 (0.1%) |
| Coal or Coke | 0 (0.0%) | 0 (0.0%) |
| All other Fuels | 491 (0.6%) | 92 (0.1%) |
| No Fuel Used | 58,674 (74.1%) | 61,057 (89.9%) |
| Total | 79,156 (100.0%) | 67,888 (100.0%) |
Household Vehicle Usage in San Juan Municipio
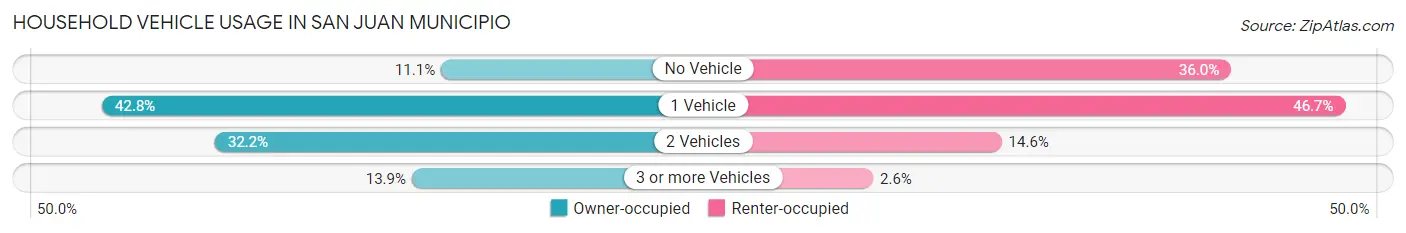
| Vehicles per Household | Owner-occupied | Renter-occupied |
| No Vehicle | 8,807 (11.1%) | 24,464 (36.0%) |
| 1 Vehicle | 33,863 (42.8%) | 31,711 (46.7%) |
| 2 Vehicles | 25,518 (32.2%) | 9,930 (14.6%) |
| 3 or more Vehicles | 10,968 (13.9%) | 1,783 (2.6%) |
| Total | 79,156 (100.0%) | 67,888 (100.0%) |
Real Estate & Mortgages in San Juan Municipio
Real Estate and Mortgage Overview in San Juan Municipio
| Characteristic | Without Mortgage | With Mortgage |
| Housing Units | 41,234 | 37,922 |
| Median Property Value | $155,800 | $172,100 |
| Median Household Income | $31,875 | $4,301 |
| Monthly Housing Costs | $244 | $3,166 |
| Real Estate Taxes | $738 | $23,887 |
Property Value by Mortgage Status in San Juan Municipio
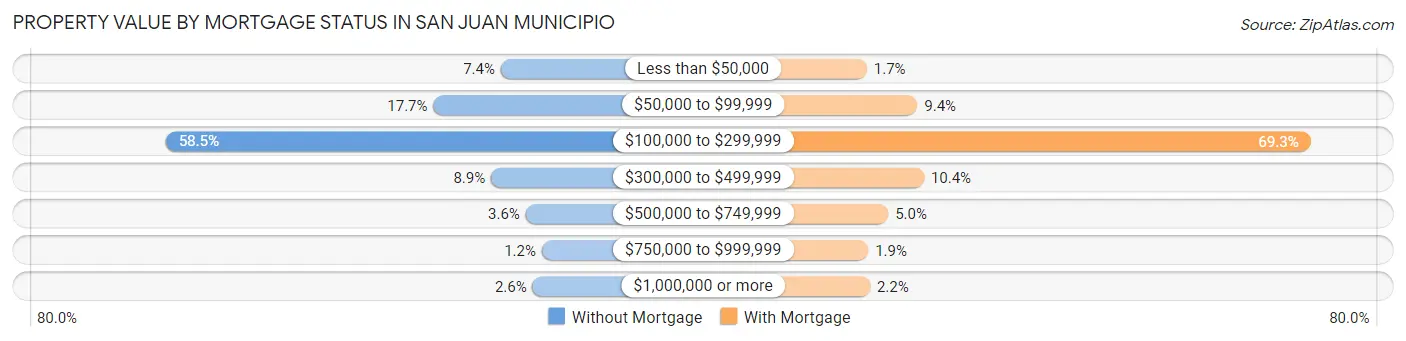
| Property Value | Without Mortgage | With Mortgage |
| Less than $50,000 | 3,068 (7.4%) | 652 (1.7%) |
| $50,000 to $99,999 | 7,304 (17.7%) | 3,571 (9.4%) |
| $100,000 to $299,999 | 24,117 (58.5%) | 26,294 (69.3%) |
| $300,000 to $499,999 | 3,680 (8.9%) | 3,953 (10.4%) |
| $500,000 to $749,999 | 1,502 (3.6%) | 1,887 (5.0%) |
| $750,000 to $999,999 | 491 (1.2%) | 731 (1.9%) |
| $1,000,000 or more | 1,072 (2.6%) | 834 (2.2%) |
| Total | 41,234 (100.0%) | 37,922 (100.0%) |
Household Income by Mortgage Status in San Juan Municipio
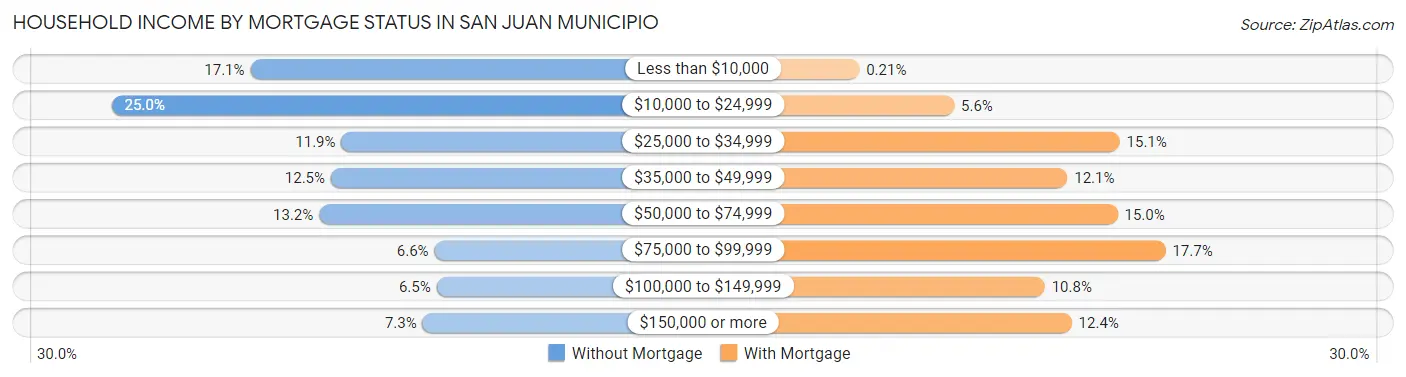
| Household Income | Without Mortgage | With Mortgage |
| Less than $10,000 | 7,053 (17.1%) | 80 (0.2%) |
| $10,000 to $24,999 | 10,320 (25.0%) | 2,136 (5.6%) |
| $25,000 to $34,999 | 4,908 (11.9%) | 5,722 (15.1%) |
| $35,000 to $49,999 | 5,154 (12.5%) | 4,590 (12.1%) |
| $50,000 to $74,999 | 5,429 (13.2%) | 5,678 (15.0%) |
| $75,000 to $99,999 | 2,715 (6.6%) | 6,715 (17.7%) |
| $100,000 to $149,999 | 2,662 (6.5%) | 4,098 (10.8%) |
| $150,000 or more | 2,993 (7.3%) | 4,682 (12.3%) |
| Total | 41,234 (100.0%) | 37,922 (100.0%) |
Property Value to Household Income Ratio in San Juan Municipio
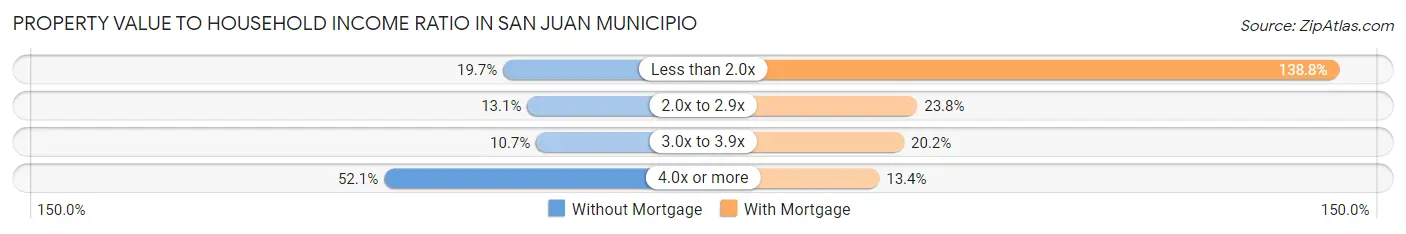
| Value-to-Income Ratio | Without Mortgage | With Mortgage |
| Less than 2.0x | 8,112 (19.7%) | 52,618 (138.7%) |
| 2.0x to 2.9x | 5,391 (13.1%) | 9,025 (23.8%) |
| 3.0x to 3.9x | 4,395 (10.7%) | 7,665 (20.2%) |
| 4.0x or more | 21,481 (52.1%) | 5,096 (13.4%) |
| Total | 41,234 (100.0%) | 37,922 (100.0%) |
Real Estate Taxes by Mortgage Status in San Juan Municipio
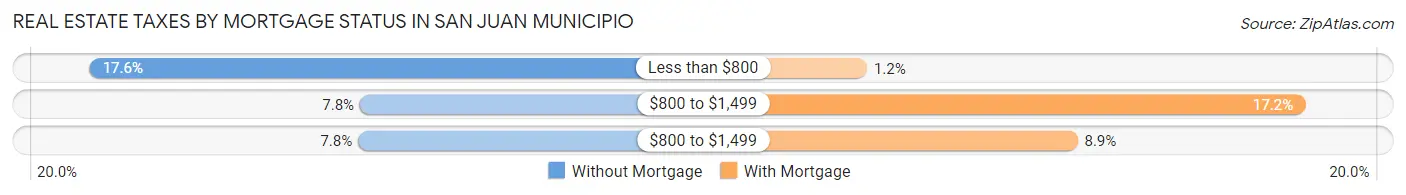
| Property Taxes | Without Mortgage | With Mortgage |
| Less than $800 | 7,267 (17.6%) | 472 (1.2%) |
| $800 to $1,499 | 3,196 (7.7%) | 6,539 (17.2%) |
| $800 to $1,499 | 3,223 (7.8%) | 3,386 (8.9%) |
| Total | 41,234 (100.0%) | 37,922 (100.0%) |
Health & Disability in San Juan Municipio
Health Insurance Coverage by Age in San Juan Municipio
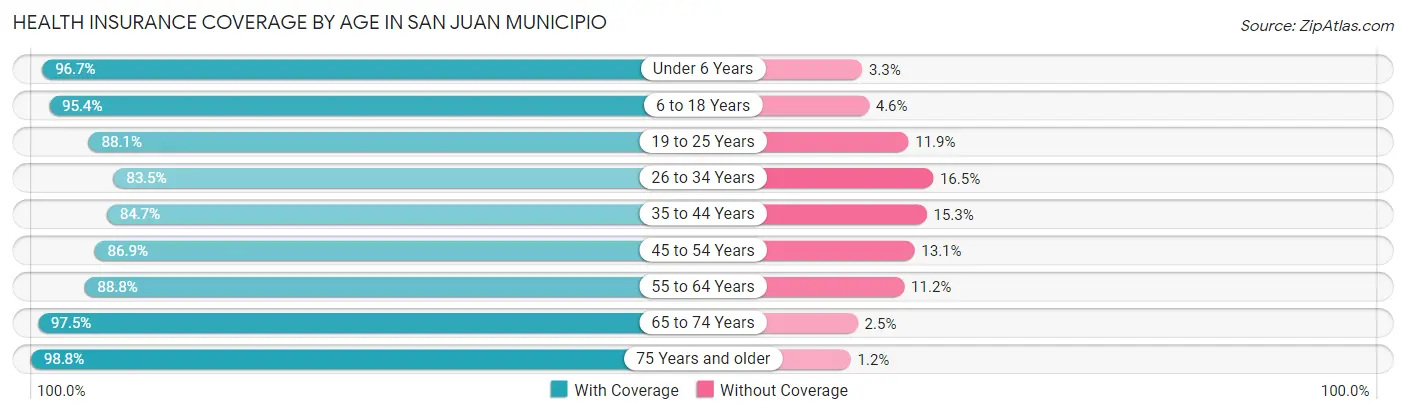
| Age Bracket | With Coverage | Without Coverage |
| Under 6 Years | 14,640 (96.7%) | 498 (3.3%) |
| 6 to 18 Years | 42,643 (95.4%) | 2,043 (4.6%) |
| 19 to 25 Years | 28,705 (88.1%) | 3,892 (11.9%) |
| 26 to 34 Years | 31,409 (83.5%) | 6,226 (16.5%) |
| 35 to 44 Years | 32,978 (84.7%) | 5,973 (15.3%) |
| 45 to 54 Years | 36,128 (86.9%) | 5,433 (13.1%) |
| 55 to 64 Years | 40,607 (88.8%) | 5,100 (11.2%) |
| 65 to 74 Years | 39,216 (97.5%) | 1,002 (2.5%) |
| 75 Years and older | 39,595 (98.8%) | 469 (1.2%) |
| Total | 305,921 (90.9%) | 30,636 (9.1%) |
Health Insurance Coverage by Citizenship Status in San Juan Municipio
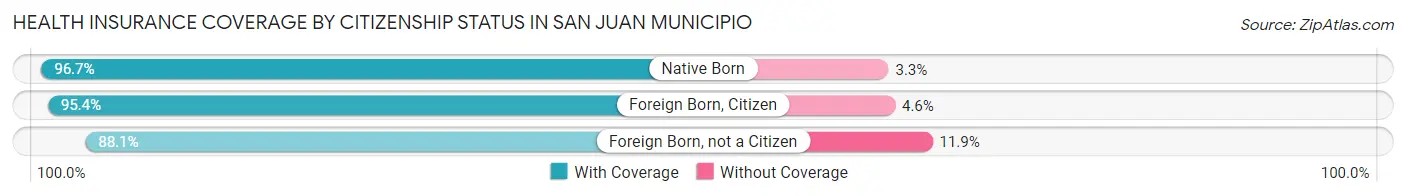
| Citizenship Status | With Coverage | Without Coverage |
| Native Born | 14,640 (96.7%) | 498 (3.3%) |
| Foreign Born, Citizen | 42,643 (95.4%) | 2,043 (4.6%) |
| Foreign Born, not a Citizen | 28,705 (88.1%) | 3,892 (11.9%) |
Health Insurance Coverage by Household Income in San Juan Municipio
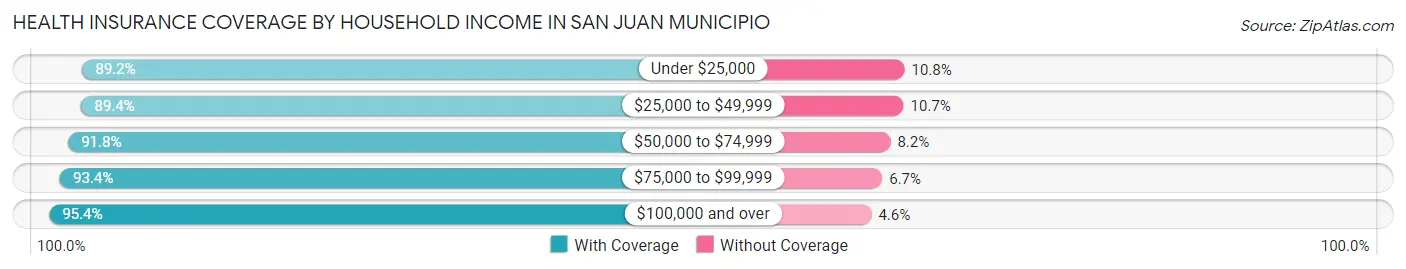
| Household Income | With Coverage | Without Coverage |
| Under $25,000 | 123,400 (89.2%) | 14,976 (10.8%) |
| $25,000 to $49,999 | 65,147 (89.3%) | 7,763 (10.6%) |
| $50,000 to $74,999 | 41,517 (91.8%) | 3,697 (8.2%) |
| $75,000 to $99,999 | 23,545 (93.3%) | 1,676 (6.7%) |
| $100,000 and over | 48,911 (95.4%) | 2,371 (4.6%) |
Public vs Private Health Insurance Coverage by Age in San Juan Municipio
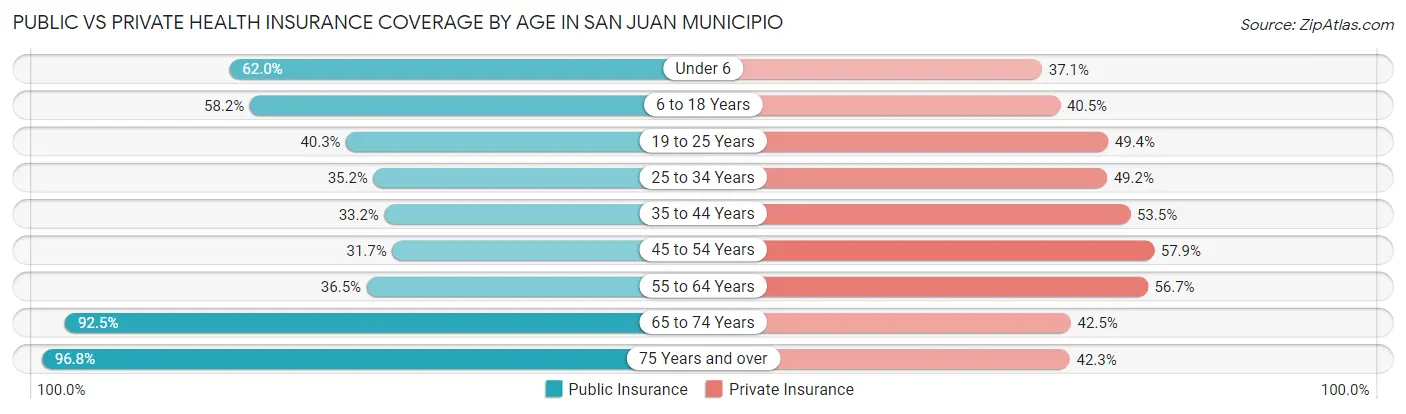
| Age Bracket | Public Insurance | Private Insurance |
| Under 6 | 9,383 (62.0%) | 5,619 (37.1%) |
| 6 to 18 Years | 25,983 (58.2%) | 18,092 (40.5%) |
| 19 to 25 Years | 13,122 (40.3%) | 16,101 (49.4%) |
| 25 to 34 Years | 13,249 (35.2%) | 18,510 (49.2%) |
| 35 to 44 Years | 12,917 (33.2%) | 20,833 (53.5%) |
| 45 to 54 Years | 13,180 (31.7%) | 24,067 (57.9%) |
| 55 to 64 Years | 16,663 (36.5%) | 25,931 (56.7%) |
| 65 to 74 Years | 37,201 (92.5%) | 17,086 (42.5%) |
| 75 Years and over | 38,782 (96.8%) | 16,940 (42.3%) |
| Total | 180,480 (53.6%) | 163,179 (48.5%) |
Disability Status by Sex by Age in San Juan Municipio
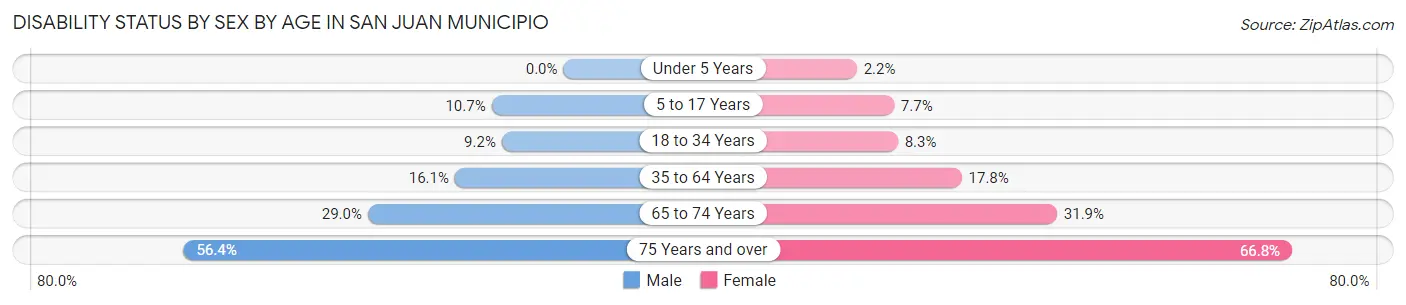
| Age Bracket | Male | Female |
| Under 5 Years | 0 (0.0%) | 132 (2.2%) |
| 5 to 17 Years | 2,301 (10.7%) | 1,674 (7.7%) |
| 18 to 34 Years | 3,245 (9.1%) | 3,251 (8.3%) |
| 35 to 64 Years | 9,250 (16.1%) | 12,249 (17.8%) |
| 65 to 74 Years | 4,885 (29.0%) | 7,473 (31.9%) |
| 75 Years and over | 8,943 (56.4%) | 16,181 (66.8%) |
Disability Class by Sex by Age in San Juan Municipio
Disability Class: Hearing Difficulty
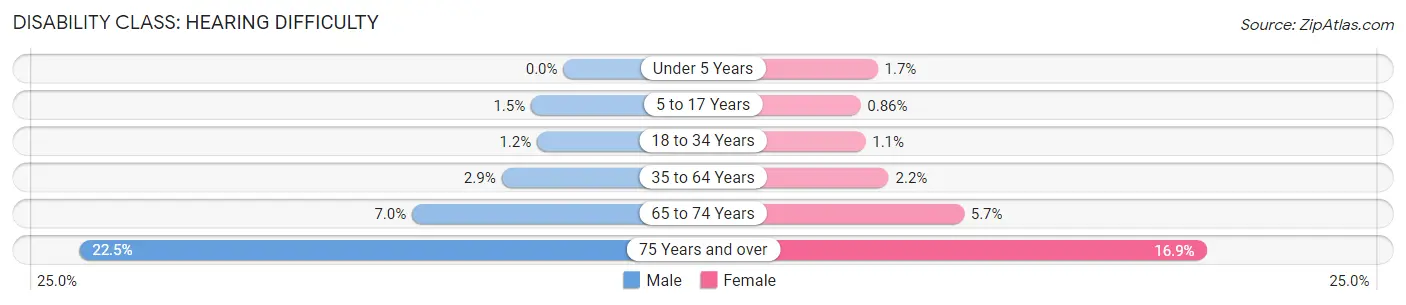
| Age Bracket | Male | Female |
| Under 5 Years | 0 (0.0%) | 99 (1.7%) |
| 5 to 17 Years | 323 (1.5%) | 187 (0.9%) |
| 18 to 34 Years | 433 (1.2%) | 426 (1.1%) |
| 35 to 64 Years | 1,646 (2.9%) | 1,497 (2.2%) |
| 65 to 74 Years | 1,181 (7.0%) | 1,325 (5.7%) |
| 75 Years and over | 3,561 (22.5%) | 4,095 (16.9%) |
Disability Class: Vision Difficulty
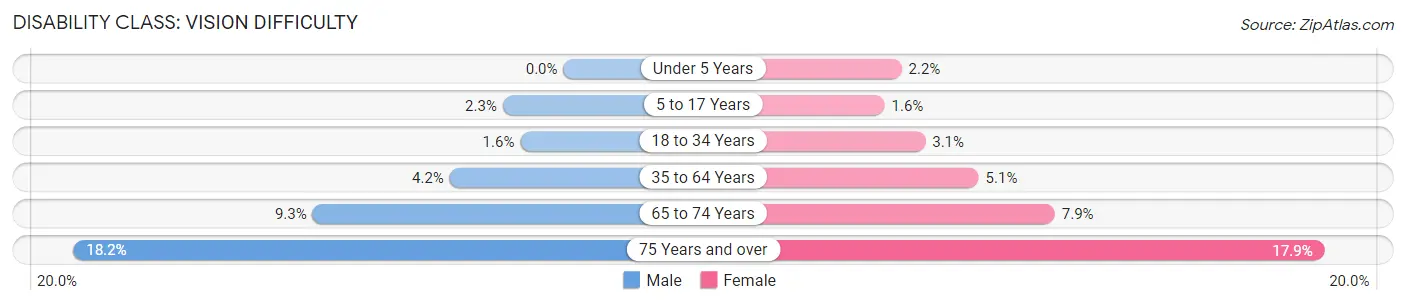
| Age Bracket | Male | Female |
| Under 5 Years | 0 (0.0%) | 132 (2.2%) |
| 5 to 17 Years | 486 (2.2%) | 344 (1.6%) |
| 18 to 34 Years | 568 (1.6%) | 1,214 (3.1%) |
| 35 to 64 Years | 2,422 (4.2%) | 3,498 (5.1%) |
| 65 to 74 Years | 1,566 (9.3%) | 1,851 (7.9%) |
| 75 Years and over | 2,884 (18.2%) | 4,337 (17.9%) |
Disability Class: Cognitive Difficulty
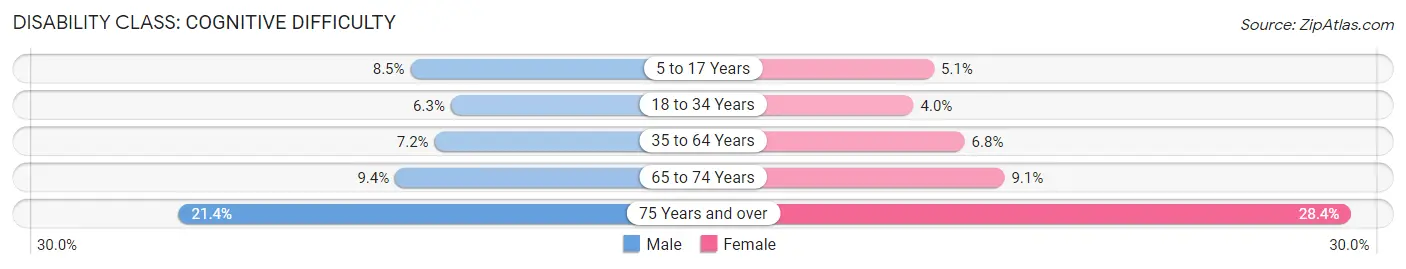
| Age Bracket | Male | Female |
| 5 to 17 Years | 1,838 (8.5%) | 1,111 (5.1%) |
| 18 to 34 Years | 2,224 (6.3%) | 1,567 (4.0%) |
| 35 to 64 Years | 4,120 (7.2%) | 4,707 (6.8%) |
| 65 to 74 Years | 1,576 (9.4%) | 2,121 (9.1%) |
| 75 Years and over | 3,397 (21.4%) | 6,866 (28.4%) |
Disability Class: Ambulatory Difficulty
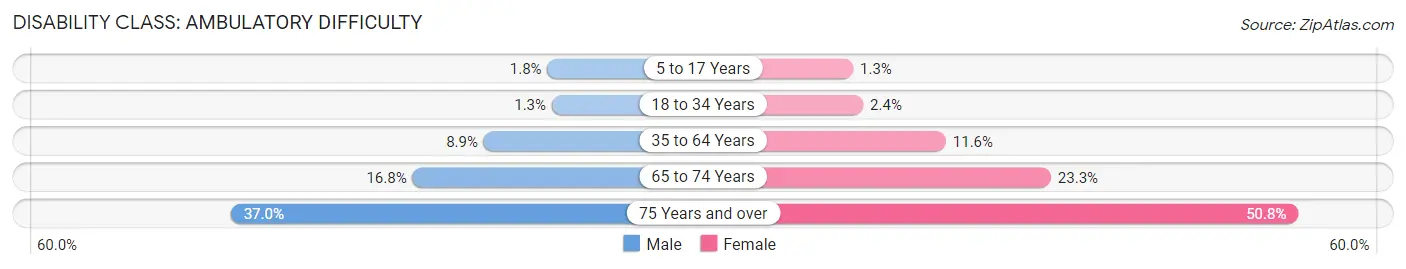
| Age Bracket | Male | Female |
| 5 to 17 Years | 382 (1.8%) | 273 (1.3%) |
| 18 to 34 Years | 455 (1.3%) | 934 (2.4%) |
| 35 to 64 Years | 5,082 (8.9%) | 7,982 (11.6%) |
| 65 to 74 Years | 2,826 (16.8%) | 5,449 (23.3%) |
| 75 Years and over | 5,873 (37.0%) | 12,305 (50.8%) |
Disability Class: Self-Care Difficulty
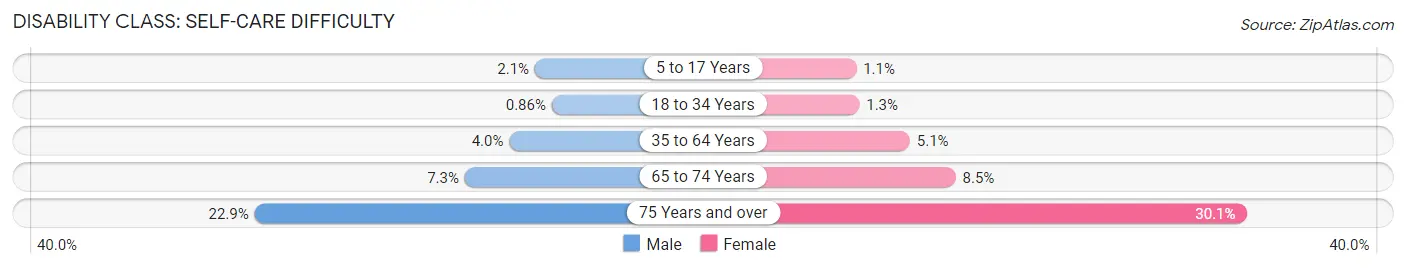
| Age Bracket | Male | Female |
| 5 to 17 Years | 455 (2.1%) | 231 (1.1%) |
| 18 to 34 Years | 306 (0.9%) | 509 (1.3%) |
| 35 to 64 Years | 2,300 (4.0%) | 3,474 (5.1%) |
| 65 to 74 Years | 1,231 (7.3%) | 1,978 (8.5%) |
| 75 Years and over | 3,635 (22.9%) | 7,288 (30.1%) |
Technology Access in San Juan Municipio
Computing Device Access in San Juan Municipio
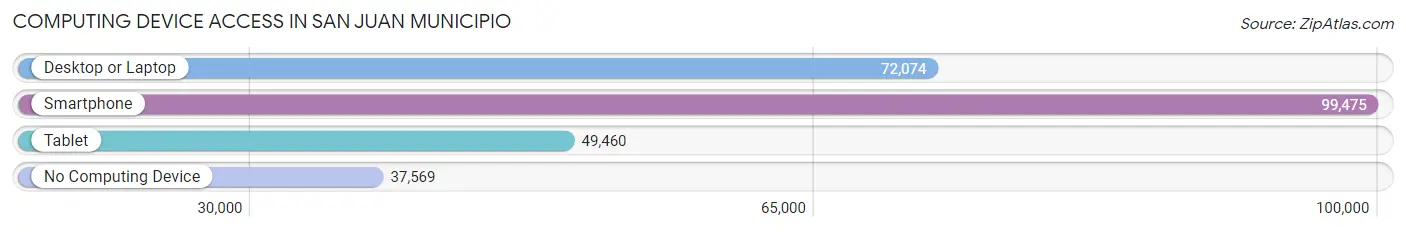
| Device Type | # Households | % Households |
| Desktop or Laptop | 72,074 | 49.0% |
| Smartphone | 99,475 | 67.6% |
| Tablet | 49,460 | 33.6% |
| No Computing Device | 37,569 | 25.6% |
| Total | 147,044 | 100.0% |
Internet Access in San Juan Municipio
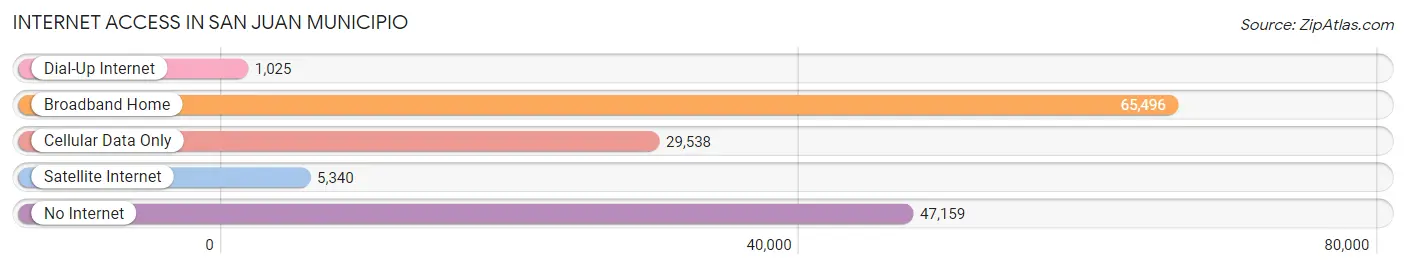
| Internet Type | # Households | % Households |
| Dial-Up Internet | 1,025 | 0.7% |
| Broadband Home | 65,496 | 44.5% |
| Cellular Data Only | 29,538 | 20.1% |
| Satellite Internet | 5,340 | 3.6% |
| No Internet | 47,159 | 32.1% |
| Total | 147,044 | 100.0% |
San Juan Municipio Summary
San Juan Municipio is the capital of Puerto Rico and the most populous municipality in the Caribbean. It is located in the northern coast of the island, south of the Atlantic Ocean. The municipality is home to the largest metropolitan area in the Caribbean, with a population of over two million people.
Geography
San Juan Municipio is located in the northern coast of Puerto Rico, south of the Atlantic Ocean. It is bordered by the municipalities of Bayamón, Carolina, Cataño, Guaynabo, and Trujillo Alto. The municipality covers an area of approximately 87 square miles, making it the largest municipality in Puerto Rico. The terrain is mostly flat, with some hills in the northern part of the municipality. The highest point in the municipality is Cerro de San Juan, which is located in the northern part of the municipality and has an elevation of 1,085 feet.
The municipality is home to several bodies of water, including the San Juan Bay, the San Juan River, and the San Juan Lagoon. The San Juan Bay is a large bay located in the northern part of the municipality, and is connected to the Atlantic Ocean. The San Juan River is a river that runs through the municipality, and is a major source of water for the municipality. The San Juan Lagoon is a large lagoon located in the southern part of the municipality, and is a popular spot for fishing and other recreational activities.
Climate
San Juan Municipio has a tropical climate, with hot and humid summers and mild winters. The average temperature in the municipality is around 80°F, with temperatures ranging from the mid-70s in the winter to the mid-90s in the summer. The municipality receives an average of around 60 inches of rain per year, with the majority of the rain falling in the summer months.
Demographics
As of the 2010 census, San Juan Municipio had a population of 395,326 people. The population is predominantly Hispanic, with around 85% of the population identifying as such. The majority of the population is of Puerto Rican descent, with smaller percentages of people from other Caribbean countries, the United States, and other countries. The median age in the municipality is 37.5 years, with around 25% of the population under the age of 18.
Economy
San Juan Municipio is the economic center of Puerto Rico, and is home to a variety of industries. The municipality is home to several large corporations, including Banco Popular, Cemex, and Walgreens. The municipality is also home to several government agencies, including the Puerto Rico Department of Education, the Puerto Rico Department of Health, and the Puerto Rico Department of Transportation.
The municipality is home to several tourist attractions, including the San Juan National Historic Site, the San Juan Cathedral, and the El Morro Fortress. The municipality is also home to several beaches, including Isla Verde Beach, Condado Beach, and Ocean Park Beach.
San Juan Municipio is also home to several universities, including the University of Puerto Rico, the Interamerican University of Puerto Rico, and the Pontifical Catholic University of Puerto Rico. The municipality is also home to several hospitals, including the San Juan VA Medical Center, the San Juan City Hospital, and the San Juan Children's Hospital.
Conclusion
San Juan Municipio is the capital of Puerto Rico and the most populous municipality in the Caribbean. It is located in the northern coast of the island, south of the Atlantic Ocean. The municipality is home to the largest metropolitan area in the Caribbean, with a population of over two million people. The municipality is home to several large corporations, government agencies, tourist attractions, universities, and hospitals. The population is predominantly Hispanic, with around 85% of the population identifying as such. The economy of the municipality is largely driven by tourism, government, and industry.
Common Questions
What is Per Capita Income in San Juan Municipio?
Per Capita income in San Juan Municipio is $22,553.
What is the Median Family Income in San Juan Municipio?
Median Family Income in San Juan Municipio is $33,876.
What is the Median Household income in San Juan Municipio?
Median Household Income in San Juan Municipio is $26,111.
What is Income or Wage Gap in San Juan Municipio?
Income or Wage Gap in San Juan Municipio is 3.7%.
Women in San Juan Municipio earn 96.3 cents for every dollar earned by a man.
What is Family Income Deficit in San Juan Municipio?
Family Income Deficit in San Juan Municipio is $13,041.
Families that are below poverty line in San Juan Municipio earn $13,041 less on average than the poverty threshold level.
What is Inequality or Gini Index in San Juan Municipio?
Inequality or Gini Index in San Juan Municipio is 0.61.
What is the Total Population of San Juan Municipio?
Total Population of San Juan Municipio is 340,903.
What is the Total Male Population of San Juan Municipio?
Total Male Population of San Juan Municipio is 155,775.
What is the Total Female Population of San Juan Municipio?
Total Female Population of San Juan Municipio is 185,128.
What is the Ratio of Males per 100 Females in San Juan Municipio?
There are 84.14 Males per 100 Females in San Juan Municipio.
What is the Ratio of Females per 100 Males in San Juan Municipio?
There are 118.84 Females per 100 Males in San Juan Municipio.
What is the Median Population Age in San Juan Municipio?
Median Population Age in San Juan Municipio is 45.0 Years.
What is the Average Family Size in San Juan Municipio
Average Family Size in San Juan Municipio is 3.1 People.
What is the Average Household Size in San Juan Municipio
Average Household Size in San Juan Municipio is 2.3 People.
How Large is the Labor Force in San Juan Municipio?
There are 153,003 People in the Labor Forcein in San Juan Municipio.
What is the Percentage of People in the Labor Force in San Juan Municipio?
52.3% of People are in the Labor Force in San Juan Municipio.
What is the Unemployment Rate in San Juan Municipio?
Unemployment Rate in San Juan Municipio is 15.7%.