Sabana Grande Municipio, PR Map & Demographics
Sabana Grande Municipio Map
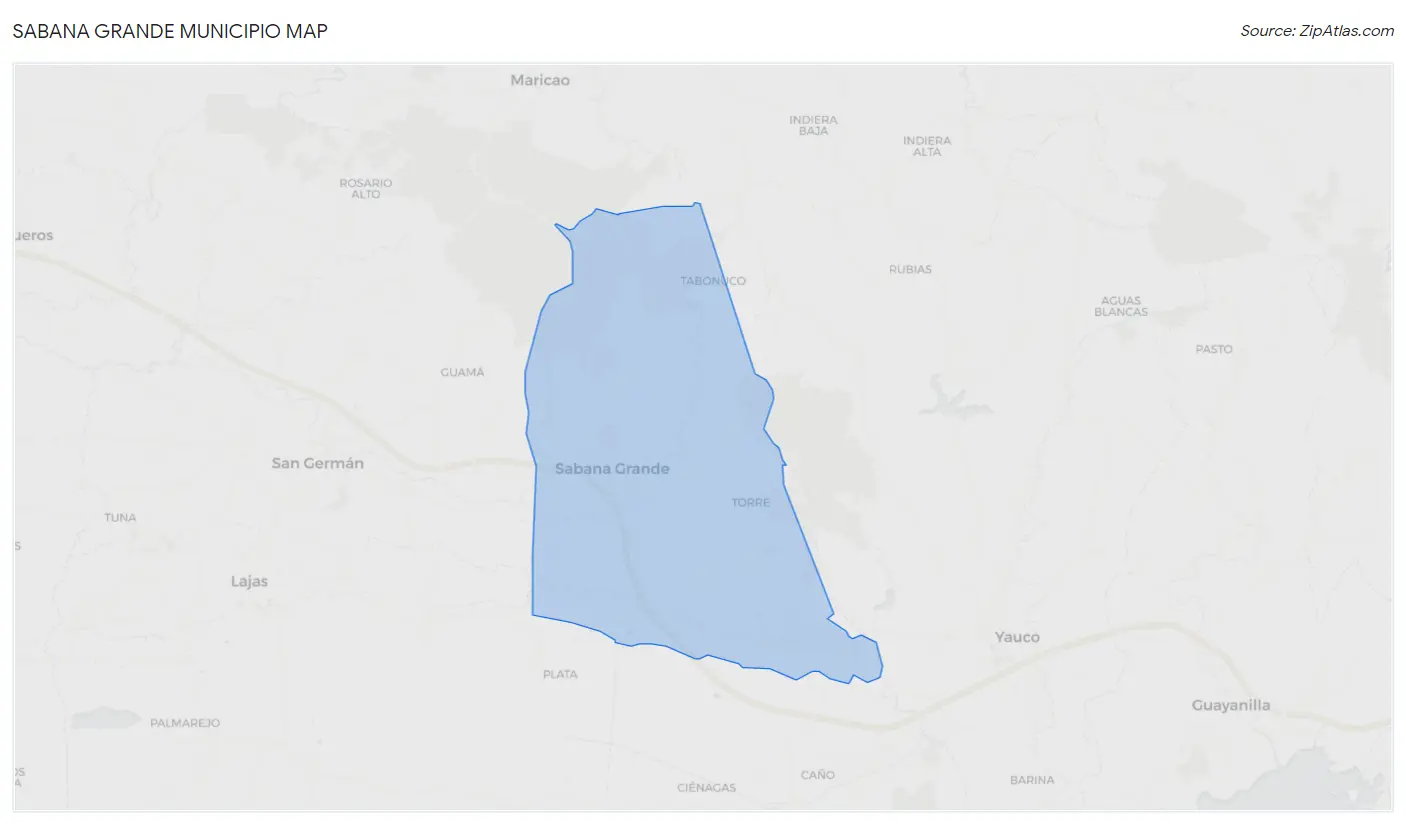
Sabana Grande Municipio Overview
$11,255
PER CAPITA INCOME
$24,957
AVG FAMILY INCOME
$20,464
AVG HOUSEHOLD INCOME
6.6%
WAGE / INCOME GAP [ % ]
93.4¢/ $1
WAGE / INCOME GAP [ $ ]
$7,971
FAMILY INCOME DEFICIT
0.47
INEQUALITY / GINI INDEX
22,639
TOTAL POPULATION
10,557
MALE POPULATION
12,082
FEMALE POPULATION
87.38
MALES / 100 FEMALES
114.45
FEMALES / 100 MALES
44.9
MEDIAN AGE
4.4
AVG FAMILY SIZE
3.2
AVG HOUSEHOLD SIZE
7,240
LABOR FORCE [ PEOPLE ]
37.7%
PERCENT IN LABOR FORCE
11.5%
UNEMPLOYMENT RATE
Sabana Grande Municipio Area Codes
Income in Sabana Grande Municipio
Income Overview in Sabana Grande Municipio
Per Capita Income in Sabana Grande Municipio is $11,255, while median incomes of families and households are $24,957 and $20,464 respectively.
| Characteristic | Number | Measure |
| Per Capita Income | 22,639 | $11,255 |
| Median Family Income | 4,331 | $24,957 |
| Mean Family Income | 4,331 | $34,474 |
| Median Household Income | 7,102 | $20,464 |
| Mean Household Income | 7,102 | $28,827 |
| Income Deficit | 4,331 | $7,971 |
| Wage / Income Gap (%) | 22,639 | 6.60% |
| Wage / Income Gap ($) | 22,639 | 93.40¢ per $1 |
| Gini / Inequality Index | 22,639 | 0.47 |
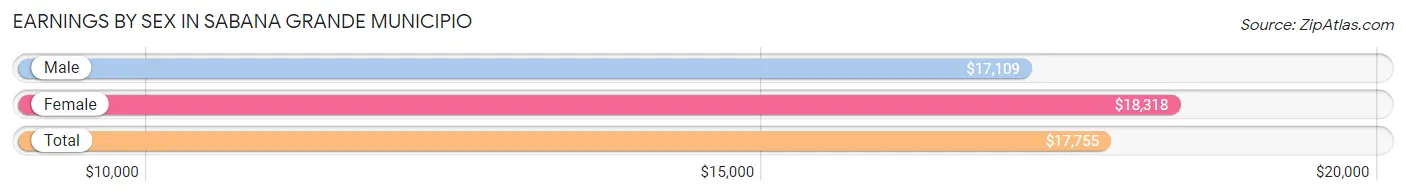
Earnings by Sex in Sabana Grande Municipio
Average Earnings in Sabana Grande Municipio are $17,755, $17,109 for men and $18,318 for women, a difference of 6.6%.
| Sex | Number | Average Earnings |
| Male | 3,467 (51.2%) | $17,109 |
| Female | 3,303 (48.8%) | $18,318 |
| Total | 6,770 (100.0%) | $17,755 |
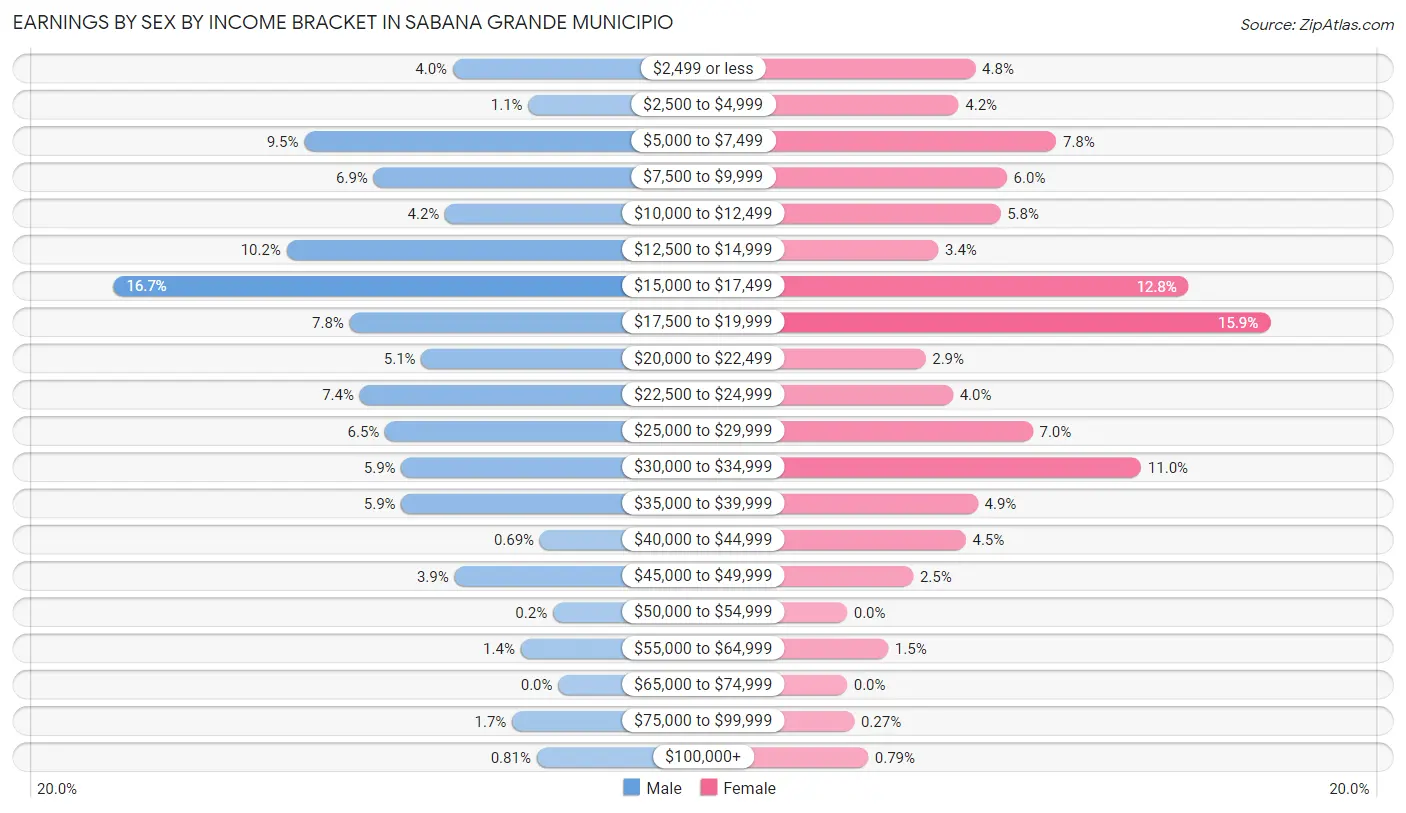
Earnings by Sex by Income Bracket in Sabana Grande Municipio
The most common earnings brackets in Sabana Grande Municipio are $15,000 to $17,499 for men (578 | 16.7%) and $17,500 to $19,999 for women (524 | 15.9%).
| Income | Male | Female |
| $2,499 or less | 137 (4.0%) | 159 (4.8%) |
| $2,500 to $4,999 | 39 (1.1%) | 138 (4.2%) |
| $5,000 to $7,499 | 330 (9.5%) | 259 (7.8%) |
| $7,500 to $9,999 | 240 (6.9%) | 198 (6.0%) |
| $10,000 to $12,499 | 147 (4.2%) | 190 (5.8%) |
| $12,500 to $14,999 | 353 (10.2%) | 113 (3.4%) |
| $15,000 to $17,499 | 578 (16.7%) | 423 (12.8%) |
| $17,500 to $19,999 | 271 (7.8%) | 524 (15.9%) |
| $20,000 to $22,499 | 178 (5.1%) | 97 (2.9%) |
| $22,500 to $24,999 | 258 (7.4%) | 131 (4.0%) |
| $25,000 to $29,999 | 225 (6.5%) | 230 (7.0%) |
| $30,000 to $34,999 | 204 (5.9%) | 364 (11.0%) |
| $35,000 to $39,999 | 204 (5.9%) | 162 (4.9%) |
| $40,000 to $44,999 | 24 (0.7%) | 147 (4.4%) |
| $45,000 to $49,999 | 135 (3.9%) | 82 (2.5%) |
| $50,000 to $54,999 | 7 (0.2%) | 0 (0.0%) |
| $55,000 to $64,999 | 49 (1.4%) | 51 (1.5%) |
| $65,000 to $74,999 | 0 (0.0%) | 0 (0.0%) |
| $75,000 to $99,999 | 60 (1.7%) | 9 (0.3%) |
| $100,000+ | 28 (0.8%) | 26 (0.8%) |
| Total | 3,467 (100.0%) | 3,303 (100.0%) |
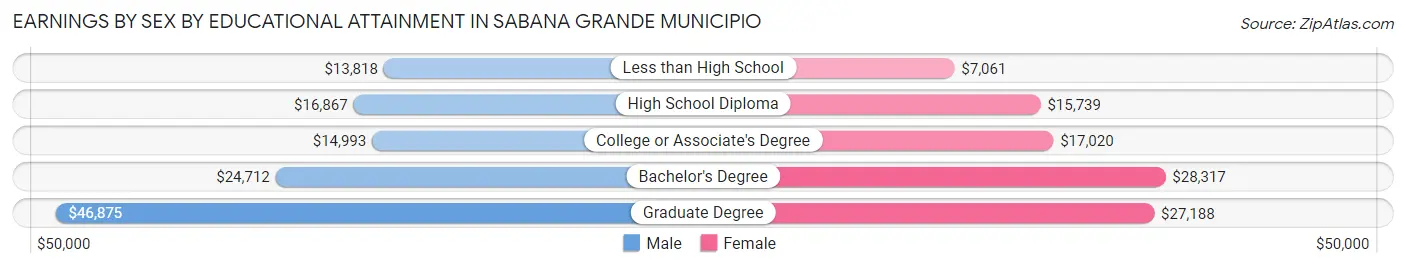
Earnings by Sex by Educational Attainment in Sabana Grande Municipio
Average earnings in Sabana Grande Municipio are $17,828 for men and $18,893 for women, a difference of 5.6%. Men with an educational attainment of graduate degree enjoy the highest average annual earnings of $46,875, while those with less than high school education earn the least with $13,818. Women with an educational attainment of bachelor's degree earn the most with the average annual earnings of $28,317, while those with less than high school education have the smallest earnings of $7,061.
| Educational Attainment | Male Income | Female Income |
| Less than High School | $13,818 | $7,061 |
| High School Diploma | $16,867 | $15,739 |
| College or Associate's Degree | $14,993 | $17,020 |
| Bachelor's Degree | $24,712 | $28,317 |
| Graduate Degree | $46,875 | $27,188 |
| Total | $17,828 | $18,893 |
Family Income in Sabana Grande Municipio
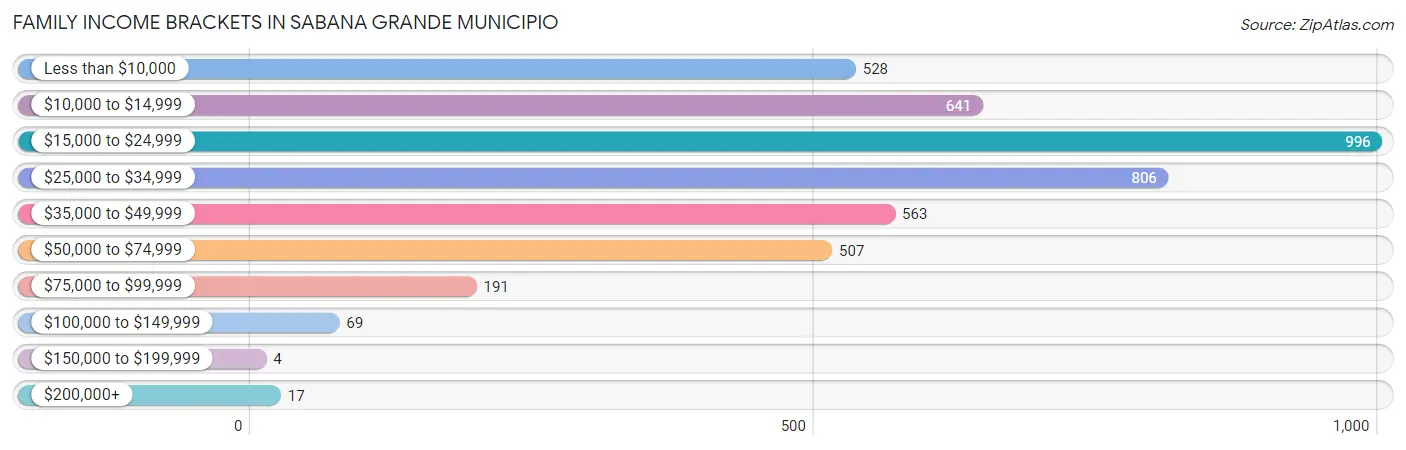
Family Income Brackets in Sabana Grande Municipio
According to the Sabana Grande Municipio family income data, there are 996 families falling into the $15,000 to $24,999 income range, which is the most common income bracket and makes up 23.0% of all families. Conversely, the $150,000 to $199,999 income bracket is the least frequent group with only 4 families (0.1%) belonging to this category.
| Income Bracket | # Families | % Families |
| Less than $10,000 | 528 | 12.2% |
| $10,000 to $14,999 | 641 | 14.8% |
| $15,000 to $24,999 | 996 | 23.0% |
| $25,000 to $34,999 | 806 | 18.6% |
| $35,000 to $49,999 | 563 | 13.0% |
| $50,000 to $74,999 | 507 | 11.7% |
| $75,000 to $99,999 | 191 | 4.4% |
| $100,000 to $149,999 | 69 | 1.6% |
| $150,000 to $199,999 | 4 | 0.1% |
| $200,000+ | 17 | 0.4% |
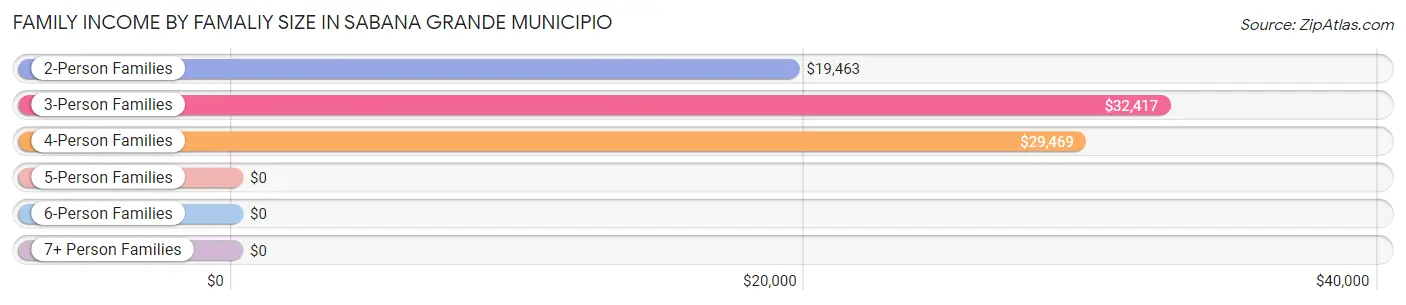
Family Income by Famaliy Size in Sabana Grande Municipio
3-person families (1,288 | 29.7%) account for the highest median family income in Sabana Grande Municipio with $32,417 per family, while 3-person families (1,288 | 29.7%) have the highest median income of $10,806 per family member.
| Income Bracket | # Families | Median Income |
| 2-Person Families | 2,350 (54.3%) | $19,463 |
| 3-Person Families | 1,288 (29.7%) | $32,417 |
| 4-Person Families | 543 (12.5%) | $29,469 |
| 5-Person Families | 91 (2.1%) | $0 |
| 6-Person Families | 42 (1.0%) | $0 |
| 7+ Person Families | 17 (0.4%) | $0 |
| Total | 4,331 (100.0%) | $24,957 |
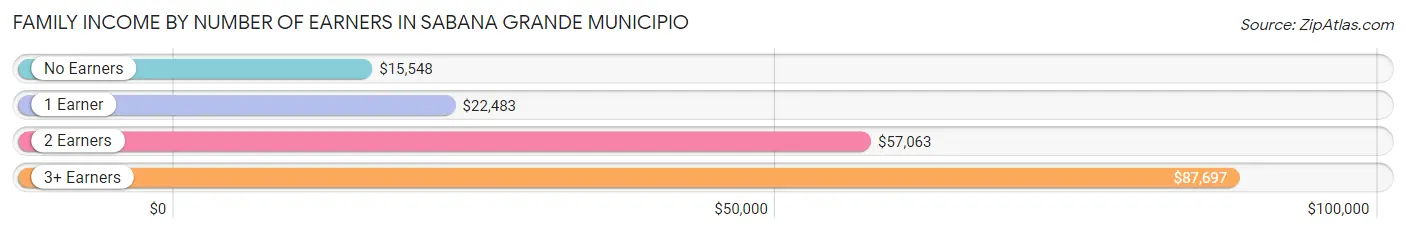
Family Income by Number of Earners in Sabana Grande Municipio
The median family income in Sabana Grande Municipio is $24,957, with families comprising 3+ earners (109) having the highest median family income of $87,697, while families with no earners (1,816) have the lowest median family income of $15,548, accounting for 2.5% and 41.9% of families, respectively.
| Number of Earners | # Families | Median Income |
| No Earners | 1,816 (41.9%) | $15,548 |
| 1 Earner | 1,721 (39.7%) | $22,483 |
| 2 Earners | 685 (15.8%) | $57,063 |
| 3+ Earners | 109 (2.5%) | $87,697 |
| Total | 4,331 (100.0%) | $24,957 |
Household Income in Sabana Grande Municipio
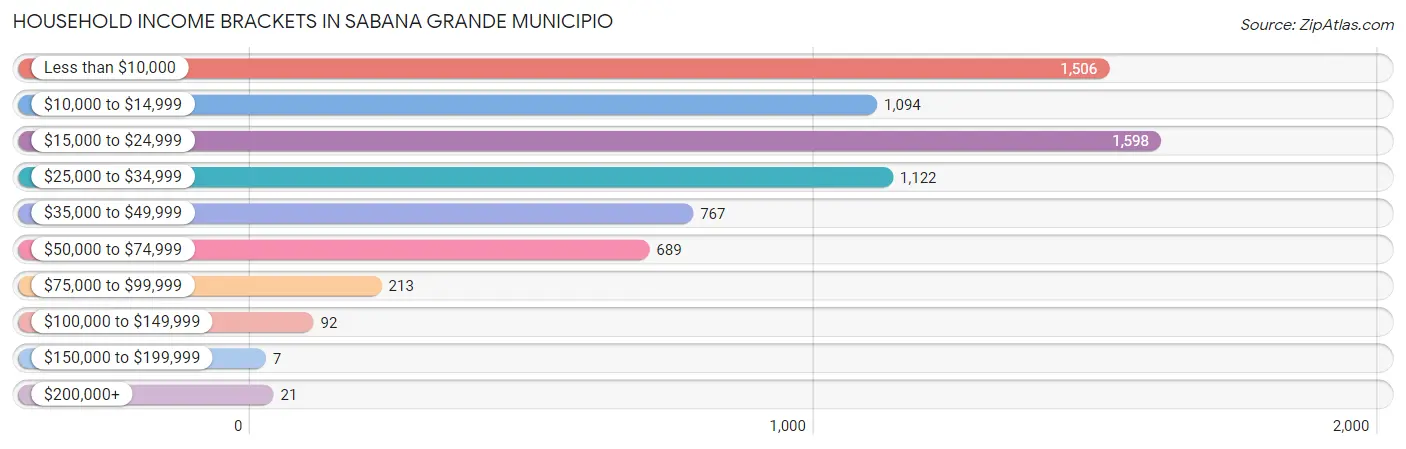
Household Income Brackets in Sabana Grande Municipio
With 1,598 households falling in the category, the $15,000 to $24,999 income range is the most frequent in Sabana Grande Municipio, accounting for 22.5% of all households. In contrast, only 7 households (0.1%) fall into the $150,000 to $199,999 income bracket, making it the least populous group.
| Income Bracket | # Households | % Households |
| Less than $10,000 | 1,506 | 21.2% |
| $10,000 to $14,999 | 1,094 | 15.4% |
| $15,000 to $24,999 | 1,598 | 22.5% |
| $25,000 to $34,999 | 1,122 | 15.8% |
| $35,000 to $49,999 | 767 | 10.8% |
| $50,000 to $74,999 | 689 | 9.7% |
| $75,000 to $99,999 | 213 | 3.0% |
| $100,000 to $149,999 | 92 | 1.3% |
| $150,000 to $199,999 | 7 | 0.1% |
| $200,000+ | 21 | 0.3% |
Household Income by Householder Age in Sabana Grande Municipio
The median household income in Sabana Grande Municipio is $20,464, with the highest median household income of $26,377 found in the 45 to 64 years age bracket for the primary householder. A total of 2,579 households (36.3%) fall into this category. Meanwhile, the 15 to 24 years age bracket for the primary householder has the lowest median household income of $0, with 72 households (1.0%) in this group.
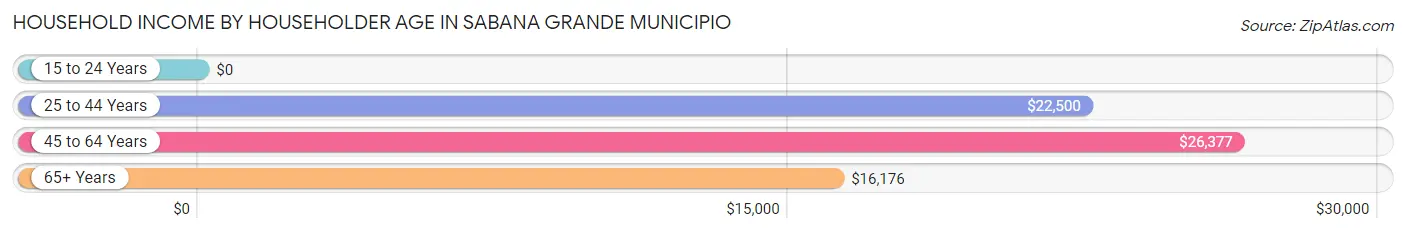
| Income Bracket | # Households | Median Income |
| 15 to 24 Years | 72 (1.0%) | $0 |
| 25 to 44 Years | 1,348 (19.0%) | $22,500 |
| 45 to 64 Years | 2,579 (36.3%) | $26,377 |
| 65+ Years | 3,103 (43.7%) | $16,176 |
| Total | 7,102 (100.0%) | $20,464 |
Poverty in Sabana Grande Municipio
Income Below Poverty by Sex and Age in Sabana Grande Municipio
With 43.6% poverty level for males and 48.1% for females among the residents of Sabana Grande Municipio, 5 year old males and 5 year old females are the most vulnerable to poverty, with 39 males (100.0%) and 13 females (100.0%) in their respective age groups living below the poverty level.
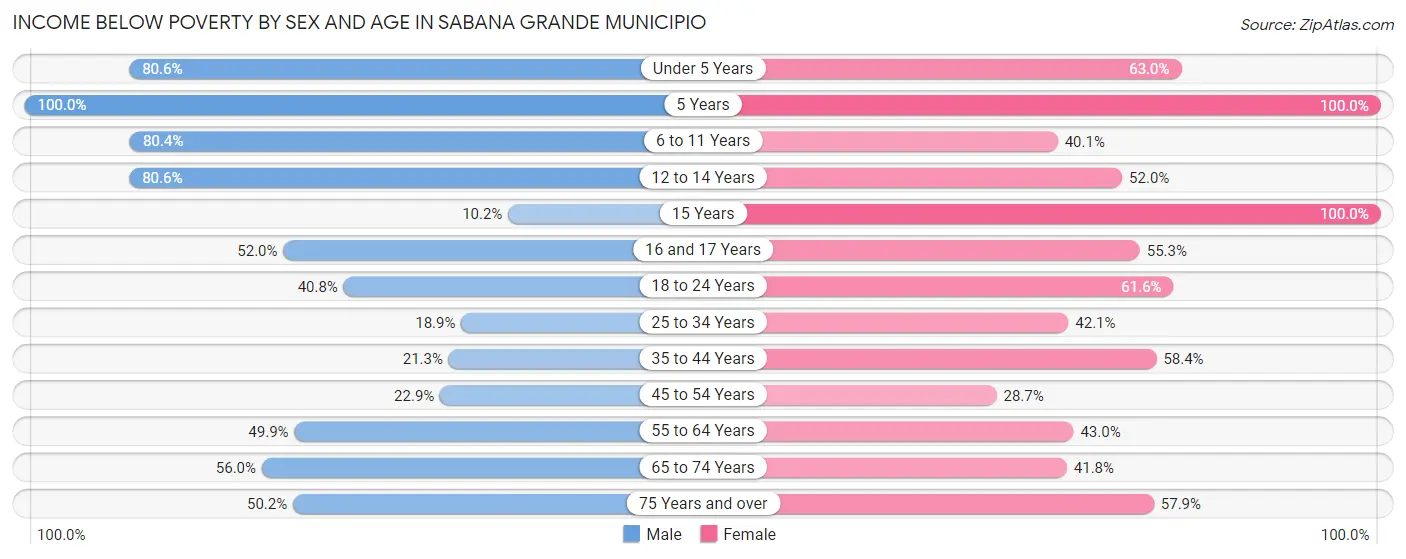
| Age Bracket | Male | Female |
| Under 5 Years | 170 (80.6%) | 356 (63.0%) |
| 5 Years | 39 (100.0%) | 13 (100.0%) |
| 6 to 11 Years | 526 (80.4%) | 317 (40.1%) |
| 12 to 14 Years | 427 (80.6%) | 191 (52.0%) |
| 15 Years | 17 (10.2%) | 66 (100.0%) |
| 16 and 17 Years | 224 (52.0%) | 78 (55.3%) |
| 18 to 24 Years | 570 (40.8%) | 810 (61.6%) |
| 25 to 34 Years | 179 (18.9%) | 460 (42.0%) |
| 35 to 44 Years | 256 (21.3%) | 789 (58.4%) |
| 45 to 54 Years | 309 (22.9%) | 444 (28.7%) |
| 55 to 64 Years | 622 (49.9%) | 704 (43.0%) |
| 65 to 74 Years | 699 (56.0%) | 663 (41.8%) |
| 75 Years and over | 547 (50.2%) | 874 (57.9%) |
| Total | 4,585 (43.6%) | 5,765 (48.1%) |
Income Above Poverty by Sex and Age in Sabana Grande Municipio
According to the poverty statistics in Sabana Grande Municipio, males aged 15 years and females aged 45 to 54 years are the age groups that are most secure financially, with 89.8% of males and 71.3% of females in these age groups living above the poverty line.
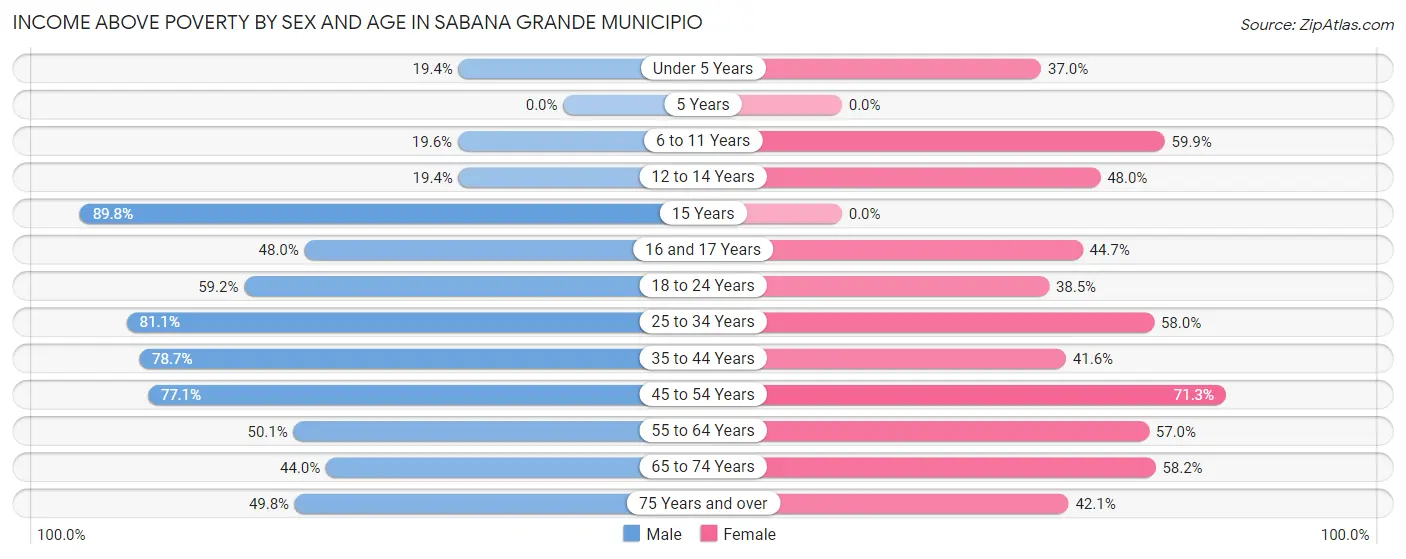
| Age Bracket | Male | Female |
| Under 5 Years | 41 (19.4%) | 209 (37.0%) |
| 5 Years | 0 (0.0%) | 0 (0.0%) |
| 6 to 11 Years | 128 (19.6%) | 474 (59.9%) |
| 12 to 14 Years | 103 (19.4%) | 176 (48.0%) |
| 15 Years | 149 (89.8%) | 0 (0.0%) |
| 16 and 17 Years | 207 (48.0%) | 63 (44.7%) |
| 18 to 24 Years | 828 (59.2%) | 506 (38.5%) |
| 25 to 34 Years | 766 (81.1%) | 634 (58.0%) |
| 35 to 44 Years | 948 (78.7%) | 562 (41.6%) |
| 45 to 54 Years | 1,042 (77.1%) | 1,102 (71.3%) |
| 55 to 64 Years | 624 (50.1%) | 933 (57.0%) |
| 65 to 74 Years | 550 (44.0%) | 924 (58.2%) |
| 75 Years and over | 543 (49.8%) | 635 (42.1%) |
| Total | 5,929 (56.4%) | 6,218 (51.9%) |
Income Below Poverty Among Married-Couple Families in Sabana Grande Municipio
The poverty statistics for married-couple families in Sabana Grande Municipio show that 38.6% or 903 of the total 2,337 families live below the poverty line. Families with 3 or 4 children have the highest poverty rate of 100.0%, comprising of 36 families. On the other hand, families with 1 or 2 children have the lowest poverty rate of 33.7%, which includes 168 families.
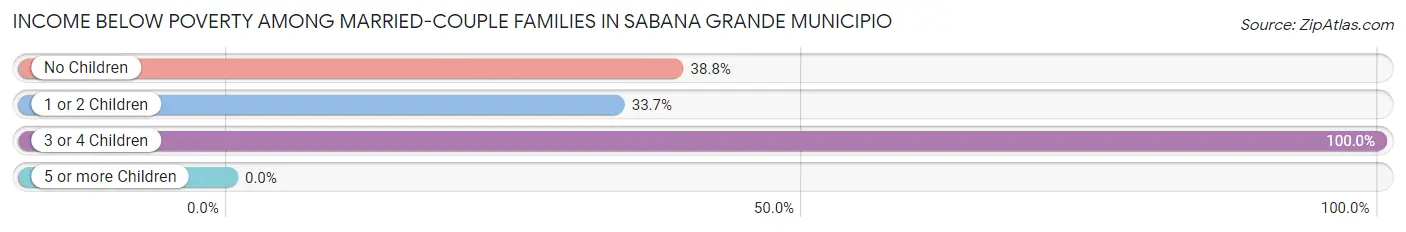
| Children | Above Poverty | Below Poverty |
| No Children | 1,103 (61.2%) | 699 (38.8%) |
| 1 or 2 Children | 331 (66.3%) | 168 (33.7%) |
| 3 or 4 Children | 0 (0.0%) | 36 (100.0%) |
| 5 or more Children | 0 (0.0%) | 0 (0.0%) |
| Total | 1,434 (61.4%) | 903 (38.6%) |
Income Below Poverty Among Single-Parent Households in Sabana Grande Municipio
According to the poverty data in Sabana Grande Municipio, 62.0% or 467 single-father households and 45.7% or 567 single-mother households are living below the poverty line. Among single-father households, those with no children have the highest poverty rate, with 358 households (64.3%) experiencing poverty. Likewise, among single-mother households, those with 3 or 4 children have the highest poverty rate, with 131 households (100.0%) falling below the poverty line.
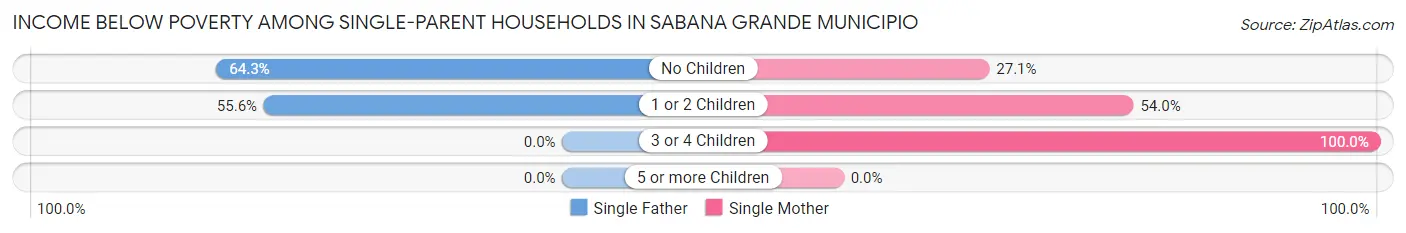
| Children | Single Father | Single Mother |
| No Children | 358 (64.3%) | 165 (27.1%) |
| 1 or 2 Children | 109 (55.6%) | 271 (54.0%) |
| 3 or 4 Children | 0 (0.0%) | 131 (100.0%) |
| 5 or more Children | 0 (0.0%) | 0 (0.0%) |
| Total | 467 (62.0%) | 567 (45.7%) |
Income Below Poverty Among Married-Couple vs Single-Parent Households in Sabana Grande Municipio
The poverty data for Sabana Grande Municipio shows that 903 of the married-couple family households (38.6%) and 1,034 of the single-parent households (51.9%) are living below the poverty level. Within the married-couple family households, those with 3 or 4 children have the highest poverty rate, with 36 households (100.0%) falling below the poverty line. Among the single-parent households, those with 3 or 4 children have the highest poverty rate, with 131 household (100.0%) living below poverty.
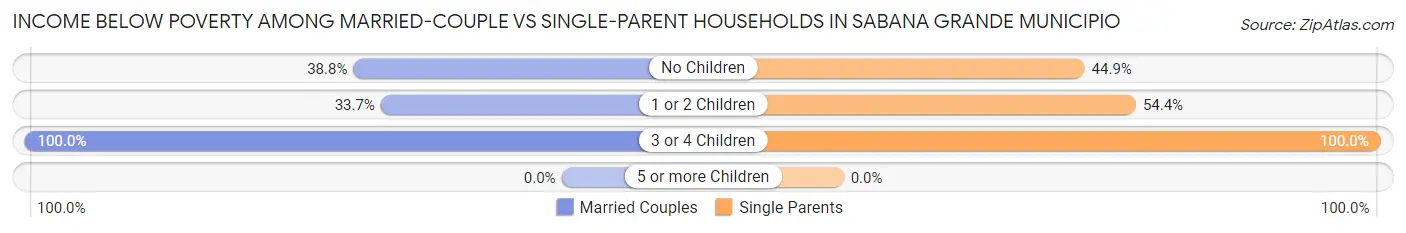
| Children | Married-Couple Families | Single-Parent Households |
| No Children | 699 (38.8%) | 523 (44.9%) |
| 1 or 2 Children | 168 (33.7%) | 380 (54.4%) |
| 3 or 4 Children | 36 (100.0%) | 131 (100.0%) |
| 5 or more Children | 0 (0.0%) | 0 (0.0%) |
| Total | 903 (38.6%) | 1,034 (51.9%) |
Race in Sabana Grande Municipio
The most populous races in Sabana Grande Municipio are Hispanic or Latino (22,457 | 99.2%), White / Caucasian (14,684 | 64.9%), and Some other Race (5,198 | 23.0%).
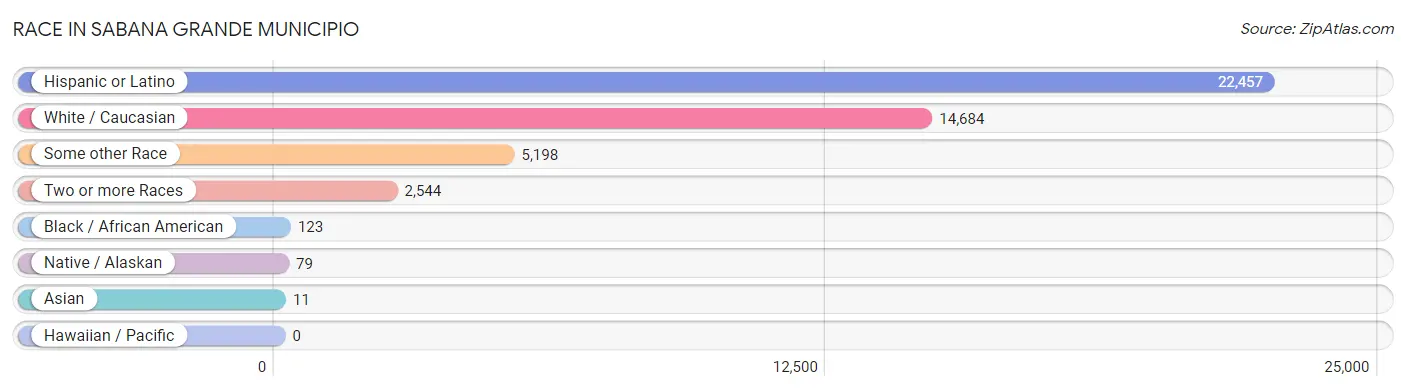
| Race | # Population | % Population |
| Asian | 11 | 0.1% |
| Black / African American | 123 | 0.5% |
| Hawaiian / Pacific | 0 | 0.0% |
| Hispanic or Latino | 22,457 | 99.2% |
| Native / Alaskan | 79 | 0.4% |
| White / Caucasian | 14,684 | 64.9% |
| Two or more Races | 2,544 | 11.2% |
| Some other Race | 5,198 | 23.0% |
| Total | 22,639 | 100.0% |
Ancestry in Sabana Grande Municipio
The most populous ancestries reported in Sabana Grande Municipio are Puerto Rican (22,405 | 99.0%), Central American Indian (256 | 1.1%), American (242 | 1.1%), Dominican (26 | 0.1%), and African (13 | 0.1%), together accounting for 101.3% of all Sabana Grande Municipio residents.
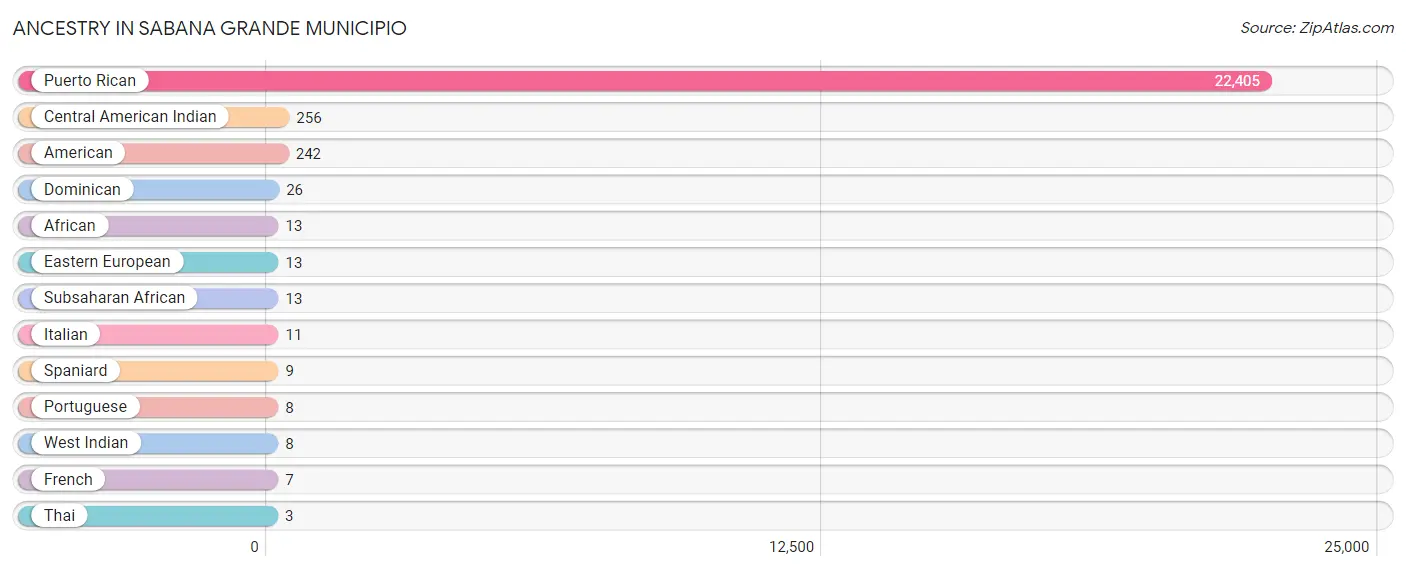
| Ancestry | # Population | % Population |
| African | 13 | 0.1% |
| American | 242 | 1.1% |
| Central American Indian | 256 | 1.1% |
| Dominican | 26 | 0.1% |
| Eastern European | 13 | 0.1% |
| French | 7 | 0.0% |
| Italian | 11 | 0.1% |
| Portuguese | 8 | 0.0% |
| Puerto Rican | 22,405 | 99.0% |
| Spaniard | 9 | 0.0% |
| Subsaharan African | 13 | 0.1% |
| Thai | 3 | 0.0% |
| West Indian | 8 | 0.0% | View All 13 Rows |
Immigrants in Sabana Grande Municipio

| Immigration Origin | # Population | % Population | View All 0 Rows |
Sex and Age in Sabana Grande Municipio
Sex and Age in Sabana Grande Municipio
The most populous age groups in Sabana Grande Municipio are 15 to 19 Years (1,010 | 9.6%) for men and 20 to 24 Years (920 | 7.6%) for women.
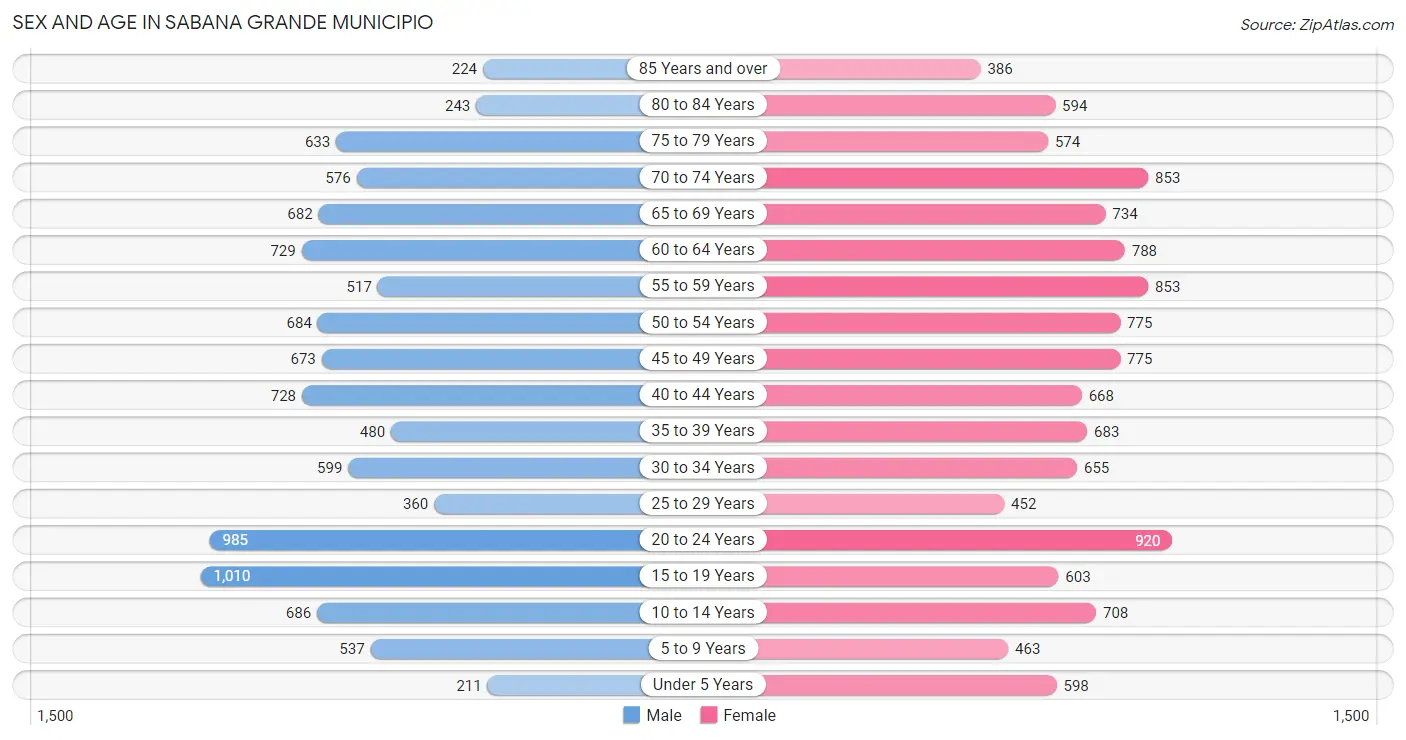
| Age Bracket | Male | Female |
| Under 5 Years | 211 (2.0%) | 598 (5.0%) |
| 5 to 9 Years | 537 (5.1%) | 463 (3.8%) |
| 10 to 14 Years | 686 (6.5%) | 708 (5.9%) |
| 15 to 19 Years | 1,010 (9.6%) | 603 (5.0%) |
| 20 to 24 Years | 985 (9.3%) | 920 (7.6%) |
| 25 to 29 Years | 360 (3.4%) | 452 (3.7%) |
| 30 to 34 Years | 599 (5.7%) | 655 (5.4%) |
| 35 to 39 Years | 480 (4.5%) | 683 (5.7%) |
| 40 to 44 Years | 728 (6.9%) | 668 (5.5%) |
| 45 to 49 Years | 673 (6.4%) | 775 (6.4%) |
| 50 to 54 Years | 684 (6.5%) | 775 (6.4%) |
| 55 to 59 Years | 517 (4.9%) | 853 (7.1%) |
| 60 to 64 Years | 729 (6.9%) | 788 (6.5%) |
| 65 to 69 Years | 682 (6.5%) | 734 (6.1%) |
| 70 to 74 Years | 576 (5.5%) | 853 (7.1%) |
| 75 to 79 Years | 633 (6.0%) | 574 (4.8%) |
| 80 to 84 Years | 243 (2.3%) | 594 (4.9%) |
| 85 Years and over | 224 (2.1%) | 386 (3.2%) |
| Total | 10,557 (100.0%) | 12,082 (100.0%) |
Families and Households in Sabana Grande Municipio
Median Family Size in Sabana Grande Municipio
The median family size in Sabana Grande Municipio is 4.40 persons per family, with single male/father families (753 | 17.4%) accounting for the largest median family size of 4.9 persons per family. On the other hand, married-couple families (2,337 | 54.0%) represent the smallest median family size with 4.12 persons per family.
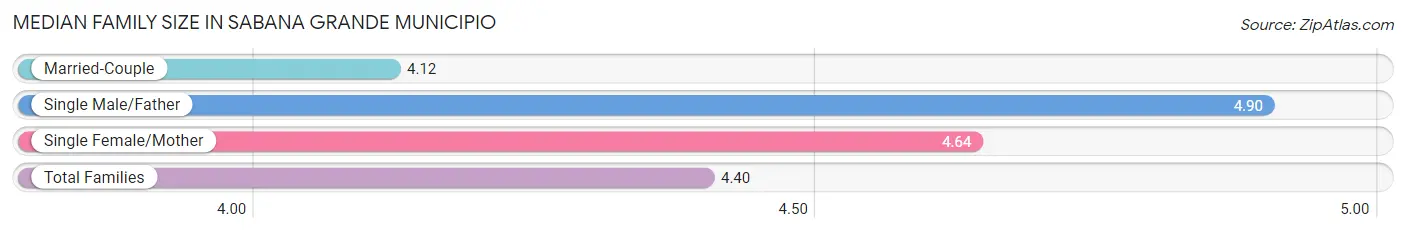
| Family Type | # Families | Family Size |
| Married-Couple | 2,337 (54.0%) | 4.12 |
| Single Male/Father | 753 (17.4%) | 4.90 |
| Single Female/Mother | 1,241 (28.6%) | 4.64 |
| Total Families | 4,331 (100.0%) | 4.40 |
Median Household Size in Sabana Grande Municipio
The median household size in Sabana Grande Municipio is 3.16 persons per household, with single male/father households (753 | 10.6%) accounting for the largest median household size of 5.03 persons per household. non-family households (2,771 | 39.0%) represent the smallest median household size with 1.12 persons per household.
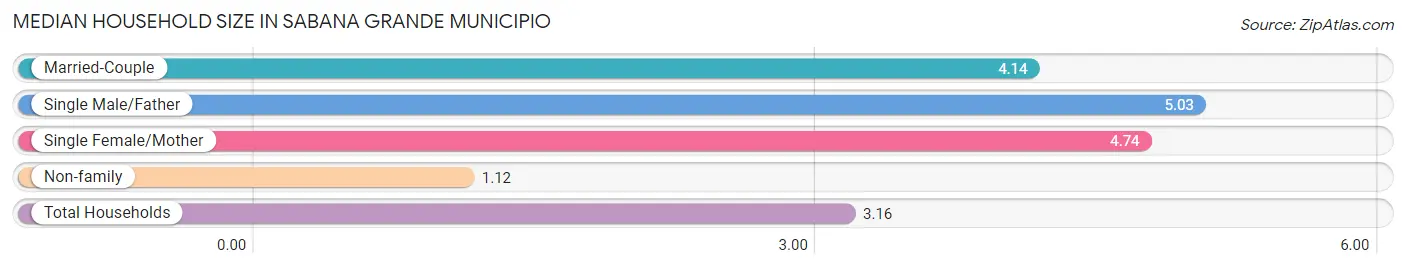
| Household Type | # Households | Household Size |
| Married-Couple | 2,337 (32.9%) | 4.14 |
| Single Male/Father | 753 (10.6%) | 5.03 |
| Single Female/Mother | 1,241 (17.5%) | 4.74 |
| Non-family | 2,771 (39.0%) | 1.12 |
| Total Households | 7,102 (100.0%) | 3.16 |
Household Size by Marriage Status in Sabana Grande Municipio
Out of a total of 7,102 households in Sabana Grande Municipio, 4,331 (61.0%) are family households, while 2,771 (39.0%) are nonfamily households. The most numerous type of family households are 2-person households, comprising 2,167, and the most common type of nonfamily households are 1-person households, comprising 2,505.
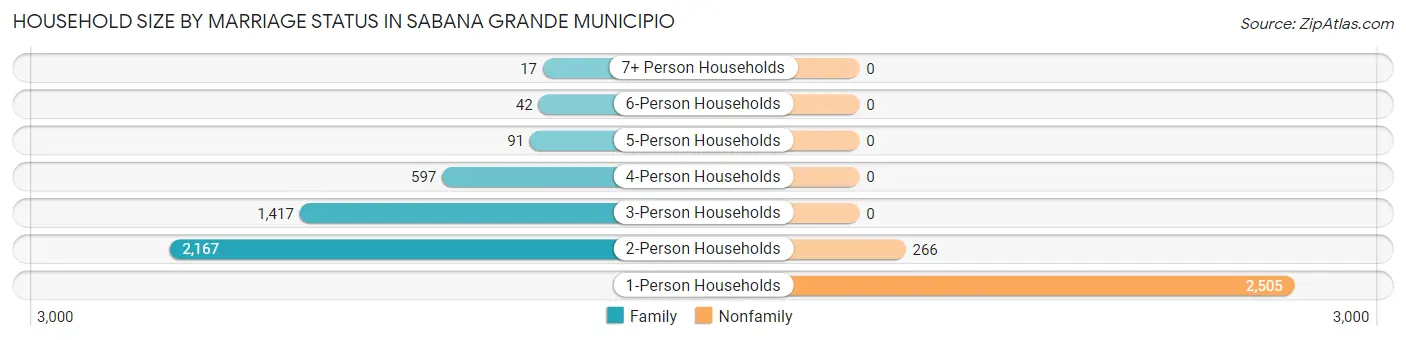
| Household Size | Family Households | Nonfamily Households |
| 1-Person Households | - | 2,505 (35.3%) |
| 2-Person Households | 2,167 (30.5%) | 266 (3.7%) |
| 3-Person Households | 1,417 (20.0%) | 0 (0.0%) |
| 4-Person Households | 597 (8.4%) | 0 (0.0%) |
| 5-Person Households | 91 (1.3%) | 0 (0.0%) |
| 6-Person Households | 42 (0.6%) | 0 (0.0%) |
| 7+ Person Households | 17 (0.2%) | 0 (0.0%) |
| Total | 4,331 (61.0%) | 2,771 (39.0%) |
Female Fertility in Sabana Grande Municipio
Fertility by Age in Sabana Grande Municipio
Average fertility rate in Sabana Grande Municipio is 22.0 births per 1,000 women. Women in the age bracket of 15 to 19 years have the highest fertility rate with 136.0 births per 1,000 women. Women in the age bracket of 15 to 19 years acount for 77.4% of all women with births.
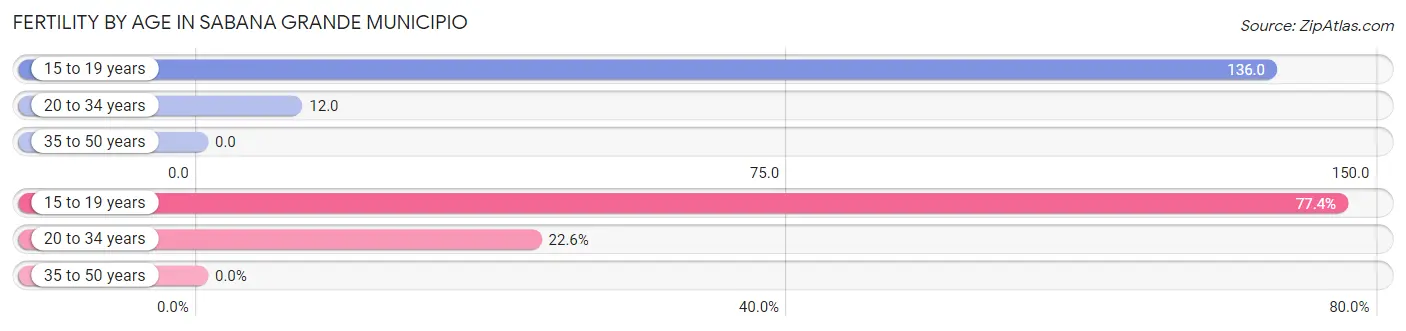
| Age Bracket | Women with Births | Births / 1,000 Women |
| 15 to 19 years | 82 (77.4%) | 136.0 |
| 20 to 34 years | 24 (22.6%) | 12.0 |
| 35 to 50 years | 0 (0.0%) | 0.0 |
| Total | 106 (100.0%) | 22.0 |
Fertility by Age by Marriage Status in Sabana Grande Municipio
22.6% of women with births (106) in Sabana Grande Municipio are married. The highest percentage of unmarried women with births falls into 15 to 19 years age bracket with 100.0% of them unmarried at the time of birth, while the lowest percentage of unmarried women with births belong to 20 to 34 years age bracket with 0.0% of them unmarried.
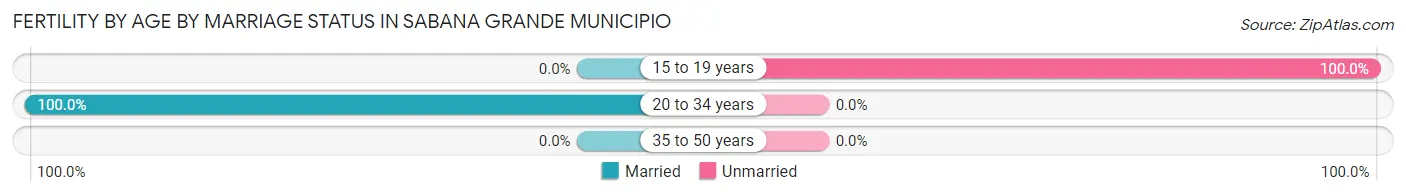
| Age Bracket | Married | Unmarried |
| 15 to 19 years | 0 (0.0%) | 82 (100.0%) |
| 20 to 34 years | 24 (100.0%) | 0 (0.0%) |
| 35 to 50 years | 0 (0.0%) | 0 (0.0%) |
| Total | 24 (22.6%) | 82 (77.4%) |
Fertility by Education in Sabana Grande Municipio
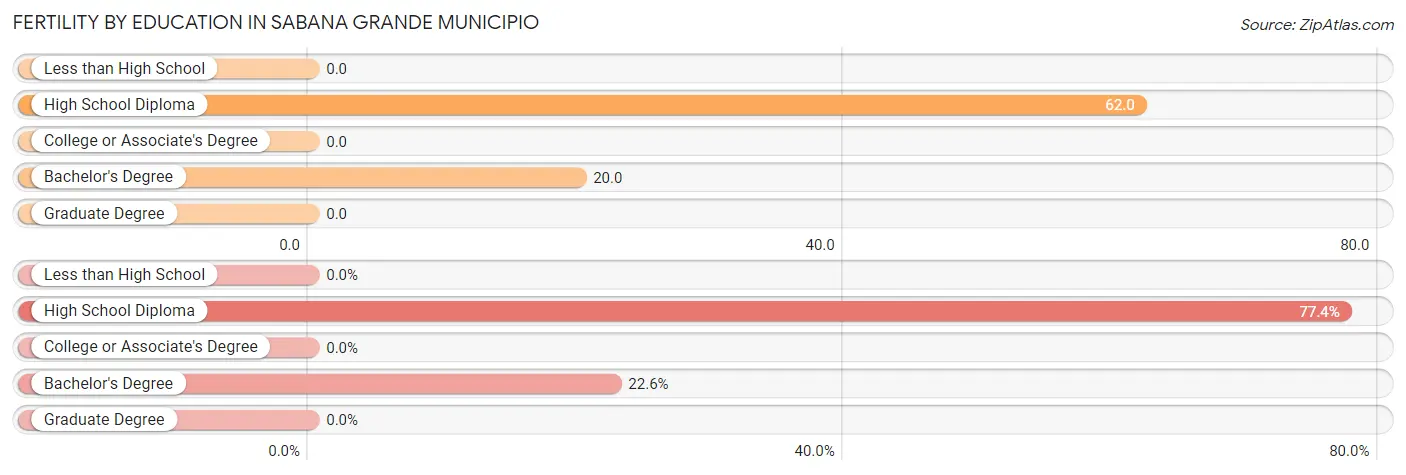
| Educational Attainment | Women with Births | Births / 1,000 Women |
| Less than High School | 0 (0.0%) | 0.0 |
| High School Diploma | 82 (77.4%) | 62.0 |
| College or Associate's Degree | 0 (0.0%) | 0.0 |
| Bachelor's Degree | 24 (22.6%) | 20.0 |
| Graduate Degree | 0 (0.0%) | 0.0 |
| Total | 106 (100.0%) | 22.0 |
Fertility by Education by Marriage Status in Sabana Grande Municipio
77.4% of women with births in Sabana Grande Municipio are unmarried. Women with the educational attainment of bachelor's degree are most likely to be married with 100.0% of them married at childbirth, while women with the educational attainment of high school diploma are least likely to be married with 100.0% of them unmarried at childbirth.
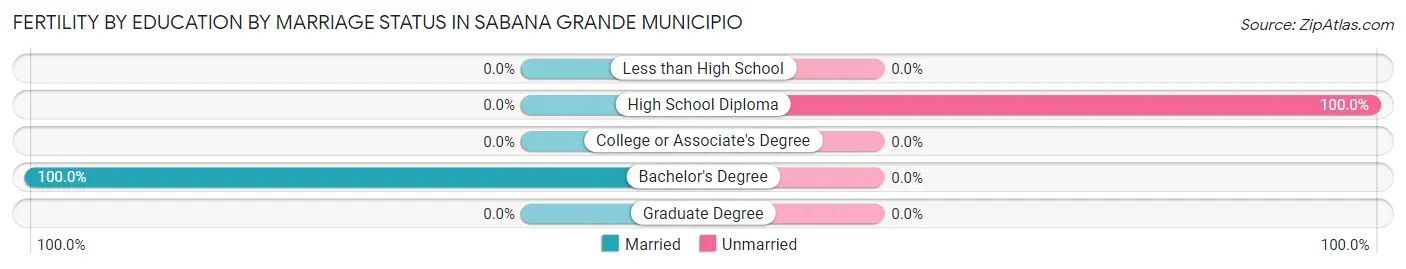
| Educational Attainment | Married | Unmarried |
| Less than High School | 0 (0.0%) | 0 (0.0%) |
| High School Diploma | 0 (0.0%) | 82 (100.0%) |
| College or Associate's Degree | 0 (0.0%) | 0 (0.0%) |
| Bachelor's Degree | 24 (100.0%) | 0 (0.0%) |
| Graduate Degree | 0 (0.0%) | 0 (0.0%) |
| Total | 24 (22.6%) | 82 (77.4%) |
Employment Characteristics in Sabana Grande Municipio
Employment by Class of Employer in Sabana Grande Municipio
Among the 6,360 employed individuals in Sabana Grande Municipio, private company employees (3,726 | 58.6%), state government employees (1,197 | 18.8%), and local government employees (557 | 8.8%) make up the most common classes of employment.
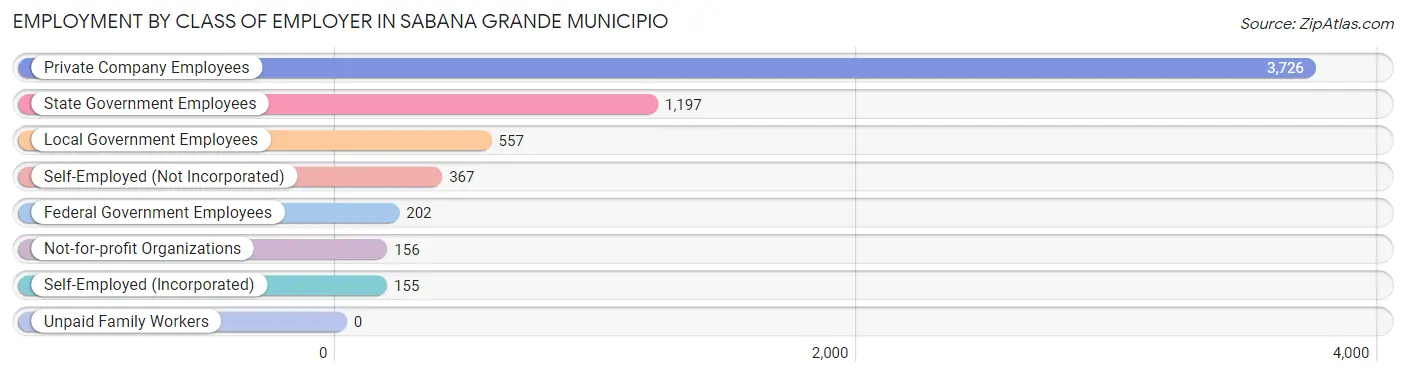
| Employer Class | # Employees | % Employees |
| Private Company Employees | 3,726 | 58.6% |
| Self-Employed (Incorporated) | 155 | 2.4% |
| Self-Employed (Not Incorporated) | 367 | 5.8% |
| Not-for-profit Organizations | 156 | 2.5% |
| Local Government Employees | 557 | 8.8% |
| State Government Employees | 1,197 | 18.8% |
| Federal Government Employees | 202 | 3.2% |
| Unpaid Family Workers | 0 | 0.0% |
| Total | 6,360 | 100.0% |
Employment Status by Age in Sabana Grande Municipio
According to the labor force statistics for Sabana Grande Municipio, out of the total population over 16 years of age (19,204), 37.7% or 7,240 individuals are in the labor force, with 11.5% or 833 of them unemployed. The age group with the highest labor force participation rate is 25 to 29 years, with 73.6% or 598 individuals in the labor force. Within the labor force, the 20 to 24 years age range has the highest percentage of unemployed individuals, with 35.2% or 244 of them being unemployed.
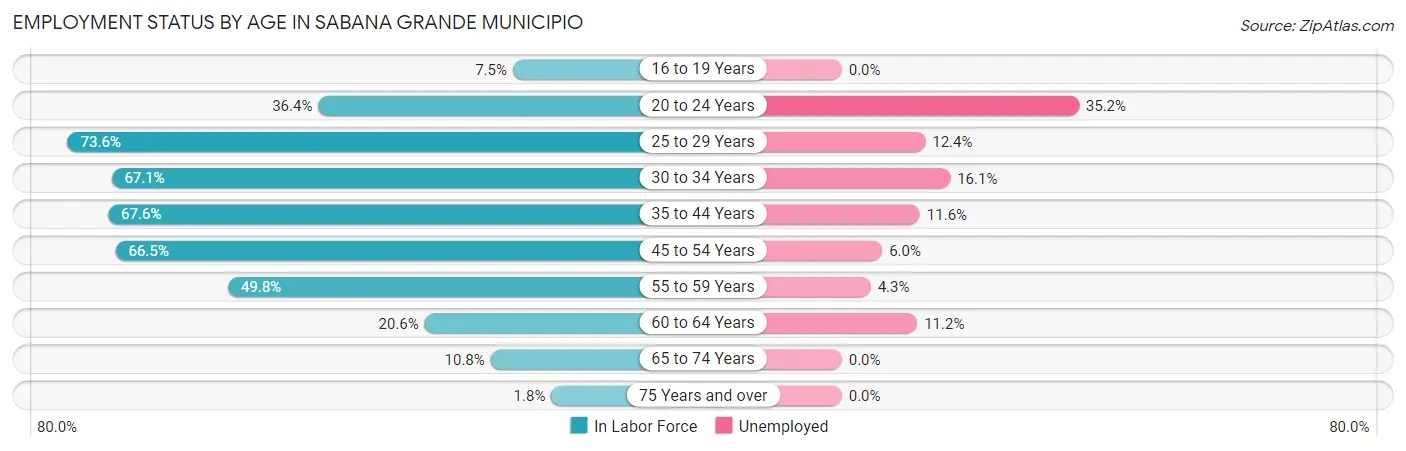
| Age Bracket | In Labor Force | Unemployed |
| 16 to 19 Years | 104 (7.5%) | 0 (0.0%) |
| 20 to 24 Years | 693 (36.4%) | 244 (35.2%) |
| 25 to 29 Years | 598 (73.6%) | 74 (12.4%) |
| 30 to 34 Years | 841 (67.1%) | 135 (16.1%) |
| 35 to 44 Years | 1,730 (67.6%) | 201 (11.6%) |
| 45 to 54 Years | 1,933 (66.5%) | 116 (6.0%) |
| 55 to 59 Years | 682 (49.8%) | 29 (4.3%) |
| 60 to 64 Years | 313 (20.6%) | 35 (11.2%) |
| 65 to 74 Years | 307 (10.8%) | 0 (0.0%) |
| 75 Years and over | 48 (1.8%) | 0 (0.0%) |
| Total | 7,240 (37.7%) | 833 (11.5%) |
Employment Status by Educational Attainment in Sabana Grande Municipio
According to labor force statistics for Sabana Grande Municipio, 58.5% of individuals (6,095) out of the total population between 25 and 64 years of age (10,419) are in the labor force, with 9.6% or 585 of them being unemployed. The group with the highest labor force participation rate are those with the educational attainment of bachelor's degree or higher, with 73.0% or 2,254 individuals in the labor force. Within the labor force, individuals with less than high school education have the highest percentage of unemployment, with 26.0% or 60 of them being unemployed.
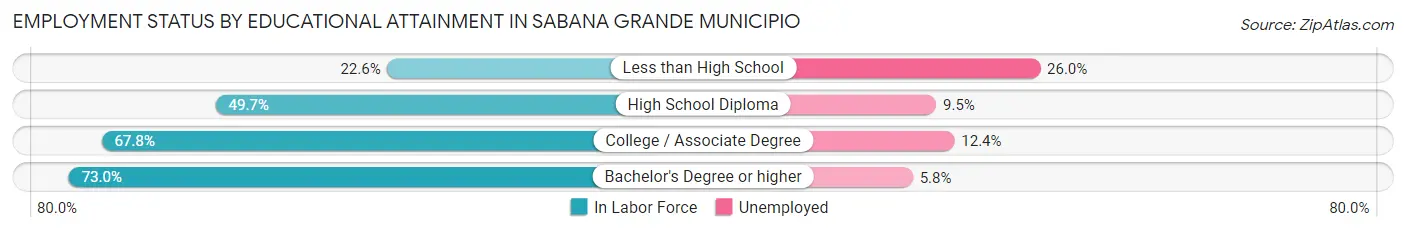
| Educational Attainment | In Labor Force | Unemployed |
| Less than High School | 231 (22.6%) | 265 (26.0%) |
| High School Diploma | 1,833 (49.7%) | 350 (9.5%) |
| College / Associate Degree | 1,777 (67.8%) | 325 (12.4%) |
| Bachelor's Degree or higher | 2,254 (73.0%) | 179 (5.8%) |
| Total | 6,095 (58.5%) | 1,000 (9.6%) |
Employment Occupations by Sex in Sabana Grande Municipio
Management, Business, Science and Arts Occupations
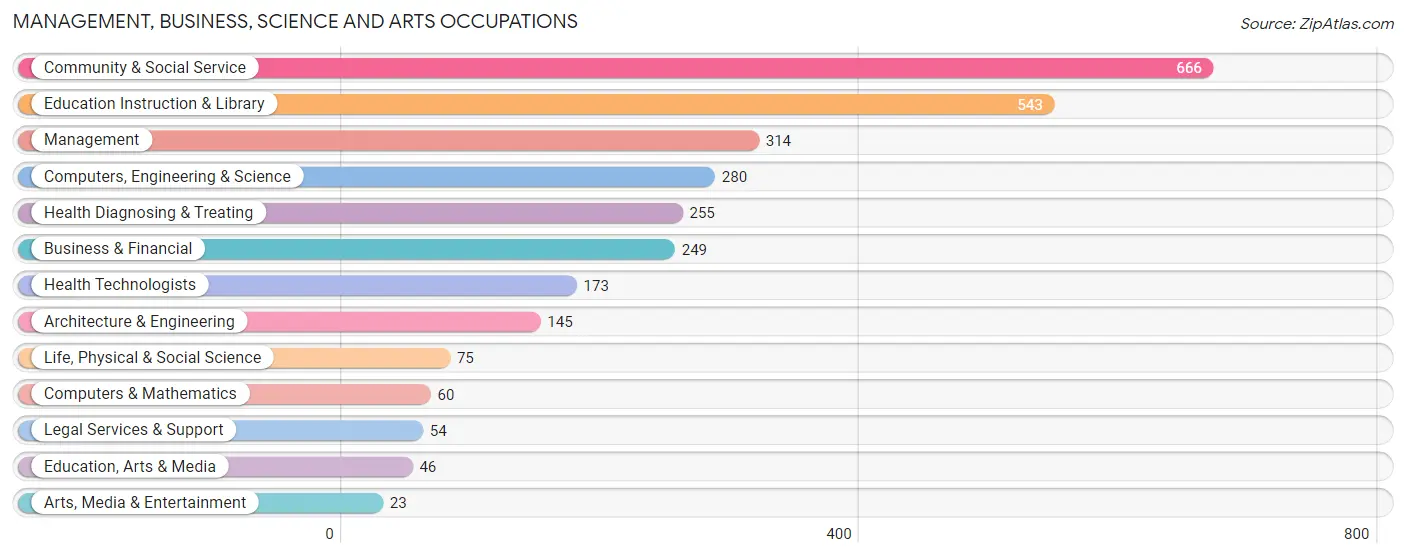
The most common Management, Business, Science and Arts occupations in Sabana Grande Municipio are Community & Social Service (666 | 10.4%), Education Instruction & Library (543 | 8.5%), Management (314 | 4.9%), Computers, Engineering & Science (280 | 4.4%), and Health Diagnosing & Treating (255 | 4.0%).
Management, Business, Science and Arts Occupations by Sex
Within the Management, Business, Science and Arts occupations in Sabana Grande Municipio, the most male-oriented occupations are Life, Physical & Social Science (100.0%), Arts, Media & Entertainment (100.0%), and Management (52.2%), while the most female-oriented occupations are Health Technologists (94.2%), Health Diagnosing & Treating (89.0%), and Computers & Mathematics (88.3%).
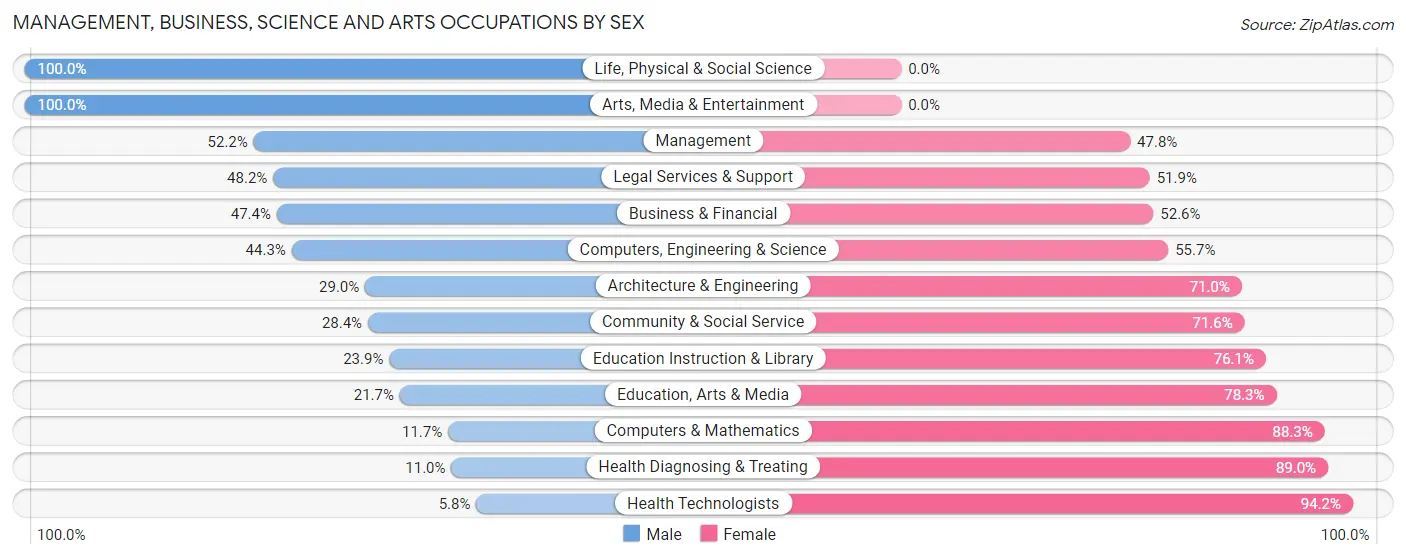
| Occupation | Male | Female |
| Management | 164 (52.2%) | 150 (47.8%) |
| Business & Financial | 118 (47.4%) | 131 (52.6%) |
| Computers, Engineering & Science | 124 (44.3%) | 156 (55.7%) |
| Computers & Mathematics | 7 (11.7%) | 53 (88.3%) |
| Architecture & Engineering | 42 (29.0%) | 103 (71.0%) |
| Life, Physical & Social Science | 75 (100.0%) | 0 (0.0%) |
| Community & Social Service | 189 (28.4%) | 477 (71.6%) |
| Education, Arts & Media | 10 (21.7%) | 36 (78.3%) |
| Legal Services & Support | 26 (48.1%) | 28 (51.8%) |
| Education Instruction & Library | 130 (23.9%) | 413 (76.1%) |
| Arts, Media & Entertainment | 23 (100.0%) | 0 (0.0%) |
| Health Diagnosing & Treating | 28 (11.0%) | 227 (89.0%) |
| Health Technologists | 10 (5.8%) | 163 (94.2%) |
| Total (Category) | 623 (35.3%) | 1,141 (64.7%) |
| Total (Overall) | 3,347 (52.3%) | 3,052 (47.7%) |
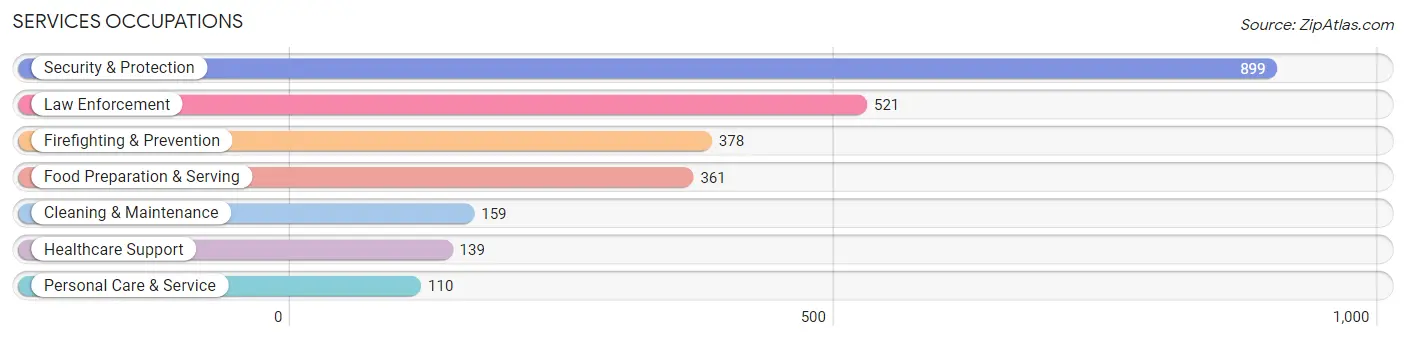
Services Occupations
The most common Services occupations in Sabana Grande Municipio are Security & Protection (899 | 14.1%), Law Enforcement (521 | 8.1%), Firefighting & Prevention (378 | 5.9%), Food Preparation & Serving (361 | 5.6%), and Cleaning & Maintenance (159 | 2.5%).
Services Occupations by Sex
Within the Services occupations in Sabana Grande Municipio, the most male-oriented occupations are Law Enforcement (77.5%), Cleaning & Maintenance (69.2%), and Security & Protection (66.8%), while the most female-oriented occupations are Healthcare Support (100.0%), Personal Care & Service (63.6%), and Firefighting & Prevention (47.9%).
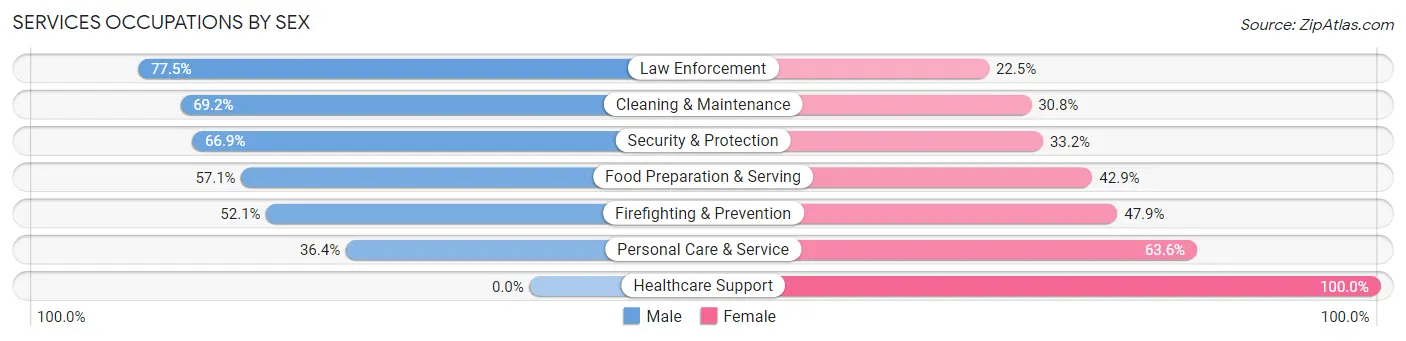
| Occupation | Male | Female |
| Healthcare Support | 0 (0.0%) | 139 (100.0%) |
| Security & Protection | 601 (66.8%) | 298 (33.2%) |
| Firefighting & Prevention | 197 (52.1%) | 181 (47.9%) |
| Law Enforcement | 404 (77.5%) | 117 (22.5%) |
| Food Preparation & Serving | 206 (57.1%) | 155 (42.9%) |
| Cleaning & Maintenance | 110 (69.2%) | 49 (30.8%) |
| Personal Care & Service | 40 (36.4%) | 70 (63.6%) |
| Total (Category) | 957 (57.4%) | 711 (42.6%) |
| Total (Overall) | 3,347 (52.3%) | 3,052 (47.7%) |
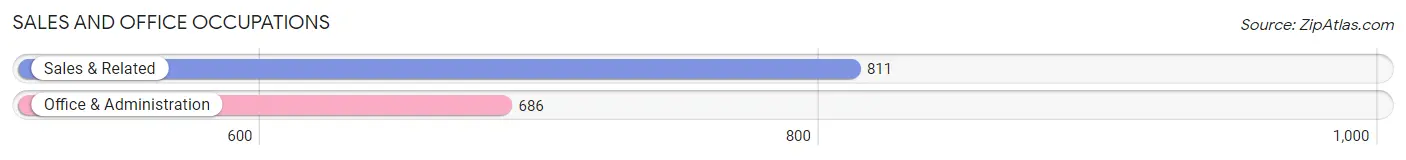
Sales and Office Occupations
The most common Sales and Office occupations in Sabana Grande Municipio are Sales & Related (811 | 12.7%), and Office & Administration (686 | 10.7%).
Sales and Office Occupations by Sex
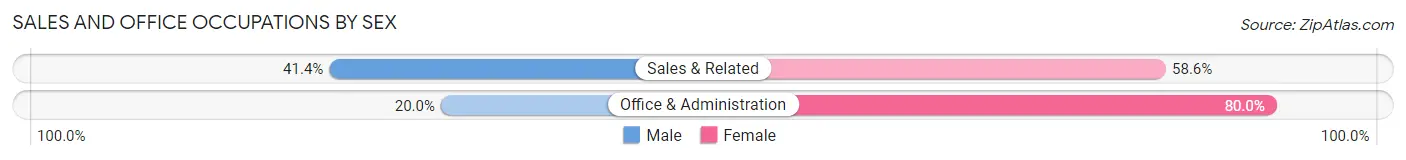
| Occupation | Male | Female |
| Sales & Related | 336 (41.4%) | 475 (58.6%) |
| Office & Administration | 137 (20.0%) | 549 (80.0%) |
| Total (Category) | 473 (31.6%) | 1,024 (68.4%) |
| Total (Overall) | 3,347 (52.3%) | 3,052 (47.7%) |
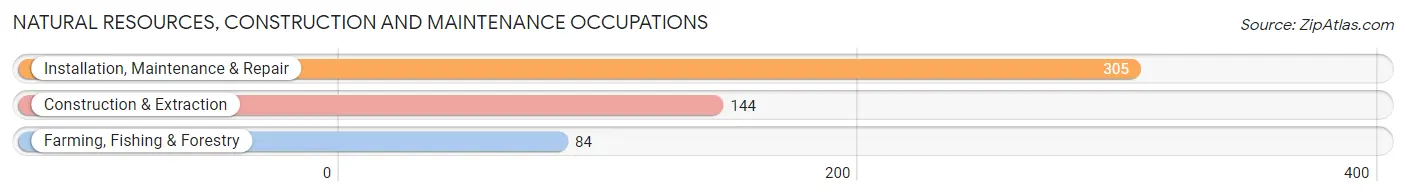
Natural Resources, Construction and Maintenance Occupations
The most common Natural Resources, Construction and Maintenance occupations in Sabana Grande Municipio are Installation, Maintenance & Repair (305 | 4.8%), Construction & Extraction (144 | 2.2%), and Farming, Fishing & Forestry (84 | 1.3%).
Natural Resources, Construction and Maintenance Occupations by Sex
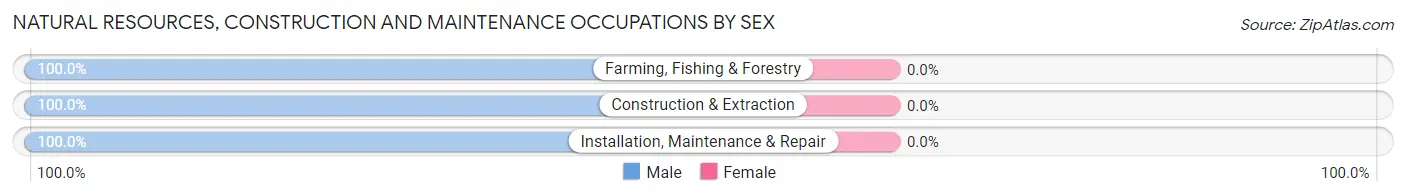
| Occupation | Male | Female |
| Farming, Fishing & Forestry | 84 (100.0%) | 0 (0.0%) |
| Construction & Extraction | 144 (100.0%) | 0 (0.0%) |
| Installation, Maintenance & Repair | 305 (100.0%) | 0 (0.0%) |
| Total (Category) | 533 (100.0%) | 0 (0.0%) |
| Total (Overall) | 3,347 (52.3%) | 3,052 (47.7%) |
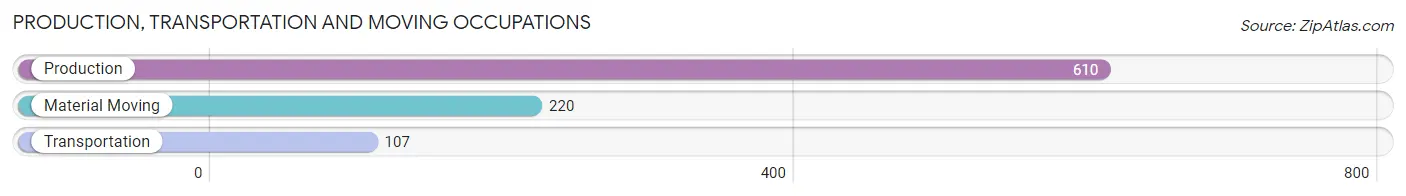
Production, Transportation and Moving Occupations
The most common Production, Transportation and Moving occupations in Sabana Grande Municipio are Production (610 | 9.5%), Material Moving (220 | 3.4%), and Transportation (107 | 1.7%).
Production, Transportation and Moving Occupations by Sex
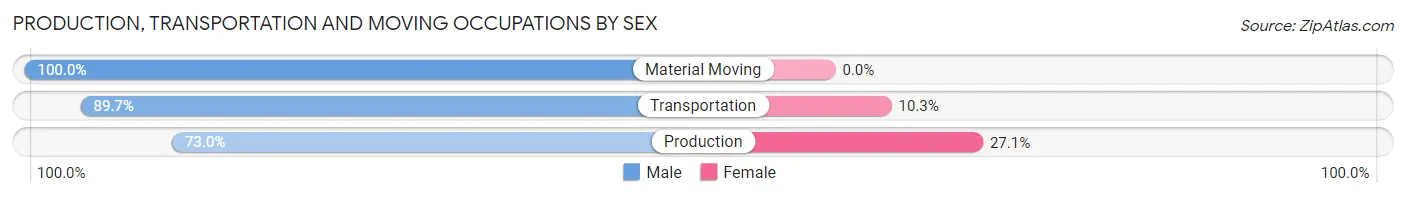
| Occupation | Male | Female |
| Production | 445 (73.0%) | 165 (27.1%) |
| Transportation | 96 (89.7%) | 11 (10.3%) |
| Material Moving | 220 (100.0%) | 0 (0.0%) |
| Total (Category) | 761 (81.2%) | 176 (18.8%) |
| Total (Overall) | 3,347 (52.3%) | 3,052 (47.7%) |
Employment Industries by Sex in Sabana Grande Municipio
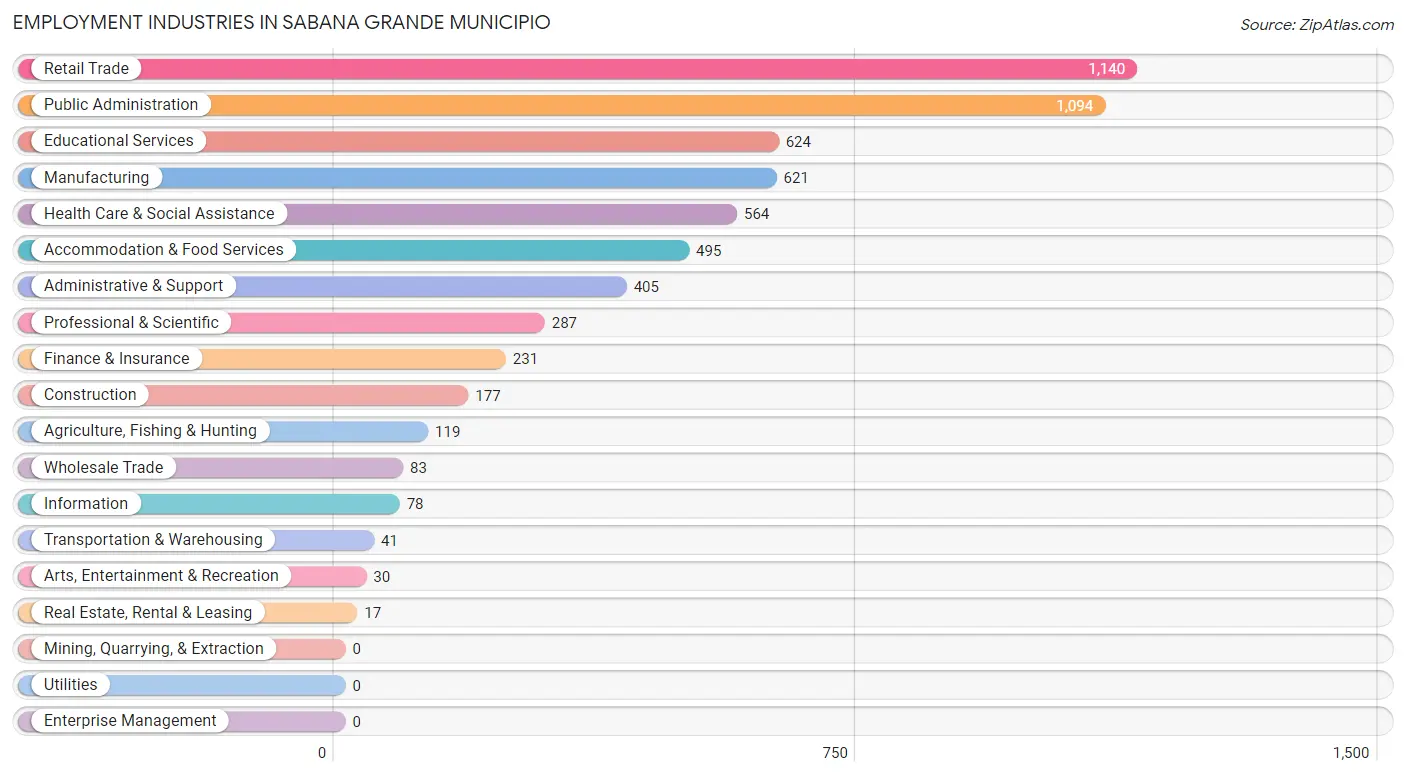
Employment Industries in Sabana Grande Municipio
The major employment industries in Sabana Grande Municipio include Retail Trade (1,140 | 17.8%), Public Administration (1,094 | 17.1%), Educational Services (624 | 9.8%), Manufacturing (621 | 9.7%), and Health Care & Social Assistance (564 | 8.8%).
Employment Industries by Sex in Sabana Grande Municipio
The Sabana Grande Municipio industries that see more men than women are Wholesale Trade (100.0%), Transportation & Warehousing (100.0%), and Information (100.0%), whereas the industries that tend to have a higher number of women are Health Care & Social Assistance (88.6%), Educational Services (68.6%), and Professional & Scientific (64.8%).
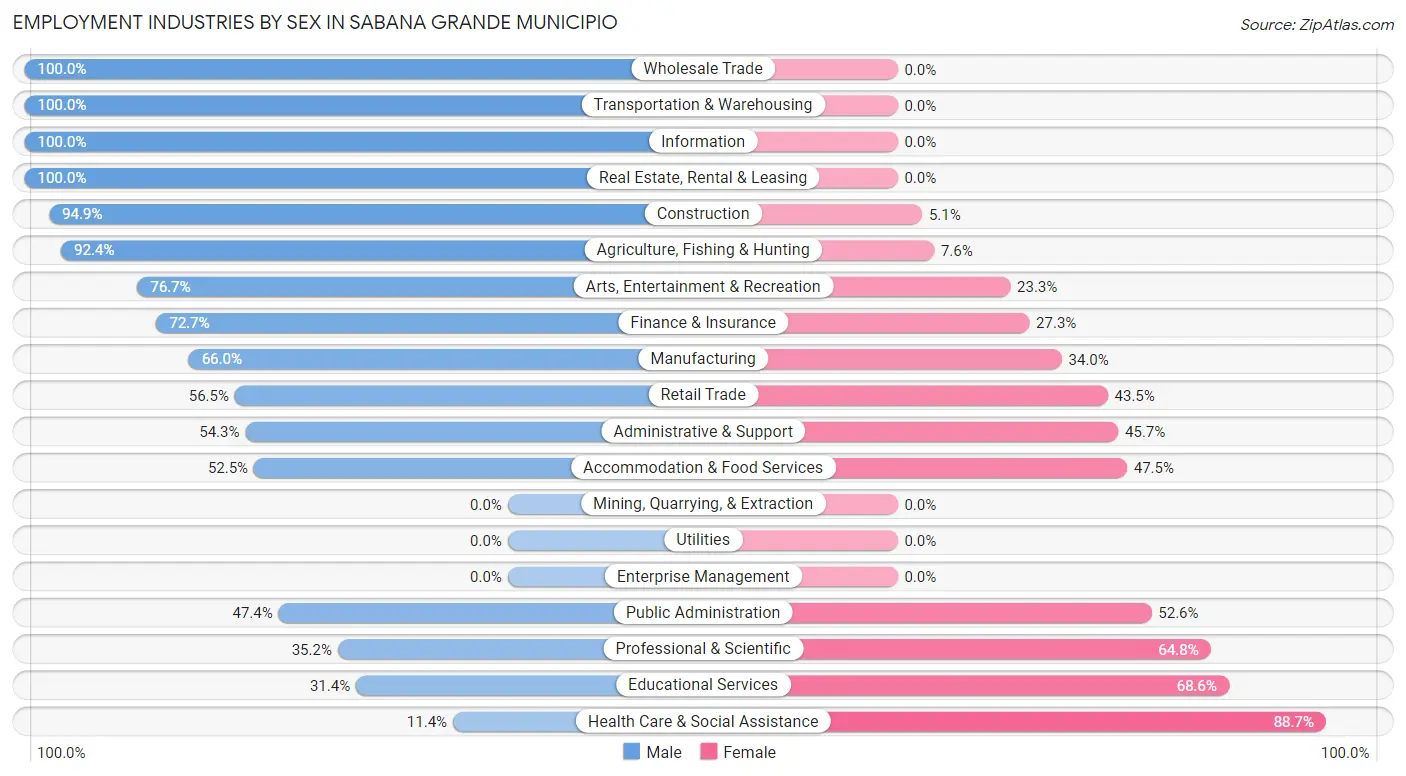
| Industry | Male | Female |
| Agriculture, Fishing & Hunting | 110 (92.4%) | 9 (7.6%) |
| Mining, Quarrying, & Extraction | 0 (0.0%) | 0 (0.0%) |
| Construction | 168 (94.9%) | 9 (5.1%) |
| Manufacturing | 410 (66.0%) | 211 (34.0%) |
| Wholesale Trade | 83 (100.0%) | 0 (0.0%) |
| Retail Trade | 644 (56.5%) | 496 (43.5%) |
| Transportation & Warehousing | 41 (100.0%) | 0 (0.0%) |
| Utilities | 0 (0.0%) | 0 (0.0%) |
| Information | 78 (100.0%) | 0 (0.0%) |
| Finance & Insurance | 168 (72.7%) | 63 (27.3%) |
| Real Estate, Rental & Leasing | 17 (100.0%) | 0 (0.0%) |
| Professional & Scientific | 101 (35.2%) | 186 (64.8%) |
| Enterprise Management | 0 (0.0%) | 0 (0.0%) |
| Administrative & Support | 220 (54.3%) | 185 (45.7%) |
| Educational Services | 196 (31.4%) | 428 (68.6%) |
| Health Care & Social Assistance | 64 (11.4%) | 500 (88.6%) |
| Arts, Entertainment & Recreation | 23 (76.7%) | 7 (23.3%) |
| Accommodation & Food Services | 260 (52.5%) | 235 (47.5%) |
| Public Administration | 519 (47.4%) | 575 (52.6%) |
| Total | 3,347 (52.3%) | 3,052 (47.7%) |
Education in Sabana Grande Municipio
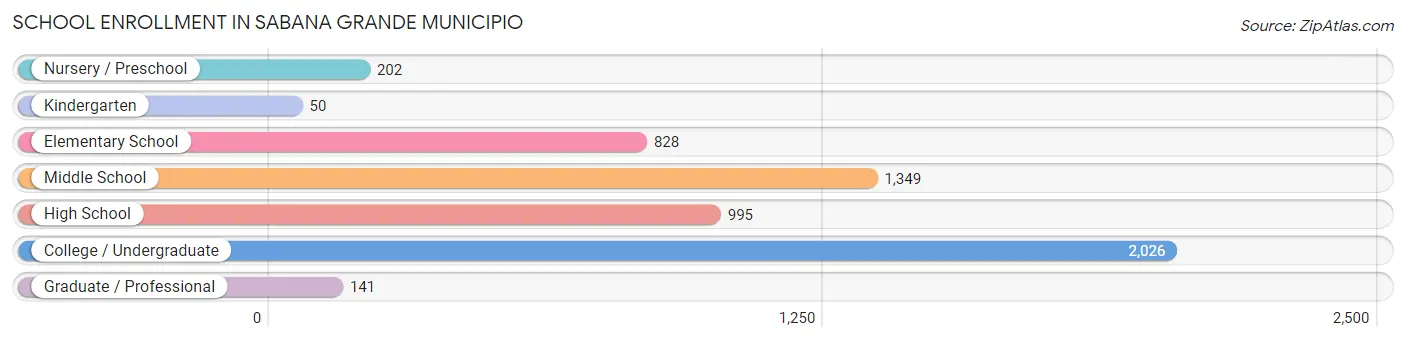
School Enrollment in Sabana Grande Municipio
The most common levels of schooling among the 5,591 students in Sabana Grande Municipio are college / undergraduate (2,026 | 36.2%), middle school (1,349 | 24.1%), and high school (995 | 17.8%).
| School Level | # Students | % Students |
| Nursery / Preschool | 202 | 3.6% |
| Kindergarten | 50 | 0.9% |
| Elementary School | 828 | 14.8% |
| Middle School | 1,349 | 24.1% |
| High School | 995 | 17.8% |
| College / Undergraduate | 2,026 | 36.2% |
| Graduate / Professional | 141 | 2.5% |
| Total | 5,591 | 100.0% |
School Enrollment by Age by Funding Source in Sabana Grande Municipio
Out of a total of 5,591 students who are enrolled in schools in Sabana Grande Municipio, 1,107 (19.8%) attend a private institution, while the remaining 4,484 (80.2%) are enrolled in public schools. The age group of 25 to 34 year olds has the highest likelihood of being enrolled in private schools, with 43 (100.0% in the age bracket) enrolled. Conversely, the age group of 5 to 9 year old has the lowest likelihood of being enrolled in a private school, with 919 (94.6% in the age bracket) attending a public institution.
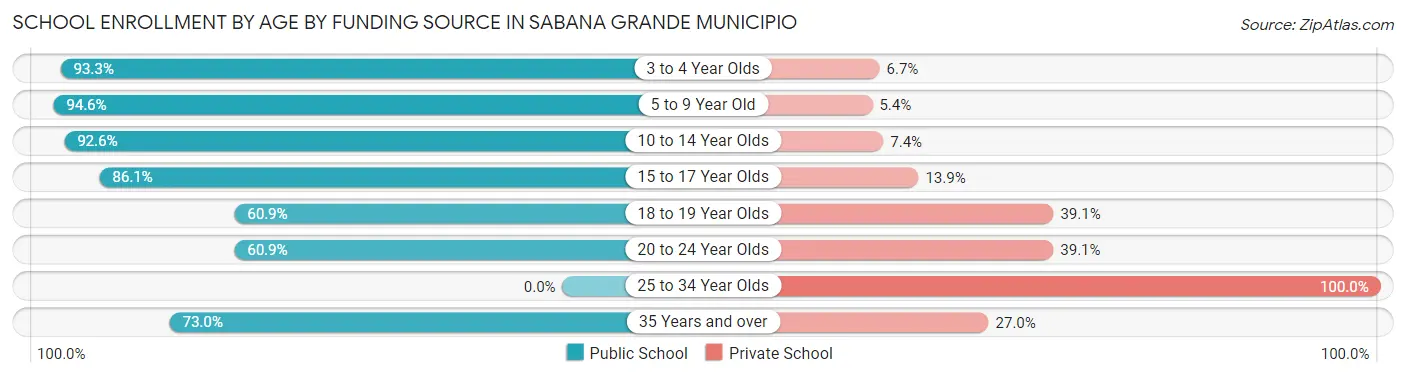
| Age Bracket | Public School | Private School |
| 3 to 4 Year Olds | 223 (93.3%) | 16 (6.7%) |
| 5 to 9 Year Old | 919 (94.6%) | 52 (5.4%) |
| 10 to 14 Year Olds | 1,291 (92.6%) | 103 (7.4%) |
| 15 to 17 Year Olds | 667 (86.1%) | 108 (13.9%) |
| 18 to 19 Year Olds | 396 (60.9%) | 254 (39.1%) |
| 20 to 24 Year Olds | 621 (60.9%) | 398 (39.1%) |
| 25 to 34 Year Olds | 0 (0.0%) | 43 (100.0%) |
| 35 Years and over | 365 (73.0%) | 135 (27.0%) |
| Total | 4,484 (80.2%) | 1,107 (19.8%) |
Educational Attainment by Field of Study in Sabana Grande Municipio
Business (1,168 | 28.0%), education (1,072 | 25.7%), arts & humanities (311 | 7.4%), bio, nature & agricultural (300 | 7.2%), and social sciences (295 | 7.1%) are the most common fields of study among 4,178 individuals in Sabana Grande Municipio who have obtained a bachelor's degree or higher.
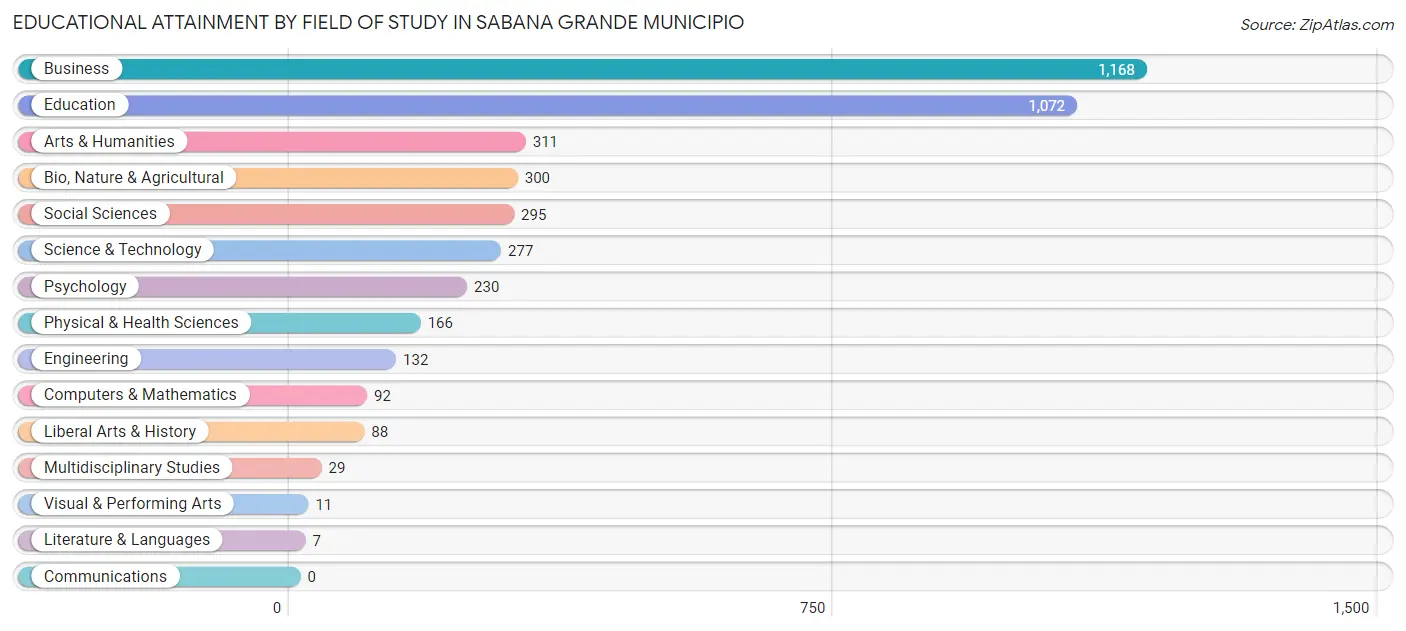
| Field of Study | # Graduates | % Graduates |
| Computers & Mathematics | 92 | 2.2% |
| Bio, Nature & Agricultural | 300 | 7.2% |
| Physical & Health Sciences | 166 | 4.0% |
| Psychology | 230 | 5.5% |
| Social Sciences | 295 | 7.1% |
| Engineering | 132 | 3.2% |
| Multidisciplinary Studies | 29 | 0.7% |
| Science & Technology | 277 | 6.6% |
| Business | 1,168 | 28.0% |
| Education | 1,072 | 25.7% |
| Literature & Languages | 7 | 0.2% |
| Liberal Arts & History | 88 | 2.1% |
| Visual & Performing Arts | 11 | 0.3% |
| Communications | 0 | 0.0% |
| Arts & Humanities | 311 | 7.4% |
| Total | 4,178 | 100.0% |
Transportation & Commute in Sabana Grande Municipio
Vehicle Availability by Sex in Sabana Grande Municipio
The most prevalent vehicle ownership categories in Sabana Grande Municipio are males with 2 vehicles (1,299, accounting for 38.9%) and females with 2 vehicles (1,310, making up 43.2%).
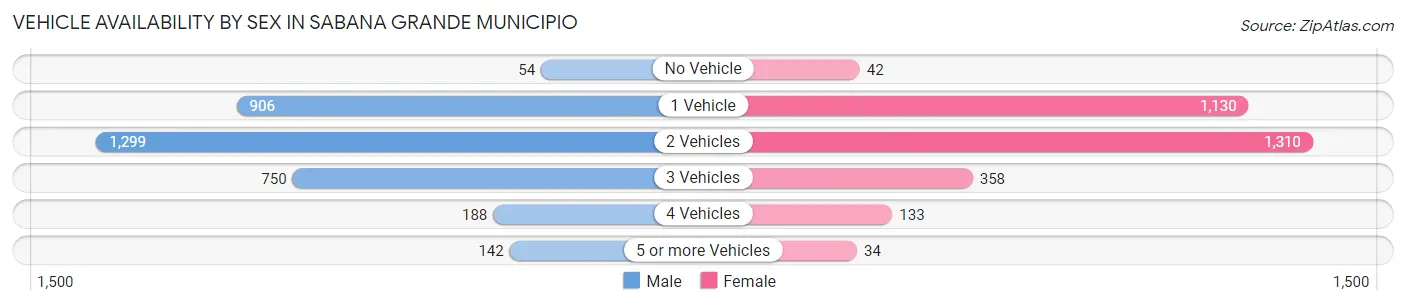
| Vehicles Available | Male | Female |
| No Vehicle | 54 (1.6%) | 42 (1.4%) |
| 1 Vehicle | 906 (27.1%) | 1,130 (37.6%) |
| 2 Vehicles | 1,299 (38.9%) | 1,310 (43.6%) |
| 3 Vehicles | 750 (22.5%) | 358 (11.9%) |
| 4 Vehicles | 188 (5.6%) | 133 (4.4%) |
| 5 or more Vehicles | 142 (4.3%) | 34 (1.1%) |
| Total | 3,339 (100.0%) | 3,007 (100.0%) |
Commute Time in Sabana Grande Municipio
The most frequently occuring commute durations in Sabana Grande Municipio are 15 to 19 minutes (1,507 commuters, 24.3%), 10 to 14 minutes (1,445 commuters, 23.3%), and 20 to 24 minutes (1,016 commuters, 16.4%).
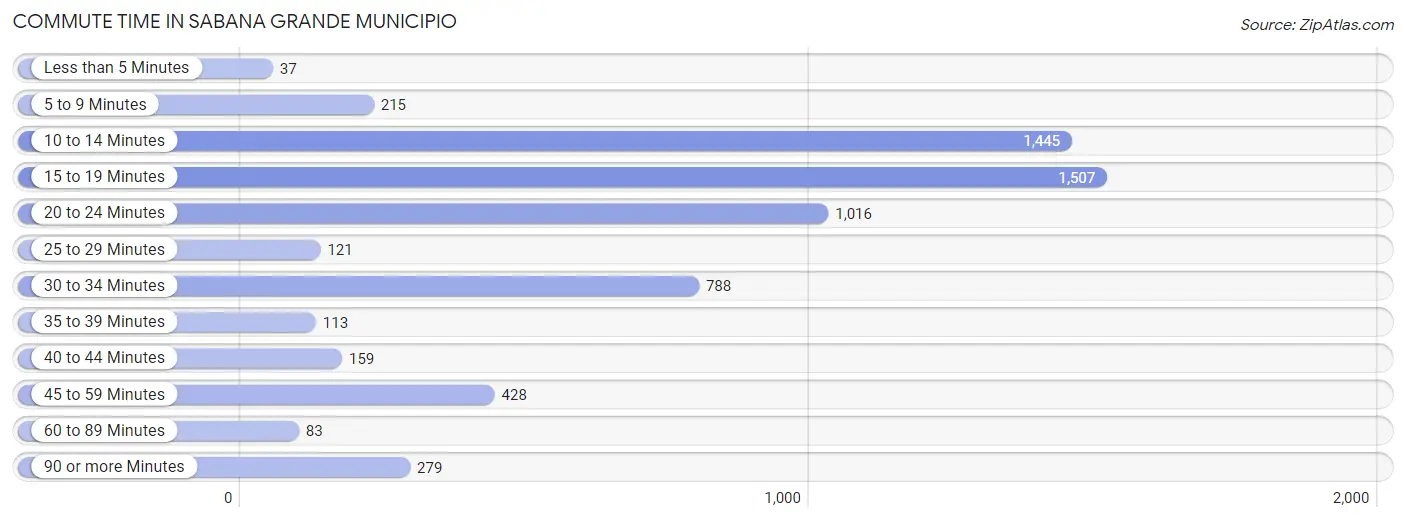
| Commute Time | # Commuters | % Commuters |
| Less than 5 Minutes | 37 | 0.6% |
| 5 to 9 Minutes | 215 | 3.5% |
| 10 to 14 Minutes | 1,445 | 23.3% |
| 15 to 19 Minutes | 1,507 | 24.3% |
| 20 to 24 Minutes | 1,016 | 16.4% |
| 25 to 29 Minutes | 121 | 1.9% |
| 30 to 34 Minutes | 788 | 12.7% |
| 35 to 39 Minutes | 113 | 1.8% |
| 40 to 44 Minutes | 159 | 2.6% |
| 45 to 59 Minutes | 428 | 6.9% |
| 60 to 89 Minutes | 83 | 1.3% |
| 90 or more Minutes | 279 | 4.5% |
Commute Time by Sex in Sabana Grande Municipio
The most common commute times in Sabana Grande Municipio are 15 to 19 minutes (875 commuters, 27.3%) for males and 10 to 14 minutes (1,047 commuters, 35.0%) for females.
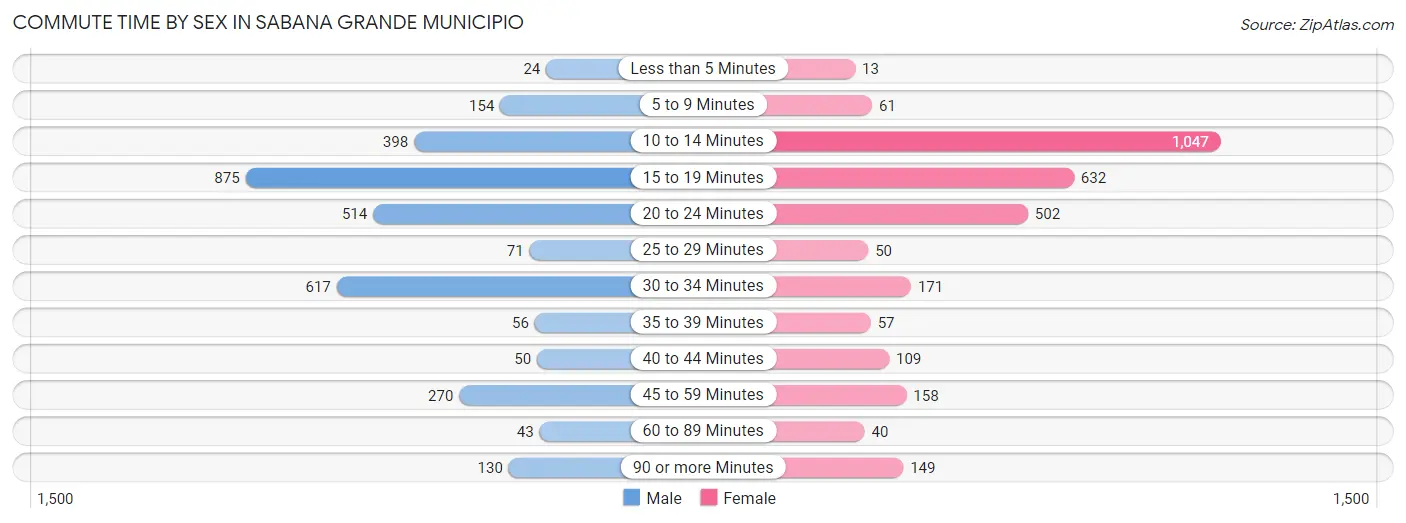
| Commute Time | Male | Female |
| Less than 5 Minutes | 24 (0.7%) | 13 (0.4%) |
| 5 to 9 Minutes | 154 (4.8%) | 61 (2.0%) |
| 10 to 14 Minutes | 398 (12.4%) | 1,047 (35.0%) |
| 15 to 19 Minutes | 875 (27.3%) | 632 (21.1%) |
| 20 to 24 Minutes | 514 (16.1%) | 502 (16.8%) |
| 25 to 29 Minutes | 71 (2.2%) | 50 (1.7%) |
| 30 to 34 Minutes | 617 (19.3%) | 171 (5.7%) |
| 35 to 39 Minutes | 56 (1.8%) | 57 (1.9%) |
| 40 to 44 Minutes | 50 (1.6%) | 109 (3.6%) |
| 45 to 59 Minutes | 270 (8.4%) | 158 (5.3%) |
| 60 to 89 Minutes | 43 (1.3%) | 40 (1.3%) |
| 90 or more Minutes | 130 (4.1%) | 149 (5.0%) |
Time of Departure to Work by Sex in Sabana Grande Municipio
The most frequent times of departure to work in Sabana Grande Municipio are 7:00 AM to 7:29 AM (862, 26.9%) for males and 7:00 AM to 7:29 AM (1,007, 33.7%) for females.
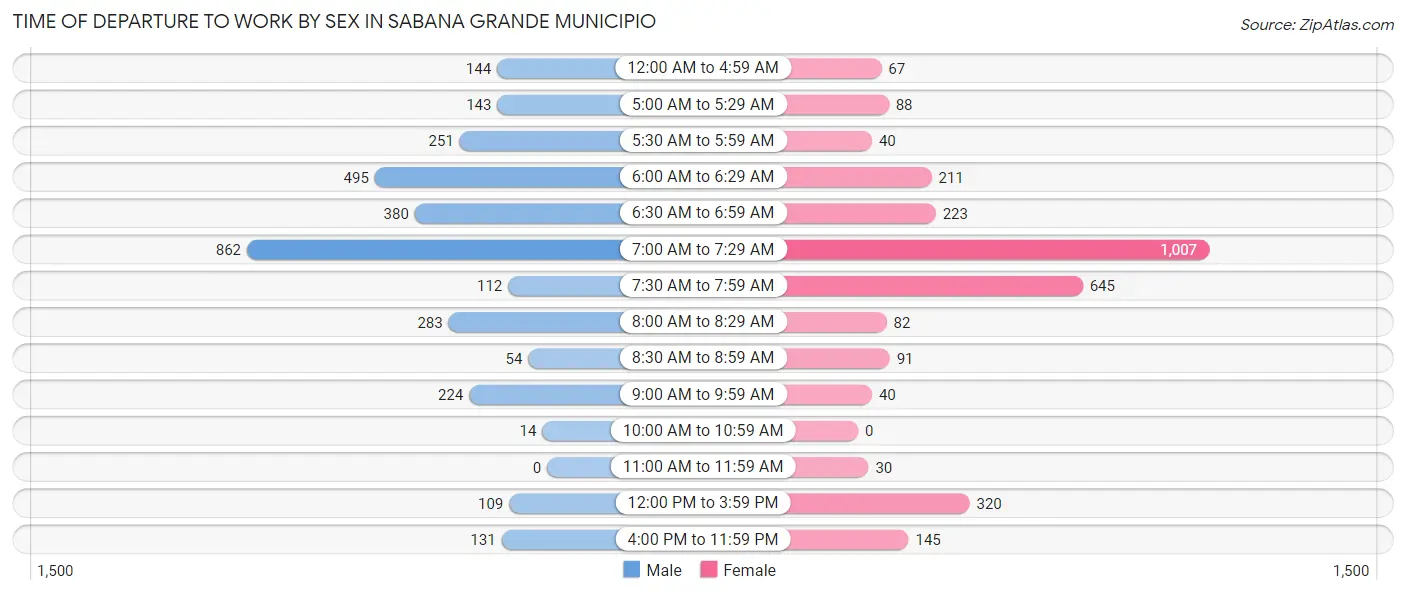
| Time of Departure | Male | Female |
| 12:00 AM to 4:59 AM | 144 (4.5%) | 67 (2.2%) |
| 5:00 AM to 5:29 AM | 143 (4.5%) | 88 (2.9%) |
| 5:30 AM to 5:59 AM | 251 (7.8%) | 40 (1.3%) |
| 6:00 AM to 6:29 AM | 495 (15.5%) | 211 (7.1%) |
| 6:30 AM to 6:59 AM | 380 (11.9%) | 223 (7.5%) |
| 7:00 AM to 7:29 AM | 862 (26.9%) | 1,007 (33.7%) |
| 7:30 AM to 7:59 AM | 112 (3.5%) | 645 (21.6%) |
| 8:00 AM to 8:29 AM | 283 (8.8%) | 82 (2.7%) |
| 8:30 AM to 8:59 AM | 54 (1.7%) | 91 (3.0%) |
| 9:00 AM to 9:59 AM | 224 (7.0%) | 40 (1.3%) |
| 10:00 AM to 10:59 AM | 14 (0.4%) | 0 (0.0%) |
| 11:00 AM to 11:59 AM | 0 (0.0%) | 30 (1.0%) |
| 12:00 PM to 3:59 PM | 109 (3.4%) | 320 (10.7%) |
| 4:00 PM to 11:59 PM | 131 (4.1%) | 145 (4.9%) |
| Total | 3,202 (100.0%) | 2,989 (100.0%) |
Housing Occupancy in Sabana Grande Municipio
Occupancy by Ownership in Sabana Grande Municipio
Of the total 7,102 dwellings in Sabana Grande Municipio, owner-occupied units account for 5,531 (77.9%), while renter-occupied units make up 1,571 (22.1%).
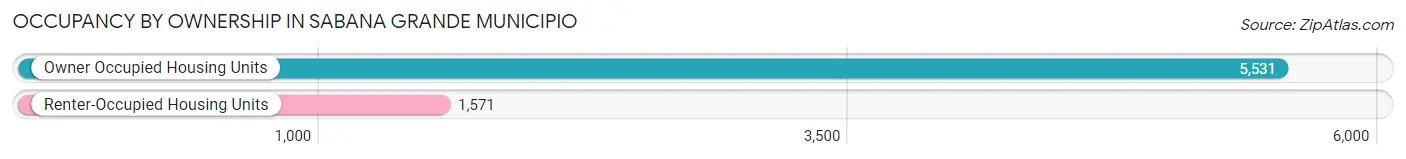
| Occupancy | # Housing Units | % Housing Units |
| Owner Occupied Housing Units | 5,531 | 77.9% |
| Renter-Occupied Housing Units | 1,571 | 22.1% |
| Total Occupied Housing Units | 7,102 | 100.0% |
Occupancy by Household Size in Sabana Grande Municipio
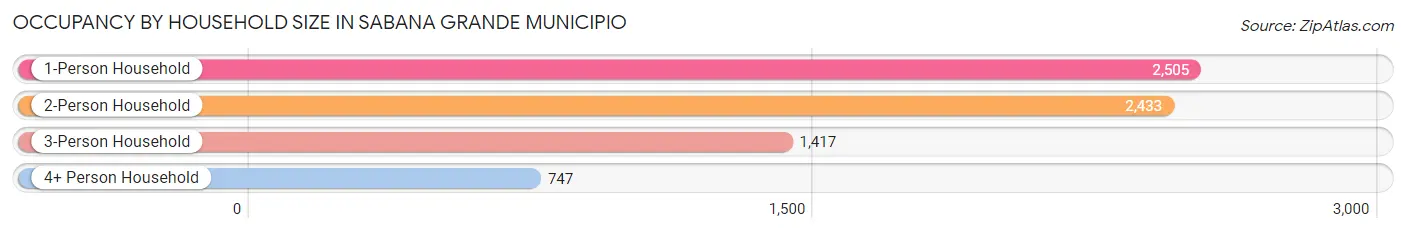
| Household Size | # Housing Units | % Housing Units |
| 1-Person Household | 2,505 | 35.3% |
| 2-Person Household | 2,433 | 34.3% |
| 3-Person Household | 1,417 | 20.0% |
| 4+ Person Household | 747 | 10.5% |
| Total Housing Units | 7,102 | 100.0% |
Occupancy by Ownership by Household Size in Sabana Grande Municipio
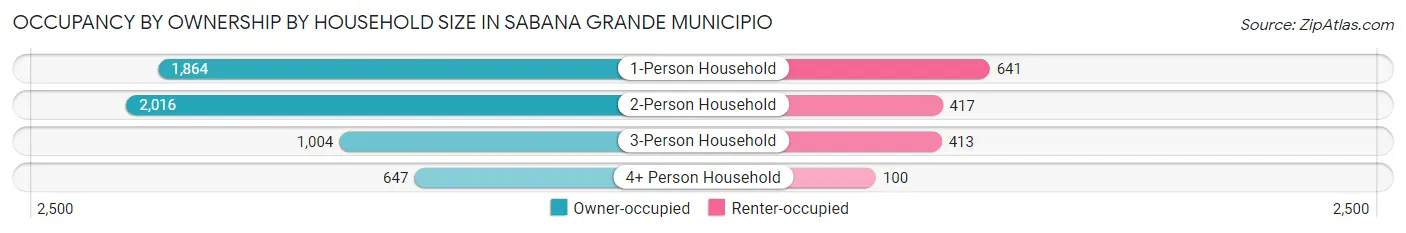
| Household Size | Owner-occupied | Renter-occupied |
| 1-Person Household | 1,864 (74.4%) | 641 (25.6%) |
| 2-Person Household | 2,016 (82.9%) | 417 (17.1%) |
| 3-Person Household | 1,004 (70.9%) | 413 (29.1%) |
| 4+ Person Household | 647 (86.6%) | 100 (13.4%) |
| Total Housing Units | 5,531 (77.9%) | 1,571 (22.1%) |
Occupancy by Educational Attainment in Sabana Grande Municipio
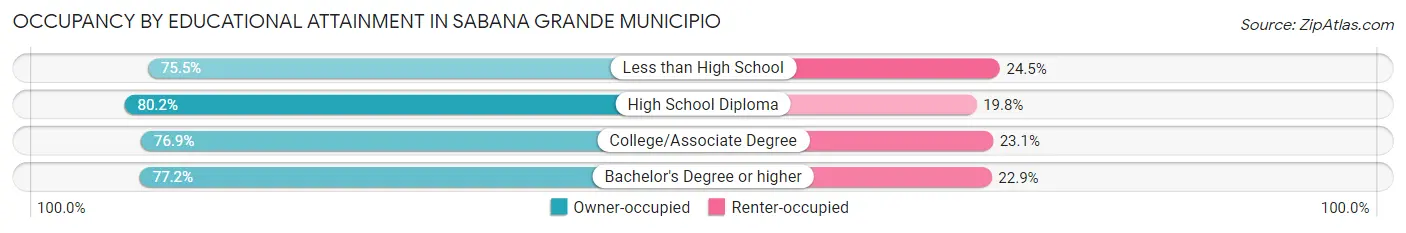
| Household Size | Owner-occupied | Renter-occupied |
| Less than High School | 1,022 (75.5%) | 331 (24.5%) |
| High School Diploma | 2,046 (80.2%) | 506 (19.8%) |
| College/Associate Degree | 1,008 (76.9%) | 303 (23.1%) |
| Bachelor's Degree or higher | 1,455 (77.1%) | 431 (22.9%) |
Occupancy by Age of Householder in Sabana Grande Municipio
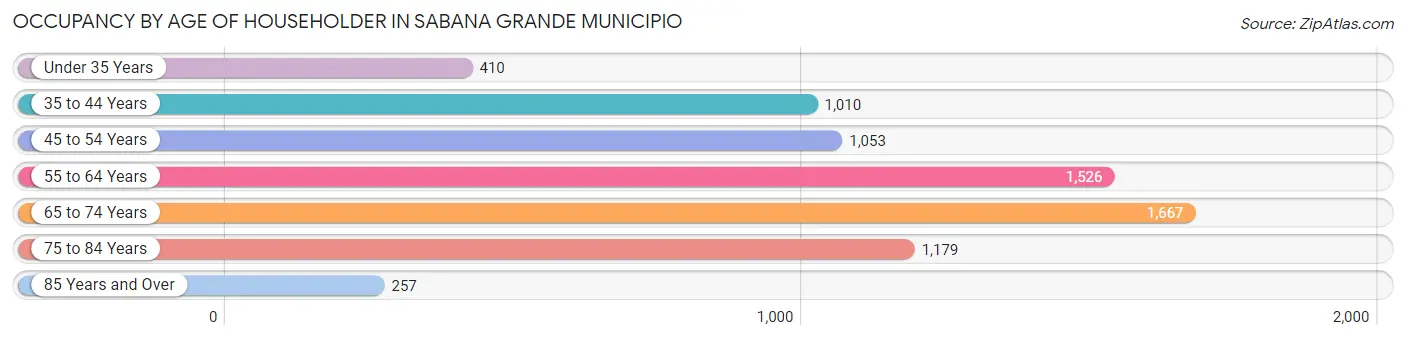
| Age Bracket | # Households | % Households |
| Under 35 Years | 410 | 5.8% |
| 35 to 44 Years | 1,010 | 14.2% |
| 45 to 54 Years | 1,053 | 14.8% |
| 55 to 64 Years | 1,526 | 21.5% |
| 65 to 74 Years | 1,667 | 23.5% |
| 75 to 84 Years | 1,179 | 16.6% |
| 85 Years and Over | 257 | 3.6% |
| Total | 7,102 | 100.0% |
Housing Finances in Sabana Grande Municipio
Median Income by Occupancy in Sabana Grande Municipio
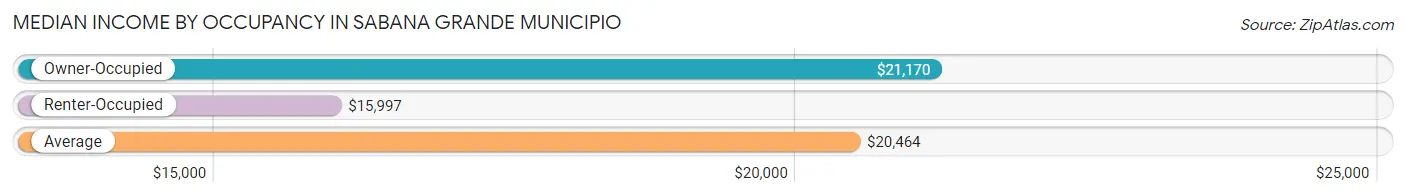
| Occupancy Type | # Households | Median Income |
| Owner-Occupied | 5,531 (77.9%) | $21,170 |
| Renter-Occupied | 1,571 (22.1%) | $15,997 |
| Average | 7,102 (100.0%) | $20,464 |
Occupancy by Householder Income Bracket in Sabana Grande Municipio
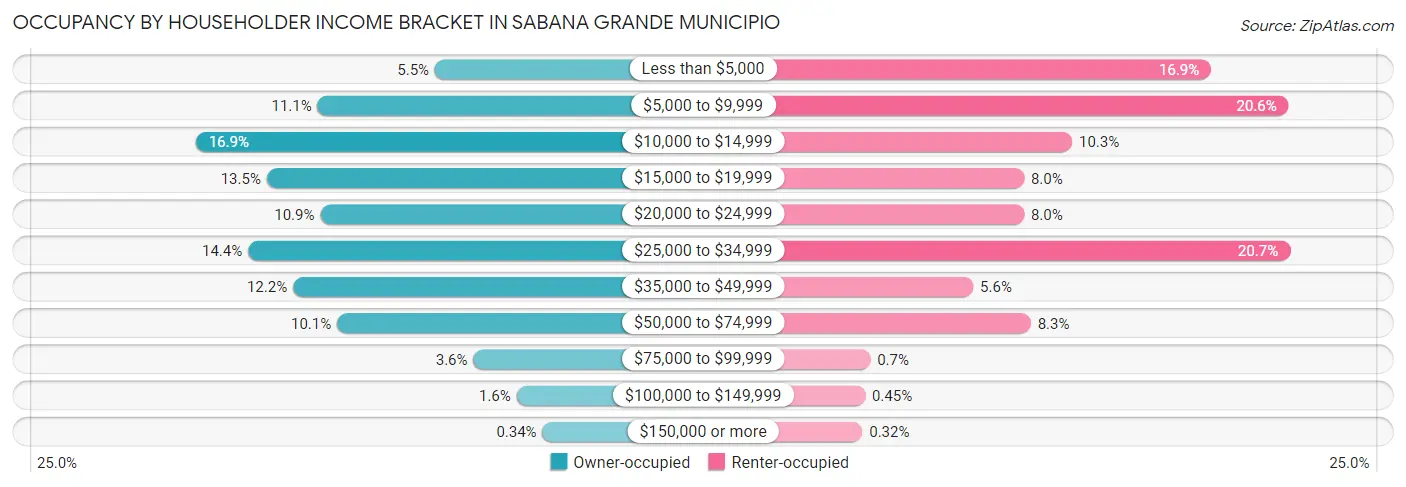
| Income Bracket | Owner-occupied | Renter-occupied |
| Less than $5,000 | 302 (5.5%) | 266 (16.9%) |
| $5,000 to $9,999 | 611 (11.1%) | 324 (20.6%) |
| $10,000 to $14,999 | 932 (16.9%) | 162 (10.3%) |
| $15,000 to $19,999 | 745 (13.5%) | 126 (8.0%) |
| $20,000 to $24,999 | 604 (10.9%) | 126 (8.0%) |
| $25,000 to $34,999 | 794 (14.4%) | 325 (20.7%) |
| $35,000 to $49,999 | 676 (12.2%) | 88 (5.6%) |
| $50,000 to $74,999 | 560 (10.1%) | 131 (8.3%) |
| $75,000 to $99,999 | 201 (3.6%) | 11 (0.7%) |
| $100,000 to $149,999 | 87 (1.6%) | 7 (0.4%) |
| $150,000 or more | 19 (0.3%) | 5 (0.3%) |
| Total | 5,531 (100.0%) | 1,571 (100.0%) |
Monthly Housing Cost Tiers in Sabana Grande Municipio
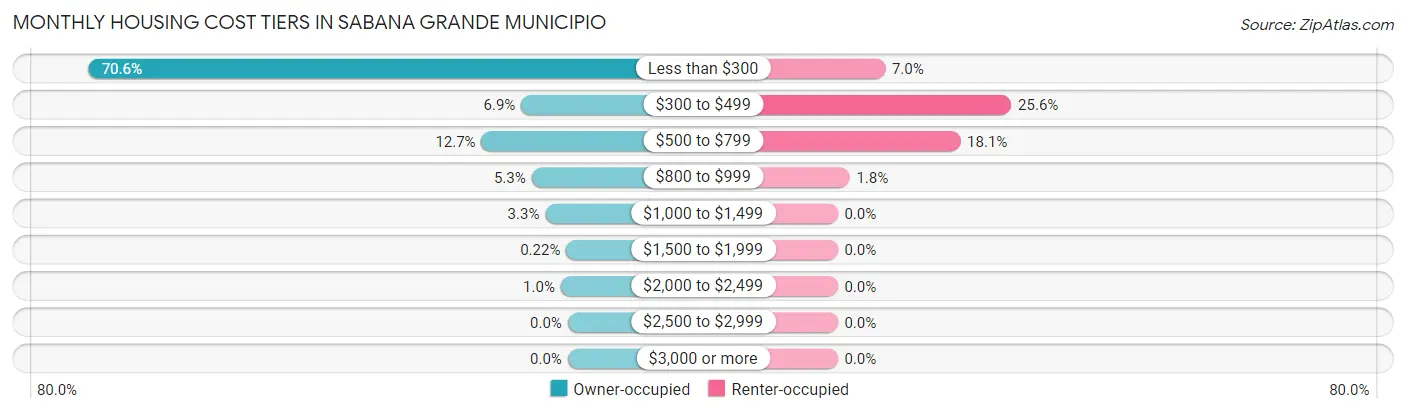
| Monthly Cost | Owner-occupied | Renter-occupied |
| Less than $300 | 3,902 (70.6%) | 110 (7.0%) |
| $300 to $499 | 379 (6.9%) | 402 (25.6%) |
| $500 to $799 | 703 (12.7%) | 284 (18.1%) |
| $800 to $999 | 295 (5.3%) | 28 (1.8%) |
| $1,000 to $1,499 | 183 (3.3%) | 0 (0.0%) |
| $1,500 to $1,999 | 12 (0.2%) | 0 (0.0%) |
| $2,000 to $2,499 | 57 (1.0%) | 0 (0.0%) |
| $2,500 to $2,999 | 0 (0.0%) | 0 (0.0%) |
| $3,000 or more | 0 (0.0%) | 0 (0.0%) |
| Total | 5,531 (100.0%) | 1,571 (100.0%) |
Physical Housing Characteristics in Sabana Grande Municipio
Housing Structures in Sabana Grande Municipio
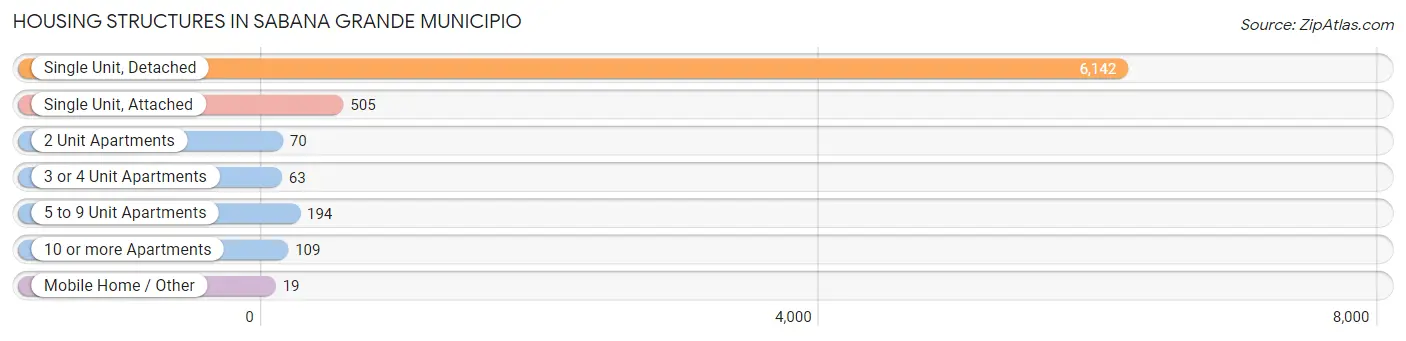
| Structure Type | # Housing Units | % Housing Units |
| Single Unit, Detached | 6,142 | 86.5% |
| Single Unit, Attached | 505 | 7.1% |
| 2 Unit Apartments | 70 | 1.0% |
| 3 or 4 Unit Apartments | 63 | 0.9% |
| 5 to 9 Unit Apartments | 194 | 2.7% |
| 10 or more Apartments | 109 | 1.5% |
| Mobile Home / Other | 19 | 0.3% |
| Total | 7,102 | 100.0% |
Housing Structures by Occupancy in Sabana Grande Municipio
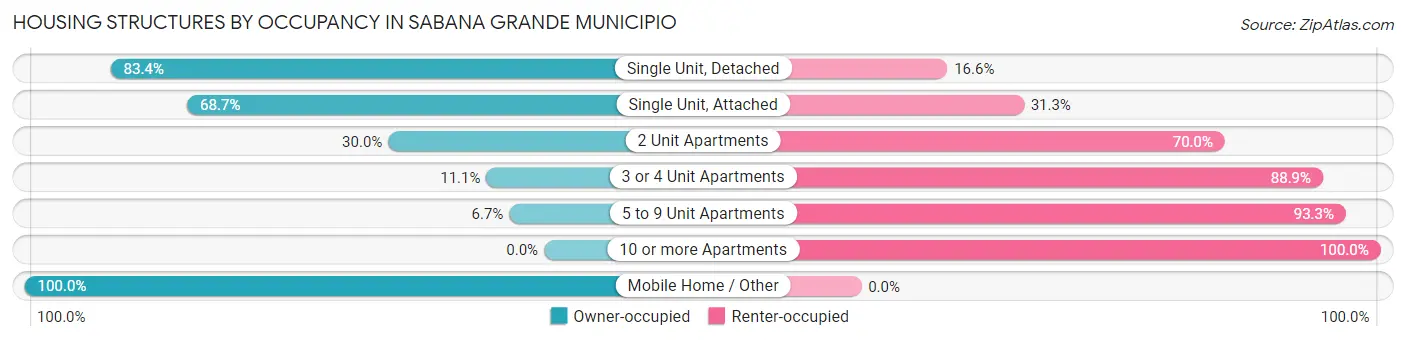
| Structure Type | Owner-occupied | Renter-occupied |
| Single Unit, Detached | 5,124 (83.4%) | 1,018 (16.6%) |
| Single Unit, Attached | 347 (68.7%) | 158 (31.3%) |
| 2 Unit Apartments | 21 (30.0%) | 49 (70.0%) |
| 3 or 4 Unit Apartments | 7 (11.1%) | 56 (88.9%) |
| 5 to 9 Unit Apartments | 13 (6.7%) | 181 (93.3%) |
| 10 or more Apartments | 0 (0.0%) | 109 (100.0%) |
| Mobile Home / Other | 19 (100.0%) | 0 (0.0%) |
| Total | 5,531 (77.9%) | 1,571 (22.1%) |
Housing Structures by Number of Rooms in Sabana Grande Municipio
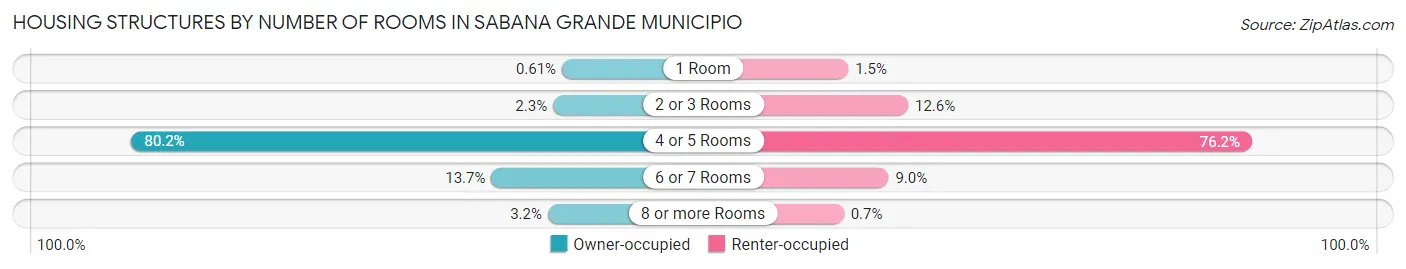
| Number of Rooms | Owner-occupied | Renter-occupied |
| 1 Room | 34 (0.6%) | 24 (1.5%) |
| 2 or 3 Rooms | 125 (2.3%) | 198 (12.6%) |
| 4 or 5 Rooms | 4,438 (80.2%) | 1,197 (76.2%) |
| 6 or 7 Rooms | 756 (13.7%) | 141 (9.0%) |
| 8 or more Rooms | 178 (3.2%) | 11 (0.7%) |
| Total | 5,531 (100.0%) | 1,571 (100.0%) |
Housing Structure by Heating Type in Sabana Grande Municipio
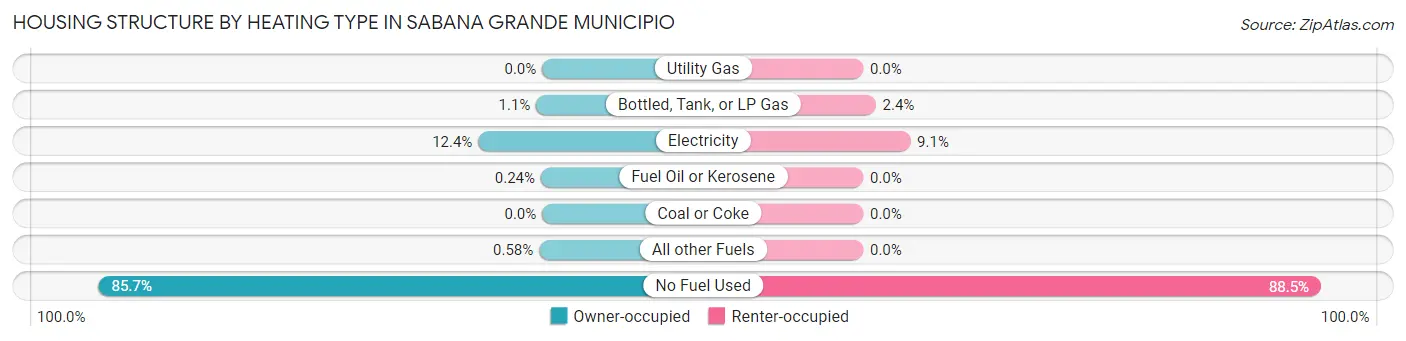
| Heating Type | Owner-occupied | Renter-occupied |
| Utility Gas | 0 (0.0%) | 0 (0.0%) |
| Bottled, Tank, or LP Gas | 63 (1.1%) | 38 (2.4%) |
| Electricity | 683 (12.3%) | 143 (9.1%) |
| Fuel Oil or Kerosene | 13 (0.2%) | 0 (0.0%) |
| Coal or Coke | 0 (0.0%) | 0 (0.0%) |
| All other Fuels | 32 (0.6%) | 0 (0.0%) |
| No Fuel Used | 4,740 (85.7%) | 1,390 (88.5%) |
| Total | 5,531 (100.0%) | 1,571 (100.0%) |
Household Vehicle Usage in Sabana Grande Municipio
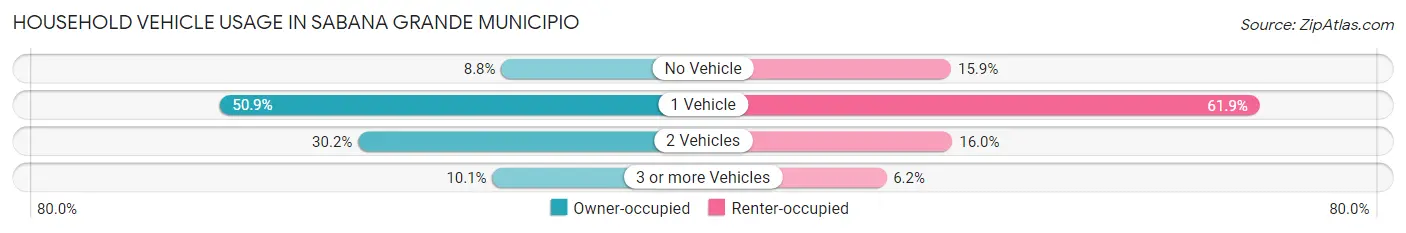
| Vehicles per Household | Owner-occupied | Renter-occupied |
| No Vehicle | 486 (8.8%) | 249 (15.9%) |
| 1 Vehicle | 2,816 (50.9%) | 973 (61.9%) |
| 2 Vehicles | 1,669 (30.2%) | 252 (16.0%) |
| 3 or more Vehicles | 560 (10.1%) | 97 (6.2%) |
| Total | 5,531 (100.0%) | 1,571 (100.0%) |
Real Estate & Mortgages in Sabana Grande Municipio
Real Estate and Mortgage Overview in Sabana Grande Municipio
| Characteristic | Without Mortgage | With Mortgage |
| Housing Units | 4,217 | 1,314 |
| Median Property Value | $91,200 | $123,800 |
| Median Household Income | $17,712 | $19 |
| Monthly Housing Costs | $132 | $0 |
| Real Estate Taxes | $199 | $1,253 |
Property Value by Mortgage Status in Sabana Grande Municipio
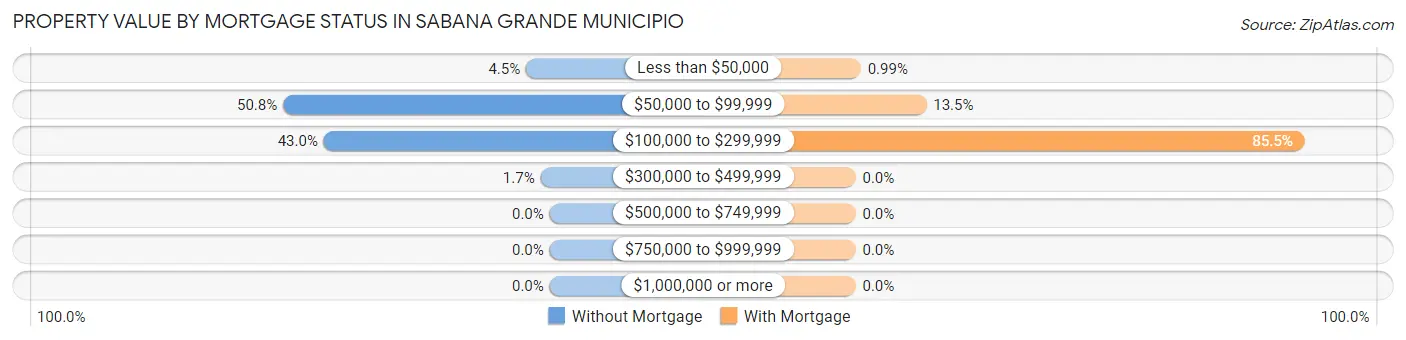
| Property Value | Without Mortgage | With Mortgage |
| Less than $50,000 | 189 (4.5%) | 13 (1.0%) |
| $50,000 to $99,999 | 2,141 (50.8%) | 177 (13.5%) |
| $100,000 to $299,999 | 1,814 (43.0%) | 1,124 (85.5%) |
| $300,000 to $499,999 | 73 (1.7%) | 0 (0.0%) |
| $500,000 to $749,999 | 0 (0.0%) | 0 (0.0%) |
| $750,000 to $999,999 | 0 (0.0%) | 0 (0.0%) |
| $1,000,000 or more | 0 (0.0%) | 0 (0.0%) |
| Total | 4,217 (100.0%) | 1,314 (100.0%) |
Household Income by Mortgage Status in Sabana Grande Municipio
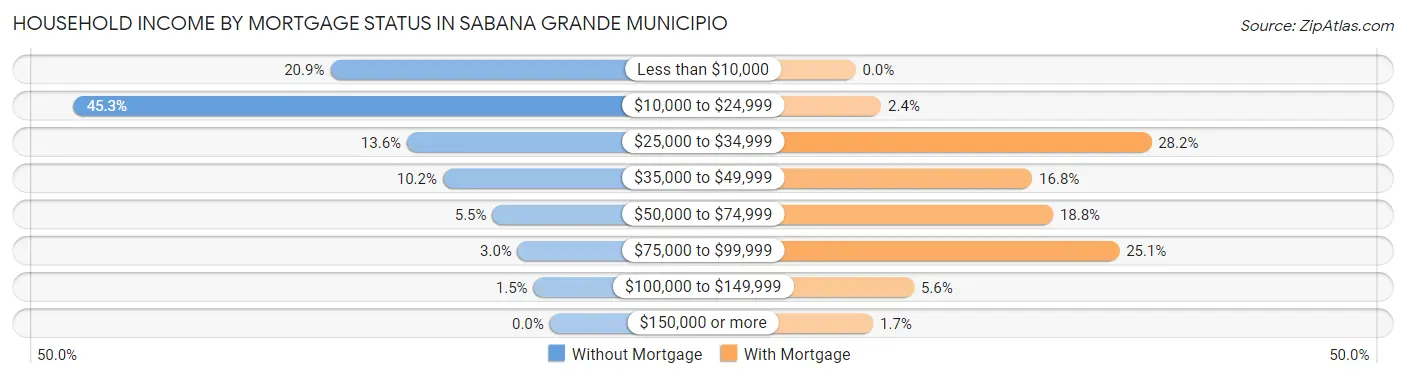
| Household Income | Without Mortgage | With Mortgage |
| Less than $10,000 | 881 (20.9%) | 0 (0.0%) |
| $10,000 to $24,999 | 1,911 (45.3%) | 32 (2.4%) |
| $25,000 to $34,999 | 573 (13.6%) | 370 (28.2%) |
| $35,000 to $49,999 | 429 (10.2%) | 221 (16.8%) |
| $50,000 to $74,999 | 230 (5.4%) | 247 (18.8%) |
| $75,000 to $99,999 | 128 (3.0%) | 330 (25.1%) |
| $100,000 to $149,999 | 65 (1.5%) | 73 (5.6%) |
| $150,000 or more | 0 (0.0%) | 22 (1.7%) |
| Total | 4,217 (100.0%) | 1,314 (100.0%) |
Property Value to Household Income Ratio in Sabana Grande Municipio
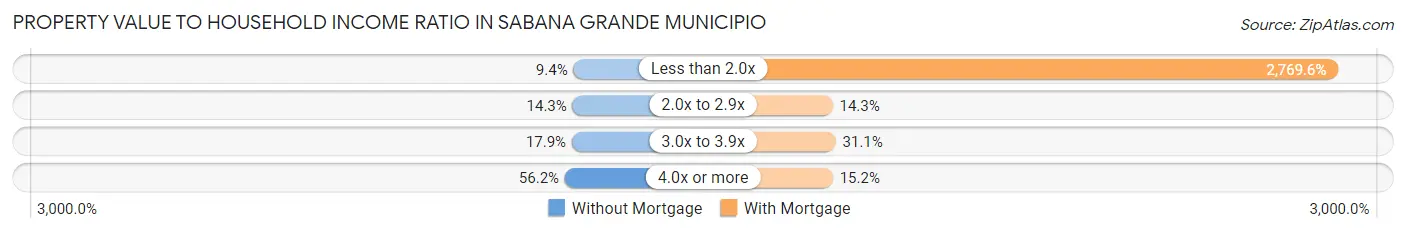
| Value-to-Income Ratio | Without Mortgage | With Mortgage |
| Less than 2.0x | 397 (9.4%) | 36,393 (2,769.6%) |
| 2.0x to 2.9x | 602 (14.3%) | 188 (14.3%) |
| 3.0x to 3.9x | 754 (17.9%) | 408 (31.0%) |
| 4.0x or more | 2,370 (56.2%) | 200 (15.2%) |
| Total | 4,217 (100.0%) | 1,314 (100.0%) |
Real Estate Taxes by Mortgage Status in Sabana Grande Municipio
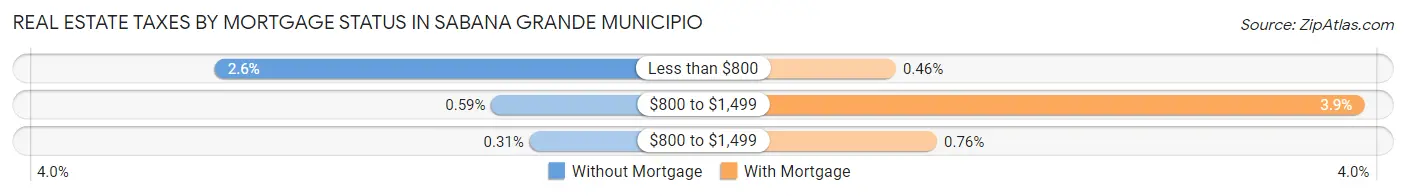
| Property Taxes | Without Mortgage | With Mortgage |
| Less than $800 | 110 (2.6%) | 6 (0.5%) |
| $800 to $1,499 | 25 (0.6%) | 51 (3.9%) |
| $800 to $1,499 | 13 (0.3%) | 10 (0.8%) |
| Total | 4,217 (100.0%) | 1,314 (100.0%) |
Health & Disability in Sabana Grande Municipio
Health Insurance Coverage by Age in Sabana Grande Municipio
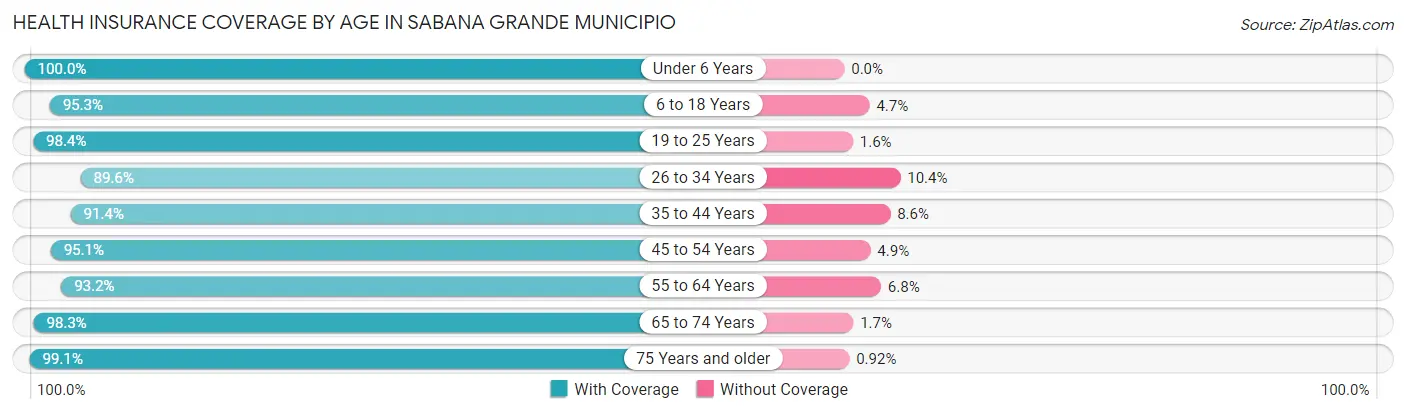
| Age Bracket | With Coverage | Without Coverage |
| Under 6 Years | 861 (100.0%) | 0 (0.0%) |
| 6 to 18 Years | 3,457 (95.3%) | 170 (4.7%) |
| 19 to 25 Years | 2,468 (98.4%) | 40 (1.6%) |
| 26 to 34 Years | 1,562 (89.6%) | 182 (10.4%) |
| 35 to 44 Years | 2,336 (91.4%) | 219 (8.6%) |
| 45 to 54 Years | 2,756 (95.1%) | 141 (4.9%) |
| 55 to 64 Years | 2,686 (93.2%) | 197 (6.8%) |
| 65 to 74 Years | 2,789 (98.3%) | 47 (1.7%) |
| 75 Years and older | 2,575 (99.1%) | 24 (0.9%) |
| Total | 21,490 (95.5%) | 1,020 (4.5%) |
Health Insurance Coverage by Citizenship Status in Sabana Grande Municipio
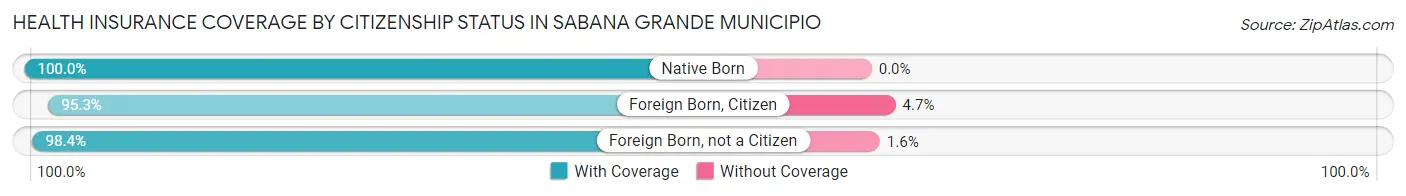
| Citizenship Status | With Coverage | Without Coverage |
| Native Born | 861 (100.0%) | 0 (0.0%) |
| Foreign Born, Citizen | 3,457 (95.3%) | 170 (4.7%) |
| Foreign Born, not a Citizen | 2,468 (98.4%) | 40 (1.6%) |
Health Insurance Coverage by Household Income in Sabana Grande Municipio
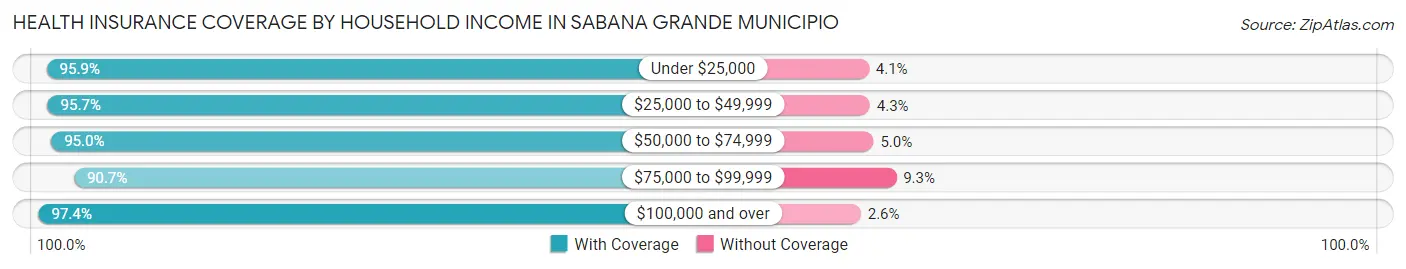
| Household Income | With Coverage | Without Coverage |
| Under $25,000 | 10,482 (95.9%) | 452 (4.1%) |
| $25,000 to $49,999 | 6,311 (95.7%) | 285 (4.3%) |
| $50,000 to $74,999 | 2,605 (95.0%) | 137 (5.0%) |
| $75,000 to $99,999 | 1,206 (90.7%) | 123 (9.3%) |
| $100,000 and over | 818 (97.4%) | 22 (2.6%) |
Public vs Private Health Insurance Coverage by Age in Sabana Grande Municipio
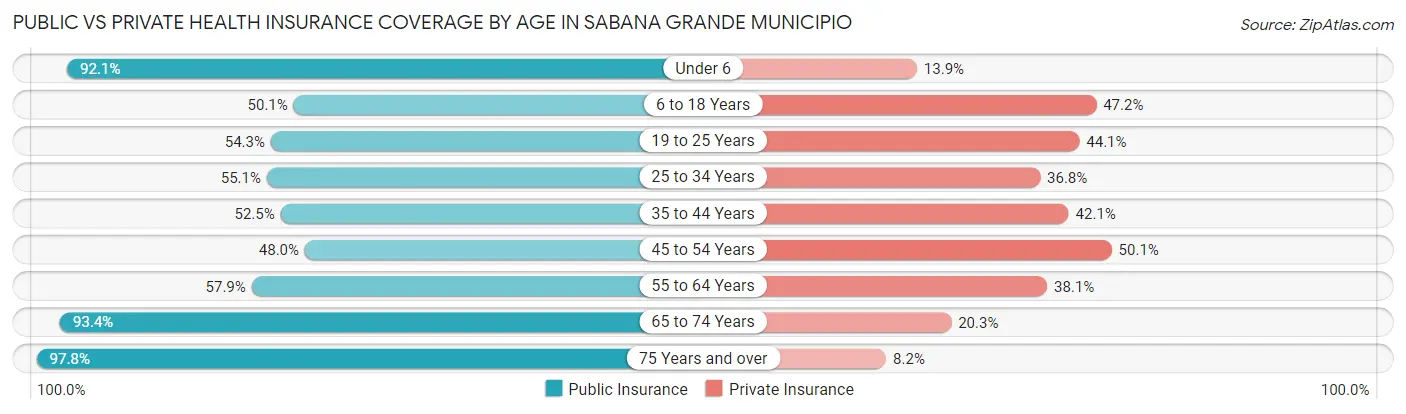
| Age Bracket | Public Insurance | Private Insurance |
| Under 6 | 793 (92.1%) | 120 (13.9%) |
| 6 to 18 Years | 1,816 (50.1%) | 1,713 (47.2%) |
| 19 to 25 Years | 1,362 (54.3%) | 1,106 (44.1%) |
| 25 to 34 Years | 960 (55.0%) | 642 (36.8%) |
| 35 to 44 Years | 1,341 (52.5%) | 1,076 (42.1%) |
| 45 to 54 Years | 1,390 (48.0%) | 1,451 (50.1%) |
| 55 to 64 Years | 1,668 (57.9%) | 1,099 (38.1%) |
| 65 to 74 Years | 2,650 (93.4%) | 576 (20.3%) |
| 75 Years and over | 2,541 (97.8%) | 214 (8.2%) |
| Total | 14,521 (64.5%) | 7,997 (35.5%) |
Disability Status by Sex by Age in Sabana Grande Municipio
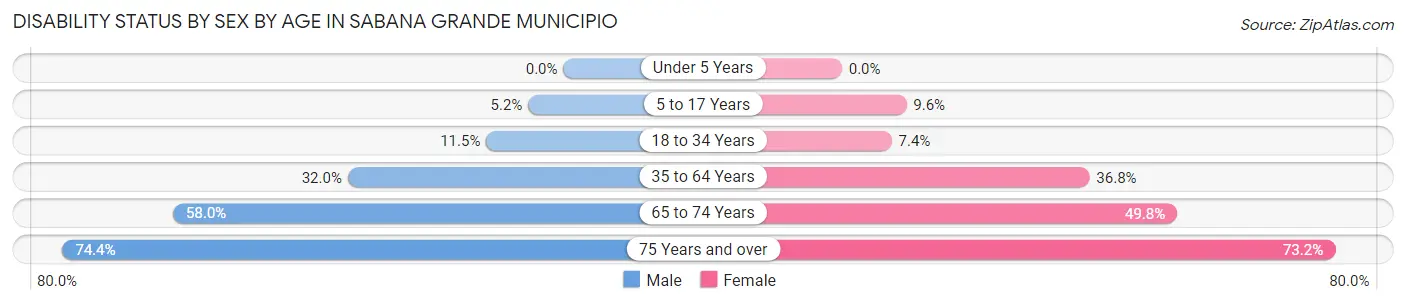
| Age Bracket | Male | Female |
| Under 5 Years | 0 (0.0%) | 0 (0.0%) |
| 5 to 17 Years | 95 (5.2%) | 132 (9.6%) |
| 18 to 34 Years | 266 (11.5%) | 178 (7.4%) |
| 35 to 64 Years | 1,217 (32.0%) | 1,667 (36.8%) |
| 65 to 74 Years | 724 (58.0%) | 790 (49.8%) |
| 75 Years and over | 811 (74.4%) | 1,105 (73.2%) |
Disability Class by Sex by Age in Sabana Grande Municipio
Disability Class: Hearing Difficulty
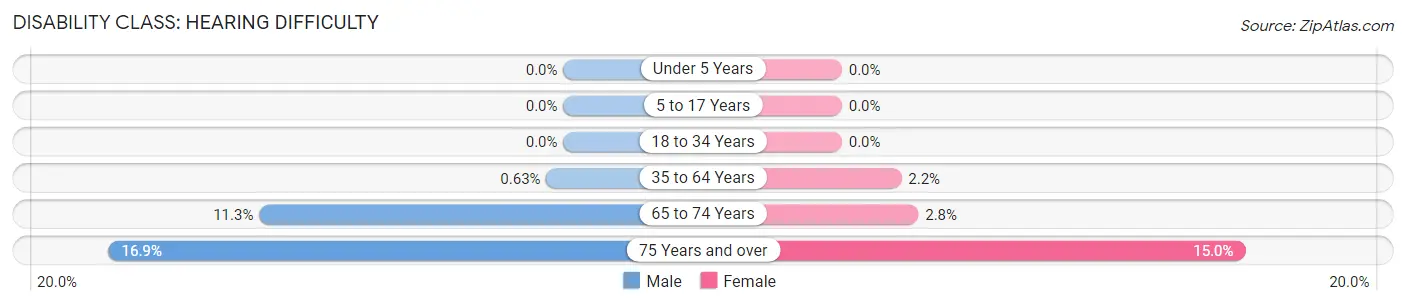
| Age Bracket | Male | Female |
| Under 5 Years | 0 (0.0%) | 0 (0.0%) |
| 5 to 17 Years | 0 (0.0%) | 0 (0.0%) |
| 18 to 34 Years | 0 (0.0%) | 0 (0.0%) |
| 35 to 64 Years | 24 (0.6%) | 100 (2.2%) |
| 65 to 74 Years | 141 (11.3%) | 45 (2.8%) |
| 75 Years and over | 184 (16.9%) | 226 (15.0%) |
Disability Class: Vision Difficulty
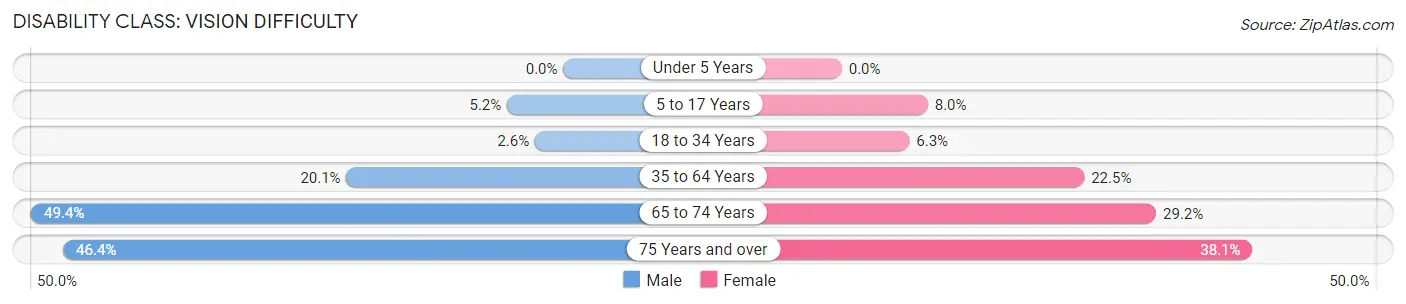
| Age Bracket | Male | Female |
| Under 5 Years | 0 (0.0%) | 0 (0.0%) |
| 5 to 17 Years | 95 (5.2%) | 110 (8.0%) |
| 18 to 34 Years | 61 (2.6%) | 151 (6.3%) |
| 35 to 64 Years | 765 (20.1%) | 1,020 (22.5%) |
| 65 to 74 Years | 617 (49.4%) | 463 (29.2%) |
| 75 Years and over | 506 (46.4%) | 575 (38.1%) |
Disability Class: Cognitive Difficulty
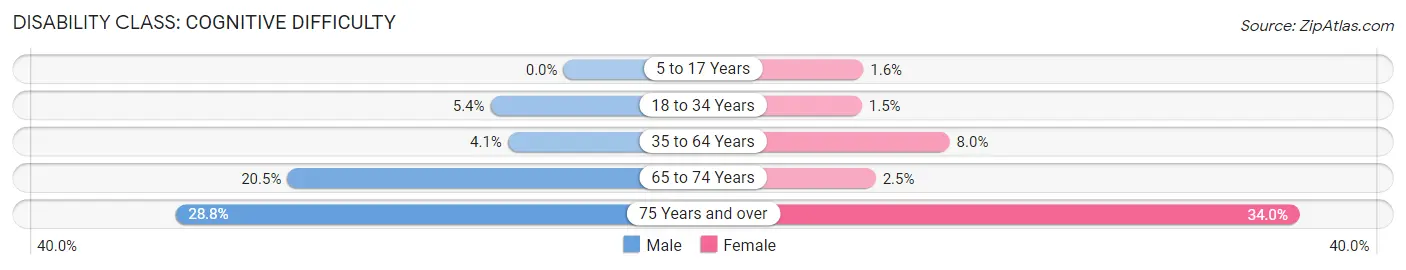
| Age Bracket | Male | Female |
| 5 to 17 Years | 0 (0.0%) | 22 (1.6%) |
| 18 to 34 Years | 126 (5.4%) | 36 (1.5%) |
| 35 to 64 Years | 157 (4.1%) | 363 (8.0%) |
| 65 to 74 Years | 256 (20.5%) | 40 (2.5%) |
| 75 Years and over | 314 (28.8%) | 513 (34.0%) |
Disability Class: Ambulatory Difficulty
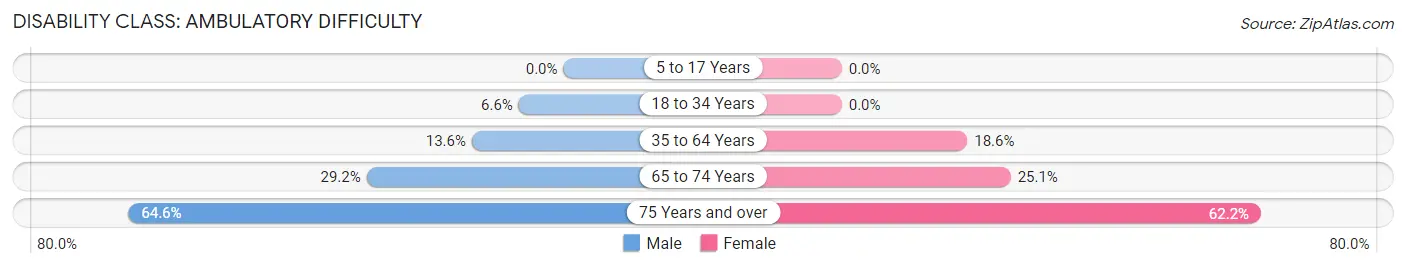
| Age Bracket | Male | Female |
| 5 to 17 Years | 0 (0.0%) | 0 (0.0%) |
| 18 to 34 Years | 154 (6.6%) | 0 (0.0%) |
| 35 to 64 Years | 517 (13.6%) | 845 (18.6%) |
| 65 to 74 Years | 365 (29.2%) | 398 (25.1%) |
| 75 Years and over | 704 (64.6%) | 939 (62.2%) |
Disability Class: Self-Care Difficulty
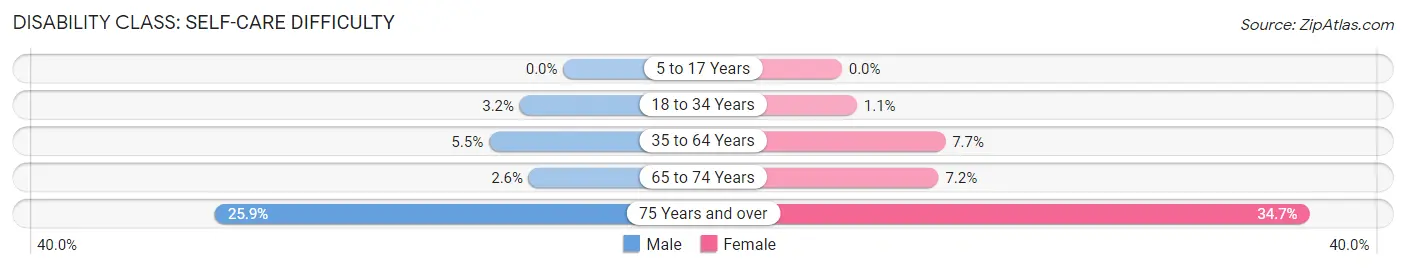
| Age Bracket | Male | Female |
| 5 to 17 Years | 0 (0.0%) | 0 (0.0%) |
| 18 to 34 Years | 75 (3.2%) | 27 (1.1%) |
| 35 to 64 Years | 210 (5.5%) | 348 (7.7%) |
| 65 to 74 Years | 32 (2.6%) | 114 (7.2%) |
| 75 Years and over | 282 (25.9%) | 524 (34.7%) |
Technology Access in Sabana Grande Municipio
Computing Device Access in Sabana Grande Municipio
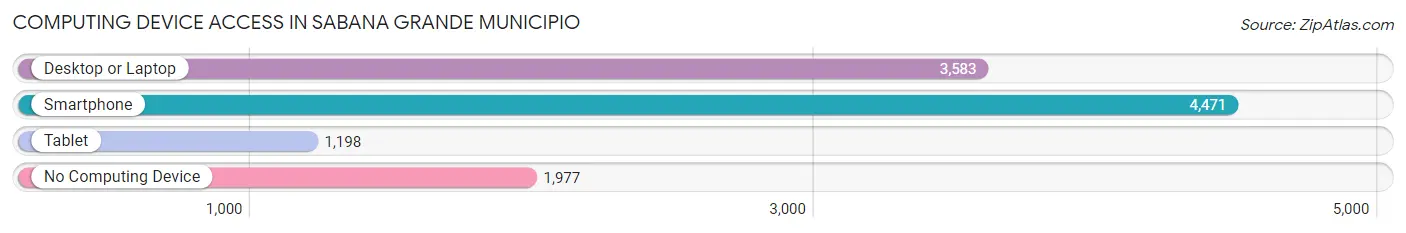
| Device Type | # Households | % Households |
| Desktop or Laptop | 3,583 | 50.4% |
| Smartphone | 4,471 | 62.9% |
| Tablet | 1,198 | 16.9% |
| No Computing Device | 1,977 | 27.8% |
| Total | 7,102 | 100.0% |
Internet Access in Sabana Grande Municipio
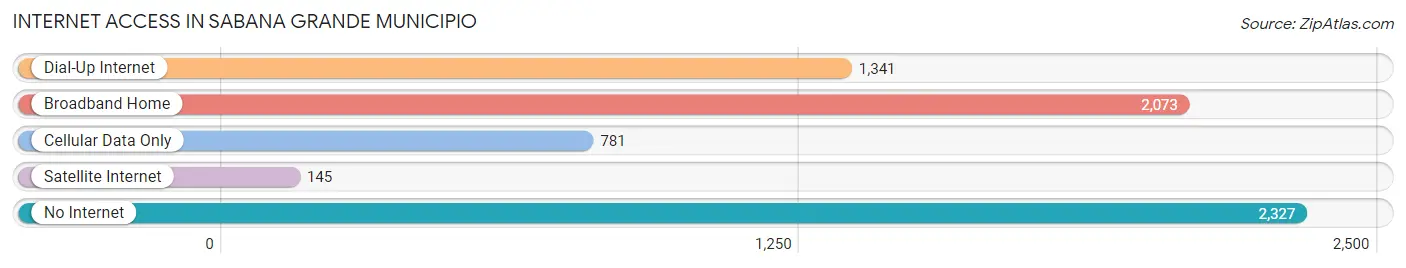
| Internet Type | # Households | % Households |
| Dial-Up Internet | 1,341 | 18.9% |
| Broadband Home | 2,073 | 29.2% |
| Cellular Data Only | 781 | 11.0% |
| Satellite Internet | 145 | 2.0% |
| No Internet | 2,327 | 32.8% |
| Total | 7,102 | 100.0% |
Sabana Grande Municipio Summary
Sabana Grande Municipio is located in the western part of Puerto Rico, in the region known as the Porta del Sol. It is bordered by the municipalities of Lajas, San Germán, Maricao, and Las Marías. The municipality has a total area of approximately 97 square miles and a population of approximately 24,000 people.
History
The area that is now Sabana Grande Municipio was originally inhabited by the Taíno people, who were the indigenous people of Puerto Rico. The Taíno people were eventually displaced by the Spanish, who colonized the island in the 16th century. The area was then divided into several large haciendas, which were owned by wealthy Spanish landowners. In 1815, the area was officially established as the municipality of Sabana Grande.
Geography
Sabana Grande Municipio is located in the western part of Puerto Rico, in the region known as the Porta del Sol. It is bordered by the municipalities of Lajas, San Germán, Maricao, and Las Marías. The municipality has a total area of approximately 97 square miles and is divided into the barrios of Sabana Grande, San Germán, and Maricao. The terrain is mostly flat, with some hills in the northern part of the municipality. The climate is tropical, with temperatures ranging from the mid-70s to the mid-80s.
Economy
The economy of Sabana Grande Municipio is largely based on agriculture. The main crops grown in the area are coffee, sugarcane, and tobacco. Other industries in the area include manufacturing, tourism, and services. The municipality is also home to several small businesses, including restaurants, shops, and hotels.
Demographics
As of the 2010 census, the population of Sabana Grande Municipio was 24,000. The population is mostly of Puerto Rican descent, with a small percentage of people of other ethnic backgrounds. The median household income in the municipality is $20,000, and the unemployment rate is around 10%.
Education
Sabana Grande Municipio is served by the Puerto Rico Department of Education. There are several public schools in the municipality, as well as several private schools. The University of Puerto Rico also has a campus in the municipality.
Conclusion
Sabana Grande Municipio is a small municipality located in the western part of Puerto Rico. It has a population of approximately 24,000 people and is largely based on agriculture. The economy is also supported by manufacturing, tourism, and services. The municipality is served by the Puerto Rico Department of Education and is home to several public and private schools.
Common Questions
What is Per Capita Income in Sabana Grande Municipio?
Per Capita income in Sabana Grande Municipio is $11,255.
What is the Median Family Income in Sabana Grande Municipio?
Median Family Income in Sabana Grande Municipio is $24,957.
What is the Median Household income in Sabana Grande Municipio?
Median Household Income in Sabana Grande Municipio is $20,464.
What is Income or Wage Gap in Sabana Grande Municipio?
Income or Wage Gap in Sabana Grande Municipio is 6.6%.
Women in Sabana Grande Municipio earn 93.4 cents for every dollar earned by a man.
What is Family Income Deficit in Sabana Grande Municipio?
Family Income Deficit in Sabana Grande Municipio is $7,971.
Families that are below poverty line in Sabana Grande Municipio earn $7,971 less on average than the poverty threshold level.
What is Inequality or Gini Index in Sabana Grande Municipio?
Inequality or Gini Index in Sabana Grande Municipio is 0.47.
What is the Total Population of Sabana Grande Municipio?
Total Population of Sabana Grande Municipio is 22,639.
What is the Total Male Population of Sabana Grande Municipio?
Total Male Population of Sabana Grande Municipio is 10,557.
What is the Total Female Population of Sabana Grande Municipio?
Total Female Population of Sabana Grande Municipio is 12,082.
What is the Ratio of Males per 100 Females in Sabana Grande Municipio?
There are 87.38 Males per 100 Females in Sabana Grande Municipio.
What is the Ratio of Females per 100 Males in Sabana Grande Municipio?
There are 114.45 Females per 100 Males in Sabana Grande Municipio.
What is the Median Population Age in Sabana Grande Municipio?
Median Population Age in Sabana Grande Municipio is 44.9 Years.
What is the Average Family Size in Sabana Grande Municipio
Average Family Size in Sabana Grande Municipio is 4.4 People.
What is the Average Household Size in Sabana Grande Municipio
Average Household Size in Sabana Grande Municipio is 3.2 People.
How Large is the Labor Force in Sabana Grande Municipio?
There are 7,240 People in the Labor Forcein in Sabana Grande Municipio.
What is the Percentage of People in the Labor Force in Sabana Grande Municipio?
37.7% of People are in the Labor Force in Sabana Grande Municipio.
What is the Unemployment Rate in Sabana Grande Municipio?
Unemployment Rate in Sabana Grande Municipio is 11.5%.