Rio Grande Municipio, PR Map & Demographics
Rio Grande Municipio Overview
$14,161
PER CAPITA INCOME
$31,786
AVG FAMILY INCOME
$25,963
AVG HOUSEHOLD INCOME
2.7%
WAGE / INCOME GAP [ % ]
97.3¢/ $1
WAGE / INCOME GAP [ $ ]
$11,055
FAMILY INCOME DEFICIT
0.47
INEQUALITY / GINI INDEX
46,838
TOTAL POPULATION
22,429
MALE POPULATION
24,409
FEMALE POPULATION
91.89
MALES / 100 FEMALES
108.83
FEMALES / 100 MALES
43.8
MEDIAN AGE
3.5
AVG FAMILY SIZE
2.9
AVG HOUSEHOLD SIZE
21,021
LABOR FORCE [ PEOPLE ]
52.3%
PERCENT IN LABOR FORCE
17.6%
UNEMPLOYMENT RATE
Rio Grande Municipio Area Codes
Income in Rio Grande Municipio
Income Overview in Rio Grande Municipio
Per Capita Income in Rio Grande Municipio is $14,161, while median incomes of families and households are $31,786 and $25,963 respectively.
| Characteristic | Number | Measure |
| Per Capita Income | 46,838 | $14,161 |
| Median Family Income | 11,120 | $31,786 |
| Mean Family Income | 11,120 | $39,824 |
| Median Household Income | 15,981 | $25,963 |
| Mean Household Income | 15,981 | $35,286 |
| Income Deficit | 11,120 | $11,055 |
| Wage / Income Gap (%) | 46,838 | 2.66% |
| Wage / Income Gap ($) | 46,838 | 97.34¢ per $1 |
| Gini / Inequality Index | 46,838 | 0.47 |
Earnings by Sex in Rio Grande Municipio
Average Earnings in Rio Grande Municipio are $18,928, $19,131 for men and $18,622 for women, a difference of 2.7%.
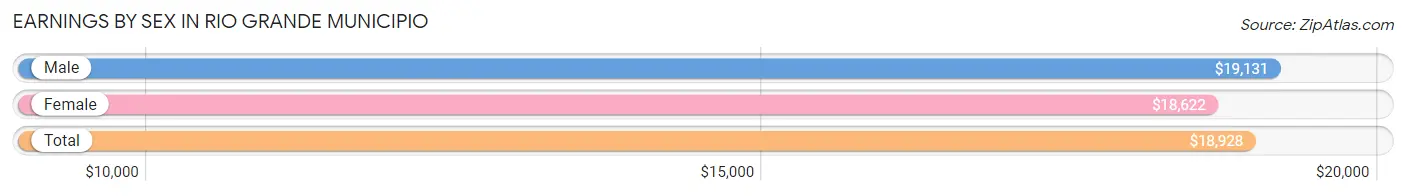
| Sex | Number | Average Earnings |
| Male | 9,987 (52.6%) | $19,131 |
| Female | 9,005 (47.4%) | $18,622 |
| Total | 18,992 (100.0%) | $18,928 |
Earnings by Sex by Income Bracket in Rio Grande Municipio
The most common earnings brackets in Rio Grande Municipio are $17,500 to $19,999 for men (1,092 | 10.9%) and $15,000 to $17,499 for women (913 | 10.1%).
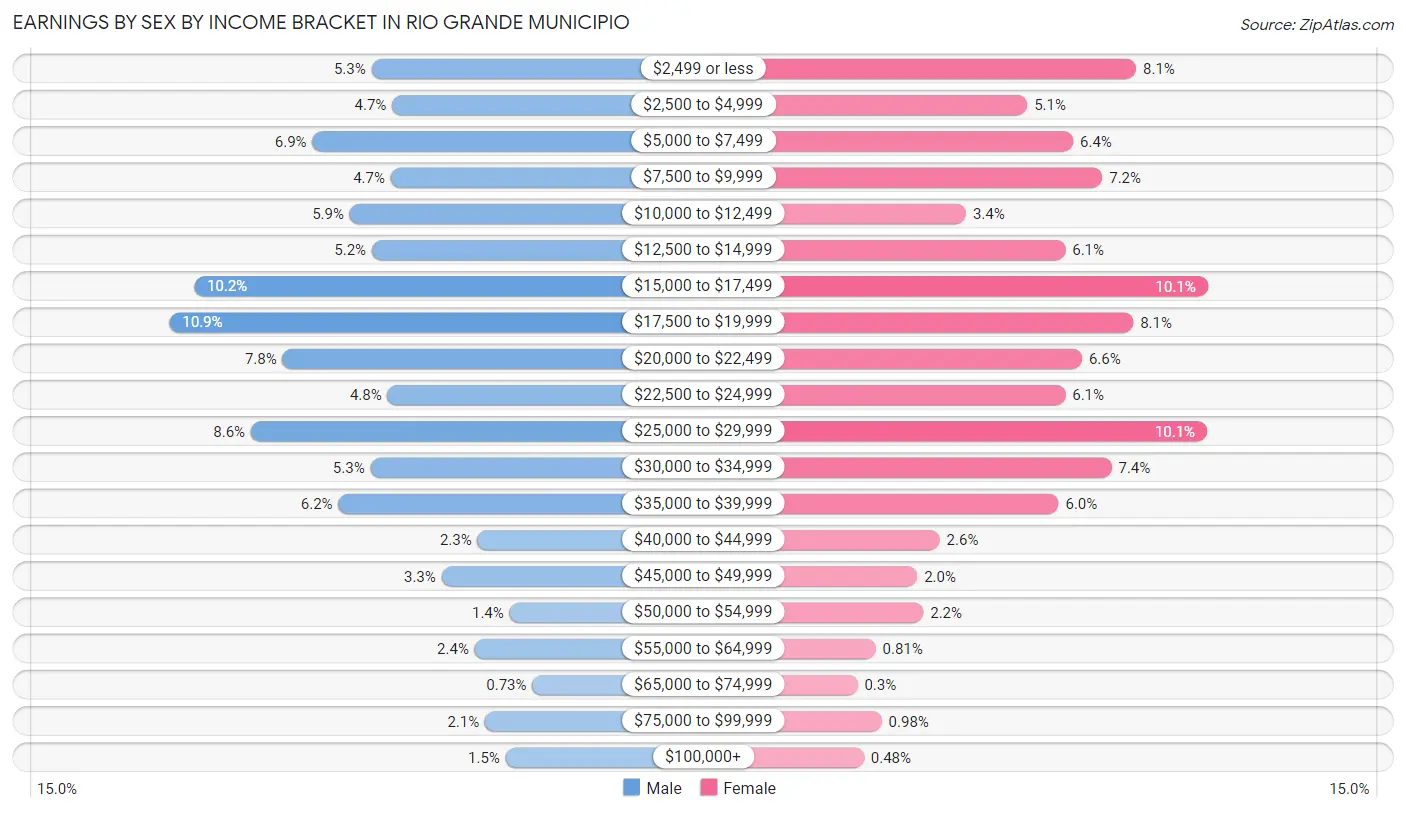
| Income | Male | Female |
| $2,499 or less | 524 (5.2%) | 732 (8.1%) |
| $2,500 to $4,999 | 466 (4.7%) | 457 (5.1%) |
| $5,000 to $7,499 | 690 (6.9%) | 573 (6.4%) |
| $7,500 to $9,999 | 470 (4.7%) | 647 (7.2%) |
| $10,000 to $12,499 | 585 (5.9%) | 302 (3.4%) |
| $12,500 to $14,999 | 523 (5.2%) | 553 (6.1%) |
| $15,000 to $17,499 | 1,023 (10.2%) | 913 (10.1%) |
| $17,500 to $19,999 | 1,092 (10.9%) | 725 (8.1%) |
| $20,000 to $22,499 | 774 (7.7%) | 595 (6.6%) |
| $22,500 to $24,999 | 479 (4.8%) | 553 (6.1%) |
| $25,000 to $29,999 | 863 (8.6%) | 911 (10.1%) |
| $30,000 to $34,999 | 527 (5.3%) | 670 (7.4%) |
| $35,000 to $39,999 | 617 (6.2%) | 536 (5.9%) |
| $40,000 to $44,999 | 227 (2.3%) | 235 (2.6%) |
| $45,000 to $49,999 | 328 (3.3%) | 178 (2.0%) |
| $50,000 to $54,999 | 137 (1.4%) | 194 (2.1%) |
| $55,000 to $64,999 | 235 (2.4%) | 73 (0.8%) |
| $65,000 to $74,999 | 73 (0.7%) | 27 (0.3%) |
| $75,000 to $99,999 | 206 (2.1%) | 88 (1.0%) |
| $100,000+ | 148 (1.5%) | 43 (0.5%) |
| Total | 9,987 (100.0%) | 9,005 (100.0%) |
Earnings by Sex by Educational Attainment in Rio Grande Municipio
Average earnings in Rio Grande Municipio are $20,428 for men and $20,340 for women, a difference of 0.4%. Men with an educational attainment of graduate degree enjoy the highest average annual earnings of $38,651, while those with less than high school education earn the least with $15,730. Women with an educational attainment of graduate degree earn the most with the average annual earnings of $30,610, while those with less than high school education have the smallest earnings of $10,950.
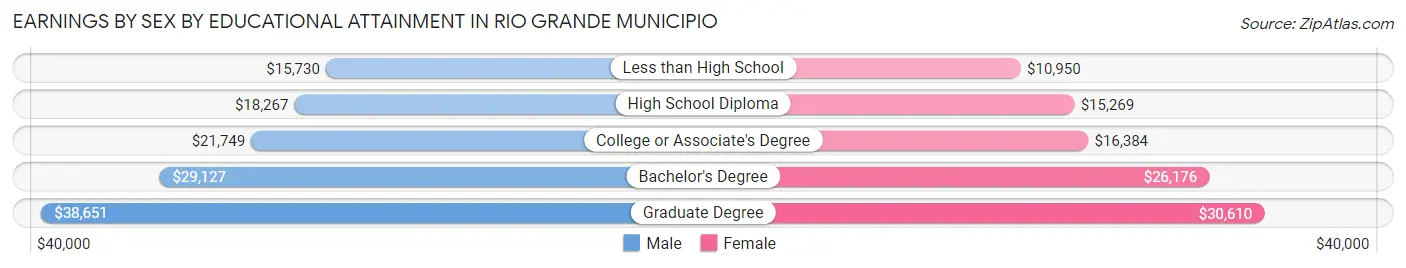
| Educational Attainment | Male Income | Female Income |
| Less than High School | $15,730 | $10,950 |
| High School Diploma | $18,267 | $15,269 |
| College or Associate's Degree | $21,749 | $16,384 |
| Bachelor's Degree | $29,127 | $26,176 |
| Graduate Degree | $38,651 | $30,610 |
| Total | $20,428 | $20,340 |
Family Income in Rio Grande Municipio
Family Income Brackets in Rio Grande Municipio
According to the Rio Grande Municipio family income data, there are 2,124 families falling into the $35,000 to $49,999 income range, which is the most common income bracket and makes up 19.1% of all families. Conversely, the $200,000+ income bracket is the least frequent group with only 22 families (0.2%) belonging to this category.
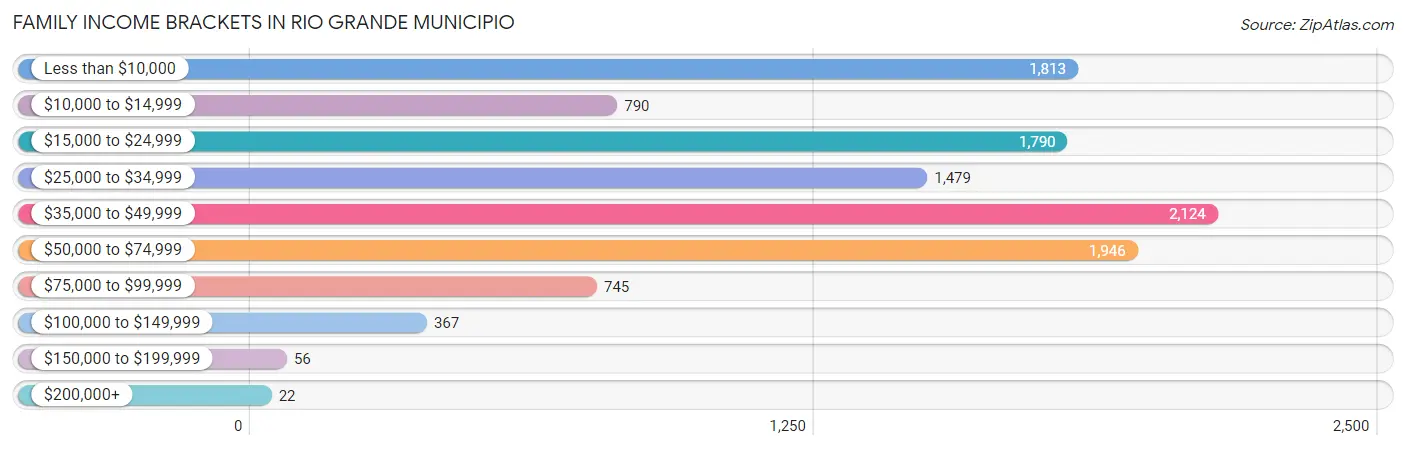
| Income Bracket | # Families | % Families |
| Less than $10,000 | 1,813 | 16.3% |
| $10,000 to $14,999 | 790 | 7.1% |
| $15,000 to $24,999 | 1,790 | 16.1% |
| $25,000 to $34,999 | 1,479 | 13.3% |
| $35,000 to $49,999 | 2,124 | 19.1% |
| $50,000 to $74,999 | 1,946 | 17.5% |
| $75,000 to $99,999 | 745 | 6.7% |
| $100,000 to $149,999 | 367 | 3.3% |
| $150,000 to $199,999 | 56 | 0.5% |
| $200,000+ | 22 | 0.2% |
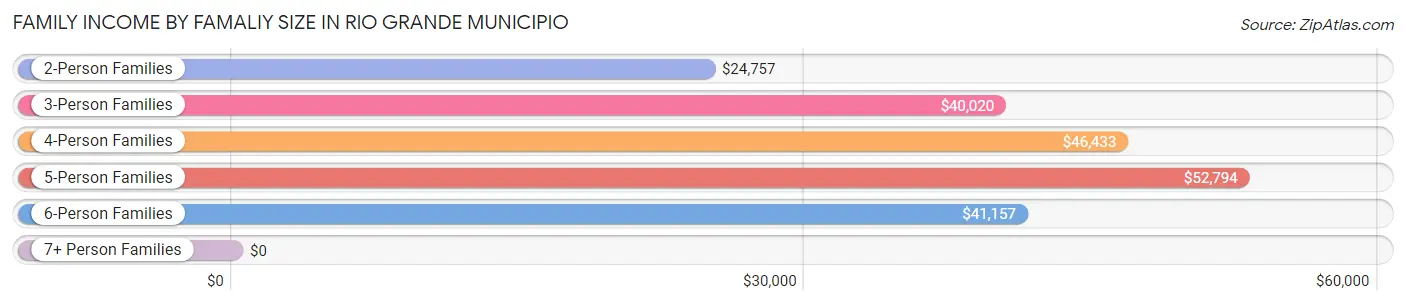
Family Income by Famaliy Size in Rio Grande Municipio
5-person families (492 | 4.4%) account for the highest median family income in Rio Grande Municipio with $52,794 per family, while 3-person families (3,168 | 28.5%) have the highest median income of $13,340 per family member.
| Income Bracket | # Families | Median Income |
| 2-Person Families | 5,255 (47.3%) | $24,757 |
| 3-Person Families | 3,168 (28.5%) | $40,020 |
| 4-Person Families | 2,020 (18.2%) | $46,433 |
| 5-Person Families | 492 (4.4%) | $52,794 |
| 6-Person Families | 131 (1.2%) | $41,157 |
| 7+ Person Families | 54 (0.5%) | $0 |
| Total | 11,120 (100.0%) | $31,786 |
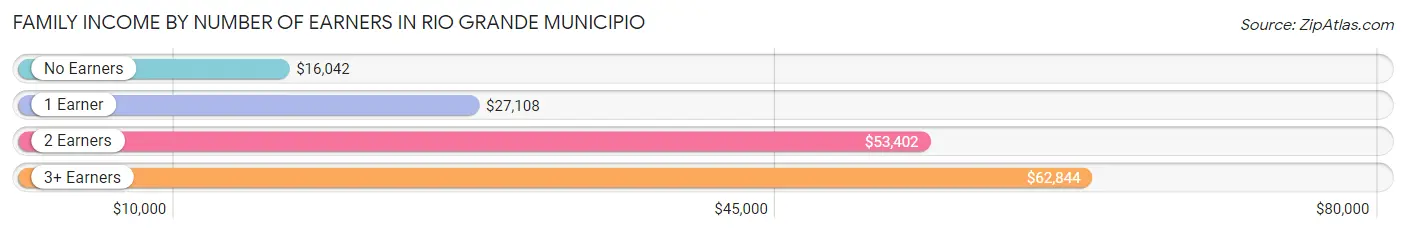
Family Income by Number of Earners in Rio Grande Municipio
The median family income in Rio Grande Municipio is $31,786, with families comprising 3+ earners (813) having the highest median family income of $62,844, while families with no earners (3,447) have the lowest median family income of $16,042, accounting for 7.3% and 31.0% of families, respectively.
| Number of Earners | # Families | Median Income |
| No Earners | 3,447 (31.0%) | $16,042 |
| 1 Earner | 4,102 (36.9%) | $27,108 |
| 2 Earners | 2,758 (24.8%) | $53,402 |
| 3+ Earners | 813 (7.3%) | $62,844 |
| Total | 11,120 (100.0%) | $31,786 |
Household Income in Rio Grande Municipio
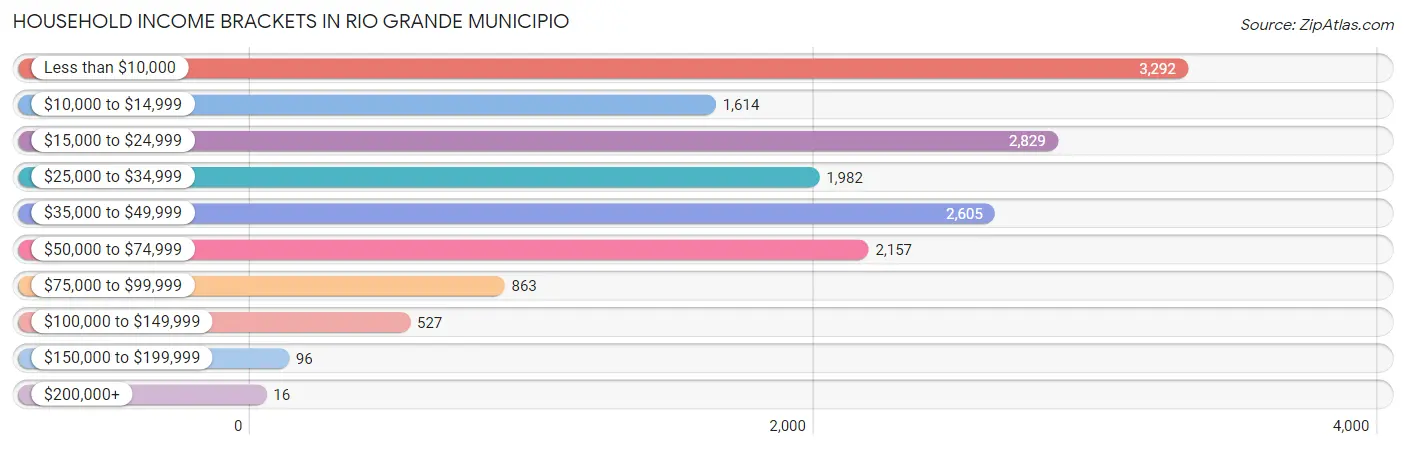
Household Income Brackets in Rio Grande Municipio
With 3,292 households falling in the category, the less than $10,000 income range is the most frequent in Rio Grande Municipio, accounting for 20.6% of all households. In contrast, only 16 households (0.1%) fall into the $200,000+ income bracket, making it the least populous group.
| Income Bracket | # Households | % Households |
| Less than $10,000 | 3,292 | 20.6% |
| $10,000 to $14,999 | 1,614 | 10.1% |
| $15,000 to $24,999 | 2,829 | 17.7% |
| $25,000 to $34,999 | 1,982 | 12.4% |
| $35,000 to $49,999 | 2,605 | 16.3% |
| $50,000 to $74,999 | 2,157 | 13.5% |
| $75,000 to $99,999 | 863 | 5.4% |
| $100,000 to $149,999 | 527 | 3.3% |
| $150,000 to $199,999 | 96 | 0.6% |
| $200,000+ | 16 | 0.1% |
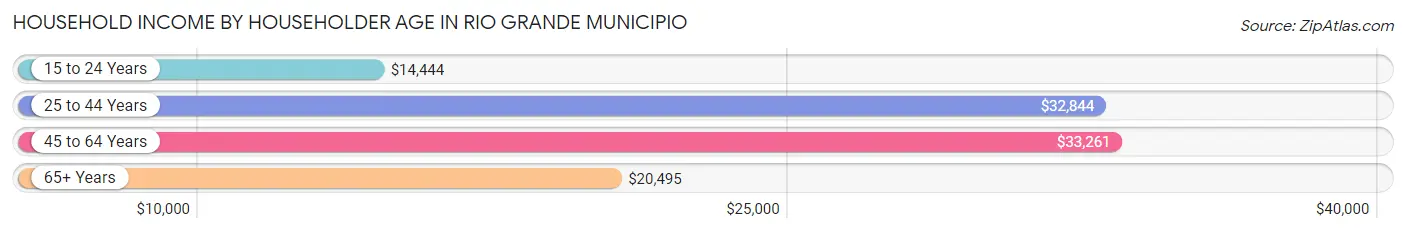
Household Income by Householder Age in Rio Grande Municipio
The median household income in Rio Grande Municipio is $25,963, with the highest median household income of $33,261 found in the 45 to 64 years age bracket for the primary householder. A total of 6,158 households (38.5%) fall into this category. Meanwhile, the 15 to 24 years age bracket for the primary householder has the lowest median household income of $14,444, with 204 households (1.3%) in this group.
| Income Bracket | # Households | Median Income |
| 15 to 24 Years | 204 (1.3%) | $14,444 |
| 25 to 44 Years | 3,485 (21.8%) | $32,844 |
| 45 to 64 Years | 6,158 (38.5%) | $33,261 |
| 65+ Years | 6,134 (38.4%) | $20,495 |
| Total | 15,981 (100.0%) | $25,963 |
Poverty in Rio Grande Municipio
Income Below Poverty by Sex and Age in Rio Grande Municipio
With 33.5% poverty level for males and 38.8% for females among the residents of Rio Grande Municipio, 5 year old males and under 5 year old females are the most vulnerable to poverty, with 193 males (90.6%) and 489 females (66.0%) in their respective age groups living below the poverty level.
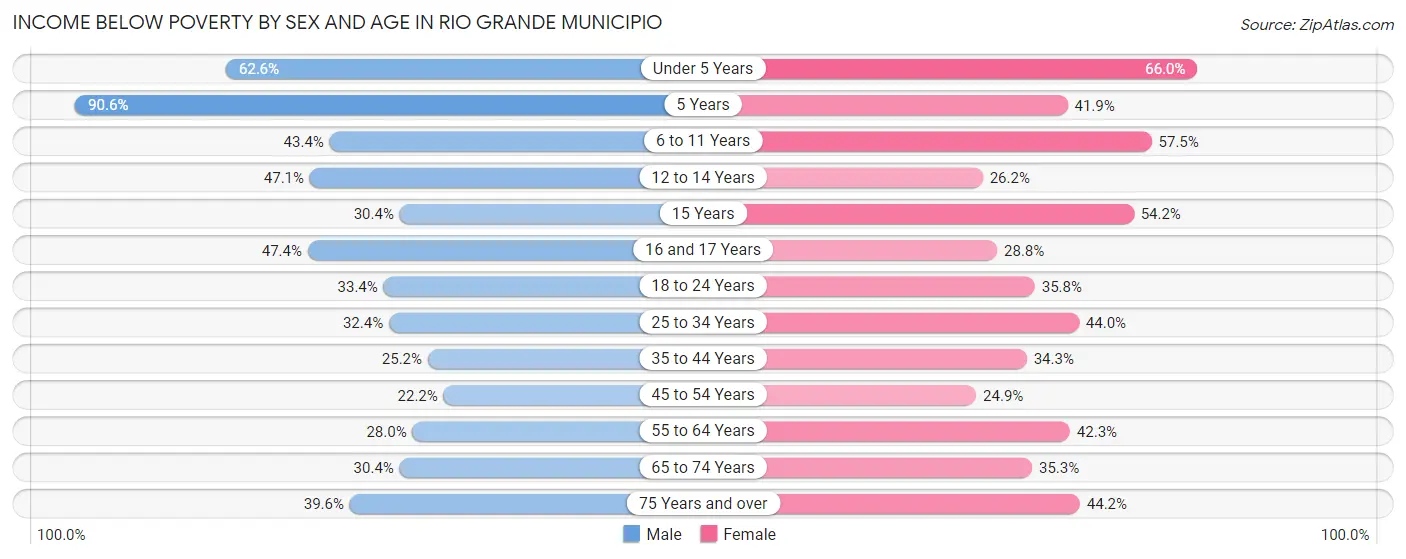
| Age Bracket | Male | Female |
| Under 5 Years | 498 (62.6%) | 489 (66.0%) |
| 5 Years | 193 (90.6%) | 75 (41.9%) |
| 6 to 11 Years | 632 (43.4%) | 754 (57.5%) |
| 12 to 14 Years | 327 (47.0%) | 208 (26.2%) |
| 15 Years | 41 (30.4%) | 175 (54.2%) |
| 16 and 17 Years | 350 (47.4%) | 143 (28.8%) |
| 18 to 24 Years | 734 (33.4%) | 765 (35.8%) |
| 25 to 34 Years | 992 (32.4%) | 1,356 (44.0%) |
| 35 to 44 Years | 664 (25.2%) | 995 (34.3%) |
| 45 to 54 Years | 657 (22.2%) | 849 (24.9%) |
| 55 to 64 Years | 794 (28.0%) | 1,410 (42.3%) |
| 65 to 74 Years | 723 (30.4%) | 1,081 (35.3%) |
| 75 Years and over | 781 (39.6%) | 1,100 (44.2%) |
| Total | 7,386 (33.5%) | 9,400 (38.8%) |
Income Above Poverty by Sex and Age in Rio Grande Municipio
According to the poverty statistics in Rio Grande Municipio, males aged 45 to 54 years and females aged 45 to 54 years are the age groups that are most secure financially, with 77.8% of males and 75.1% of females in these age groups living above the poverty line.
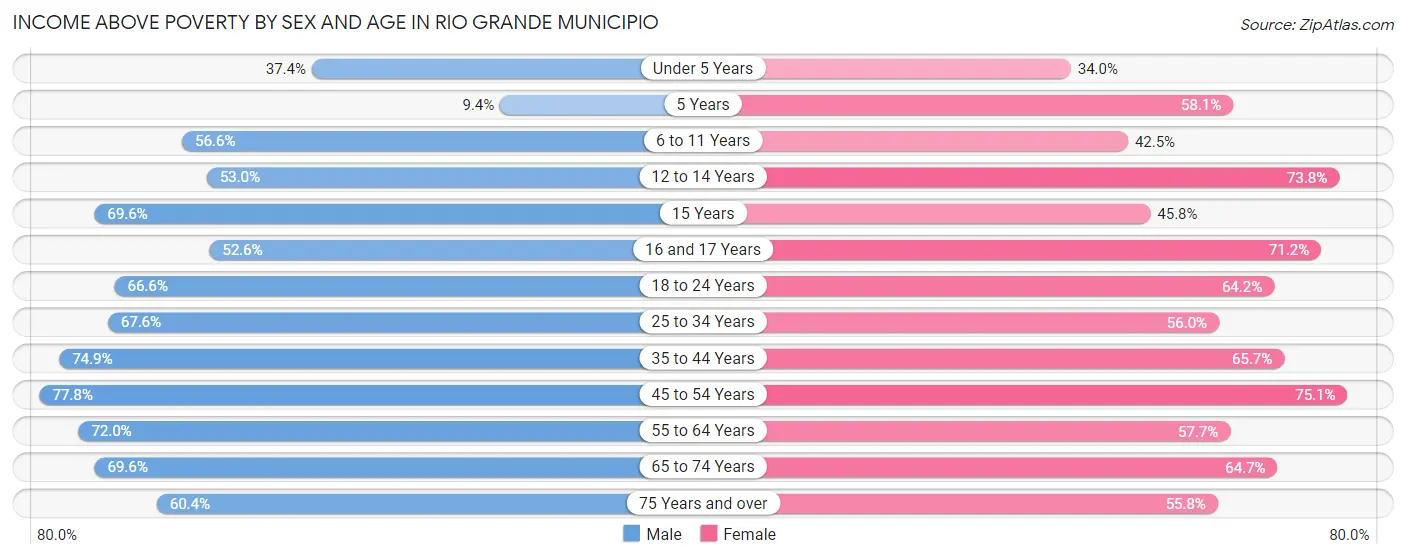
| Age Bracket | Male | Female |
| Under 5 Years | 297 (37.4%) | 252 (34.0%) |
| 5 Years | 20 (9.4%) | 104 (58.1%) |
| 6 to 11 Years | 825 (56.6%) | 557 (42.5%) |
| 12 to 14 Years | 368 (52.9%) | 587 (73.8%) |
| 15 Years | 94 (69.6%) | 148 (45.8%) |
| 16 and 17 Years | 388 (52.6%) | 353 (71.2%) |
| 18 to 24 Years | 1,466 (66.6%) | 1,370 (64.2%) |
| 25 to 34 Years | 2,073 (67.6%) | 1,725 (56.0%) |
| 35 to 44 Years | 1,976 (74.9%) | 1,903 (65.7%) |
| 45 to 54 Years | 2,299 (77.8%) | 2,555 (75.1%) |
| 55 to 64 Years | 2,042 (72.0%) | 1,920 (57.7%) |
| 65 to 74 Years | 1,657 (69.6%) | 1,980 (64.7%) |
| 75 Years and over | 1,189 (60.4%) | 1,389 (55.8%) |
| Total | 14,694 (66.5%) | 14,843 (61.2%) |
Income Below Poverty Among Married-Couple Families in Rio Grande Municipio
The poverty statistics for married-couple families in Rio Grande Municipio show that 24.9% or 1,634 of the total 6,556 families live below the poverty line. Families with 3 or 4 children have the highest poverty rate of 43.7%, comprising of 66 families. On the other hand, families with 1 or 2 children have the lowest poverty rate of 23.2%, which includes 436 families.
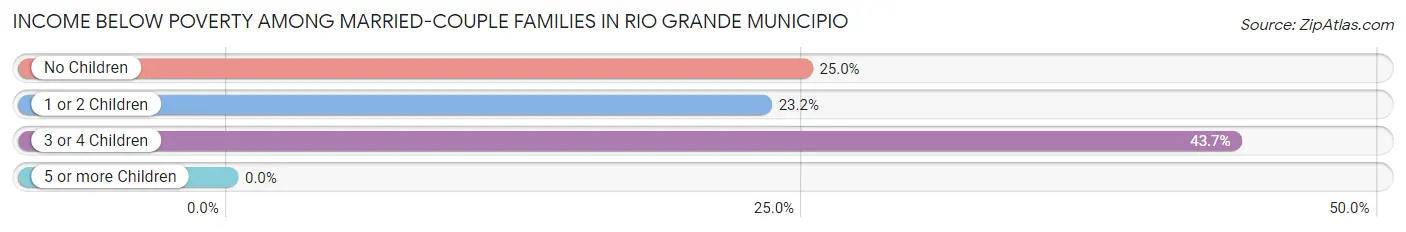
| Children | Above Poverty | Below Poverty |
| No Children | 3,396 (75.0%) | 1,132 (25.0%) |
| 1 or 2 Children | 1,441 (76.8%) | 436 (23.2%) |
| 3 or 4 Children | 85 (56.3%) | 66 (43.7%) |
| 5 or more Children | 0 (0.0%) | 0 (0.0%) |
| Total | 4,922 (75.1%) | 1,634 (24.9%) |
Income Below Poverty Among Single-Parent Households in Rio Grande Municipio
According to the poverty data in Rio Grande Municipio, 55.3% or 546 single-father households and 46.5% or 1,662 single-mother households are living below the poverty line. Among single-father households, those with 1 or 2 children have the highest poverty rate, with 325 households (65.4%) experiencing poverty. Likewise, among single-mother households, those with 3 or 4 children have the highest poverty rate, with 240 households (94.5%) falling below the poverty line.
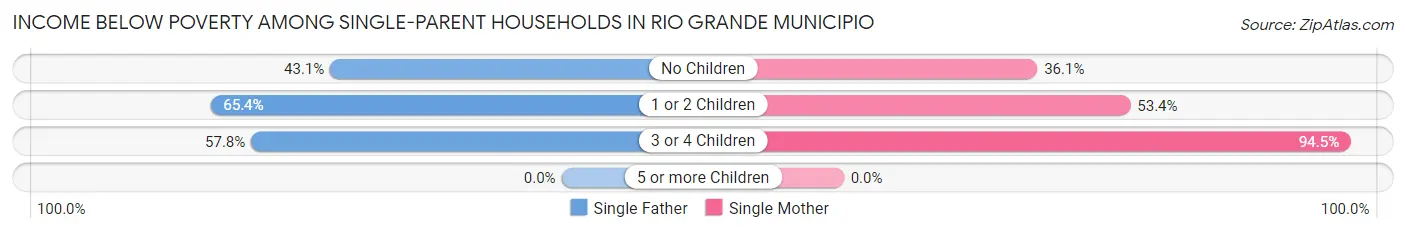
| Children | Single Father | Single Mother |
| No Children | 184 (43.1%) | 731 (36.0%) |
| 1 or 2 Children | 325 (65.4%) | 691 (53.4%) |
| 3 or 4 Children | 37 (57.8%) | 240 (94.5%) |
| 5 or more Children | 0 (0.0%) | 0 (0.0%) |
| Total | 546 (55.3%) | 1,662 (46.5%) |
Income Below Poverty Among Married-Couple vs Single-Parent Households in Rio Grande Municipio
The poverty data for Rio Grande Municipio shows that 1,634 of the married-couple family households (24.9%) and 2,208 of the single-parent households (48.4%) are living below the poverty level. Within the married-couple family households, those with 3 or 4 children have the highest poverty rate, with 66 households (43.7%) falling below the poverty line. Among the single-parent households, those with 3 or 4 children have the highest poverty rate, with 277 household (87.1%) living below poverty.
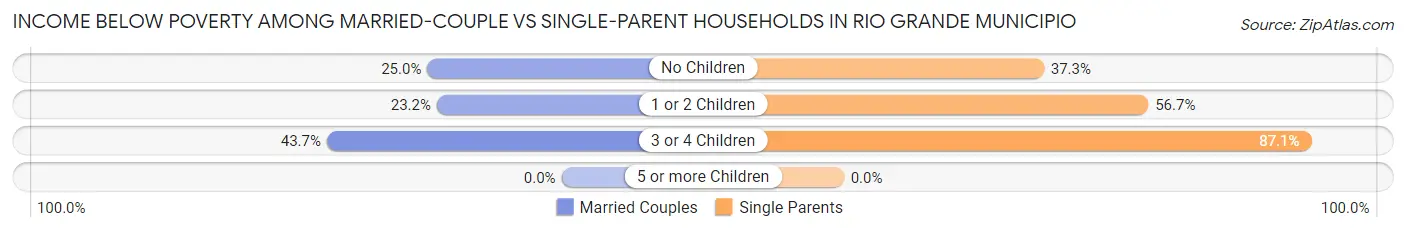
| Children | Married-Couple Families | Single-Parent Households |
| No Children | 1,132 (25.0%) | 915 (37.3%) |
| 1 or 2 Children | 436 (23.2%) | 1,016 (56.7%) |
| 3 or 4 Children | 66 (43.7%) | 277 (87.1%) |
| 5 or more Children | 0 (0.0%) | 0 (0.0%) |
| Total | 1,634 (24.9%) | 2,208 (48.4%) |
Race in Rio Grande Municipio
The most populous races in Rio Grande Municipio are Hispanic or Latino (46,468 | 99.2%), Some other Race (15,547 | 33.2%), and White / Caucasian (12,920 | 27.6%).
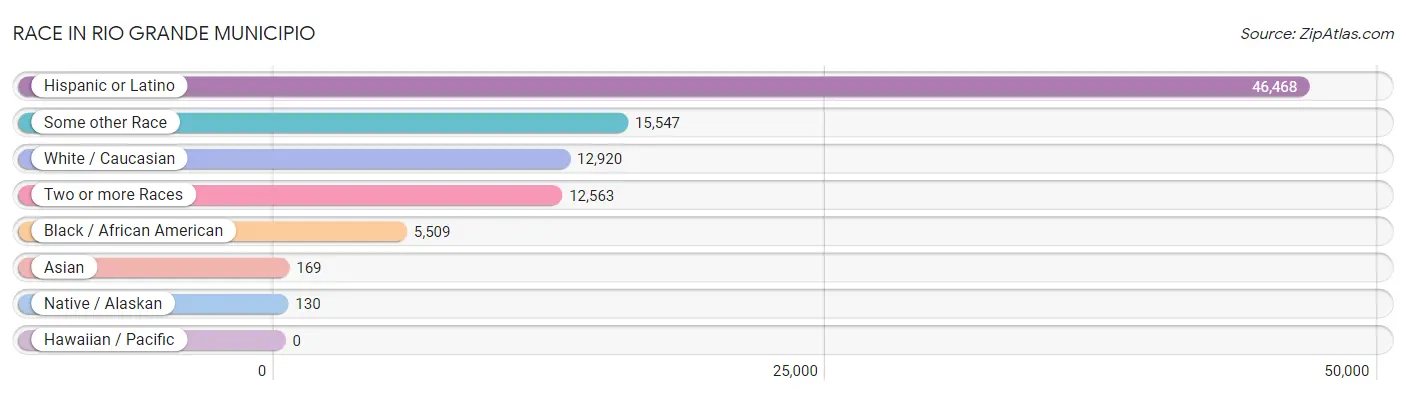
| Race | # Population | % Population |
| Asian | 169 | 0.4% |
| Black / African American | 5,509 | 11.8% |
| Hawaiian / Pacific | 0 | 0.0% |
| Hispanic or Latino | 46,468 | 99.2% |
| Native / Alaskan | 130 | 0.3% |
| White / Caucasian | 12,920 | 27.6% |
| Two or more Races | 12,563 | 26.8% |
| Some other Race | 15,547 | 33.2% |
| Total | 46,838 | 100.0% |
Ancestry in Rio Grande Municipio
The most populous ancestries reported in Rio Grande Municipio are Puerto Rican (45,321 | 96.8%), Dominican (632 | 1.3%), American (346 | 0.7%), Central American Indian (198 | 0.4%), and South American (139 | 0.3%), together accounting for 99.6% of all Rio Grande Municipio residents.
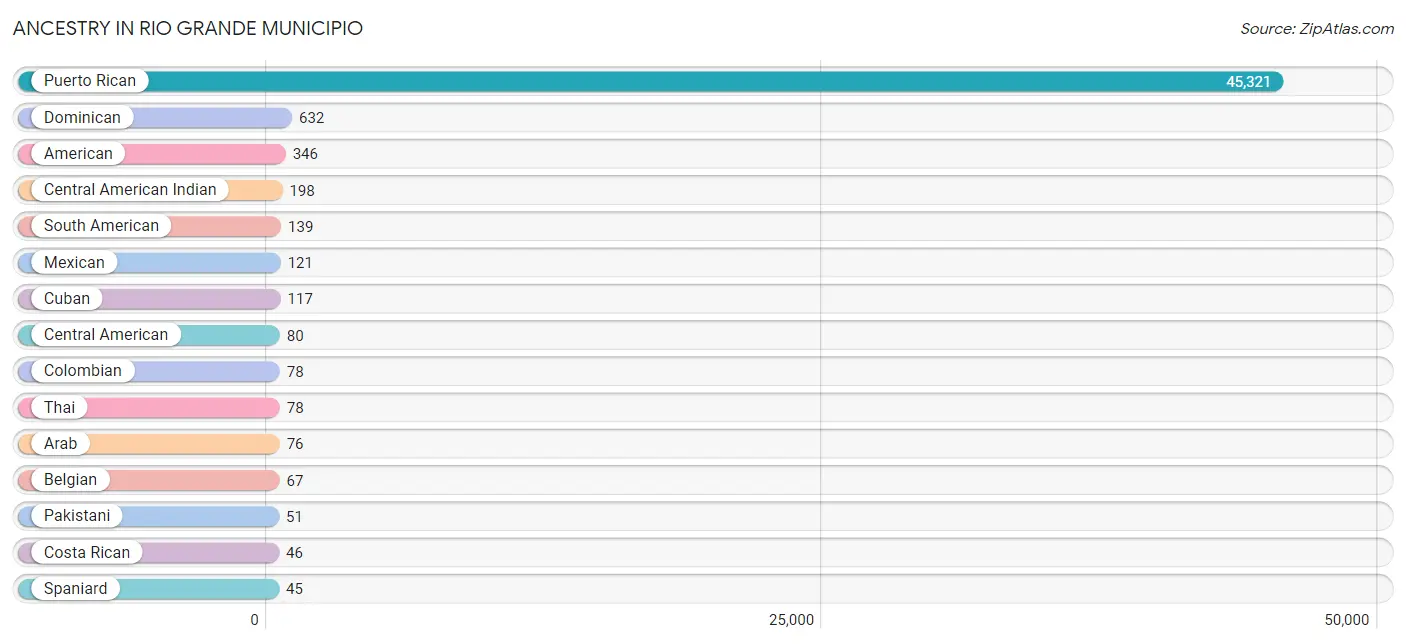
| Ancestry | # Population | % Population |
| American | 346 | 0.7% |
| Arab | 76 | 0.2% |
| Argentinean | 27 | 0.1% |
| Belgian | 67 | 0.1% |
| Brazilian | 9 | 0.0% |
| Burmese | 40 | 0.1% |
| Central American | 80 | 0.2% |
| Central American Indian | 198 | 0.4% |
| Colombian | 78 | 0.2% |
| Costa Rican | 46 | 0.1% |
| Cuban | 117 | 0.3% |
| Dominican | 632 | 1.3% |
| English | 26 | 0.1% |
| French | 21 | 0.0% |
| French Canadian | 3 | 0.0% |
| Italian | 14 | 0.0% |
| Mexican | 121 | 0.3% |
| Mexican American Indian | 13 | 0.0% |
| Pakistani | 51 | 0.1% |
| Polish | 15 | 0.0% |
| Puerto Rican | 45,321 | 96.8% |
| Russian | 15 | 0.0% |
| Salvadoran | 34 | 0.1% |
| South American | 139 | 0.3% |
| South American Indian | 18 | 0.0% |
| Spaniard | 45 | 0.1% |
| Thai | 78 | 0.2% |
| Venezuelan | 34 | 0.1% |
| West Indian | 12 | 0.0% | View All 29 Rows |
Immigrants in Rio Grande Municipio

| Immigration Origin | # Population | % Population | View All 0 Rows |
Sex and Age in Rio Grande Municipio
Sex and Age in Rio Grande Municipio
The most populous age groups in Rio Grande Municipio are 25 to 29 Years (1,788 | 8.0%) for men and 55 to 59 Years (1,983 | 8.1%) for women.
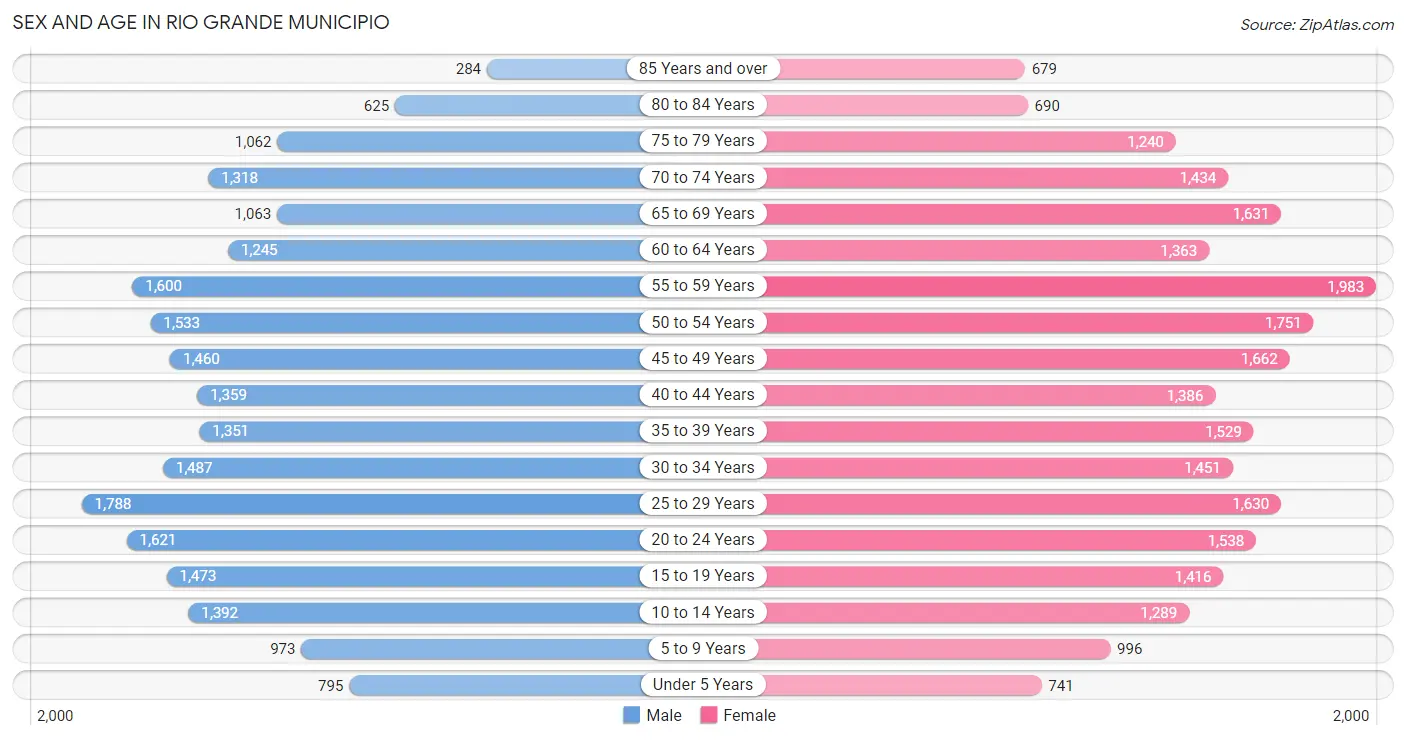
| Age Bracket | Male | Female |
| Under 5 Years | 795 (3.5%) | 741 (3.0%) |
| 5 to 9 Years | 973 (4.3%) | 996 (4.1%) |
| 10 to 14 Years | 1,392 (6.2%) | 1,289 (5.3%) |
| 15 to 19 Years | 1,473 (6.6%) | 1,416 (5.8%) |
| 20 to 24 Years | 1,621 (7.2%) | 1,538 (6.3%) |
| 25 to 29 Years | 1,788 (8.0%) | 1,630 (6.7%) |
| 30 to 34 Years | 1,487 (6.6%) | 1,451 (5.9%) |
| 35 to 39 Years | 1,351 (6.0%) | 1,529 (6.3%) |
| 40 to 44 Years | 1,359 (6.1%) | 1,386 (5.7%) |
| 45 to 49 Years | 1,460 (6.5%) | 1,662 (6.8%) |
| 50 to 54 Years | 1,533 (6.8%) | 1,751 (7.2%) |
| 55 to 59 Years | 1,600 (7.1%) | 1,983 (8.1%) |
| 60 to 64 Years | 1,245 (5.6%) | 1,363 (5.6%) |
| 65 to 69 Years | 1,063 (4.7%) | 1,631 (6.7%) |
| 70 to 74 Years | 1,318 (5.9%) | 1,434 (5.9%) |
| 75 to 79 Years | 1,062 (4.7%) | 1,240 (5.1%) |
| 80 to 84 Years | 625 (2.8%) | 690 (2.8%) |
| 85 Years and over | 284 (1.3%) | 679 (2.8%) |
| Total | 22,429 (100.0%) | 24,409 (100.0%) |
Families and Households in Rio Grande Municipio
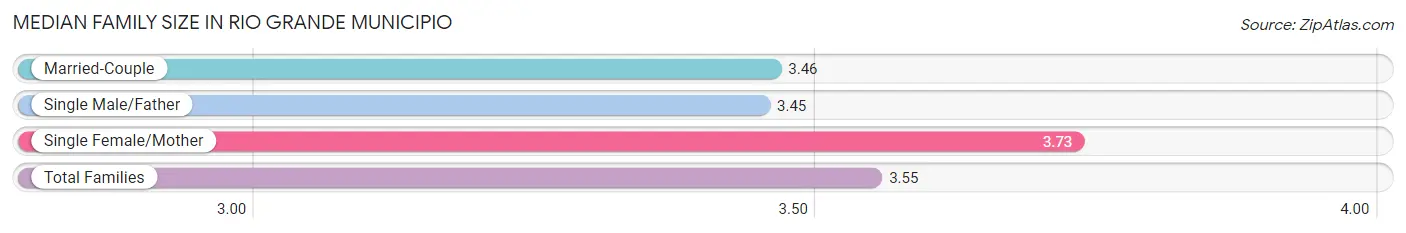
Median Family Size in Rio Grande Municipio
The median family size in Rio Grande Municipio is 3.55 persons per family, with single female/mother families (3,576 | 32.2%) accounting for the largest median family size of 3.73 persons per family. On the other hand, single male/father families (988 | 8.9%) represent the smallest median family size with 3.45 persons per family.
| Family Type | # Families | Family Size |
| Married-Couple | 6,556 (59.0%) | 3.46 |
| Single Male/Father | 988 (8.9%) | 3.45 |
| Single Female/Mother | 3,576 (32.2%) | 3.73 |
| Total Families | 11,120 (100.0%) | 3.55 |
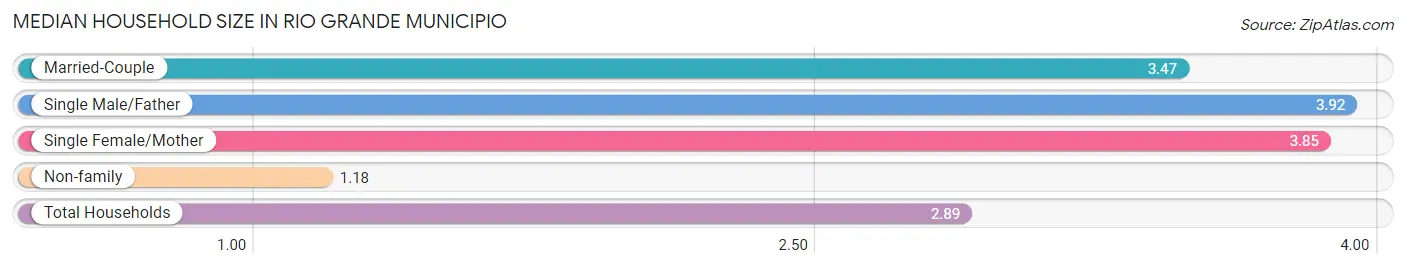
Median Household Size in Rio Grande Municipio
The median household size in Rio Grande Municipio is 2.89 persons per household, with single male/father households (988 | 6.2%) accounting for the largest median household size of 3.92 persons per household. non-family households (4,861 | 30.4%) represent the smallest median household size with 1.18 persons per household.
| Household Type | # Households | Household Size |
| Married-Couple | 6,556 (41.0%) | 3.47 |
| Single Male/Father | 988 (6.2%) | 3.92 |
| Single Female/Mother | 3,576 (22.4%) | 3.85 |
| Non-family | 4,861 (30.4%) | 1.18 |
| Total Households | 15,981 (100.0%) | 2.89 |
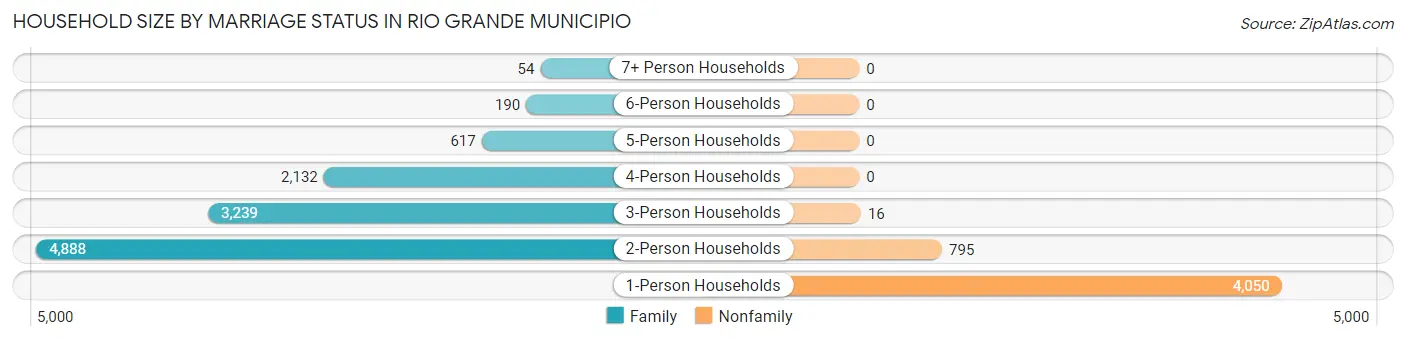
Household Size by Marriage Status in Rio Grande Municipio
Out of a total of 15,981 households in Rio Grande Municipio, 11,120 (69.6%) are family households, while 4,861 (30.4%) are nonfamily households. The most numerous type of family households are 2-person households, comprising 4,888, and the most common type of nonfamily households are 1-person households, comprising 4,050.
| Household Size | Family Households | Nonfamily Households |
| 1-Person Households | - | 4,050 (25.3%) |
| 2-Person Households | 4,888 (30.6%) | 795 (5.0%) |
| 3-Person Households | 3,239 (20.3%) | 16 (0.1%) |
| 4-Person Households | 2,132 (13.3%) | 0 (0.0%) |
| 5-Person Households | 617 (3.9%) | 0 (0.0%) |
| 6-Person Households | 190 (1.2%) | 0 (0.0%) |
| 7+ Person Households | 54 (0.3%) | 0 (0.0%) |
| Total | 11,120 (69.6%) | 4,861 (30.4%) |
Female Fertility in Rio Grande Municipio
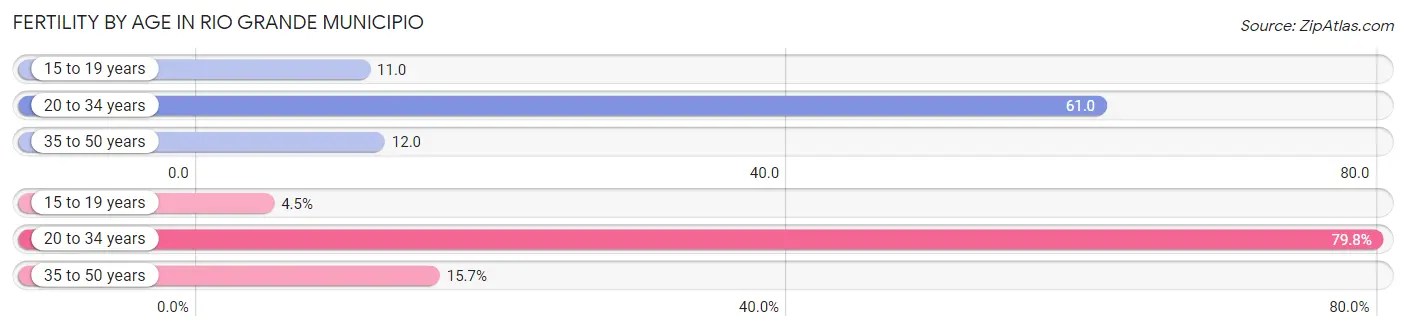
Fertility by Age in Rio Grande Municipio
Average fertility rate in Rio Grande Municipio is 33.0 births per 1,000 women. Women in the age bracket of 20 to 34 years have the highest fertility rate with 61.0 births per 1,000 women. Women in the age bracket of 20 to 34 years acount for 79.8% of all women with births.
| Age Bracket | Women with Births | Births / 1,000 Women |
| 15 to 19 years | 16 (4.5%) | 11.0 |
| 20 to 34 years | 284 (79.8%) | 61.0 |
| 35 to 50 years | 56 (15.7%) | 12.0 |
| Total | 356 (100.0%) | 33.0 |
Fertility by Age by Marriage Status in Rio Grande Municipio
40.4% of women with births (356) in Rio Grande Municipio are married. The highest percentage of unmarried women with births falls into 15 to 19 years age bracket with 100.0% of them unmarried at the time of birth, while the lowest percentage of unmarried women with births belong to 35 to 50 years age bracket with 53.6% of them unmarried.
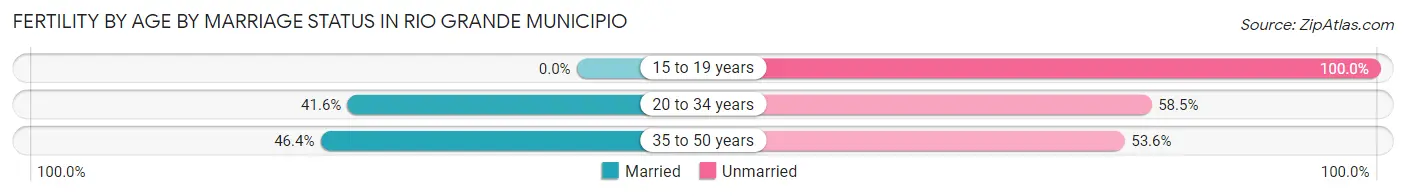
| Age Bracket | Married | Unmarried |
| 15 to 19 years | 0 (0.0%) | 16 (100.0%) |
| 20 to 34 years | 118 (41.5%) | 166 (58.5%) |
| 35 to 50 years | 26 (46.4%) | 30 (53.6%) |
| Total | 144 (40.5%) | 212 (59.6%) |
Fertility by Education in Rio Grande Municipio
Average fertility rate in Rio Grande Municipio is 33.0 births per 1,000 women. Women with the education attainment of high school diploma have the highest fertility rate of 69.0 births per 1,000 women, while women with the education attainment of less than high school have the lowest fertility at 10.0 births per 1,000 women. Women with the education attainment of high school diploma represent 43.0% of all women with births.
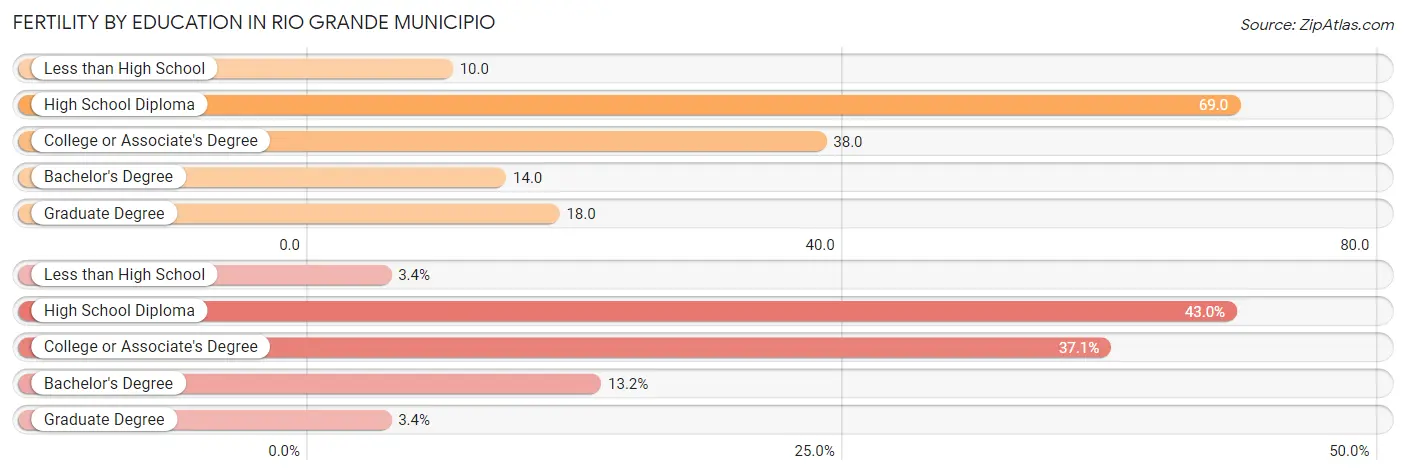
| Educational Attainment | Women with Births | Births / 1,000 Women |
| Less than High School | 12 (3.4%) | 10.0 |
| High School Diploma | 153 (43.0%) | 69.0 |
| College or Associate's Degree | 132 (37.1%) | 38.0 |
| Bachelor's Degree | 47 (13.2%) | 14.0 |
| Graduate Degree | 12 (3.4%) | 18.0 |
| Total | 356 (100.0%) | 33.0 |
Fertility by Education by Marriage Status in Rio Grande Municipio
59.6% of women with births in Rio Grande Municipio are unmarried. Women with the educational attainment of bachelor's degree are most likely to be married with 100.0% of them married at childbirth, while women with the educational attainment of less than high school are least likely to be married with 100.0% of them unmarried at childbirth.
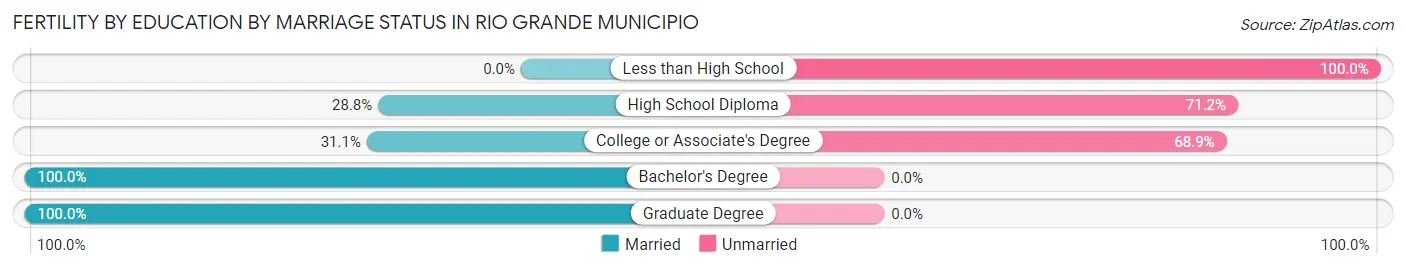
| Educational Attainment | Married | Unmarried |
| Less than High School | 0 (0.0%) | 12 (100.0%) |
| High School Diploma | 44 (28.8%) | 109 (71.2%) |
| College or Associate's Degree | 41 (31.1%) | 91 (68.9%) |
| Bachelor's Degree | 47 (100.0%) | 0 (0.0%) |
| Graduate Degree | 12 (100.0%) | 0 (0.0%) |
| Total | 144 (40.5%) | 212 (59.6%) |
Employment Characteristics in Rio Grande Municipio
Employment by Class of Employer in Rio Grande Municipio
Among the 15,959 employed individuals in Rio Grande Municipio, private company employees (9,828 | 61.6%), self-employed (not incorporated) (2,239 | 14.0%), and state government employees (1,820 | 11.4%) make up the most common classes of employment.
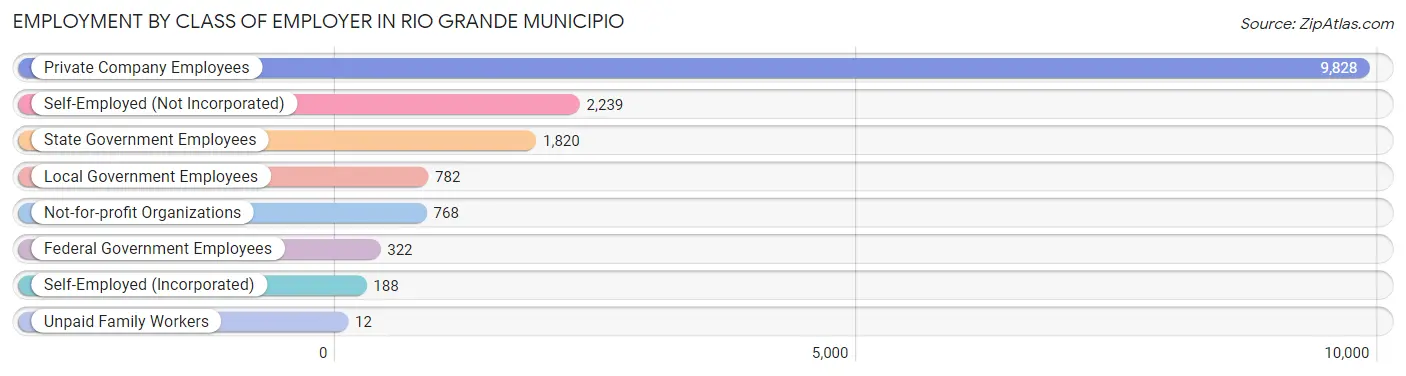
| Employer Class | # Employees | % Employees |
| Private Company Employees | 9,828 | 61.6% |
| Self-Employed (Incorporated) | 188 | 1.2% |
| Self-Employed (Not Incorporated) | 2,239 | 14.0% |
| Not-for-profit Organizations | 768 | 4.8% |
| Local Government Employees | 782 | 4.9% |
| State Government Employees | 1,820 | 11.4% |
| Federal Government Employees | 322 | 2.0% |
| Unpaid Family Workers | 12 | 0.1% |
| Total | 15,959 | 100.0% |
Employment Status by Age in Rio Grande Municipio
According to the labor force statistics for Rio Grande Municipio, out of the total population over 16 years of age (40,194), 52.3% or 21,021 individuals are in the labor force, with 17.6% or 3,700 of them unemployed. The age group with the highest labor force participation rate is 30 to 34 years, with 82.4% or 2,421 individuals in the labor force. Within the labor force, the 16 to 19 years age range has the highest percentage of unemployed individuals, with 45.5% or 306 of them being unemployed.
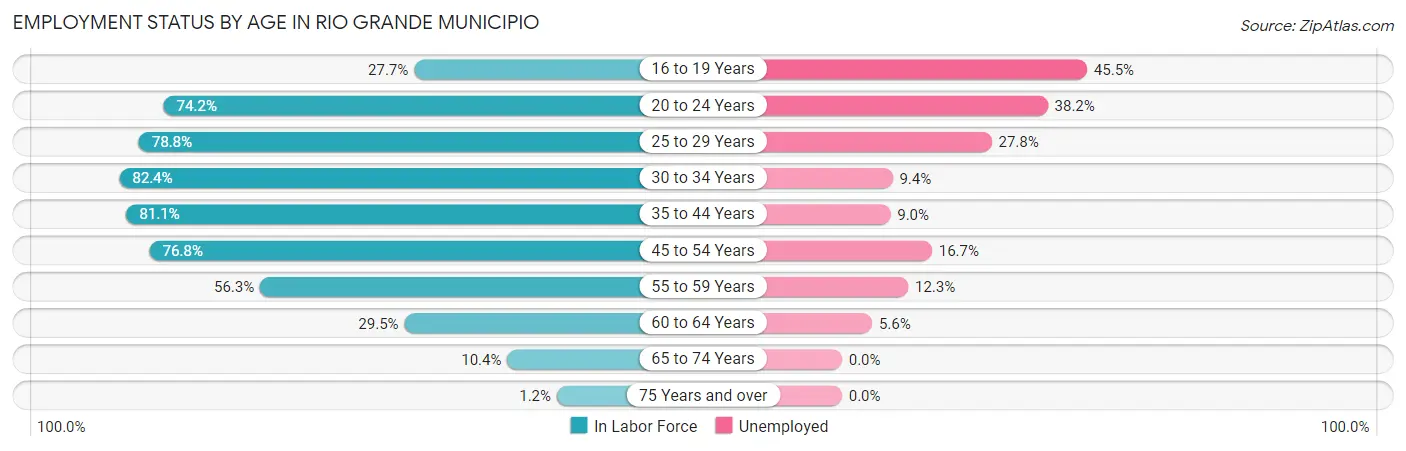
| Age Bracket | In Labor Force | Unemployed |
| 16 to 19 Years | 673 (27.7%) | 306 (45.5%) |
| 20 to 24 Years | 2,344 (74.2%) | 895 (38.2%) |
| 25 to 29 Years | 2,693 (78.8%) | 749 (27.8%) |
| 30 to 34 Years | 2,421 (82.4%) | 228 (9.4%) |
| 35 to 44 Years | 4,562 (81.1%) | 411 (9.0%) |
| 45 to 54 Years | 4,920 (76.8%) | 822 (16.7%) |
| 55 to 59 Years | 2,017 (56.3%) | 248 (12.3%) |
| 60 to 64 Years | 769 (29.5%) | 43 (5.6%) |
| 65 to 74 Years | 566 (10.4%) | 0 (0.0%) |
| 75 Years and over | 55 (1.2%) | 0 (0.0%) |
| Total | 21,021 (52.3%) | 3,700 (17.6%) |
Employment Status by Educational Attainment in Rio Grande Municipio
According to labor force statistics for Rio Grande Municipio, 70.7% of individuals (17,377) out of the total population between 25 and 64 years of age (24,578) are in the labor force, with 14.4% or 2,502 of them being unemployed. The group with the highest labor force participation rate are those with the educational attainment of bachelor's degree or higher, with 85.8% or 6,538 individuals in the labor force. Within the labor force, individuals with less than high school education have the highest percentage of unemployment, with 31.8% or 352 of them being unemployed.
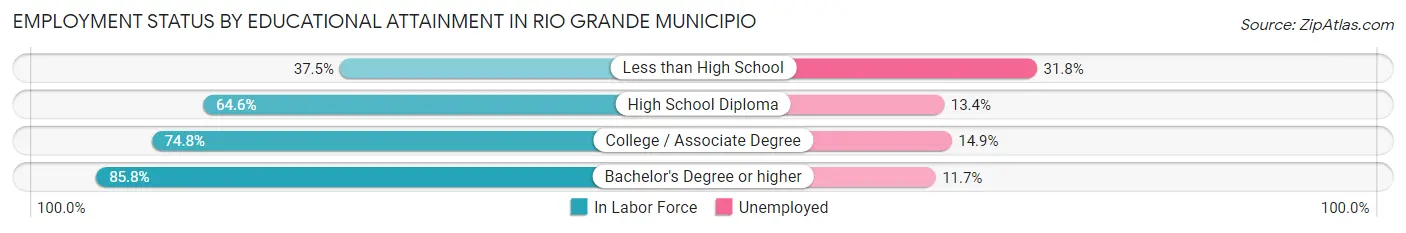
| Educational Attainment | In Labor Force | Unemployed |
| Less than High School | 1,106 (37.5%) | 937 (31.8%) |
| High School Diploma | 4,678 (64.6%) | 970 (13.4%) |
| College / Associate Degree | 5,063 (74.8%) | 1,009 (14.9%) |
| Bachelor's Degree or higher | 6,538 (85.8%) | 892 (11.7%) |
| Total | 17,377 (70.7%) | 3,539 (14.4%) |
Employment Occupations by Sex in Rio Grande Municipio
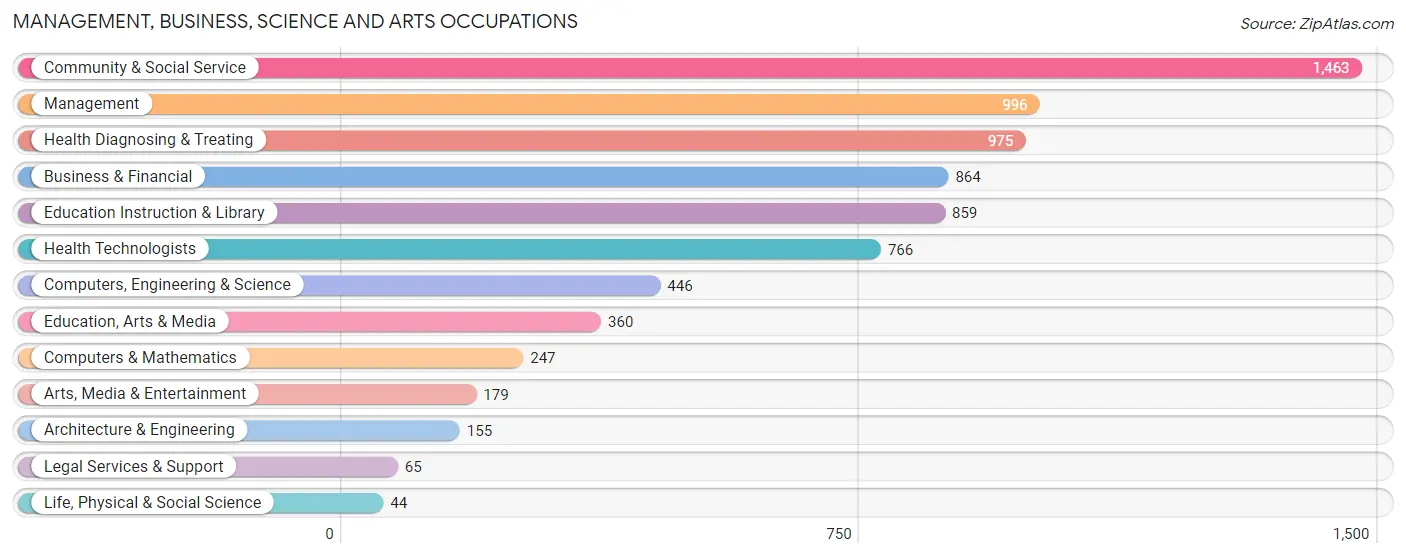
Management, Business, Science and Arts Occupations
The most common Management, Business, Science and Arts occupations in Rio Grande Municipio are Community & Social Service (1,463 | 8.4%), Management (996 | 5.8%), Health Diagnosing & Treating (975 | 5.6%), Business & Financial (864 | 5.0%), and Education Instruction & Library (859 | 5.0%).
Management, Business, Science and Arts Occupations by Sex
Within the Management, Business, Science and Arts occupations in Rio Grande Municipio, the most male-oriented occupations are Architecture & Engineering (90.3%), Computers, Engineering & Science (85.0%), and Computers & Mathematics (83.4%), while the most female-oriented occupations are Legal Services & Support (100.0%), Education Instruction & Library (89.2%), and Arts, Media & Entertainment (84.9%).
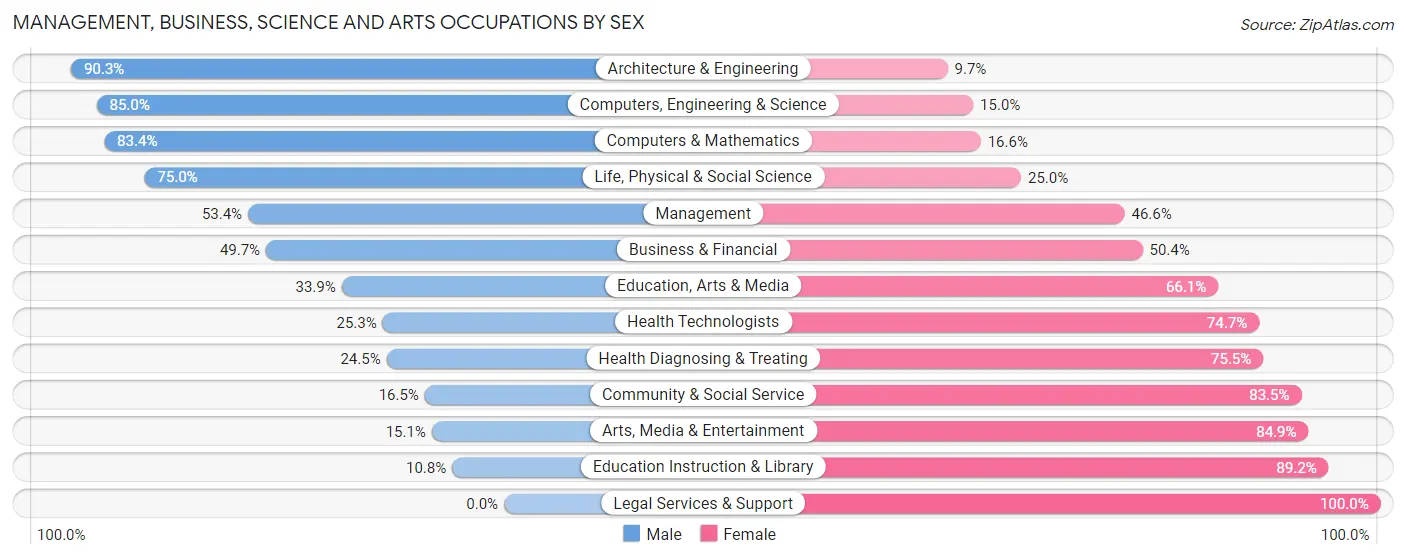
| Occupation | Male | Female |
| Management | 532 (53.4%) | 464 (46.6%) |
| Business & Financial | 429 (49.6%) | 435 (50.3%) |
| Computers, Engineering & Science | 379 (85.0%) | 67 (15.0%) |
| Computers & Mathematics | 206 (83.4%) | 41 (16.6%) |
| Architecture & Engineering | 140 (90.3%) | 15 (9.7%) |
| Life, Physical & Social Science | 33 (75.0%) | 11 (25.0%) |
| Community & Social Service | 242 (16.5%) | 1,221 (83.5%) |
| Education, Arts & Media | 122 (33.9%) | 238 (66.1%) |
| Legal Services & Support | 0 (0.0%) | 65 (100.0%) |
| Education Instruction & Library | 93 (10.8%) | 766 (89.2%) |
| Arts, Media & Entertainment | 27 (15.1%) | 152 (84.9%) |
| Health Diagnosing & Treating | 239 (24.5%) | 736 (75.5%) |
| Health Technologists | 194 (25.3%) | 572 (74.7%) |
| Total (Category) | 1,821 (38.4%) | 2,923 (61.6%) |
| Total (Overall) | 9,104 (52.5%) | 8,223 (47.5%) |
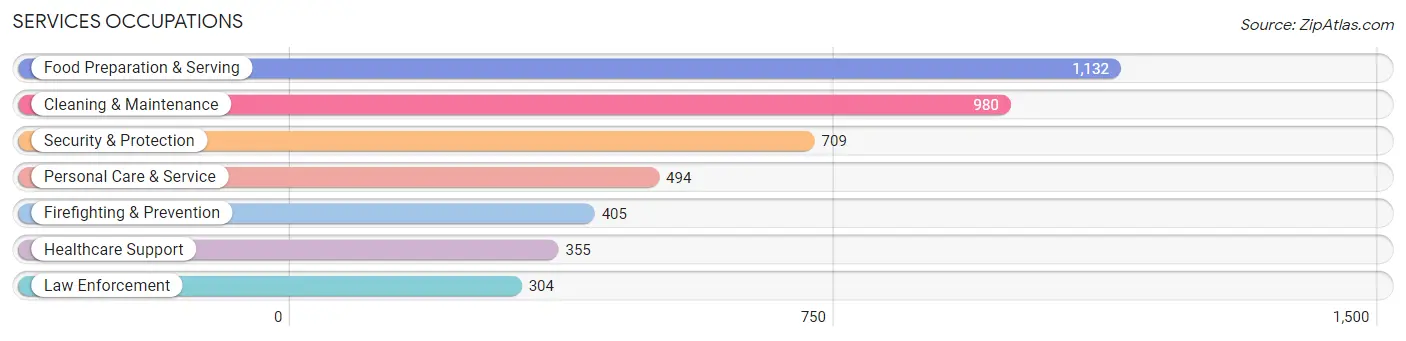
Services Occupations
The most common Services occupations in Rio Grande Municipio are Food Preparation & Serving (1,132 | 6.5%), Cleaning & Maintenance (980 | 5.7%), Security & Protection (709 | 4.1%), Personal Care & Service (494 | 2.9%), and Firefighting & Prevention (405 | 2.3%).
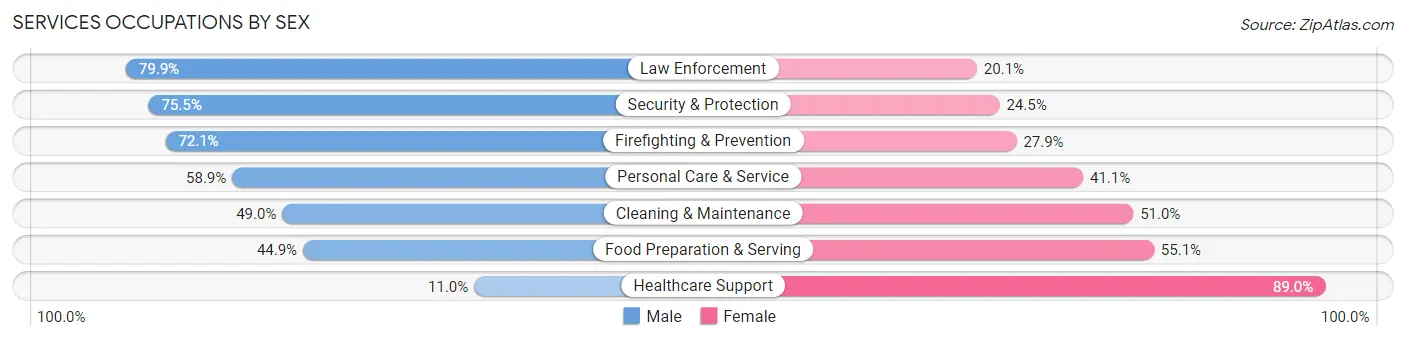
Services Occupations by Sex
Within the Services occupations in Rio Grande Municipio, the most male-oriented occupations are Law Enforcement (79.9%), Security & Protection (75.5%), and Firefighting & Prevention (72.1%), while the most female-oriented occupations are Healthcare Support (89.0%), Food Preparation & Serving (55.1%), and Cleaning & Maintenance (51.0%).
| Occupation | Male | Female |
| Healthcare Support | 39 (11.0%) | 316 (89.0%) |
| Security & Protection | 535 (75.5%) | 174 (24.5%) |
| Firefighting & Prevention | 292 (72.1%) | 113 (27.9%) |
| Law Enforcement | 243 (79.9%) | 61 (20.1%) |
| Food Preparation & Serving | 508 (44.9%) | 624 (55.1%) |
| Cleaning & Maintenance | 480 (49.0%) | 500 (51.0%) |
| Personal Care & Service | 291 (58.9%) | 203 (41.1%) |
| Total (Category) | 1,853 (50.5%) | 1,817 (49.5%) |
| Total (Overall) | 9,104 (52.5%) | 8,223 (47.5%) |
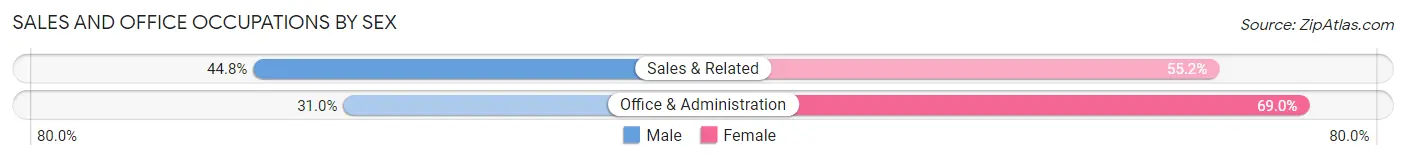
Sales and Office Occupations
The most common Sales and Office occupations in Rio Grande Municipio are Office & Administration (2,573 | 14.8%), and Sales & Related (2,353 | 13.6%).

Sales and Office Occupations by Sex
| Occupation | Male | Female |
| Sales & Related | 1,055 (44.8%) | 1,298 (55.2%) |
| Office & Administration | 797 (31.0%) | 1,776 (69.0%) |
| Total (Category) | 1,852 (37.6%) | 3,074 (62.4%) |
| Total (Overall) | 9,104 (52.5%) | 8,223 (47.5%) |
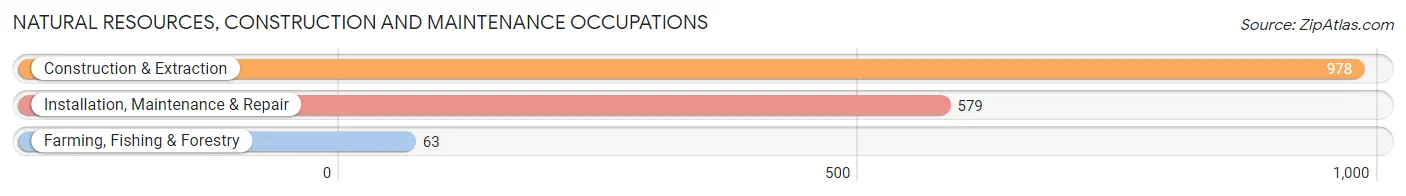
Natural Resources, Construction and Maintenance Occupations
The most common Natural Resources, Construction and Maintenance occupations in Rio Grande Municipio are Construction & Extraction (978 | 5.6%), Installation, Maintenance & Repair (579 | 3.3%), and Farming, Fishing & Forestry (63 | 0.4%).
Natural Resources, Construction and Maintenance Occupations by Sex
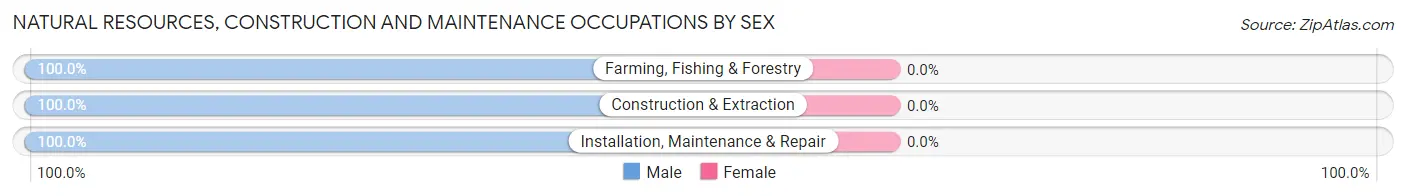
| Occupation | Male | Female |
| Farming, Fishing & Forestry | 63 (100.0%) | 0 (0.0%) |
| Construction & Extraction | 978 (100.0%) | 0 (0.0%) |
| Installation, Maintenance & Repair | 579 (100.0%) | 0 (0.0%) |
| Total (Category) | 1,620 (100.0%) | 0 (0.0%) |
| Total (Overall) | 9,104 (52.5%) | 8,223 (47.5%) |
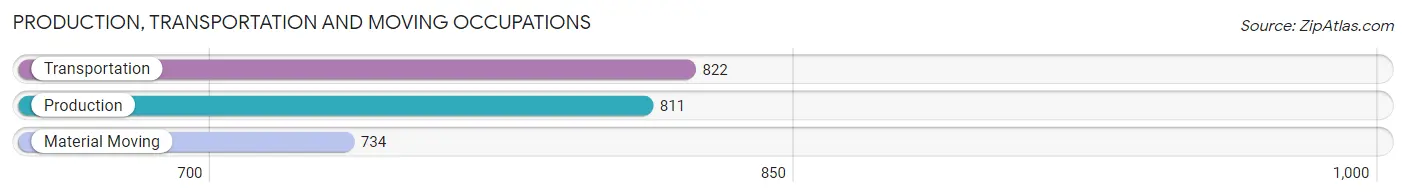
Production, Transportation and Moving Occupations
The most common Production, Transportation and Moving occupations in Rio Grande Municipio are Transportation (822 | 4.7%), Production (811 | 4.7%), and Material Moving (734 | 4.2%).
Production, Transportation and Moving Occupations by Sex
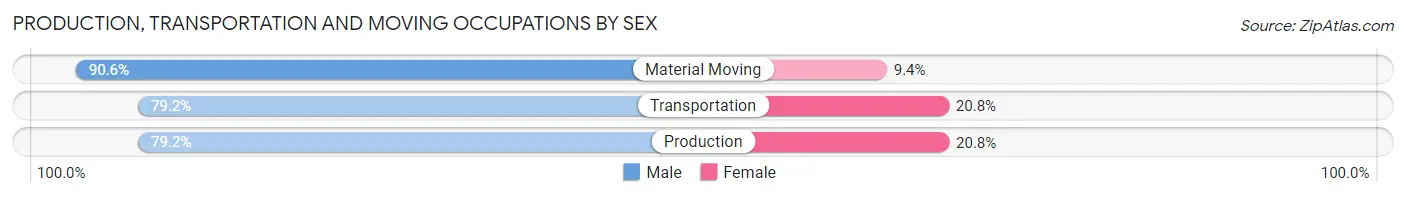
| Occupation | Male | Female |
| Production | 642 (79.2%) | 169 (20.8%) |
| Transportation | 651 (79.2%) | 171 (20.8%) |
| Material Moving | 665 (90.6%) | 69 (9.4%) |
| Total (Category) | 1,958 (82.7%) | 409 (17.3%) |
| Total (Overall) | 9,104 (52.5%) | 8,223 (47.5%) |
Employment Industries by Sex in Rio Grande Municipio
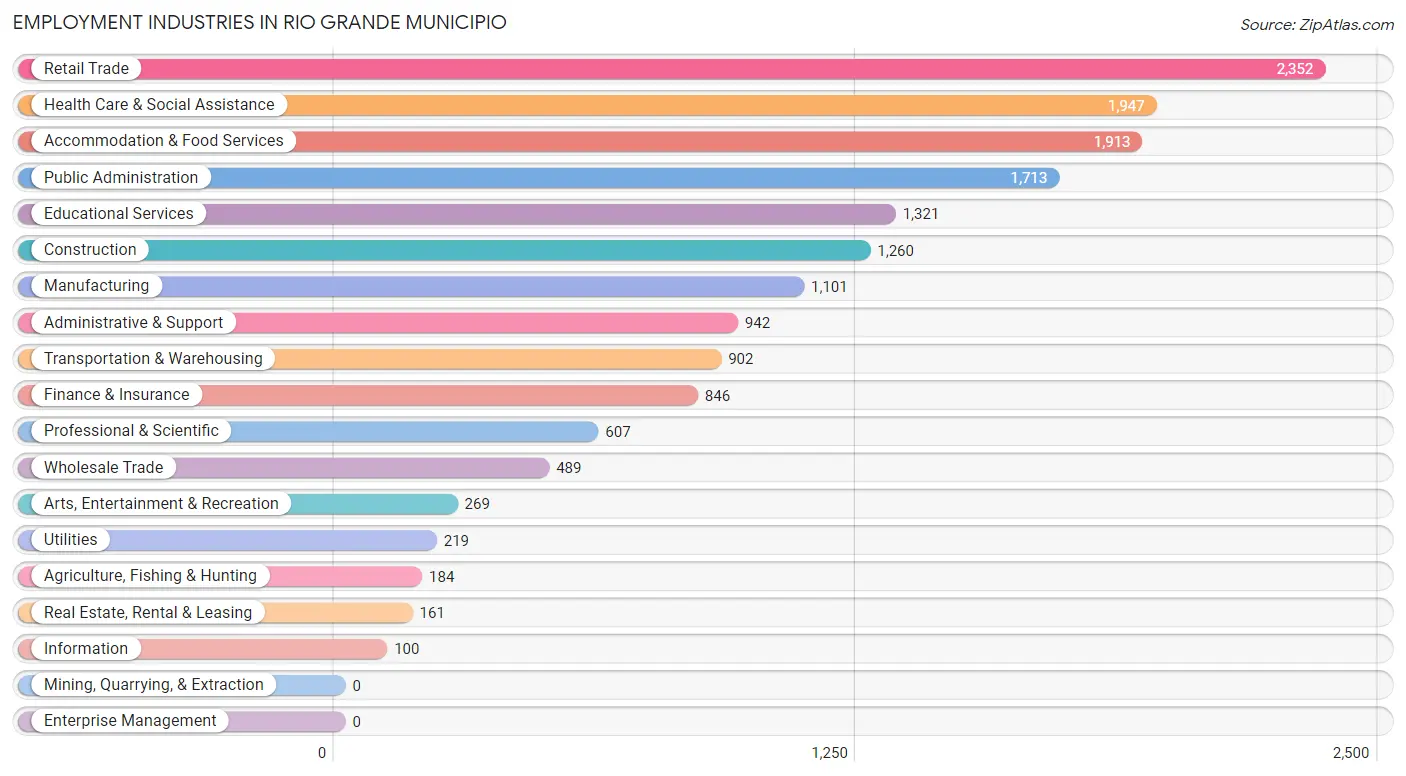
Employment Industries in Rio Grande Municipio
The major employment industries in Rio Grande Municipio include Retail Trade (2,352 | 13.6%), Health Care & Social Assistance (1,947 | 11.2%), Accommodation & Food Services (1,913 | 11.0%), Public Administration (1,713 | 9.9%), and Educational Services (1,321 | 7.6%).
Employment Industries by Sex in Rio Grande Municipio
The Rio Grande Municipio industries that see more men than women are Agriculture, Fishing & Hunting (100.0%), Utilities (100.0%), and Information (100.0%), whereas the industries that tend to have a higher number of women are Educational Services (80.1%), Real Estate, Rental & Leasing (75.2%), and Health Care & Social Assistance (74.8%).
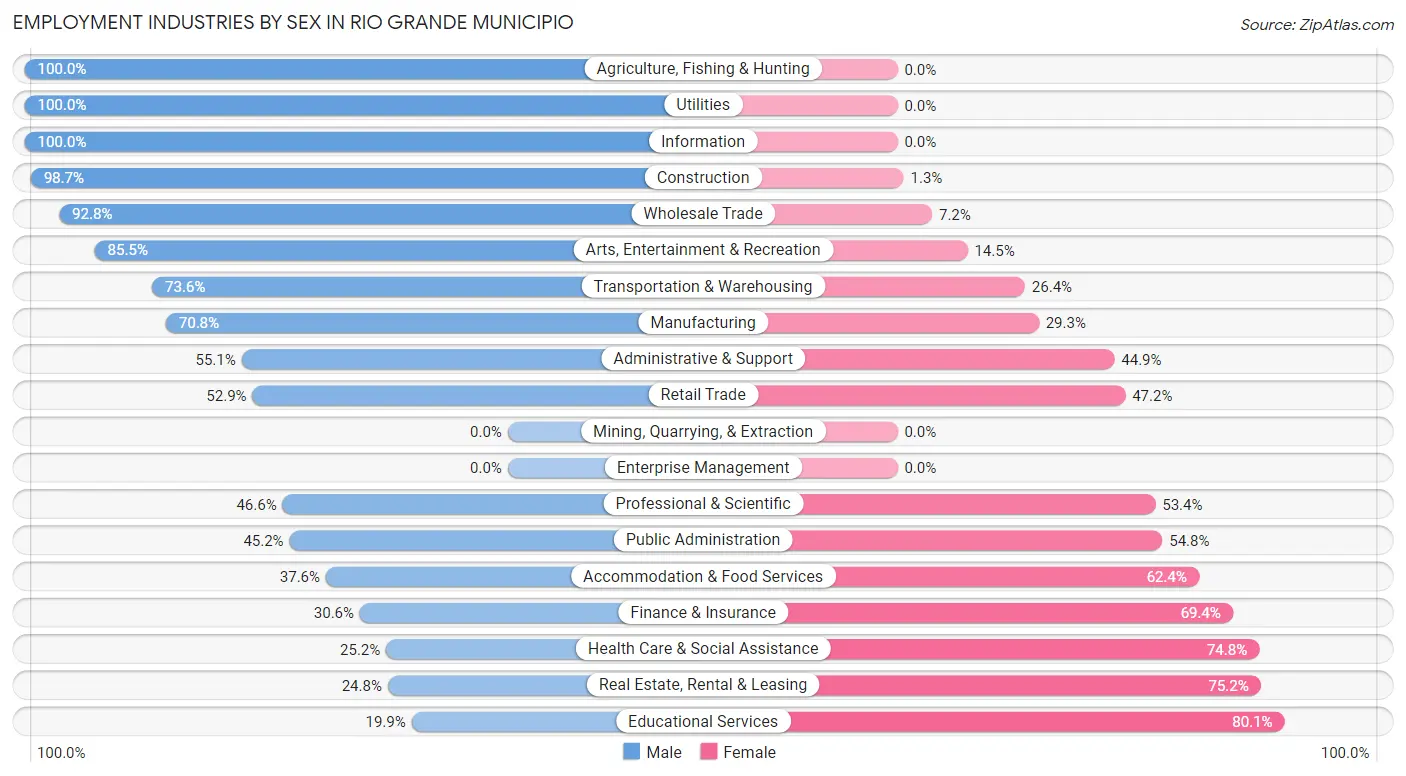
| Industry | Male | Female |
| Agriculture, Fishing & Hunting | 184 (100.0%) | 0 (0.0%) |
| Mining, Quarrying, & Extraction | 0 (0.0%) | 0 (0.0%) |
| Construction | 1,244 (98.7%) | 16 (1.3%) |
| Manufacturing | 779 (70.8%) | 322 (29.2%) |
| Wholesale Trade | 454 (92.8%) | 35 (7.2%) |
| Retail Trade | 1,243 (52.8%) | 1,109 (47.1%) |
| Transportation & Warehousing | 664 (73.6%) | 238 (26.4%) |
| Utilities | 219 (100.0%) | 0 (0.0%) |
| Information | 100 (100.0%) | 0 (0.0%) |
| Finance & Insurance | 259 (30.6%) | 587 (69.4%) |
| Real Estate, Rental & Leasing | 40 (24.8%) | 121 (75.2%) |
| Professional & Scientific | 283 (46.6%) | 324 (53.4%) |
| Enterprise Management | 0 (0.0%) | 0 (0.0%) |
| Administrative & Support | 519 (55.1%) | 423 (44.9%) |
| Educational Services | 263 (19.9%) | 1,058 (80.1%) |
| Health Care & Social Assistance | 490 (25.2%) | 1,457 (74.8%) |
| Arts, Entertainment & Recreation | 230 (85.5%) | 39 (14.5%) |
| Accommodation & Food Services | 720 (37.6%) | 1,193 (62.4%) |
| Public Administration | 774 (45.2%) | 939 (54.8%) |
| Total | 9,104 (52.5%) | 8,223 (47.5%) |
Education in Rio Grande Municipio
School Enrollment in Rio Grande Municipio
The most common levels of schooling among the 9,731 students in Rio Grande Municipio are high school (2,372 | 24.4%), college / undergraduate (2,348 | 24.1%), and middle school (2,031 | 20.9%).
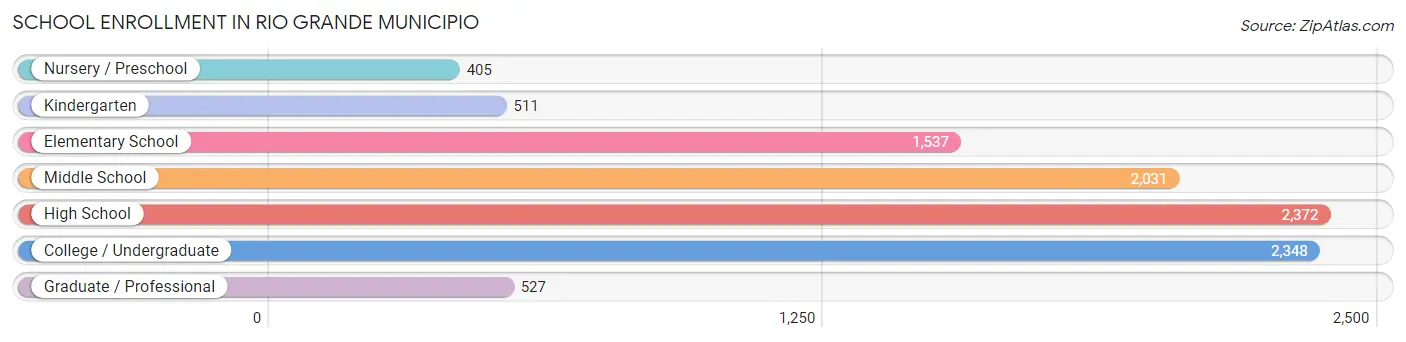
| School Level | # Students | % Students |
| Nursery / Preschool | 405 | 4.2% |
| Kindergarten | 511 | 5.2% |
| Elementary School | 1,537 | 15.8% |
| Middle School | 2,031 | 20.9% |
| High School | 2,372 | 24.4% |
| College / Undergraduate | 2,348 | 24.1% |
| Graduate / Professional | 527 | 5.4% |
| Total | 9,731 | 100.0% |
School Enrollment by Age by Funding Source in Rio Grande Municipio
Out of a total of 9,731 students who are enrolled in schools in Rio Grande Municipio, 4,359 (44.8%) attend a private institution, while the remaining 5,372 (55.2%) are enrolled in public schools. The age group of 25 to 34 year olds has the highest likelihood of being enrolled in private schools, with 485 (78.9% in the age bracket) enrolled. Conversely, the age group of 10 to 14 year olds has the lowest likelihood of being enrolled in a private school, with 1,820 (68.4% in the age bracket) attending a public institution.
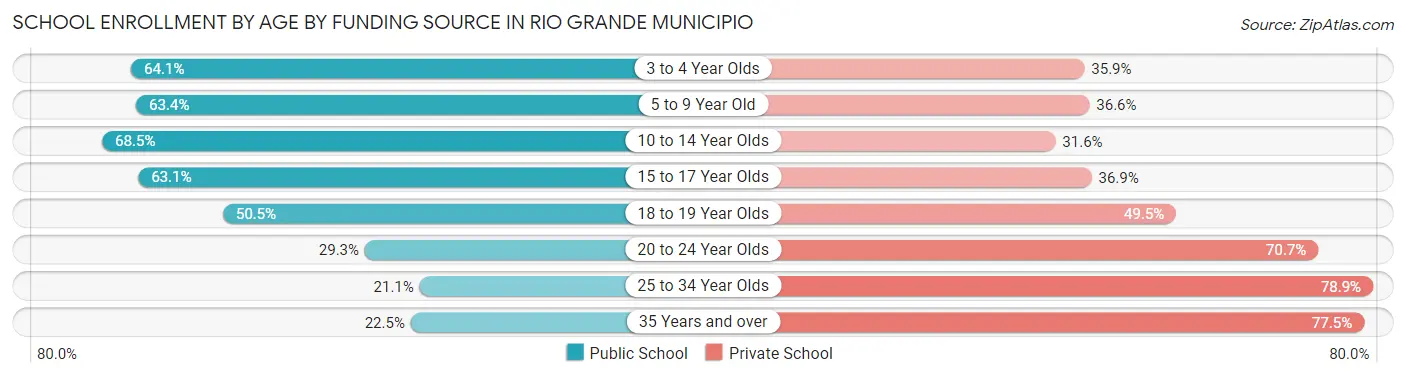
| Age Bracket | Public School | Private School |
| 3 to 4 Year Olds | 236 (64.1%) | 132 (35.9%) |
| 5 to 9 Year Old | 1,238 (63.4%) | 715 (36.6%) |
| 10 to 14 Year Olds | 1,820 (68.4%) | 839 (31.6%) |
| 15 to 17 Year Olds | 1,038 (63.1%) | 608 (36.9%) |
| 18 to 19 Year Olds | 492 (50.5%) | 483 (49.5%) |
| 20 to 24 Year Olds | 346 (29.3%) | 835 (70.7%) |
| 25 to 34 Year Olds | 130 (21.1%) | 485 (78.9%) |
| 35 Years and over | 75 (22.5%) | 259 (77.5%) |
| Total | 5,372 (55.2%) | 4,359 (44.8%) |
Educational Attainment by Field of Study in Rio Grande Municipio
Business (2,743 | 30.5%), education (1,659 | 18.4%), science & technology (1,508 | 16.8%), arts & humanities (1,048 | 11.7%), and computers & mathematics (464 | 5.2%) are the most common fields of study among 8,995 individuals in Rio Grande Municipio who have obtained a bachelor's degree or higher.
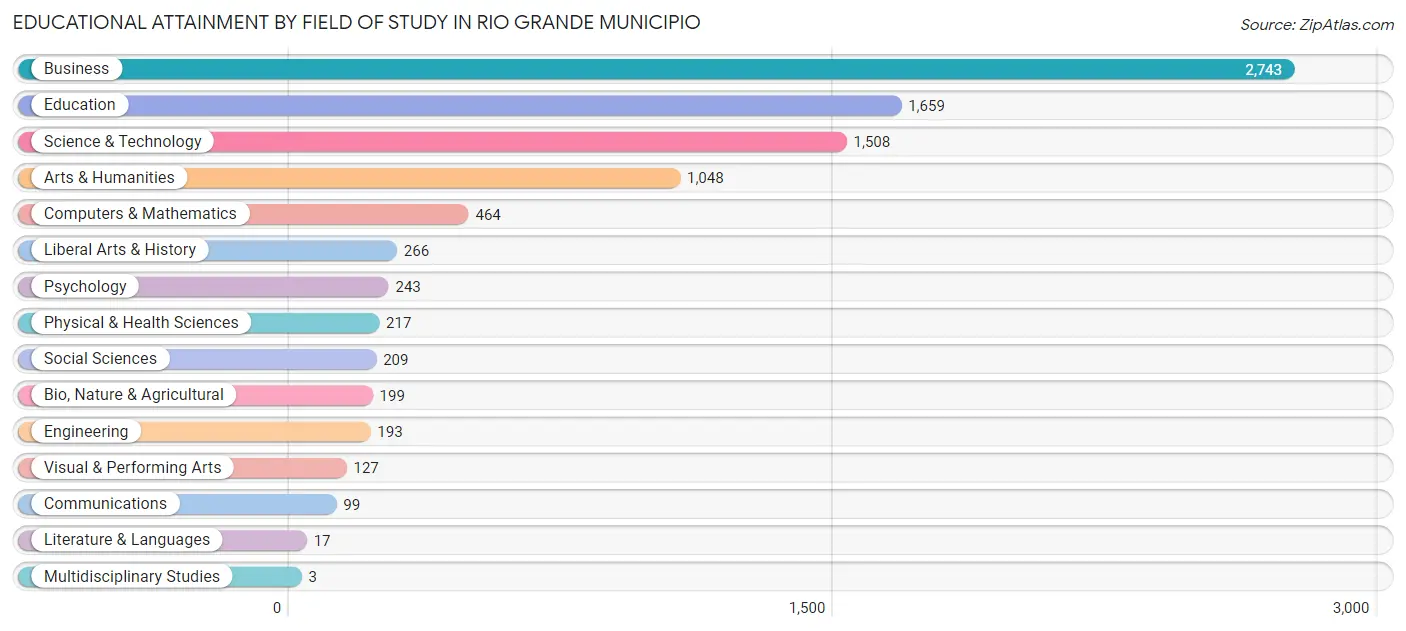
| Field of Study | # Graduates | % Graduates |
| Computers & Mathematics | 464 | 5.2% |
| Bio, Nature & Agricultural | 199 | 2.2% |
| Physical & Health Sciences | 217 | 2.4% |
| Psychology | 243 | 2.7% |
| Social Sciences | 209 | 2.3% |
| Engineering | 193 | 2.1% |
| Multidisciplinary Studies | 3 | 0.0% |
| Science & Technology | 1,508 | 16.8% |
| Business | 2,743 | 30.5% |
| Education | 1,659 | 18.4% |
| Literature & Languages | 17 | 0.2% |
| Liberal Arts & History | 266 | 3.0% |
| Visual & Performing Arts | 127 | 1.4% |
| Communications | 99 | 1.1% |
| Arts & Humanities | 1,048 | 11.7% |
| Total | 8,995 | 100.0% |
Transportation & Commute in Rio Grande Municipio
Vehicle Availability by Sex in Rio Grande Municipio
The most prevalent vehicle ownership categories in Rio Grande Municipio are males with 2 vehicles (3,528, accounting for 41.7%) and females with 2 vehicles (3,193, making up 47.3%).
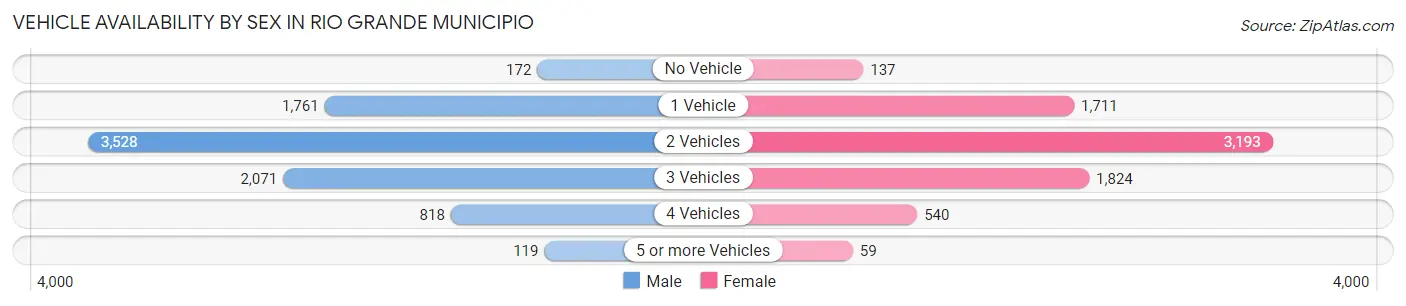
| Vehicles Available | Male | Female |
| No Vehicle | 172 (2.0%) | 137 (1.8%) |
| 1 Vehicle | 1,761 (20.8%) | 1,711 (22.9%) |
| 2 Vehicles | 3,528 (41.7%) | 3,193 (42.8%) |
| 3 Vehicles | 2,071 (24.4%) | 1,824 (24.4%) |
| 4 Vehicles | 818 (9.7%) | 540 (7.2%) |
| 5 or more Vehicles | 119 (1.4%) | 59 (0.8%) |
| Total | 8,469 (100.0%) | 7,464 (100.0%) |
Commute Time in Rio Grande Municipio
The most frequently occuring commute durations in Rio Grande Municipio are 60 to 89 minutes (2,920 commuters, 19.7%), 30 to 34 minutes (2,182 commuters, 14.7%), and 45 to 59 minutes (1,730 commuters, 11.6%).
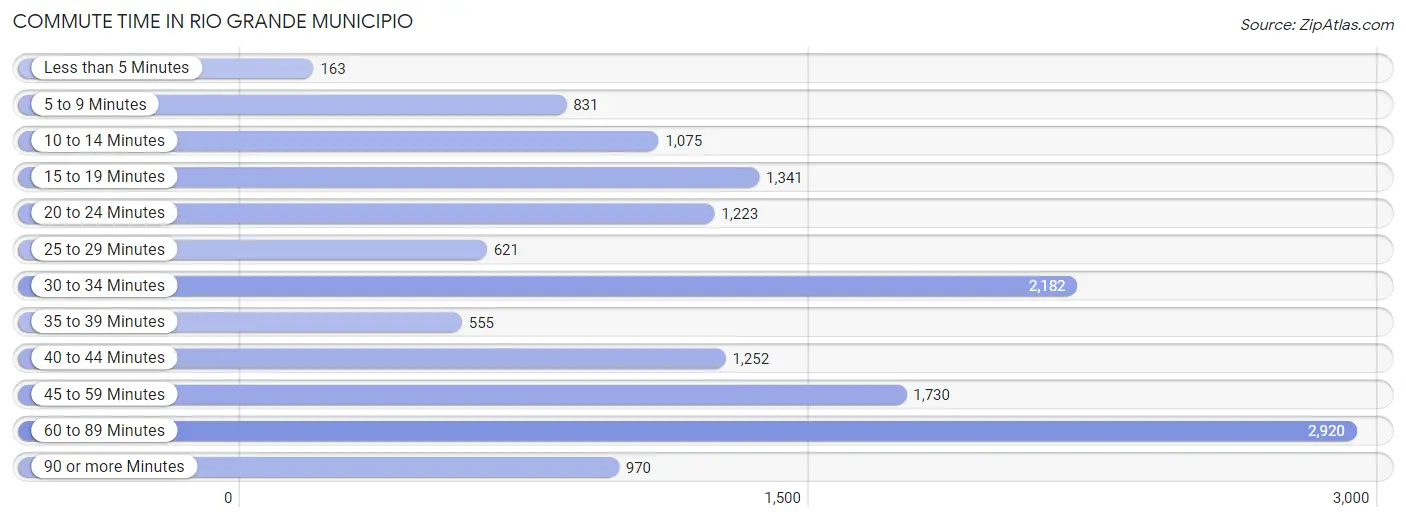
| Commute Time | # Commuters | % Commuters |
| Less than 5 Minutes | 163 | 1.1% |
| 5 to 9 Minutes | 831 | 5.6% |
| 10 to 14 Minutes | 1,075 | 7.2% |
| 15 to 19 Minutes | 1,341 | 9.0% |
| 20 to 24 Minutes | 1,223 | 8.2% |
| 25 to 29 Minutes | 621 | 4.2% |
| 30 to 34 Minutes | 2,182 | 14.7% |
| 35 to 39 Minutes | 555 | 3.7% |
| 40 to 44 Minutes | 1,252 | 8.4% |
| 45 to 59 Minutes | 1,730 | 11.6% |
| 60 to 89 Minutes | 2,920 | 19.7% |
| 90 or more Minutes | 970 | 6.5% |
Commute Time by Sex in Rio Grande Municipio
The most common commute times in Rio Grande Municipio are 60 to 89 minutes (1,651 commuters, 20.5%) for males and 60 to 89 minutes (1,269 commuters, 18.6%) for females.
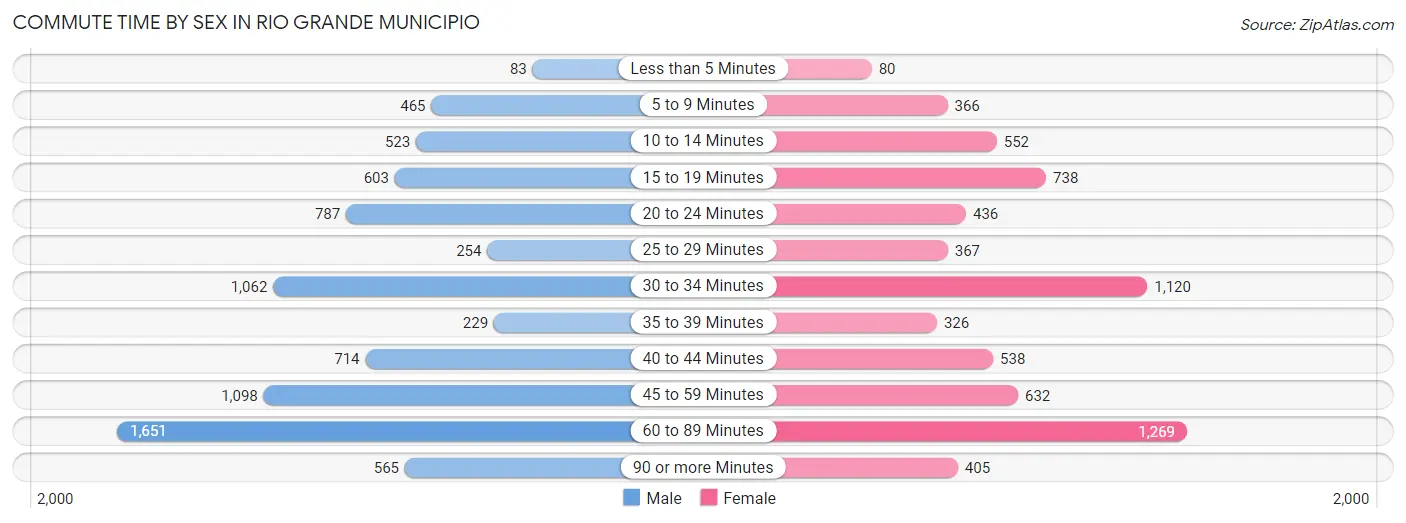
| Commute Time | Male | Female |
| Less than 5 Minutes | 83 (1.0%) | 80 (1.2%) |
| 5 to 9 Minutes | 465 (5.8%) | 366 (5.4%) |
| 10 to 14 Minutes | 523 (6.5%) | 552 (8.1%) |
| 15 to 19 Minutes | 603 (7.5%) | 738 (10.8%) |
| 20 to 24 Minutes | 787 (9.8%) | 436 (6.4%) |
| 25 to 29 Minutes | 254 (3.2%) | 367 (5.4%) |
| 30 to 34 Minutes | 1,062 (13.2%) | 1,120 (16.4%) |
| 35 to 39 Minutes | 229 (2.9%) | 326 (4.8%) |
| 40 to 44 Minutes | 714 (8.9%) | 538 (7.9%) |
| 45 to 59 Minutes | 1,098 (13.7%) | 632 (9.2%) |
| 60 to 89 Minutes | 1,651 (20.5%) | 1,269 (18.6%) |
| 90 or more Minutes | 565 (7.0%) | 405 (5.9%) |
Time of Departure to Work by Sex in Rio Grande Municipio
The most frequent times of departure to work in Rio Grande Municipio are 6:00 AM to 6:29 AM (1,289, 16.0%) for males and 7:00 AM to 7:29 AM (1,241, 18.2%) for females.
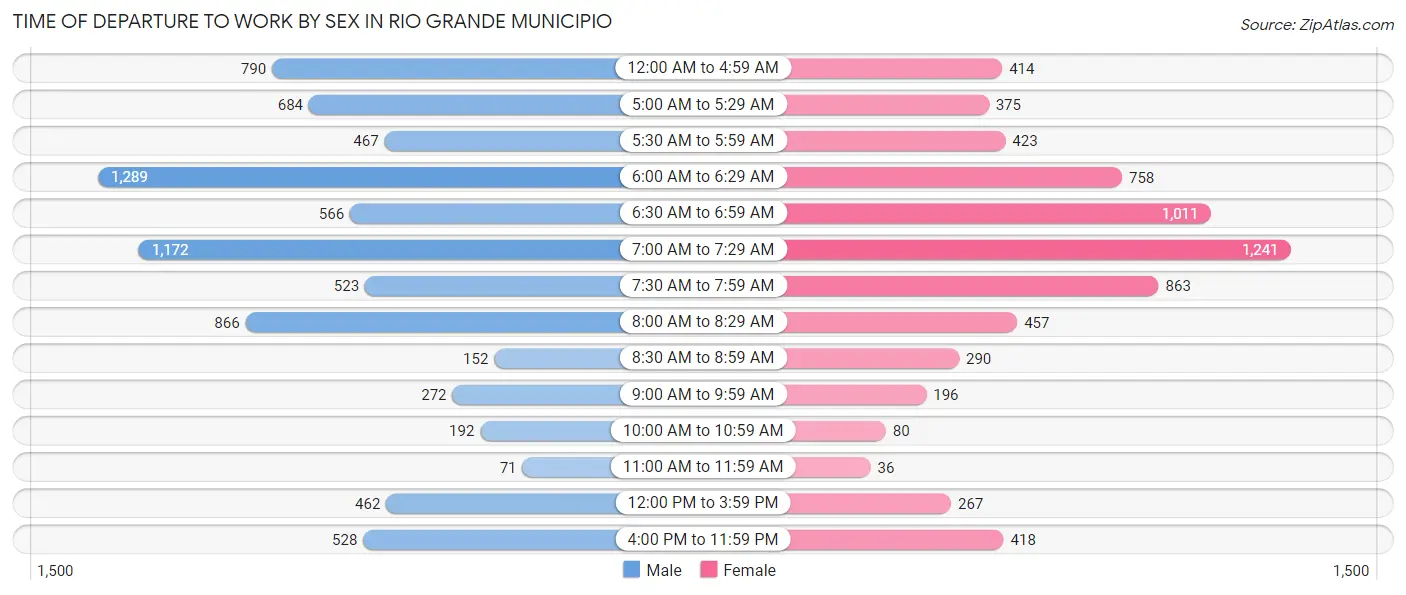
| Time of Departure | Male | Female |
| 12:00 AM to 4:59 AM | 790 (9.8%) | 414 (6.1%) |
| 5:00 AM to 5:29 AM | 684 (8.5%) | 375 (5.5%) |
| 5:30 AM to 5:59 AM | 467 (5.8%) | 423 (6.2%) |
| 6:00 AM to 6:29 AM | 1,289 (16.0%) | 758 (11.1%) |
| 6:30 AM to 6:59 AM | 566 (7.0%) | 1,011 (14.8%) |
| 7:00 AM to 7:29 AM | 1,172 (14.6%) | 1,241 (18.2%) |
| 7:30 AM to 7:59 AM | 523 (6.5%) | 863 (12.6%) |
| 8:00 AM to 8:29 AM | 866 (10.8%) | 457 (6.7%) |
| 8:30 AM to 8:59 AM | 152 (1.9%) | 290 (4.3%) |
| 9:00 AM to 9:59 AM | 272 (3.4%) | 196 (2.9%) |
| 10:00 AM to 10:59 AM | 192 (2.4%) | 80 (1.2%) |
| 11:00 AM to 11:59 AM | 71 (0.9%) | 36 (0.5%) |
| 12:00 PM to 3:59 PM | 462 (5.8%) | 267 (3.9%) |
| 4:00 PM to 11:59 PM | 528 (6.6%) | 418 (6.1%) |
| Total | 8,034 (100.0%) | 6,829 (100.0%) |
Housing Occupancy in Rio Grande Municipio
Occupancy by Ownership in Rio Grande Municipio
Of the total 15,981 dwellings in Rio Grande Municipio, owner-occupied units account for 11,615 (72.7%), while renter-occupied units make up 4,366 (27.3%).
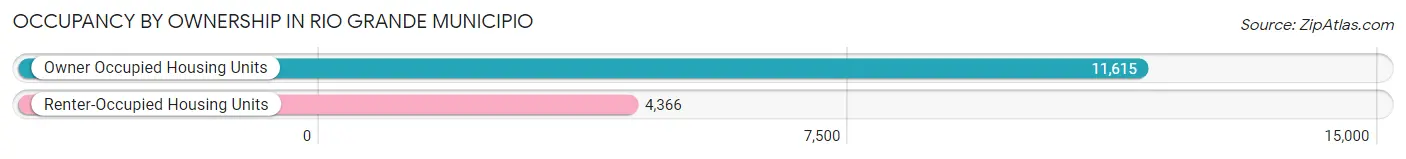
| Occupancy | # Housing Units | % Housing Units |
| Owner Occupied Housing Units | 11,615 | 72.7% |
| Renter-Occupied Housing Units | 4,366 | 27.3% |
| Total Occupied Housing Units | 15,981 | 100.0% |
Occupancy by Household Size in Rio Grande Municipio
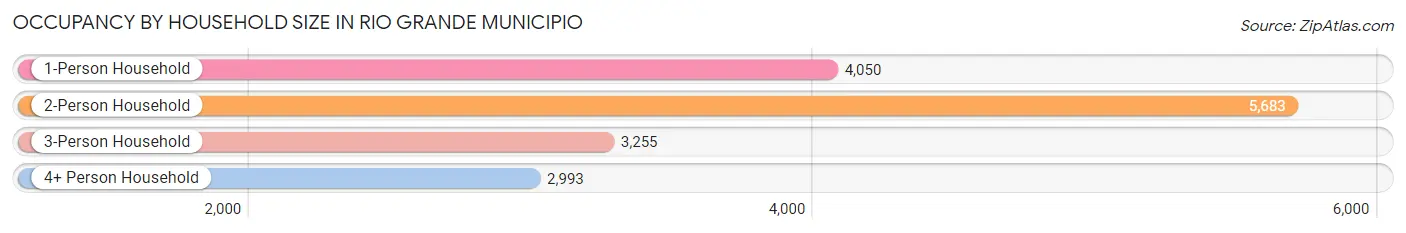
| Household Size | # Housing Units | % Housing Units |
| 1-Person Household | 4,050 | 25.3% |
| 2-Person Household | 5,683 | 35.6% |
| 3-Person Household | 3,255 | 20.4% |
| 4+ Person Household | 2,993 | 18.7% |
| Total Housing Units | 15,981 | 100.0% |
Occupancy by Ownership by Household Size in Rio Grande Municipio
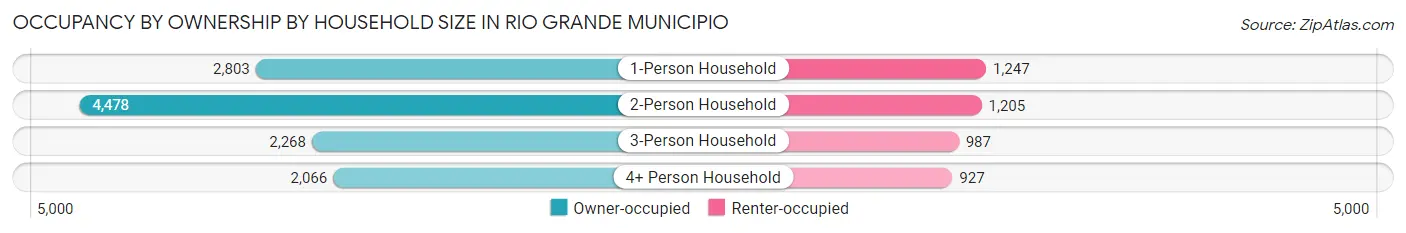
| Household Size | Owner-occupied | Renter-occupied |
| 1-Person Household | 2,803 (69.2%) | 1,247 (30.8%) |
| 2-Person Household | 4,478 (78.8%) | 1,205 (21.2%) |
| 3-Person Household | 2,268 (69.7%) | 987 (30.3%) |
| 4+ Person Household | 2,066 (69.0%) | 927 (31.0%) |
| Total Housing Units | 11,615 (72.7%) | 4,366 (27.3%) |
Occupancy by Educational Attainment in Rio Grande Municipio
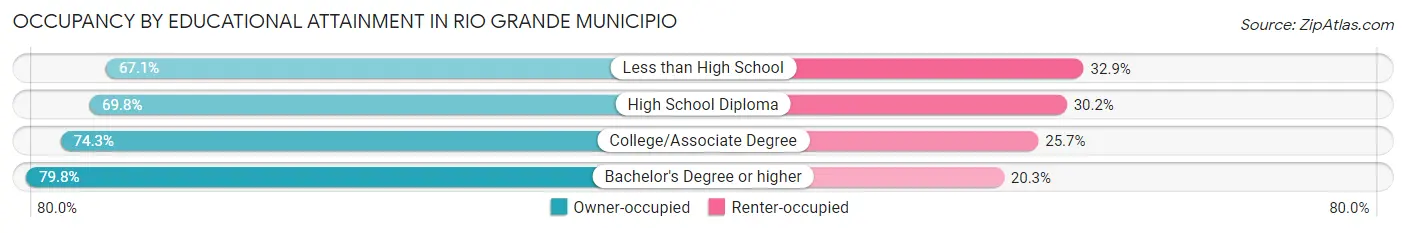
| Household Size | Owner-occupied | Renter-occupied |
| Less than High School | 2,367 (67.1%) | 1,161 (32.9%) |
| High School Diploma | 3,311 (69.8%) | 1,434 (30.2%) |
| College/Associate Degree | 2,854 (74.3%) | 988 (25.7%) |
| Bachelor's Degree or higher | 3,083 (79.7%) | 783 (20.3%) |
Occupancy by Age of Householder in Rio Grande Municipio
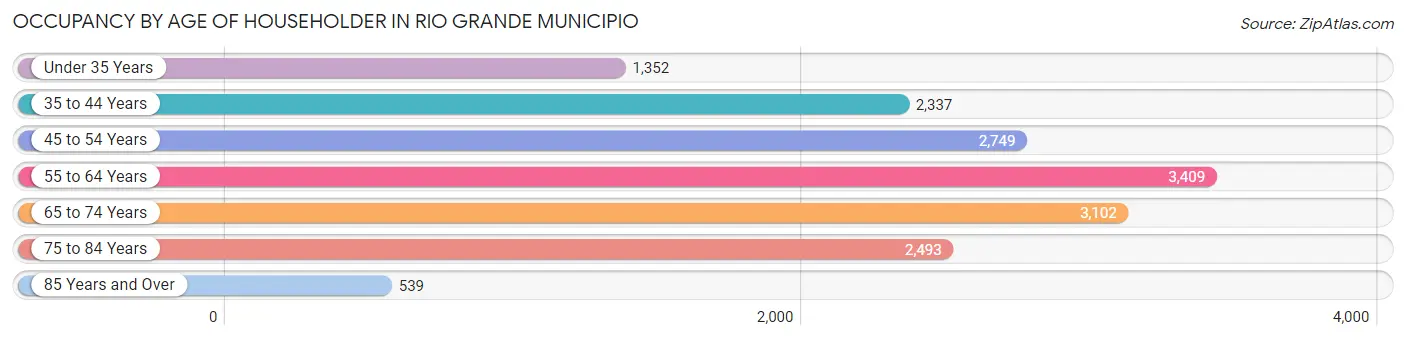
| Age Bracket | # Households | % Households |
| Under 35 Years | 1,352 | 8.5% |
| 35 to 44 Years | 2,337 | 14.6% |
| 45 to 54 Years | 2,749 | 17.2% |
| 55 to 64 Years | 3,409 | 21.3% |
| 65 to 74 Years | 3,102 | 19.4% |
| 75 to 84 Years | 2,493 | 15.6% |
| 85 Years and Over | 539 | 3.4% |
| Total | 15,981 | 100.0% |
Housing Finances in Rio Grande Municipio
Median Income by Occupancy in Rio Grande Municipio
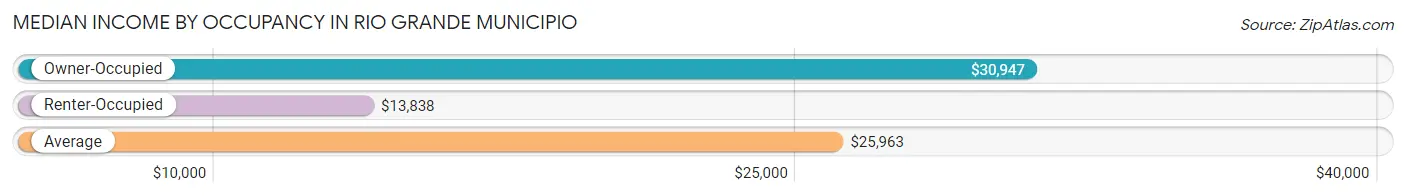
| Occupancy Type | # Households | Median Income |
| Owner-Occupied | 11,615 (72.7%) | $30,947 |
| Renter-Occupied | 4,366 (27.3%) | $13,838 |
| Average | 15,981 (100.0%) | $25,963 |
Occupancy by Householder Income Bracket in Rio Grande Municipio
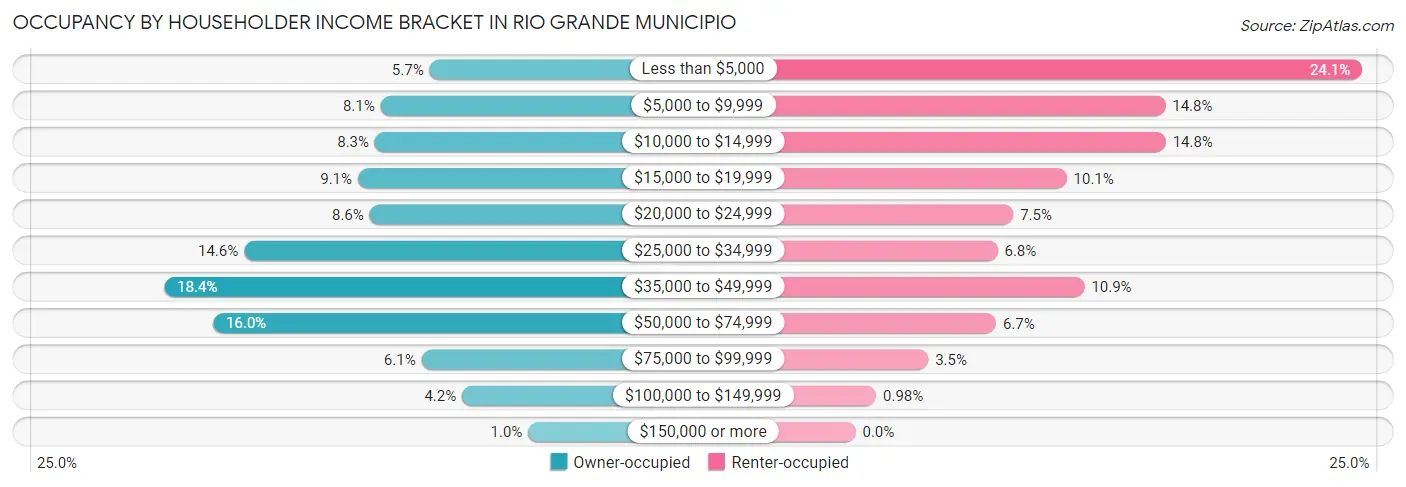
| Income Bracket | Owner-occupied | Renter-occupied |
| Less than $5,000 | 664 (5.7%) | 1,053 (24.1%) |
| $5,000 to $9,999 | 935 (8.1%) | 644 (14.7%) |
| $10,000 to $14,999 | 966 (8.3%) | 645 (14.8%) |
| $15,000 to $19,999 | 1,060 (9.1%) | 439 (10.1%) |
| $20,000 to $24,999 | 995 (8.6%) | 328 (7.5%) |
| $25,000 to $34,999 | 1,690 (14.5%) | 295 (6.8%) |
| $35,000 to $49,999 | 2,133 (18.4%) | 476 (10.9%) |
| $50,000 to $74,999 | 1,862 (16.0%) | 292 (6.7%) |
| $75,000 to $99,999 | 708 (6.1%) | 151 (3.5%) |
| $100,000 to $149,999 | 484 (4.2%) | 43 (1.0%) |
| $150,000 or more | 118 (1.0%) | 0 (0.0%) |
| Total | 11,615 (100.0%) | 4,366 (100.0%) |
Monthly Housing Cost Tiers in Rio Grande Municipio
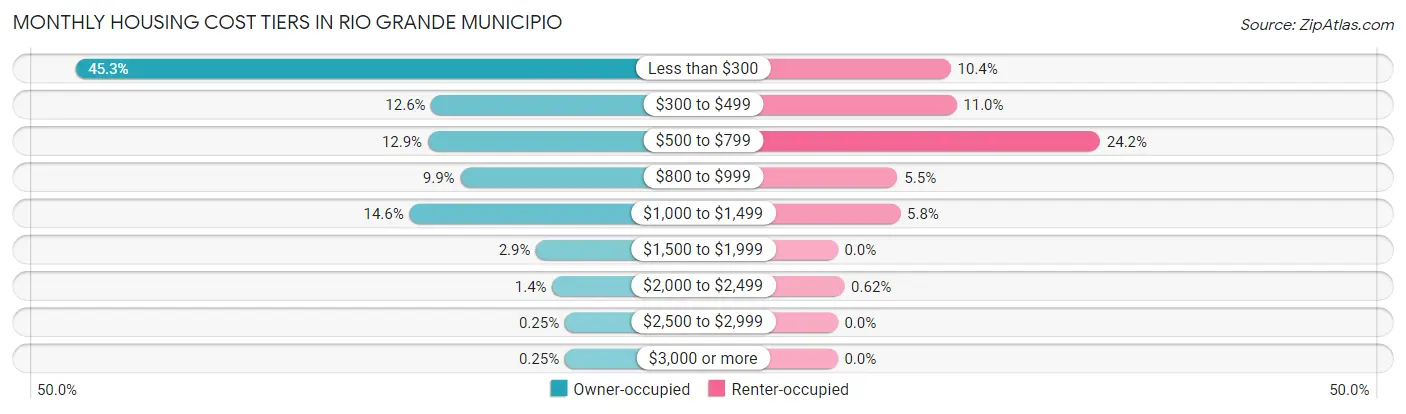
| Monthly Cost | Owner-occupied | Renter-occupied |
| Less than $300 | 5,266 (45.3%) | 455 (10.4%) |
| $300 to $499 | 1,458 (12.6%) | 478 (11.0%) |
| $500 to $799 | 1,495 (12.9%) | 1,055 (24.2%) |
| $800 to $999 | 1,147 (9.9%) | 241 (5.5%) |
| $1,000 to $1,499 | 1,691 (14.6%) | 252 (5.8%) |
| $1,500 to $1,999 | 336 (2.9%) | 0 (0.0%) |
| $2,000 to $2,499 | 164 (1.4%) | 27 (0.6%) |
| $2,500 to $2,999 | 29 (0.3%) | 0 (0.0%) |
| $3,000 or more | 29 (0.3%) | 0 (0.0%) |
| Total | 11,615 (100.0%) | 4,366 (100.0%) |
Physical Housing Characteristics in Rio Grande Municipio
Housing Structures in Rio Grande Municipio
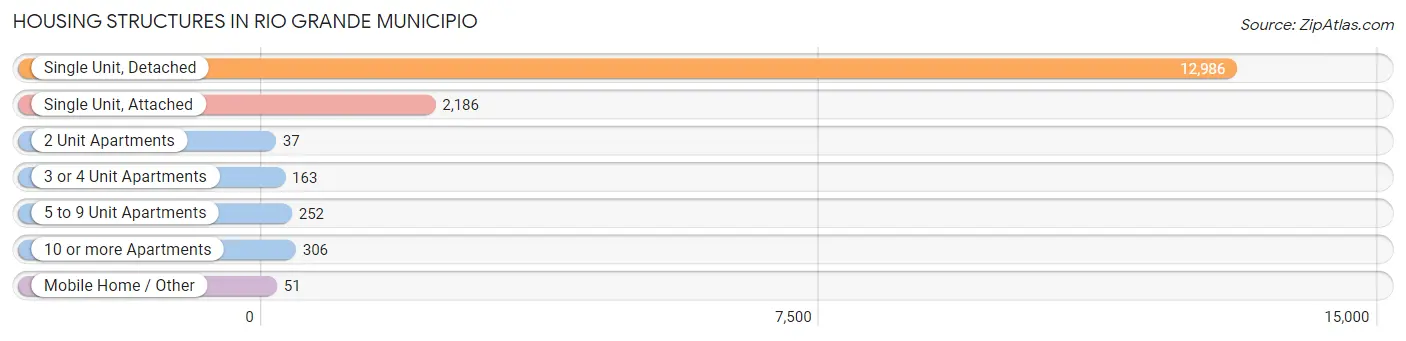
| Structure Type | # Housing Units | % Housing Units |
| Single Unit, Detached | 12,986 | 81.3% |
| Single Unit, Attached | 2,186 | 13.7% |
| 2 Unit Apartments | 37 | 0.2% |
| 3 or 4 Unit Apartments | 163 | 1.0% |
| 5 to 9 Unit Apartments | 252 | 1.6% |
| 10 or more Apartments | 306 | 1.9% |
| Mobile Home / Other | 51 | 0.3% |
| Total | 15,981 | 100.0% |
Housing Structures by Occupancy in Rio Grande Municipio
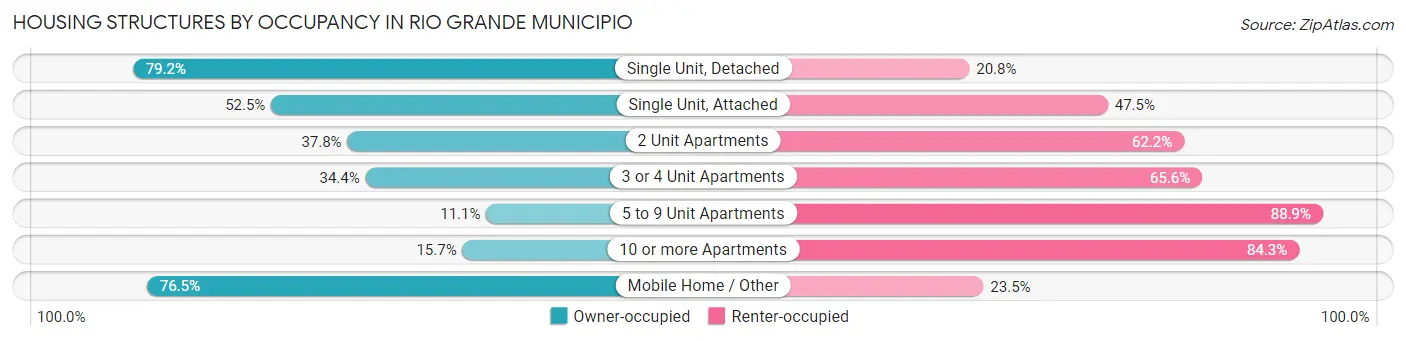
| Structure Type | Owner-occupied | Renter-occupied |
| Single Unit, Detached | 10,282 (79.2%) | 2,704 (20.8%) |
| Single Unit, Attached | 1,148 (52.5%) | 1,038 (47.5%) |
| 2 Unit Apartments | 14 (37.8%) | 23 (62.2%) |
| 3 or 4 Unit Apartments | 56 (34.4%) | 107 (65.6%) |
| 5 to 9 Unit Apartments | 28 (11.1%) | 224 (88.9%) |
| 10 or more Apartments | 48 (15.7%) | 258 (84.3%) |
| Mobile Home / Other | 39 (76.5%) | 12 (23.5%) |
| Total | 11,615 (72.7%) | 4,366 (27.3%) |
Housing Structures by Number of Rooms in Rio Grande Municipio
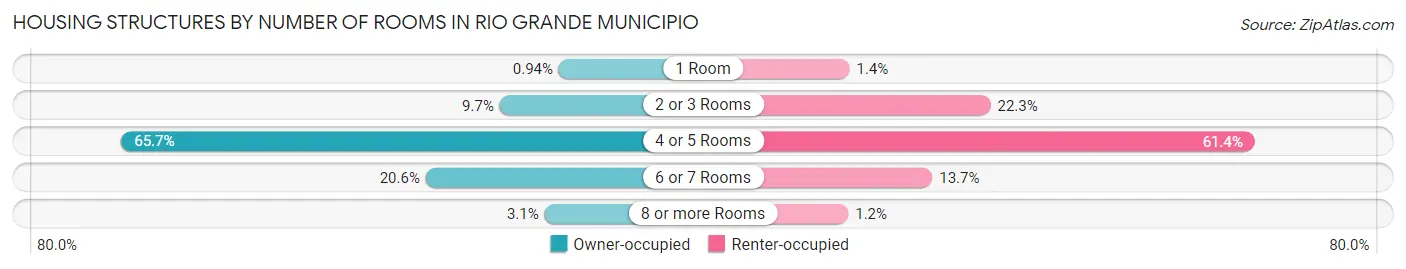
| Number of Rooms | Owner-occupied | Renter-occupied |
| 1 Room | 109 (0.9%) | 62 (1.4%) |
| 2 or 3 Rooms | 1,125 (9.7%) | 973 (22.3%) |
| 4 or 5 Rooms | 7,629 (65.7%) | 2,680 (61.4%) |
| 6 or 7 Rooms | 2,397 (20.6%) | 597 (13.7%) |
| 8 or more Rooms | 355 (3.1%) | 54 (1.2%) |
| Total | 11,615 (100.0%) | 4,366 (100.0%) |
Housing Structure by Heating Type in Rio Grande Municipio
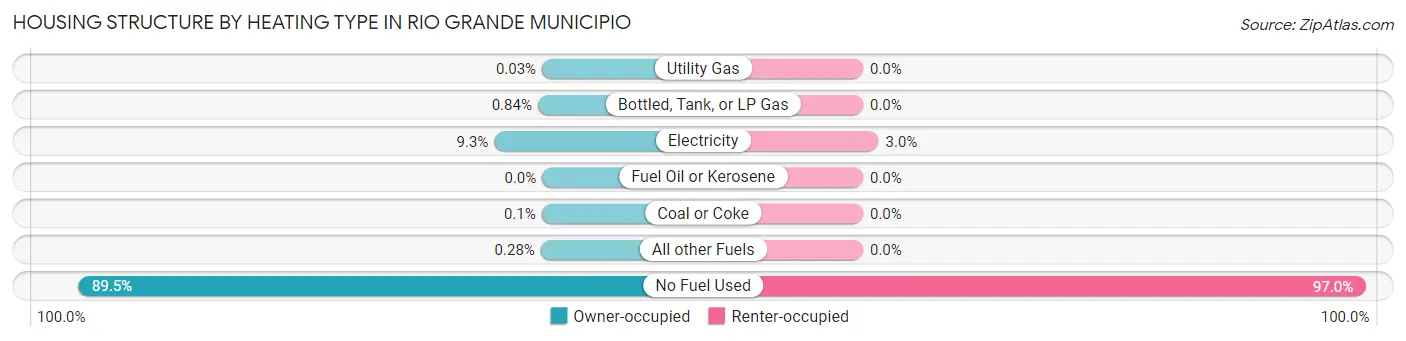
| Heating Type | Owner-occupied | Renter-occupied |
| Utility Gas | 4 (0.0%) | 0 (0.0%) |
| Bottled, Tank, or LP Gas | 97 (0.8%) | 0 (0.0%) |
| Electricity | 1,075 (9.3%) | 131 (3.0%) |
| Fuel Oil or Kerosene | 0 (0.0%) | 0 (0.0%) |
| Coal or Coke | 12 (0.1%) | 0 (0.0%) |
| All other Fuels | 32 (0.3%) | 0 (0.0%) |
| No Fuel Used | 10,395 (89.5%) | 4,235 (97.0%) |
| Total | 11,615 (100.0%) | 4,366 (100.0%) |
Household Vehicle Usage in Rio Grande Municipio
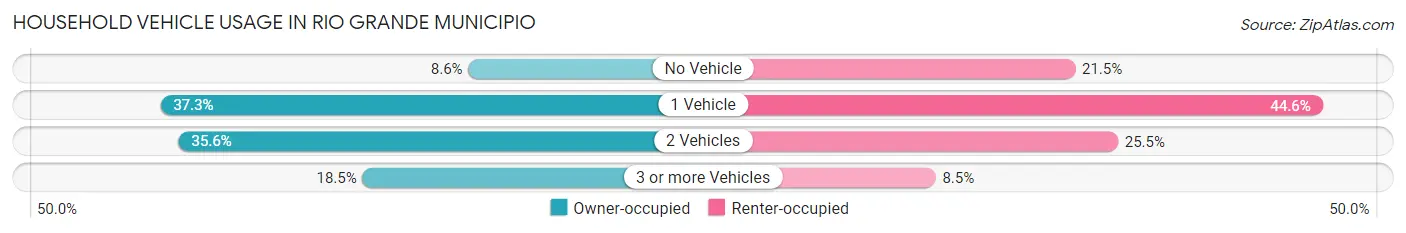
| Vehicles per Household | Owner-occupied | Renter-occupied |
| No Vehicle | 995 (8.6%) | 938 (21.5%) |
| 1 Vehicle | 4,337 (37.3%) | 1,947 (44.6%) |
| 2 Vehicles | 4,140 (35.6%) | 1,112 (25.5%) |
| 3 or more Vehicles | 2,143 (18.4%) | 369 (8.5%) |
| Total | 11,615 (100.0%) | 4,366 (100.0%) |
Real Estate & Mortgages in Rio Grande Municipio
Real Estate and Mortgage Overview in Rio Grande Municipio
| Characteristic | Without Mortgage | With Mortgage |
| Housing Units | 6,583 | 5,032 |
| Median Property Value | $121,000 | $138,000 |
| Median Household Income | $23,930 | $106 |
| Monthly Housing Costs | $171 | $29 |
| Real Estate Taxes | $496 | $4,206 |
Property Value by Mortgage Status in Rio Grande Municipio
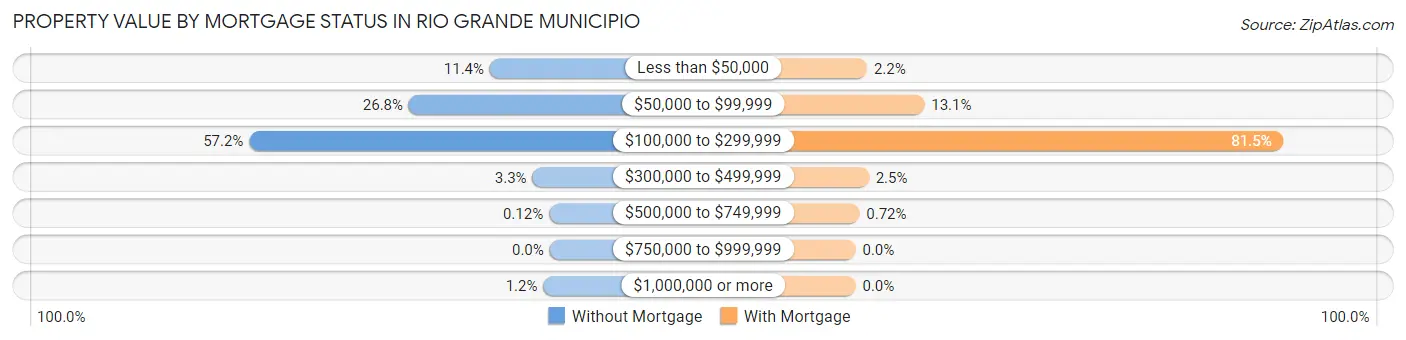
| Property Value | Without Mortgage | With Mortgage |
| Less than $50,000 | 749 (11.4%) | 109 (2.2%) |
| $50,000 to $99,999 | 1,765 (26.8%) | 659 (13.1%) |
| $100,000 to $299,999 | 3,767 (57.2%) | 4,102 (81.5%) |
| $300,000 to $499,999 | 215 (3.3%) | 126 (2.5%) |
| $500,000 to $749,999 | 8 (0.1%) | 36 (0.7%) |
| $750,000 to $999,999 | 0 (0.0%) | 0 (0.0%) |
| $1,000,000 or more | 79 (1.2%) | 0 (0.0%) |
| Total | 6,583 (100.0%) | 5,032 (100.0%) |
Household Income by Mortgage Status in Rio Grande Municipio
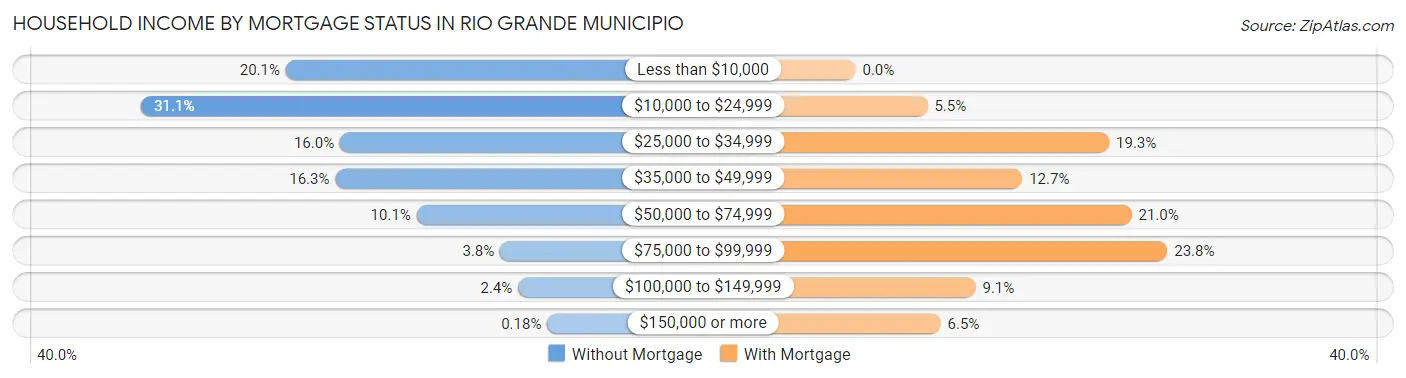
| Household Income | Without Mortgage | With Mortgage |
| Less than $10,000 | 1,323 (20.1%) | 0 (0.0%) |
| $10,000 to $24,999 | 2,049 (31.1%) | 276 (5.5%) |
| $25,000 to $34,999 | 1,051 (16.0%) | 972 (19.3%) |
| $35,000 to $49,999 | 1,075 (16.3%) | 639 (12.7%) |
| $50,000 to $74,999 | 667 (10.1%) | 1,058 (21.0%) |
| $75,000 to $99,999 | 248 (3.8%) | 1,195 (23.7%) |
| $100,000 to $149,999 | 158 (2.4%) | 460 (9.1%) |
| $150,000 or more | 12 (0.2%) | 326 (6.5%) |
| Total | 6,583 (100.0%) | 5,032 (100.0%) |
Property Value to Household Income Ratio in Rio Grande Municipio
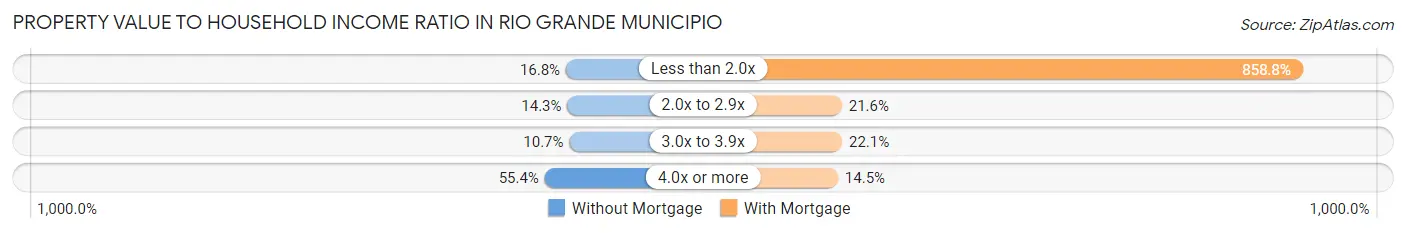
| Value-to-Income Ratio | Without Mortgage | With Mortgage |
| Less than 2.0x | 1,107 (16.8%) | 43,214 (858.8%) |
| 2.0x to 2.9x | 939 (14.3%) | 1,085 (21.6%) |
| 3.0x to 3.9x | 703 (10.7%) | 1,110 (22.1%) |
| 4.0x or more | 3,648 (55.4%) | 731 (14.5%) |
| Total | 6,583 (100.0%) | 5,032 (100.0%) |
Real Estate Taxes by Mortgage Status in Rio Grande Municipio
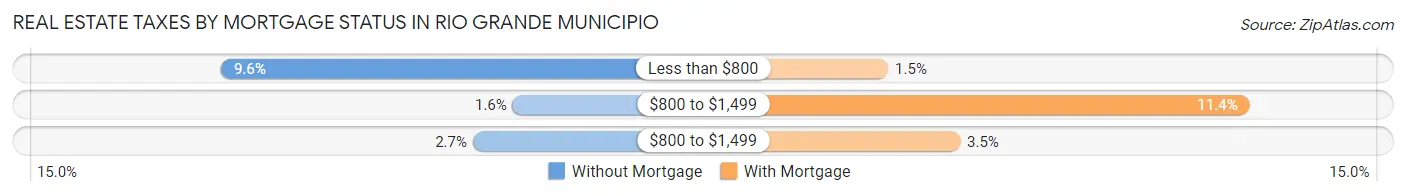
| Property Taxes | Without Mortgage | With Mortgage |
| Less than $800 | 633 (9.6%) | 76 (1.5%) |
| $800 to $1,499 | 107 (1.6%) | 574 (11.4%) |
| $800 to $1,499 | 179 (2.7%) | 175 (3.5%) |
| Total | 6,583 (100.0%) | 5,032 (100.0%) |
Health & Disability in Rio Grande Municipio
Health Insurance Coverage by Age in Rio Grande Municipio
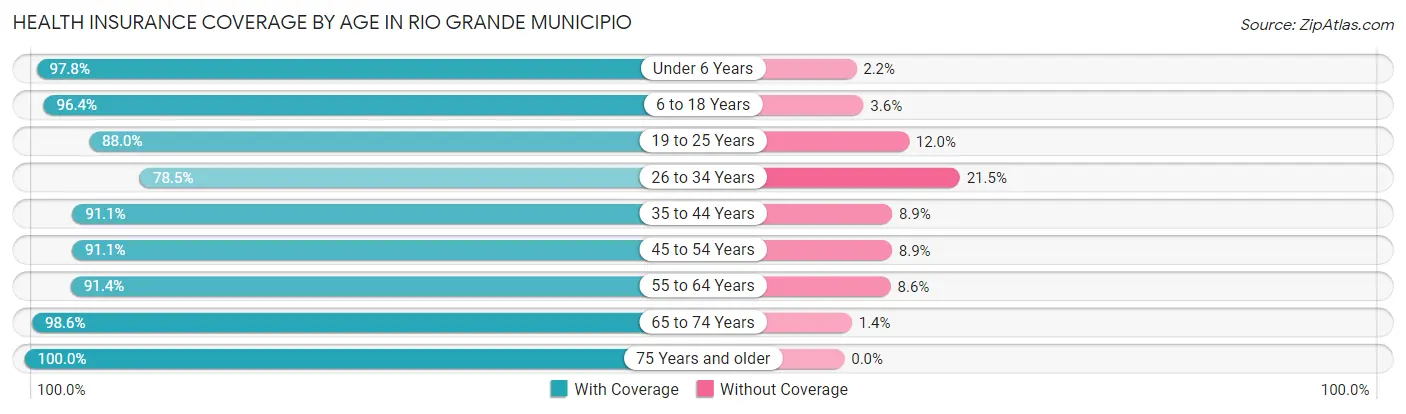
| Age Bracket | With Coverage | Without Coverage |
| Under 6 Years | 1,885 (97.8%) | 43 (2.2%) |
| 6 to 18 Years | 6,280 (96.4%) | 232 (3.6%) |
| 19 to 25 Years | 3,989 (88.0%) | 546 (12.0%) |
| 26 to 34 Years | 4,225 (78.5%) | 1,159 (21.5%) |
| 35 to 44 Years | 5,045 (91.1%) | 493 (8.9%) |
| 45 to 54 Years | 5,796 (91.1%) | 564 (8.9%) |
| 55 to 64 Years | 5,633 (91.4%) | 533 (8.6%) |
| 65 to 74 Years | 5,365 (98.6%) | 76 (1.4%) |
| 75 Years and older | 4,459 (100.0%) | 0 (0.0%) |
| Total | 42,677 (92.1%) | 3,646 (7.9%) |
Health Insurance Coverage by Citizenship Status in Rio Grande Municipio
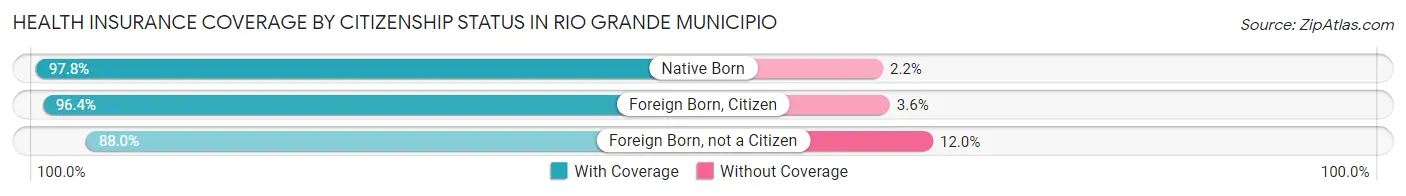
| Citizenship Status | With Coverage | Without Coverage |
| Native Born | 1,885 (97.8%) | 43 (2.2%) |
| Foreign Born, Citizen | 6,280 (96.4%) | 232 (3.6%) |
| Foreign Born, not a Citizen | 3,989 (88.0%) | 546 (12.0%) |
Health Insurance Coverage by Household Income in Rio Grande Municipio
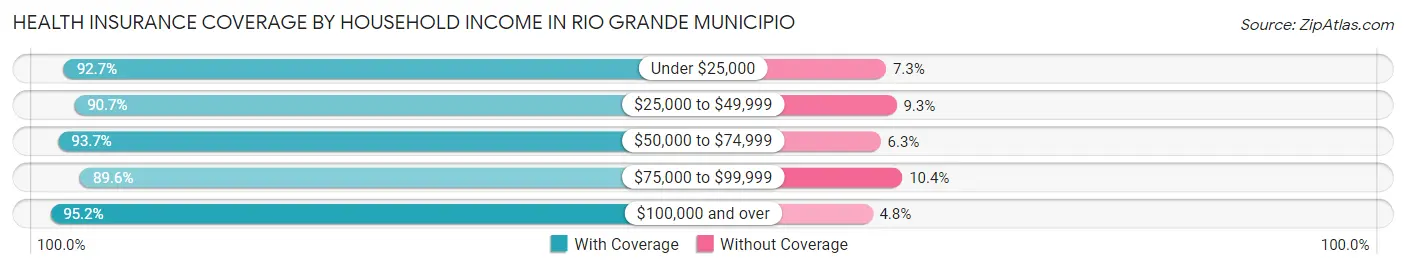
| Household Income | With Coverage | Without Coverage |
| Under $25,000 | 16,178 (92.7%) | 1,281 (7.3%) |
| $25,000 to $49,999 | 13,159 (90.7%) | 1,350 (9.3%) |
| $50,000 to $74,999 | 7,636 (93.7%) | 517 (6.3%) |
| $75,000 to $99,999 | 3,202 (89.6%) | 371 (10.4%) |
| $100,000 and over | 2,356 (95.2%) | 119 (4.8%) |
Public vs Private Health Insurance Coverage by Age in Rio Grande Municipio
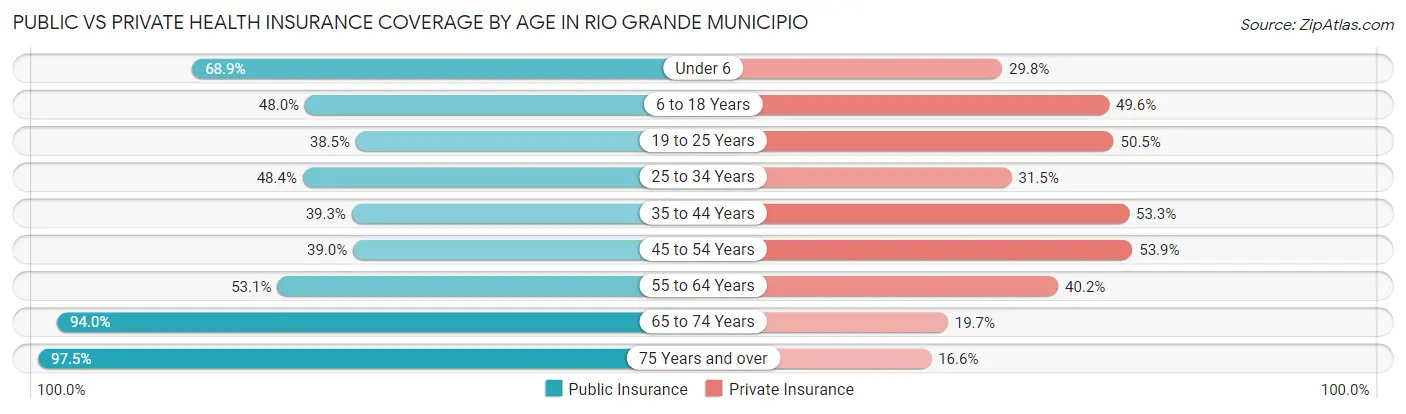
| Age Bracket | Public Insurance | Private Insurance |
| Under 6 | 1,328 (68.9%) | 574 (29.8%) |
| 6 to 18 Years | 3,124 (48.0%) | 3,230 (49.6%) |
| 19 to 25 Years | 1,747 (38.5%) | 2,288 (50.4%) |
| 25 to 34 Years | 2,604 (48.4%) | 1,697 (31.5%) |
| 35 to 44 Years | 2,176 (39.3%) | 2,953 (53.3%) |
| 45 to 54 Years | 2,482 (39.0%) | 3,429 (53.9%) |
| 55 to 64 Years | 3,275 (53.1%) | 2,476 (40.2%) |
| 65 to 74 Years | 5,113 (94.0%) | 1,071 (19.7%) |
| 75 Years and over | 4,347 (97.5%) | 740 (16.6%) |
| Total | 26,196 (56.6%) | 18,458 (39.9%) |
Disability Status by Sex by Age in Rio Grande Municipio
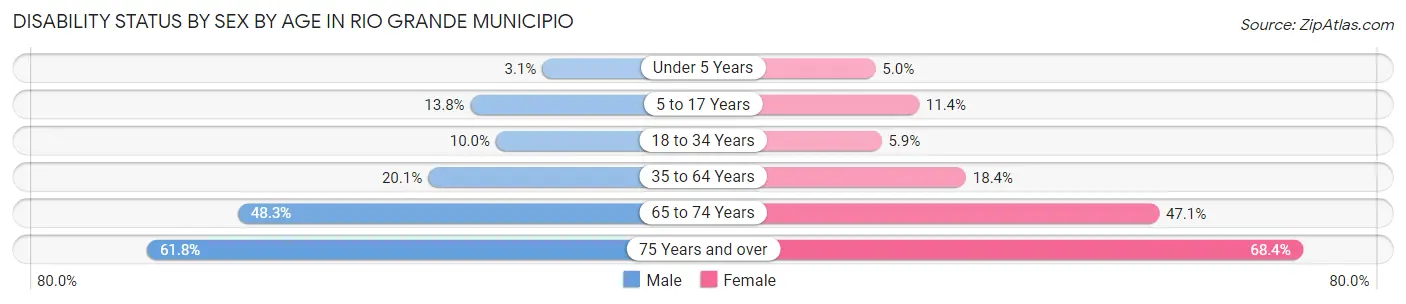
| Age Bracket | Male | Female |
| Under 5 Years | 25 (3.1%) | 37 (5.0%) |
| 5 to 17 Years | 447 (13.8%) | 355 (11.4%) |
| 18 to 34 Years | 528 (10.0%) | 307 (5.9%) |
| 35 to 64 Years | 1,695 (20.1%) | 1,774 (18.4%) |
| 65 to 74 Years | 1,150 (48.3%) | 1,442 (47.1%) |
| 75 Years and over | 1,218 (61.8%) | 1,703 (68.4%) |
Disability Class by Sex by Age in Rio Grande Municipio
Disability Class: Hearing Difficulty
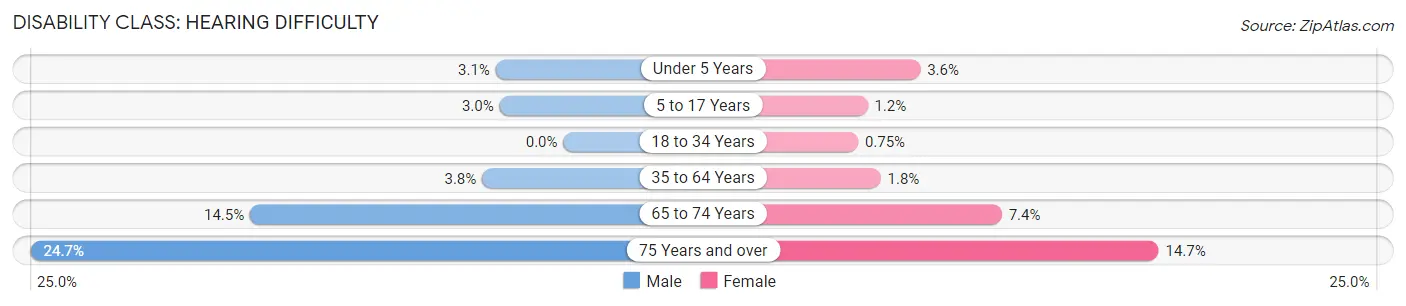
| Age Bracket | Male | Female |
| Under 5 Years | 25 (3.1%) | 27 (3.6%) |
| 5 to 17 Years | 96 (3.0%) | 37 (1.2%) |
| 18 to 34 Years | 0 (0.0%) | 39 (0.7%) |
| 35 to 64 Years | 318 (3.8%) | 173 (1.8%) |
| 65 to 74 Years | 346 (14.5%) | 227 (7.4%) |
| 75 Years and over | 487 (24.7%) | 366 (14.7%) |
Disability Class: Vision Difficulty
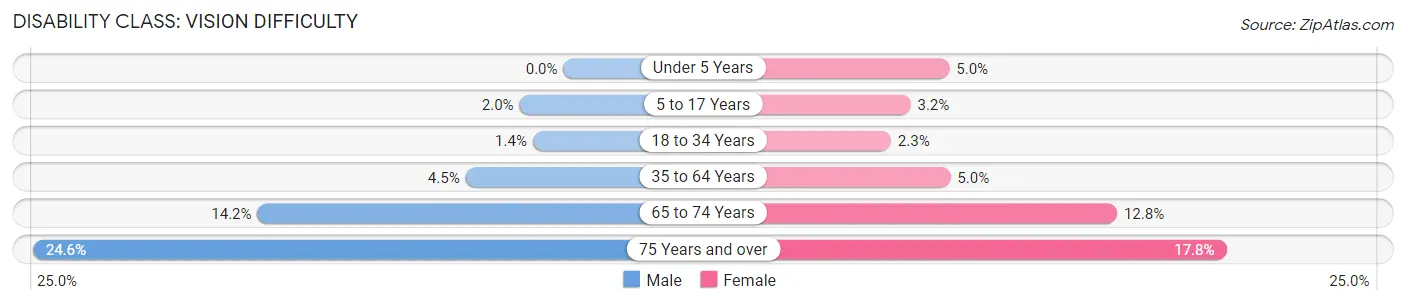
| Age Bracket | Male | Female |
| Under 5 Years | 0 (0.0%) | 37 (5.0%) |
| 5 to 17 Years | 66 (2.0%) | 99 (3.2%) |
| 18 to 34 Years | 75 (1.4%) | 119 (2.3%) |
| 35 to 64 Years | 383 (4.5%) | 485 (5.0%) |
| 65 to 74 Years | 338 (14.2%) | 391 (12.8%) |
| 75 Years and over | 485 (24.6%) | 444 (17.8%) |
Disability Class: Cognitive Difficulty
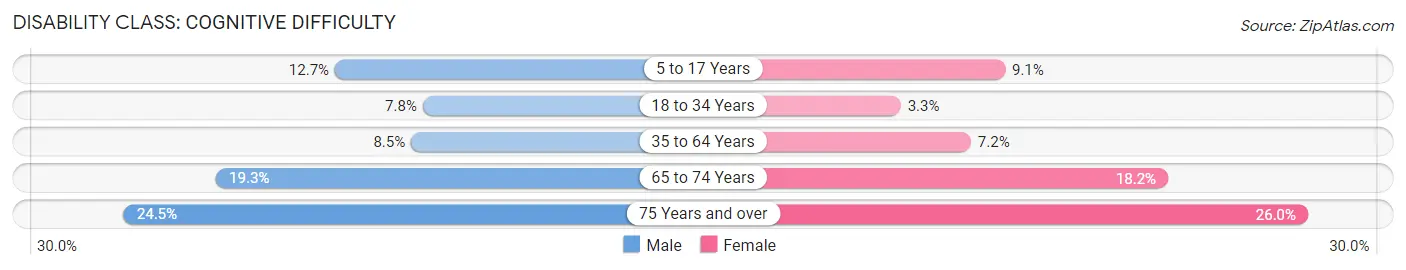
| Age Bracket | Male | Female |
| 5 to 17 Years | 412 (12.7%) | 282 (9.1%) |
| 18 to 34 Years | 412 (7.8%) | 171 (3.3%) |
| 35 to 64 Years | 715 (8.5%) | 693 (7.2%) |
| 65 to 74 Years | 460 (19.3%) | 556 (18.2%) |
| 75 Years and over | 482 (24.5%) | 646 (26.0%) |
Disability Class: Ambulatory Difficulty
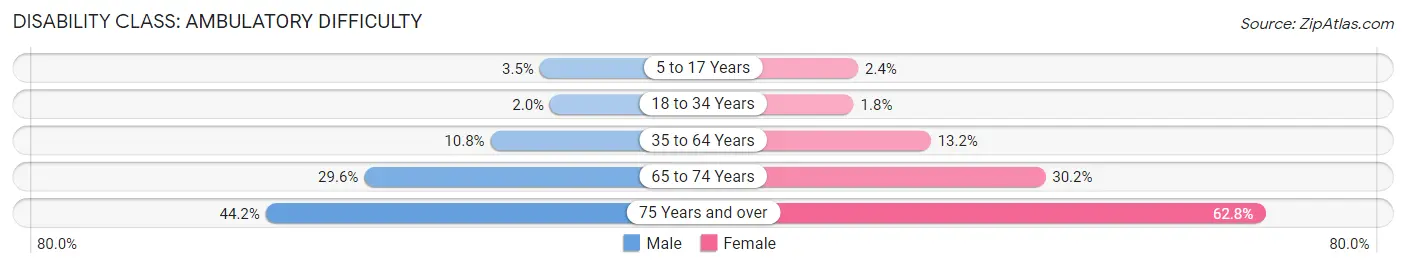
| Age Bracket | Male | Female |
| 5 to 17 Years | 114 (3.5%) | 75 (2.4%) |
| 18 to 34 Years | 105 (2.0%) | 92 (1.8%) |
| 35 to 64 Years | 913 (10.8%) | 1,271 (13.2%) |
| 65 to 74 Years | 704 (29.6%) | 925 (30.2%) |
| 75 Years and over | 871 (44.2%) | 1,564 (62.8%) |
Disability Class: Self-Care Difficulty
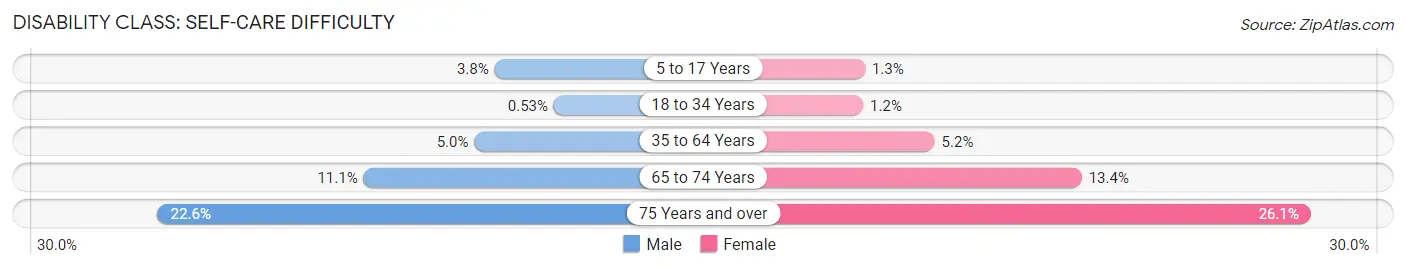
| Age Bracket | Male | Female |
| 5 to 17 Years | 124 (3.8%) | 40 (1.3%) |
| 18 to 34 Years | 28 (0.5%) | 62 (1.2%) |
| 35 to 64 Years | 418 (5.0%) | 498 (5.2%) |
| 65 to 74 Years | 265 (11.1%) | 409 (13.4%) |
| 75 Years and over | 445 (22.6%) | 650 (26.1%) |
Technology Access in Rio Grande Municipio
Computing Device Access in Rio Grande Municipio
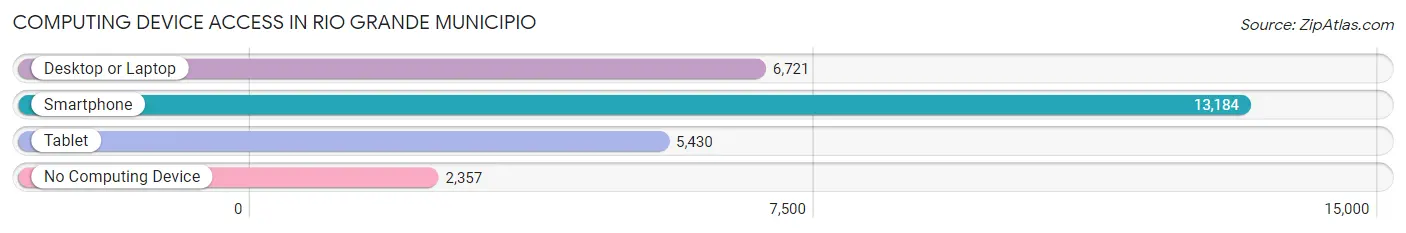
| Device Type | # Households | % Households |
| Desktop or Laptop | 6,721 | 42.1% |
| Smartphone | 13,184 | 82.5% |
| Tablet | 5,430 | 34.0% |
| No Computing Device | 2,357 | 14.7% |
| Total | 15,981 | 100.0% |
Internet Access in Rio Grande Municipio
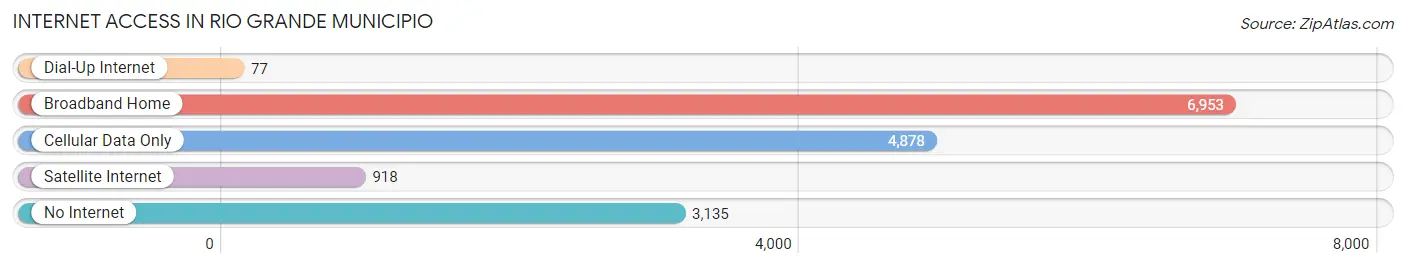
| Internet Type | # Households | % Households |
| Dial-Up Internet | 77 | 0.5% |
| Broadband Home | 6,953 | 43.5% |
| Cellular Data Only | 4,878 | 30.5% |
| Satellite Internet | 918 | 5.7% |
| No Internet | 3,135 | 19.6% |
| Total | 15,981 | 100.0% |
Rio Grande Municipio Summary
Rio Grande Municipio is located in the northeast corner of Puerto Rico, and is part of the metropolitan area of San Juan. It is bordered by the municipalities of Loíza, Canóvanas, and Naguabo. The municipality covers an area of approximately 40 square miles and has a population of approximately 40,000 people.
History
The area that is now Rio Grande Municipio was originally inhabited by the Taíno people, who were the indigenous people of Puerto Rico. The Taíno were a peaceful people who lived in small villages and were skilled farmers. They were eventually conquered by the Spanish in the 16th century, and the area was then colonized by the Spanish. The area was then divided into two parts, the northern part being called Rio Grande de Loíza and the southern part being called Rio Grande de Manatí. The two parts were eventually merged in 1824 to form the municipality of Rio Grande.
In the 19th century, the area was an important agricultural center, with sugarcane and coffee being the main crops. The area was also known for its cattle and horse breeding. In the 20th century, the economy shifted to tourism, with the development of resorts and hotels in the area.
Geography
Rio Grande Municipio is located in the northeast corner of Puerto Rico, and is part of the metropolitan area of San Juan. It is bordered by the municipalities of Loíza, Canóvanas, and Naguabo. The municipality covers an area of approximately 40 square miles and has a population of approximately 40,000 people.
The terrain of the municipality is mostly flat, with some hills in the northern part. The climate is tropical, with temperatures ranging from the mid-70s to the mid-80s. The area receives an average of about 60 inches of rain per year.
Economy
The economy of Rio Grande Municipio is largely based on tourism, with resorts and hotels being the main sources of income. The area is also known for its agricultural production, with sugarcane and coffee being the main crops. The area is also known for its cattle and horse breeding.
In addition to tourism and agriculture, the area is also home to several manufacturing companies, including pharmaceuticals, electronics, and food processing. The area is also home to several government offices, including the Puerto Rico Department of Education and the Puerto Rico Department of Transportation.
Demographics
As of the 2010 census, the population of Rio Grande Municipio was 39,919. The population is mostly of Puerto Rican descent, with a small percentage of other ethnicities, including African, Asian, and European. The median age of the population is 38.5 years, and the median household income is $20,845.
The majority of the population is Roman Catholic, with a small percentage of other religions, including Protestantism and Judaism. The official language of the municipality is Spanish, although English is also spoken.
Conclusion
Rio Grande Municipio is located in the northeast corner of Puerto Rico, and is part of the metropolitan area of San Juan. It is bordered by the municipalities of Loíza, Canóvanas, and Naguabo. The municipality covers an area of approximately 40 square miles and has a population of approximately 40,000 people. The economy of the area is largely based on tourism, with resorts and hotels being the main sources of income. The population is mostly of Puerto Rican descent, with a small percentage of other ethnicities, including African, Asian, and European. The official language of the municipality is Spanish, although English is also spoken.
Common Questions
What is Per Capita Income in Rio Grande Municipio?
Per Capita income in Rio Grande Municipio is $14,161.
What is the Median Family Income in Rio Grande Municipio?
Median Family Income in Rio Grande Municipio is $31,786.
What is the Median Household income in Rio Grande Municipio?
Median Household Income in Rio Grande Municipio is $25,963.
What is Income or Wage Gap in Rio Grande Municipio?
Income or Wage Gap in Rio Grande Municipio is 2.7%.
Women in Rio Grande Municipio earn 97.3 cents for every dollar earned by a man.
What is Family Income Deficit in Rio Grande Municipio?
Family Income Deficit in Rio Grande Municipio is $11,055.
Families that are below poverty line in Rio Grande Municipio earn $11,055 less on average than the poverty threshold level.
What is Inequality or Gini Index in Rio Grande Municipio?
Inequality or Gini Index in Rio Grande Municipio is 0.47.
What is the Total Population of Rio Grande Municipio?
Total Population of Rio Grande Municipio is 46,838.
What is the Total Male Population of Rio Grande Municipio?
Total Male Population of Rio Grande Municipio is 22,429.
What is the Total Female Population of Rio Grande Municipio?
Total Female Population of Rio Grande Municipio is 24,409.
What is the Ratio of Males per 100 Females in Rio Grande Municipio?
There are 91.89 Males per 100 Females in Rio Grande Municipio.
What is the Ratio of Females per 100 Males in Rio Grande Municipio?
There are 108.83 Females per 100 Males in Rio Grande Municipio.
What is the Median Population Age in Rio Grande Municipio?
Median Population Age in Rio Grande Municipio is 43.8 Years.
What is the Average Family Size in Rio Grande Municipio
Average Family Size in Rio Grande Municipio is 3.5 People.
What is the Average Household Size in Rio Grande Municipio
Average Household Size in Rio Grande Municipio is 2.9 People.
How Large is the Labor Force in Rio Grande Municipio?
There are 21,021 People in the Labor Forcein in Rio Grande Municipio.
What is the Percentage of People in the Labor Force in Rio Grande Municipio?
52.3% of People are in the Labor Force in Rio Grande Municipio.
What is the Unemployment Rate in Rio Grande Municipio?
Unemployment Rate in Rio Grande Municipio is 17.6%.