Naguabo Municipio, PR Map & Demographics
Naguabo Municipio Map
Naguabo Municipio Overview
$10,940
PER CAPITA INCOME
$22,616
AVG FAMILY INCOME
$20,486
AVG HOUSEHOLD INCOME
7.1%
WAGE / INCOME GAP [ % ]
92.9¢/ $1
WAGE / INCOME GAP [ $ ]
$11,940
FAMILY INCOME DEFICIT
0.42
INEQUALITY / GINI INDEX
23,340
TOTAL POPULATION
10,947
MALE POPULATION
12,393
FEMALE POPULATION
88.33
MALES / 100 FEMALES
113.21
FEMALES / 100 MALES
39.8
MEDIAN AGE
3.5
AVG FAMILY SIZE
2.9
AVG HOUSEHOLD SIZE
7,604
LABOR FORCE [ PEOPLE ]
39.3%
PERCENT IN LABOR FORCE
10.0%
UNEMPLOYMENT RATE
Naguabo Municipio Area Codes
Income in Naguabo Municipio
Income Overview in Naguabo Municipio
Per Capita Income in Naguabo Municipio is $10,940, while median incomes of families and households are $22,616 and $20,486 respectively.
| Characteristic | Number | Measure |
| Per Capita Income | 23,340 | $10,940 |
| Median Family Income | 5,387 | $22,616 |
| Mean Family Income | 5,387 | $28,196 |
| Median Household Income | 8,171 | $20,486 |
| Mean Household Income | 8,171 | $26,126 |
| Income Deficit | 5,387 | $11,940 |
| Wage / Income Gap (%) | 23,340 | 7.13% |
| Wage / Income Gap ($) | 23,340 | 92.87¢ per $1 |
| Gini / Inequality Index | 23,340 | 0.42 |
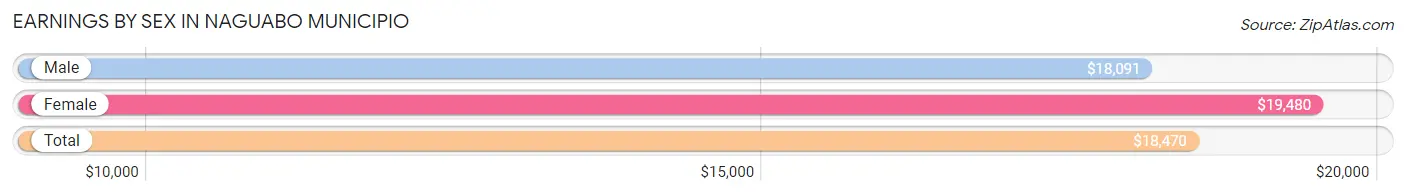
Earnings by Sex in Naguabo Municipio
Average Earnings in Naguabo Municipio are $18,470, $18,091 for men and $19,480 for women, a difference of 7.1%.
| Sex | Number | Average Earnings |
| Male | 4,425 (59.9%) | $18,091 |
| Female | 2,960 (40.1%) | $19,480 |
| Total | 7,385 (100.0%) | $18,470 |
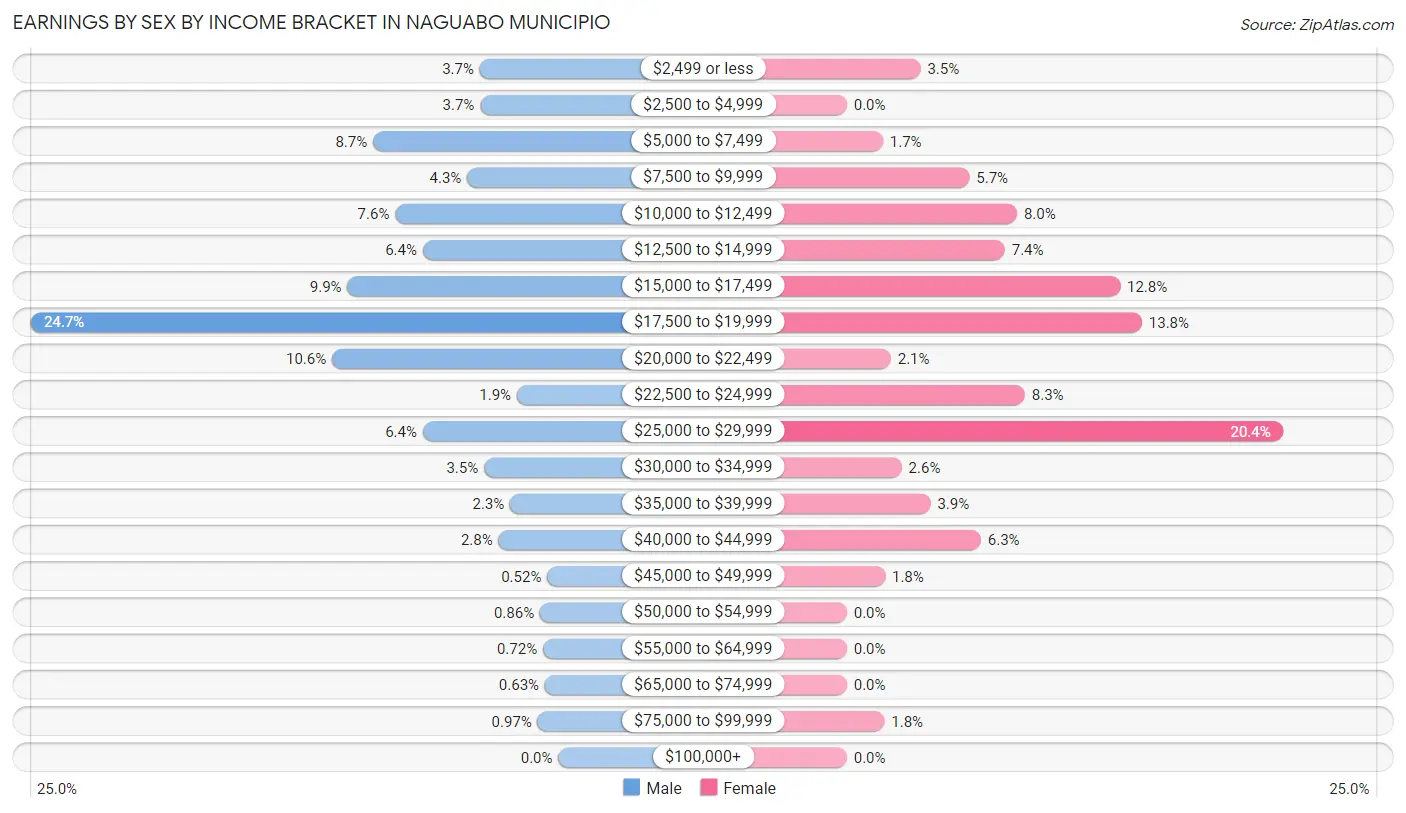
Earnings by Sex by Income Bracket in Naguabo Municipio
The most common earnings brackets in Naguabo Municipio are $17,500 to $19,999 for men (1,093 | 24.7%) and $25,000 to $29,999 for women (604 | 20.4%).
| Income | Male | Female |
| $2,499 or less | 163 (3.7%) | 102 (3.5%) |
| $2,500 to $4,999 | 162 (3.7%) | 0 (0.0%) |
| $5,000 to $7,499 | 384 (8.7%) | 50 (1.7%) |
| $7,500 to $9,999 | 189 (4.3%) | 170 (5.7%) |
| $10,000 to $12,499 | 338 (7.6%) | 236 (8.0%) |
| $12,500 to $14,999 | 281 (6.4%) | 219 (7.4%) |
| $15,000 to $17,499 | 437 (9.9%) | 379 (12.8%) |
| $17,500 to $19,999 | 1,093 (24.7%) | 409 (13.8%) |
| $20,000 to $22,499 | 469 (10.6%) | 61 (2.1%) |
| $22,500 to $24,999 | 86 (1.9%) | 247 (8.3%) |
| $25,000 to $29,999 | 281 (6.4%) | 604 (20.4%) |
| $30,000 to $34,999 | 154 (3.5%) | 76 (2.6%) |
| $35,000 to $39,999 | 100 (2.3%) | 116 (3.9%) |
| $40,000 to $44,999 | 124 (2.8%) | 186 (6.3%) |
| $45,000 to $49,999 | 23 (0.5%) | 53 (1.8%) |
| $50,000 to $54,999 | 38 (0.9%) | 0 (0.0%) |
| $55,000 to $64,999 | 32 (0.7%) | 0 (0.0%) |
| $65,000 to $74,999 | 28 (0.6%) | 0 (0.0%) |
| $75,000 to $99,999 | 43 (1.0%) | 52 (1.8%) |
| $100,000+ | 0 (0.0%) | 0 (0.0%) |
| Total | 4,425 (100.0%) | 2,960 (100.0%) |
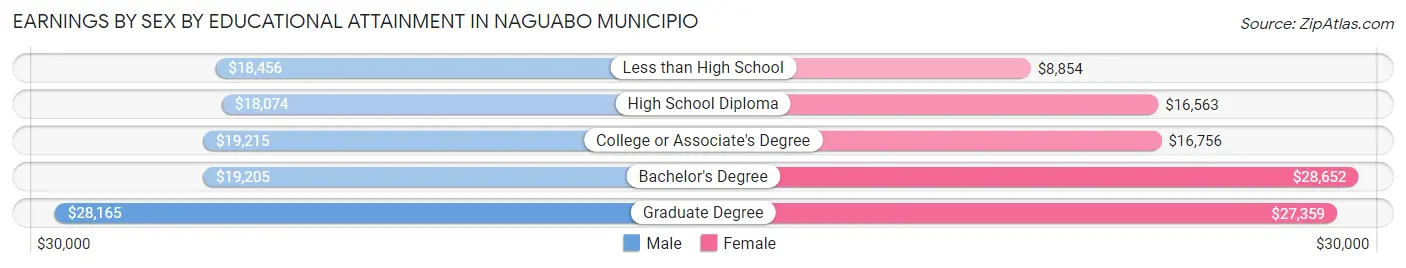
Earnings by Sex by Educational Attainment in Naguabo Municipio
Average earnings in Naguabo Municipio are $18,593 for men and $19,952 for women, a difference of 6.8%. Men with an educational attainment of graduate degree enjoy the highest average annual earnings of $28,165, while those with high school diploma education earn the least with $18,074. Women with an educational attainment of bachelor's degree earn the most with the average annual earnings of $28,652, while those with less than high school education have the smallest earnings of $8,854.
| Educational Attainment | Male Income | Female Income |
| Less than High School | $18,456 | $8,854 |
| High School Diploma | $18,074 | $16,563 |
| College or Associate's Degree | $19,215 | $16,756 |
| Bachelor's Degree | $19,205 | $28,652 |
| Graduate Degree | $28,165 | $27,359 |
| Total | $18,593 | $19,952 |
Family Income in Naguabo Municipio
Family Income Brackets in Naguabo Municipio
According to the Naguabo Municipio family income data, there are 1,282 families falling into the $15,000 to $24,999 income range, which is the most common income bracket and makes up 23.8% of all families.
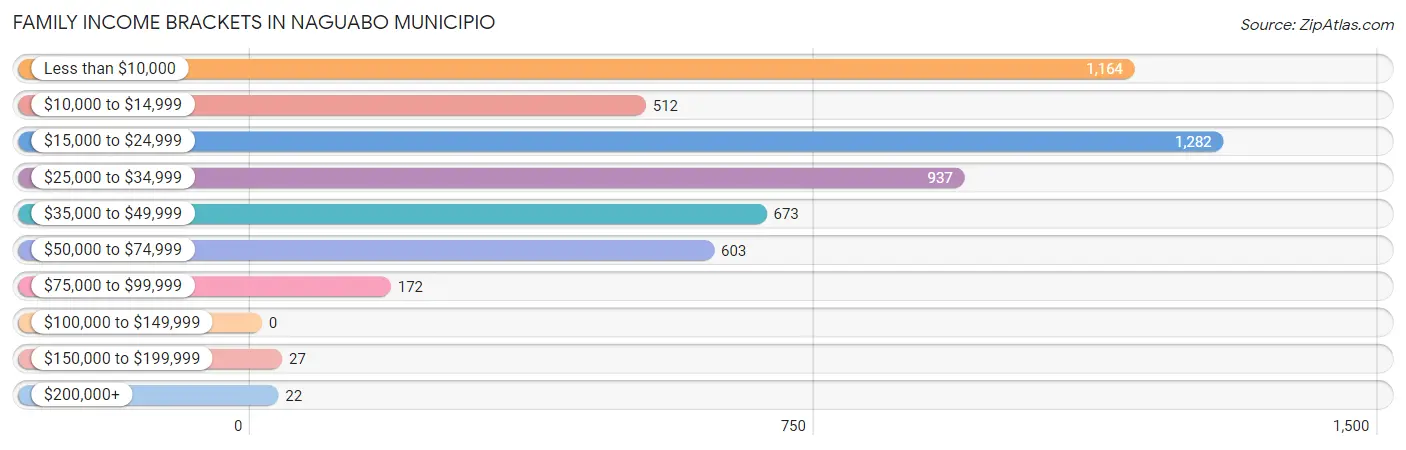
| Income Bracket | # Families | % Families |
| Less than $10,000 | 1,164 | 21.6% |
| $10,000 to $14,999 | 512 | 9.5% |
| $15,000 to $24,999 | 1,282 | 23.8% |
| $25,000 to $34,999 | 937 | 17.4% |
| $35,000 to $49,999 | 673 | 12.5% |
| $50,000 to $74,999 | 603 | 11.2% |
| $75,000 to $99,999 | 172 | 3.2% |
| $100,000 to $149,999 | 0 | 0.0% |
| $150,000 to $199,999 | 27 | 0.5% |
| $200,000+ | 22 | 0.4% |
Family Income by Famaliy Size in Naguabo Municipio
5-person families (168 | 3.1%) account for the highest median family income in Naguabo Municipio with $33,065 per family, while 2-person families (3,101 | 57.6%) have the highest median income of $11,136 per family member.
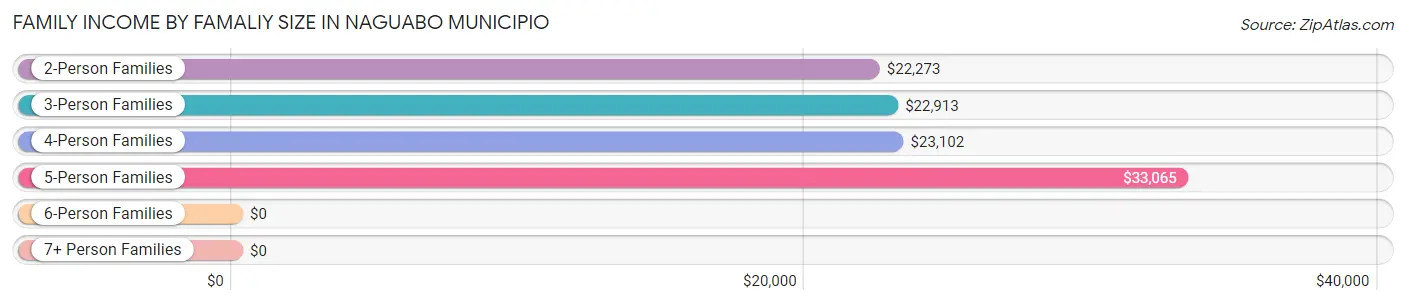
| Income Bracket | # Families | Median Income |
| 2-Person Families | 3,101 (57.6%) | $22,273 |
| 3-Person Families | 1,231 (22.9%) | $22,913 |
| 4-Person Families | 731 (13.6%) | $23,102 |
| 5-Person Families | 168 (3.1%) | $33,065 |
| 6-Person Families | 133 (2.5%) | $0 |
| 7+ Person Families | 23 (0.4%) | $0 |
| Total | 5,387 (100.0%) | $22,616 |
Family Income by Number of Earners in Naguabo Municipio
The median family income in Naguabo Municipio is $22,616, with families comprising 3+ earners (189) having the highest median family income of $50,404, while families with no earners (2,606) have the lowest median family income of $15,872, accounting for 3.5% and 48.4% of families, respectively.
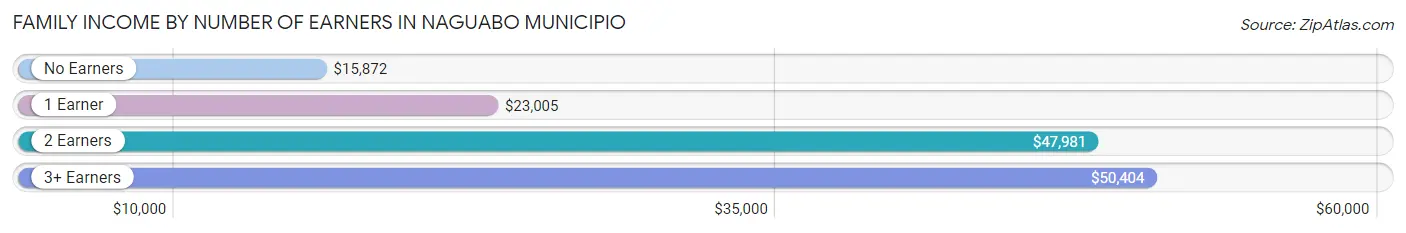
| Number of Earners | # Families | Median Income |
| No Earners | 2,606 (48.4%) | $15,872 |
| 1 Earner | 1,824 (33.9%) | $23,005 |
| 2 Earners | 768 (14.3%) | $47,981 |
| 3+ Earners | 189 (3.5%) | $50,404 |
| Total | 5,387 (100.0%) | $22,616 |
Household Income in Naguabo Municipio
Household Income Brackets in Naguabo Municipio
With 2,361 households falling in the category, the $15,000 to $24,999 income range is the most frequent in Naguabo Municipio, accounting for 28.9% of all households.
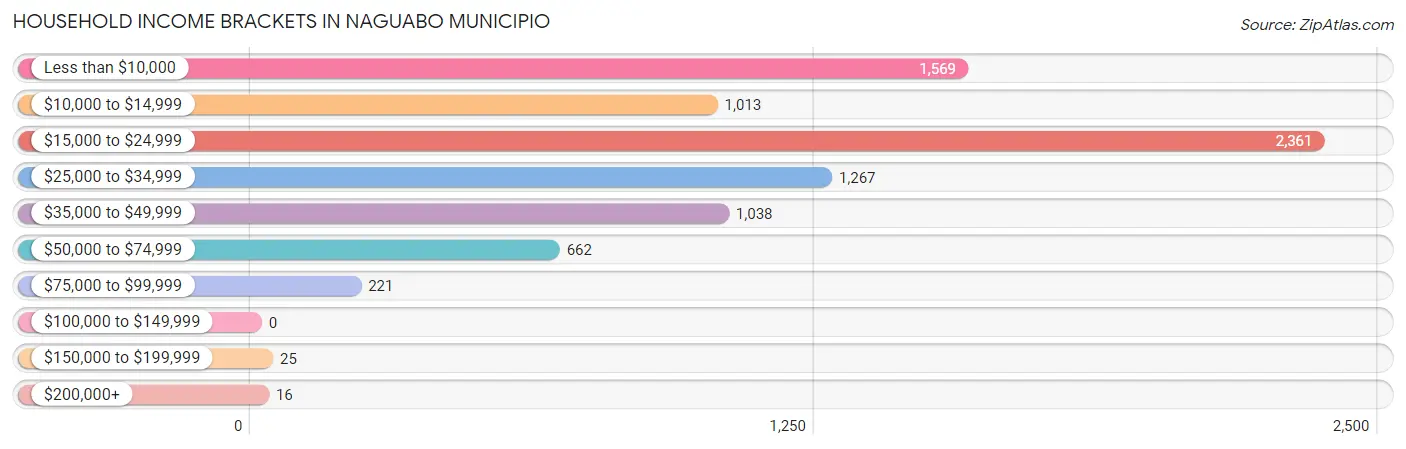
| Income Bracket | # Households | % Households |
| Less than $10,000 | 1,569 | 19.2% |
| $10,000 to $14,999 | 1,013 | 12.4% |
| $15,000 to $24,999 | 2,361 | 28.9% |
| $25,000 to $34,999 | 1,267 | 15.5% |
| $35,000 to $49,999 | 1,038 | 12.7% |
| $50,000 to $74,999 | 662 | 8.1% |
| $75,000 to $99,999 | 221 | 2.7% |
| $100,000 to $149,999 | 0 | 0.0% |
| $150,000 to $199,999 | 25 | 0.3% |
| $200,000+ | 16 | 0.2% |
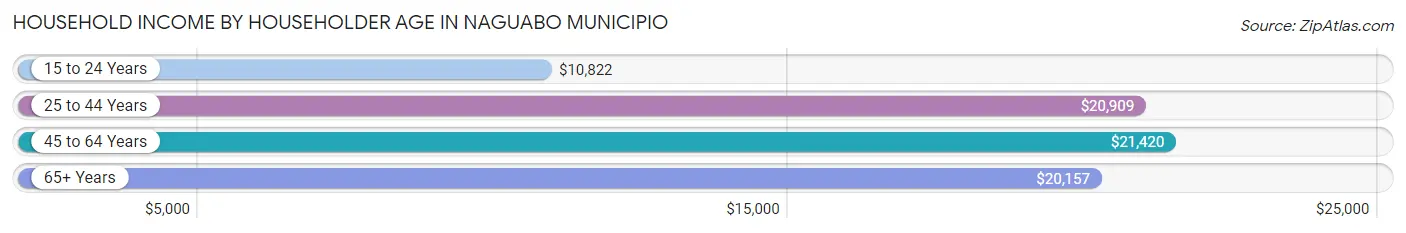
Household Income by Householder Age in Naguabo Municipio
The median household income in Naguabo Municipio is $20,486, with the highest median household income of $21,420 found in the 45 to 64 years age bracket for the primary householder. A total of 3,071 households (37.6%) fall into this category. Meanwhile, the 15 to 24 years age bracket for the primary householder has the lowest median household income of $10,822, with 157 households (1.9%) in this group.
| Income Bracket | # Households | Median Income |
| 15 to 24 Years | 157 (1.9%) | $10,822 |
| 25 to 44 Years | 2,187 (26.8%) | $20,909 |
| 45 to 64 Years | 3,071 (37.6%) | $21,420 |
| 65+ Years | 2,756 (33.7%) | $20,157 |
| Total | 8,171 (100.0%) | $20,486 |
Poverty in Naguabo Municipio
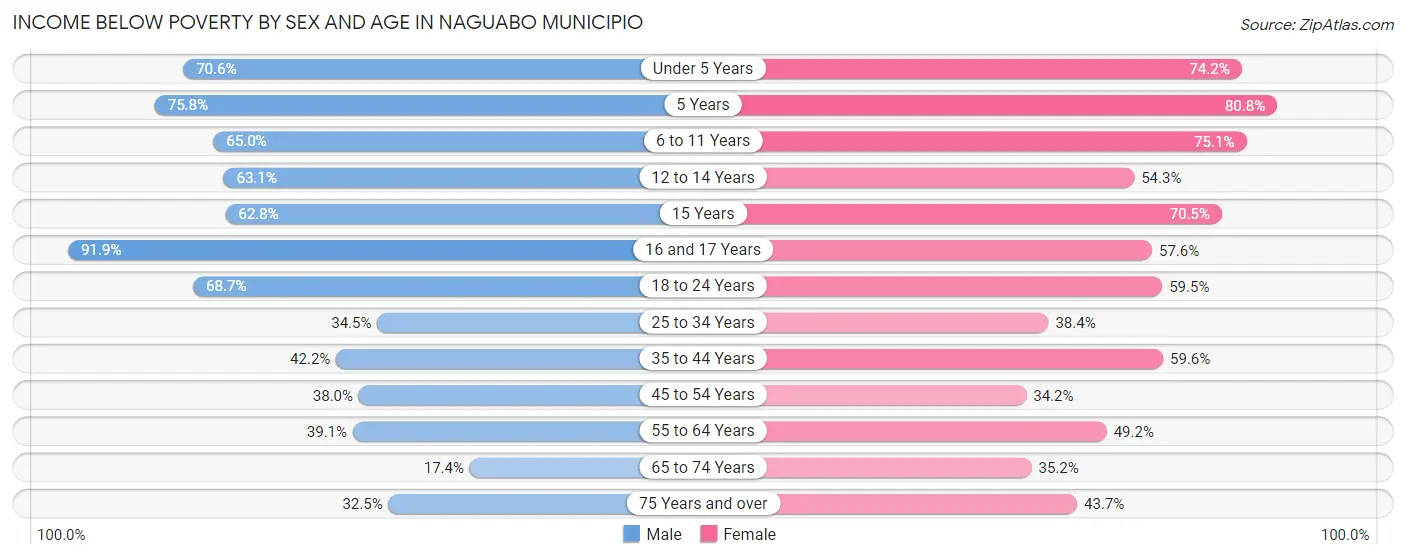
Income Below Poverty by Sex and Age in Naguabo Municipio
With 46.0% poverty level for males and 49.7% for females among the residents of Naguabo Municipio, 16 and 17 year old males and 5 year old females are the most vulnerable to poverty, with 365 males (91.9%) and 147 females (80.8%) in their respective age groups living below the poverty level.
| Age Bracket | Male | Female |
| Under 5 Years | 321 (70.6%) | 316 (74.2%) |
| 5 Years | 91 (75.8%) | 147 (80.8%) |
| 6 to 11 Years | 667 (64.9%) | 605 (75.1%) |
| 12 to 14 Years | 152 (63.1%) | 203 (54.3%) |
| 15 Years | 128 (62.7%) | 91 (70.5%) |
| 16 and 17 Years | 365 (91.9%) | 148 (57.6%) |
| 18 to 24 Years | 751 (68.7%) | 668 (59.5%) |
| 25 to 34 Years | 507 (34.5%) | 679 (38.4%) |
| 35 to 44 Years | 587 (42.2%) | 1,052 (59.6%) |
| 45 to 54 Years | 514 (38.0%) | 555 (34.2%) |
| 55 to 64 Years | 463 (39.1%) | 693 (49.2%) |
| 65 to 74 Years | 194 (17.4%) | 451 (35.2%) |
| 75 Years and over | 285 (32.5%) | 522 (43.7%) |
| Total | 5,025 (46.0%) | 6,130 (49.7%) |
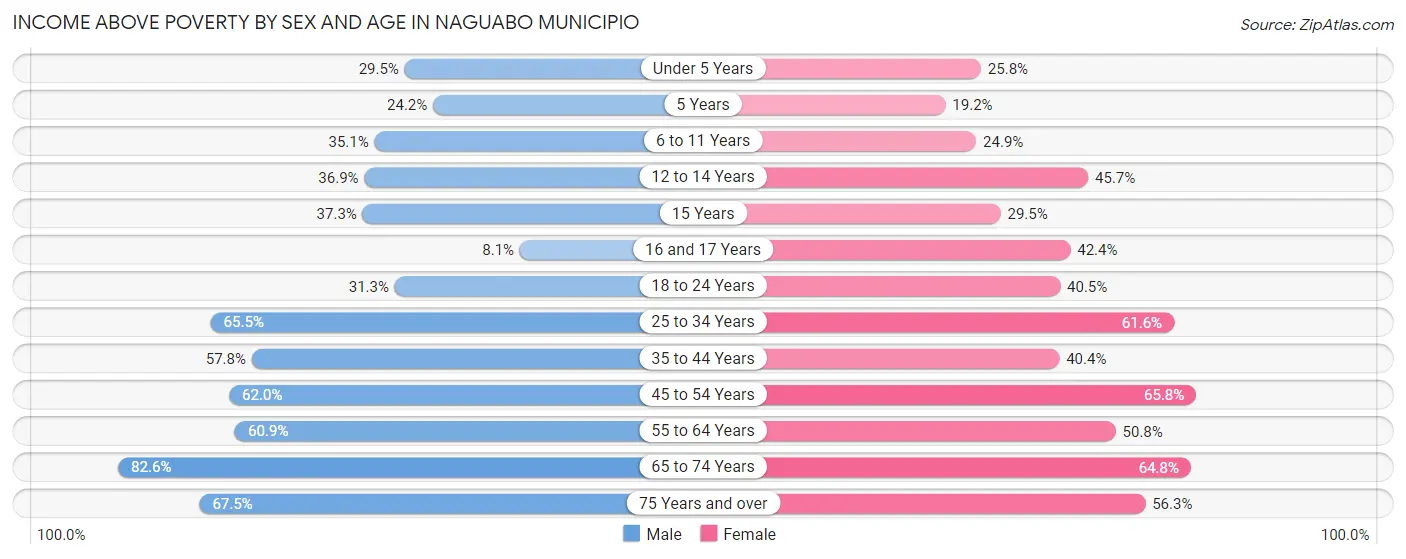
Income Above Poverty by Sex and Age in Naguabo Municipio
According to the poverty statistics in Naguabo Municipio, males aged 65 to 74 years and females aged 45 to 54 years are the age groups that are most secure financially, with 82.6% of males and 65.8% of females in these age groups living above the poverty line.
| Age Bracket | Male | Female |
| Under 5 Years | 134 (29.4%) | 110 (25.8%) |
| 5 Years | 29 (24.2%) | 35 (19.2%) |
| 6 to 11 Years | 360 (35.0%) | 201 (24.9%) |
| 12 to 14 Years | 89 (36.9%) | 171 (45.7%) |
| 15 Years | 76 (37.2%) | 38 (29.5%) |
| 16 and 17 Years | 32 (8.1%) | 109 (42.4%) |
| 18 to 24 Years | 342 (31.3%) | 455 (40.5%) |
| 25 to 34 Years | 961 (65.5%) | 1,091 (61.6%) |
| 35 to 44 Years | 805 (57.8%) | 712 (40.4%) |
| 45 to 54 Years | 840 (62.0%) | 1,066 (65.8%) |
| 55 to 64 Years | 722 (60.9%) | 716 (50.8%) |
| 65 to 74 Years | 923 (82.6%) | 829 (64.8%) |
| 75 Years and over | 593 (67.5%) | 673 (56.3%) |
| Total | 5,906 (54.0%) | 6,206 (50.3%) |
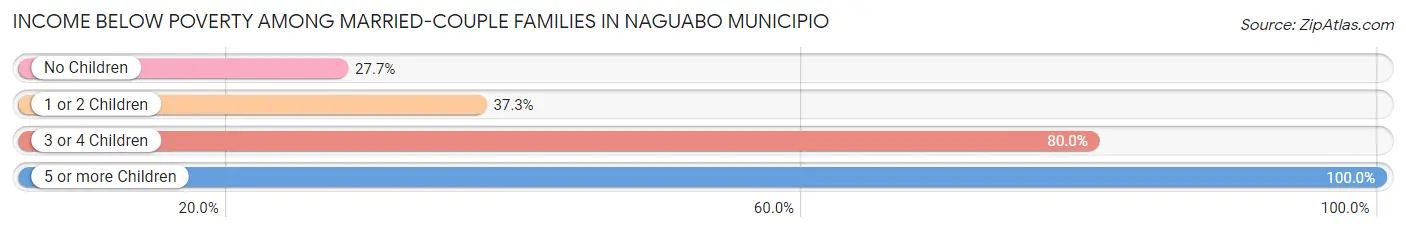
Income Below Poverty Among Married-Couple Families in Naguabo Municipio
The poverty statistics for married-couple families in Naguabo Municipio show that 32.3% or 844 of the total 2,617 families live below the poverty line. Families with 5 or more children have the highest poverty rate of 100.0%, comprising of 23 families. On the other hand, families with no children have the lowest poverty rate of 27.7%, which includes 538 families.
| Children | Above Poverty | Below Poverty |
| No Children | 1,406 (72.3%) | 538 (27.7%) |
| 1 or 2 Children | 348 (62.7%) | 207 (37.3%) |
| 3 or 4 Children | 19 (20.0%) | 76 (80.0%) |
| 5 or more Children | 0 (0.0%) | 23 (100.0%) |
| Total | 1,773 (67.7%) | 844 (32.3%) |
Income Below Poverty Among Single-Parent Households in Naguabo Municipio
According to the poverty data in Naguabo Municipio, 34.2% or 149 single-father households and 61.2% or 1,429 single-mother households are living below the poverty line. Among single-father households, those with 1 or 2 children have the highest poverty rate, with 75 households (38.3%) experiencing poverty. Likewise, among single-mother households, those with 3 or 4 children have the highest poverty rate, with 166 households (100.0%) falling below the poverty line.
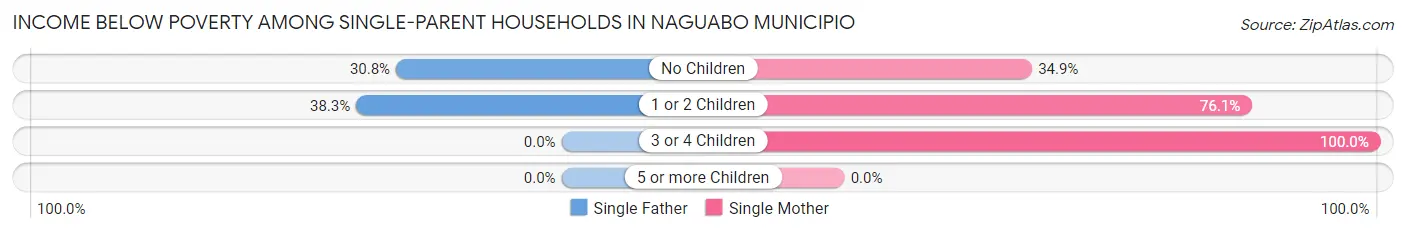
| Children | Single Father | Single Mother |
| No Children | 74 (30.8%) | 328 (34.9%) |
| 1 or 2 Children | 75 (38.3%) | 935 (76.1%) |
| 3 or 4 Children | 0 (0.0%) | 166 (100.0%) |
| 5 or more Children | 0 (0.0%) | 0 (0.0%) |
| Total | 149 (34.2%) | 1,429 (61.2%) |
Income Below Poverty Among Married-Couple vs Single-Parent Households in Naguabo Municipio
The poverty data for Naguabo Municipio shows that 844 of the married-couple family households (32.3%) and 1,578 of the single-parent households (57.0%) are living below the poverty level. Within the married-couple family households, those with 5 or more children have the highest poverty rate, with 23 households (100.0%) falling below the poverty line. Among the single-parent households, those with 3 or 4 children have the highest poverty rate, with 166 household (100.0%) living below poverty.
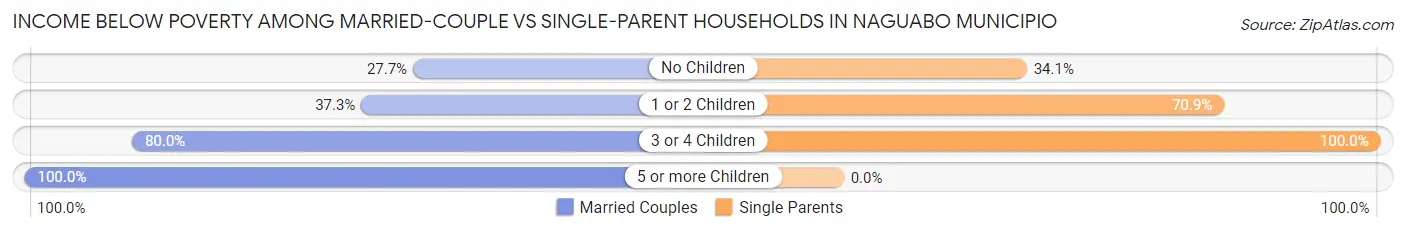
| Children | Married-Couple Families | Single-Parent Households |
| No Children | 538 (27.7%) | 402 (34.1%) |
| 1 or 2 Children | 207 (37.3%) | 1,010 (70.9%) |
| 3 or 4 Children | 76 (80.0%) | 166 (100.0%) |
| 5 or more Children | 23 (100.0%) | 0 (0.0%) |
| Total | 844 (32.3%) | 1,578 (57.0%) |
Race in Naguabo Municipio
The most populous races in Naguabo Municipio are Hispanic or Latino (23,107 | 99.0%), Some other Race (13,604 | 58.3%), and White / Caucasian (7,887 | 33.8%).
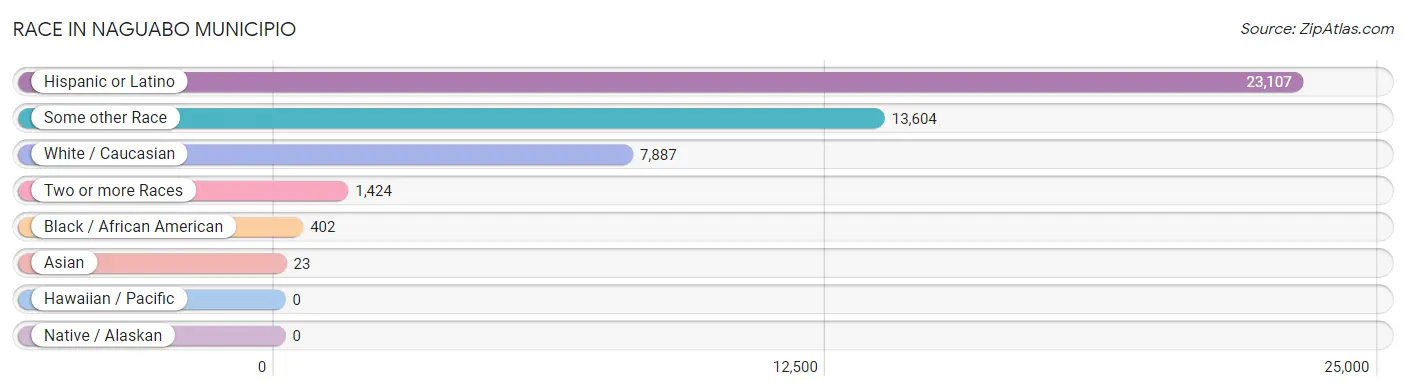
| Race | # Population | % Population |
| Asian | 23 | 0.1% |
| Black / African American | 402 | 1.7% |
| Hawaiian / Pacific | 0 | 0.0% |
| Hispanic or Latino | 23,107 | 99.0% |
| Native / Alaskan | 0 | 0.0% |
| White / Caucasian | 7,887 | 33.8% |
| Two or more Races | 1,424 | 6.1% |
| Some other Race | 13,604 | 58.3% |
| Total | 23,340 | 100.0% |
Ancestry in Naguabo Municipio
The most populous ancestries reported in Naguabo Municipio are Puerto Rican (22,804 | 97.7%), American (271 | 1.2%), Thai (160 | 0.7%), Central American (105 | 0.4%), and Costa Rican (78 | 0.3%), together accounting for 100.3% of all Naguabo Municipio residents.
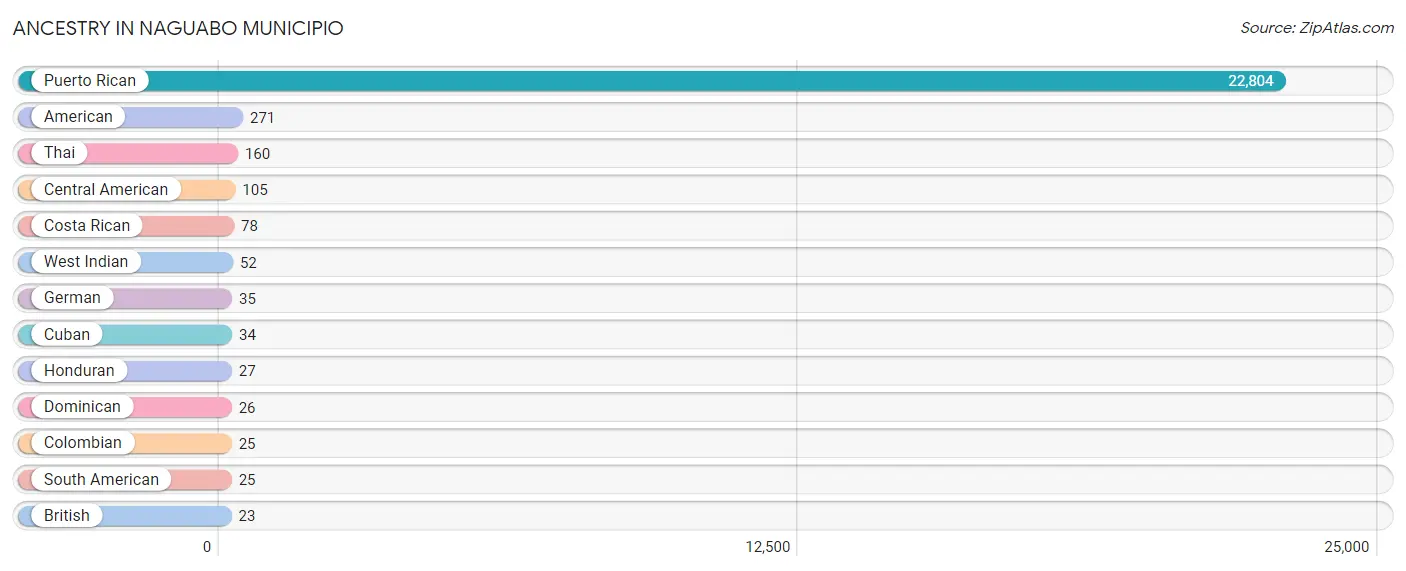
| Ancestry | # Population | % Population |
| American | 271 | 1.2% |
| British | 23 | 0.1% |
| Central American | 105 | 0.4% |
| Colombian | 25 | 0.1% |
| Costa Rican | 78 | 0.3% |
| Cuban | 34 | 0.2% |
| Dominican | 26 | 0.1% |
| German | 35 | 0.2% |
| Honduran | 27 | 0.1% |
| Puerto Rican | 22,804 | 97.7% |
| South American | 25 | 0.1% |
| Thai | 160 | 0.7% |
| West Indian | 52 | 0.2% | View All 13 Rows |
Immigrants in Naguabo Municipio

| Immigration Origin | # Population | % Population | View All 0 Rows |
Sex and Age in Naguabo Municipio
Sex and Age in Naguabo Municipio
The most populous age groups in Naguabo Municipio are 15 to 19 Years (956 | 8.7%) for men and 25 to 29 Years (924 | 7.5%) for women.
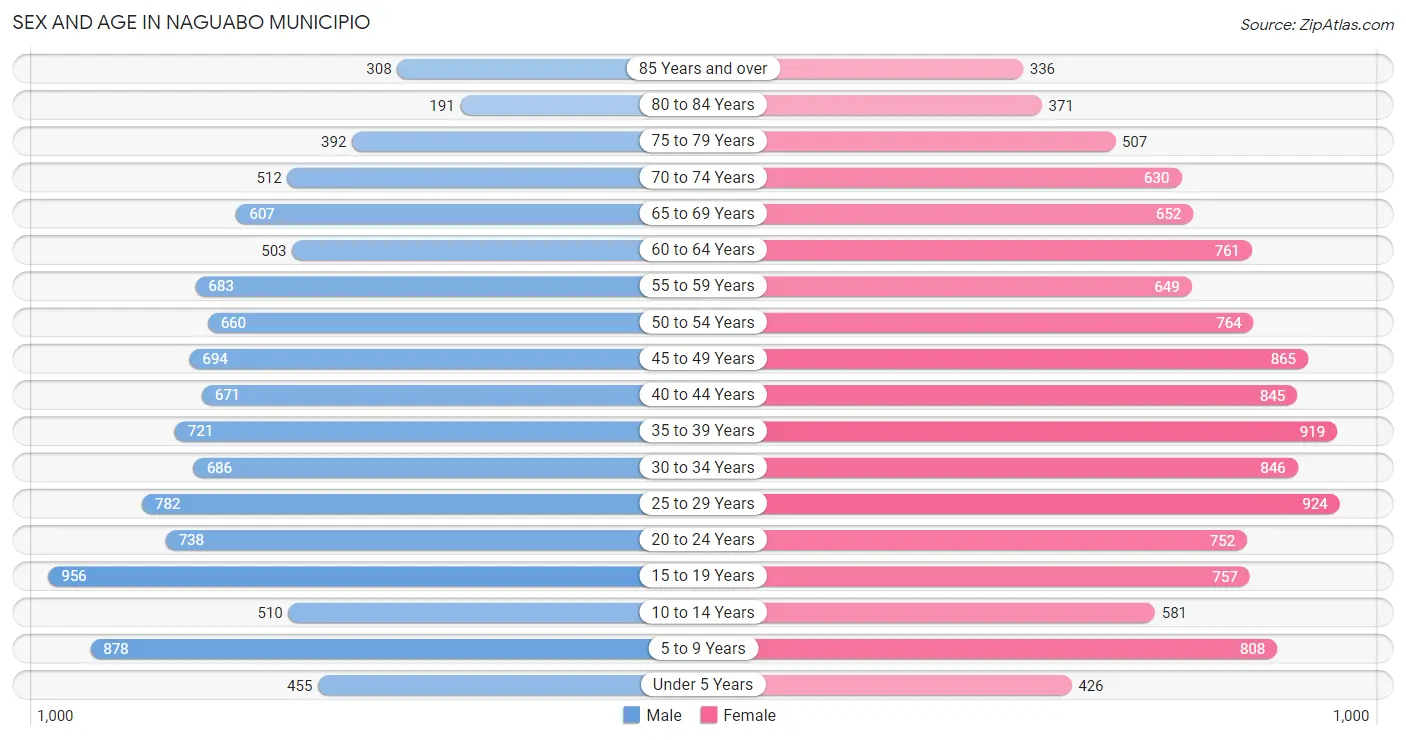
| Age Bracket | Male | Female |
| Under 5 Years | 455 (4.2%) | 426 (3.4%) |
| 5 to 9 Years | 878 (8.0%) | 808 (6.5%) |
| 10 to 14 Years | 510 (4.7%) | 581 (4.7%) |
| 15 to 19 Years | 956 (8.7%) | 757 (6.1%) |
| 20 to 24 Years | 738 (6.7%) | 752 (6.1%) |
| 25 to 29 Years | 782 (7.1%) | 924 (7.5%) |
| 30 to 34 Years | 686 (6.3%) | 846 (6.8%) |
| 35 to 39 Years | 721 (6.6%) | 919 (7.4%) |
| 40 to 44 Years | 671 (6.1%) | 845 (6.8%) |
| 45 to 49 Years | 694 (6.3%) | 865 (7.0%) |
| 50 to 54 Years | 660 (6.0%) | 764 (6.2%) |
| 55 to 59 Years | 683 (6.2%) | 649 (5.2%) |
| 60 to 64 Years | 503 (4.6%) | 761 (6.1%) |
| 65 to 69 Years | 607 (5.5%) | 652 (5.3%) |
| 70 to 74 Years | 512 (4.7%) | 630 (5.1%) |
| 75 to 79 Years | 392 (3.6%) | 507 (4.1%) |
| 80 to 84 Years | 191 (1.7%) | 371 (3.0%) |
| 85 Years and over | 308 (2.8%) | 336 (2.7%) |
| Total | 10,947 (100.0%) | 12,393 (100.0%) |
Families and Households in Naguabo Municipio
Median Family Size in Naguabo Municipio
The median family size in Naguabo Municipio is 3.51 persons per family, with single male/father families (436 | 8.1%) accounting for the largest median family size of 3.86 persons per family. On the other hand, married-couple families (2,617 | 48.6%) represent the smallest median family size with 3.29 persons per family.
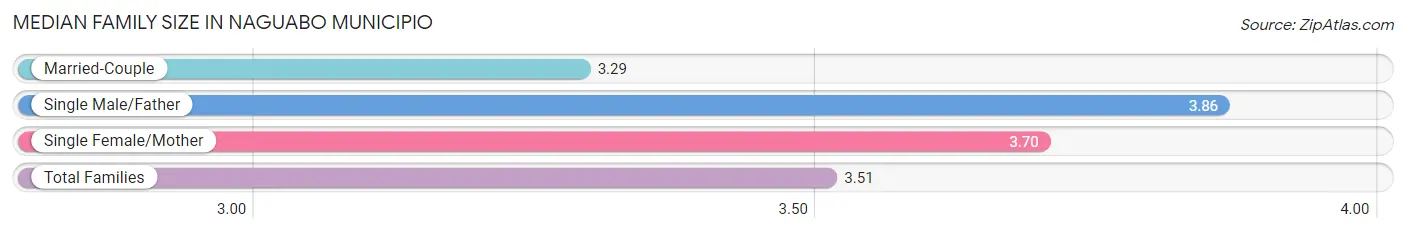
| Family Type | # Families | Family Size |
| Married-Couple | 2,617 (48.6%) | 3.29 |
| Single Male/Father | 436 (8.1%) | 3.86 |
| Single Female/Mother | 2,334 (43.3%) | 3.70 |
| Total Families | 5,387 (100.0%) | 3.51 |
Median Household Size in Naguabo Municipio
The median household size in Naguabo Municipio is 2.85 persons per household, with single male/father households (436 | 5.3%) accounting for the largest median household size of 4.36 persons per household. non-family households (2,784 | 34.1%) represent the smallest median household size with 1.28 persons per household.
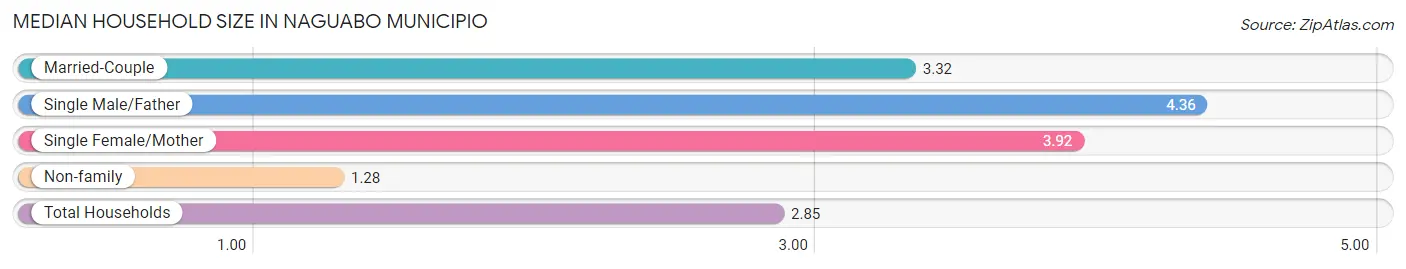
| Household Type | # Households | Household Size |
| Married-Couple | 2,617 (32.0%) | 3.32 |
| Single Male/Father | 436 (5.3%) | 4.36 |
| Single Female/Mother | 2,334 (28.6%) | 3.92 |
| Non-family | 2,784 (34.1%) | 1.28 |
| Total Households | 8,171 (100.0%) | 2.85 |
Household Size by Marriage Status in Naguabo Municipio
Out of a total of 8,171 households in Naguabo Municipio, 5,387 (65.9%) are family households, while 2,784 (34.1%) are nonfamily households. The most numerous type of family households are 2-person households, comprising 2,676, and the most common type of nonfamily households are 1-person households, comprising 2,128.
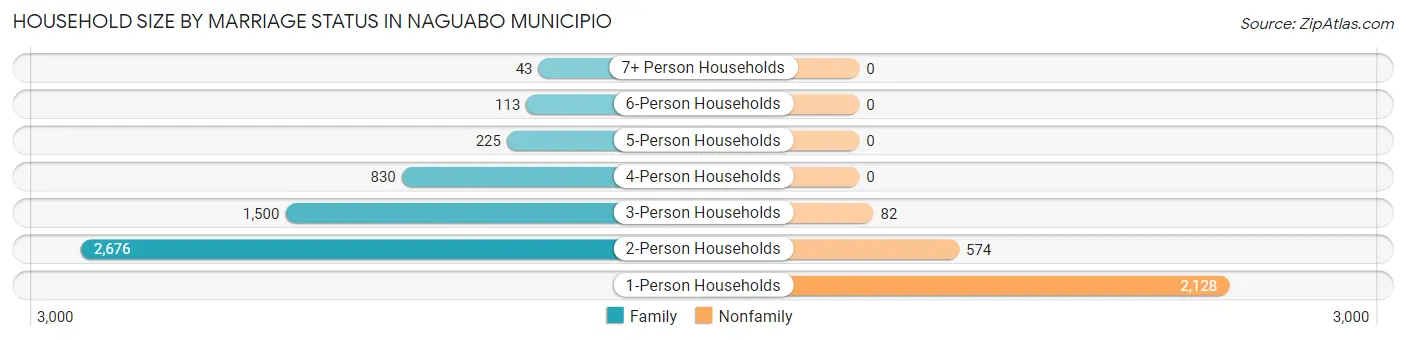
| Household Size | Family Households | Nonfamily Households |
| 1-Person Households | - | 2,128 (26.0%) |
| 2-Person Households | 2,676 (32.8%) | 574 (7.0%) |
| 3-Person Households | 1,500 (18.4%) | 82 (1.0%) |
| 4-Person Households | 830 (10.2%) | 0 (0.0%) |
| 5-Person Households | 225 (2.8%) | 0 (0.0%) |
| 6-Person Households | 113 (1.4%) | 0 (0.0%) |
| 7+ Person Households | 43 (0.5%) | 0 (0.0%) |
| Total | 5,387 (65.9%) | 2,784 (34.1%) |
Female Fertility in Naguabo Municipio
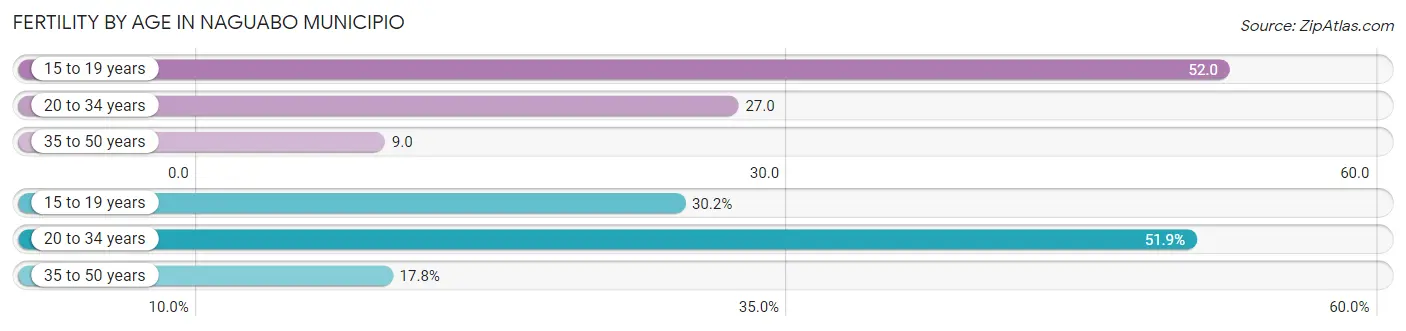
Fertility by Age in Naguabo Municipio
Average fertility rate in Naguabo Municipio is 22.0 births per 1,000 women. Women in the age bracket of 15 to 19 years have the highest fertility rate with 52.0 births per 1,000 women. Women in the age bracket of 20 to 34 years acount for 51.9% of all women with births.
| Age Bracket | Women with Births | Births / 1,000 Women |
| 15 to 19 years | 39 (30.2%) | 52.0 |
| 20 to 34 years | 67 (51.9%) | 27.0 |
| 35 to 50 years | 23 (17.8%) | 9.0 |
| Total | 129 (100.0%) | 22.0 |
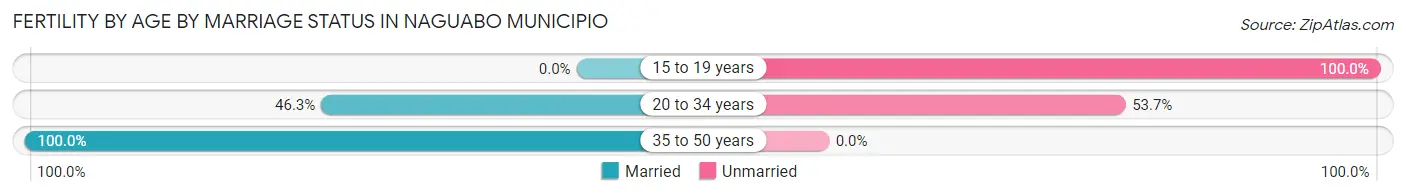
Fertility by Age by Marriage Status in Naguabo Municipio
41.9% of women with births (129) in Naguabo Municipio are married. The highest percentage of unmarried women with births falls into 15 to 19 years age bracket with 100.0% of them unmarried at the time of birth, while the lowest percentage of unmarried women with births belong to 35 to 50 years age bracket with 0.0% of them unmarried.
| Age Bracket | Married | Unmarried |
| 15 to 19 years | 0 (0.0%) | 39 (100.0%) |
| 20 to 34 years | 31 (46.3%) | 36 (53.7%) |
| 35 to 50 years | 23 (100.0%) | 0 (0.0%) |
| Total | 54 (41.9%) | 75 (58.1%) |
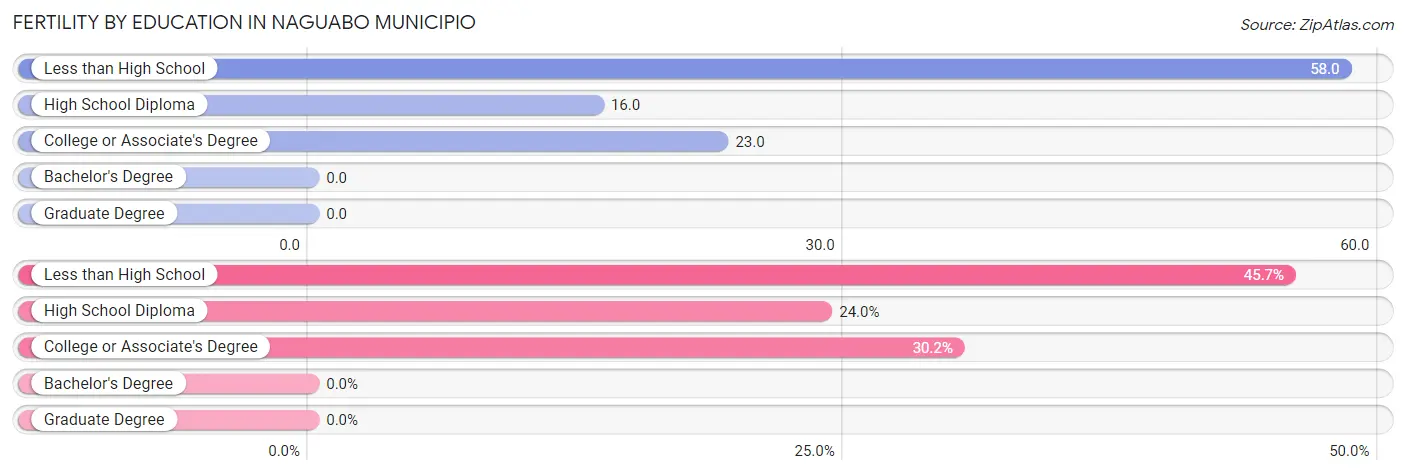
Fertility by Education in Naguabo Municipio
| Educational Attainment | Women with Births | Births / 1,000 Women |
| Less than High School | 59 (45.7%) | 58.0 |
| High School Diploma | 31 (24.0%) | 16.0 |
| College or Associate's Degree | 39 (30.2%) | 23.0 |
| Bachelor's Degree | 0 (0.0%) | 0.0 |
| Graduate Degree | 0 (0.0%) | 0.0 |
| Total | 129 (100.0%) | 22.0 |
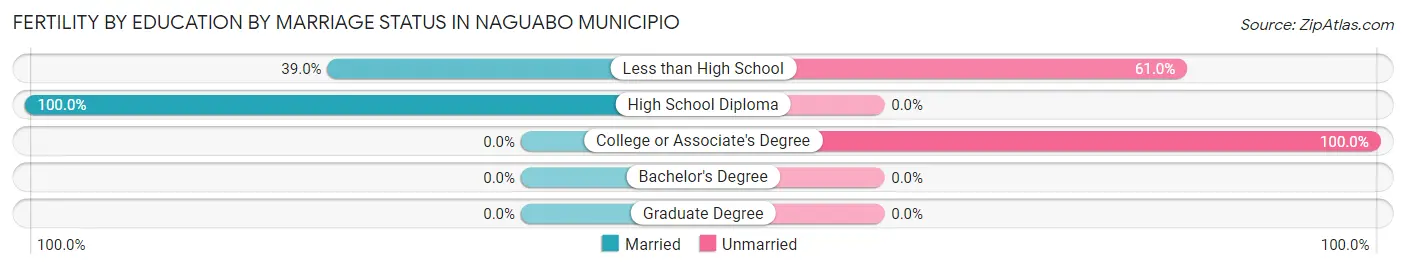
Fertility by Education by Marriage Status in Naguabo Municipio
58.1% of women with births in Naguabo Municipio are unmarried. Women with the educational attainment of high school diploma are most likely to be married with 100.0% of them married at childbirth, while women with the educational attainment of college or associate's degree are least likely to be married with 100.0% of them unmarried at childbirth.
| Educational Attainment | Married | Unmarried |
| Less than High School | 23 (39.0%) | 36 (61.0%) |
| High School Diploma | 31 (100.0%) | 0 (0.0%) |
| College or Associate's Degree | 0 (0.0%) | 39 (100.0%) |
| Bachelor's Degree | 0 (0.0%) | 0 (0.0%) |
| Graduate Degree | 0 (0.0%) | 0 (0.0%) |
| Total | 54 (41.9%) | 75 (58.1%) |
Employment Characteristics in Naguabo Municipio
Employment by Class of Employer in Naguabo Municipio
Among the 6,753 employed individuals in Naguabo Municipio, private company employees (4,141 | 61.3%), self-employed (not incorporated) (842 | 12.5%), and local government employees (540 | 8.0%) make up the most common classes of employment.
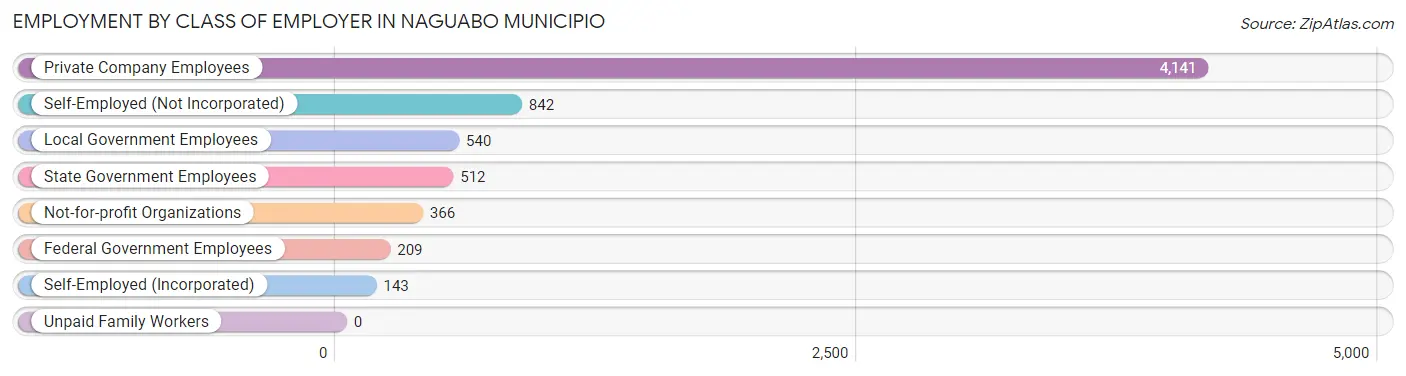
| Employer Class | # Employees | % Employees |
| Private Company Employees | 4,141 | 61.3% |
| Self-Employed (Incorporated) | 143 | 2.1% |
| Self-Employed (Not Incorporated) | 842 | 12.5% |
| Not-for-profit Organizations | 366 | 5.4% |
| Local Government Employees | 540 | 8.0% |
| State Government Employees | 512 | 7.6% |
| Federal Government Employees | 209 | 3.1% |
| Unpaid Family Workers | 0 | 0.0% |
| Total | 6,753 | 100.0% |
Employment Status by Age in Naguabo Municipio
According to the labor force statistics for Naguabo Municipio, out of the total population over 16 years of age (19,349), 39.3% or 7,604 individuals are in the labor force, with 10.0% or 760 of them unemployed. The age group with the highest labor force participation rate is 30 to 34 years, with 73.0% or 1,118 individuals in the labor force. Within the labor force, the 20 to 24 years age range has the highest percentage of unemployed individuals, with 40.5% or 297 of them being unemployed.
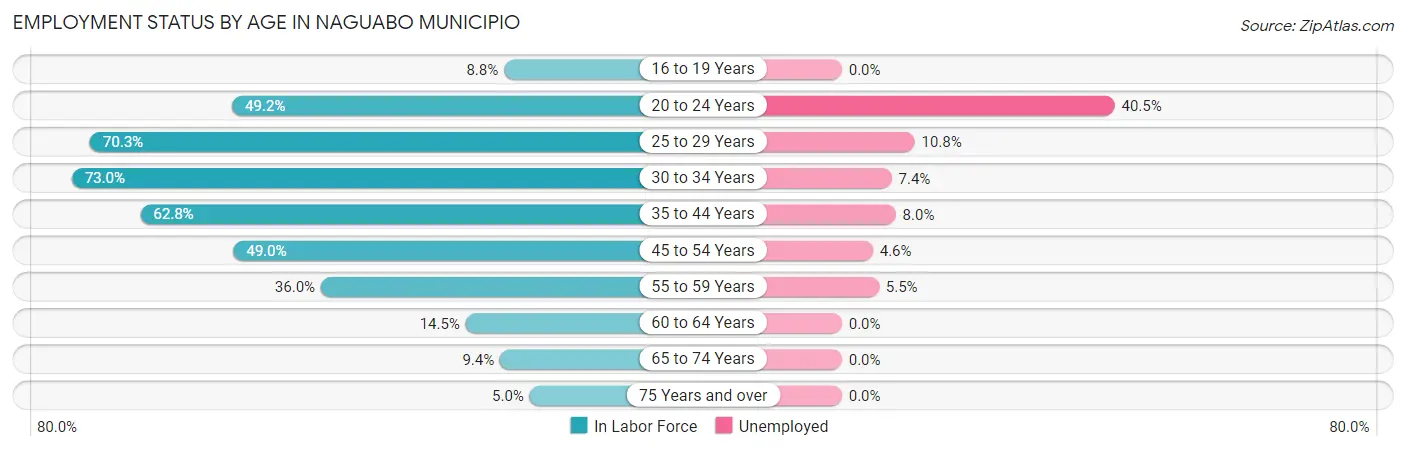
| Age Bracket | In Labor Force | Unemployed |
| 16 to 19 Years | 121 (8.8%) | 0 (0.0%) |
| 20 to 24 Years | 733 (49.2%) | 297 (40.5%) |
| 25 to 29 Years | 1,199 (70.3%) | 129 (10.8%) |
| 30 to 34 Years | 1,118 (73.0%) | 83 (7.4%) |
| 35 to 44 Years | 1,982 (62.8%) | 159 (8.0%) |
| 45 to 54 Years | 1,462 (49.0%) | 67 (4.6%) |
| 55 to 59 Years | 480 (36.0%) | 26 (5.5%) |
| 60 to 64 Years | 183 (14.5%) | 0 (0.0%) |
| 65 to 74 Years | 226 (9.4%) | 0 (0.0%) |
| 75 Years and over | 105 (5.0%) | 0 (0.0%) |
| Total | 7,604 (39.3%) | 760 (10.0%) |
Employment Status by Educational Attainment in Naguabo Municipio
According to labor force statistics for Naguabo Municipio, 53.7% of individuals (6,430) out of the total population between 25 and 64 years of age (11,973) are in the labor force, with 7.2% or 463 of them being unemployed. The group with the highest labor force participation rate are those with the educational attainment of college / associate degree, with 64.7% or 1,668 individuals in the labor force. Within the labor force, individuals with high school diploma education have the highest percentage of unemployment, with 15.5% or 362 of them being unemployed.
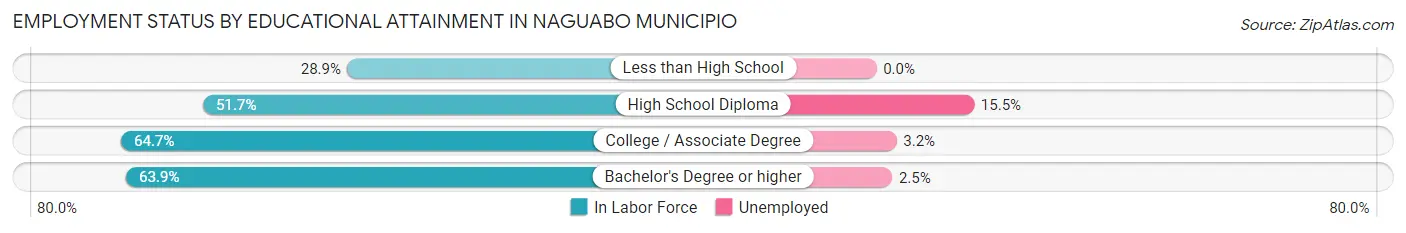
| Educational Attainment | In Labor Force | Unemployed |
| Less than High School | 572 (28.9%) | 0 (0.0%) |
| High School Diploma | 2,336 (51.7%) | 700 (15.5%) |
| College / Associate Degree | 1,668 (64.7%) | 82 (3.2%) |
| Bachelor's Degree or higher | 1,851 (63.9%) | 72 (2.5%) |
| Total | 6,430 (53.7%) | 862 (7.2%) |
Employment Occupations by Sex in Naguabo Municipio
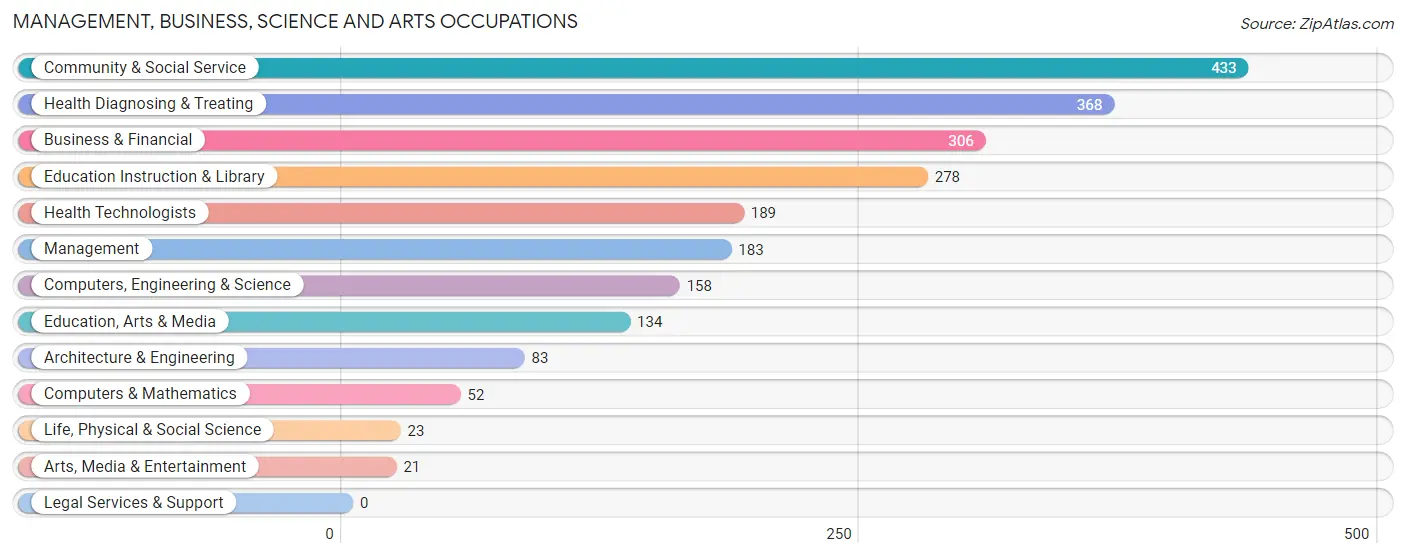
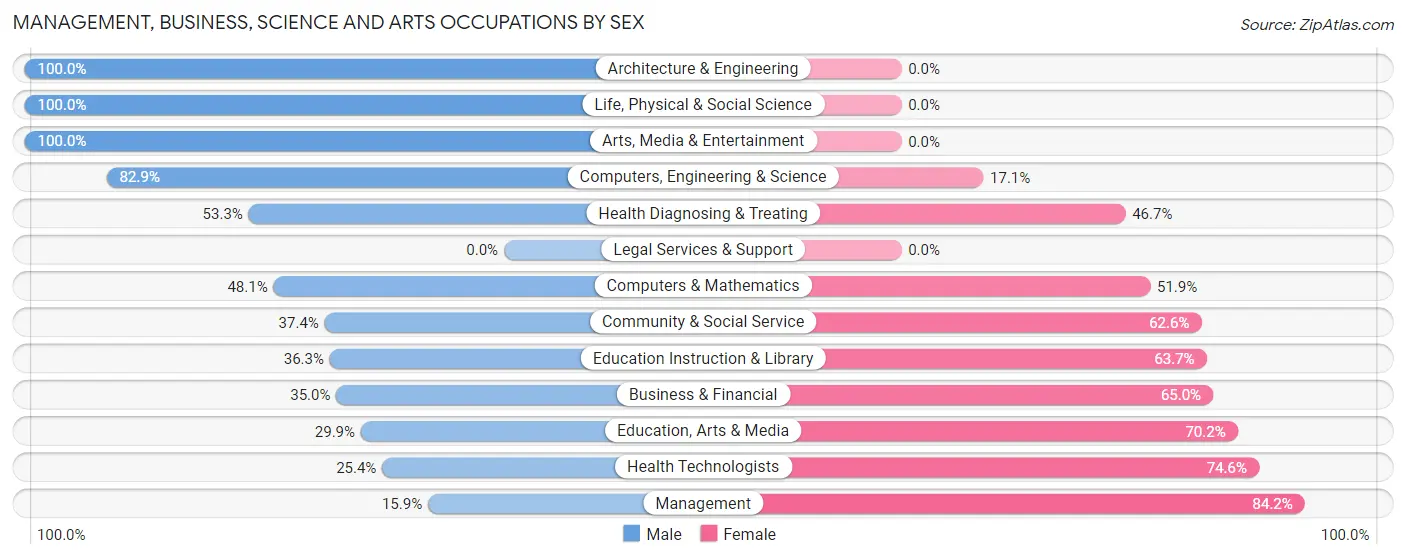
Management, Business, Science and Arts Occupations
The most common Management, Business, Science and Arts occupations in Naguabo Municipio are Community & Social Service (433 | 6.4%), Health Diagnosing & Treating (368 | 5.4%), Business & Financial (306 | 4.5%), Education Instruction & Library (278 | 4.1%), and Health Technologists (189 | 2.8%).
Management, Business, Science and Arts Occupations by Sex
Within the Management, Business, Science and Arts occupations in Naguabo Municipio, the most male-oriented occupations are Architecture & Engineering (100.0%), Life, Physical & Social Science (100.0%), and Arts, Media & Entertainment (100.0%), while the most female-oriented occupations are Management (84.2%), Health Technologists (74.6%), and Education, Arts & Media (70.2%).
| Occupation | Male | Female |
| Management | 29 (15.9%) | 154 (84.2%) |
| Business & Financial | 107 (35.0%) | 199 (65.0%) |
| Computers, Engineering & Science | 131 (82.9%) | 27 (17.1%) |
| Computers & Mathematics | 25 (48.1%) | 27 (51.9%) |
| Architecture & Engineering | 83 (100.0%) | 0 (0.0%) |
| Life, Physical & Social Science | 23 (100.0%) | 0 (0.0%) |
| Community & Social Service | 162 (37.4%) | 271 (62.6%) |
| Education, Arts & Media | 40 (29.8%) | 94 (70.2%) |
| Legal Services & Support | 0 (0.0%) | 0 (0.0%) |
| Education Instruction & Library | 101 (36.3%) | 177 (63.7%) |
| Arts, Media & Entertainment | 21 (100.0%) | 0 (0.0%) |
| Health Diagnosing & Treating | 196 (53.3%) | 172 (46.7%) |
| Health Technologists | 48 (25.4%) | 141 (74.6%) |
| Total (Category) | 625 (43.2%) | 823 (56.8%) |
| Total (Overall) | 4,049 (59.8%) | 2,728 (40.3%) |
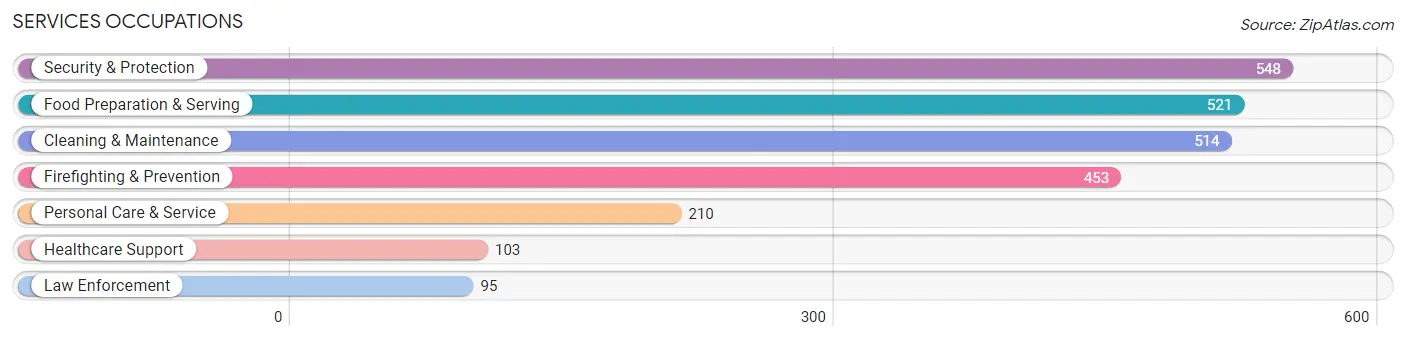
Services Occupations
The most common Services occupations in Naguabo Municipio are Security & Protection (548 | 8.1%), Food Preparation & Serving (521 | 7.7%), Cleaning & Maintenance (514 | 7.6%), Firefighting & Prevention (453 | 6.7%), and Personal Care & Service (210 | 3.1%).
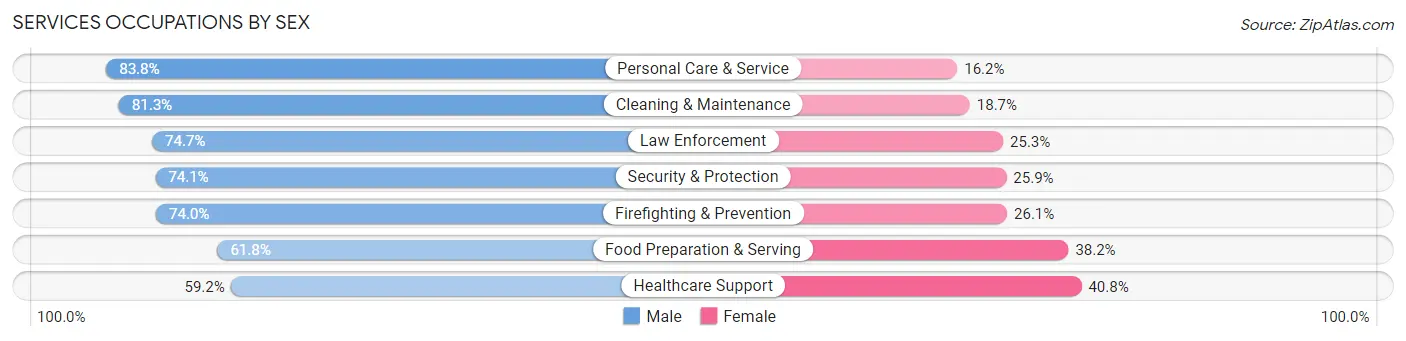
Services Occupations by Sex
Within the Services occupations in Naguabo Municipio, the most male-oriented occupations are Personal Care & Service (83.8%), Cleaning & Maintenance (81.3%), and Law Enforcement (74.7%), while the most female-oriented occupations are Healthcare Support (40.8%), Food Preparation & Serving (38.2%), and Firefighting & Prevention (26.1%).
| Occupation | Male | Female |
| Healthcare Support | 61 (59.2%) | 42 (40.8%) |
| Security & Protection | 406 (74.1%) | 142 (25.9%) |
| Firefighting & Prevention | 335 (74.0%) | 118 (26.1%) |
| Law Enforcement | 71 (74.7%) | 24 (25.3%) |
| Food Preparation & Serving | 322 (61.8%) | 199 (38.2%) |
| Cleaning & Maintenance | 418 (81.3%) | 96 (18.7%) |
| Personal Care & Service | 176 (83.8%) | 34 (16.2%) |
| Total (Category) | 1,383 (72.9%) | 513 (27.1%) |
| Total (Overall) | 4,049 (59.8%) | 2,728 (40.3%) |
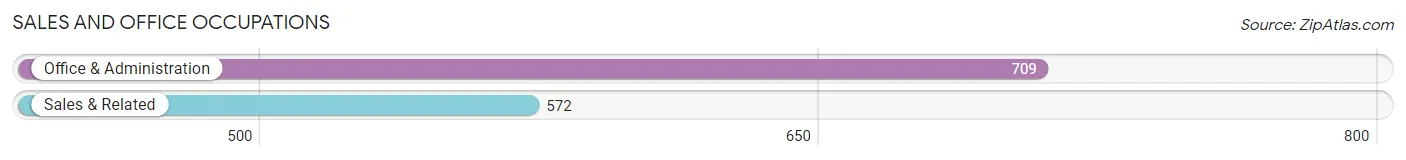
Sales and Office Occupations
The most common Sales and Office occupations in Naguabo Municipio are Office & Administration (709 | 10.5%), and Sales & Related (572 | 8.4%).
Sales and Office Occupations by Sex
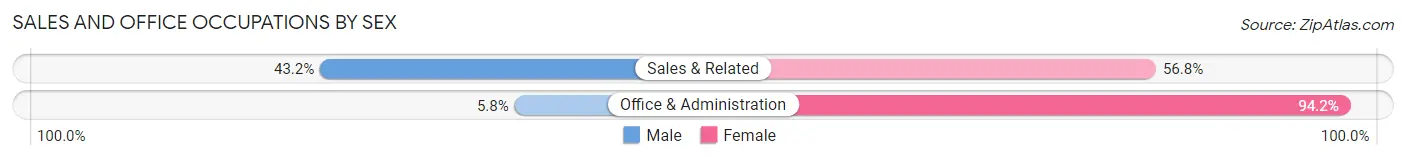
| Occupation | Male | Female |
| Sales & Related | 247 (43.2%) | 325 (56.8%) |
| Office & Administration | 41 (5.8%) | 668 (94.2%) |
| Total (Category) | 288 (22.5%) | 993 (77.5%) |
| Total (Overall) | 4,049 (59.8%) | 2,728 (40.3%) |
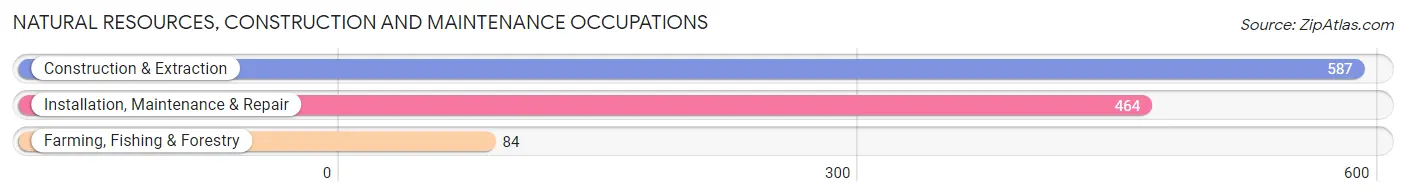
Natural Resources, Construction and Maintenance Occupations
The most common Natural Resources, Construction and Maintenance occupations in Naguabo Municipio are Construction & Extraction (587 | 8.7%), Installation, Maintenance & Repair (464 | 6.9%), and Farming, Fishing & Forestry (84 | 1.2%).
Natural Resources, Construction and Maintenance Occupations by Sex
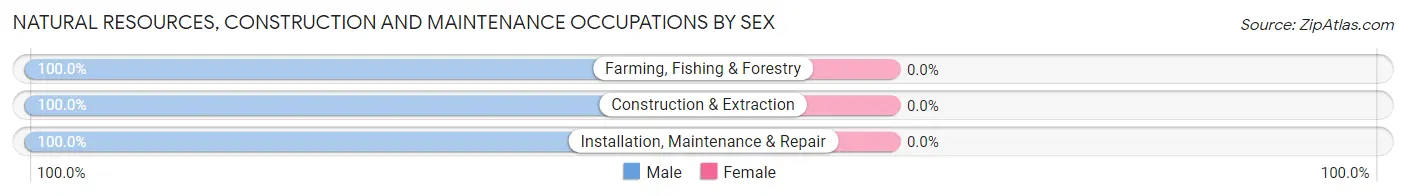
| Occupation | Male | Female |
| Farming, Fishing & Forestry | 84 (100.0%) | 0 (0.0%) |
| Construction & Extraction | 587 (100.0%) | 0 (0.0%) |
| Installation, Maintenance & Repair | 464 (100.0%) | 0 (0.0%) |
| Total (Category) | 1,135 (100.0%) | 0 (0.0%) |
| Total (Overall) | 4,049 (59.8%) | 2,728 (40.3%) |
Production, Transportation and Moving Occupations
The most common Production, Transportation and Moving occupations in Naguabo Municipio are Production (680 | 10.0%), Transportation (174 | 2.6%), and Material Moving (163 | 2.4%).
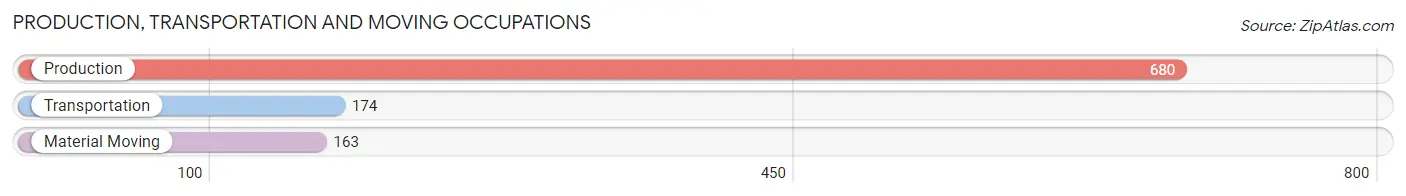
Production, Transportation and Moving Occupations by Sex
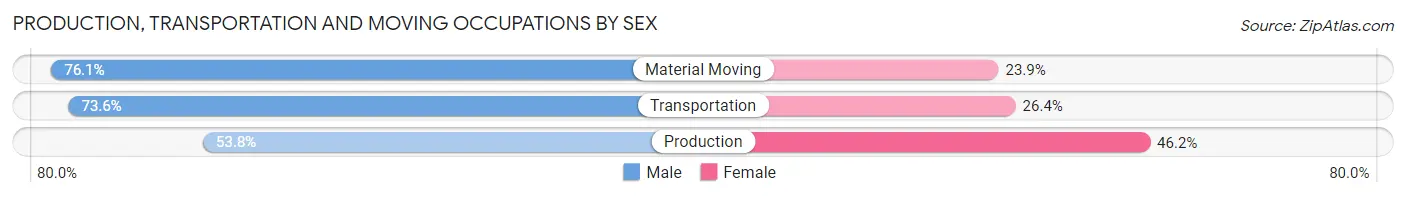
| Occupation | Male | Female |
| Production | 366 (53.8%) | 314 (46.2%) |
| Transportation | 128 (73.6%) | 46 (26.4%) |
| Material Moving | 124 (76.1%) | 39 (23.9%) |
| Total (Category) | 618 (60.8%) | 399 (39.2%) |
| Total (Overall) | 4,049 (59.8%) | 2,728 (40.3%) |
Employment Industries by Sex in Naguabo Municipio
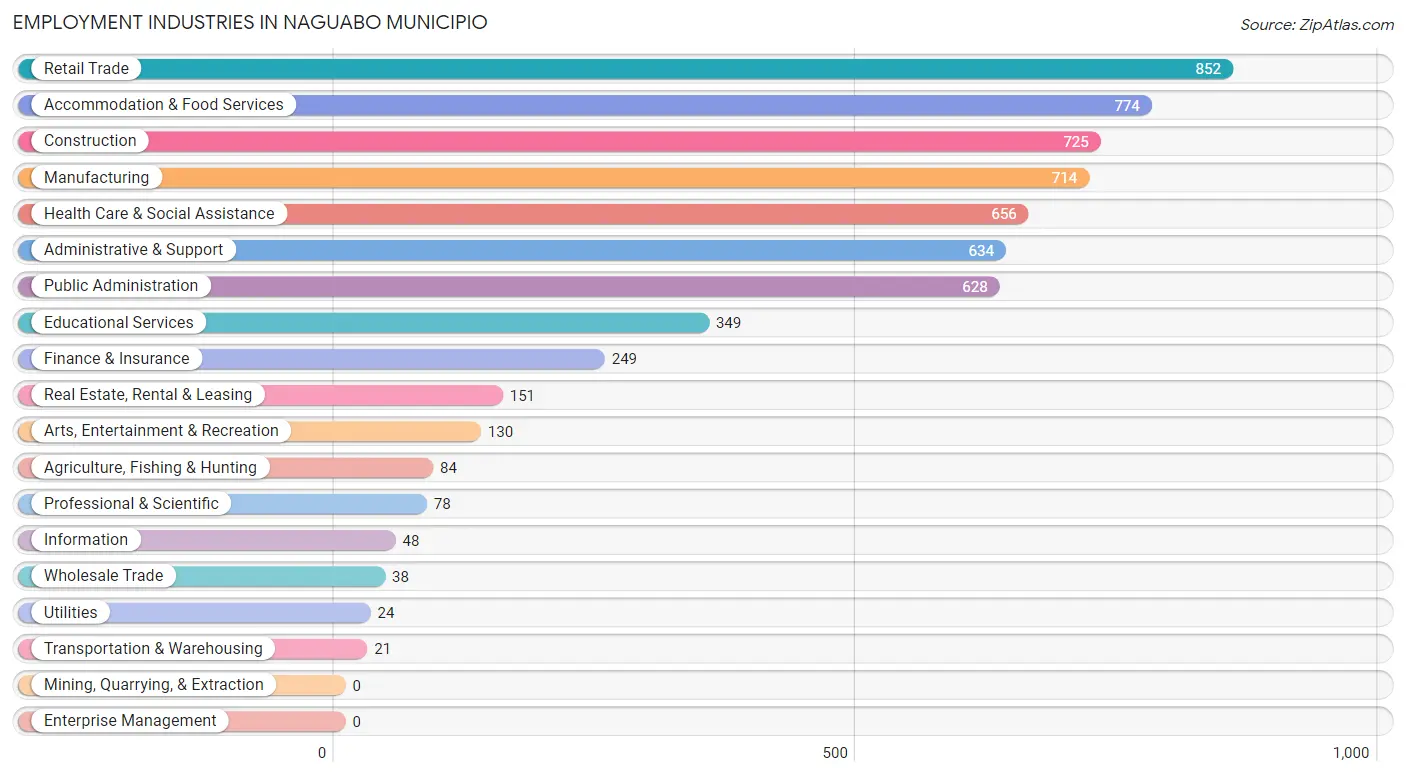
Employment Industries in Naguabo Municipio
The major employment industries in Naguabo Municipio include Retail Trade (852 | 12.6%), Accommodation & Food Services (774 | 11.4%), Construction (725 | 10.7%), Manufacturing (714 | 10.5%), and Health Care & Social Assistance (656 | 9.7%).
Employment Industries by Sex in Naguabo Municipio
The Naguabo Municipio industries that see more men than women are Agriculture, Fishing & Hunting (100.0%), Construction (100.0%), and Wholesale Trade (100.0%), whereas the industries that tend to have a higher number of women are Utilities (100.0%), Finance & Insurance (100.0%), and Educational Services (63.9%).
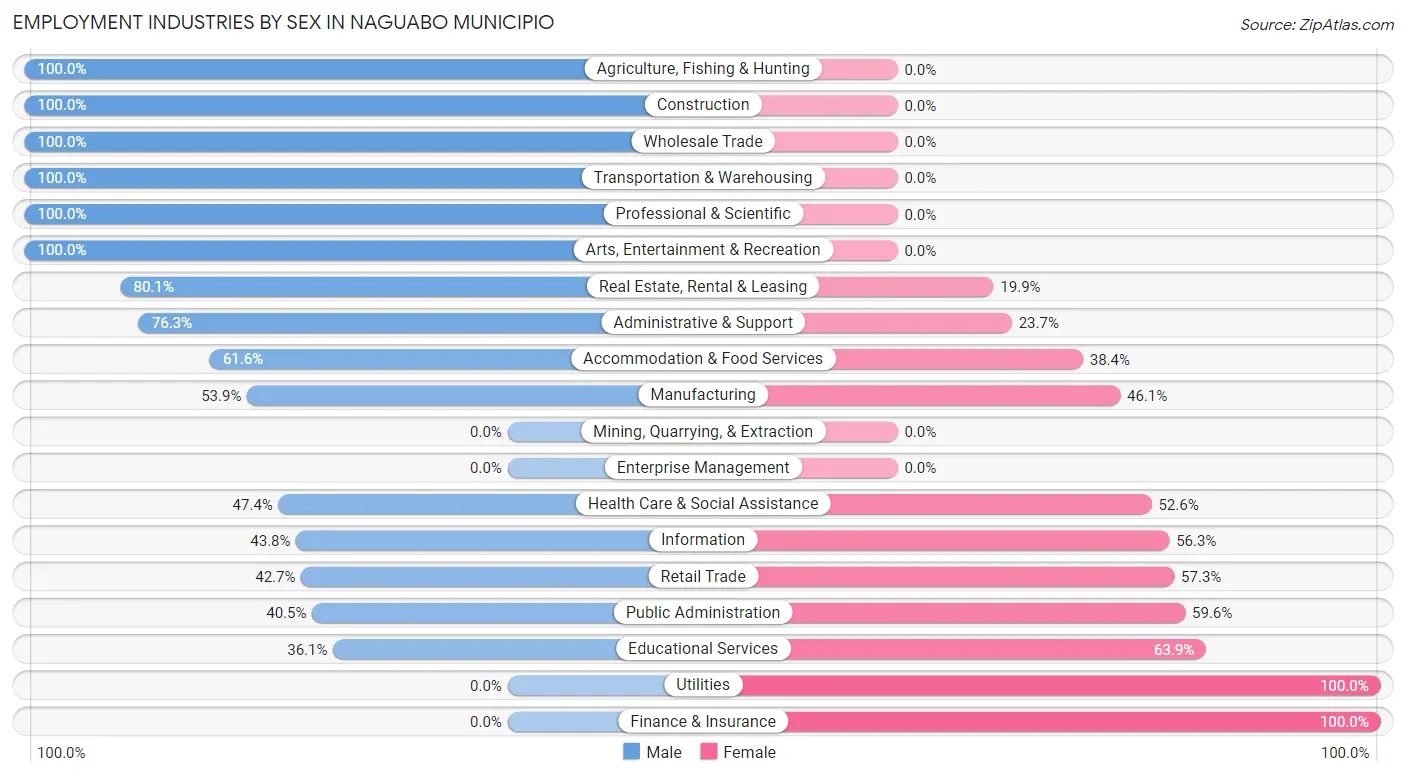
| Industry | Male | Female |
| Agriculture, Fishing & Hunting | 84 (100.0%) | 0 (0.0%) |
| Mining, Quarrying, & Extraction | 0 (0.0%) | 0 (0.0%) |
| Construction | 725 (100.0%) | 0 (0.0%) |
| Manufacturing | 385 (53.9%) | 329 (46.1%) |
| Wholesale Trade | 38 (100.0%) | 0 (0.0%) |
| Retail Trade | 364 (42.7%) | 488 (57.3%) |
| Transportation & Warehousing | 21 (100.0%) | 0 (0.0%) |
| Utilities | 0 (0.0%) | 24 (100.0%) |
| Information | 21 (43.8%) | 27 (56.2%) |
| Finance & Insurance | 0 (0.0%) | 249 (100.0%) |
| Real Estate, Rental & Leasing | 121 (80.1%) | 30 (19.9%) |
| Professional & Scientific | 78 (100.0%) | 0 (0.0%) |
| Enterprise Management | 0 (0.0%) | 0 (0.0%) |
| Administrative & Support | 484 (76.3%) | 150 (23.7%) |
| Educational Services | 126 (36.1%) | 223 (63.9%) |
| Health Care & Social Assistance | 311 (47.4%) | 345 (52.6%) |
| Arts, Entertainment & Recreation | 130 (100.0%) | 0 (0.0%) |
| Accommodation & Food Services | 477 (61.6%) | 297 (38.4%) |
| Public Administration | 254 (40.5%) | 374 (59.6%) |
| Total | 4,049 (59.8%) | 2,728 (40.3%) |
Education in Naguabo Municipio
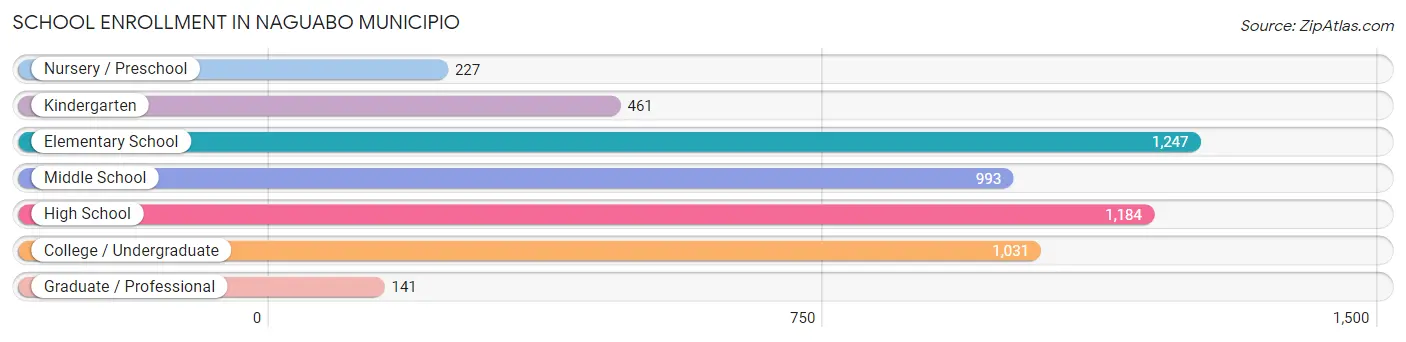
School Enrollment in Naguabo Municipio
The most common levels of schooling among the 5,284 students in Naguabo Municipio are elementary school (1,247 | 23.6%), high school (1,184 | 22.4%), and college / undergraduate (1,031 | 19.5%).
| School Level | # Students | % Students |
| Nursery / Preschool | 227 | 4.3% |
| Kindergarten | 461 | 8.7% |
| Elementary School | 1,247 | 23.6% |
| Middle School | 993 | 18.8% |
| High School | 1,184 | 22.4% |
| College / Undergraduate | 1,031 | 19.5% |
| Graduate / Professional | 141 | 2.7% |
| Total | 5,284 | 100.0% |
School Enrollment by Age by Funding Source in Naguabo Municipio
Out of a total of 5,284 students who are enrolled in schools in Naguabo Municipio, 1,316 (24.9%) attend a private institution, while the remaining 3,968 (75.1%) are enrolled in public schools. The age group of 20 to 24 year olds has the highest likelihood of being enrolled in private schools, with 352 (71.0% in the age bracket) enrolled. Conversely, the age group of 15 to 17 year olds has the lowest likelihood of being enrolled in a private school, with 910 (96.0% in the age bracket) attending a public institution.
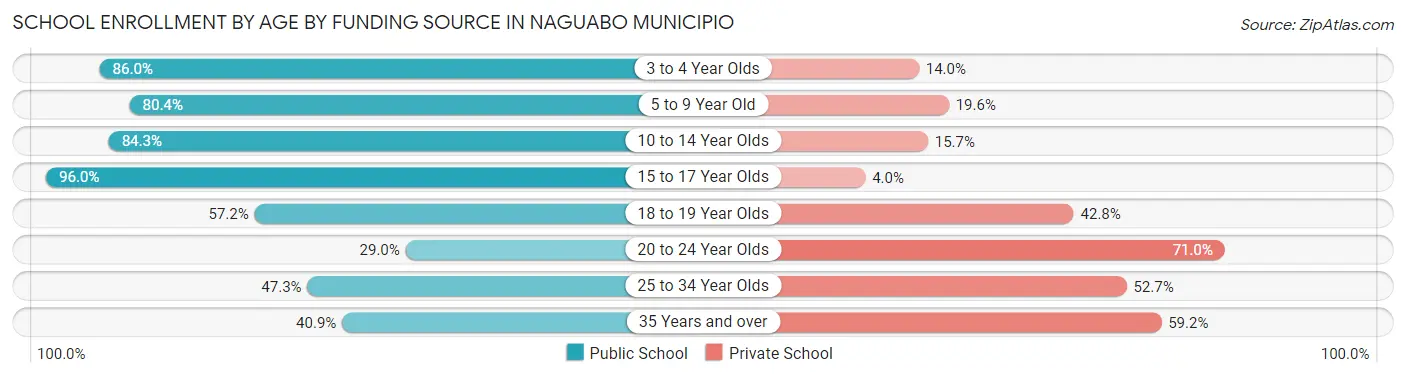
| Age Bracket | Public School | Private School |
| 3 to 4 Year Olds | 209 (86.0%) | 34 (14.0%) |
| 5 to 9 Year Old | 1,356 (80.4%) | 330 (19.6%) |
| 10 to 14 Year Olds | 920 (84.3%) | 171 (15.7%) |
| 15 to 17 Year Olds | 910 (96.0%) | 38 (4.0%) |
| 18 to 19 Year Olds | 311 (57.2%) | 233 (42.8%) |
| 20 to 24 Year Olds | 144 (29.0%) | 352 (71.0%) |
| 25 to 34 Year Olds | 53 (47.3%) | 59 (52.7%) |
| 35 Years and over | 67 (40.8%) | 97 (59.2%) |
| Total | 3,968 (75.1%) | 1,316 (24.9%) |
Educational Attainment by Field of Study in Naguabo Municipio
Business (1,076 | 28.3%), education (906 | 23.8%), science & technology (532 | 14.0%), arts & humanities (273 | 7.2%), and social sciences (263 | 6.9%) are the most common fields of study among 3,803 individuals in Naguabo Municipio who have obtained a bachelor's degree or higher.
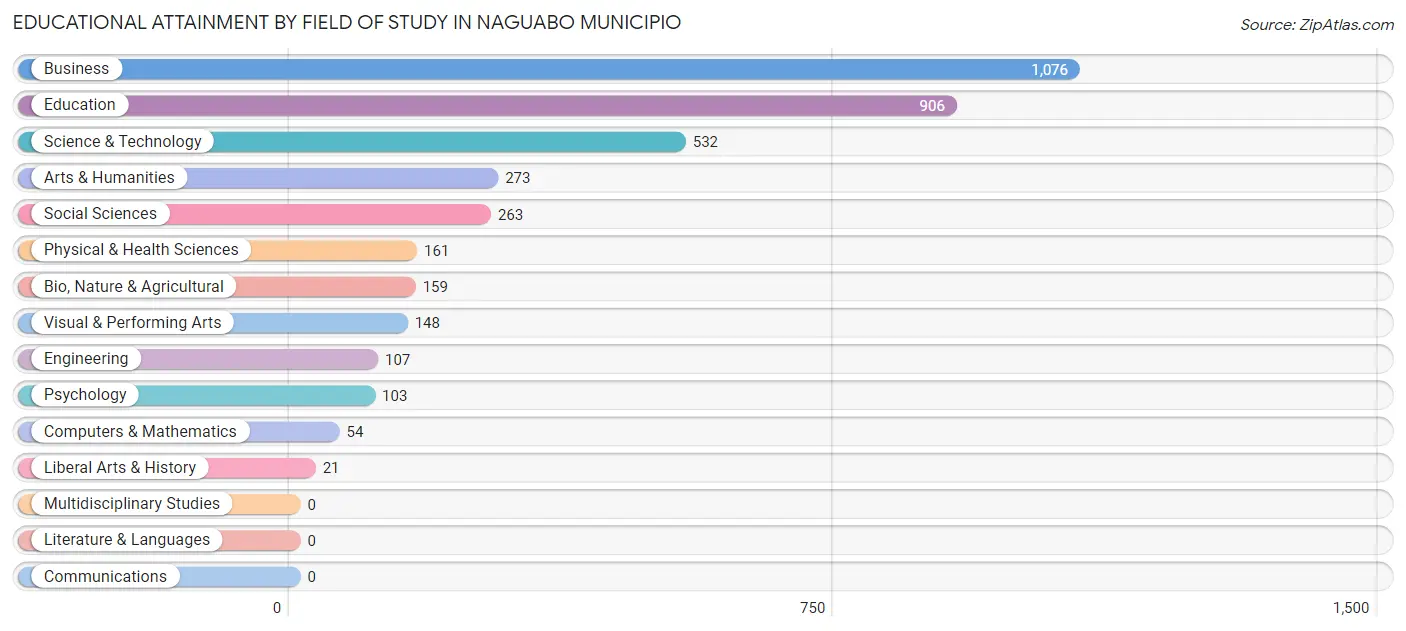
| Field of Study | # Graduates | % Graduates |
| Computers & Mathematics | 54 | 1.4% |
| Bio, Nature & Agricultural | 159 | 4.2% |
| Physical & Health Sciences | 161 | 4.2% |
| Psychology | 103 | 2.7% |
| Social Sciences | 263 | 6.9% |
| Engineering | 107 | 2.8% |
| Multidisciplinary Studies | 0 | 0.0% |
| Science & Technology | 532 | 14.0% |
| Business | 1,076 | 28.3% |
| Education | 906 | 23.8% |
| Literature & Languages | 0 | 0.0% |
| Liberal Arts & History | 21 | 0.5% |
| Visual & Performing Arts | 148 | 3.9% |
| Communications | 0 | 0.0% |
| Arts & Humanities | 273 | 7.2% |
| Total | 3,803 | 100.0% |
Transportation & Commute in Naguabo Municipio
Vehicle Availability by Sex in Naguabo Municipio
The most prevalent vehicle ownership categories in Naguabo Municipio are males with 2 vehicles (1,715, accounting for 42.4%) and females with 2 vehicles (1,411, making up 63.5%).
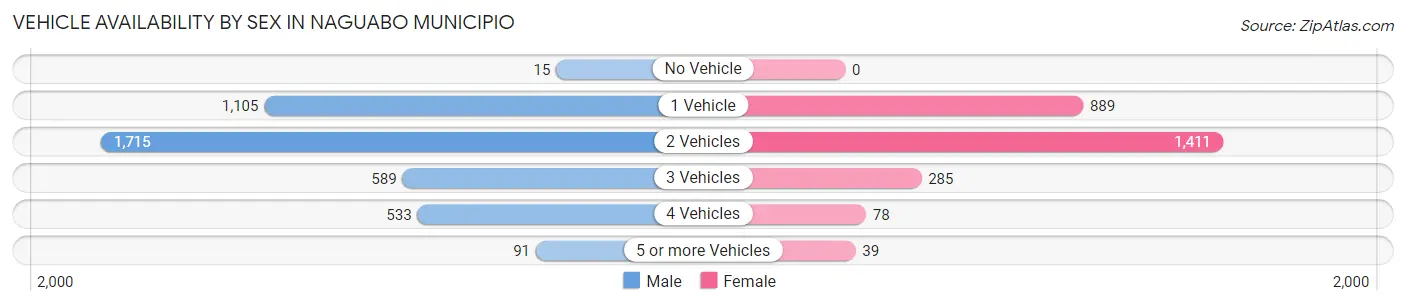
| Vehicles Available | Male | Female |
| No Vehicle | 15 (0.4%) | 0 (0.0%) |
| 1 Vehicle | 1,105 (27.3%) | 889 (32.9%) |
| 2 Vehicles | 1,715 (42.4%) | 1,411 (52.2%) |
| 3 Vehicles | 589 (14.5%) | 285 (10.5%) |
| 4 Vehicles | 533 (13.2%) | 78 (2.9%) |
| 5 or more Vehicles | 91 (2.2%) | 39 (1.4%) |
| Total | 4,048 (100.0%) | 2,702 (100.0%) |
Commute Time in Naguabo Municipio
The most frequently occuring commute durations in Naguabo Municipio are 15 to 19 minutes (1,185 commuters, 18.4%), 20 to 24 minutes (1,178 commuters, 18.3%), and 60 to 89 minutes (1,109 commuters, 17.2%).
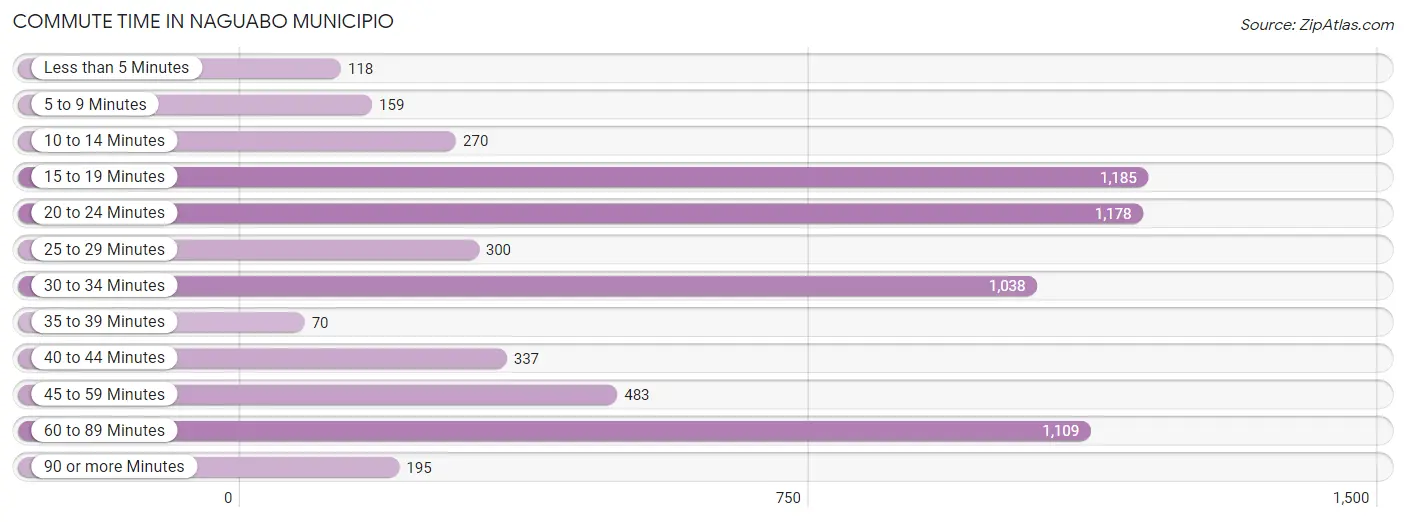
| Commute Time | # Commuters | % Commuters |
| Less than 5 Minutes | 118 | 1.8% |
| 5 to 9 Minutes | 159 | 2.5% |
| 10 to 14 Minutes | 270 | 4.2% |
| 15 to 19 Minutes | 1,185 | 18.4% |
| 20 to 24 Minutes | 1,178 | 18.3% |
| 25 to 29 Minutes | 300 | 4.7% |
| 30 to 34 Minutes | 1,038 | 16.1% |
| 35 to 39 Minutes | 70 | 1.1% |
| 40 to 44 Minutes | 337 | 5.2% |
| 45 to 59 Minutes | 483 | 7.5% |
| 60 to 89 Minutes | 1,109 | 17.2% |
| 90 or more Minutes | 195 | 3.0% |
Commute Time by Sex in Naguabo Municipio
The most common commute times in Naguabo Municipio are 20 to 24 minutes (749 commuters, 19.4%) for males and 30 to 34 minutes (596 commuters, 23.2%) for females.
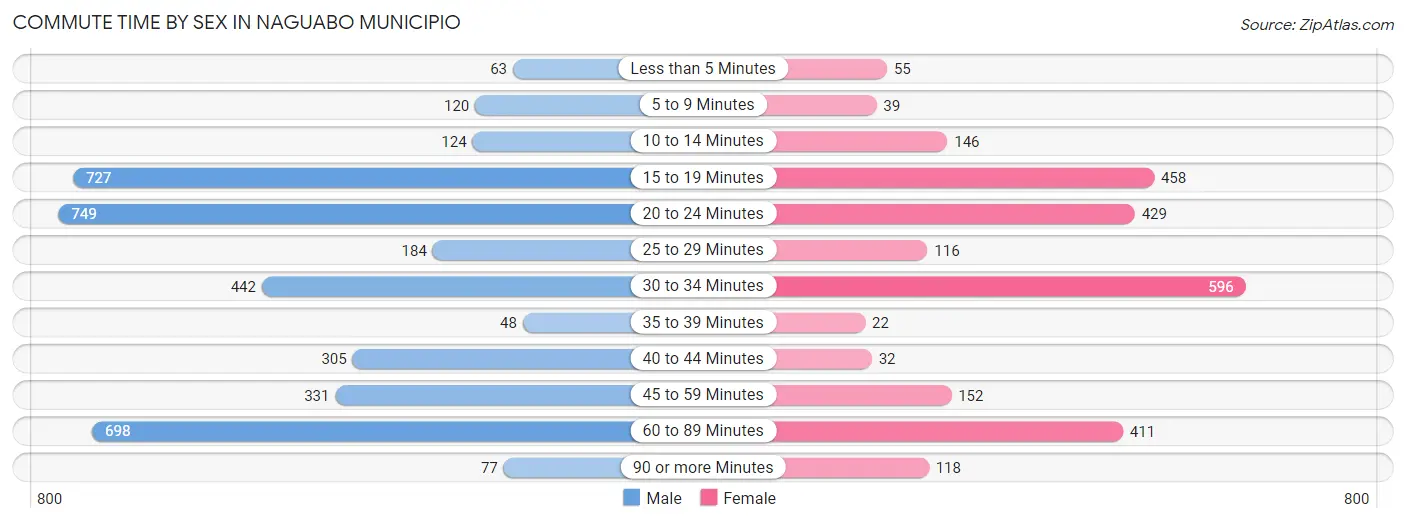
| Commute Time | Male | Female |
| Less than 5 Minutes | 63 (1.6%) | 55 (2.1%) |
| 5 to 9 Minutes | 120 (3.1%) | 39 (1.5%) |
| 10 to 14 Minutes | 124 (3.2%) | 146 (5.7%) |
| 15 to 19 Minutes | 727 (18.8%) | 458 (17.8%) |
| 20 to 24 Minutes | 749 (19.4%) | 429 (16.7%) |
| 25 to 29 Minutes | 184 (4.8%) | 116 (4.5%) |
| 30 to 34 Minutes | 442 (11.4%) | 596 (23.2%) |
| 35 to 39 Minutes | 48 (1.2%) | 22 (0.9%) |
| 40 to 44 Minutes | 305 (7.9%) | 32 (1.2%) |
| 45 to 59 Minutes | 331 (8.6%) | 152 (5.9%) |
| 60 to 89 Minutes | 698 (18.0%) | 411 (16.0%) |
| 90 or more Minutes | 77 (2.0%) | 118 (4.6%) |
Time of Departure to Work by Sex in Naguabo Municipio
The most frequent times of departure to work in Naguabo Municipio are 6:30 AM to 6:59 AM (562, 14.5%) for males and 7:30 AM to 7:59 AM (343, 13.3%) for females.
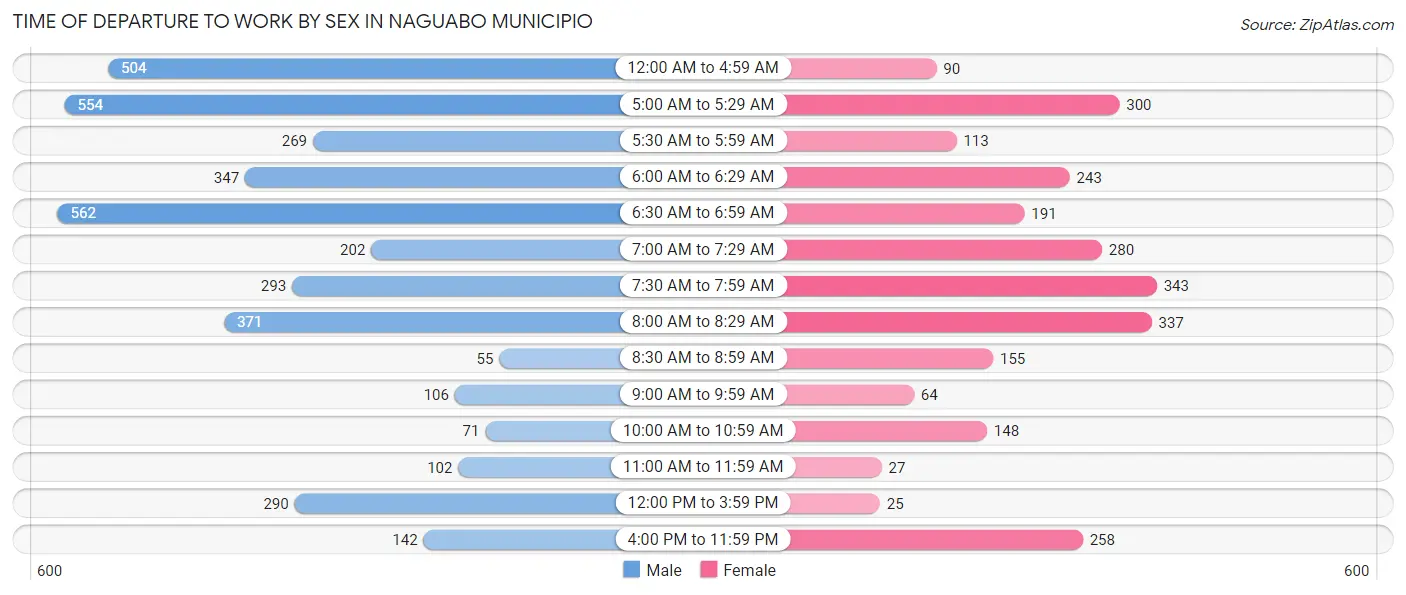
| Time of Departure | Male | Female |
| 12:00 AM to 4:59 AM | 504 (13.0%) | 90 (3.5%) |
| 5:00 AM to 5:29 AM | 554 (14.3%) | 300 (11.7%) |
| 5:30 AM to 5:59 AM | 269 (7.0%) | 113 (4.4%) |
| 6:00 AM to 6:29 AM | 347 (9.0%) | 243 (9.4%) |
| 6:30 AM to 6:59 AM | 562 (14.5%) | 191 (7.4%) |
| 7:00 AM to 7:29 AM | 202 (5.2%) | 280 (10.9%) |
| 7:30 AM to 7:59 AM | 293 (7.6%) | 343 (13.3%) |
| 8:00 AM to 8:29 AM | 371 (9.6%) | 337 (13.1%) |
| 8:30 AM to 8:59 AM | 55 (1.4%) | 155 (6.0%) |
| 9:00 AM to 9:59 AM | 106 (2.7%) | 64 (2.5%) |
| 10:00 AM to 10:59 AM | 71 (1.8%) | 148 (5.8%) |
| 11:00 AM to 11:59 AM | 102 (2.6%) | 27 (1.1%) |
| 12:00 PM to 3:59 PM | 290 (7.5%) | 25 (1.0%) |
| 4:00 PM to 11:59 PM | 142 (3.7%) | 258 (10.0%) |
| Total | 3,868 (100.0%) | 2,574 (100.0%) |
Housing Occupancy in Naguabo Municipio
Occupancy by Ownership in Naguabo Municipio
Of the total 8,171 dwellings in Naguabo Municipio, owner-occupied units account for 5,905 (72.3%), while renter-occupied units make up 2,266 (27.7%).
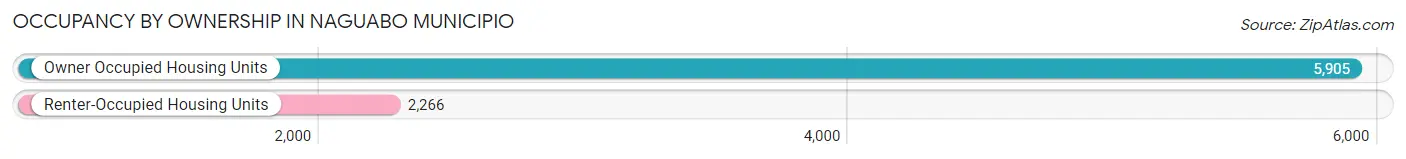
| Occupancy | # Housing Units | % Housing Units |
| Owner Occupied Housing Units | 5,905 | 72.3% |
| Renter-Occupied Housing Units | 2,266 | 27.7% |
| Total Occupied Housing Units | 8,171 | 100.0% |
Occupancy by Household Size in Naguabo Municipio
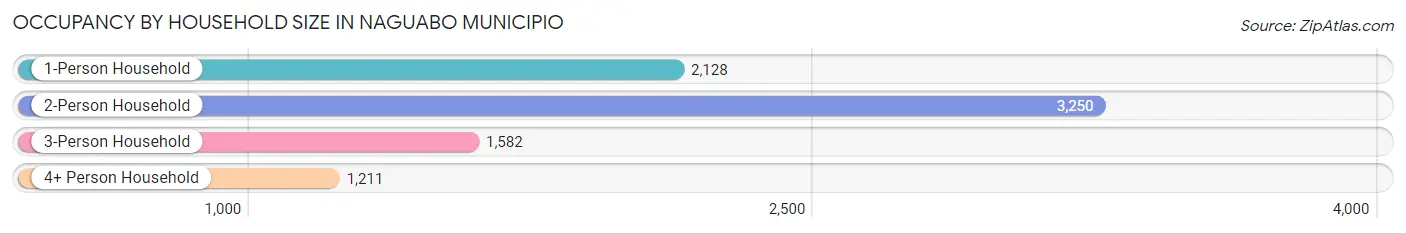
| Household Size | # Housing Units | % Housing Units |
| 1-Person Household | 2,128 | 26.0% |
| 2-Person Household | 3,250 | 39.8% |
| 3-Person Household | 1,582 | 19.4% |
| 4+ Person Household | 1,211 | 14.8% |
| Total Housing Units | 8,171 | 100.0% |
Occupancy by Ownership by Household Size in Naguabo Municipio
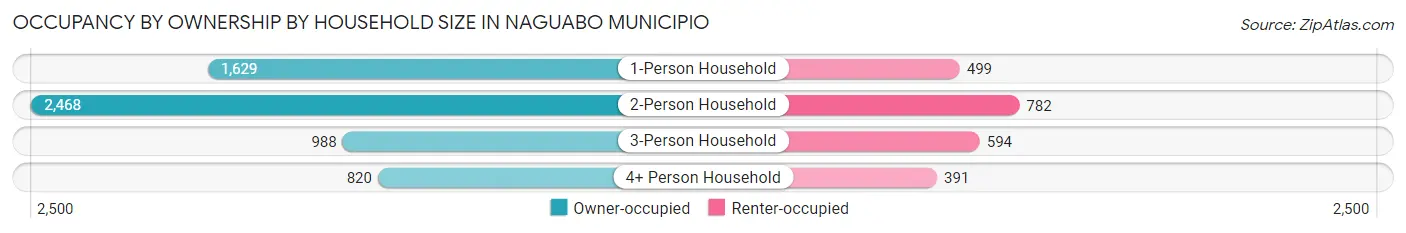
| Household Size | Owner-occupied | Renter-occupied |
| 1-Person Household | 1,629 (76.5%) | 499 (23.4%) |
| 2-Person Household | 2,468 (75.9%) | 782 (24.1%) |
| 3-Person Household | 988 (62.5%) | 594 (37.6%) |
| 4+ Person Household | 820 (67.7%) | 391 (32.3%) |
| Total Housing Units | 5,905 (72.3%) | 2,266 (27.7%) |
Occupancy by Educational Attainment in Naguabo Municipio
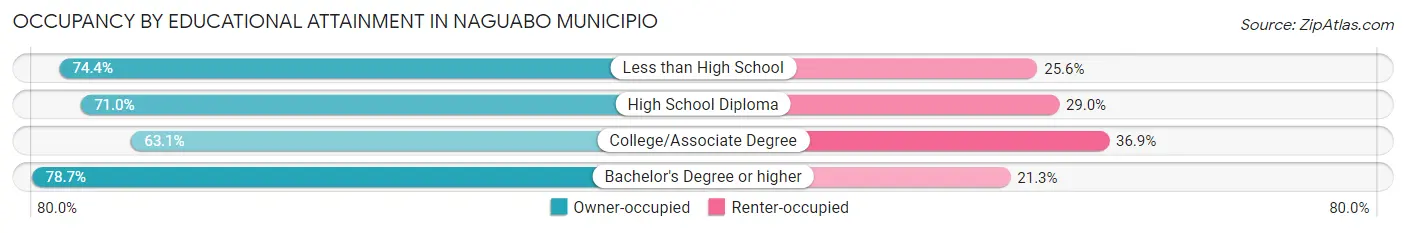
| Household Size | Owner-occupied | Renter-occupied |
| Less than High School | 1,520 (74.4%) | 522 (25.6%) |
| High School Diploma | 2,114 (71.0%) | 863 (29.0%) |
| College/Associate Degree | 847 (63.1%) | 496 (36.9%) |
| Bachelor's Degree or higher | 1,424 (78.7%) | 385 (21.3%) |
Occupancy by Age of Householder in Naguabo Municipio
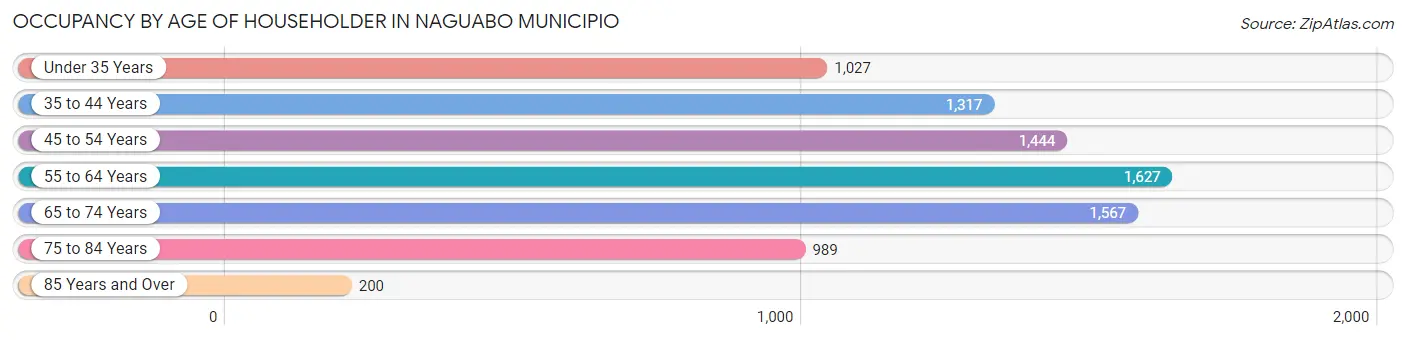
| Age Bracket | # Households | % Households |
| Under 35 Years | 1,027 | 12.6% |
| 35 to 44 Years | 1,317 | 16.1% |
| 45 to 54 Years | 1,444 | 17.7% |
| 55 to 64 Years | 1,627 | 19.9% |
| 65 to 74 Years | 1,567 | 19.2% |
| 75 to 84 Years | 989 | 12.1% |
| 85 Years and Over | 200 | 2.5% |
| Total | 8,171 | 100.0% |
Housing Finances in Naguabo Municipio
Median Income by Occupancy in Naguabo Municipio
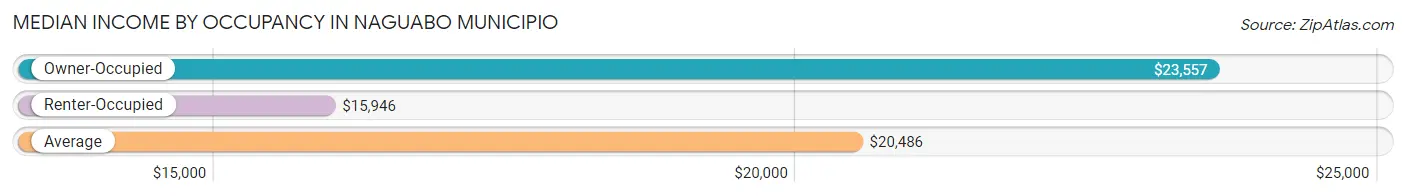
| Occupancy Type | # Households | Median Income |
| Owner-Occupied | 5,905 (72.3%) | $23,557 |
| Renter-Occupied | 2,266 (27.7%) | $15,946 |
| Average | 8,171 (100.0%) | $20,486 |
Occupancy by Householder Income Bracket in Naguabo Municipio
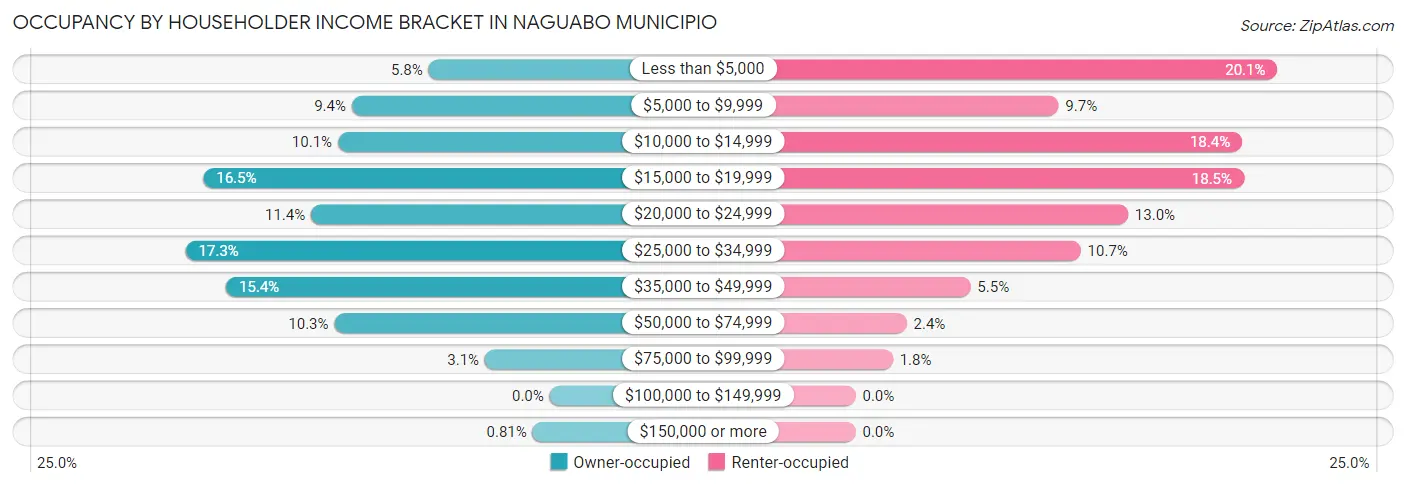
| Income Bracket | Owner-occupied | Renter-occupied |
| Less than $5,000 | 340 (5.8%) | 455 (20.1%) |
| $5,000 to $9,999 | 556 (9.4%) | 219 (9.7%) |
| $10,000 to $14,999 | 595 (10.1%) | 417 (18.4%) |
| $15,000 to $19,999 | 974 (16.5%) | 419 (18.5%) |
| $20,000 to $24,999 | 671 (11.4%) | 294 (13.0%) |
| $25,000 to $34,999 | 1,024 (17.3%) | 243 (10.7%) |
| $35,000 to $49,999 | 910 (15.4%) | 124 (5.5%) |
| $50,000 to $74,999 | 605 (10.2%) | 55 (2.4%) |
| $75,000 to $99,999 | 182 (3.1%) | 40 (1.8%) |
| $100,000 to $149,999 | 0 (0.0%) | 0 (0.0%) |
| $150,000 or more | 48 (0.8%) | 0 (0.0%) |
| Total | 5,905 (100.0%) | 2,266 (100.0%) |
Monthly Housing Cost Tiers in Naguabo Municipio
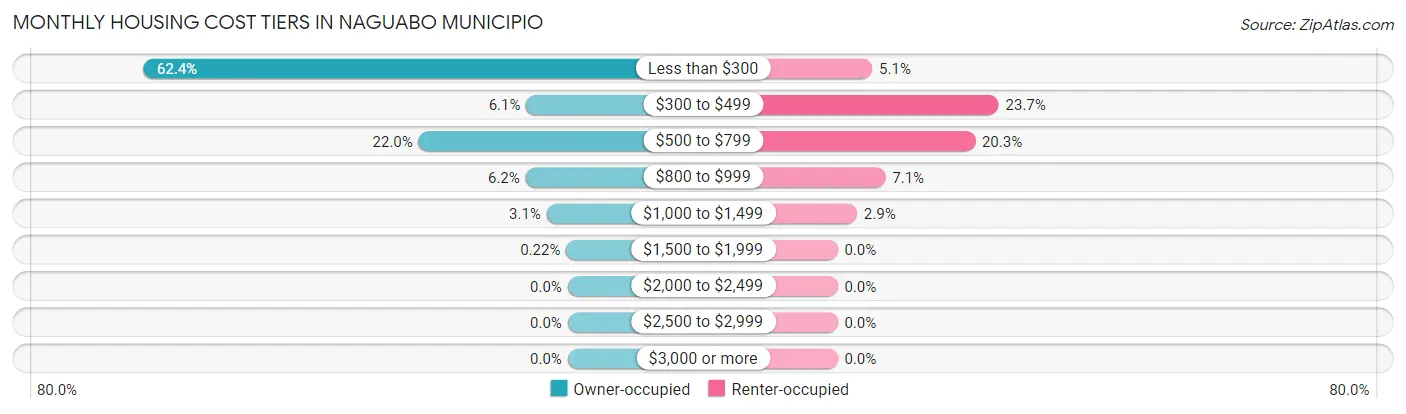
| Monthly Cost | Owner-occupied | Renter-occupied |
| Less than $300 | 3,686 (62.4%) | 116 (5.1%) |
| $300 to $499 | 360 (6.1%) | 538 (23.7%) |
| $500 to $799 | 1,297 (22.0%) | 459 (20.3%) |
| $800 to $999 | 366 (6.2%) | 160 (7.1%) |
| $1,000 to $1,499 | 183 (3.1%) | 65 (2.9%) |
| $1,500 to $1,999 | 13 (0.2%) | 0 (0.0%) |
| $2,000 to $2,499 | 0 (0.0%) | 0 (0.0%) |
| $2,500 to $2,999 | 0 (0.0%) | 0 (0.0%) |
| $3,000 or more | 0 (0.0%) | 0 (0.0%) |
| Total | 5,905 (100.0%) | 2,266 (100.0%) |
Physical Housing Characteristics in Naguabo Municipio
Housing Structures in Naguabo Municipio
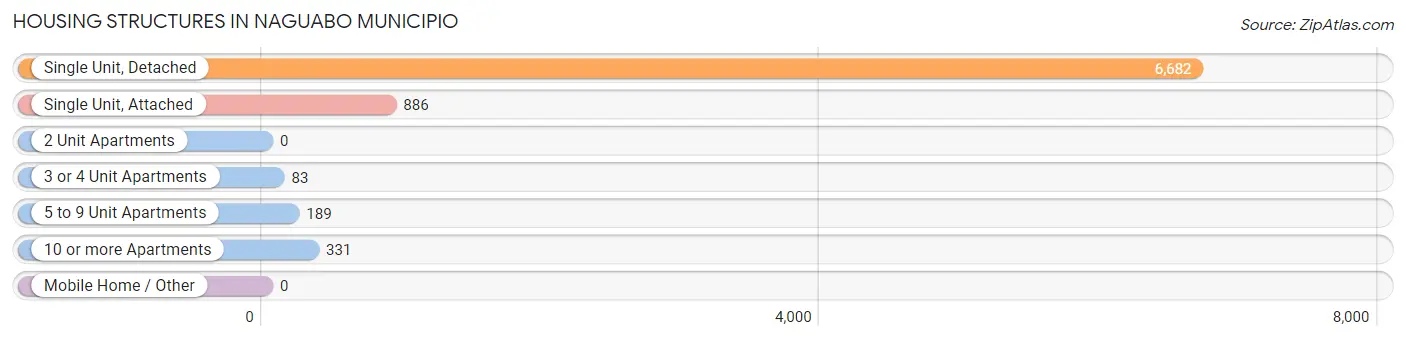
| Structure Type | # Housing Units | % Housing Units |
| Single Unit, Detached | 6,682 | 81.8% |
| Single Unit, Attached | 886 | 10.8% |
| 2 Unit Apartments | 0 | 0.0% |
| 3 or 4 Unit Apartments | 83 | 1.0% |
| 5 to 9 Unit Apartments | 189 | 2.3% |
| 10 or more Apartments | 331 | 4.1% |
| Mobile Home / Other | 0 | 0.0% |
| Total | 8,171 | 100.0% |
Housing Structures by Occupancy in Naguabo Municipio
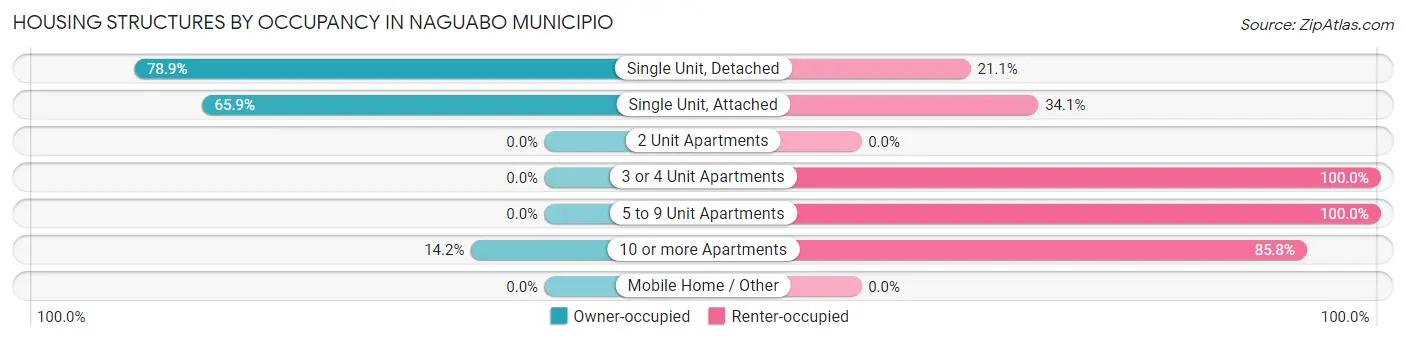
| Structure Type | Owner-occupied | Renter-occupied |
| Single Unit, Detached | 5,274 (78.9%) | 1,408 (21.1%) |
| Single Unit, Attached | 584 (65.9%) | 302 (34.1%) |
| 2 Unit Apartments | 0 (0.0%) | 0 (0.0%) |
| 3 or 4 Unit Apartments | 0 (0.0%) | 83 (100.0%) |
| 5 to 9 Unit Apartments | 0 (0.0%) | 189 (100.0%) |
| 10 or more Apartments | 47 (14.2%) | 284 (85.8%) |
| Mobile Home / Other | 0 (0.0%) | 0 (0.0%) |
| Total | 5,905 (72.3%) | 2,266 (27.7%) |
Housing Structures by Number of Rooms in Naguabo Municipio
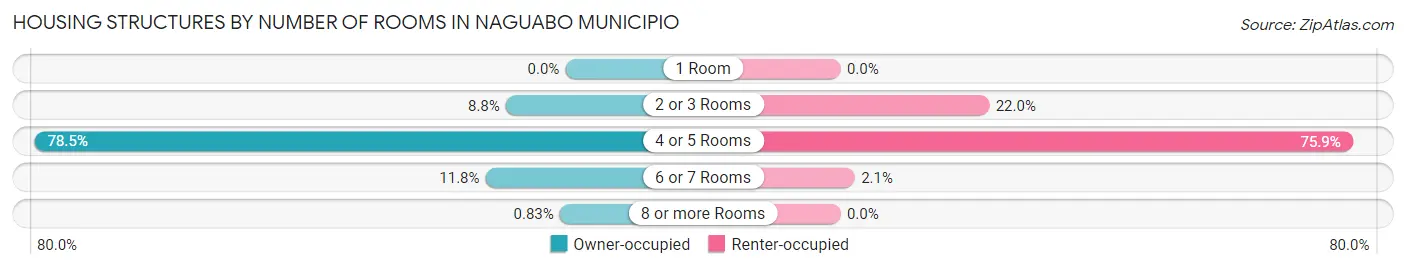
| Number of Rooms | Owner-occupied | Renter-occupied |
| 1 Room | 0 (0.0%) | 0 (0.0%) |
| 2 or 3 Rooms | 521 (8.8%) | 499 (22.0%) |
| 4 or 5 Rooms | 4,637 (78.5%) | 1,719 (75.9%) |
| 6 or 7 Rooms | 698 (11.8%) | 48 (2.1%) |
| 8 or more Rooms | 49 (0.8%) | 0 (0.0%) |
| Total | 5,905 (100.0%) | 2,266 (100.0%) |
Housing Structure by Heating Type in Naguabo Municipio
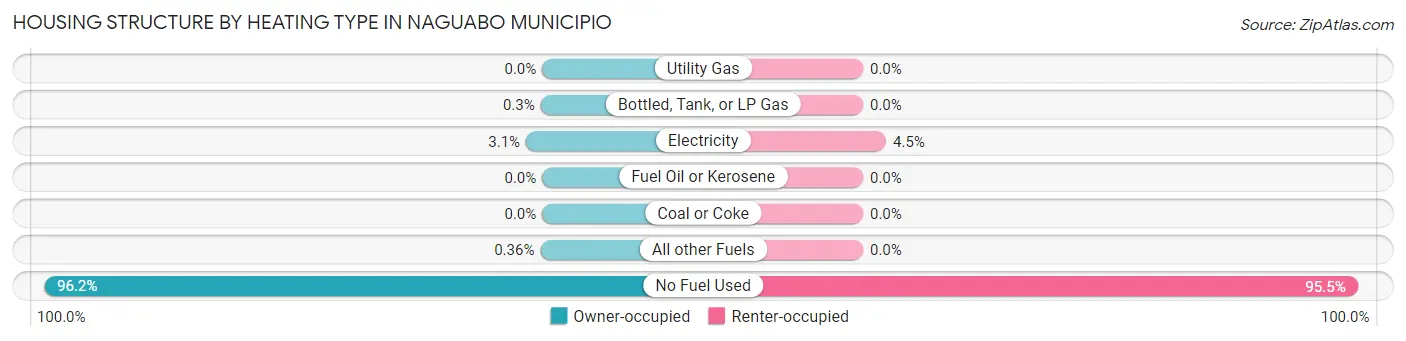
| Heating Type | Owner-occupied | Renter-occupied |
| Utility Gas | 0 (0.0%) | 0 (0.0%) |
| Bottled, Tank, or LP Gas | 18 (0.3%) | 0 (0.0%) |
| Electricity | 184 (3.1%) | 101 (4.5%) |
| Fuel Oil or Kerosene | 0 (0.0%) | 0 (0.0%) |
| Coal or Coke | 0 (0.0%) | 0 (0.0%) |
| All other Fuels | 21 (0.4%) | 0 (0.0%) |
| No Fuel Used | 5,682 (96.2%) | 2,165 (95.5%) |
| Total | 5,905 (100.0%) | 2,266 (100.0%) |
Household Vehicle Usage in Naguabo Municipio
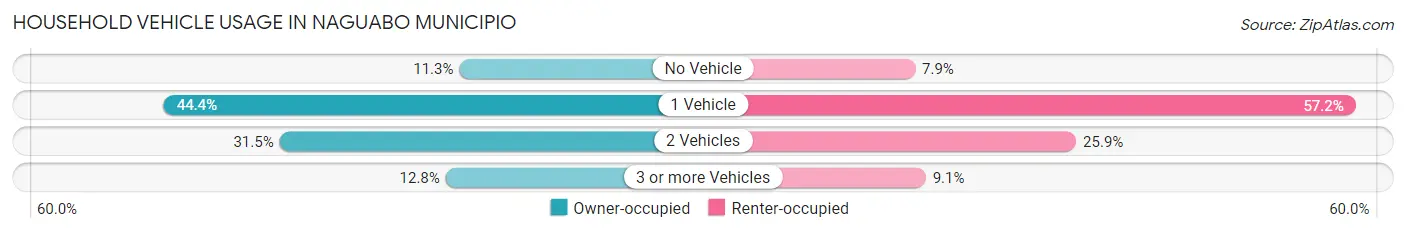
| Vehicles per Household | Owner-occupied | Renter-occupied |
| No Vehicle | 668 (11.3%) | 178 (7.9%) |
| 1 Vehicle | 2,622 (44.4%) | 1,296 (57.2%) |
| 2 Vehicles | 1,857 (31.5%) | 587 (25.9%) |
| 3 or more Vehicles | 758 (12.8%) | 205 (9.0%) |
| Total | 5,905 (100.0%) | 2,266 (100.0%) |
Real Estate & Mortgages in Naguabo Municipio
Real Estate and Mortgage Overview in Naguabo Municipio
| Characteristic | Without Mortgage | With Mortgage |
| Housing Units | 3,962 | 1,943 |
| Median Property Value | $100,000 | $95,900 |
| Median Household Income | $19,489 | $0 |
| Monthly Housing Costs | $150 | $0 |
| Real Estate Taxes | - | - |
Property Value by Mortgage Status in Naguabo Municipio
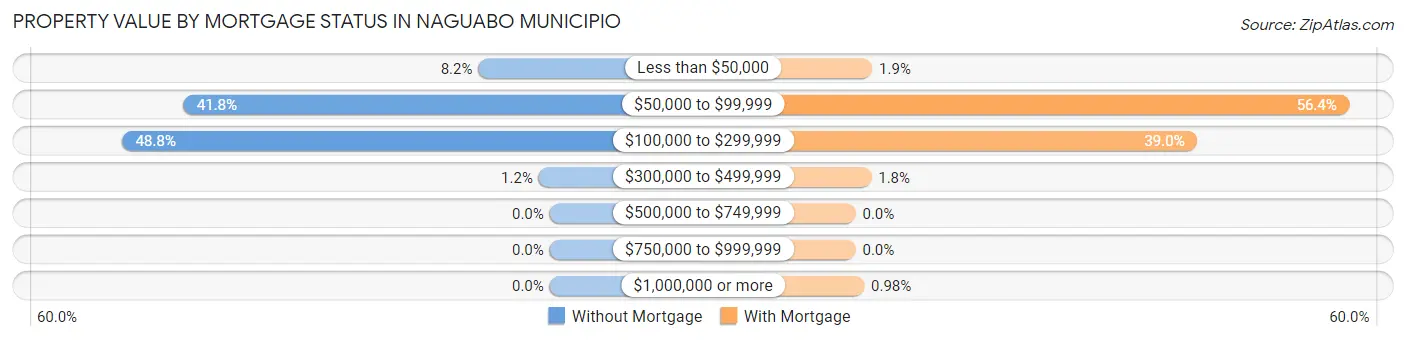
| Property Value | Without Mortgage | With Mortgage |
| Less than $50,000 | 323 (8.2%) | 37 (1.9%) |
| $50,000 to $99,999 | 1,656 (41.8%) | 1,095 (56.4%) |
| $100,000 to $299,999 | 1,934 (48.8%) | 757 (39.0%) |
| $300,000 to $499,999 | 49 (1.2%) | 35 (1.8%) |
| $500,000 to $749,999 | 0 (0.0%) | 0 (0.0%) |
| $750,000 to $999,999 | 0 (0.0%) | 0 (0.0%) |
| $1,000,000 or more | 0 (0.0%) | 19 (1.0%) |
| Total | 3,962 (100.0%) | 1,943 (100.0%) |
Household Income by Mortgage Status in Naguabo Municipio
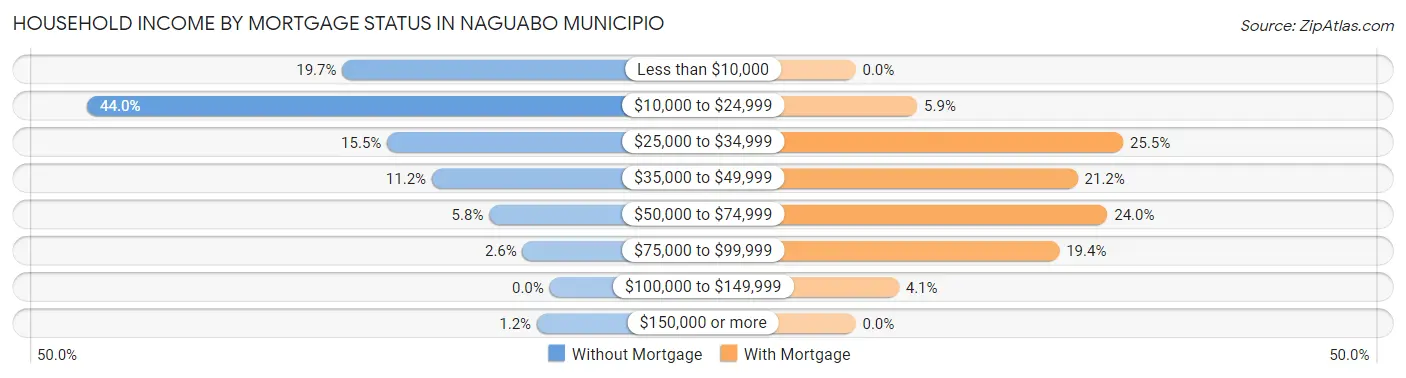
| Household Income | Without Mortgage | With Mortgage |
| Less than $10,000 | 782 (19.7%) | 0 (0.0%) |
| $10,000 to $24,999 | 1,745 (44.0%) | 114 (5.9%) |
| $25,000 to $34,999 | 613 (15.5%) | 495 (25.5%) |
| $35,000 to $49,999 | 444 (11.2%) | 411 (21.1%) |
| $50,000 to $74,999 | 228 (5.8%) | 466 (24.0%) |
| $75,000 to $99,999 | 102 (2.6%) | 377 (19.4%) |
| $100,000 to $149,999 | 0 (0.0%) | 80 (4.1%) |
| $150,000 or more | 48 (1.2%) | 0 (0.0%) |
| Total | 3,962 (100.0%) | 1,943 (100.0%) |
Property Value to Household Income Ratio in Naguabo Municipio
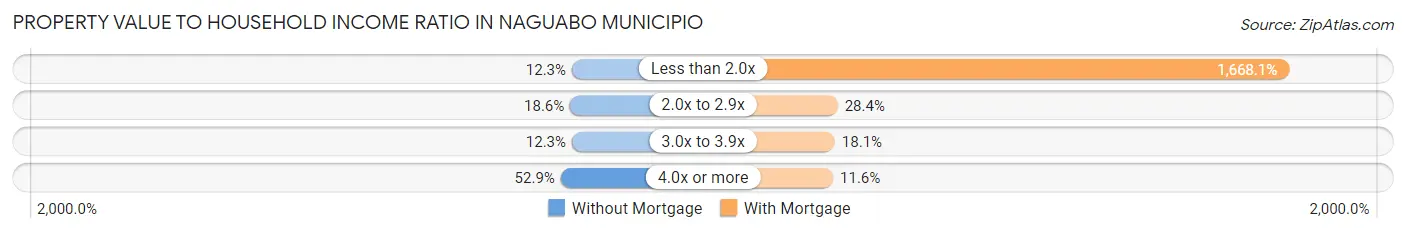
| Value-to-Income Ratio | Without Mortgage | With Mortgage |
| Less than 2.0x | 489 (12.3%) | 32,411 (1,668.1%) |
| 2.0x to 2.9x | 738 (18.6%) | 551 (28.4%) |
| 3.0x to 3.9x | 486 (12.3%) | 352 (18.1%) |
| 4.0x or more | 2,097 (52.9%) | 226 (11.6%) |
| Total | 3,962 (100.0%) | 1,943 (100.0%) |
Real Estate Taxes by Mortgage Status in Naguabo Municipio
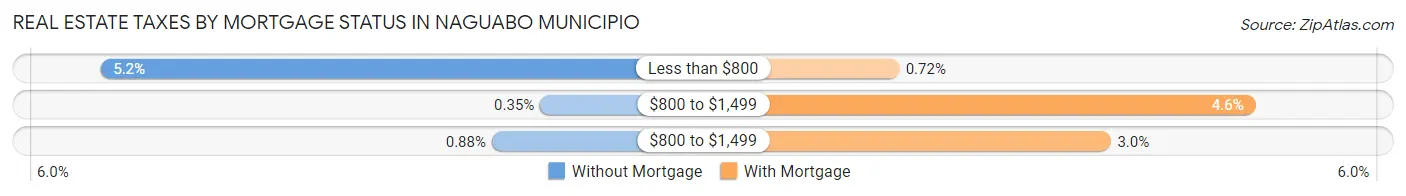
| Property Taxes | Without Mortgage | With Mortgage |
| Less than $800 | 205 (5.2%) | 14 (0.7%) |
| $800 to $1,499 | 14 (0.4%) | 90 (4.6%) |
| $800 to $1,499 | 35 (0.9%) | 59 (3.0%) |
| Total | 3,962 (100.0%) | 1,943 (100.0%) |
Health & Disability in Naguabo Municipio
Health Insurance Coverage by Age in Naguabo Municipio
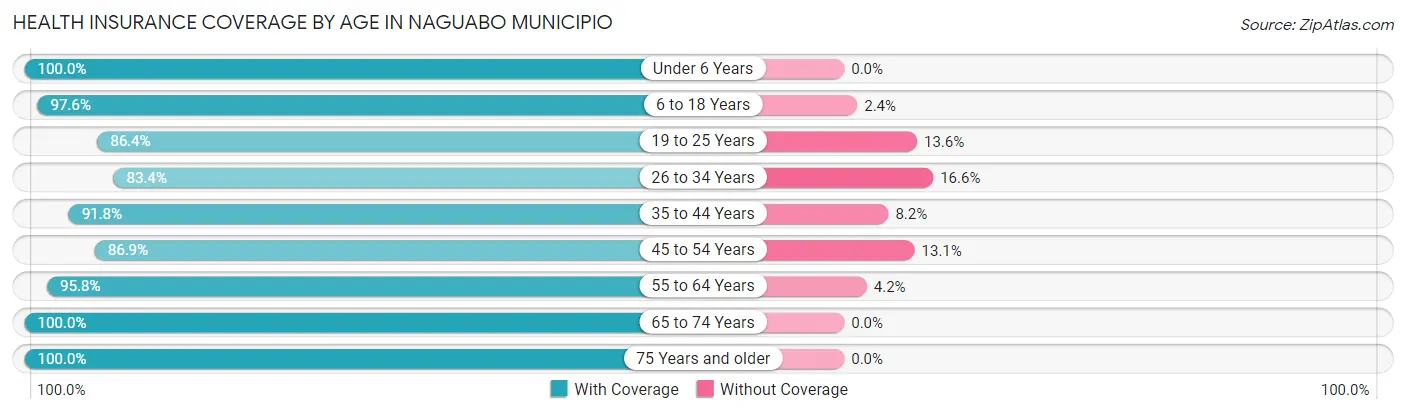
| Age Bracket | With Coverage | Without Coverage |
| Under 6 Years | 1,183 (100.0%) | 0 (0.0%) |
| 6 to 18 Years | 3,705 (97.6%) | 92 (2.4%) |
| 19 to 25 Years | 2,034 (86.4%) | 319 (13.6%) |
| 26 to 34 Years | 2,307 (83.4%) | 459 (16.6%) |
| 35 to 44 Years | 2,896 (91.8%) | 260 (8.2%) |
| 45 to 54 Years | 2,585 (86.9%) | 390 (13.1%) |
| 55 to 64 Years | 2,409 (95.8%) | 106 (4.2%) |
| 65 to 74 Years | 2,397 (100.0%) | 0 (0.0%) |
| 75 Years and older | 2,073 (100.0%) | 0 (0.0%) |
| Total | 21,589 (93.0%) | 1,626 (7.0%) |
Health Insurance Coverage by Citizenship Status in Naguabo Municipio
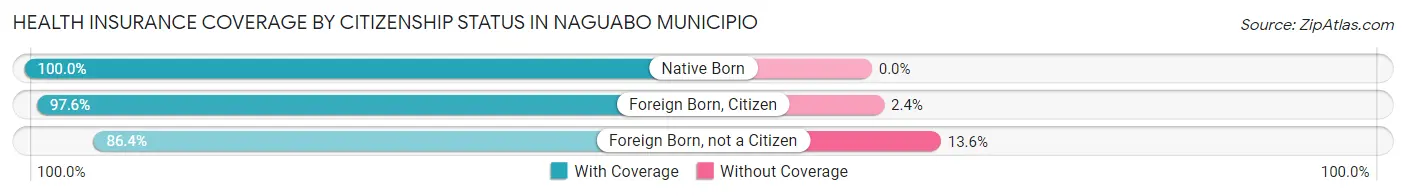
| Citizenship Status | With Coverage | Without Coverage |
| Native Born | 1,183 (100.0%) | 0 (0.0%) |
| Foreign Born, Citizen | 3,705 (97.6%) | 92 (2.4%) |
| Foreign Born, not a Citizen | 2,034 (86.4%) | 319 (13.6%) |
Health Insurance Coverage by Household Income in Naguabo Municipio
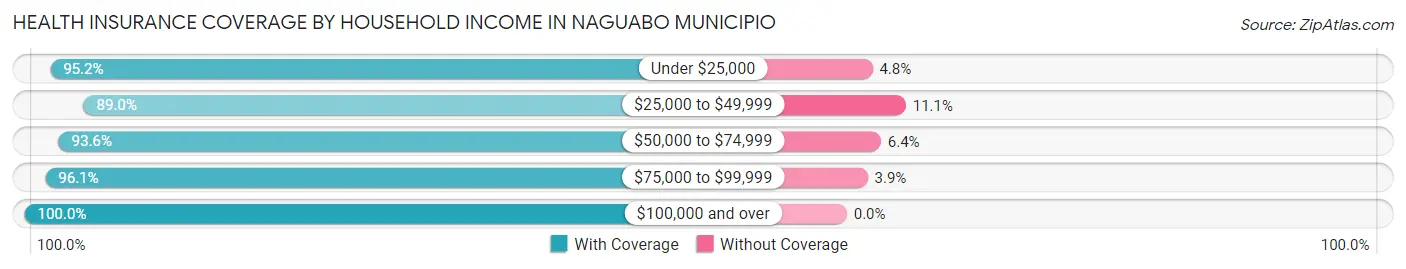
| Household Income | With Coverage | Without Coverage |
| Under $25,000 | 11,669 (95.2%) | 589 (4.8%) |
| $25,000 to $49,999 | 6,995 (88.9%) | 869 (11.1%) |
| $50,000 to $74,999 | 2,113 (93.6%) | 144 (6.4%) |
| $75,000 to $99,999 | 591 (96.1%) | 24 (3.9%) |
| $100,000 and over | 195 (100.0%) | 0 (0.0%) |
Public vs Private Health Insurance Coverage by Age in Naguabo Municipio
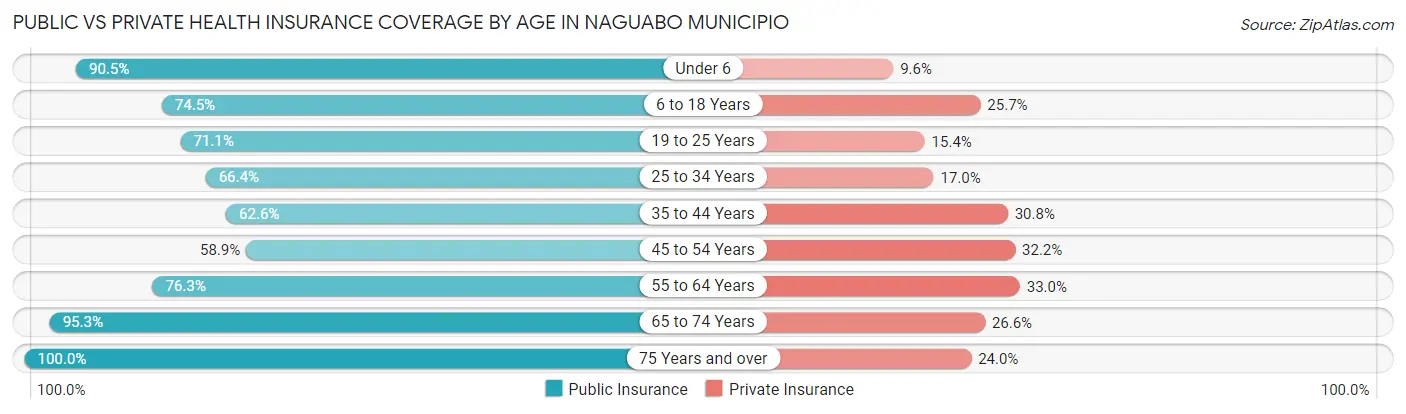
| Age Bracket | Public Insurance | Private Insurance |
| Under 6 | 1,070 (90.4%) | 113 (9.6%) |
| 6 to 18 Years | 2,829 (74.5%) | 977 (25.7%) |
| 19 to 25 Years | 1,672 (71.1%) | 362 (15.4%) |
| 25 to 34 Years | 1,836 (66.4%) | 471 (17.0%) |
| 35 to 44 Years | 1,975 (62.6%) | 972 (30.8%) |
| 45 to 54 Years | 1,752 (58.9%) | 957 (32.2%) |
| 55 to 64 Years | 1,918 (76.3%) | 831 (33.0%) |
| 65 to 74 Years | 2,285 (95.3%) | 637 (26.6%) |
| 75 Years and over | 2,073 (100.0%) | 498 (24.0%) |
| Total | 17,410 (75.0%) | 5,818 (25.1%) |
Disability Status by Sex by Age in Naguabo Municipio
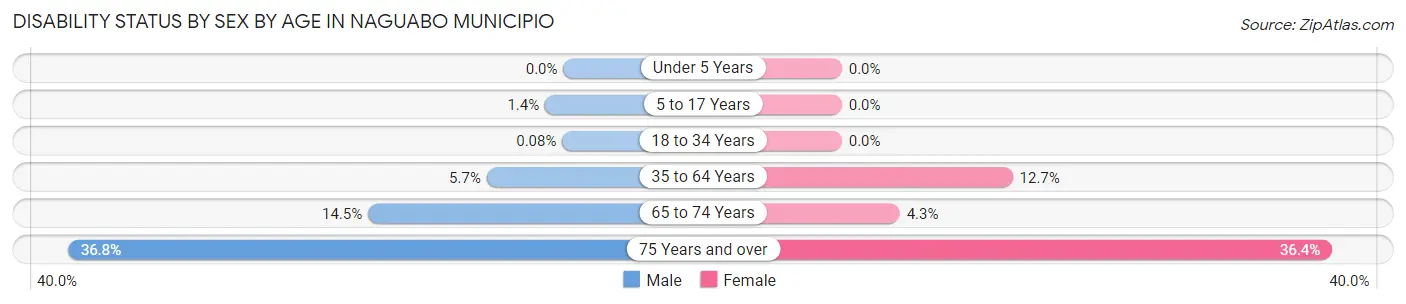
| Age Bracket | Male | Female |
| Under 5 Years | 0 (0.0%) | 0 (0.0%) |
| 5 to 17 Years | 27 (1.4%) | 0 (0.0%) |
| 18 to 34 Years | 2 (0.1%) | 0 (0.0%) |
| 35 to 64 Years | 219 (5.7%) | 608 (12.7%) |
| 65 to 74 Years | 162 (14.5%) | 55 (4.3%) |
| 75 Years and over | 323 (36.8%) | 435 (36.4%) |
Disability Class by Sex by Age in Naguabo Municipio
Disability Class: Hearing Difficulty
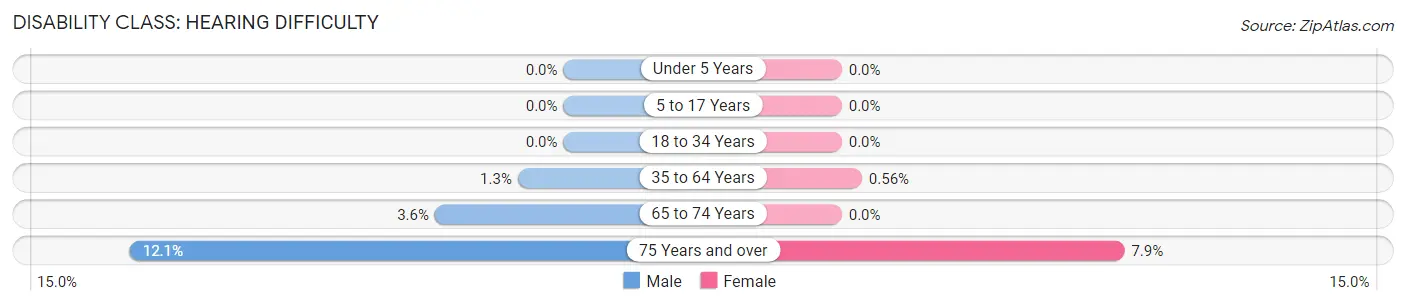
| Age Bracket | Male | Female |
| Under 5 Years | 0 (0.0%) | 0 (0.0%) |
| 5 to 17 Years | 0 (0.0%) | 0 (0.0%) |
| 18 to 34 Years | 0 (0.0%) | 0 (0.0%) |
| 35 to 64 Years | 49 (1.3%) | 27 (0.6%) |
| 65 to 74 Years | 40 (3.6%) | 0 (0.0%) |
| 75 Years and over | 106 (12.1%) | 94 (7.9%) |
Disability Class: Vision Difficulty
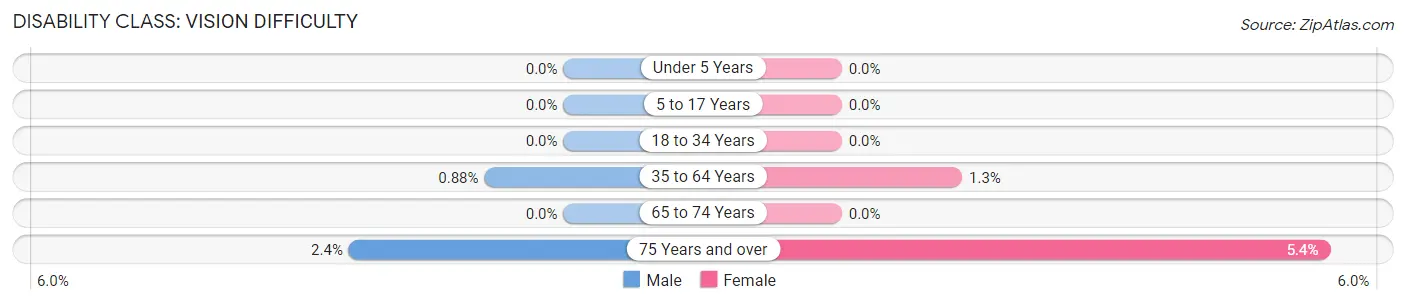
| Age Bracket | Male | Female |
| Under 5 Years | 0 (0.0%) | 0 (0.0%) |
| 5 to 17 Years | 0 (0.0%) | 0 (0.0%) |
| 18 to 34 Years | 0 (0.0%) | 0 (0.0%) |
| 35 to 64 Years | 34 (0.9%) | 64 (1.3%) |
| 65 to 74 Years | 0 (0.0%) | 0 (0.0%) |
| 75 Years and over | 21 (2.4%) | 65 (5.4%) |
Disability Class: Cognitive Difficulty
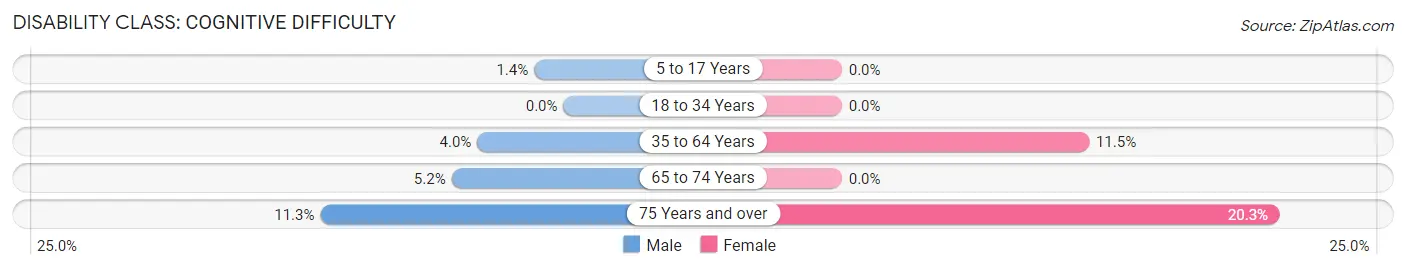
| Age Bracket | Male | Female |
| 5 to 17 Years | 27 (1.4%) | 0 (0.0%) |
| 18 to 34 Years | 0 (0.0%) | 0 (0.0%) |
| 35 to 64 Years | 154 (4.0%) | 550 (11.5%) |
| 65 to 74 Years | 58 (5.2%) | 0 (0.0%) |
| 75 Years and over | 99 (11.3%) | 243 (20.3%) |
Disability Class: Ambulatory Difficulty
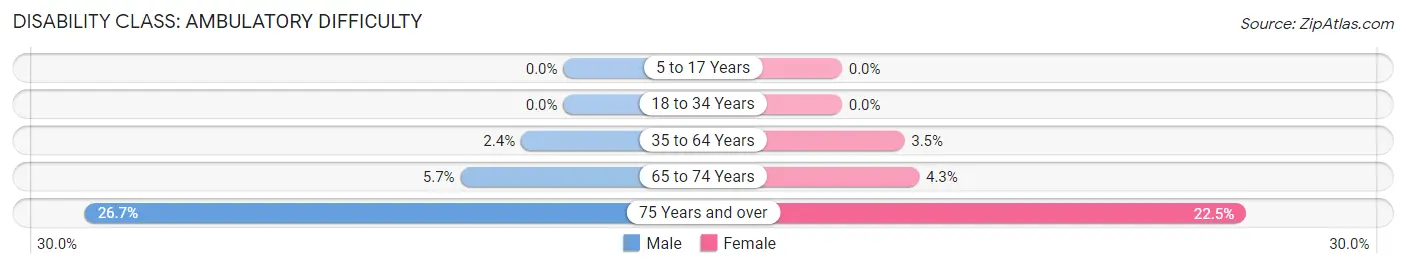
| Age Bracket | Male | Female |
| 5 to 17 Years | 0 (0.0%) | 0 (0.0%) |
| 18 to 34 Years | 0 (0.0%) | 0 (0.0%) |
| 35 to 64 Years | 91 (2.4%) | 167 (3.5%) |
| 65 to 74 Years | 64 (5.7%) | 55 (4.3%) |
| 75 Years and over | 234 (26.7%) | 269 (22.5%) |
Disability Class: Self-Care Difficulty
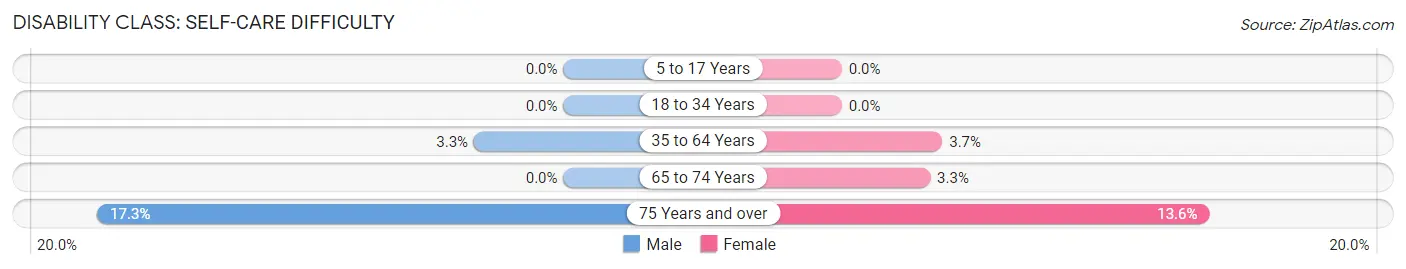
| Age Bracket | Male | Female |
| 5 to 17 Years | 0 (0.0%) | 0 (0.0%) |
| 18 to 34 Years | 0 (0.0%) | 0 (0.0%) |
| 35 to 64 Years | 128 (3.3%) | 179 (3.7%) |
| 65 to 74 Years | 0 (0.0%) | 42 (3.3%) |
| 75 Years and over | 152 (17.3%) | 163 (13.6%) |
Technology Access in Naguabo Municipio
Computing Device Access in Naguabo Municipio
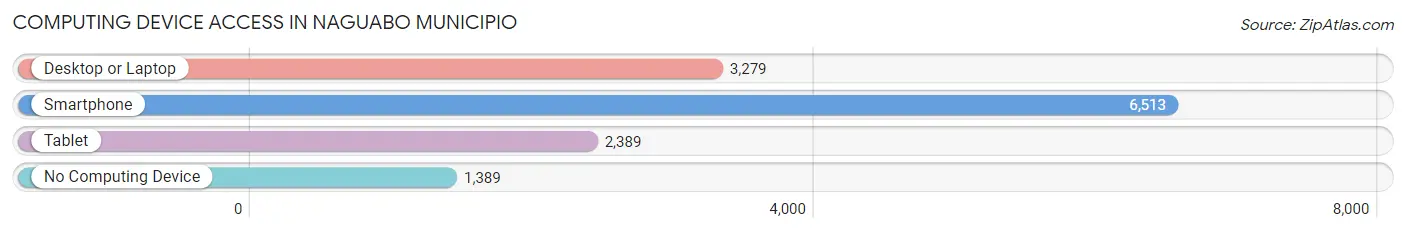
| Device Type | # Households | % Households |
| Desktop or Laptop | 3,279 | 40.1% |
| Smartphone | 6,513 | 79.7% |
| Tablet | 2,389 | 29.2% |
| No Computing Device | 1,389 | 17.0% |
| Total | 8,171 | 100.0% |
Internet Access in Naguabo Municipio
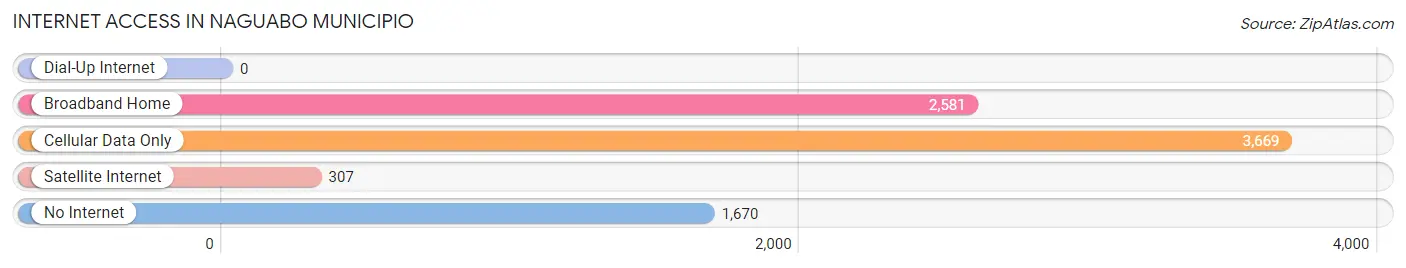
| Internet Type | # Households | % Households |
| Dial-Up Internet | 0 | 0.0% |
| Broadband Home | 2,581 | 31.6% |
| Cellular Data Only | 3,669 | 44.9% |
| Satellite Internet | 307 | 3.8% |
| No Internet | 1,670 | 20.4% |
| Total | 8,171 | 100.0% |
Naguabo Municipio Summary
Naguabo Municipio is a municipality located in the eastern region of Puerto Rico. It is part of the San Juan-Caguas-Guaynabo Metropolitan Statistical Area. The municipality is situated on the eastern coast of the island, bordered by the municipalities of Humacao, Yabucoa, and Río Grande. As of the 2010 census, the population of Naguabo was 28,817.
History
The area of Naguabo was originally inhabited by the Taíno Indians. The first Spanish settlers arrived in the area in the early 16th century. The town was officially founded in 1793 and was named after the Taíno chief Naguabo. During the 19th century, the town was a major producer of sugar cane and coffee. In 1898, Naguabo was annexed to the United States as part of the Treaty of Paris.
Geography
Naguabo is located in the eastern region of Puerto Rico, bordered by the municipalities of Humacao, Yabucoa, and Río Grande. The municipality covers an area of 44.9 square miles (116.3 km2) and is located at an elevation of 545 feet (166 m). The terrain is mostly hilly and mountainous, with the highest point being Cerro La Santa at 1,845 feet (562 m). The municipality is located on the eastern coast of the island, with the Caribbean Sea to the east and the Atlantic Ocean to the north.
Climate
Naguabo has a tropical climate, with hot and humid summers and mild winters. The average temperature is 78°F (26°C), with temperatures ranging from a low of 68°F (20°C) in the winter to a high of 86°F (30°C) in the summer. The average annual precipitation is 64 inches (1,620 mm).
Economy
The economy of Naguabo is largely based on agriculture, with the main crops being sugar cane, coffee, and bananas. The municipality is also home to several manufacturing plants, including a pharmaceutical plant and a plastics factory. Tourism is also an important part of the economy, with the municipality being home to several beaches and resorts.
Demographics
As of the 2010 census, the population of Naguabo was 28,817, with a population density of 645.3 people per square mile (249.3/km2). The racial makeup of the municipality was 79.2% White, 8.2% Black, 0.3% Native American, 0.7% Asian, 0.1% Pacific Islander, and 11.5% from other races. The median household income was $17,845, and the median family income was $20,945. The unemployment rate was 11.3%.
Naguabo is a predominantly Roman Catholic municipality, with the majority of the population being affiliated with the Catholic Church. The municipality is also home to several Protestant churches, as well as a small Jewish community.
Education
Naguabo is served by the Puerto Rico Department of Education. The municipality has several public schools, as well as a private school. The University of Puerto Rico at Humacao is located nearby.
Conclusion
Naguabo is a municipality located in the eastern region of Puerto Rico. It is part of the San Juan-Caguas-Guaynabo Metropolitan Statistical Area and is bordered by the municipalities of Humacao, Yabucoa, and Río Grande. The municipality has a population of 28,817 and is largely based on agriculture, with the main crops being sugar cane, coffee, and bananas. Tourism is also an important part of the economy, with the municipality being home to several beaches and resorts. The population is predominantly Roman Catholic, with the majority of the population being affiliated with the Catholic Church. The municipality is served by the Puerto Rico Department of Education and is home to several public and private schools.
Common Questions
What is Per Capita Income in Naguabo Municipio?
Per Capita income in Naguabo Municipio is $10,940.
What is the Median Family Income in Naguabo Municipio?
Median Family Income in Naguabo Municipio is $22,616.
What is the Median Household income in Naguabo Municipio?
Median Household Income in Naguabo Municipio is $20,486.
What is Income or Wage Gap in Naguabo Municipio?
Income or Wage Gap in Naguabo Municipio is 7.1%.
Women in Naguabo Municipio earn 92.9 cents for every dollar earned by a man.
What is Family Income Deficit in Naguabo Municipio?
Family Income Deficit in Naguabo Municipio is $11,940.
Families that are below poverty line in Naguabo Municipio earn $11,940 less on average than the poverty threshold level.
What is Inequality or Gini Index in Naguabo Municipio?
Inequality or Gini Index in Naguabo Municipio is 0.42.
What is the Total Population of Naguabo Municipio?
Total Population of Naguabo Municipio is 23,340.
What is the Total Male Population of Naguabo Municipio?
Total Male Population of Naguabo Municipio is 10,947.
What is the Total Female Population of Naguabo Municipio?
Total Female Population of Naguabo Municipio is 12,393.
What is the Ratio of Males per 100 Females in Naguabo Municipio?
There are 88.33 Males per 100 Females in Naguabo Municipio.
What is the Ratio of Females per 100 Males in Naguabo Municipio?
There are 113.21 Females per 100 Males in Naguabo Municipio.
What is the Median Population Age in Naguabo Municipio?
Median Population Age in Naguabo Municipio is 39.8 Years.
What is the Average Family Size in Naguabo Municipio
Average Family Size in Naguabo Municipio is 3.5 People.
What is the Average Household Size in Naguabo Municipio
Average Household Size in Naguabo Municipio is 2.9 People.
How Large is the Labor Force in Naguabo Municipio?
There are 7,604 People in the Labor Forcein in Naguabo Municipio.
What is the Percentage of People in the Labor Force in Naguabo Municipio?
39.3% of People are in the Labor Force in Naguabo Municipio.
What is the Unemployment Rate in Naguabo Municipio?
Unemployment Rate in Naguabo Municipio is 10.0%.