Mayaguez Municipio, PR Map & Demographics
Mayaguez Municipio Overview
$13,487
PER CAPITA INCOME
$23,559
AVG FAMILY INCOME
$16,788
AVG HOUSEHOLD INCOME
5.9%
WAGE / INCOME GAP [ % ]
94.1¢/ $1
WAGE / INCOME GAP [ $ ]
$11,784
FAMILY INCOME DEFICIT
0.62
INEQUALITY / GINI INDEX
72,721
TOTAL POPULATION
34,773
MALE POPULATION
37,948
FEMALE POPULATION
91.63
MALES / 100 FEMALES
109.13
FEMALES / 100 MALES
42.8
MEDIAN AGE
3.2
AVG FAMILY SIZE
2.4
AVG HOUSEHOLD SIZE
25,349
LABOR FORCE [ PEOPLE ]
40.3%
PERCENT IN LABOR FORCE
23.9%
UNEMPLOYMENT RATE
Income in Mayaguez Municipio
Income Overview in Mayaguez Municipio
Per Capita Income in Mayaguez Municipio is $13,487, while median incomes of families and households are $23,559 and $16,788 respectively.
| Characteristic | Number | Measure |
| Per Capita Income | 72,721 | $13,487 |
| Median Family Income | 16,513 | $23,559 |
| Mean Family Income | 16,513 | $40,799 |
| Median Household Income | 29,343 | $16,788 |
| Mean Household Income | 29,343 | $31,049 |
| Income Deficit | 16,513 | $11,784 |
| Wage / Income Gap (%) | 72,721 | 5.85% |
| Wage / Income Gap ($) | 72,721 | 94.15¢ per $1 |
| Gini / Inequality Index | 72,721 | 0.62 |
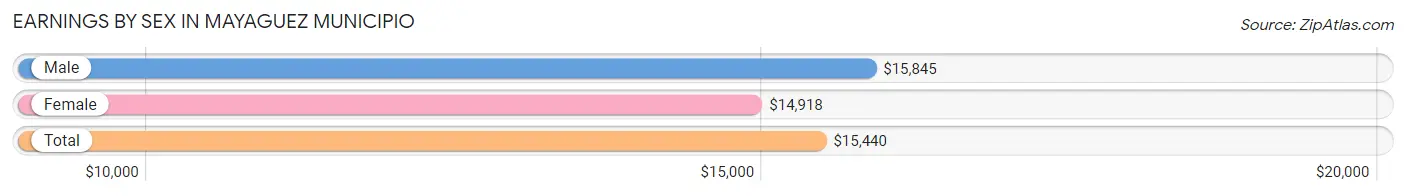
Earnings by Sex in Mayaguez Municipio
Average Earnings in Mayaguez Municipio are $15,440, $15,845 for men and $14,918 for women, a difference of 5.9%.
| Sex | Number | Average Earnings |
| Male | 12,280 (54.0%) | $15,845 |
| Female | 10,465 (46.0%) | $14,918 |
| Total | 22,745 (100.0%) | $15,440 |
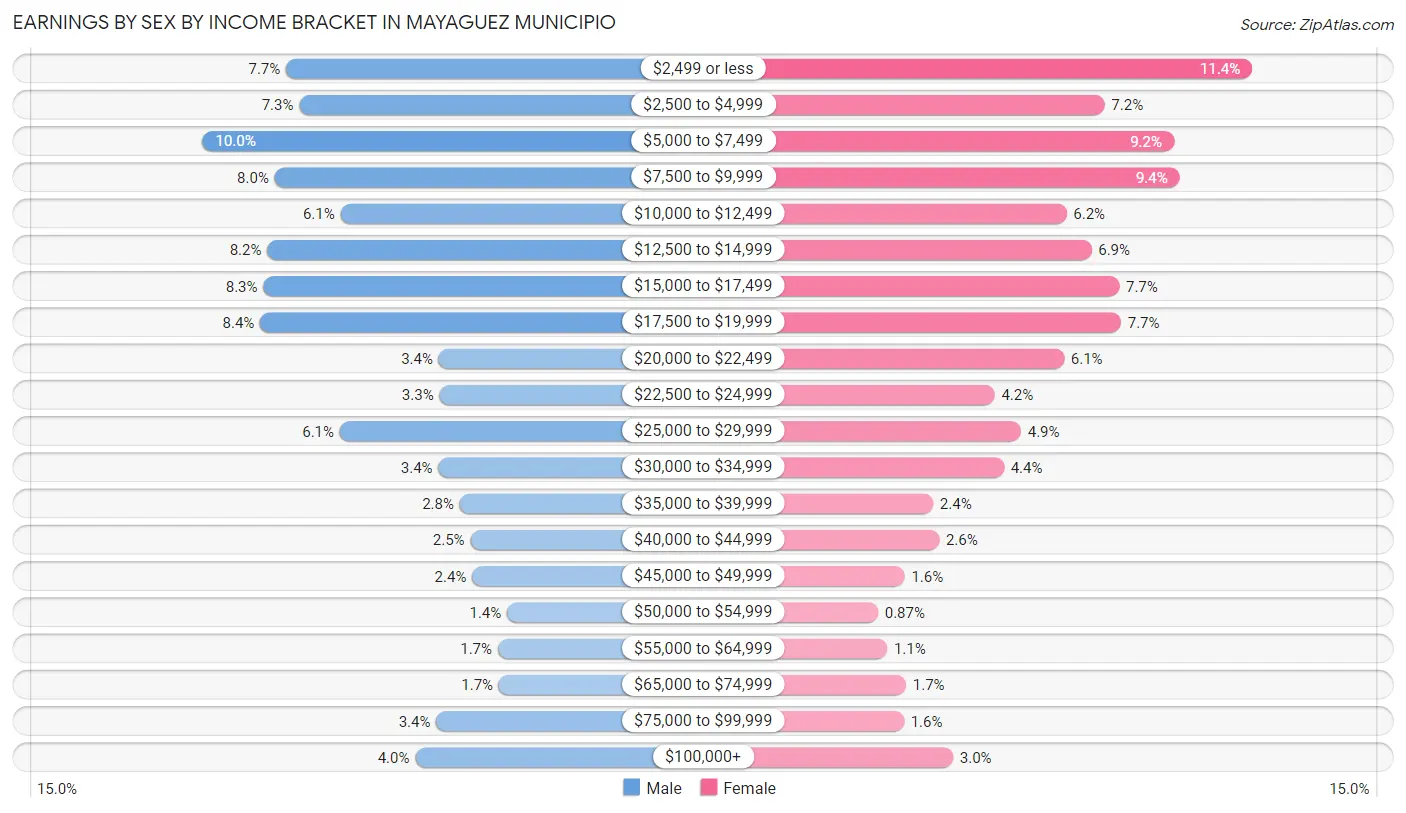
Earnings by Sex by Income Bracket in Mayaguez Municipio
The most common earnings brackets in Mayaguez Municipio are $5,000 to $7,499 for men (1,228 | 10.0%) and $2,499 or less for women (1,192 | 11.4%).
| Income | Male | Female |
| $2,499 or less | 939 (7.6%) | 1,192 (11.4%) |
| $2,500 to $4,999 | 894 (7.3%) | 758 (7.2%) |
| $5,000 to $7,499 | 1,228 (10.0%) | 962 (9.2%) |
| $7,500 to $9,999 | 979 (8.0%) | 979 (9.3%) |
| $10,000 to $12,499 | 752 (6.1%) | 646 (6.2%) |
| $12,500 to $14,999 | 1,004 (8.2%) | 719 (6.9%) |
| $15,000 to $17,499 | 1,018 (8.3%) | 801 (7.6%) |
| $17,500 to $19,999 | 1,029 (8.4%) | 806 (7.7%) |
| $20,000 to $22,499 | 413 (3.4%) | 638 (6.1%) |
| $22,500 to $24,999 | 410 (3.3%) | 434 (4.2%) |
| $25,000 to $29,999 | 754 (6.1%) | 512 (4.9%) |
| $30,000 to $34,999 | 414 (3.4%) | 462 (4.4%) |
| $35,000 to $39,999 | 340 (2.8%) | 253 (2.4%) |
| $40,000 to $44,999 | 303 (2.5%) | 271 (2.6%) |
| $45,000 to $49,999 | 297 (2.4%) | 170 (1.6%) |
| $50,000 to $54,999 | 177 (1.4%) | 91 (0.9%) |
| $55,000 to $64,999 | 209 (1.7%) | 118 (1.1%) |
| $65,000 to $74,999 | 205 (1.7%) | 174 (1.7%) |
| $75,000 to $99,999 | 421 (3.4%) | 167 (1.6%) |
| $100,000+ | 494 (4.0%) | 312 (3.0%) |
| Total | 12,280 (100.0%) | 10,465 (100.0%) |
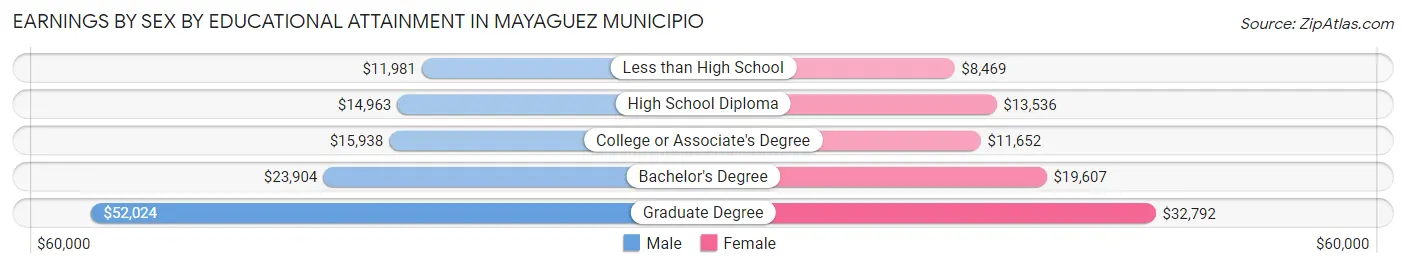
Earnings by Sex by Educational Attainment in Mayaguez Municipio
Average earnings in Mayaguez Municipio are $17,781 for men and $16,832 for women, a difference of 5.3%. Men with an educational attainment of graduate degree enjoy the highest average annual earnings of $52,024, while those with less than high school education earn the least with $11,981. Women with an educational attainment of graduate degree earn the most with the average annual earnings of $32,792, while those with less than high school education have the smallest earnings of $8,469.
| Educational Attainment | Male Income | Female Income |
| Less than High School | $11,981 | $8,469 |
| High School Diploma | $14,963 | $13,536 |
| College or Associate's Degree | $15,938 | $11,652 |
| Bachelor's Degree | $23,904 | $19,607 |
| Graduate Degree | $52,024 | $32,792 |
| Total | $17,781 | $16,832 |
Family Income in Mayaguez Municipio
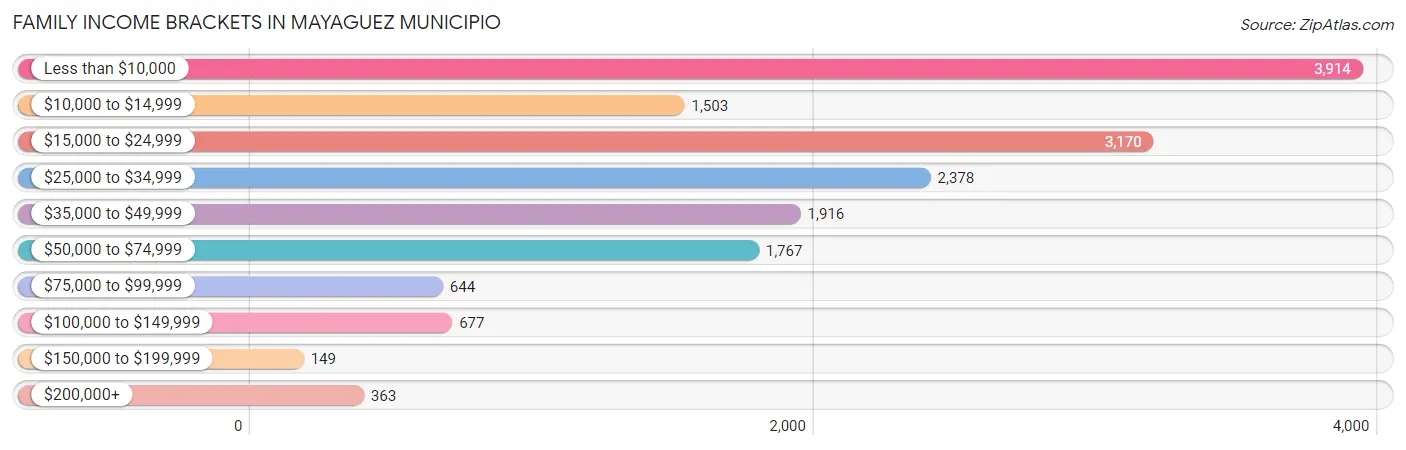
Family Income Brackets in Mayaguez Municipio
According to the Mayaguez Municipio family income data, there are 3,914 families falling into the less than $10,000 income range, which is the most common income bracket and makes up 23.7% of all families. Conversely, the $150,000 to $199,999 income bracket is the least frequent group with only 149 families (0.9%) belonging to this category.
| Income Bracket | # Families | % Families |
| Less than $10,000 | 3,914 | 23.7% |
| $10,000 to $14,999 | 1,503 | 9.1% |
| $15,000 to $24,999 | 3,170 | 19.2% |
| $25,000 to $34,999 | 2,378 | 14.4% |
| $35,000 to $49,999 | 1,916 | 11.6% |
| $50,000 to $74,999 | 1,767 | 10.7% |
| $75,000 to $99,999 | 644 | 3.9% |
| $100,000 to $149,999 | 677 | 4.1% |
| $150,000 to $199,999 | 149 | 0.9% |
| $200,000+ | 363 | 2.2% |
Family Income by Famaliy Size in Mayaguez Municipio
6-person families (225 | 1.4%) account for the highest median family income in Mayaguez Municipio with $56,492 per family, while 2-person families (8,621 | 52.2%) have the highest median income of $10,625 per family member.
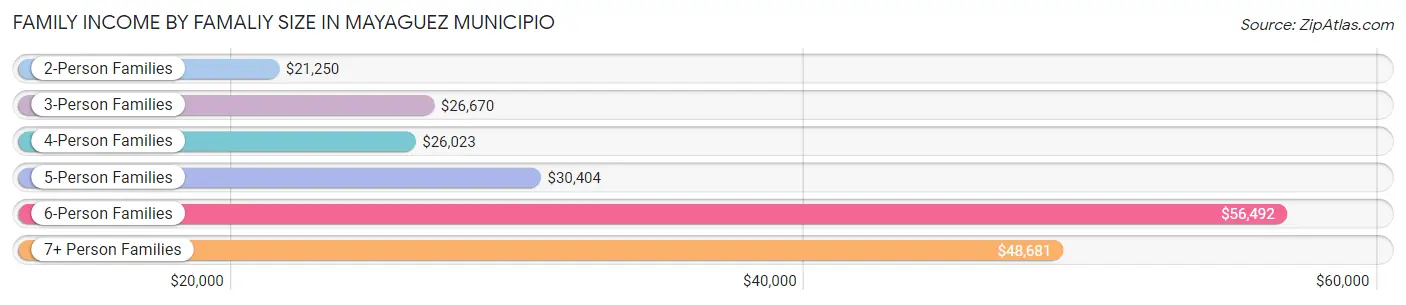
| Income Bracket | # Families | Median Income |
| 2-Person Families | 8,621 (52.2%) | $21,250 |
| 3-Person Families | 4,223 (25.6%) | $26,670 |
| 4-Person Families | 2,610 (15.8%) | $26,023 |
| 5-Person Families | 801 (4.9%) | $30,404 |
| 6-Person Families | 225 (1.4%) | $56,492 |
| 7+ Person Families | 33 (0.2%) | $48,681 |
| Total | 16,513 (100.0%) | $23,559 |
Family Income by Number of Earners in Mayaguez Municipio
The median family income in Mayaguez Municipio is $23,559, with families comprising 3+ earners (551) having the highest median family income of $63,775, while families with no earners (6,690) have the lowest median family income of $14,788, accounting for 3.3% and 40.5% of families, respectively.
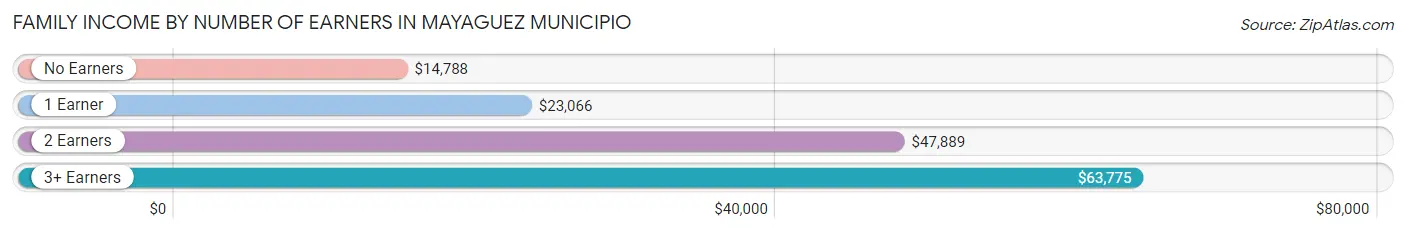
| Number of Earners | # Families | Median Income |
| No Earners | 6,690 (40.5%) | $14,788 |
| 1 Earner | 6,015 (36.4%) | $23,066 |
| 2 Earners | 3,257 (19.7%) | $47,889 |
| 3+ Earners | 551 (3.3%) | $63,775 |
| Total | 16,513 (100.0%) | $23,559 |
Household Income in Mayaguez Municipio
Household Income Brackets in Mayaguez Municipio
With 9,918 households falling in the category, the less than $10,000 income range is the most frequent in Mayaguez Municipio, accounting for 33.8% of all households. In contrast, only 205 households (0.7%) fall into the $150,000 to $199,999 income bracket, making it the least populous group.
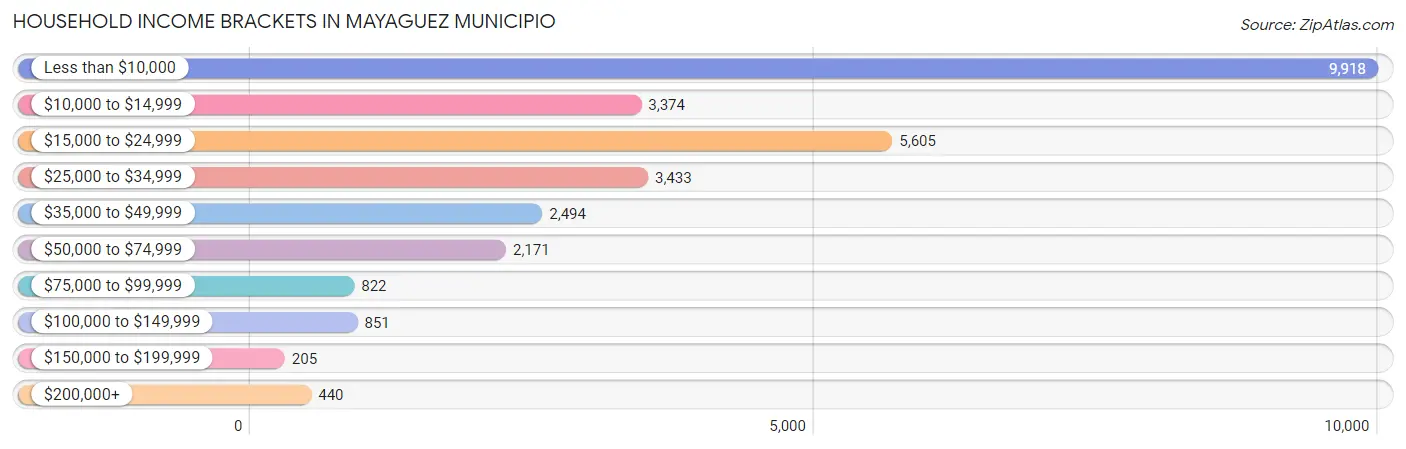
| Income Bracket | # Households | % Households |
| Less than $10,000 | 9,918 | 33.8% |
| $10,000 to $14,999 | 3,374 | 11.5% |
| $15,000 to $24,999 | 5,605 | 19.1% |
| $25,000 to $34,999 | 3,433 | 11.7% |
| $35,000 to $49,999 | 2,494 | 8.5% |
| $50,000 to $74,999 | 2,171 | 7.4% |
| $75,000 to $99,999 | 822 | 2.8% |
| $100,000 to $149,999 | 851 | 2.9% |
| $150,000 to $199,999 | 205 | 0.7% |
| $200,000+ | 440 | 1.5% |
Household Income by Householder Age in Mayaguez Municipio
The median household income in Mayaguez Municipio is $16,788, with the highest median household income of $21,100 found in the 45 to 64 years age bracket for the primary householder. A total of 8,644 households (29.5%) fall into this category. Meanwhile, the 15 to 24 years age bracket for the primary householder has the lowest median household income of $2,499, with 2,657 households (9.0%) in this group.
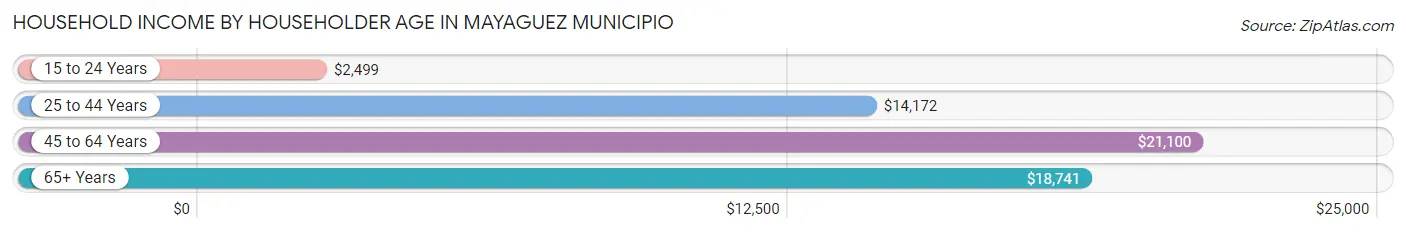
| Income Bracket | # Households | Median Income |
| 15 to 24 Years | 2,657 (9.0%) | $2,499 |
| 25 to 44 Years | 6,398 (21.8%) | $14,172 |
| 45 to 64 Years | 8,644 (29.5%) | $21,100 |
| 65+ Years | 11,644 (39.7%) | $18,741 |
| Total | 29,343 (100.0%) | $16,788 |
Poverty in Mayaguez Municipio
Income Below Poverty by Sex and Age in Mayaguez Municipio
With 52.0% poverty level for males and 54.9% for females among the residents of Mayaguez Municipio, 5 year old males and under 5 year old females are the most vulnerable to poverty, with 408 males (97.6%) and 889 females (80.4%) in their respective age groups living below the poverty level.
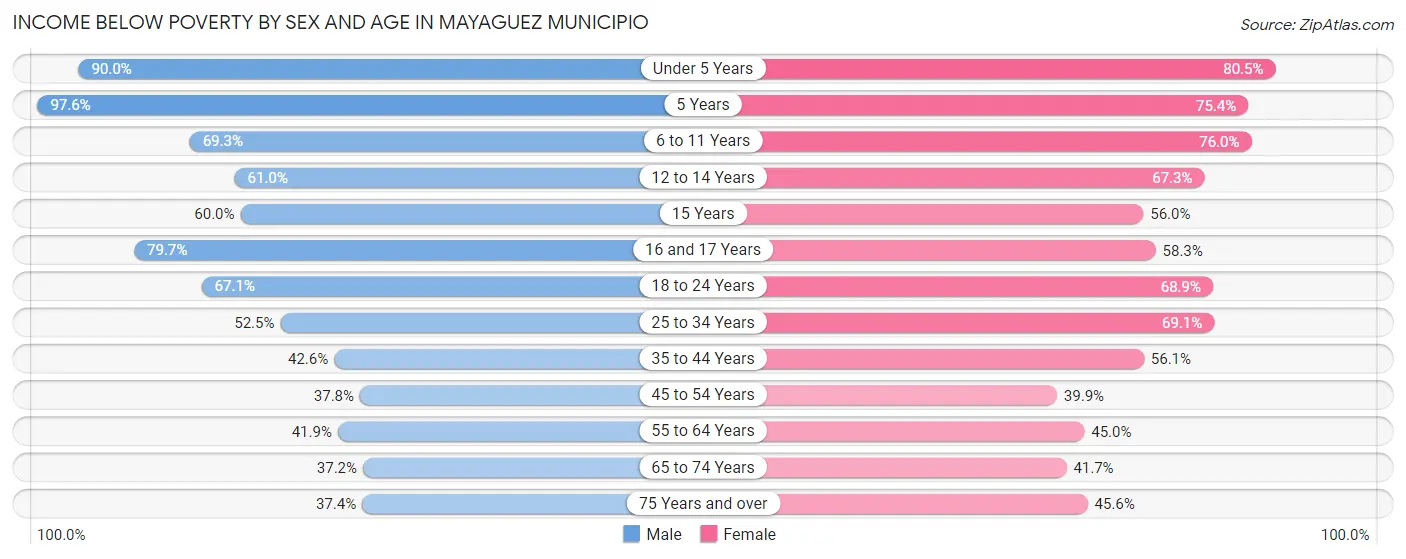
| Age Bracket | Male | Female |
| Under 5 Years | 1,089 (90.0%) | 889 (80.4%) |
| 5 Years | 408 (97.6%) | 190 (75.4%) |
| 6 to 11 Years | 1,454 (69.3%) | 1,502 (76.0%) |
| 12 to 14 Years | 551 (61.0%) | 716 (67.3%) |
| 15 Years | 253 (60.0%) | 197 (56.0%) |
| 16 and 17 Years | 741 (79.7%) | 512 (58.3%) |
| 18 to 24 Years | 3,928 (67.1%) | 3,544 (68.9%) |
| 25 to 34 Years | 2,257 (52.5%) | 2,690 (69.1%) |
| 35 to 44 Years | 1,408 (42.6%) | 1,964 (56.1%) |
| 45 to 54 Years | 1,302 (37.8%) | 1,568 (39.9%) |
| 55 to 64 Years | 1,680 (41.9%) | 2,113 (45.0%) |
| 65 to 74 Years | 1,414 (37.2%) | 2,060 (41.7%) |
| 75 Years and over | 1,327 (37.4%) | 2,597 (45.6%) |
| Total | 17,812 (52.0%) | 20,542 (54.9%) |
Income Above Poverty by Sex and Age in Mayaguez Municipio
According to the poverty statistics in Mayaguez Municipio, males aged 65 to 74 years and females aged 45 to 54 years are the age groups that are most secure financially, with 62.8% of males and 60.1% of females in these age groups living above the poverty line.
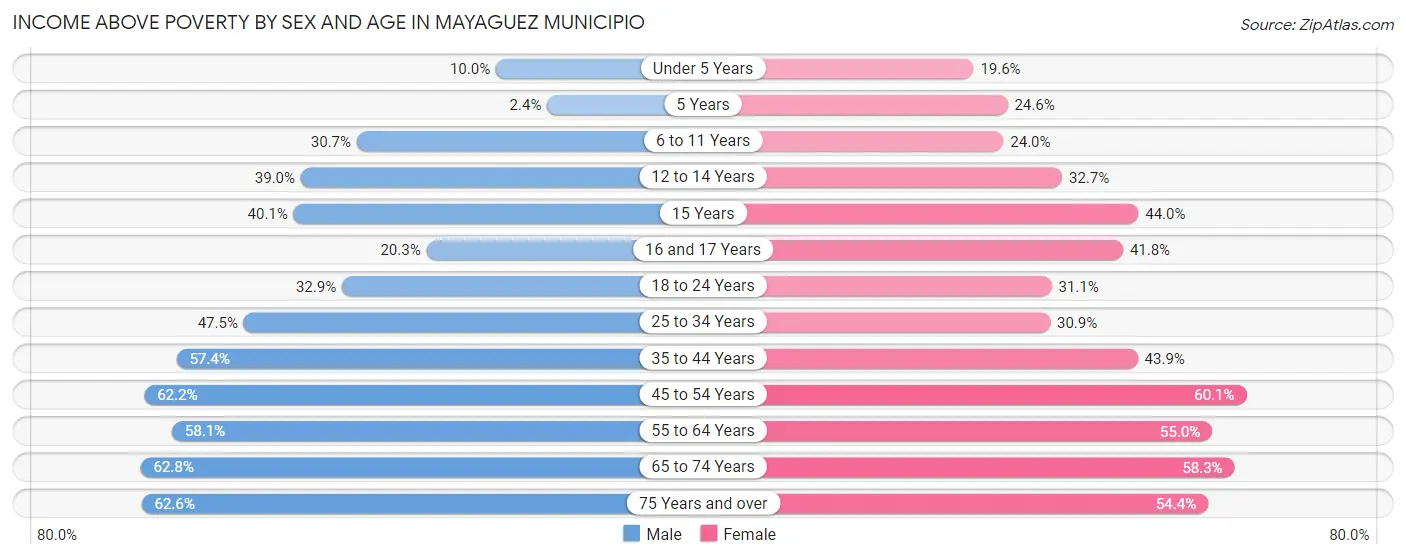
| Age Bracket | Male | Female |
| Under 5 Years | 121 (10.0%) | 216 (19.6%) |
| 5 Years | 10 (2.4%) | 62 (24.6%) |
| 6 to 11 Years | 643 (30.7%) | 474 (24.0%) |
| 12 to 14 Years | 352 (39.0%) | 348 (32.7%) |
| 15 Years | 169 (40.1%) | 155 (44.0%) |
| 16 and 17 Years | 189 (20.3%) | 367 (41.7%) |
| 18 to 24 Years | 1,923 (32.9%) | 1,603 (31.1%) |
| 25 to 34 Years | 2,039 (47.5%) | 1,204 (30.9%) |
| 35 to 44 Years | 1,900 (57.4%) | 1,539 (43.9%) |
| 45 to 54 Years | 2,145 (62.2%) | 2,359 (60.1%) |
| 55 to 64 Years | 2,331 (58.1%) | 2,582 (55.0%) |
| 65 to 74 Years | 2,386 (62.8%) | 2,880 (58.3%) |
| 75 Years and over | 2,225 (62.6%) | 3,095 (54.4%) |
| Total | 16,433 (48.0%) | 16,884 (45.1%) |
Income Below Poverty Among Married-Couple Families in Mayaguez Municipio
The poverty statistics for married-couple families in Mayaguez Municipio show that 31.5% or 2,847 of the total 9,041 families live below the poverty line. Families with 3 or 4 children have the highest poverty rate of 73.7%, comprising of 98 families. On the other hand, families with no children have the lowest poverty rate of 27.6%, which includes 1,860 families.
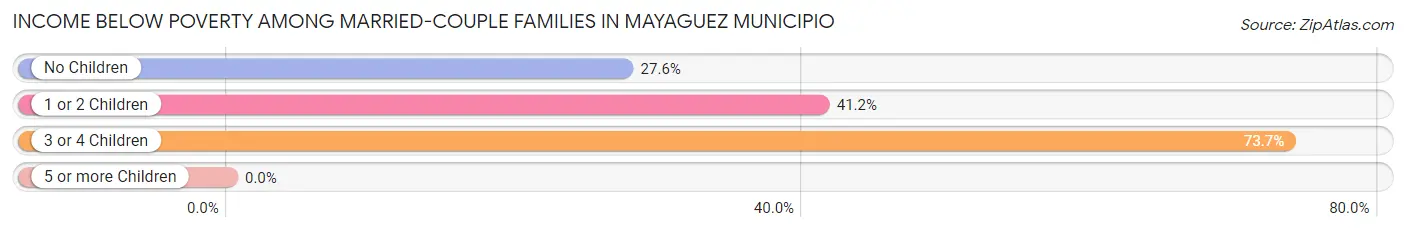
| Children | Above Poverty | Below Poverty |
| No Children | 4,891 (72.5%) | 1,860 (27.6%) |
| 1 or 2 Children | 1,268 (58.8%) | 889 (41.2%) |
| 3 or 4 Children | 35 (26.3%) | 98 (73.7%) |
| 5 or more Children | 0 (0.0%) | 0 (0.0%) |
| Total | 6,194 (68.5%) | 2,847 (31.5%) |
Income Below Poverty Among Single-Parent Households in Mayaguez Municipio
According to the poverty data in Mayaguez Municipio, 55.6% or 758 single-father households and 69.5% or 4,245 single-mother households are living below the poverty line. Among single-father households, those with 3 or 4 children have the highest poverty rate, with 25 households (78.1%) experiencing poverty. Likewise, among single-mother households, those with 3 or 4 children have the highest poverty rate, with 774 households (98.4%) falling below the poverty line.
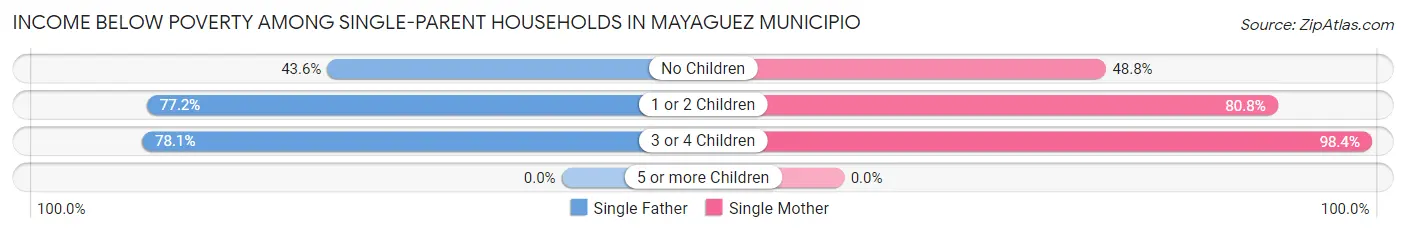
| Children | Single Father | Single Mother |
| No Children | 384 (43.6%) | 1,261 (48.8%) |
| 1 or 2 Children | 349 (77.2%) | 2,210 (80.8%) |
| 3 or 4 Children | 25 (78.1%) | 774 (98.4%) |
| 5 or more Children | 0 (0.0%) | 0 (0.0%) |
| Total | 758 (55.6%) | 4,245 (69.5%) |
Income Below Poverty Among Married-Couple vs Single-Parent Households in Mayaguez Municipio
The poverty data for Mayaguez Municipio shows that 2,847 of the married-couple family households (31.5%) and 5,003 of the single-parent households (67.0%) are living below the poverty level. Within the married-couple family households, those with 3 or 4 children have the highest poverty rate, with 98 households (73.7%) falling below the poverty line. Among the single-parent households, those with 3 or 4 children have the highest poverty rate, with 799 household (97.6%) living below poverty.
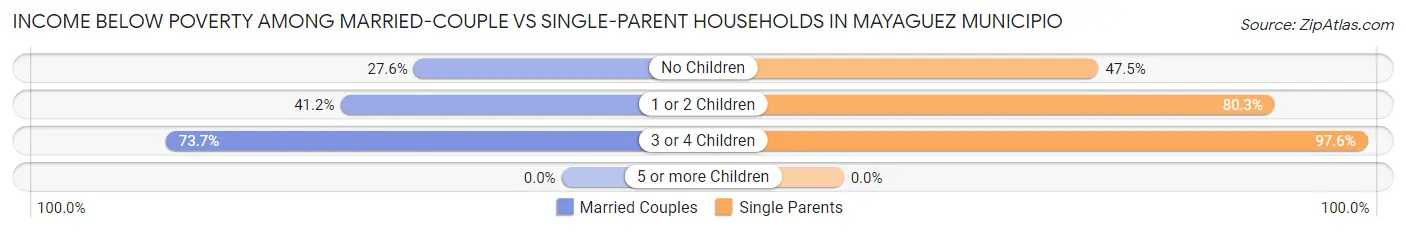
| Children | Married-Couple Families | Single-Parent Households |
| No Children | 1,860 (27.6%) | 1,645 (47.5%) |
| 1 or 2 Children | 889 (41.2%) | 2,559 (80.3%) |
| 3 or 4 Children | 98 (73.7%) | 799 (97.6%) |
| 5 or more Children | 0 (0.0%) | 0 (0.0%) |
| Total | 2,847 (31.5%) | 5,003 (67.0%) |
Race in Mayaguez Municipio
The most populous races in Mayaguez Municipio are Hispanic or Latino (72,113 | 99.2%), Some other Race (53,772 | 73.9%), and White / Caucasian (12,221 | 16.8%).
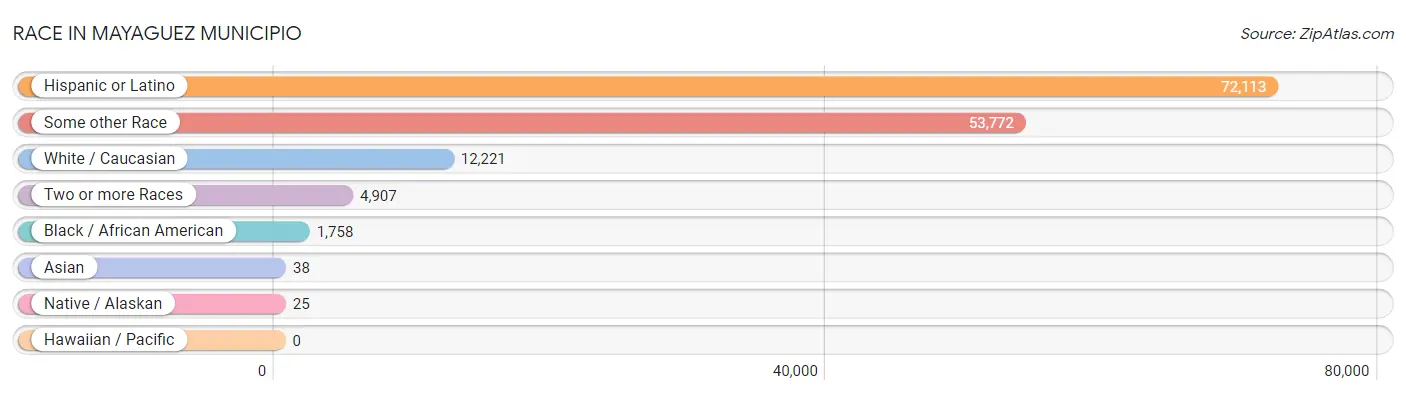
| Race | # Population | % Population |
| Asian | 38 | 0.1% |
| Black / African American | 1,758 | 2.4% |
| Hawaiian / Pacific | 0 | 0.0% |
| Hispanic or Latino | 72,113 | 99.2% |
| Native / Alaskan | 25 | 0.0% |
| White / Caucasian | 12,221 | 16.8% |
| Two or more Races | 4,907 | 6.8% |
| Some other Race | 53,772 | 73.9% |
| Total | 72,721 | 100.0% |
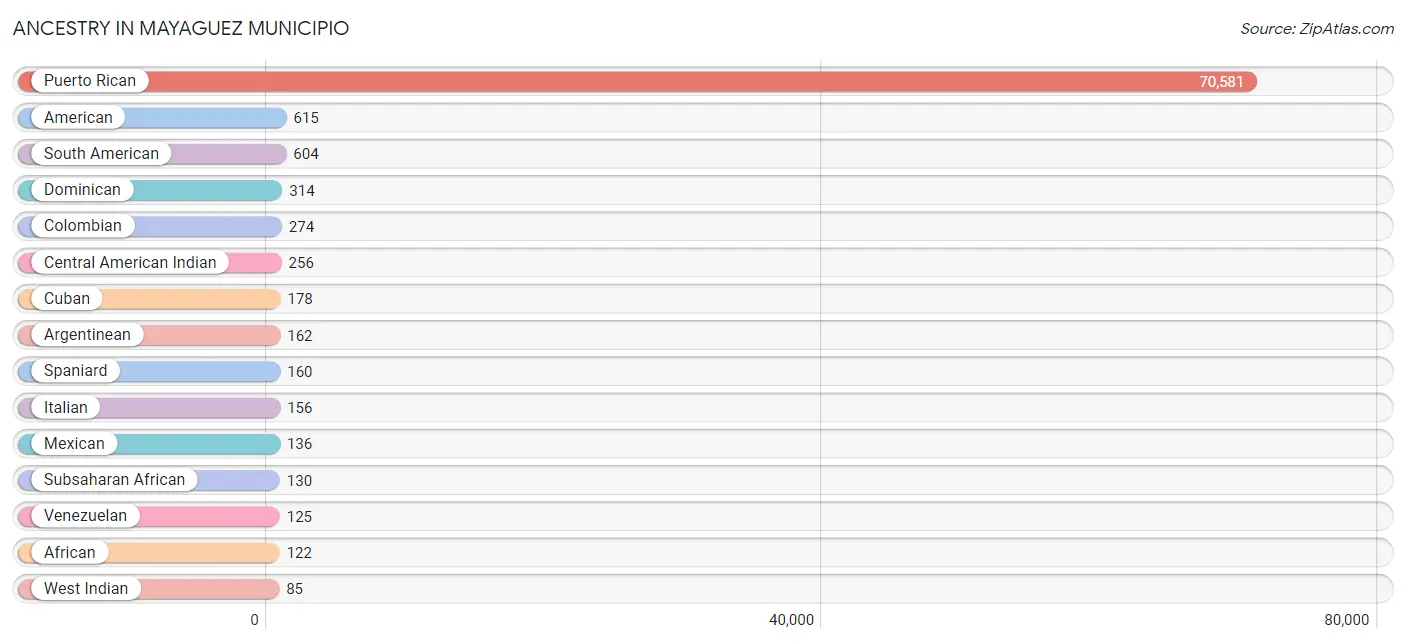
Ancestry in Mayaguez Municipio
The most populous ancestries reported in Mayaguez Municipio are Puerto Rican (70,581 | 97.1%), American (615 | 0.9%), South American (604 | 0.8%), Dominican (314 | 0.4%), and Colombian (274 | 0.4%), together accounting for 99.5% of all Mayaguez Municipio residents.
| Ancestry | # Population | % Population |
| African | 122 | 0.2% |
| American | 615 | 0.9% |
| Arab | 23 | 0.0% |
| Argentinean | 162 | 0.2% |
| Basque | 9 | 0.0% |
| British | 33 | 0.1% |
| Burmese | 21 | 0.0% |
| Central American | 67 | 0.1% |
| Central American Indian | 256 | 0.4% |
| Colombian | 274 | 0.4% |
| Costa Rican | 9 | 0.0% |
| Croatian | 9 | 0.0% |
| Cuban | 178 | 0.2% |
| Dominican | 314 | 0.4% |
| English | 8 | 0.0% |
| French | 13 | 0.0% |
| German | 17 | 0.0% |
| Guyanese | 12 | 0.0% |
| Haitian | 32 | 0.0% |
| Honduran | 14 | 0.0% |
| Indian (Asian) | 10 | 0.0% |
| Iranian | 70 | 0.1% |
| Irish | 29 | 0.0% |
| Israeli | 8 | 0.0% |
| Italian | 156 | 0.2% |
| Lebanese | 5 | 0.0% |
| Mexican | 136 | 0.2% |
| Native Hawaiian | 10 | 0.0% |
| Nigerian | 8 | 0.0% |
| Paraguayan | 16 | 0.0% |
| Peruvian | 27 | 0.0% |
| Portuguese | 7 | 0.0% |
| Puerto Rican | 70,581 | 97.1% |
| Salvadoran | 44 | 0.1% |
| South American | 604 | 0.8% |
| Spaniard | 160 | 0.2% |
| Subsaharan African | 130 | 0.2% |
| Syrian | 18 | 0.0% |
| Thai | 38 | 0.1% |
| U.S. Virgin Islander | 18 | 0.0% |
| Venezuelan | 125 | 0.2% |
| West Indian | 85 | 0.1% | View All 42 Rows |
Immigrants in Mayaguez Municipio

| Immigration Origin | # Population | % Population | View All 0 Rows |
Sex and Age in Mayaguez Municipio
Sex and Age in Mayaguez Municipio
The most populous age groups in Mayaguez Municipio are 20 to 24 Years (4,481 | 12.9%) for men and 20 to 24 Years (3,879 | 10.2%) for women.
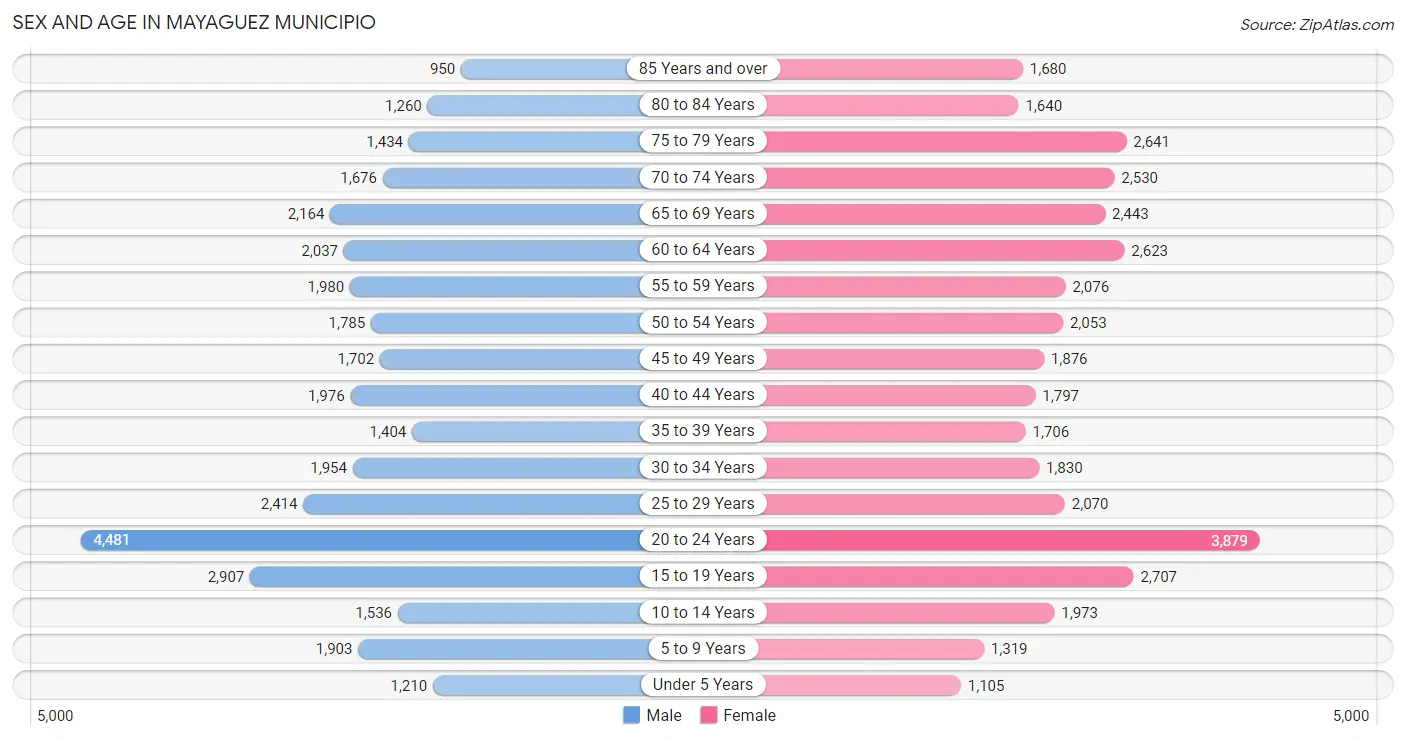
| Age Bracket | Male | Female |
| Under 5 Years | 1,210 (3.5%) | 1,105 (2.9%) |
| 5 to 9 Years | 1,903 (5.5%) | 1,319 (3.5%) |
| 10 to 14 Years | 1,536 (4.4%) | 1,973 (5.2%) |
| 15 to 19 Years | 2,907 (8.4%) | 2,707 (7.1%) |
| 20 to 24 Years | 4,481 (12.9%) | 3,879 (10.2%) |
| 25 to 29 Years | 2,414 (6.9%) | 2,070 (5.4%) |
| 30 to 34 Years | 1,954 (5.6%) | 1,830 (4.8%) |
| 35 to 39 Years | 1,404 (4.0%) | 1,706 (4.5%) |
| 40 to 44 Years | 1,976 (5.7%) | 1,797 (4.7%) |
| 45 to 49 Years | 1,702 (4.9%) | 1,876 (4.9%) |
| 50 to 54 Years | 1,785 (5.1%) | 2,053 (5.4%) |
| 55 to 59 Years | 1,980 (5.7%) | 2,076 (5.5%) |
| 60 to 64 Years | 2,037 (5.9%) | 2,623 (6.9%) |
| 65 to 69 Years | 2,164 (6.2%) | 2,443 (6.4%) |
| 70 to 74 Years | 1,676 (4.8%) | 2,530 (6.7%) |
| 75 to 79 Years | 1,434 (4.1%) | 2,641 (7.0%) |
| 80 to 84 Years | 1,260 (3.6%) | 1,640 (4.3%) |
| 85 Years and over | 950 (2.7%) | 1,680 (4.4%) |
| Total | 34,773 (100.0%) | 37,948 (100.0%) |
Families and Households in Mayaguez Municipio
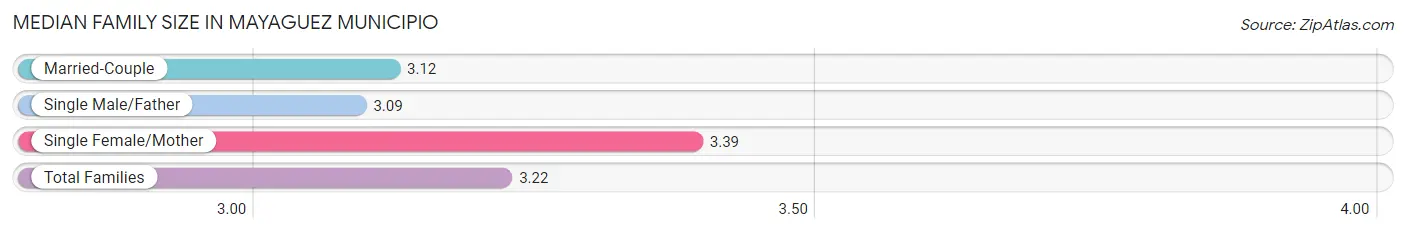
Median Family Size in Mayaguez Municipio
The median family size in Mayaguez Municipio is 3.22 persons per family, with single female/mother families (6,108 | 37.0%) accounting for the largest median family size of 3.39 persons per family. On the other hand, single male/father families (1,364 | 8.3%) represent the smallest median family size with 3.09 persons per family.
| Family Type | # Families | Family Size |
| Married-Couple | 9,041 (54.7%) | 3.12 |
| Single Male/Father | 1,364 (8.3%) | 3.09 |
| Single Female/Mother | 6,108 (37.0%) | 3.39 |
| Total Families | 16,513 (100.0%) | 3.22 |
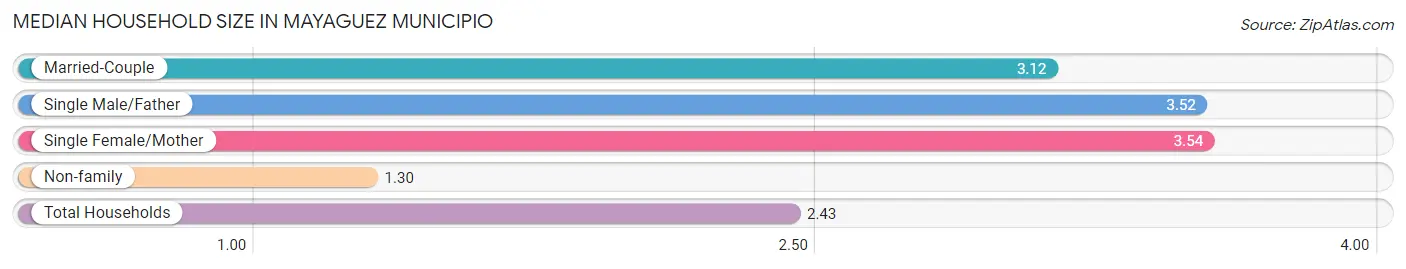
Median Household Size in Mayaguez Municipio
The median household size in Mayaguez Municipio is 2.43 persons per household, with single female/mother households (6,108 | 20.8%) accounting for the largest median household size of 3.54 persons per household. non-family households (12,830 | 43.7%) represent the smallest median household size with 1.30 persons per household.
| Household Type | # Households | Household Size |
| Married-Couple | 9,041 (30.8%) | 3.12 |
| Single Male/Father | 1,364 (4.6%) | 3.52 |
| Single Female/Mother | 6,108 (20.8%) | 3.54 |
| Non-family | 12,830 (43.7%) | 1.30 |
| Total Households | 29,343 (100.0%) | 2.43 |
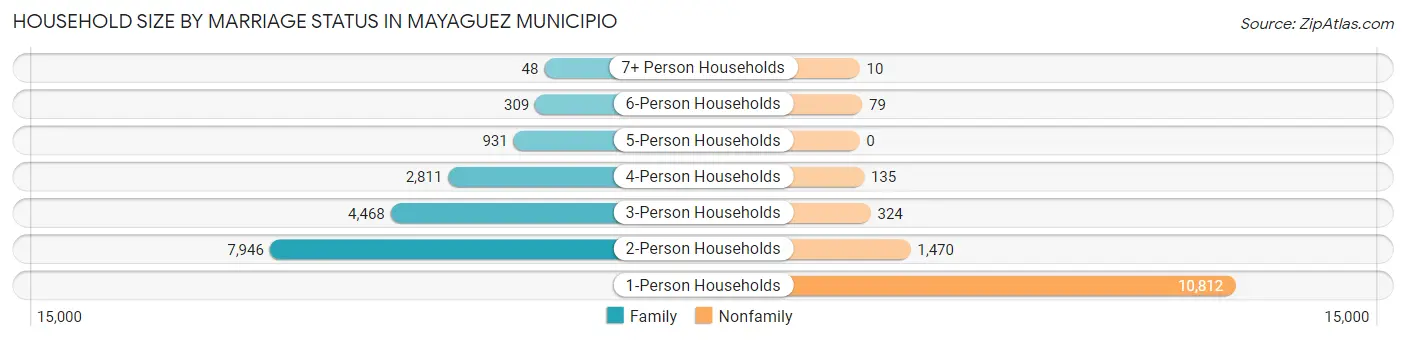
Household Size by Marriage Status in Mayaguez Municipio
Out of a total of 29,343 households in Mayaguez Municipio, 16,513 (56.3%) are family households, while 12,830 (43.7%) are nonfamily households. The most numerous type of family households are 2-person households, comprising 7,946, and the most common type of nonfamily households are 1-person households, comprising 10,812.
| Household Size | Family Households | Nonfamily Households |
| 1-Person Households | - | 10,812 (36.8%) |
| 2-Person Households | 7,946 (27.1%) | 1,470 (5.0%) |
| 3-Person Households | 4,468 (15.2%) | 324 (1.1%) |
| 4-Person Households | 2,811 (9.6%) | 135 (0.5%) |
| 5-Person Households | 931 (3.2%) | 0 (0.0%) |
| 6-Person Households | 309 (1.1%) | 79 (0.3%) |
| 7+ Person Households | 48 (0.2%) | 10 (0.0%) |
| Total | 16,513 (56.3%) | 12,830 (43.7%) |
Female Fertility in Mayaguez Municipio
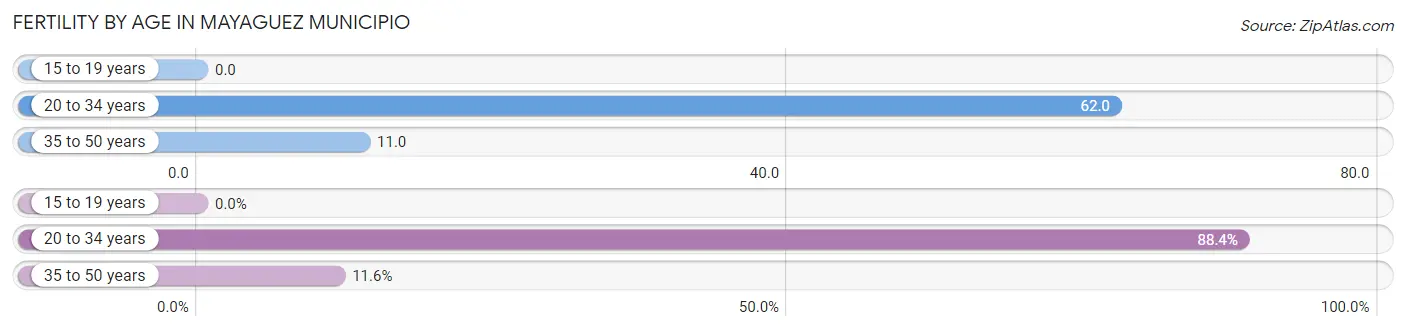
Fertility by Age in Mayaguez Municipio
Average fertility rate in Mayaguez Municipio is 34.0 births per 1,000 women. Women in the age bracket of 20 to 34 years have the highest fertility rate with 62.0 births per 1,000 women. Women in the age bracket of 20 to 34 years acount for 88.4% of all women with births.
| Age Bracket | Women with Births | Births / 1,000 Women |
| 15 to 19 years | 0 (0.0%) | 0.0 |
| 20 to 34 years | 486 (88.4%) | 62.0 |
| 35 to 50 years | 64 (11.6%) | 11.0 |
| Total | 550 (100.0%) | 34.0 |
Fertility by Age by Marriage Status in Mayaguez Municipio
33.5% of women with births (550) in Mayaguez Municipio are married. The highest percentage of unmarried women with births falls into 20 to 34 years age bracket with 73.1% of them unmarried at the time of birth, while the lowest percentage of unmarried women with births belong to 35 to 50 years age bracket with 17.2% of them unmarried.
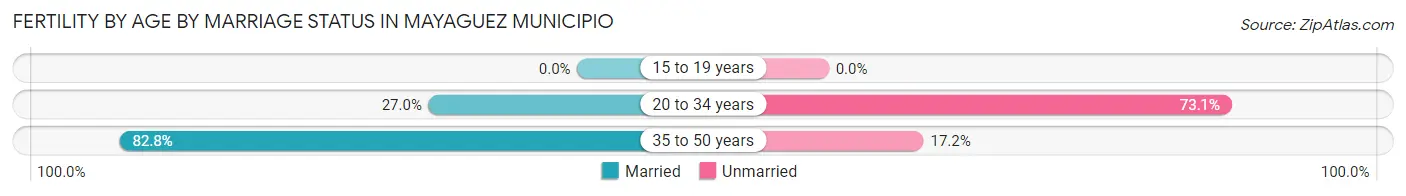
| Age Bracket | Married | Unmarried |
| 15 to 19 years | 0 (0.0%) | 0 (0.0%) |
| 20 to 34 years | 131 (27.0%) | 355 (73.1%) |
| 35 to 50 years | 53 (82.8%) | 11 (17.2%) |
| Total | 184 (33.5%) | 366 (66.5%) |
Fertility by Education in Mayaguez Municipio
Average fertility rate in Mayaguez Municipio is 34.0 births per 1,000 women. Women with the education attainment of graduate degree have the highest fertility rate of 68.0 births per 1,000 women, while women with the education attainment of bachelor's degree have the lowest fertility at 27.0 births per 1,000 women. Women with the education attainment of college or associate's degree represent 40.6% of all women with births.
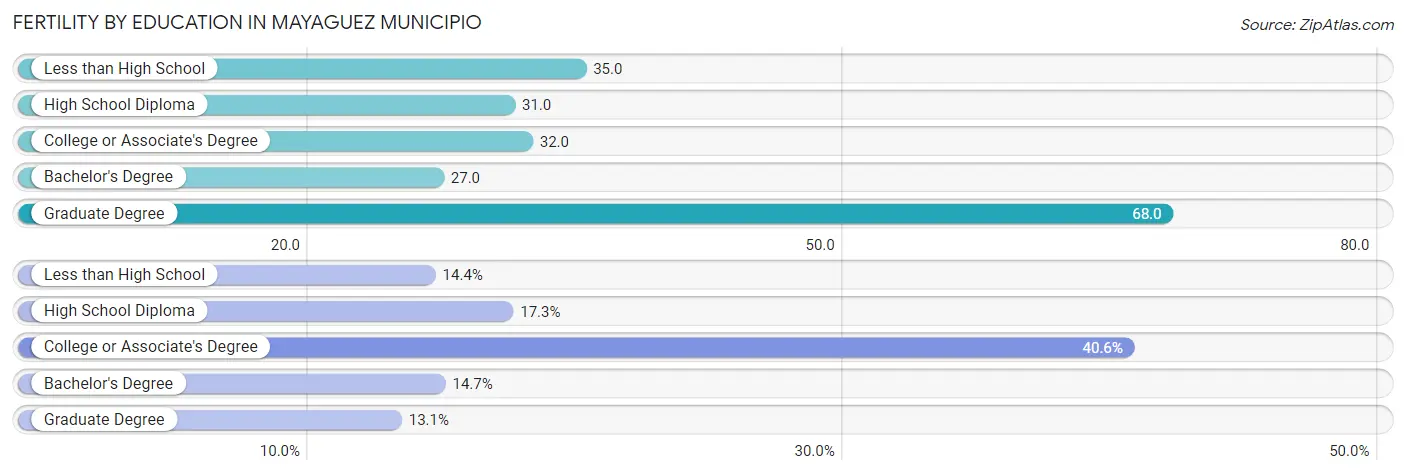
| Educational Attainment | Women with Births | Births / 1,000 Women |
| Less than High School | 79 (14.4%) | 35.0 |
| High School Diploma | 95 (17.3%) | 31.0 |
| College or Associate's Degree | 223 (40.6%) | 32.0 |
| Bachelor's Degree | 81 (14.7%) | 27.0 |
| Graduate Degree | 72 (13.1%) | 68.0 |
| Total | 550 (100.0%) | 34.0 |
Fertility by Education by Marriage Status in Mayaguez Municipio
66.5% of women with births in Mayaguez Municipio are unmarried. Women with the educational attainment of graduate degree are most likely to be married with 100.0% of them married at childbirth, while women with the educational attainment of less than high school are least likely to be married with 91.1% of them unmarried at childbirth.
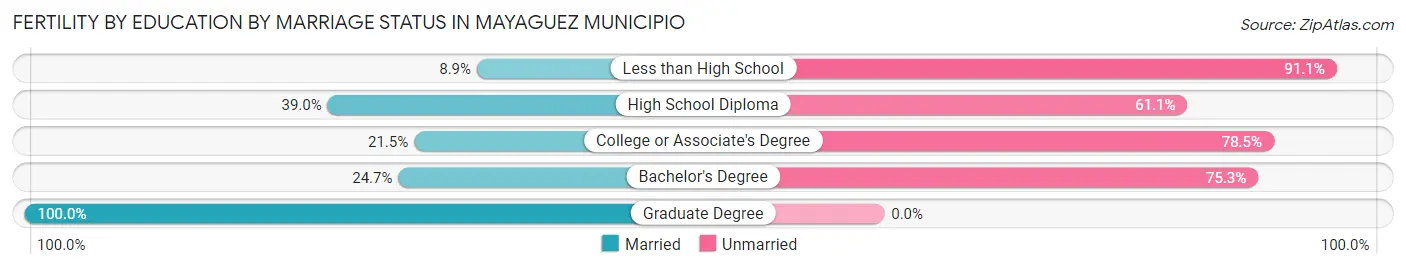
| Educational Attainment | Married | Unmarried |
| Less than High School | 7 (8.9%) | 72 (91.1%) |
| High School Diploma | 37 (39.0%) | 58 (61.1%) |
| College or Associate's Degree | 48 (21.5%) | 175 (78.5%) |
| Bachelor's Degree | 20 (24.7%) | 61 (75.3%) |
| Graduate Degree | 72 (100.0%) | 0 (0.0%) |
| Total | 184 (33.5%) | 366 (66.5%) |
Employment Characteristics in Mayaguez Municipio
Employment by Class of Employer in Mayaguez Municipio
Among the 18,771 employed individuals in Mayaguez Municipio, private company employees (12,379 | 65.9%), state government employees (2,297 | 12.2%), and self-employed (not incorporated) (1,787 | 9.5%) make up the most common classes of employment.
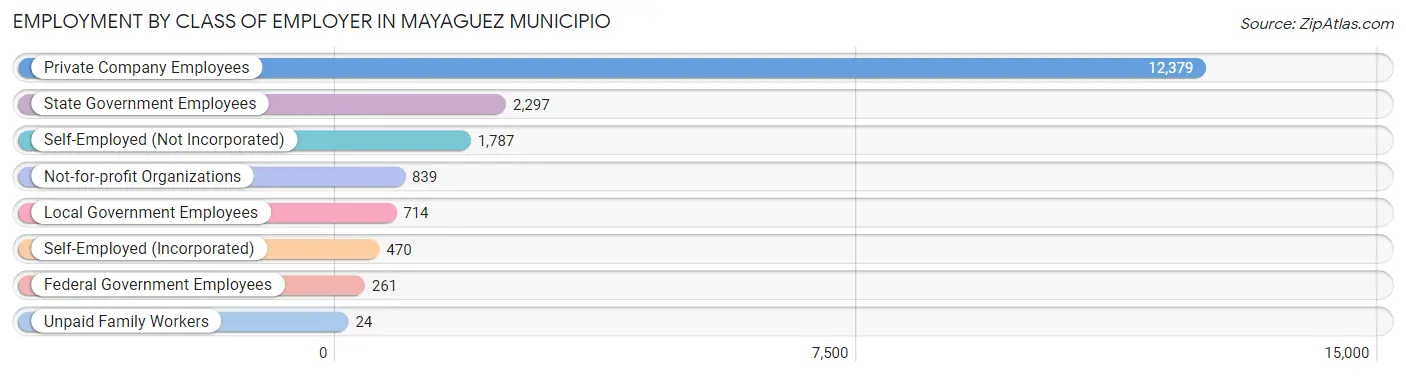
| Employer Class | # Employees | % Employees |
| Private Company Employees | 12,379 | 65.9% |
| Self-Employed (Incorporated) | 470 | 2.5% |
| Self-Employed (Not Incorporated) | 1,787 | 9.5% |
| Not-for-profit Organizations | 839 | 4.5% |
| Local Government Employees | 714 | 3.8% |
| State Government Employees | 2,297 | 12.2% |
| Federal Government Employees | 261 | 1.4% |
| Unpaid Family Workers | 24 | 0.1% |
| Total | 18,771 | 100.0% |
Employment Status by Age in Mayaguez Municipio
According to the labor force statistics for Mayaguez Municipio, out of the total population over 16 years of age (62,901), 40.3% or 25,349 individuals are in the labor force, with 23.9% or 6,058 of them unemployed. The age group with the highest labor force participation rate is 30 to 34 years, with 76.3% or 2,887 individuals in the labor force. Within the labor force, the 16 to 19 years age range has the highest percentage of unemployed individuals, with 56.0% or 596 of them being unemployed.
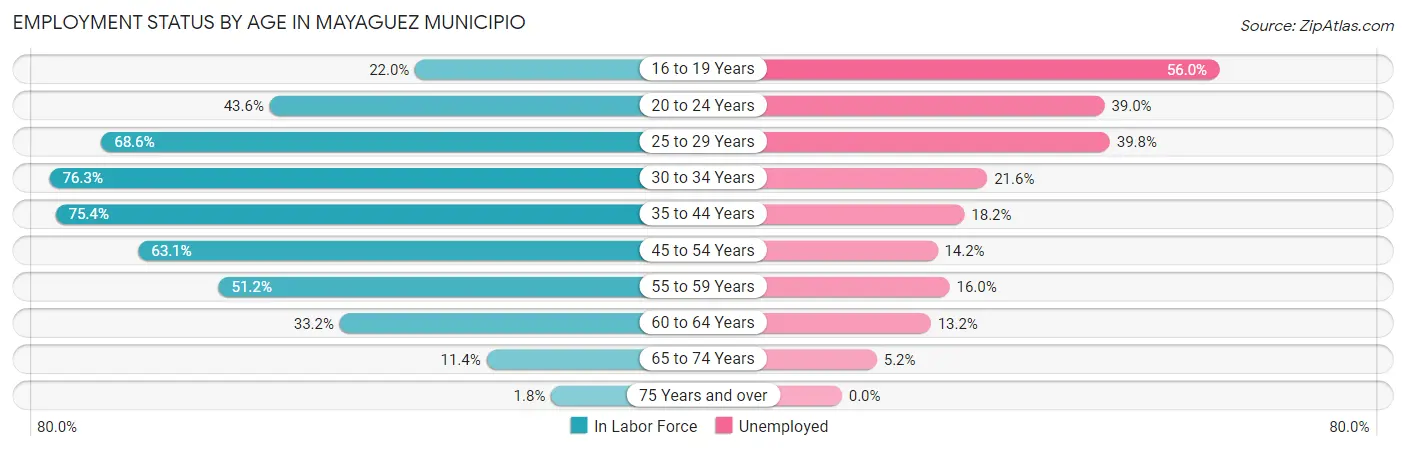
| Age Bracket | In Labor Force | Unemployed |
| 16 to 19 Years | 1,065 (22.0%) | 596 (56.0%) |
| 20 to 24 Years | 3,645 (43.6%) | 1,422 (39.0%) |
| 25 to 29 Years | 3,076 (68.6%) | 1,224 (39.8%) |
| 30 to 34 Years | 2,887 (76.3%) | 624 (21.6%) |
| 35 to 44 Years | 5,190 (75.4%) | 945 (18.2%) |
| 45 to 54 Years | 4,679 (63.1%) | 664 (14.2%) |
| 55 to 59 Years | 2,077 (51.2%) | 332 (16.0%) |
| 60 to 64 Years | 1,547 (33.2%) | 204 (13.2%) |
| 65 to 74 Years | 1,005 (11.4%) | 52 (5.2%) |
| 75 Years and over | 173 (1.8%) | 0 (0.0%) |
| Total | 25,349 (40.3%) | 6,058 (23.9%) |
Employment Status by Educational Attainment in Mayaguez Municipio
According to labor force statistics for Mayaguez Municipio, 62.2% of individuals (19,458) out of the total population between 25 and 64 years of age (31,283) are in the labor force, with 20.5% or 3,989 of them being unemployed. The group with the highest labor force participation rate are those with the educational attainment of bachelor's degree or higher, with 71.9% or 7,061 individuals in the labor force. Within the labor force, individuals with less than high school education have the highest percentage of unemployment, with 38.8% or 859 of them being unemployed.
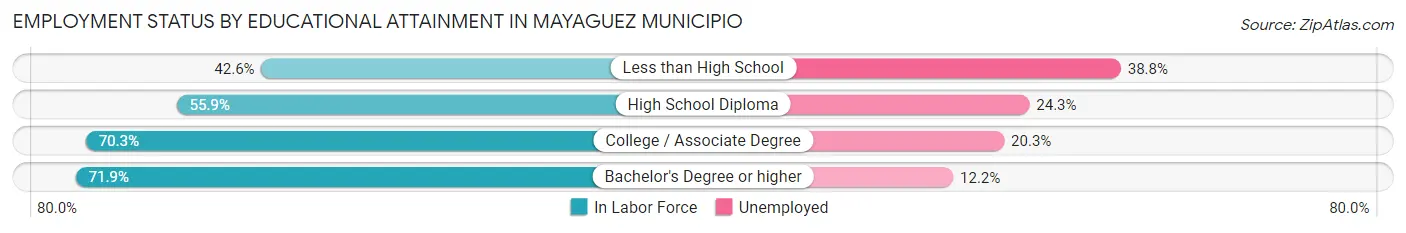
| Educational Attainment | In Labor Force | Unemployed |
| Less than High School | 2,214 (42.6%) | 2,016 (38.8%) |
| High School Diploma | 4,853 (55.9%) | 2,109 (24.3%) |
| College / Associate Degree | 5,332 (70.3%) | 1,540 (20.3%) |
| Bachelor's Degree or higher | 7,061 (71.9%) | 1,198 (12.2%) |
| Total | 19,458 (62.2%) | 6,413 (20.5%) |
Employment Occupations by Sex in Mayaguez Municipio
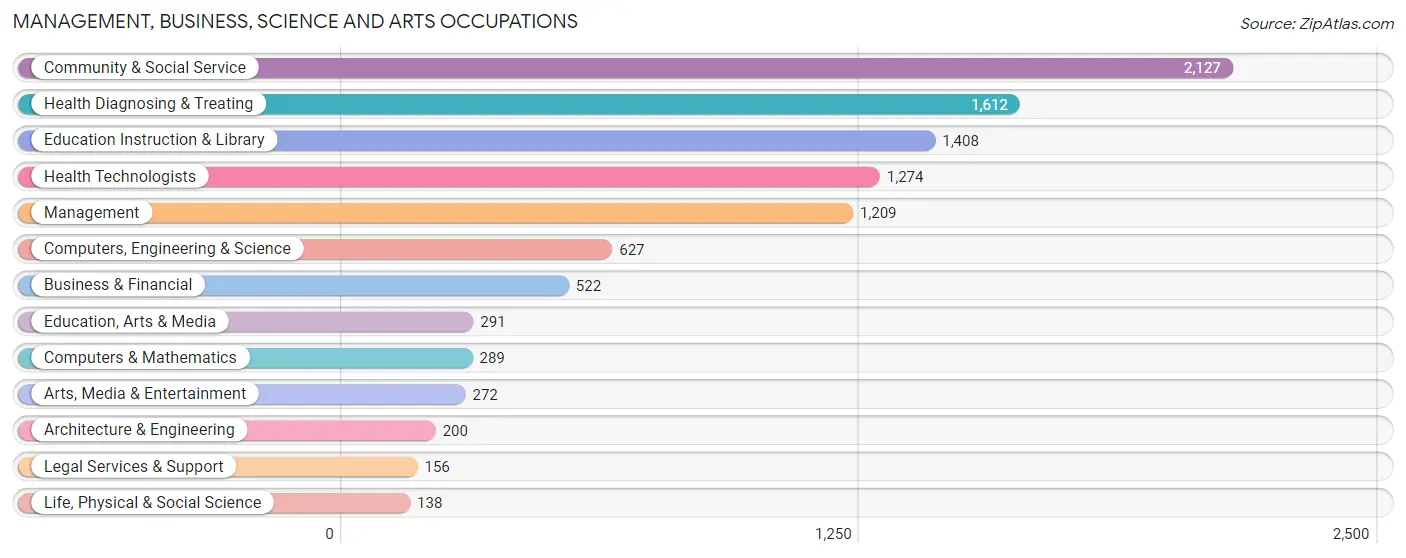
Management, Business, Science and Arts Occupations
The most common Management, Business, Science and Arts occupations in Mayaguez Municipio are Community & Social Service (2,127 | 11.0%), Health Diagnosing & Treating (1,612 | 8.4%), Education Instruction & Library (1,408 | 7.3%), Health Technologists (1,274 | 6.6%), and Management (1,209 | 6.3%).
Management, Business, Science and Arts Occupations by Sex
Within the Management, Business, Science and Arts occupations in Mayaguez Municipio, the most male-oriented occupations are Computers & Mathematics (73.4%), Computers, Engineering & Science (65.2%), and Arts, Media & Entertainment (64.7%), while the most female-oriented occupations are Education, Arts & Media (76.3%), Business & Financial (66.5%), and Health Technologists (64.3%).
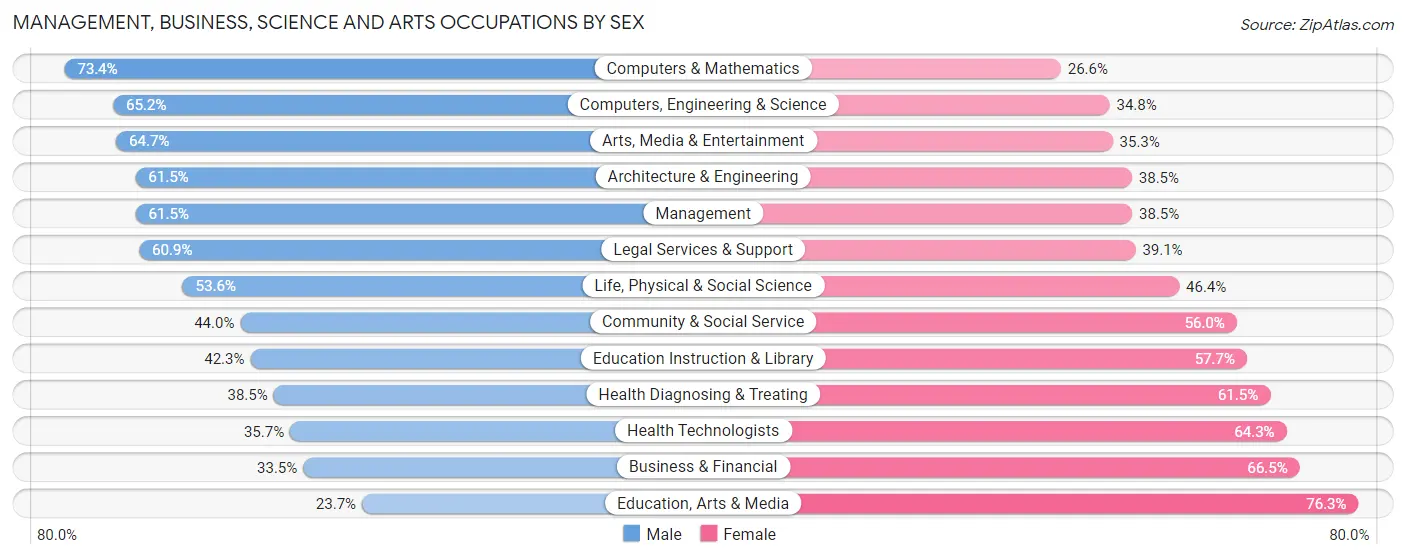
| Occupation | Male | Female |
| Management | 743 (61.5%) | 466 (38.5%) |
| Business & Financial | 175 (33.5%) | 347 (66.5%) |
| Computers, Engineering & Science | 409 (65.2%) | 218 (34.8%) |
| Computers & Mathematics | 212 (73.4%) | 77 (26.6%) |
| Architecture & Engineering | 123 (61.5%) | 77 (38.5%) |
| Life, Physical & Social Science | 74 (53.6%) | 64 (46.4%) |
| Community & Social Service | 936 (44.0%) | 1,191 (56.0%) |
| Education, Arts & Media | 69 (23.7%) | 222 (76.3%) |
| Legal Services & Support | 95 (60.9%) | 61 (39.1%) |
| Education Instruction & Library | 596 (42.3%) | 812 (57.7%) |
| Arts, Media & Entertainment | 176 (64.7%) | 96 (35.3%) |
| Health Diagnosing & Treating | 620 (38.5%) | 992 (61.5%) |
| Health Technologists | 455 (35.7%) | 819 (64.3%) |
| Total (Category) | 2,883 (47.3%) | 3,214 (52.7%) |
| Total (Overall) | 10,242 (53.2%) | 9,021 (46.8%) |
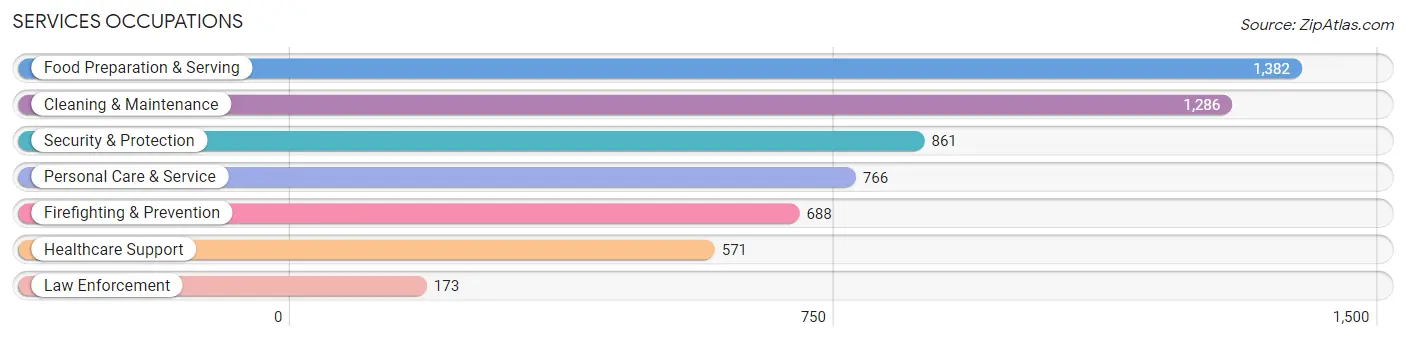
Services Occupations
The most common Services occupations in Mayaguez Municipio are Food Preparation & Serving (1,382 | 7.2%), Cleaning & Maintenance (1,286 | 6.7%), Security & Protection (861 | 4.5%), Personal Care & Service (766 | 4.0%), and Firefighting & Prevention (688 | 3.6%).
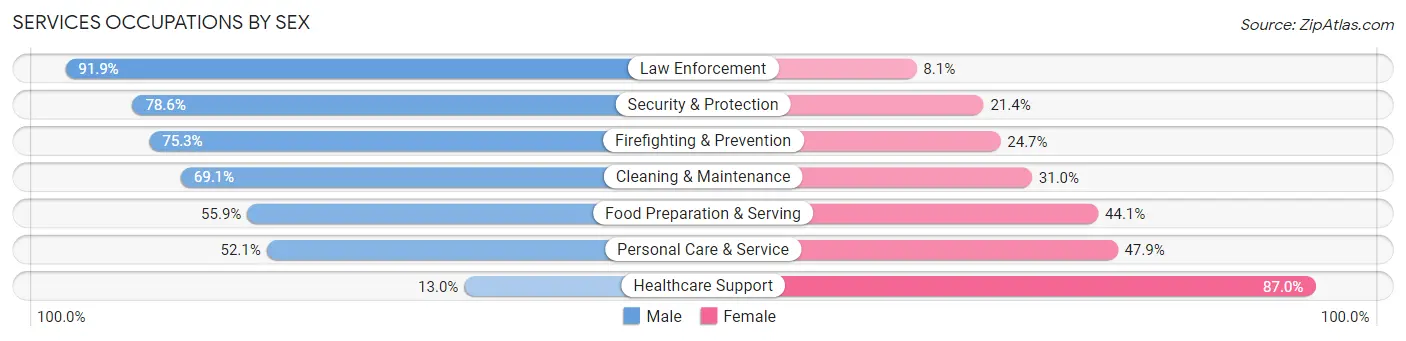
Services Occupations by Sex
Within the Services occupations in Mayaguez Municipio, the most male-oriented occupations are Law Enforcement (91.9%), Security & Protection (78.6%), and Firefighting & Prevention (75.3%), while the most female-oriented occupations are Healthcare Support (87.0%), Personal Care & Service (47.9%), and Food Preparation & Serving (44.1%).
| Occupation | Male | Female |
| Healthcare Support | 74 (13.0%) | 497 (87.0%) |
| Security & Protection | 677 (78.6%) | 184 (21.4%) |
| Firefighting & Prevention | 518 (75.3%) | 170 (24.7%) |
| Law Enforcement | 159 (91.9%) | 14 (8.1%) |
| Food Preparation & Serving | 773 (55.9%) | 609 (44.1%) |
| Cleaning & Maintenance | 888 (69.1%) | 398 (30.9%) |
| Personal Care & Service | 399 (52.1%) | 367 (47.9%) |
| Total (Category) | 2,811 (57.8%) | 2,055 (42.2%) |
| Total (Overall) | 10,242 (53.2%) | 9,021 (46.8%) |
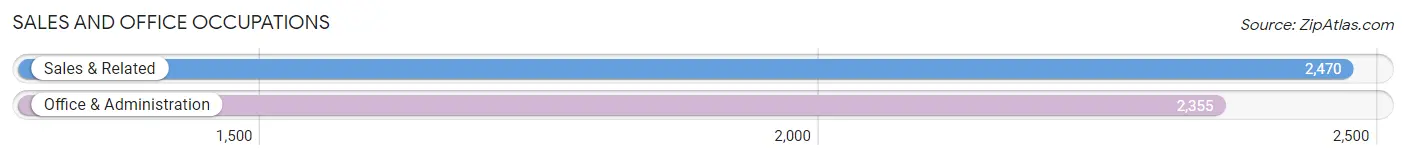
Sales and Office Occupations
The most common Sales and Office occupations in Mayaguez Municipio are Sales & Related (2,470 | 12.8%), and Office & Administration (2,355 | 12.2%).
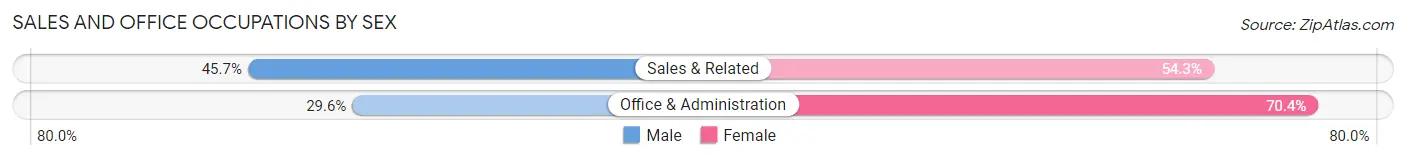
Sales and Office Occupations by Sex
| Occupation | Male | Female |
| Sales & Related | 1,128 (45.7%) | 1,342 (54.3%) |
| Office & Administration | 697 (29.6%) | 1,658 (70.4%) |
| Total (Category) | 1,825 (37.8%) | 3,000 (62.2%) |
| Total (Overall) | 10,242 (53.2%) | 9,021 (46.8%) |
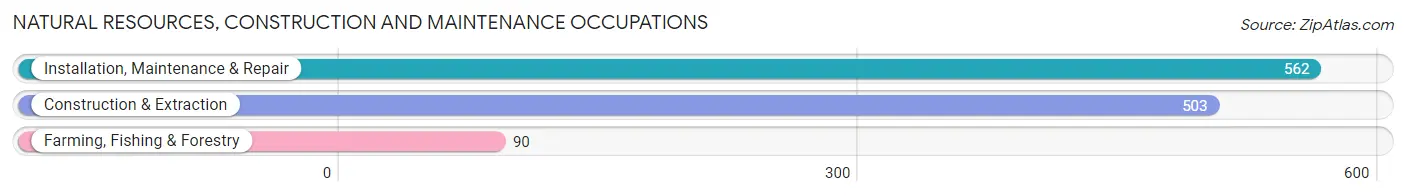
Natural Resources, Construction and Maintenance Occupations
The most common Natural Resources, Construction and Maintenance occupations in Mayaguez Municipio are Installation, Maintenance & Repair (562 | 2.9%), Construction & Extraction (503 | 2.6%), and Farming, Fishing & Forestry (90 | 0.5%).
Natural Resources, Construction and Maintenance Occupations by Sex
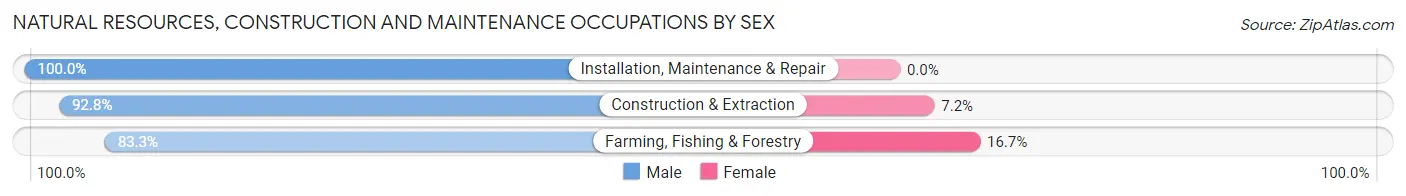
| Occupation | Male | Female |
| Farming, Fishing & Forestry | 75 (83.3%) | 15 (16.7%) |
| Construction & Extraction | 467 (92.8%) | 36 (7.2%) |
| Installation, Maintenance & Repair | 562 (100.0%) | 0 (0.0%) |
| Total (Category) | 1,104 (95.6%) | 51 (4.4%) |
| Total (Overall) | 10,242 (53.2%) | 9,021 (46.8%) |
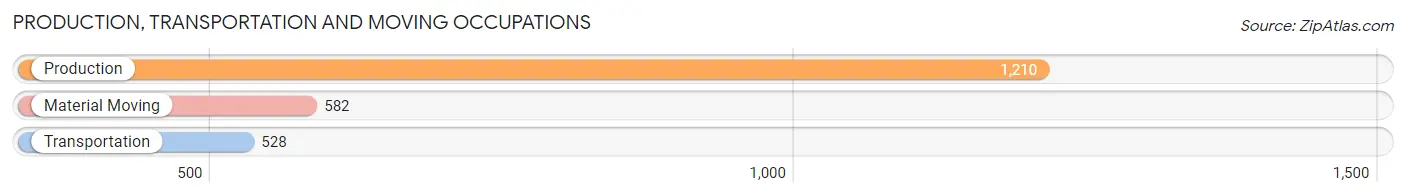
Production, Transportation and Moving Occupations
The most common Production, Transportation and Moving occupations in Mayaguez Municipio are Production (1,210 | 6.3%), Material Moving (582 | 3.0%), and Transportation (528 | 2.7%).
Production, Transportation and Moving Occupations by Sex
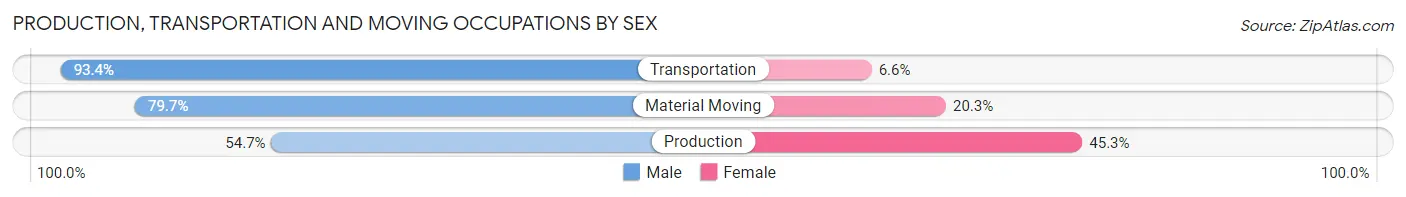
| Occupation | Male | Female |
| Production | 662 (54.7%) | 548 (45.3%) |
| Transportation | 493 (93.4%) | 35 (6.6%) |
| Material Moving | 464 (79.7%) | 118 (20.3%) |
| Total (Category) | 1,619 (69.8%) | 701 (30.2%) |
| Total (Overall) | 10,242 (53.2%) | 9,021 (46.8%) |
Employment Industries by Sex in Mayaguez Municipio
Employment Industries in Mayaguez Municipio
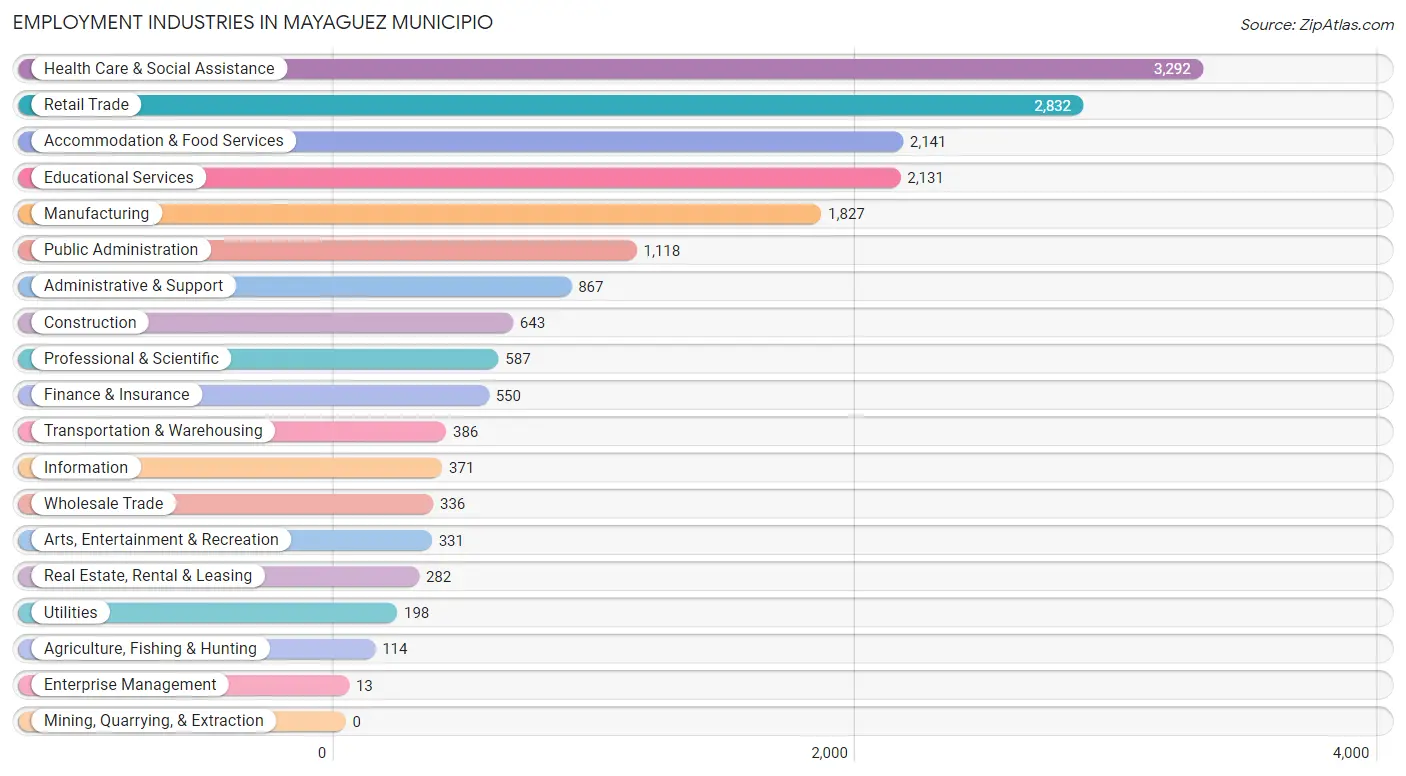
The major employment industries in Mayaguez Municipio include Health Care & Social Assistance (3,292 | 17.1%), Retail Trade (2,832 | 14.7%), Accommodation & Food Services (2,141 | 11.1%), Educational Services (2,131 | 11.1%), and Manufacturing (1,827 | 9.5%).
Employment Industries by Sex in Mayaguez Municipio
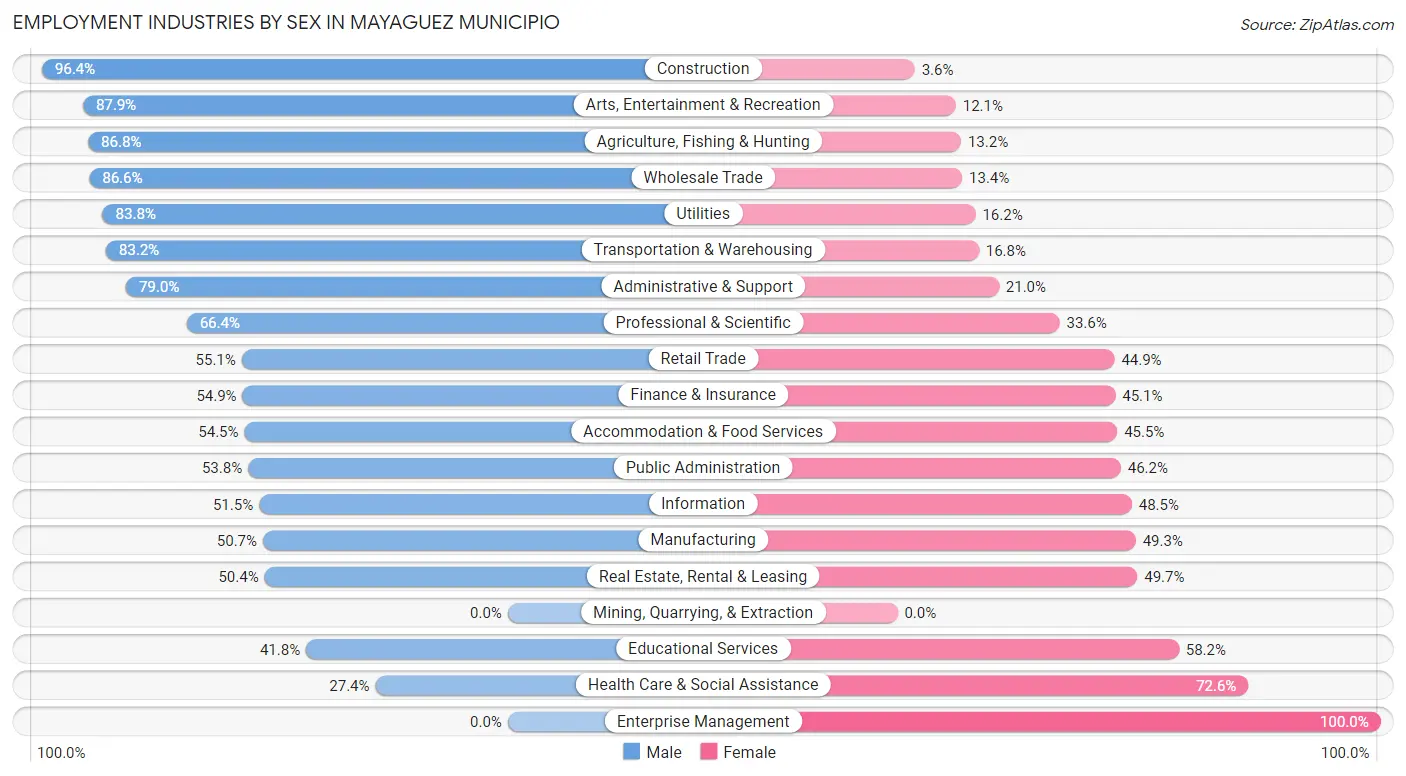
The Mayaguez Municipio industries that see more men than women are Construction (96.4%), Arts, Entertainment & Recreation (87.9%), and Agriculture, Fishing & Hunting (86.8%), whereas the industries that tend to have a higher number of women are Enterprise Management (100.0%), Health Care & Social Assistance (72.6%), and Educational Services (58.2%).
| Industry | Male | Female |
| Agriculture, Fishing & Hunting | 99 (86.8%) | 15 (13.2%) |
| Mining, Quarrying, & Extraction | 0 (0.0%) | 0 (0.0%) |
| Construction | 620 (96.4%) | 23 (3.6%) |
| Manufacturing | 926 (50.7%) | 901 (49.3%) |
| Wholesale Trade | 291 (86.6%) | 45 (13.4%) |
| Retail Trade | 1,560 (55.1%) | 1,272 (44.9%) |
| Transportation & Warehousing | 321 (83.2%) | 65 (16.8%) |
| Utilities | 166 (83.8%) | 32 (16.2%) |
| Information | 191 (51.5%) | 180 (48.5%) |
| Finance & Insurance | 302 (54.9%) | 248 (45.1%) |
| Real Estate, Rental & Leasing | 142 (50.3%) | 140 (49.6%) |
| Professional & Scientific | 390 (66.4%) | 197 (33.6%) |
| Enterprise Management | 0 (0.0%) | 13 (100.0%) |
| Administrative & Support | 685 (79.0%) | 182 (21.0%) |
| Educational Services | 890 (41.8%) | 1,241 (58.2%) |
| Health Care & Social Assistance | 902 (27.4%) | 2,390 (72.6%) |
| Arts, Entertainment & Recreation | 291 (87.9%) | 40 (12.1%) |
| Accommodation & Food Services | 1,167 (54.5%) | 974 (45.5%) |
| Public Administration | 601 (53.8%) | 517 (46.2%) |
| Total | 10,242 (53.2%) | 9,021 (46.8%) |
Education in Mayaguez Municipio
School Enrollment in Mayaguez Municipio
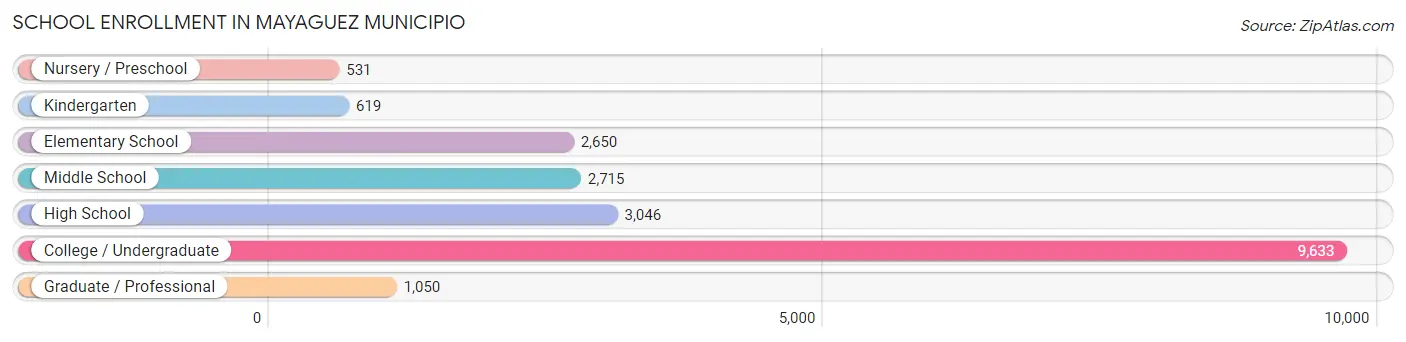
The most common levels of schooling among the 20,244 students in Mayaguez Municipio are college / undergraduate (9,633 | 47.6%), high school (3,046 | 15.0%), and middle school (2,715 | 13.4%).
| School Level | # Students | % Students |
| Nursery / Preschool | 531 | 2.6% |
| Kindergarten | 619 | 3.1% |
| Elementary School | 2,650 | 13.1% |
| Middle School | 2,715 | 13.4% |
| High School | 3,046 | 15.0% |
| College / Undergraduate | 9,633 | 47.6% |
| Graduate / Professional | 1,050 | 5.2% |
| Total | 20,244 | 100.0% |
School Enrollment by Age by Funding Source in Mayaguez Municipio
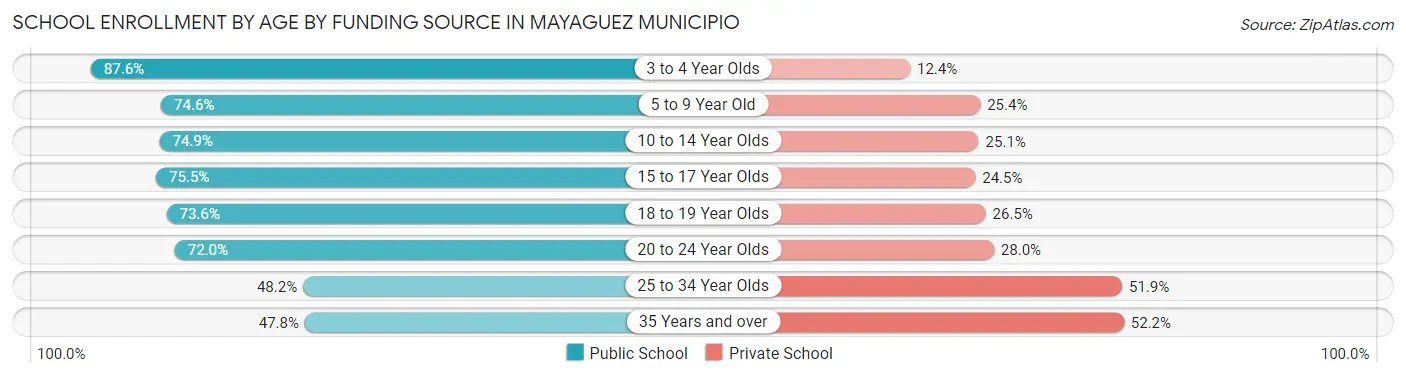
Out of a total of 20,244 students who are enrolled in schools in Mayaguez Municipio, 5,871 (29.0%) attend a private institution, while the remaining 14,373 (71.0%) are enrolled in public schools. The age group of 35 years and over has the highest likelihood of being enrolled in private schools, with 381 (52.2% in the age bracket) enrolled. Conversely, the age group of 3 to 4 year olds has the lowest likelihood of being enrolled in a private school, with 468 (87.6% in the age bracket) attending a public institution.
| Age Bracket | Public School | Private School |
| 3 to 4 Year Olds | 468 (87.6%) | 66 (12.4%) |
| 5 to 9 Year Old | 2,286 (74.6%) | 780 (25.4%) |
| 10 to 14 Year Olds | 2,522 (74.9%) | 847 (25.1%) |
| 15 to 17 Year Olds | 1,860 (75.5%) | 604 (24.5%) |
| 18 to 19 Year Olds | 1,869 (73.6%) | 672 (26.5%) |
| 20 to 24 Year Olds | 4,183 (72.0%) | 1,625 (28.0%) |
| 25 to 34 Year Olds | 834 (48.1%) | 898 (51.8%) |
| 35 Years and over | 349 (47.8%) | 381 (52.2%) |
| Total | 14,373 (71.0%) | 5,871 (29.0%) |
Educational Attainment by Field of Study in Mayaguez Municipio
Business (3,580 | 25.7%), education (1,935 | 13.9%), science & technology (1,670 | 12.0%), bio, nature & agricultural (1,469 | 10.5%), and social sciences (954 | 6.8%) are the most common fields of study among 13,945 individuals in Mayaguez Municipio who have obtained a bachelor's degree or higher.
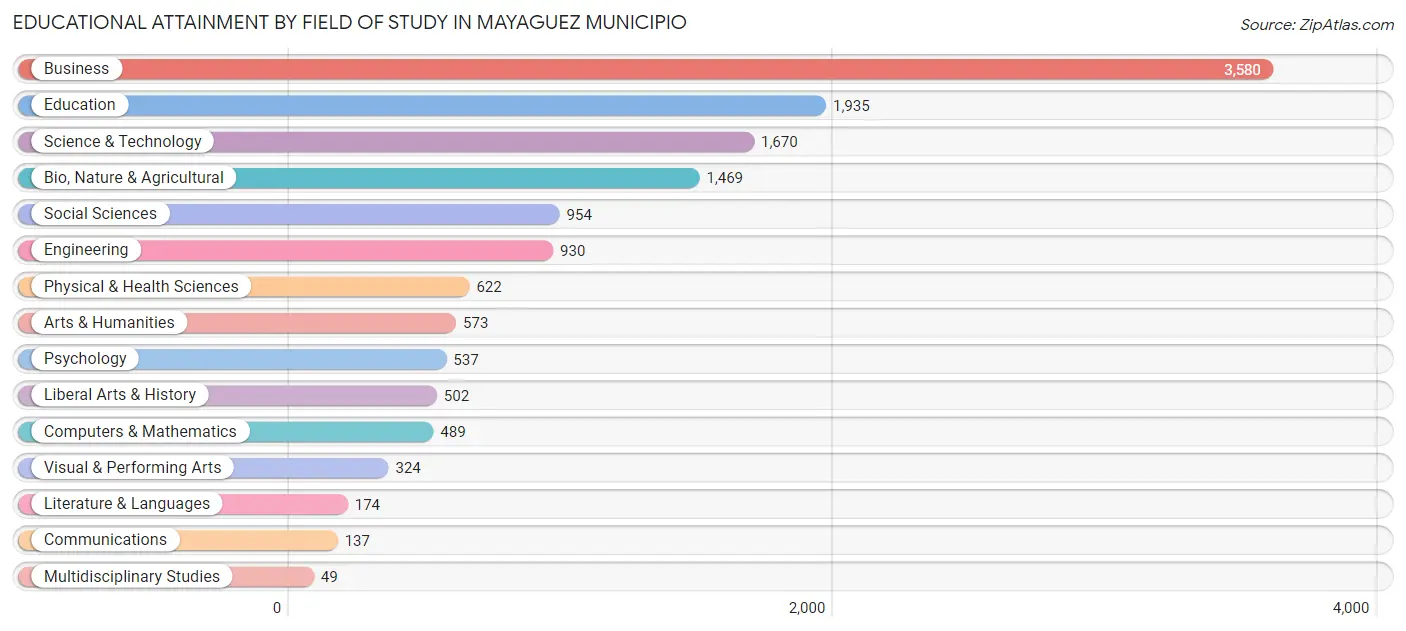
| Field of Study | # Graduates | % Graduates |
| Computers & Mathematics | 489 | 3.5% |
| Bio, Nature & Agricultural | 1,469 | 10.5% |
| Physical & Health Sciences | 622 | 4.5% |
| Psychology | 537 | 3.8% |
| Social Sciences | 954 | 6.8% |
| Engineering | 930 | 6.7% |
| Multidisciplinary Studies | 49 | 0.4% |
| Science & Technology | 1,670 | 12.0% |
| Business | 3,580 | 25.7% |
| Education | 1,935 | 13.9% |
| Literature & Languages | 174 | 1.3% |
| Liberal Arts & History | 502 | 3.6% |
| Visual & Performing Arts | 324 | 2.3% |
| Communications | 137 | 1.0% |
| Arts & Humanities | 573 | 4.1% |
| Total | 13,945 | 100.0% |
Transportation & Commute in Mayaguez Municipio
Vehicle Availability by Sex in Mayaguez Municipio
The most prevalent vehicle ownership categories in Mayaguez Municipio are males with 2 vehicles (3,960, accounting for 39.9%) and females with 2 vehicles (3,169, making up 46.0%).
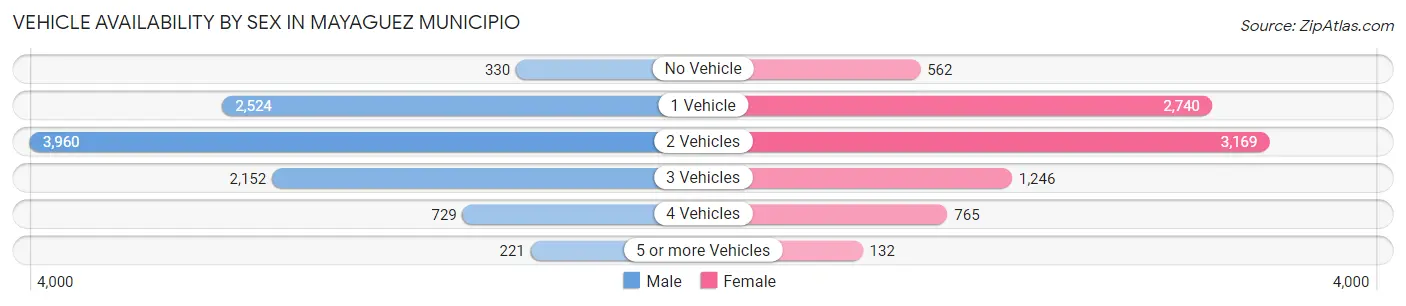
| Vehicles Available | Male | Female |
| No Vehicle | 330 (3.3%) | 562 (6.5%) |
| 1 Vehicle | 2,524 (25.5%) | 2,740 (31.8%) |
| 2 Vehicles | 3,960 (39.9%) | 3,169 (36.8%) |
| 3 Vehicles | 2,152 (21.7%) | 1,246 (14.5%) |
| 4 Vehicles | 729 (7.3%) | 765 (8.9%) |
| 5 or more Vehicles | 221 (2.2%) | 132 (1.5%) |
| Total | 9,916 (100.0%) | 8,614 (100.0%) |
Commute Time in Mayaguez Municipio
The most frequently occuring commute durations in Mayaguez Municipio are 15 to 19 minutes (4,036 commuters, 22.3%), 10 to 14 minutes (3,184 commuters, 17.6%), and 20 to 24 minutes (3,019 commuters, 16.7%).
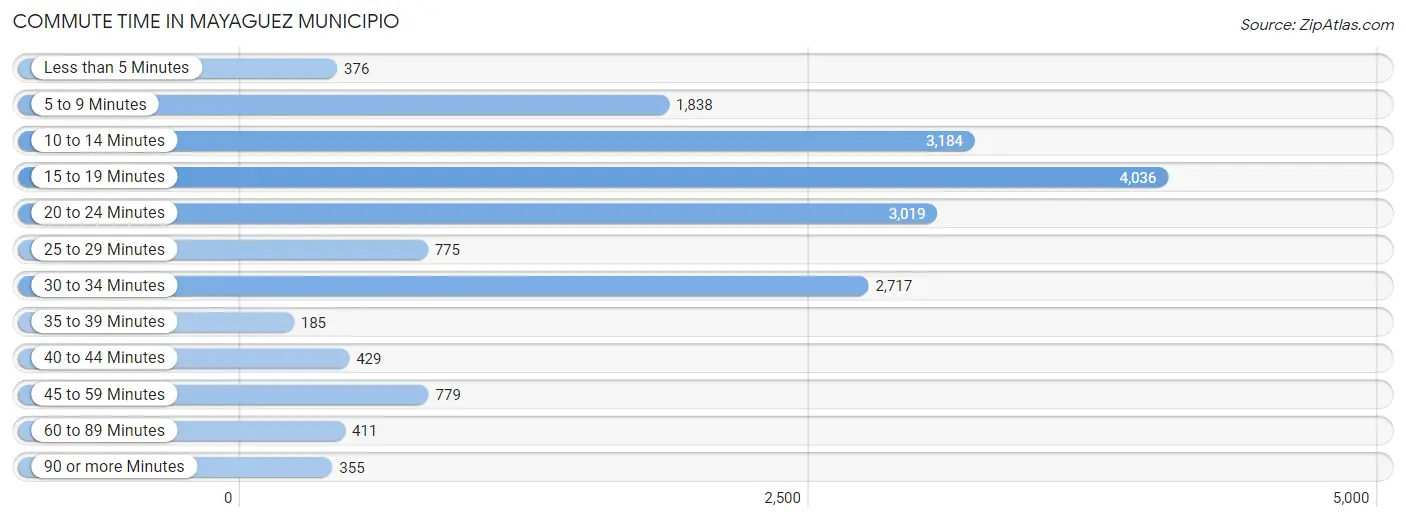
| Commute Time | # Commuters | % Commuters |
| Less than 5 Minutes | 376 | 2.1% |
| 5 to 9 Minutes | 1,838 | 10.2% |
| 10 to 14 Minutes | 3,184 | 17.6% |
| 15 to 19 Minutes | 4,036 | 22.3% |
| 20 to 24 Minutes | 3,019 | 16.7% |
| 25 to 29 Minutes | 775 | 4.3% |
| 30 to 34 Minutes | 2,717 | 15.0% |
| 35 to 39 Minutes | 185 | 1.0% |
| 40 to 44 Minutes | 429 | 2.4% |
| 45 to 59 Minutes | 779 | 4.3% |
| 60 to 89 Minutes | 411 | 2.3% |
| 90 or more Minutes | 355 | 2.0% |
Commute Time by Sex in Mayaguez Municipio
The most common commute times in Mayaguez Municipio are 15 to 19 minutes (2,105 commuters, 21.6%) for males and 15 to 19 minutes (1,931 commuters, 23.1%) for females.
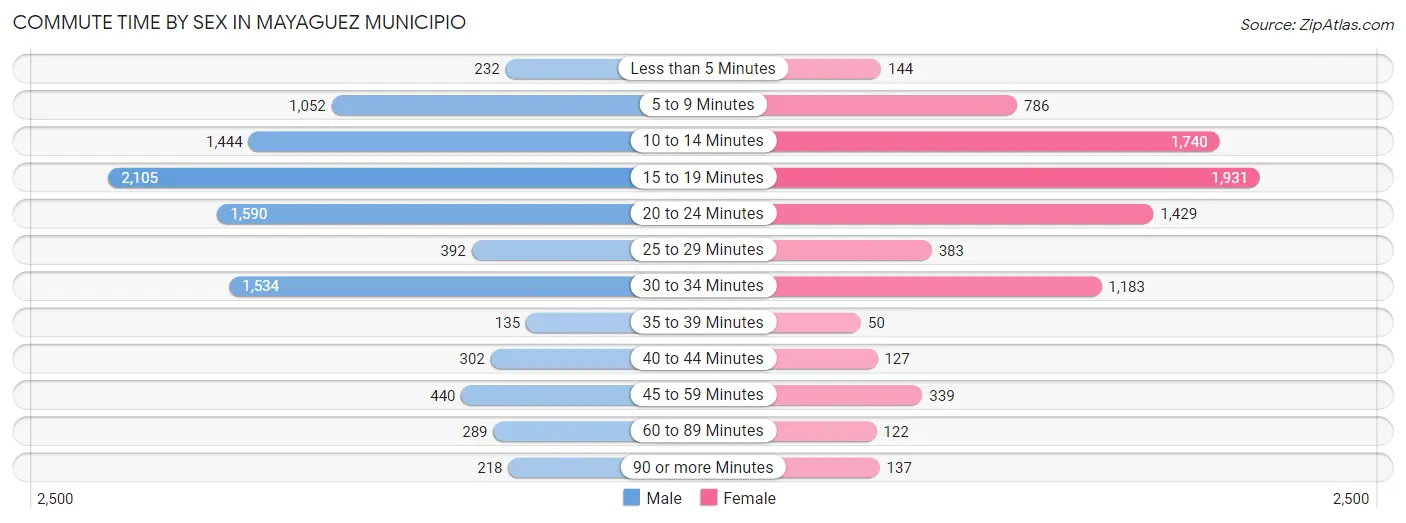
| Commute Time | Male | Female |
| Less than 5 Minutes | 232 (2.4%) | 144 (1.7%) |
| 5 to 9 Minutes | 1,052 (10.8%) | 786 (9.4%) |
| 10 to 14 Minutes | 1,444 (14.8%) | 1,740 (20.8%) |
| 15 to 19 Minutes | 2,105 (21.6%) | 1,931 (23.1%) |
| 20 to 24 Minutes | 1,590 (16.3%) | 1,429 (17.1%) |
| 25 to 29 Minutes | 392 (4.0%) | 383 (4.6%) |
| 30 to 34 Minutes | 1,534 (15.8%) | 1,183 (14.1%) |
| 35 to 39 Minutes | 135 (1.4%) | 50 (0.6%) |
| 40 to 44 Minutes | 302 (3.1%) | 127 (1.5%) |
| 45 to 59 Minutes | 440 (4.5%) | 339 (4.1%) |
| 60 to 89 Minutes | 289 (3.0%) | 122 (1.5%) |
| 90 or more Minutes | 218 (2.2%) | 137 (1.6%) |
Time of Departure to Work by Sex in Mayaguez Municipio
The most frequent times of departure to work in Mayaguez Municipio are 7:30 AM to 7:59 AM (1,336, 13.7%) for males and 7:00 AM to 7:29 AM (1,435, 17.1%) for females.
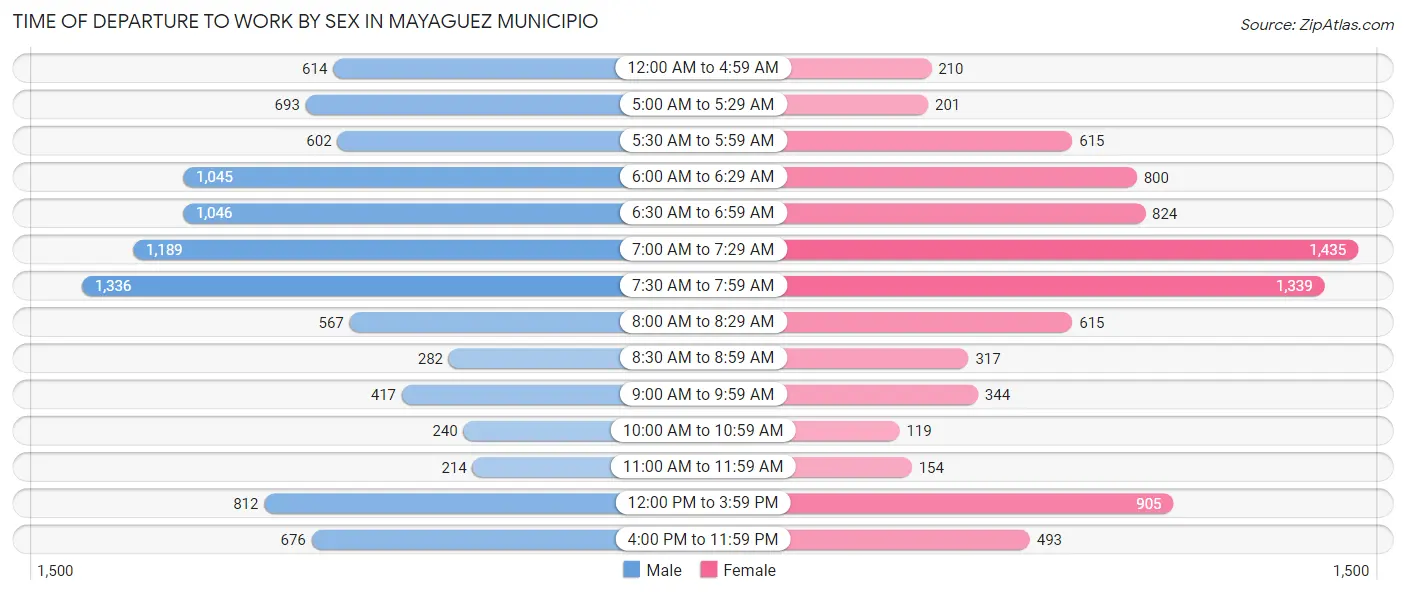
| Time of Departure | Male | Female |
| 12:00 AM to 4:59 AM | 614 (6.3%) | 210 (2.5%) |
| 5:00 AM to 5:29 AM | 693 (7.1%) | 201 (2.4%) |
| 5:30 AM to 5:59 AM | 602 (6.2%) | 615 (7.3%) |
| 6:00 AM to 6:29 AM | 1,045 (10.7%) | 800 (9.6%) |
| 6:30 AM to 6:59 AM | 1,046 (10.7%) | 824 (9.8%) |
| 7:00 AM to 7:29 AM | 1,189 (12.2%) | 1,435 (17.1%) |
| 7:30 AM to 7:59 AM | 1,336 (13.7%) | 1,339 (16.0%) |
| 8:00 AM to 8:29 AM | 567 (5.8%) | 615 (7.3%) |
| 8:30 AM to 8:59 AM | 282 (2.9%) | 317 (3.8%) |
| 9:00 AM to 9:59 AM | 417 (4.3%) | 344 (4.1%) |
| 10:00 AM to 10:59 AM | 240 (2.5%) | 119 (1.4%) |
| 11:00 AM to 11:59 AM | 214 (2.2%) | 154 (1.8%) |
| 12:00 PM to 3:59 PM | 812 (8.3%) | 905 (10.8%) |
| 4:00 PM to 11:59 PM | 676 (7.0%) | 493 (5.9%) |
| Total | 9,733 (100.0%) | 8,371 (100.0%) |
Housing Occupancy in Mayaguez Municipio
Occupancy by Ownership in Mayaguez Municipio
Of the total 29,343 dwellings in Mayaguez Municipio, owner-occupied units account for 15,548 (53.0%), while renter-occupied units make up 13,795 (47.0%).
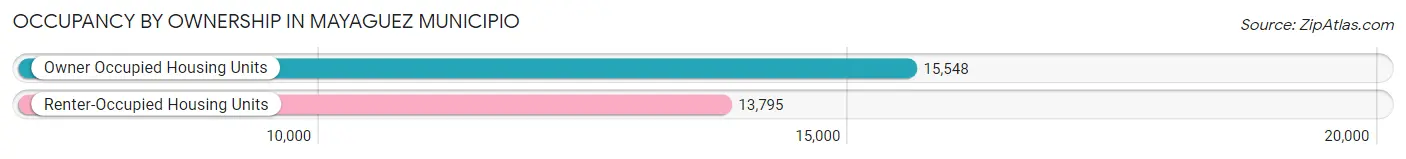
| Occupancy | # Housing Units | % Housing Units |
| Owner Occupied Housing Units | 15,548 | 53.0% |
| Renter-Occupied Housing Units | 13,795 | 47.0% |
| Total Occupied Housing Units | 29,343 | 100.0% |
Occupancy by Household Size in Mayaguez Municipio
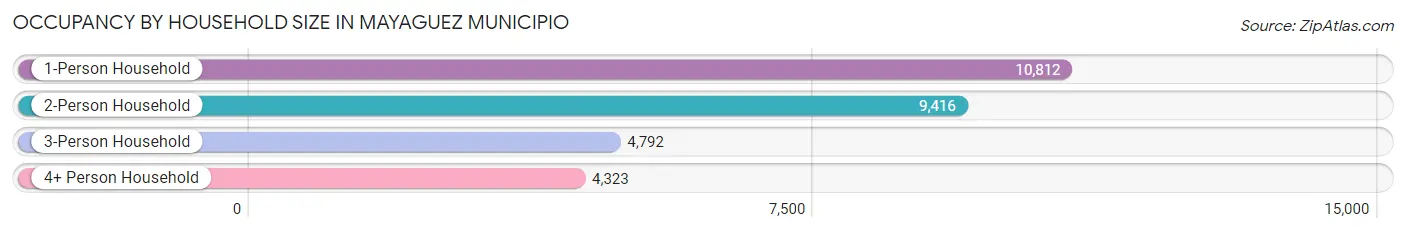
| Household Size | # Housing Units | % Housing Units |
| 1-Person Household | 10,812 | 36.8% |
| 2-Person Household | 9,416 | 32.1% |
| 3-Person Household | 4,792 | 16.3% |
| 4+ Person Household | 4,323 | 14.7% |
| Total Housing Units | 29,343 | 100.0% |
Occupancy by Ownership by Household Size in Mayaguez Municipio
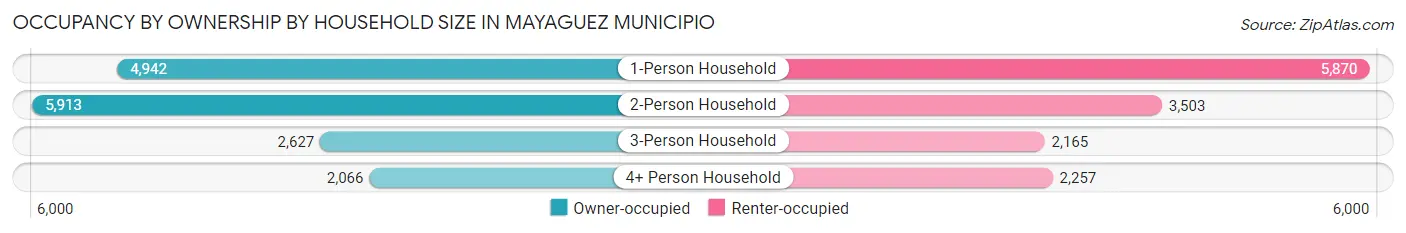
| Household Size | Owner-occupied | Renter-occupied |
| 1-Person Household | 4,942 (45.7%) | 5,870 (54.3%) |
| 2-Person Household | 5,913 (62.8%) | 3,503 (37.2%) |
| 3-Person Household | 2,627 (54.8%) | 2,165 (45.2%) |
| 4+ Person Household | 2,066 (47.8%) | 2,257 (52.2%) |
| Total Housing Units | 15,548 (53.0%) | 13,795 (47.0%) |
Occupancy by Educational Attainment in Mayaguez Municipio
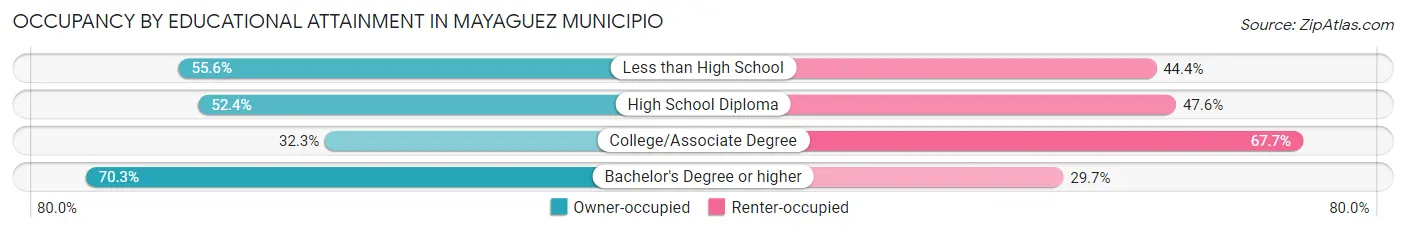
| Household Size | Owner-occupied | Renter-occupied |
| Less than High School | 4,032 (55.6%) | 3,222 (44.4%) |
| High School Diploma | 4,214 (52.4%) | 3,822 (47.6%) |
| College/Associate Degree | 2,197 (32.3%) | 4,596 (67.7%) |
| Bachelor's Degree or higher | 5,105 (70.3%) | 2,155 (29.7%) |
Occupancy by Age of Householder in Mayaguez Municipio
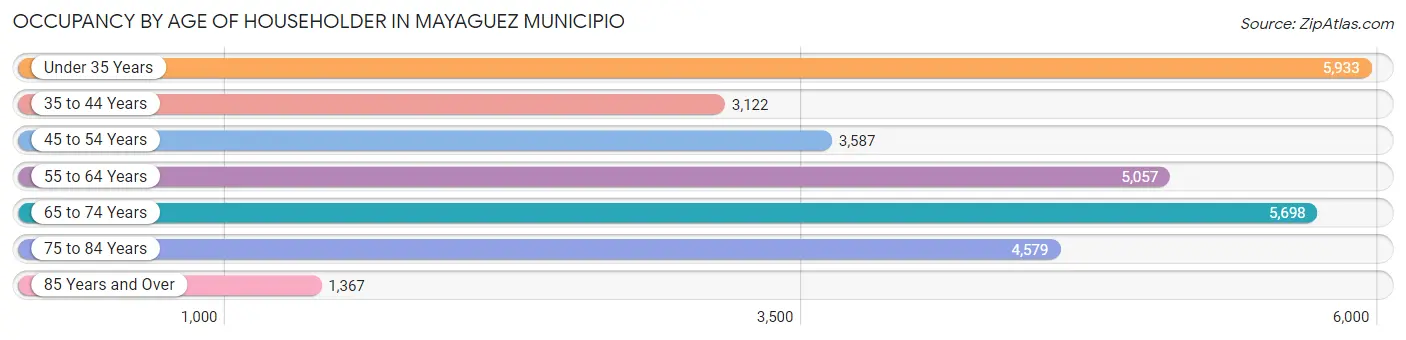
| Age Bracket | # Households | % Households |
| Under 35 Years | 5,933 | 20.2% |
| 35 to 44 Years | 3,122 | 10.6% |
| 45 to 54 Years | 3,587 | 12.2% |
| 55 to 64 Years | 5,057 | 17.2% |
| 65 to 74 Years | 5,698 | 19.4% |
| 75 to 84 Years | 4,579 | 15.6% |
| 85 Years and Over | 1,367 | 4.7% |
| Total | 29,343 | 100.0% |
Housing Finances in Mayaguez Municipio
Median Income by Occupancy in Mayaguez Municipio
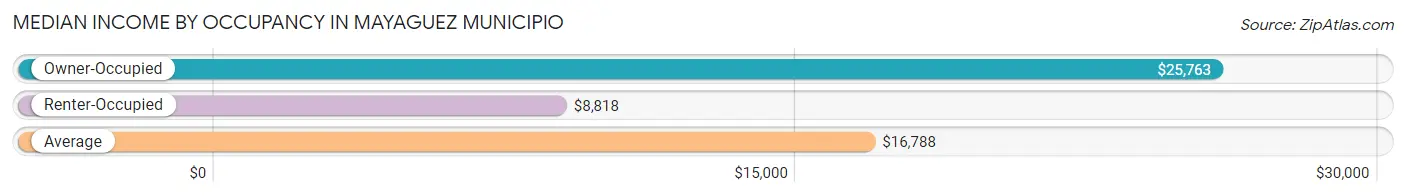
| Occupancy Type | # Households | Median Income |
| Owner-Occupied | 15,548 (53.0%) | $25,763 |
| Renter-Occupied | 13,795 (47.0%) | $8,818 |
| Average | 29,343 (100.0%) | $16,788 |
Occupancy by Householder Income Bracket in Mayaguez Municipio
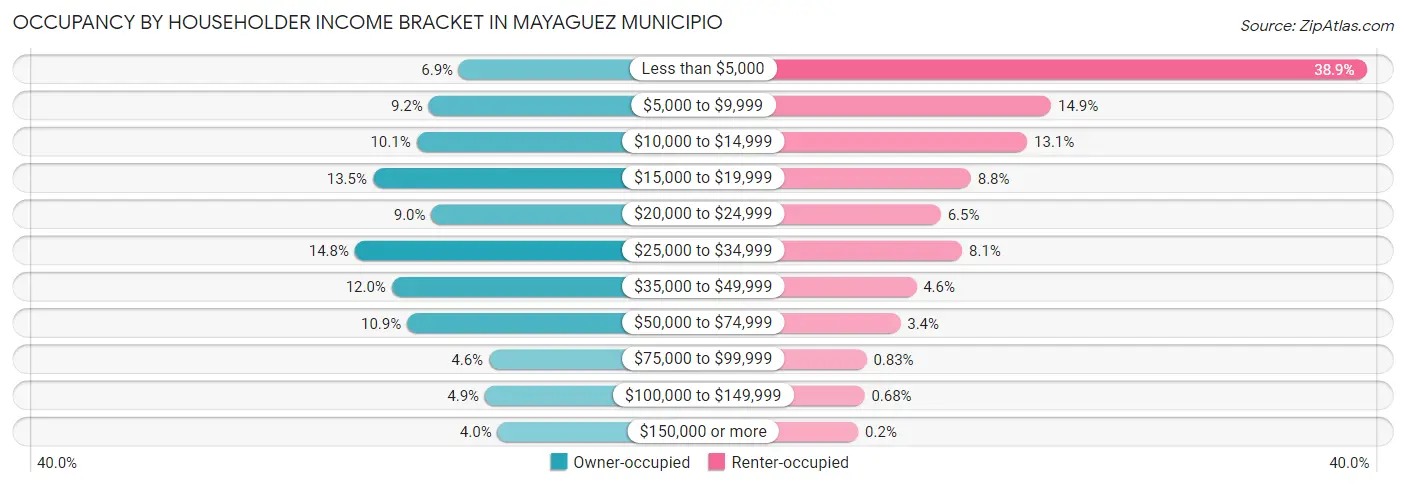
| Income Bracket | Owner-occupied | Renter-occupied |
| Less than $5,000 | 1,074 (6.9%) | 5,367 (38.9%) |
| $5,000 to $9,999 | 1,434 (9.2%) | 2,056 (14.9%) |
| $10,000 to $14,999 | 1,577 (10.1%) | 1,803 (13.1%) |
| $15,000 to $19,999 | 2,095 (13.5%) | 1,211 (8.8%) |
| $20,000 to $24,999 | 1,401 (9.0%) | 895 (6.5%) |
| $25,000 to $34,999 | 2,308 (14.8%) | 1,120 (8.1%) |
| $35,000 to $49,999 | 1,870 (12.0%) | 637 (4.6%) |
| $50,000 to $74,999 | 1,688 (10.9%) | 470 (3.4%) |
| $75,000 to $99,999 | 718 (4.6%) | 115 (0.8%) |
| $100,000 to $149,999 | 766 (4.9%) | 94 (0.7%) |
| $150,000 or more | 617 (4.0%) | 27 (0.2%) |
| Total | 15,548 (100.0%) | 13,795 (100.0%) |
Monthly Housing Cost Tiers in Mayaguez Municipio
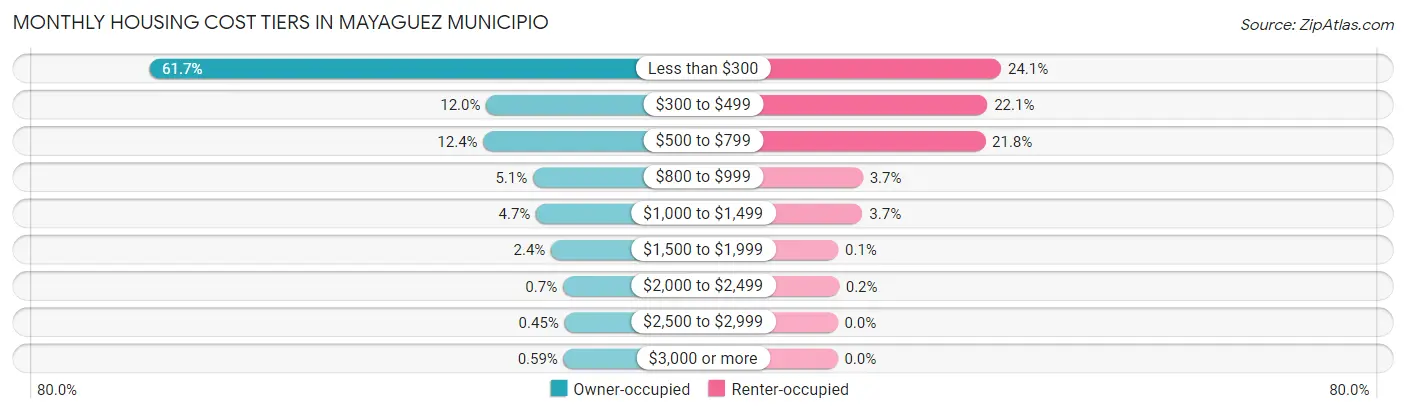
| Monthly Cost | Owner-occupied | Renter-occupied |
| Less than $300 | 9,586 (61.7%) | 3,325 (24.1%) |
| $300 to $499 | 1,864 (12.0%) | 3,045 (22.1%) |
| $500 to $799 | 1,931 (12.4%) | 3,000 (21.7%) |
| $800 to $999 | 794 (5.1%) | 514 (3.7%) |
| $1,000 to $1,499 | 723 (4.6%) | 507 (3.7%) |
| $1,500 to $1,999 | 380 (2.4%) | 14 (0.1%) |
| $2,000 to $2,499 | 109 (0.7%) | 28 (0.2%) |
| $2,500 to $2,999 | 70 (0.4%) | 0 (0.0%) |
| $3,000 or more | 91 (0.6%) | 0 (0.0%) |
| Total | 15,548 (100.0%) | 13,795 (100.0%) |
Physical Housing Characteristics in Mayaguez Municipio
Housing Structures in Mayaguez Municipio
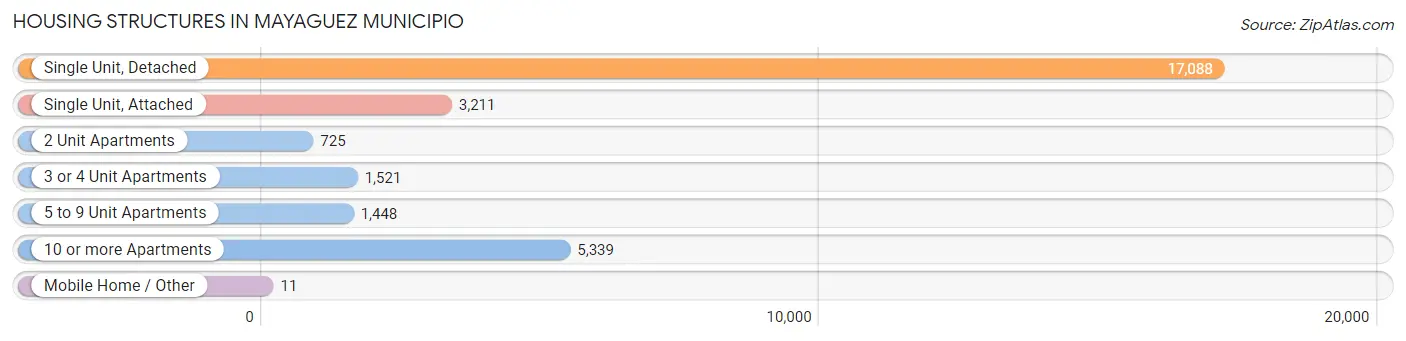
| Structure Type | # Housing Units | % Housing Units |
| Single Unit, Detached | 17,088 | 58.2% |
| Single Unit, Attached | 3,211 | 10.9% |
| 2 Unit Apartments | 725 | 2.5% |
| 3 or 4 Unit Apartments | 1,521 | 5.2% |
| 5 to 9 Unit Apartments | 1,448 | 4.9% |
| 10 or more Apartments | 5,339 | 18.2% |
| Mobile Home / Other | 11 | 0.0% |
| Total | 29,343 | 100.0% |
Housing Structures by Occupancy in Mayaguez Municipio
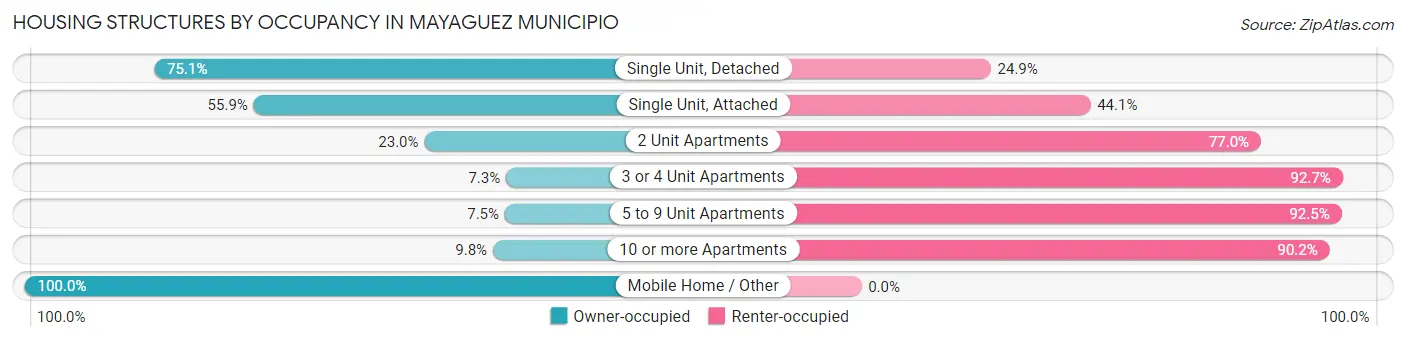
| Structure Type | Owner-occupied | Renter-occupied |
| Single Unit, Detached | 12,830 (75.1%) | 4,258 (24.9%) |
| Single Unit, Attached | 1,795 (55.9%) | 1,416 (44.1%) |
| 2 Unit Apartments | 167 (23.0%) | 558 (77.0%) |
| 3 or 4 Unit Apartments | 111 (7.3%) | 1,410 (92.7%) |
| 5 to 9 Unit Apartments | 109 (7.5%) | 1,339 (92.5%) |
| 10 or more Apartments | 525 (9.8%) | 4,814 (90.2%) |
| Mobile Home / Other | 11 (100.0%) | 0 (0.0%) |
| Total | 15,548 (53.0%) | 13,795 (47.0%) |
Housing Structures by Number of Rooms in Mayaguez Municipio
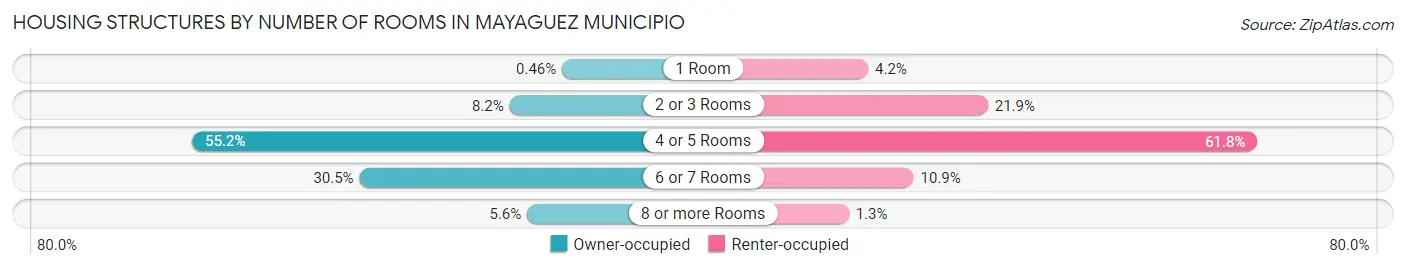
| Number of Rooms | Owner-occupied | Renter-occupied |
| 1 Room | 72 (0.5%) | 575 (4.2%) |
| 2 or 3 Rooms | 1,279 (8.2%) | 3,019 (21.9%) |
| 4 or 5 Rooms | 8,586 (55.2%) | 8,519 (61.8%) |
| 6 or 7 Rooms | 4,734 (30.4%) | 1,503 (10.9%) |
| 8 or more Rooms | 877 (5.6%) | 179 (1.3%) |
| Total | 15,548 (100.0%) | 13,795 (100.0%) |
Housing Structure by Heating Type in Mayaguez Municipio
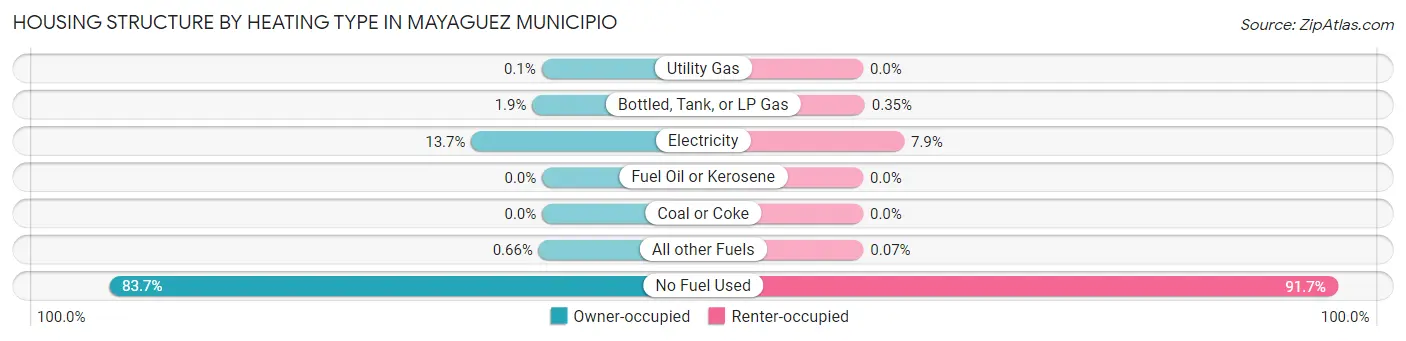
| Heating Type | Owner-occupied | Renter-occupied |
| Utility Gas | 15 (0.1%) | 0 (0.0%) |
| Bottled, Tank, or LP Gas | 296 (1.9%) | 48 (0.4%) |
| Electricity | 2,127 (13.7%) | 1,092 (7.9%) |
| Fuel Oil or Kerosene | 0 (0.0%) | 0 (0.0%) |
| Coal or Coke | 0 (0.0%) | 0 (0.0%) |
| All other Fuels | 103 (0.7%) | 9 (0.1%) |
| No Fuel Used | 13,007 (83.7%) | 12,646 (91.7%) |
| Total | 15,548 (100.0%) | 13,795 (100.0%) |
Household Vehicle Usage in Mayaguez Municipio
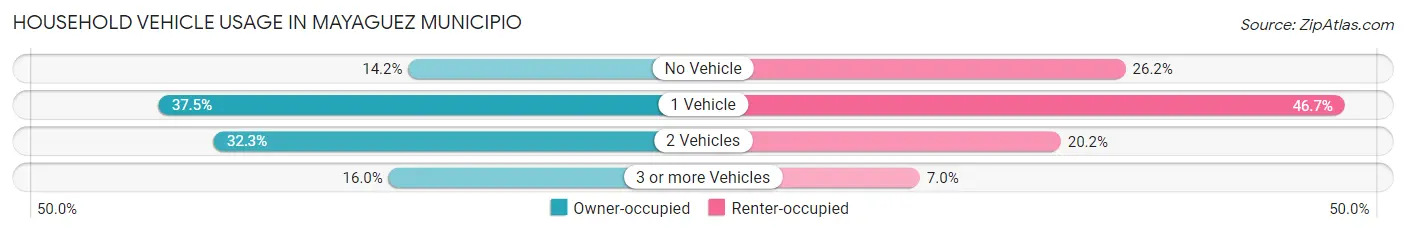
| Vehicles per Household | Owner-occupied | Renter-occupied |
| No Vehicle | 2,204 (14.2%) | 3,614 (26.2%) |
| 1 Vehicle | 5,826 (37.5%) | 6,435 (46.7%) |
| 2 Vehicles | 5,027 (32.3%) | 2,780 (20.2%) |
| 3 or more Vehicles | 2,491 (16.0%) | 966 (7.0%) |
| Total | 15,548 (100.0%) | 13,795 (100.0%) |
Real Estate & Mortgages in Mayaguez Municipio
Real Estate and Mortgage Overview in Mayaguez Municipio
| Characteristic | Without Mortgage | With Mortgage |
| Housing Units | 11,656 | 3,892 |
| Median Property Value | $97,000 | $138,700 |
| Median Household Income | $21,911 | $247 |
| Monthly Housing Costs | $178 | $85 |
| Real Estate Taxes | $588 | $2,799 |
Property Value by Mortgage Status in Mayaguez Municipio
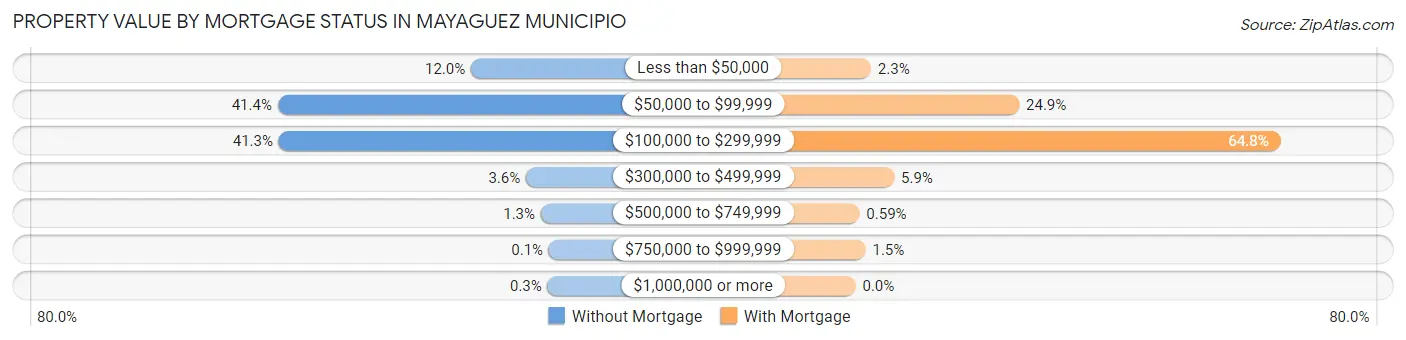
| Property Value | Without Mortgage | With Mortgage |
| Less than $50,000 | 1,395 (12.0%) | 91 (2.3%) |
| $50,000 to $99,999 | 4,829 (41.4%) | 970 (24.9%) |
| $100,000 to $299,999 | 4,811 (41.3%) | 2,520 (64.7%) |
| $300,000 to $499,999 | 419 (3.6%) | 229 (5.9%) |
| $500,000 to $749,999 | 155 (1.3%) | 23 (0.6%) |
| $750,000 to $999,999 | 12 (0.1%) | 59 (1.5%) |
| $1,000,000 or more | 35 (0.3%) | 0 (0.0%) |
| Total | 11,656 (100.0%) | 3,892 (100.0%) |
Household Income by Mortgage Status in Mayaguez Municipio
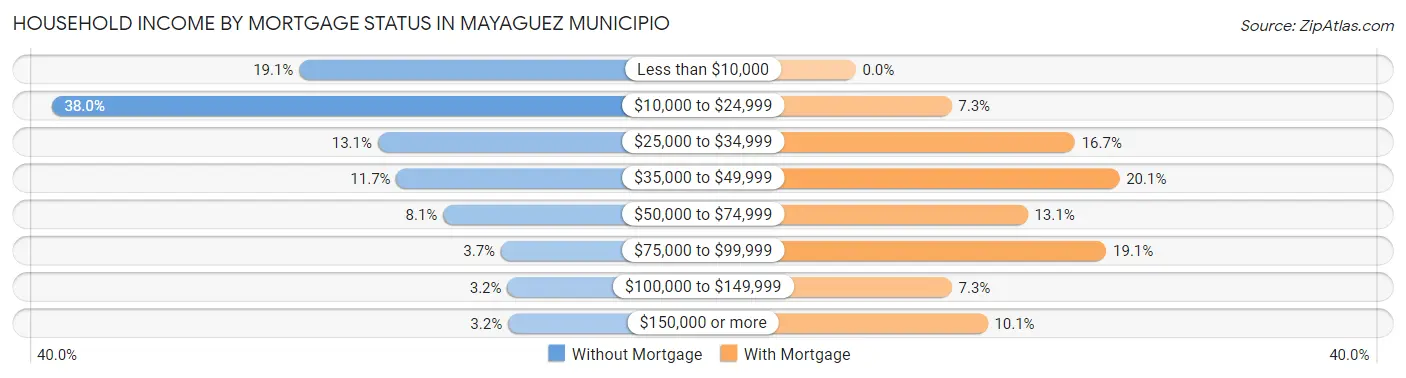
| Household Income | Without Mortgage | With Mortgage |
| Less than $10,000 | 2,224 (19.1%) | 0 (0.0%) |
| $10,000 to $24,999 | 4,423 (38.0%) | 284 (7.3%) |
| $25,000 to $34,999 | 1,526 (13.1%) | 650 (16.7%) |
| $35,000 to $49,999 | 1,360 (11.7%) | 782 (20.1%) |
| $50,000 to $74,999 | 945 (8.1%) | 510 (13.1%) |
| $75,000 to $99,999 | 433 (3.7%) | 743 (19.1%) |
| $100,000 to $149,999 | 375 (3.2%) | 285 (7.3%) |
| $150,000 or more | 370 (3.2%) | 391 (10.1%) |
| Total | 11,656 (100.0%) | 3,892 (100.0%) |
Property Value to Household Income Ratio in Mayaguez Municipio
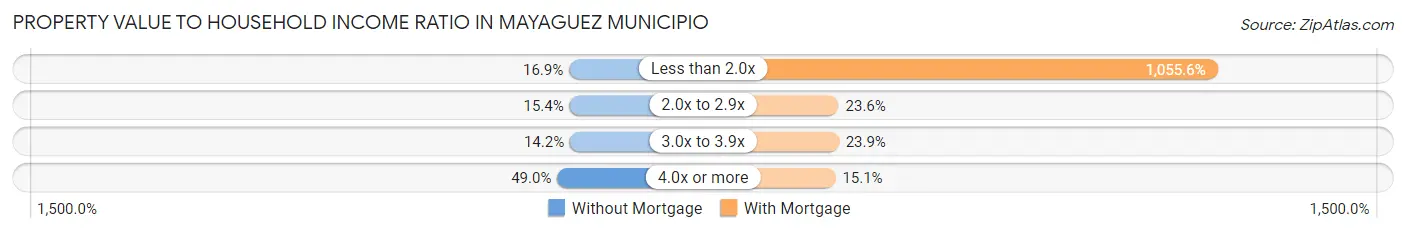
| Value-to-Income Ratio | Without Mortgage | With Mortgage |
| Less than 2.0x | 1,966 (16.9%) | 41,085 (1,055.6%) |
| 2.0x to 2.9x | 1,800 (15.4%) | 920 (23.6%) |
| 3.0x to 3.9x | 1,656 (14.2%) | 931 (23.9%) |
| 4.0x or more | 5,714 (49.0%) | 586 (15.1%) |
| Total | 11,656 (100.0%) | 3,892 (100.0%) |
Real Estate Taxes by Mortgage Status in Mayaguez Municipio
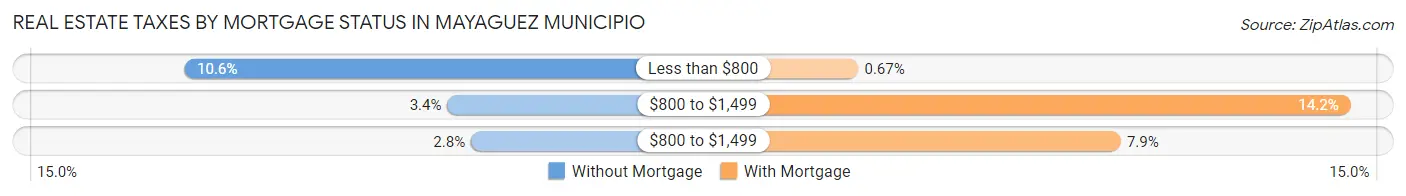
| Property Taxes | Without Mortgage | With Mortgage |
| Less than $800 | 1,239 (10.6%) | 26 (0.7%) |
| $800 to $1,499 | 399 (3.4%) | 552 (14.2%) |
| $800 to $1,499 | 323 (2.8%) | 306 (7.9%) |
| Total | 11,656 (100.0%) | 3,892 (100.0%) |
Health & Disability in Mayaguez Municipio
Health Insurance Coverage by Age in Mayaguez Municipio
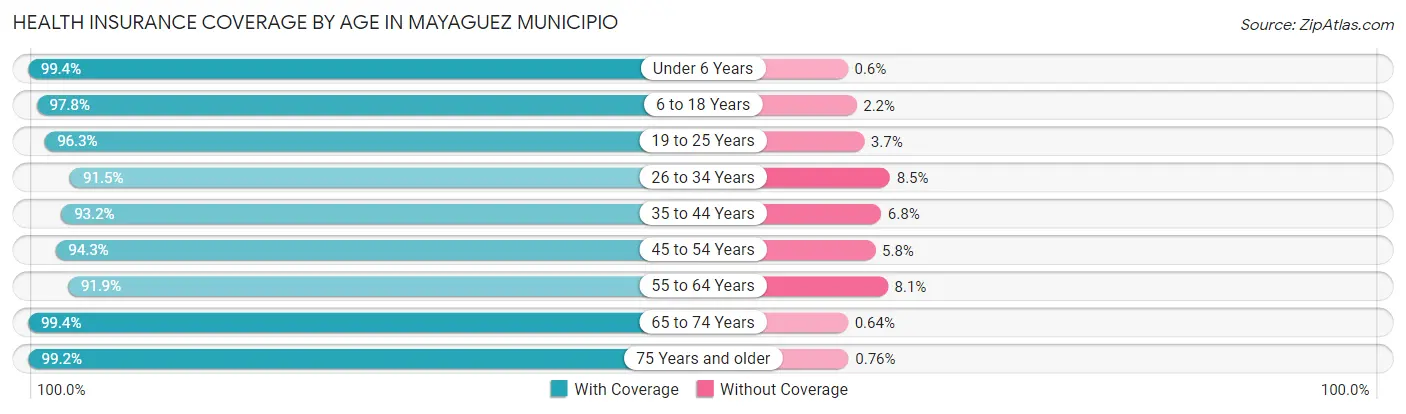
| Age Bracket | With Coverage | Without Coverage |
| Under 6 Years | 2,967 (99.4%) | 18 (0.6%) |
| 6 to 18 Years | 9,813 (97.8%) | 224 (2.2%) |
| 19 to 25 Years | 10,702 (96.3%) | 406 (3.7%) |
| 26 to 34 Years | 6,461 (91.5%) | 599 (8.5%) |
| 35 to 44 Years | 6,327 (93.2%) | 464 (6.8%) |
| 45 to 54 Years | 6,950 (94.3%) | 424 (5.8%) |
| 55 to 64 Years | 8,003 (91.9%) | 703 (8.1%) |
| 65 to 74 Years | 8,684 (99.4%) | 56 (0.6%) |
| 75 Years and older | 9,174 (99.2%) | 70 (0.8%) |
| Total | 69,081 (95.9%) | 2,964 (4.1%) |
Health Insurance Coverage by Citizenship Status in Mayaguez Municipio
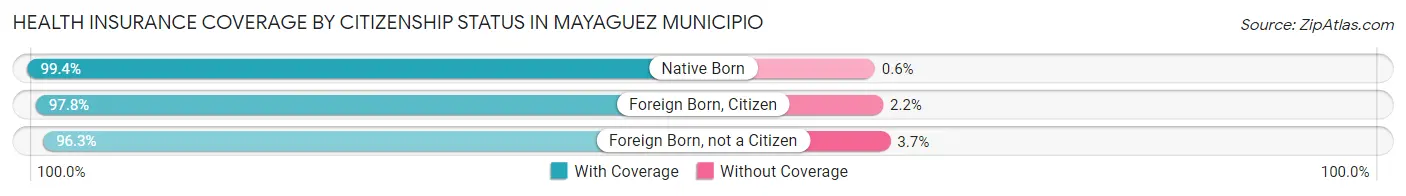
| Citizenship Status | With Coverage | Without Coverage |
| Native Born | 2,967 (99.4%) | 18 (0.6%) |
| Foreign Born, Citizen | 9,813 (97.8%) | 224 (2.2%) |
| Foreign Born, not a Citizen | 10,702 (96.3%) | 406 (3.7%) |
Health Insurance Coverage by Household Income in Mayaguez Municipio
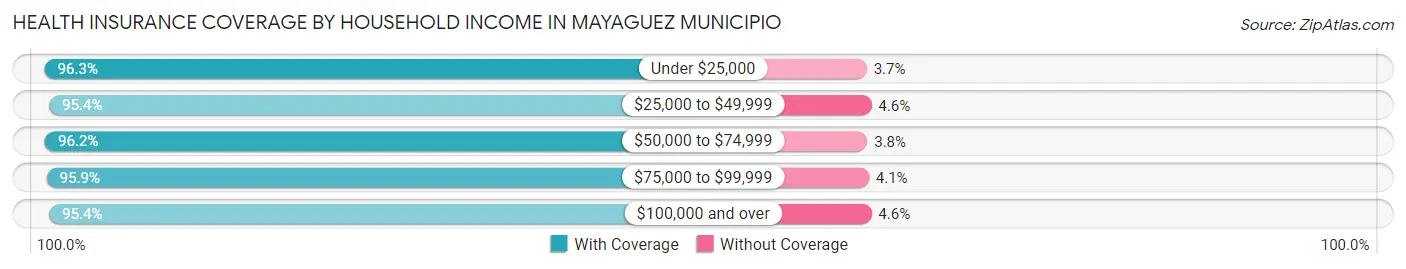
| Household Income | With Coverage | Without Coverage |
| Under $25,000 | 37,769 (96.3%) | 1,465 (3.7%) |
| $25,000 to $49,999 | 16,145 (95.4%) | 780 (4.6%) |
| $50,000 to $74,999 | 7,135 (96.2%) | 285 (3.8%) |
| $75,000 to $99,999 | 2,857 (95.9%) | 123 (4.1%) |
| $100,000 and over | 4,569 (95.4%) | 221 (4.6%) |
Public vs Private Health Insurance Coverage by Age in Mayaguez Municipio
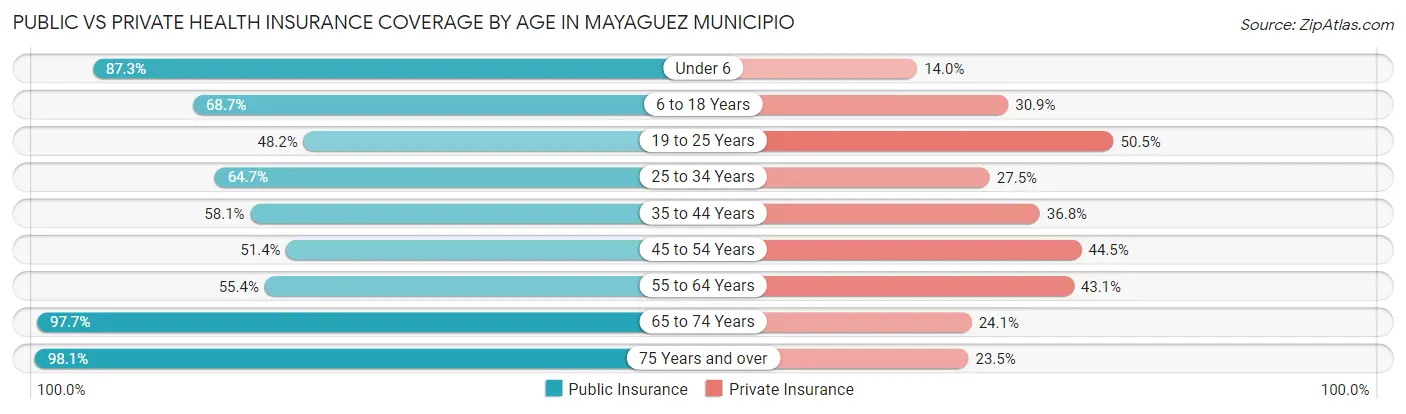
| Age Bracket | Public Insurance | Private Insurance |
| Under 6 | 2,607 (87.3%) | 418 (14.0%) |
| 6 to 18 Years | 6,899 (68.7%) | 3,102 (30.9%) |
| 19 to 25 Years | 5,357 (48.2%) | 5,604 (50.4%) |
| 25 to 34 Years | 4,568 (64.7%) | 1,941 (27.5%) |
| 35 to 44 Years | 3,945 (58.1%) | 2,497 (36.8%) |
| 45 to 54 Years | 3,791 (51.4%) | 3,282 (44.5%) |
| 55 to 64 Years | 4,826 (55.4%) | 3,750 (43.1%) |
| 65 to 74 Years | 8,536 (97.7%) | 2,108 (24.1%) |
| 75 Years and over | 9,067 (98.1%) | 2,175 (23.5%) |
| Total | 49,596 (68.8%) | 24,877 (34.5%) |
Disability Status by Sex by Age in Mayaguez Municipio
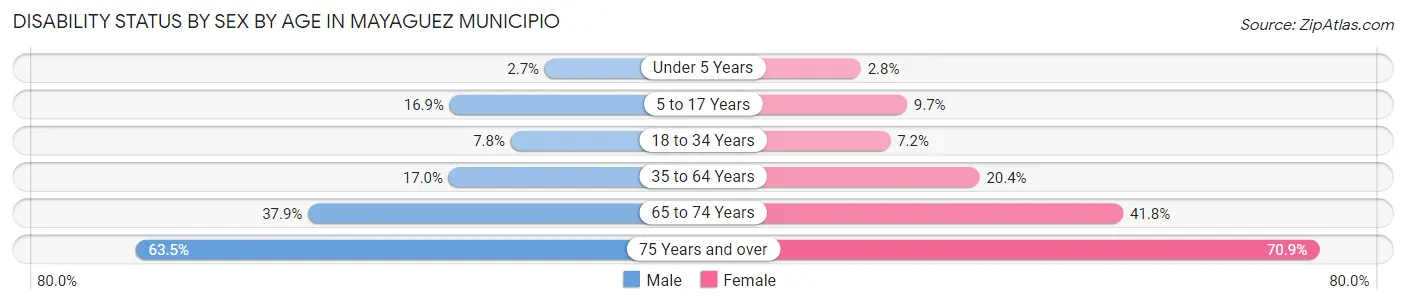
| Age Bracket | Male | Female |
| Under 5 Years | 33 (2.7%) | 31 (2.8%) |
| 5 to 17 Years | 808 (16.9%) | 437 (9.7%) |
| 18 to 34 Years | 805 (7.8%) | 665 (7.2%) |
| 35 to 64 Years | 1,827 (17.0%) | 2,478 (20.4%) |
| 65 to 74 Years | 1,440 (37.9%) | 2,063 (41.8%) |
| 75 Years and over | 2,256 (63.5%) | 4,033 (70.9%) |
Disability Class by Sex by Age in Mayaguez Municipio
Disability Class: Hearing Difficulty
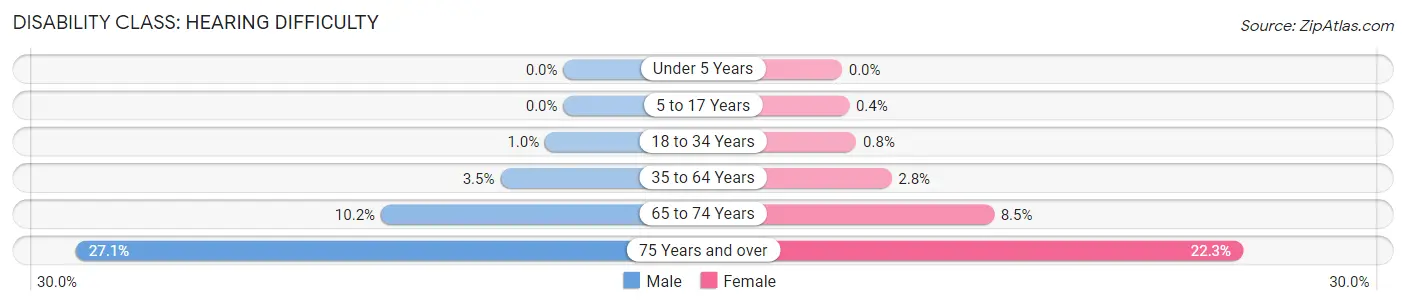
| Age Bracket | Male | Female |
| Under 5 Years | 0 (0.0%) | 0 (0.0%) |
| 5 to 17 Years | 0 (0.0%) | 18 (0.4%) |
| 18 to 34 Years | 105 (1.0%) | 74 (0.8%) |
| 35 to 64 Years | 377 (3.5%) | 335 (2.8%) |
| 65 to 74 Years | 386 (10.2%) | 418 (8.5%) |
| 75 Years and over | 964 (27.1%) | 1,271 (22.3%) |
Disability Class: Vision Difficulty
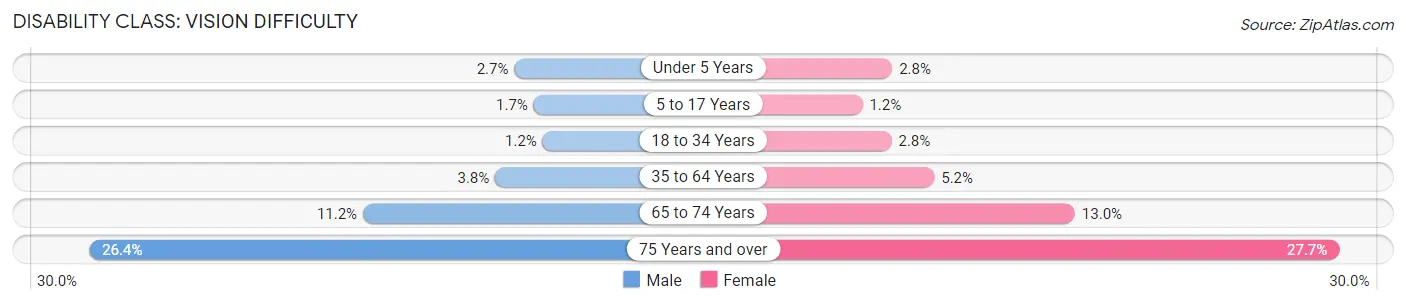
| Age Bracket | Male | Female |
| Under 5 Years | 33 (2.7%) | 31 (2.8%) |
| 5 to 17 Years | 79 (1.7%) | 52 (1.1%) |
| 18 to 34 Years | 119 (1.1%) | 256 (2.8%) |
| 35 to 64 Years | 408 (3.8%) | 624 (5.1%) |
| 65 to 74 Years | 424 (11.2%) | 641 (13.0%) |
| 75 Years and over | 938 (26.4%) | 1,576 (27.7%) |
Disability Class: Cognitive Difficulty
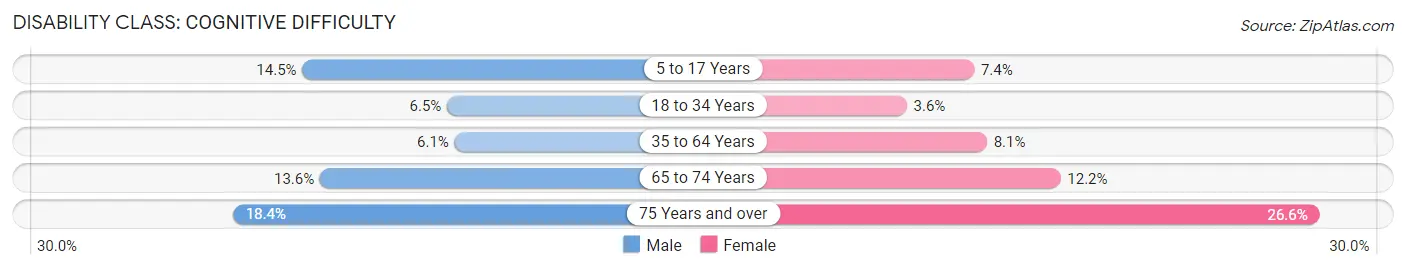
| Age Bracket | Male | Female |
| 5 to 17 Years | 696 (14.5%) | 333 (7.4%) |
| 18 to 34 Years | 667 (6.5%) | 334 (3.6%) |
| 35 to 64 Years | 650 (6.0%) | 978 (8.1%) |
| 65 to 74 Years | 515 (13.6%) | 601 (12.2%) |
| 75 Years and over | 654 (18.4%) | 1,514 (26.6%) |
Disability Class: Ambulatory Difficulty
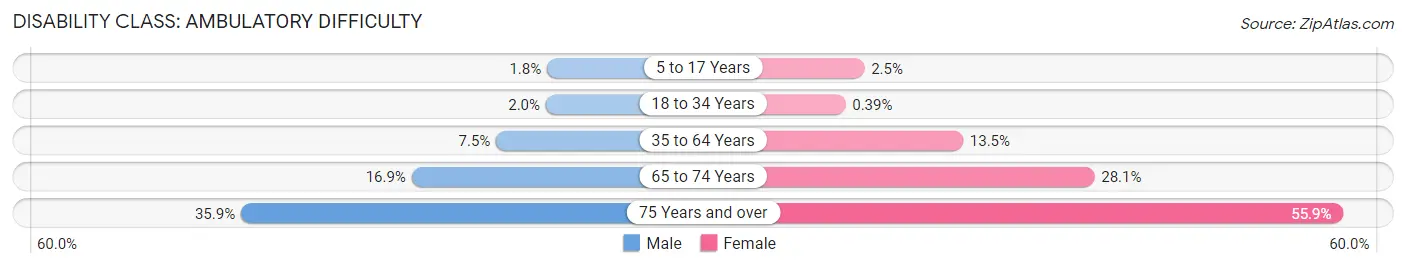
| Age Bracket | Male | Female |
| 5 to 17 Years | 87 (1.8%) | 113 (2.5%) |
| 18 to 34 Years | 201 (1.9%) | 36 (0.4%) |
| 35 to 64 Years | 804 (7.5%) | 1,634 (13.5%) |
| 65 to 74 Years | 642 (16.9%) | 1,389 (28.1%) |
| 75 Years and over | 1,275 (35.9%) | 3,179 (55.8%) |
Disability Class: Self-Care Difficulty
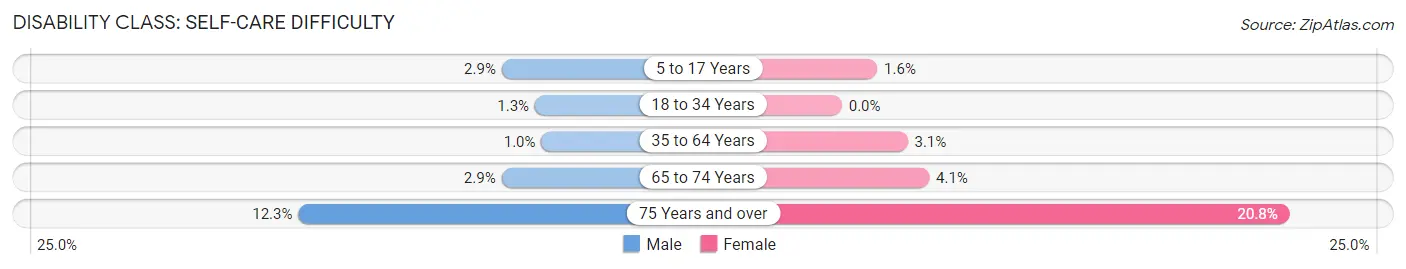
| Age Bracket | Male | Female |
| 5 to 17 Years | 137 (2.9%) | 74 (1.6%) |
| 18 to 34 Years | 136 (1.3%) | 0 (0.0%) |
| 35 to 64 Years | 110 (1.0%) | 370 (3.0%) |
| 65 to 74 Years | 109 (2.9%) | 200 (4.1%) |
| 75 Years and over | 437 (12.3%) | 1,183 (20.8%) |
Technology Access in Mayaguez Municipio
Computing Device Access in Mayaguez Municipio
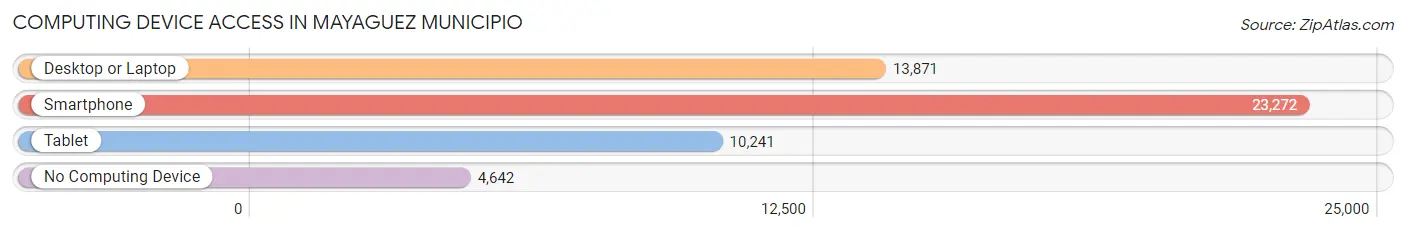
| Device Type | # Households | % Households |
| Desktop or Laptop | 13,871 | 47.3% |
| Smartphone | 23,272 | 79.3% |
| Tablet | 10,241 | 34.9% |
| No Computing Device | 4,642 | 15.8% |
| Total | 29,343 | 100.0% |
Internet Access in Mayaguez Municipio
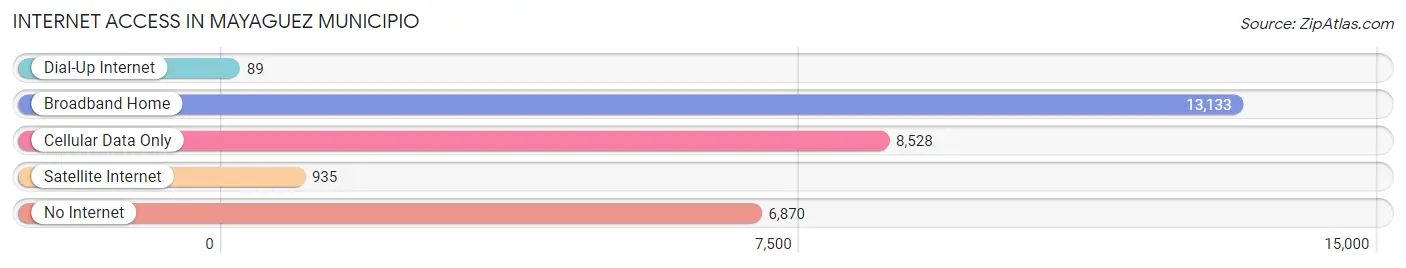
| Internet Type | # Households | % Households |
| Dial-Up Internet | 89 | 0.3% |
| Broadband Home | 13,133 | 44.8% |
| Cellular Data Only | 8,528 | 29.1% |
| Satellite Internet | 935 | 3.2% |
| No Internet | 6,870 | 23.4% |
| Total | 29,343 | 100.0% |
Mayaguez Municipio Summary
Mayaguez Municipio is located in the western part of Puerto Rico, and is the third largest municipality in the island. It is bordered by the municipalities of San German, Cabo Rojo, Hormigueros, and Anasco. The municipality is divided into two districts, Mayaguez and Hormigueros. The population of Mayaguez Municipio was estimated to be 97,924 in 2019.
History
Mayaguez Municipio was founded in 1760 by Don Francisco de los Olivos. The name of the municipality is derived from the Taino word “Mayagüez”, which means “place of water”. The area was originally inhabited by the Taino Indians, who were the first inhabitants of Puerto Rico. The Taino Indians were later replaced by the Spanish, who established the town of Mayaguez in 1760.
During the 19th century, Mayaguez Municipio experienced a period of economic growth and development. The town became an important port for the export of sugar, coffee, and other agricultural products. In 1841, the first railroad line in Puerto Rico was built in Mayaguez, connecting the town to San Juan.
In 1898, Mayaguez Municipio was occupied by the United States during the Spanish-American War. The town was the site of the Battle of Mayaguez, which was the last battle of the war. After the war, the town experienced a period of economic decline, as the sugar industry declined and the port was no longer used for exports.
Geography
Mayaguez Municipio is located in the western part of Puerto Rico, and is bordered by the municipalities of San German, Cabo Rojo, Hormigueros, and Anasco. The municipality is divided into two districts, Mayaguez and Hormigueros. The terrain of the municipality is mostly flat, with some hills in the northern part. The climate is tropical, with temperatures ranging from 75 to 90 degrees Fahrenheit.
Economy
Mayaguez Municipio has a diversified economy, with agriculture, manufacturing, and tourism being the main economic activities. The agricultural sector is the largest employer in the municipality, with sugarcane, coffee, and tobacco being the main crops. The manufacturing sector is also important, with the production of pharmaceuticals, electronics, and food products being the main industries. Tourism is also an important part of the economy, with the town being a popular destination for visitors from the United States and other countries.
Demographics
As of 2019, the population of Mayaguez Municipio was estimated to be 97,924. The population is mostly of Puerto Rican descent, with a small percentage of African and European descent. The majority of the population is Roman Catholic, with a small percentage of other religions. The official language of the municipality is Spanish, although English is also spoken. The median household income in the municipality is $20,000, and the unemployment rate is 8.3%.
Common Questions
What is Per Capita Income in Mayaguez Municipio?
Per Capita income in Mayaguez Municipio is $13,487.
What is the Median Family Income in Mayaguez Municipio?
Median Family Income in Mayaguez Municipio is $23,559.
What is the Median Household income in Mayaguez Municipio?
Median Household Income in Mayaguez Municipio is $16,788.
What is Income or Wage Gap in Mayaguez Municipio?
Income or Wage Gap in Mayaguez Municipio is 5.9%.
Women in Mayaguez Municipio earn 94.1 cents for every dollar earned by a man.
What is Family Income Deficit in Mayaguez Municipio?
Family Income Deficit in Mayaguez Municipio is $11,784.
Families that are below poverty line in Mayaguez Municipio earn $11,784 less on average than the poverty threshold level.
What is Inequality or Gini Index in Mayaguez Municipio?
Inequality or Gini Index in Mayaguez Municipio is 0.62.
What is the Total Population of Mayaguez Municipio?
Total Population of Mayaguez Municipio is 72,721.
What is the Total Male Population of Mayaguez Municipio?
Total Male Population of Mayaguez Municipio is 34,773.
What is the Total Female Population of Mayaguez Municipio?
Total Female Population of Mayaguez Municipio is 37,948.
What is the Ratio of Males per 100 Females in Mayaguez Municipio?
There are 91.63 Males per 100 Females in Mayaguez Municipio.
What is the Ratio of Females per 100 Males in Mayaguez Municipio?
There are 109.13 Females per 100 Males in Mayaguez Municipio.
What is the Median Population Age in Mayaguez Municipio?
Median Population Age in Mayaguez Municipio is 42.8 Years.
What is the Average Family Size in Mayaguez Municipio
Average Family Size in Mayaguez Municipio is 3.2 People.
What is the Average Household Size in Mayaguez Municipio
Average Household Size in Mayaguez Municipio is 2.4 People.
How Large is the Labor Force in Mayaguez Municipio?
There are 25,349 People in the Labor Forcein in Mayaguez Municipio.
What is the Percentage of People in the Labor Force in Mayaguez Municipio?
40.3% of People are in the Labor Force in Mayaguez Municipio.
What is the Unemployment Rate in Mayaguez Municipio?
Unemployment Rate in Mayaguez Municipio is 23.9%.