Las Marias Municipio, PR Map & Demographics
Las Marias Municipio Overview
$8,514
PER CAPITA INCOME
$21,612
AVG FAMILY INCOME
$16,506
AVG HOUSEHOLD INCOME
21.7%
WAGE / INCOME GAP [ % ]
78.3¢/ $1
WAGE / INCOME GAP [ $ ]
$12,405
FAMILY INCOME DEFICIT
0.48
INEQUALITY / GINI INDEX
8,826
TOTAL POPULATION
4,369
MALE POPULATION
4,457
FEMALE POPULATION
98.03
MALES / 100 FEMALES
102.01
FEMALES / 100 MALES
43.9
MEDIAN AGE
4.2
AVG FAMILY SIZE
3.2
AVG HOUSEHOLD SIZE
2,465
LABOR FORCE [ PEOPLE ]
33.3%
PERCENT IN LABOR FORCE
8.1%
UNEMPLOYMENT RATE
Income in Las Marias Municipio
Income Overview in Las Marias Municipio
Per Capita Income in Las Marias Municipio is $8,514, while median incomes of families and households are $21,612 and $16,506 respectively.
| Characteristic | Number | Measure |
| Per Capita Income | 8,826 | $8,514 |
| Median Family Income | 1,788 | $21,612 |
| Mean Family Income | 1,788 | $25,347 |
| Median Household Income | 2,722 | $16,506 |
| Mean Household Income | 2,722 | $22,419 |
| Income Deficit | 1,788 | $12,405 |
| Wage / Income Gap (%) | 8,826 | 21.73% |
| Wage / Income Gap ($) | 8,826 | 78.27¢ per $1 |
| Gini / Inequality Index | 8,826 | 0.48 |
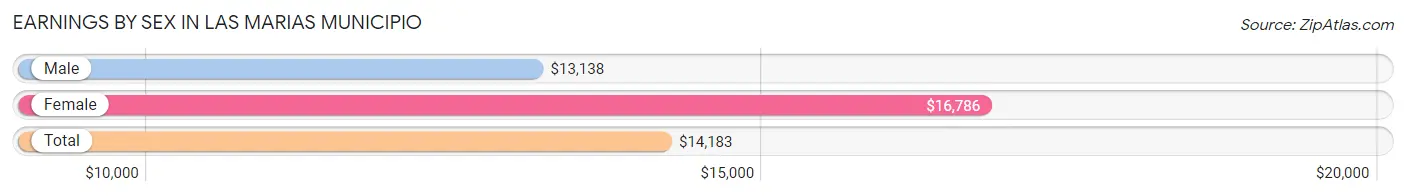
Earnings by Sex in Las Marias Municipio
Average Earnings in Las Marias Municipio are $14,183, $13,138 for men and $16,786 for women, a difference of 21.7%.
| Sex | Number | Average Earnings |
| Male | 1,301 (56.0%) | $13,138 |
| Female | 1,024 (44.0%) | $16,786 |
| Total | 2,325 (100.0%) | $14,183 |
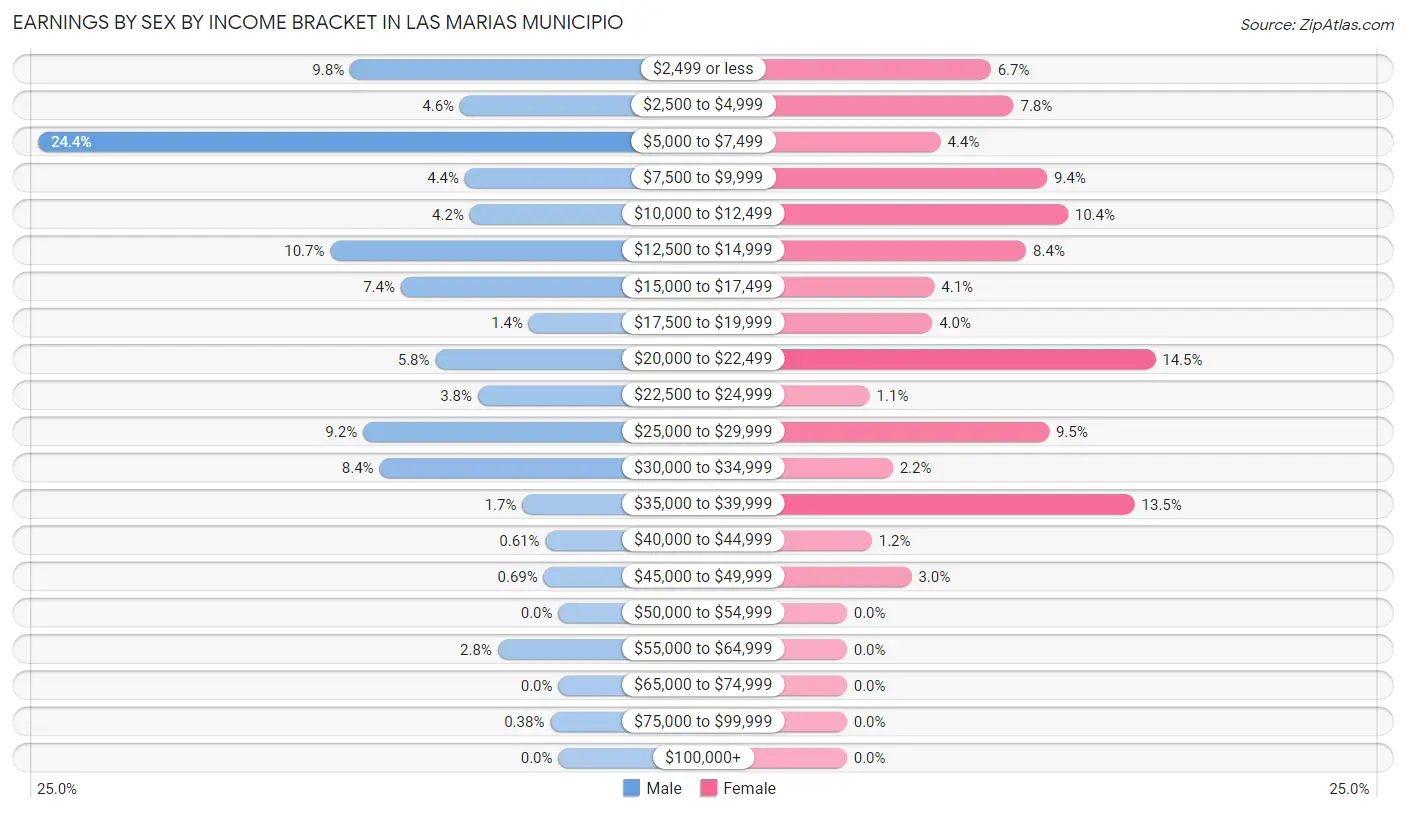
Earnings by Sex by Income Bracket in Las Marias Municipio
The most common earnings brackets in Las Marias Municipio are $5,000 to $7,499 for men (317 | 24.4%) and $20,000 to $22,499 for women (148 | 14.4%).
| Income | Male | Female |
| $2,499 or less | 127 (9.8%) | 69 (6.7%) |
| $2,500 to $4,999 | 60 (4.6%) | 80 (7.8%) |
| $5,000 to $7,499 | 317 (24.4%) | 45 (4.4%) |
| $7,500 to $9,999 | 57 (4.4%) | 96 (9.4%) |
| $10,000 to $12,499 | 54 (4.2%) | 106 (10.3%) |
| $12,500 to $14,999 | 139 (10.7%) | 86 (8.4%) |
| $15,000 to $17,499 | 96 (7.4%) | 42 (4.1%) |
| $17,500 to $19,999 | 18 (1.4%) | 41 (4.0%) |
| $20,000 to $22,499 | 75 (5.8%) | 148 (14.4%) |
| $22,500 to $24,999 | 49 (3.8%) | 11 (1.1%) |
| $25,000 to $29,999 | 119 (9.1%) | 97 (9.5%) |
| $30,000 to $34,999 | 109 (8.4%) | 22 (2.1%) |
| $35,000 to $39,999 | 22 (1.7%) | 138 (13.5%) |
| $40,000 to $44,999 | 8 (0.6%) | 12 (1.2%) |
| $45,000 to $49,999 | 9 (0.7%) | 31 (3.0%) |
| $50,000 to $54,999 | 0 (0.0%) | 0 (0.0%) |
| $55,000 to $64,999 | 37 (2.8%) | 0 (0.0%) |
| $65,000 to $74,999 | 0 (0.0%) | 0 (0.0%) |
| $75,000 to $99,999 | 5 (0.4%) | 0 (0.0%) |
| $100,000+ | 0 (0.0%) | 0 (0.0%) |
| Total | 1,301 (100.0%) | 1,024 (100.0%) |
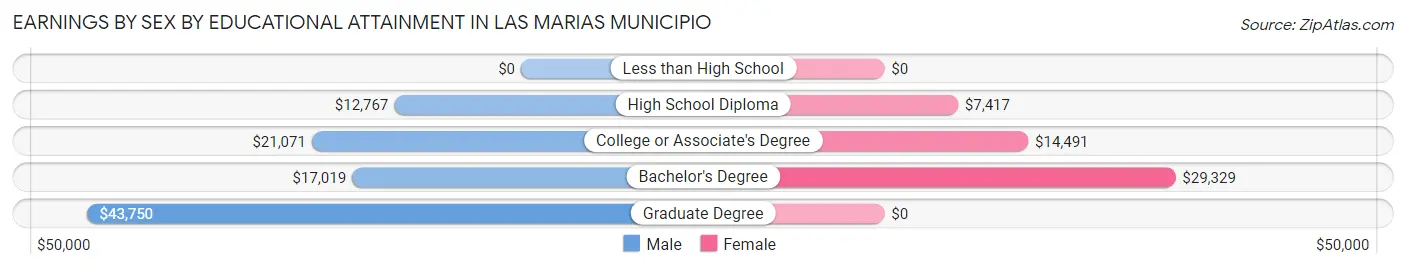
Earnings by Sex by Educational Attainment in Las Marias Municipio
Average earnings in Las Marias Municipio are $14,074 for men and $17,744 for women, a difference of 20.7%. Men with an educational attainment of graduate degree enjoy the highest average annual earnings of $43,750, while those with high school diploma education earn the least with $12,767. Women with an educational attainment of bachelor's degree earn the most with the average annual earnings of $29,329, while those with high school diploma education have the smallest earnings of $7,417.
| Educational Attainment | Male Income | Female Income |
| Less than High School | - | - |
| High School Diploma | $12,767 | $7,417 |
| College or Associate's Degree | $21,071 | $14,491 |
| Bachelor's Degree | $17,019 | $29,329 |
| Graduate Degree | $43,750 | $0 |
| Total | $14,074 | $17,744 |
Family Income in Las Marias Municipio
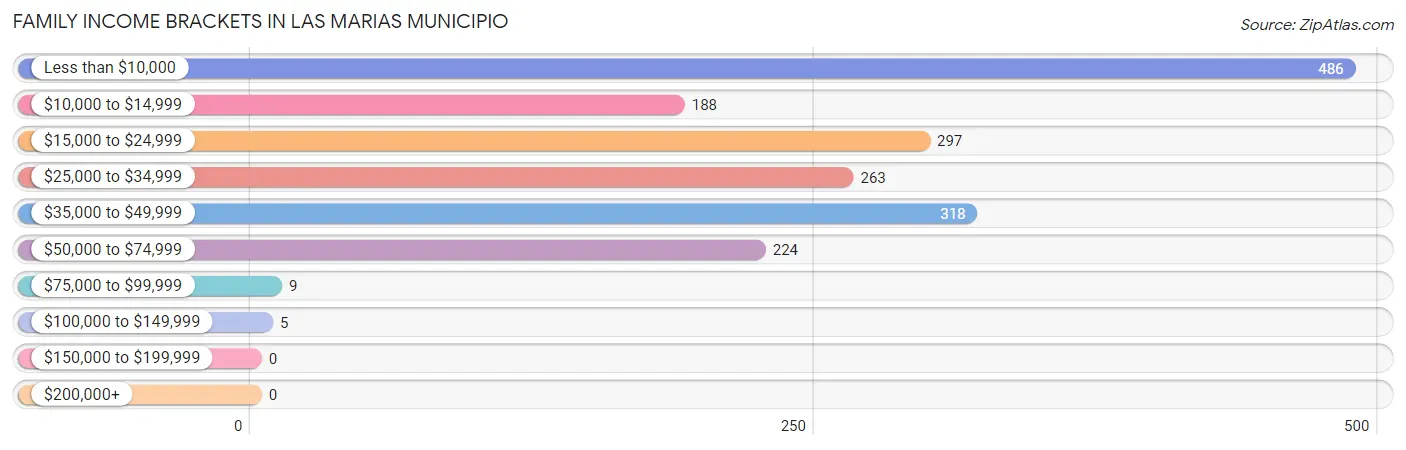
Family Income Brackets in Las Marias Municipio
According to the Las Marias Municipio family income data, there are 486 families falling into the less than $10,000 income range, which is the most common income bracket and makes up 27.2% of all families.
| Income Bracket | # Families | % Families |
| Less than $10,000 | 486 | 27.2% |
| $10,000 to $14,999 | 188 | 10.5% |
| $15,000 to $24,999 | 297 | 16.6% |
| $25,000 to $34,999 | 263 | 14.7% |
| $35,000 to $49,999 | 318 | 17.8% |
| $50,000 to $74,999 | 224 | 12.5% |
| $75,000 to $99,999 | 9 | 0.5% |
| $100,000 to $149,999 | 5 | 0.3% |
| $150,000 to $199,999 | 0 | 0.0% |
| $200,000+ | 0 | 0.0% |
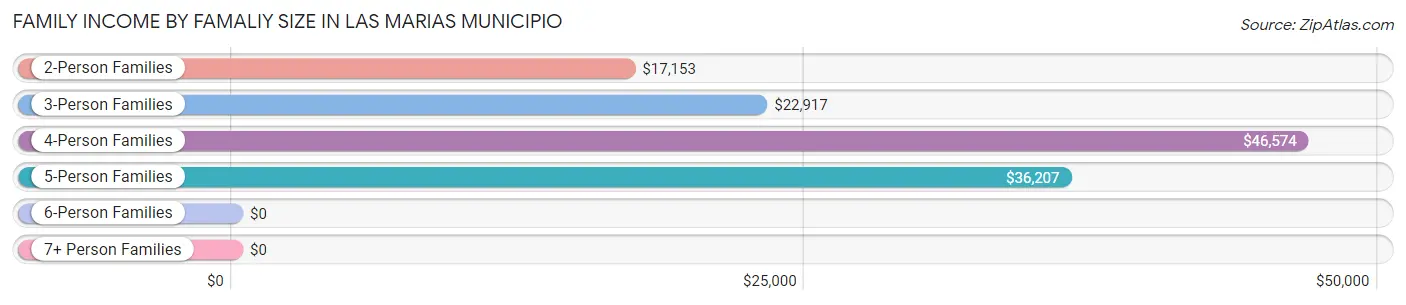
Family Income by Famaliy Size in Las Marias Municipio
4-person families (272 | 15.2%) account for the highest median family income in Las Marias Municipio with $46,574 per family, while 4-person families (272 | 15.2%) have the highest median income of $11,644 per family member.
| Income Bracket | # Families | Median Income |
| 2-Person Families | 844 (47.2%) | $17,153 |
| 3-Person Families | 576 (32.2%) | $22,917 |
| 4-Person Families | 272 (15.2%) | $46,574 |
| 5-Person Families | 82 (4.6%) | $36,207 |
| 6-Person Families | 3 (0.2%) | $0 |
| 7+ Person Families | 11 (0.6%) | $0 |
| Total | 1,788 (100.0%) | $21,612 |
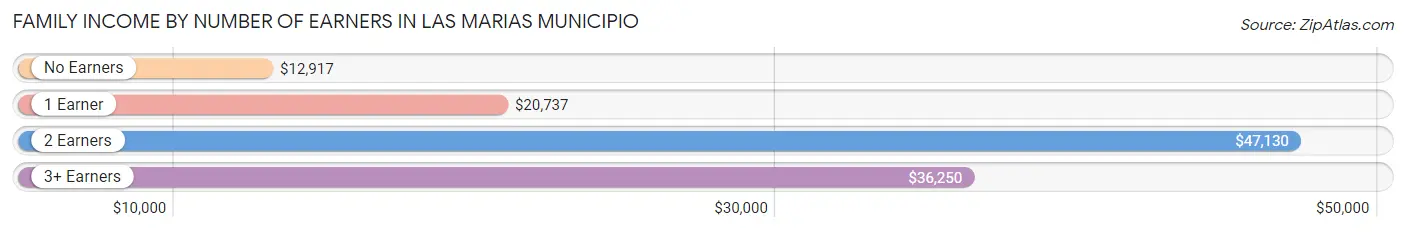
Family Income by Number of Earners in Las Marias Municipio
The median family income in Las Marias Municipio is $21,612, with families comprising 2 earners (310) having the highest median family income of $47,130, while families with no earners (882) have the lowest median family income of $12,917, accounting for 17.3% and 49.3% of families, respectively.
| Number of Earners | # Families | Median Income |
| No Earners | 882 (49.3%) | $12,917 |
| 1 Earner | 537 (30.0%) | $20,737 |
| 2 Earners | 310 (17.3%) | $47,130 |
| 3+ Earners | 59 (3.3%) | $36,250 |
| Total | 1,788 (100.0%) | $21,612 |
Household Income in Las Marias Municipio
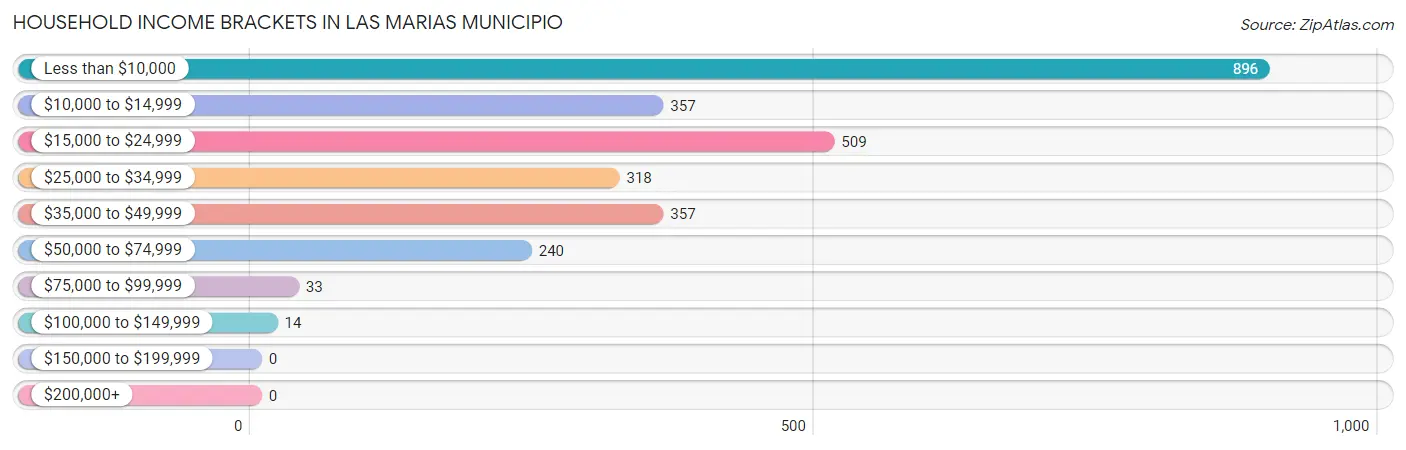
Household Income Brackets in Las Marias Municipio
With 896 households falling in the category, the less than $10,000 income range is the most frequent in Las Marias Municipio, accounting for 32.9% of all households.
| Income Bracket | # Households | % Households |
| Less than $10,000 | 896 | 32.9% |
| $10,000 to $14,999 | 357 | 13.1% |
| $15,000 to $24,999 | 509 | 18.7% |
| $25,000 to $34,999 | 318 | 11.7% |
| $35,000 to $49,999 | 357 | 13.1% |
| $50,000 to $74,999 | 240 | 8.8% |
| $75,000 to $99,999 | 33 | 1.2% |
| $100,000 to $149,999 | 14 | 0.5% |
| $150,000 to $199,999 | 0 | 0.0% |
| $200,000+ | 0 | 0.0% |
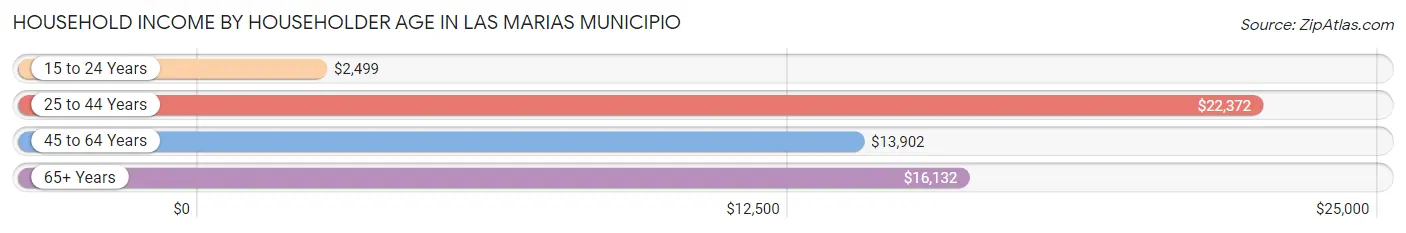
Household Income by Householder Age in Las Marias Municipio
The median household income in Las Marias Municipio is $16,506, with the highest median household income of $22,372 found in the 25 to 44 years age bracket for the primary householder. A total of 527 households (19.4%) fall into this category. Meanwhile, the 15 to 24 years age bracket for the primary householder has the lowest median household income of $2,499, with 38 households (1.4%) in this group.
| Income Bracket | # Households | Median Income |
| 15 to 24 Years | 38 (1.4%) | $2,499 |
| 25 to 44 Years | 527 (19.4%) | $22,372 |
| 45 to 64 Years | 966 (35.5%) | $13,902 |
| 65+ Years | 1,191 (43.8%) | $16,132 |
| Total | 2,722 (100.0%) | $16,506 |
Poverty in Las Marias Municipio
Income Below Poverty by Sex and Age in Las Marias Municipio
With 55.2% poverty level for males and 50.4% for females among the residents of Las Marias Municipio, under 5 year old males and 12 to 14 year old females are the most vulnerable to poverty, with 154 males (100.0%) and 89 females (74.2%) in their respective age groups living below the poverty level.
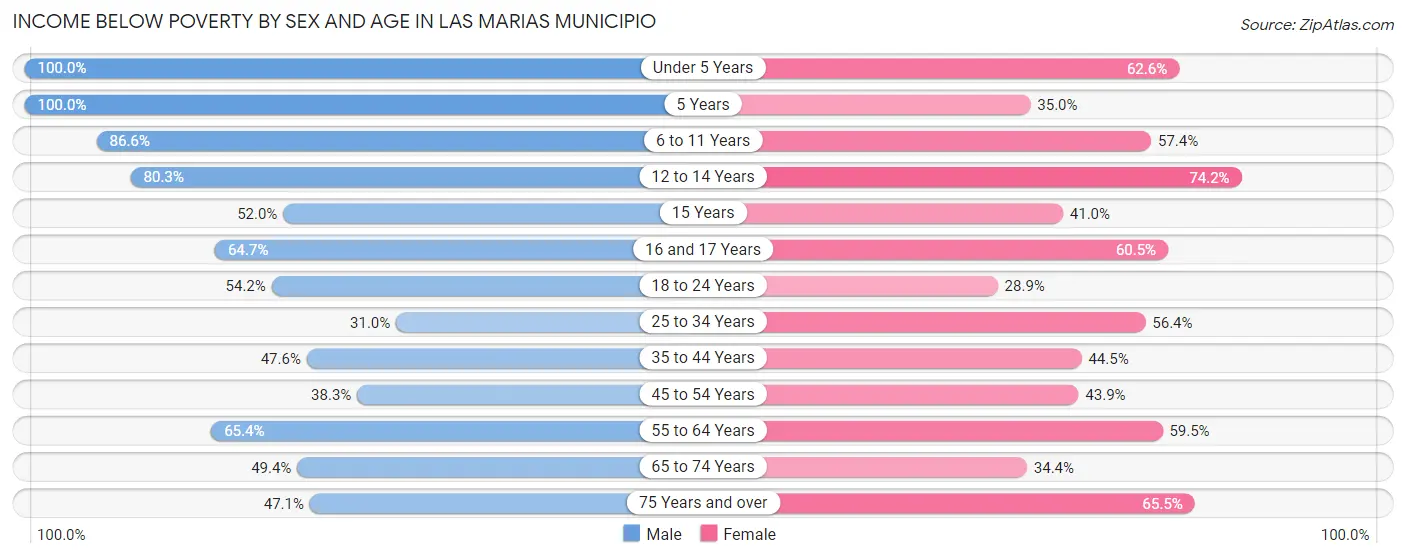
| Age Bracket | Male | Female |
| Under 5 Years | 154 (100.0%) | 102 (62.6%) |
| 5 Years | 29 (100.0%) | 7 (35.0%) |
| 6 to 11 Years | 175 (86.6%) | 217 (57.4%) |
| 12 to 14 Years | 237 (80.3%) | 89 (74.2%) |
| 15 Years | 13 (52.0%) | 16 (41.0%) |
| 16 and 17 Years | 86 (64.7%) | 69 (60.5%) |
| 18 to 24 Years | 300 (54.1%) | 105 (28.9%) |
| 25 to 34 Years | 122 (31.0%) | 315 (56.4%) |
| 35 to 44 Years | 241 (47.6%) | 222 (44.5%) |
| 45 to 54 Years | 204 (38.3%) | 242 (43.9%) |
| 55 to 64 Years | 396 (65.3%) | 369 (59.5%) |
| 65 to 74 Years | 249 (49.4%) | 191 (34.4%) |
| 75 Years and over | 193 (47.1%) | 279 (65.5%) |
| Total | 2,399 (55.2%) | 2,223 (50.4%) |
Income Above Poverty by Sex and Age in Las Marias Municipio
According to the poverty statistics in Las Marias Municipio, males aged 25 to 34 years and females aged 18 to 24 years are the age groups that are most secure financially, with 69.0% of males and 71.1% of females in these age groups living above the poverty line.
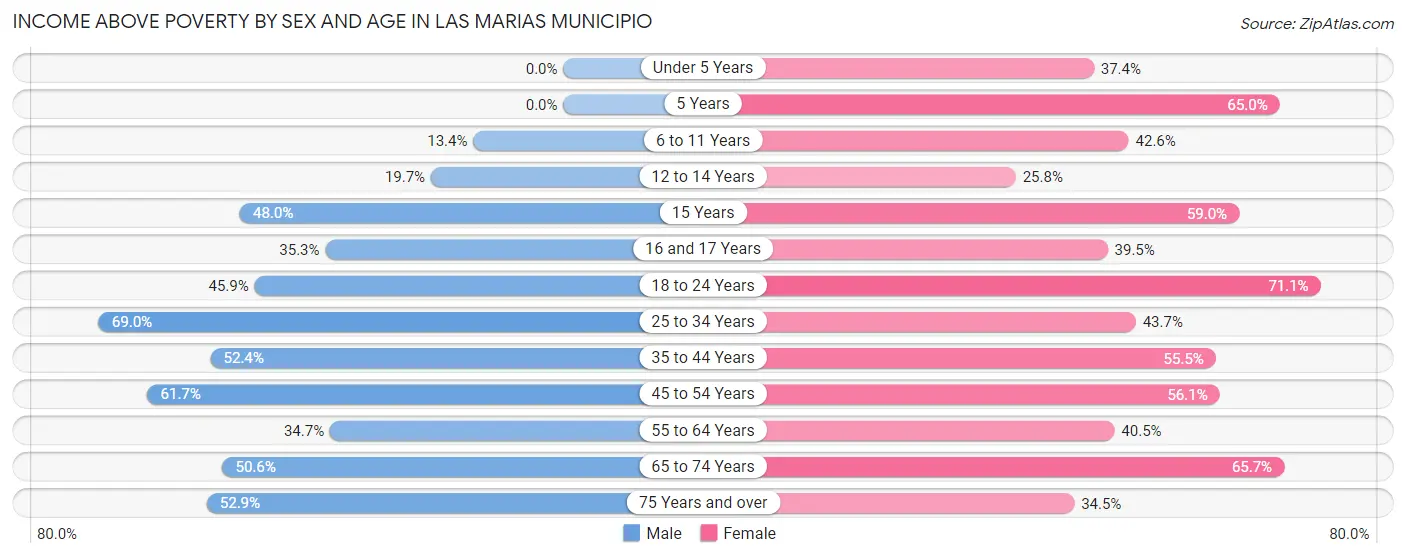
| Age Bracket | Male | Female |
| Under 5 Years | 0 (0.0%) | 61 (37.4%) |
| 5 Years | 0 (0.0%) | 13 (65.0%) |
| 6 to 11 Years | 27 (13.4%) | 161 (42.6%) |
| 12 to 14 Years | 58 (19.7%) | 31 (25.8%) |
| 15 Years | 12 (48.0%) | 23 (59.0%) |
| 16 and 17 Years | 47 (35.3%) | 45 (39.5%) |
| 18 to 24 Years | 254 (45.9%) | 258 (71.1%) |
| 25 to 34 Years | 271 (69.0%) | 244 (43.6%) |
| 35 to 44 Years | 265 (52.4%) | 277 (55.5%) |
| 45 to 54 Years | 329 (61.7%) | 309 (56.1%) |
| 55 to 64 Years | 210 (34.6%) | 251 (40.5%) |
| 65 to 74 Years | 255 (50.6%) | 365 (65.6%) |
| 75 Years and over | 217 (52.9%) | 147 (34.5%) |
| Total | 1,945 (44.8%) | 2,185 (49.6%) |
Income Below Poverty Among Married-Couple Families in Las Marias Municipio
The poverty statistics for married-couple families in Las Marias Municipio show that 39.8% or 526 of the total 1,323 families live below the poverty line. Families with 1 or 2 children have the highest poverty rate of 47.5%, comprising of 162 families. On the other hand, families with no children have the lowest poverty rate of 37.1%, which includes 364 families.
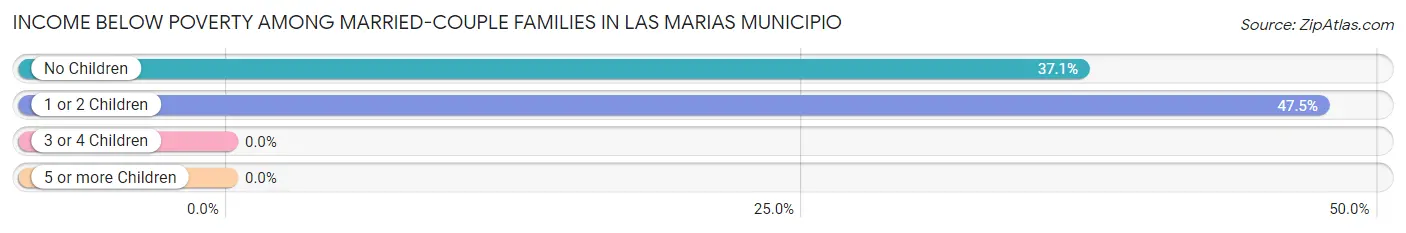
| Children | Above Poverty | Below Poverty |
| No Children | 618 (62.9%) | 364 (37.1%) |
| 1 or 2 Children | 179 (52.5%) | 162 (47.5%) |
| 3 or 4 Children | 0 (0.0%) | 0 (0.0%) |
| 5 or more Children | 0 (0.0%) | 0 (0.0%) |
| Total | 797 (60.2%) | 526 (39.8%) |
Income Below Poverty Among Single-Parent Households in Las Marias Municipio
According to the poverty data in Las Marias Municipio, 85.1% or 74 single-father households and 77.8% or 294 single-mother households are living below the poverty line. Among single-father households, those with no children have the highest poverty rate, with 27 households (100.0%) experiencing poverty. Likewise, among single-mother households, those with 1 or 2 children have the highest poverty rate, with 208 households (100.0%) falling below the poverty line.
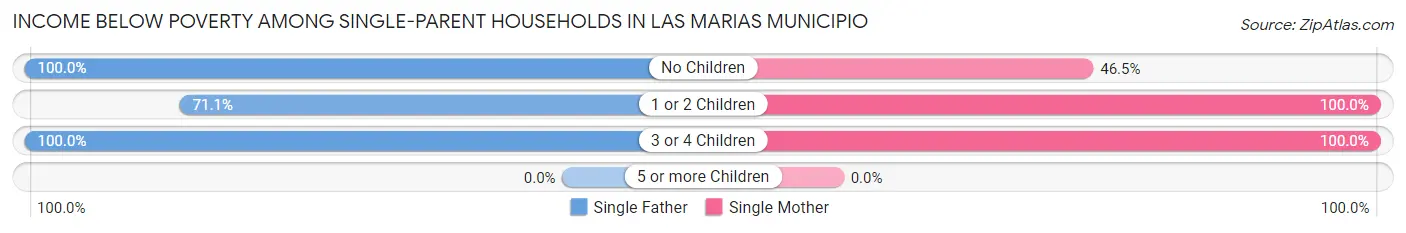
| Children | Single Father | Single Mother |
| No Children | 27 (100.0%) | 73 (46.5%) |
| 1 or 2 Children | 32 (71.1%) | 208 (100.0%) |
| 3 or 4 Children | 15 (100.0%) | 13 (100.0%) |
| 5 or more Children | 0 (0.0%) | 0 (0.0%) |
| Total | 74 (85.1%) | 294 (77.8%) |
Income Below Poverty Among Married-Couple vs Single-Parent Households in Las Marias Municipio
The poverty data for Las Marias Municipio shows that 526 of the married-couple family households (39.8%) and 368 of the single-parent households (79.1%) are living below the poverty level. Within the married-couple family households, those with 1 or 2 children have the highest poverty rate, with 162 households (47.5%) falling below the poverty line. Among the single-parent households, those with 3 or 4 children have the highest poverty rate, with 28 household (100.0%) living below poverty.
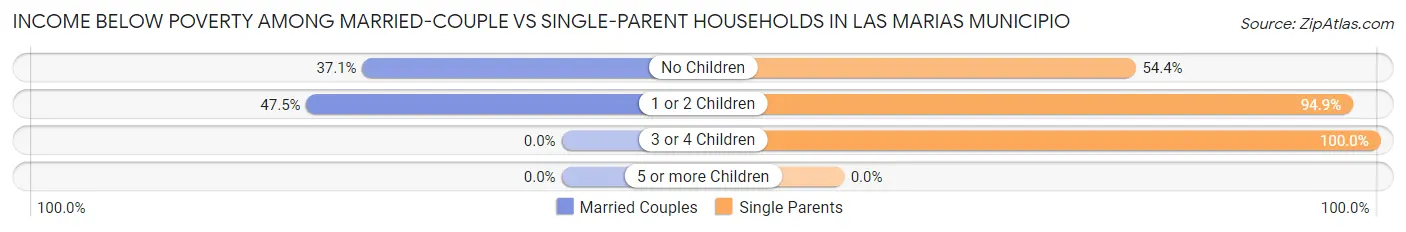
| Children | Married-Couple Families | Single-Parent Households |
| No Children | 364 (37.1%) | 100 (54.3%) |
| 1 or 2 Children | 162 (47.5%) | 240 (94.9%) |
| 3 or 4 Children | 0 (0.0%) | 28 (100.0%) |
| 5 or more Children | 0 (0.0%) | 0 (0.0%) |
| Total | 526 (39.8%) | 368 (79.1%) |
Race in Las Marias Municipio
The most populous races in Las Marias Municipio are Hispanic or Latino (8,789 | 99.6%), White / Caucasian (5,005 | 56.7%), and Some other Race (3,054 | 34.6%).
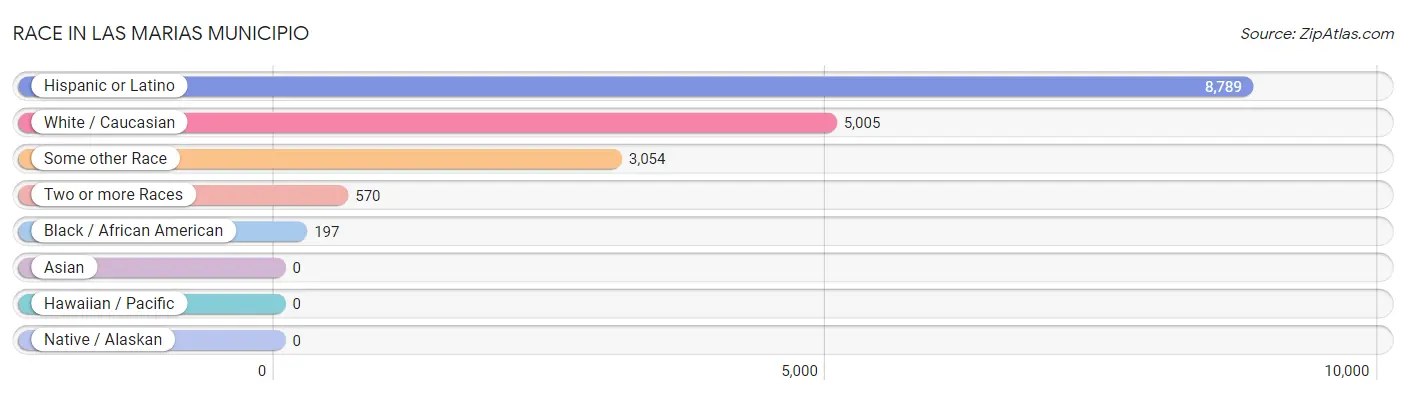
| Race | # Population | % Population |
| Asian | 0 | 0.0% |
| Black / African American | 197 | 2.2% |
| Hawaiian / Pacific | 0 | 0.0% |
| Hispanic or Latino | 8,789 | 99.6% |
| Native / Alaskan | 0 | 0.0% |
| White / Caucasian | 5,005 | 56.7% |
| Two or more Races | 570 | 6.5% |
| Some other Race | 3,054 | 34.6% |
| Total | 8,826 | 100.0% |
Ancestry in Las Marias Municipio
The most populous ancestries reported in Las Marias Municipio are Puerto Rican (8,668 | 98.2%), Dominican (63 | 0.7%), Central American (43 | 0.5%), Panamanian (43 | 0.5%), and Central American Indian (26 | 0.3%), together accounting for 100.2% of all Las Marias Municipio residents.
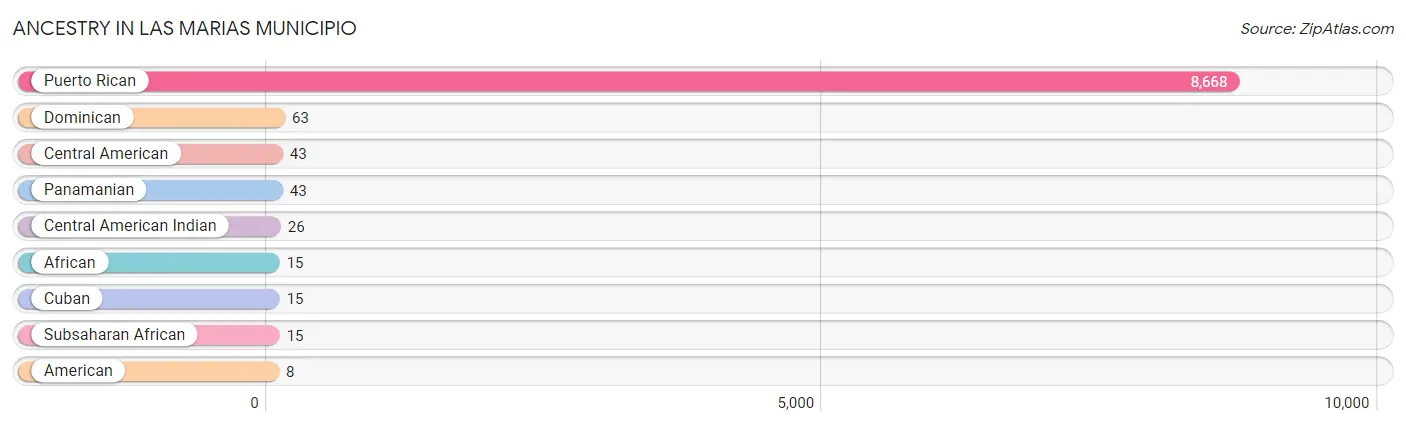
| Ancestry | # Population | % Population |
| African | 15 | 0.2% |
| American | 8 | 0.1% |
| Central American | 43 | 0.5% |
| Central American Indian | 26 | 0.3% |
| Cuban | 15 | 0.2% |
| Dominican | 63 | 0.7% |
| Panamanian | 43 | 0.5% |
| Puerto Rican | 8,668 | 98.2% |
| Subsaharan African | 15 | 0.2% | View All 9 Rows |
Immigrants in Las Marias Municipio

| Immigration Origin | # Population | % Population | View All 0 Rows |
Sex and Age in Las Marias Municipio
Sex and Age in Las Marias Municipio
The most populous age groups in Las Marias Municipio are 20 to 24 Years (458 | 10.5%) for men and 55 to 59 Years (335 | 7.5%) for women.
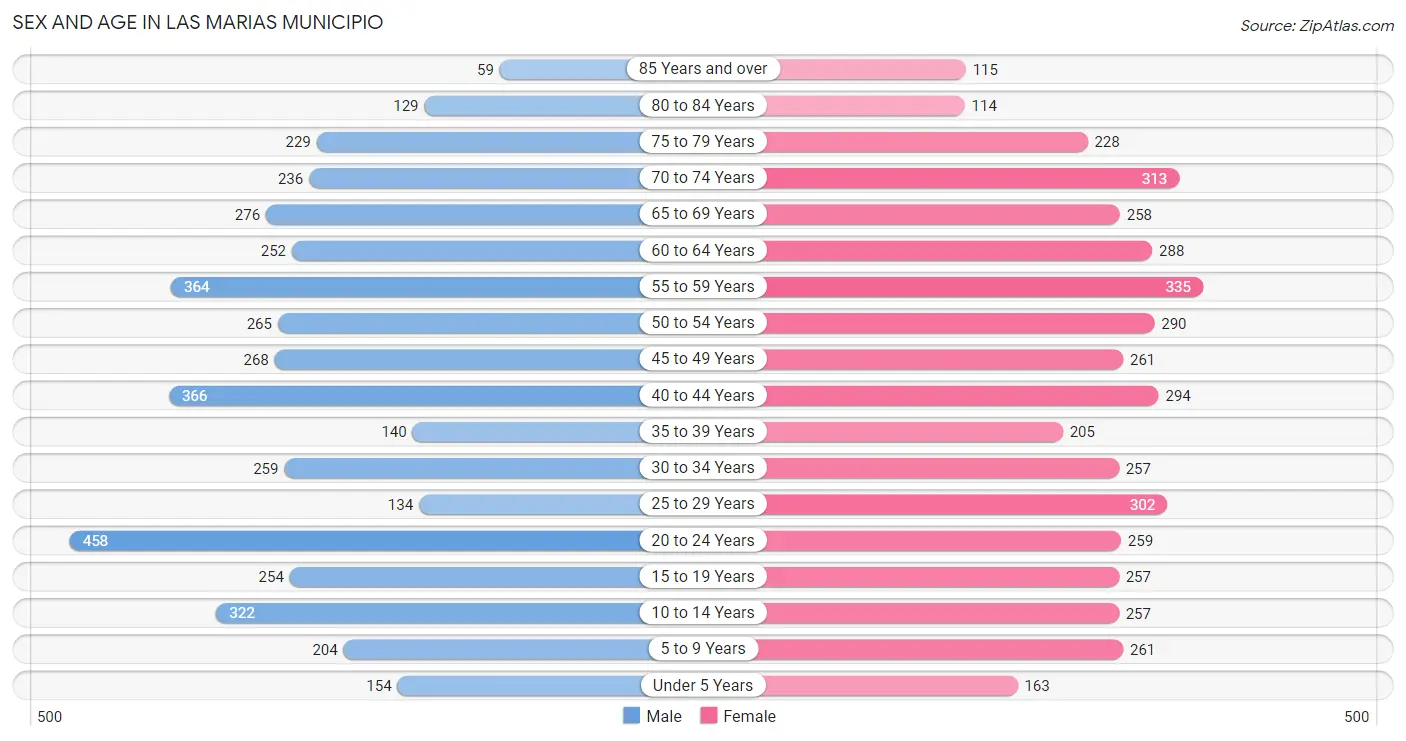
| Age Bracket | Male | Female |
| Under 5 Years | 154 (3.5%) | 163 (3.7%) |
| 5 to 9 Years | 204 (4.7%) | 261 (5.9%) |
| 10 to 14 Years | 322 (7.4%) | 257 (5.8%) |
| 15 to 19 Years | 254 (5.8%) | 257 (5.8%) |
| 20 to 24 Years | 458 (10.5%) | 259 (5.8%) |
| 25 to 29 Years | 134 (3.1%) | 302 (6.8%) |
| 30 to 34 Years | 259 (5.9%) | 257 (5.8%) |
| 35 to 39 Years | 140 (3.2%) | 205 (4.6%) |
| 40 to 44 Years | 366 (8.4%) | 294 (6.6%) |
| 45 to 49 Years | 268 (6.1%) | 261 (5.9%) |
| 50 to 54 Years | 265 (6.1%) | 290 (6.5%) |
| 55 to 59 Years | 364 (8.3%) | 335 (7.5%) |
| 60 to 64 Years | 252 (5.8%) | 288 (6.5%) |
| 65 to 69 Years | 276 (6.3%) | 258 (5.8%) |
| 70 to 74 Years | 236 (5.4%) | 313 (7.0%) |
| 75 to 79 Years | 229 (5.2%) | 228 (5.1%) |
| 80 to 84 Years | 129 (2.9%) | 114 (2.6%) |
| 85 Years and over | 59 (1.3%) | 115 (2.6%) |
| Total | 4,369 (100.0%) | 4,457 (100.0%) |
Families and Households in Las Marias Municipio
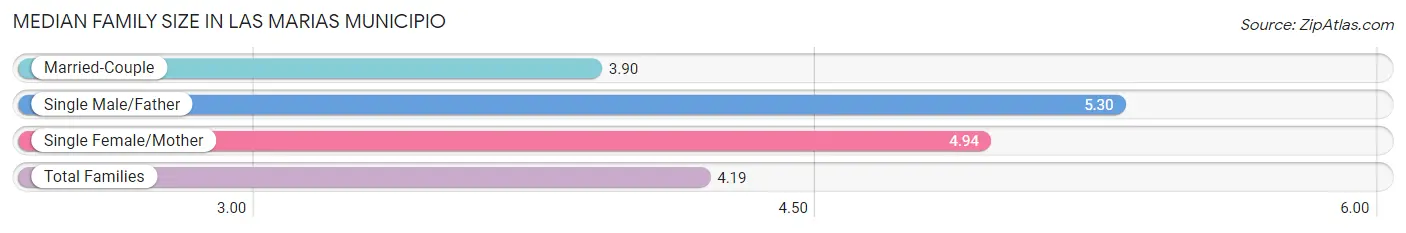
Median Family Size in Las Marias Municipio
The median family size in Las Marias Municipio is 4.19 persons per family, with single male/father families (87 | 4.9%) accounting for the largest median family size of 5.3 persons per family. On the other hand, married-couple families (1,323 | 74.0%) represent the smallest median family size with 3.90 persons per family.
| Family Type | # Families | Family Size |
| Married-Couple | 1,323 (74.0%) | 3.90 |
| Single Male/Father | 87 (4.9%) | 5.30 |
| Single Female/Mother | 378 (21.1%) | 4.94 |
| Total Families | 1,788 (100.0%) | 4.19 |
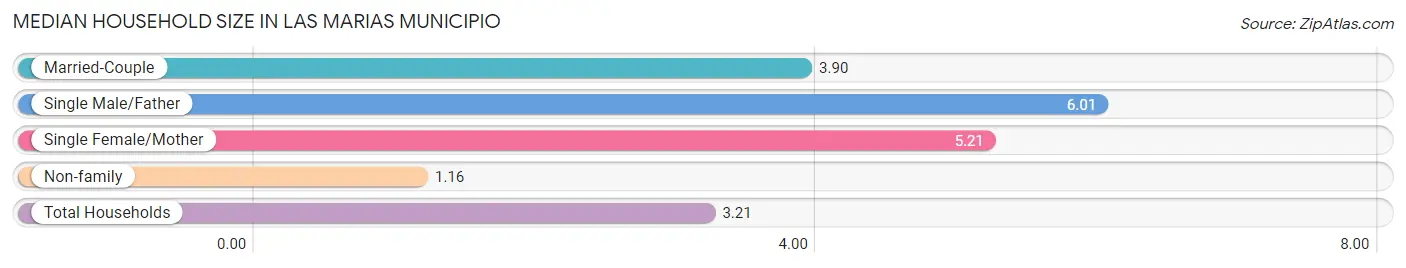
Median Household Size in Las Marias Municipio
The median household size in Las Marias Municipio is 3.21 persons per household, with single male/father households (87 | 3.2%) accounting for the largest median household size of 6.01 persons per household. non-family households (934 | 34.3%) represent the smallest median household size with 1.16 persons per household.
| Household Type | # Households | Household Size |
| Married-Couple | 1,323 (48.6%) | 3.90 |
| Single Male/Father | 87 (3.2%) | 6.01 |
| Single Female/Mother | 378 (13.9%) | 5.21 |
| Non-family | 934 (34.3%) | 1.16 |
| Total Households | 2,722 (100.0%) | 3.21 |
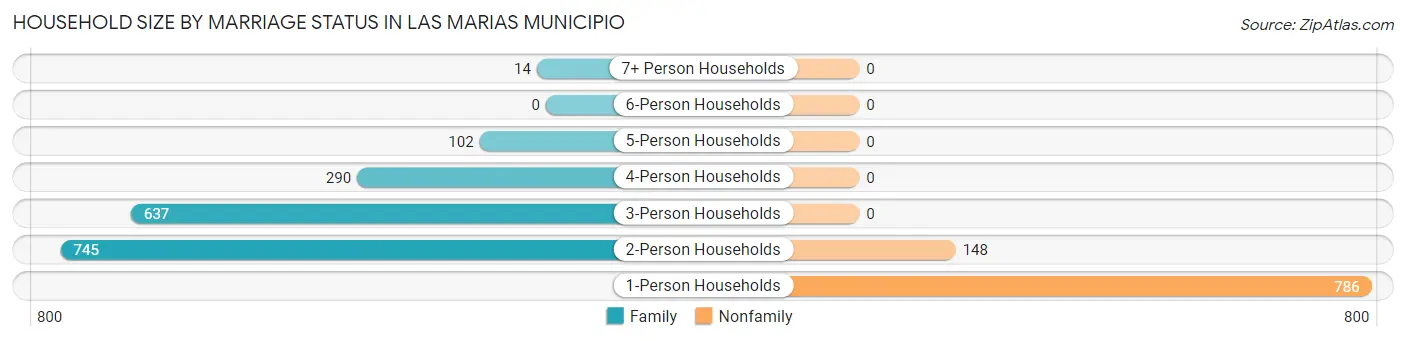
Household Size by Marriage Status in Las Marias Municipio
Out of a total of 2,722 households in Las Marias Municipio, 1,788 (65.7%) are family households, while 934 (34.3%) are nonfamily households. The most numerous type of family households are 2-person households, comprising 745, and the most common type of nonfamily households are 1-person households, comprising 786.
| Household Size | Family Households | Nonfamily Households |
| 1-Person Households | - | 786 (28.9%) |
| 2-Person Households | 745 (27.4%) | 148 (5.4%) |
| 3-Person Households | 637 (23.4%) | 0 (0.0%) |
| 4-Person Households | 290 (10.6%) | 0 (0.0%) |
| 5-Person Households | 102 (3.7%) | 0 (0.0%) |
| 6-Person Households | 0 (0.0%) | 0 (0.0%) |
| 7+ Person Households | 14 (0.5%) | 0 (0.0%) |
| Total | 1,788 (65.7%) | 934 (34.3%) |
Female Fertility in Las Marias Municipio
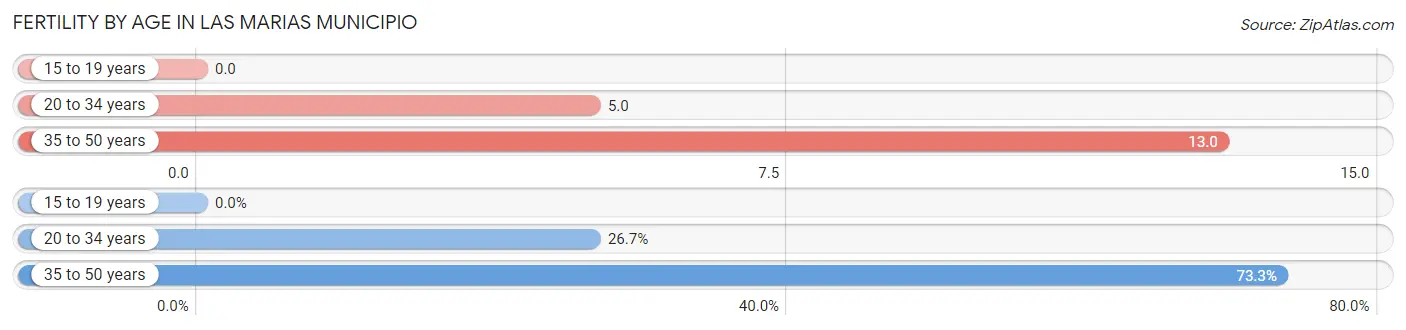
Fertility by Age in Las Marias Municipio
Average fertility rate in Las Marias Municipio is 8.0 births per 1,000 women. Women in the age bracket of 35 to 50 years have the highest fertility rate with 13.0 births per 1,000 women. Women in the age bracket of 35 to 50 years acount for 73.3% of all women with births.
| Age Bracket | Women with Births | Births / 1,000 Women |
| 15 to 19 years | 0 (0.0%) | 0.0 |
| 20 to 34 years | 4 (26.7%) | 5.0 |
| 35 to 50 years | 11 (73.3%) | 13.0 |
| Total | 15 (100.0%) | 8.0 |
Fertility by Age by Marriage Status in Las Marias Municipio
73.3% of women with births (15) in Las Marias Municipio are married. The highest percentage of unmarried women with births falls into 20 to 34 years age bracket with 100.0% of them unmarried at the time of birth, while the lowest percentage of unmarried women with births belong to 35 to 50 years age bracket with 0.0% of them unmarried.
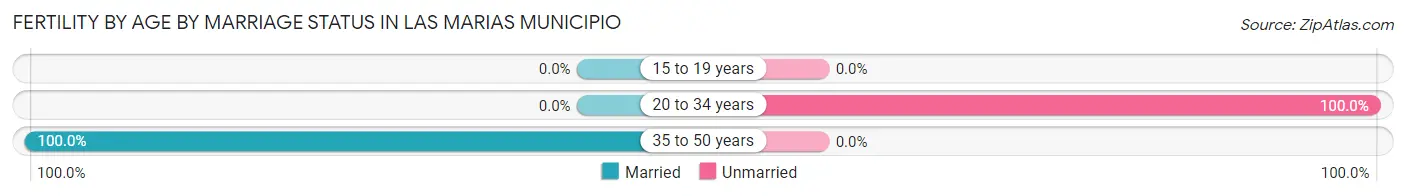
| Age Bracket | Married | Unmarried |
| 15 to 19 years | 0 (0.0%) | 0 (0.0%) |
| 20 to 34 years | 0 (0.0%) | 4 (100.0%) |
| 35 to 50 years | 11 (100.0%) | 0 (0.0%) |
| Total | 11 (73.3%) | 4 (26.7%) |
Fertility by Education in Las Marias Municipio
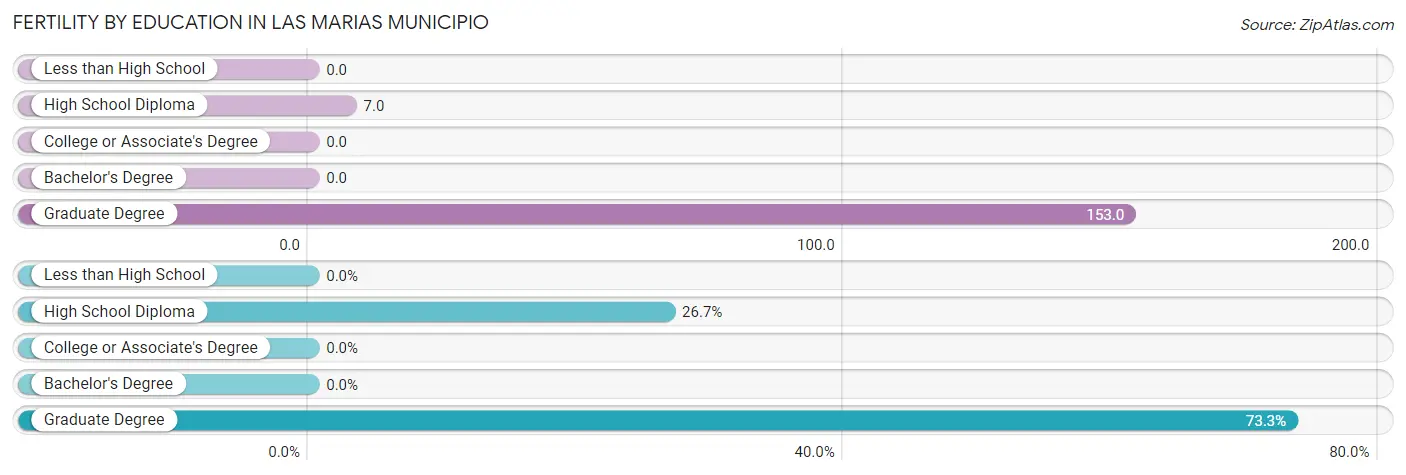
| Educational Attainment | Women with Births | Births / 1,000 Women |
| Less than High School | 0 (0.0%) | 0.0 |
| High School Diploma | 4 (26.7%) | 7.0 |
| College or Associate's Degree | 0 (0.0%) | 0.0 |
| Bachelor's Degree | 0 (0.0%) | 0.0 |
| Graduate Degree | 11 (73.3%) | 153.0 |
| Total | 15 (100.0%) | 8.0 |
Fertility by Education by Marriage Status in Las Marias Municipio
26.7% of women with births in Las Marias Municipio are unmarried. Women with the educational attainment of graduate degree are most likely to be married with 100.0% of them married at childbirth, while women with the educational attainment of high school diploma are least likely to be married with 100.0% of them unmarried at childbirth.
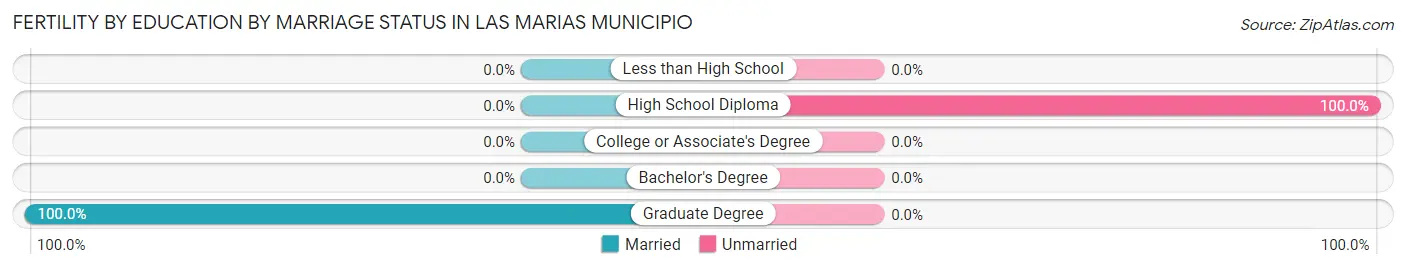
| Educational Attainment | Married | Unmarried |
| Less than High School | 0 (0.0%) | 0 (0.0%) |
| High School Diploma | 0 (0.0%) | 4 (100.0%) |
| College or Associate's Degree | 0 (0.0%) | 0 (0.0%) |
| Bachelor's Degree | 0 (0.0%) | 0 (0.0%) |
| Graduate Degree | 11 (100.0%) | 0 (0.0%) |
| Total | 11 (73.3%) | 4 (26.7%) |
Employment Characteristics in Las Marias Municipio
Employment by Class of Employer in Las Marias Municipio
Among the 2,255 employed individuals in Las Marias Municipio, private company employees (1,068 | 47.4%), state government employees (379 | 16.8%), and local government employees (353 | 15.7%) make up the most common classes of employment.
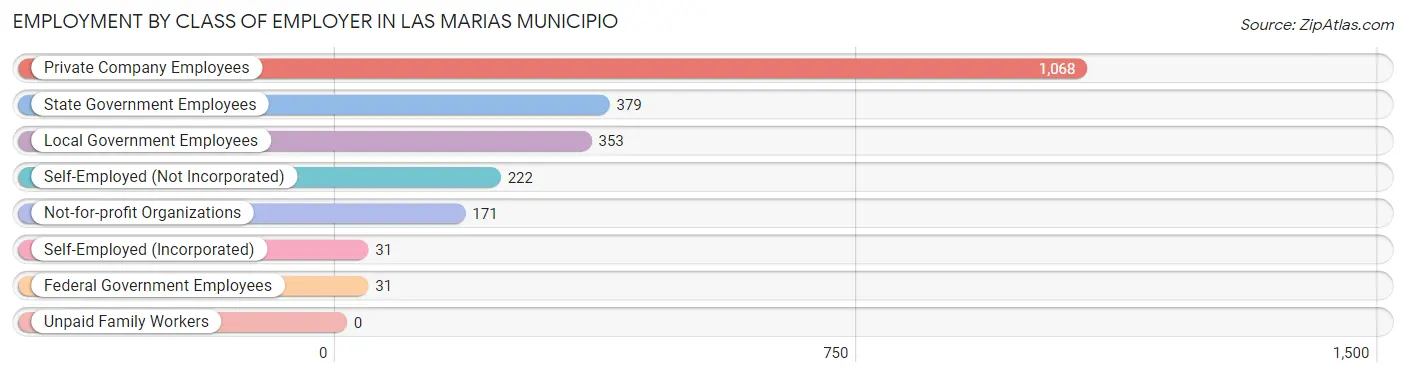
| Employer Class | # Employees | % Employees |
| Private Company Employees | 1,068 | 47.4% |
| Self-Employed (Incorporated) | 31 | 1.4% |
| Self-Employed (Not Incorporated) | 222 | 9.8% |
| Not-for-profit Organizations | 171 | 7.6% |
| Local Government Employees | 353 | 15.7% |
| State Government Employees | 379 | 16.8% |
| Federal Government Employees | 31 | 1.4% |
| Unpaid Family Workers | 0 | 0.0% |
| Total | 2,255 | 100.0% |
Employment Status by Age in Las Marias Municipio
According to the labor force statistics for Las Marias Municipio, out of the total population over 16 years of age (7,401), 33.3% or 2,465 individuals are in the labor force, with 8.1% or 200 of them unemployed. The age group with the highest labor force participation rate is 25 to 29 years, with 76.8% or 335 individuals in the labor force. Within the labor force, the 35 to 44 years age range has the highest percentage of unemployed individuals, with 13.7% or 79 of them being unemployed.
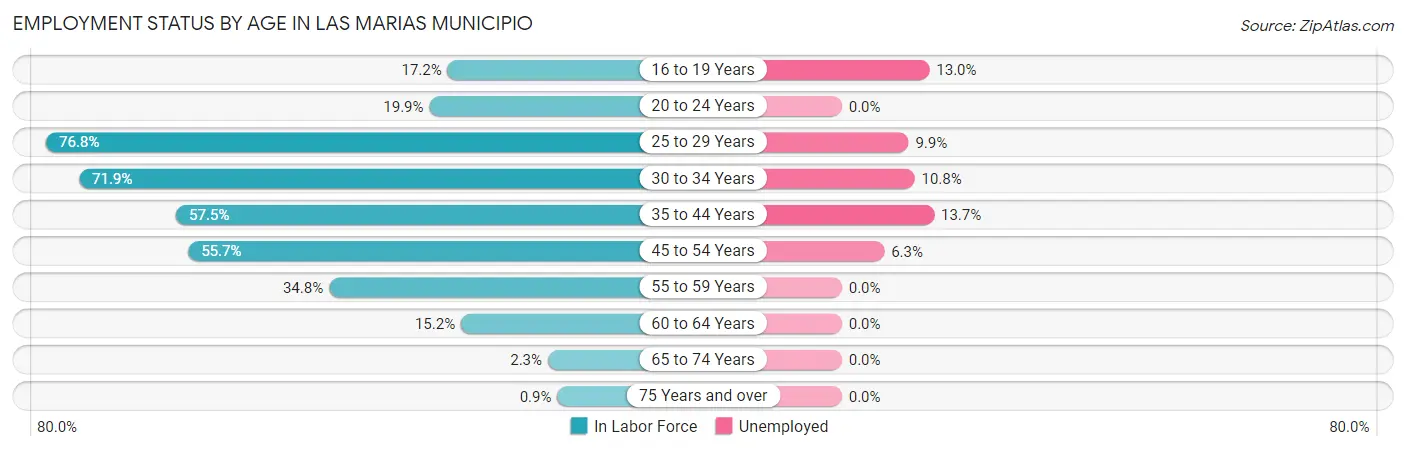
| Age Bracket | In Labor Force | Unemployed |
| 16 to 19 Years | 77 (17.2%) | 10 (13.0%) |
| 20 to 24 Years | 143 (19.9%) | 0 (0.0%) |
| 25 to 29 Years | 335 (76.8%) | 33 (9.9%) |
| 30 to 34 Years | 371 (71.9%) | 40 (10.8%) |
| 35 to 44 Years | 578 (57.5%) | 79 (13.7%) |
| 45 to 54 Years | 604 (55.7%) | 38 (6.3%) |
| 55 to 59 Years | 243 (34.8%) | 0 (0.0%) |
| 60 to 64 Years | 82 (15.2%) | 0 (0.0%) |
| 65 to 74 Years | 25 (2.3%) | 0 (0.0%) |
| 75 Years and over | 8 (0.9%) | 0 (0.0%) |
| Total | 2,465 (33.3%) | 200 (8.1%) |
Employment Status by Educational Attainment in Las Marias Municipio
According to labor force statistics for Las Marias Municipio, 51.7% of individuals (2,213) out of the total population between 25 and 64 years of age (4,280) are in the labor force, with 8.6% or 190 of them being unemployed. The group with the highest labor force participation rate are those with the educational attainment of bachelor's degree or higher, with 73.0% or 610 individuals in the labor force. Within the labor force, individuals with less than high school education have the highest percentage of unemployment, with 33.6% or 81 of them being unemployed.
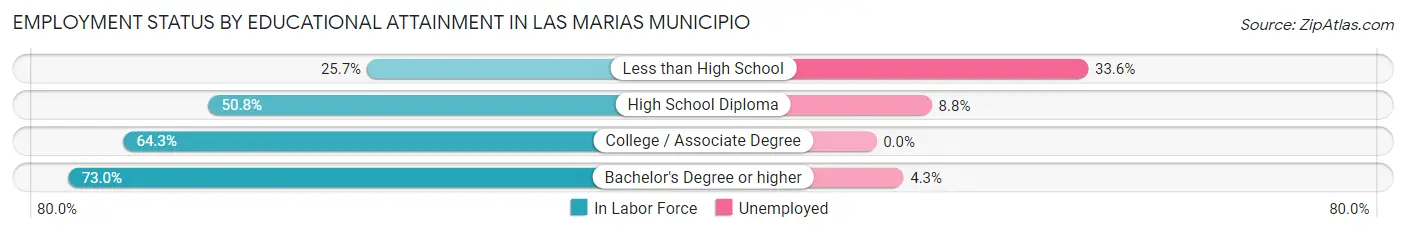
| Educational Attainment | In Labor Force | Unemployed |
| Less than High School | 241 (25.7%) | 314 (33.6%) |
| High School Diploma | 940 (50.8%) | 163 (8.8%) |
| College / Associate Degree | 423 (64.3%) | 0 (0.0%) |
| Bachelor's Degree or higher | 610 (73.0%) | 36 (4.3%) |
| Total | 2,213 (51.7%) | 368 (8.6%) |
Employment Occupations by Sex in Las Marias Municipio
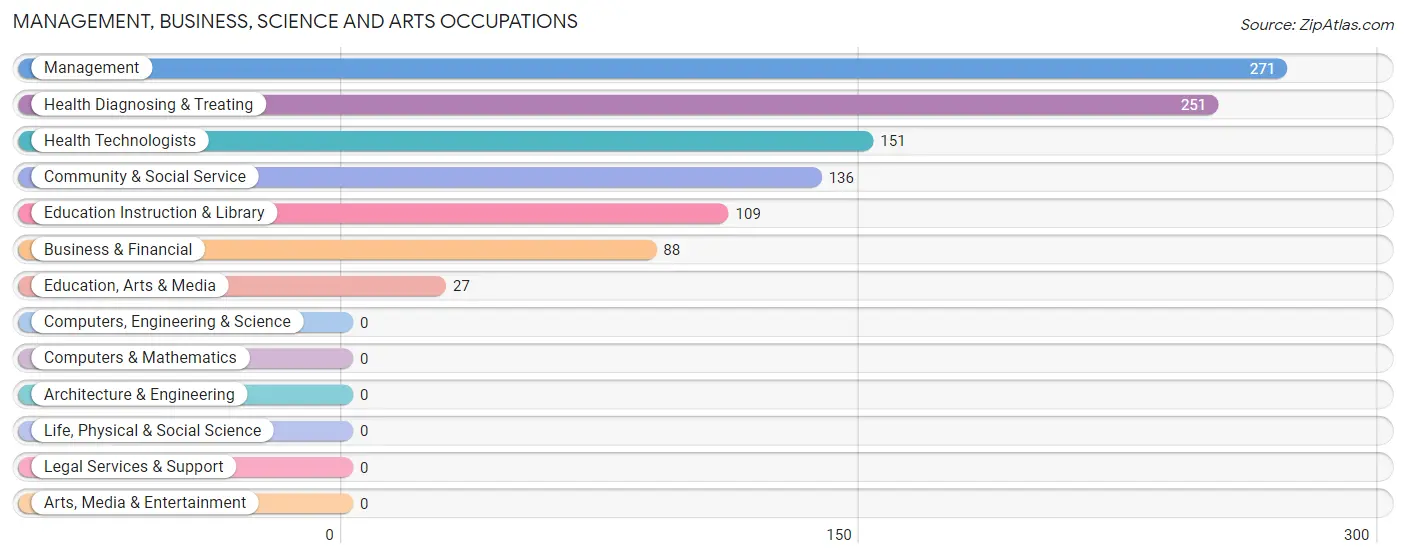
Management, Business, Science and Arts Occupations
The most common Management, Business, Science and Arts occupations in Las Marias Municipio are Management (271 | 12.0%), Health Diagnosing & Treating (251 | 11.1%), Health Technologists (151 | 6.7%), Community & Social Service (136 | 6.0%), and Education Instruction & Library (109 | 4.8%).
Management, Business, Science and Arts Occupations by Sex
Within the Management, Business, Science and Arts occupations in Las Marias Municipio, the most male-oriented occupations are Management (67.9%), Business & Financial (29.5%), and Education Instruction & Library (19.3%), while the most female-oriented occupations are Education, Arts & Media (100.0%), Health Technologists (86.8%), and Community & Social Service (84.6%).
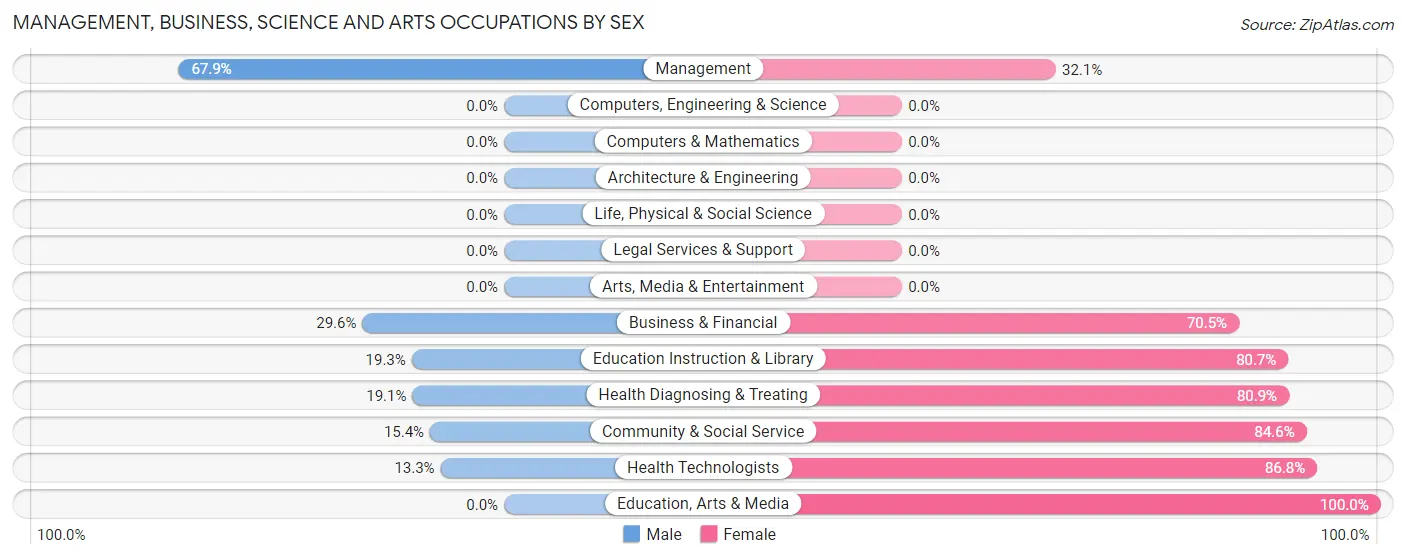
| Occupation | Male | Female |
| Management | 184 (67.9%) | 87 (32.1%) |
| Business & Financial | 26 (29.5%) | 62 (70.5%) |
| Computers, Engineering & Science | 0 (0.0%) | 0 (0.0%) |
| Computers & Mathematics | 0 (0.0%) | 0 (0.0%) |
| Architecture & Engineering | 0 (0.0%) | 0 (0.0%) |
| Life, Physical & Social Science | 0 (0.0%) | 0 (0.0%) |
| Community & Social Service | 21 (15.4%) | 115 (84.6%) |
| Education, Arts & Media | 0 (0.0%) | 27 (100.0%) |
| Legal Services & Support | 0 (0.0%) | 0 (0.0%) |
| Education Instruction & Library | 21 (19.3%) | 88 (80.7%) |
| Arts, Media & Entertainment | 0 (0.0%) | 0 (0.0%) |
| Health Diagnosing & Treating | 48 (19.1%) | 203 (80.9%) |
| Health Technologists | 20 (13.3%) | 131 (86.8%) |
| Total (Category) | 279 (37.4%) | 467 (62.6%) |
| Total (Overall) | 1,268 (56.0%) | 998 (44.0%) |
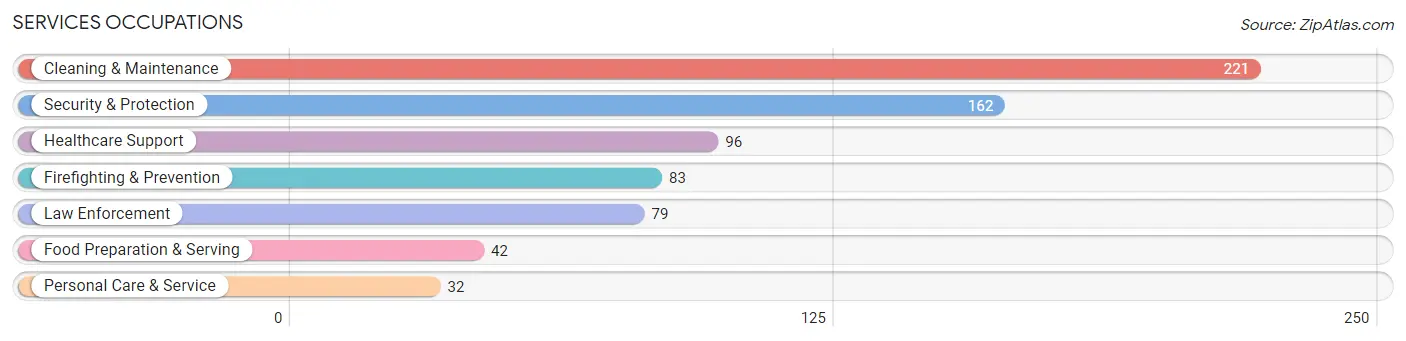
Services Occupations
The most common Services occupations in Las Marias Municipio are Cleaning & Maintenance (221 | 9.8%), Security & Protection (162 | 7.1%), Healthcare Support (96 | 4.2%), Firefighting & Prevention (83 | 3.7%), and Law Enforcement (79 | 3.5%).
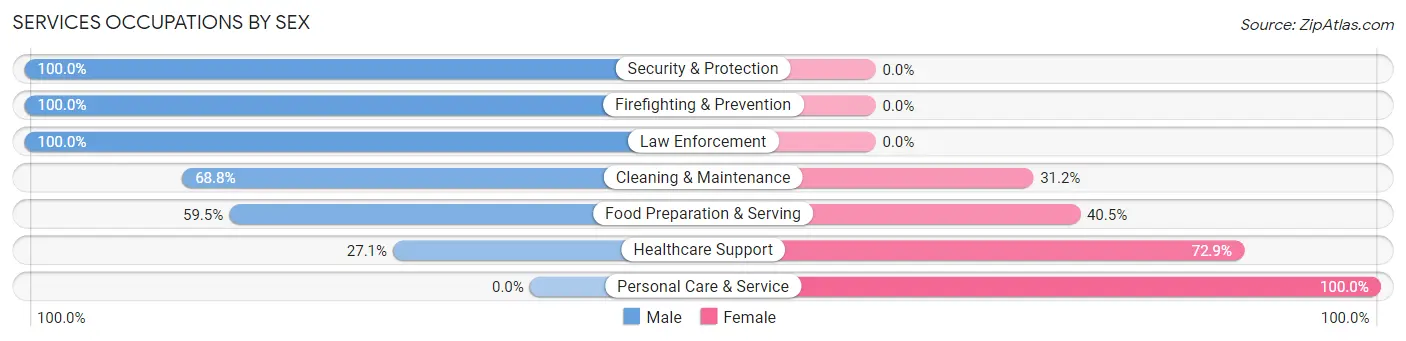
Services Occupations by Sex
Within the Services occupations in Las Marias Municipio, the most male-oriented occupations are Security & Protection (100.0%), Firefighting & Prevention (100.0%), and Law Enforcement (100.0%), while the most female-oriented occupations are Personal Care & Service (100.0%), Healthcare Support (72.9%), and Food Preparation & Serving (40.5%).
| Occupation | Male | Female |
| Healthcare Support | 26 (27.1%) | 70 (72.9%) |
| Security & Protection | 162 (100.0%) | 0 (0.0%) |
| Firefighting & Prevention | 83 (100.0%) | 0 (0.0%) |
| Law Enforcement | 79 (100.0%) | 0 (0.0%) |
| Food Preparation & Serving | 25 (59.5%) | 17 (40.5%) |
| Cleaning & Maintenance | 152 (68.8%) | 69 (31.2%) |
| Personal Care & Service | 0 (0.0%) | 32 (100.0%) |
| Total (Category) | 365 (66.0%) | 188 (34.0%) |
| Total (Overall) | 1,268 (56.0%) | 998 (44.0%) |
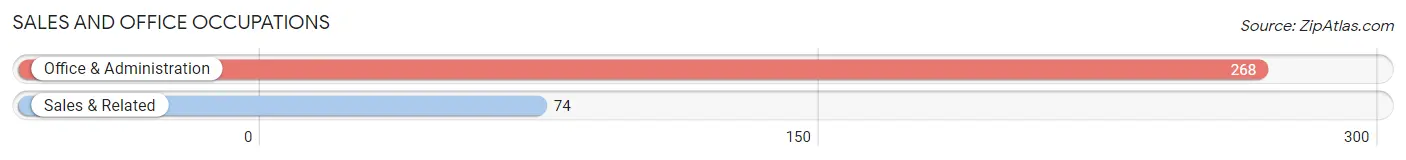
Sales and Office Occupations
The most common Sales and Office occupations in Las Marias Municipio are Office & Administration (268 | 11.8%), and Sales & Related (74 | 3.3%).
Sales and Office Occupations by Sex

| Occupation | Male | Female |
| Sales & Related | 56 (75.7%) | 18 (24.3%) |
| Office & Administration | 27 (10.1%) | 241 (89.9%) |
| Total (Category) | 83 (24.3%) | 259 (75.7%) |
| Total (Overall) | 1,268 (56.0%) | 998 (44.0%) |
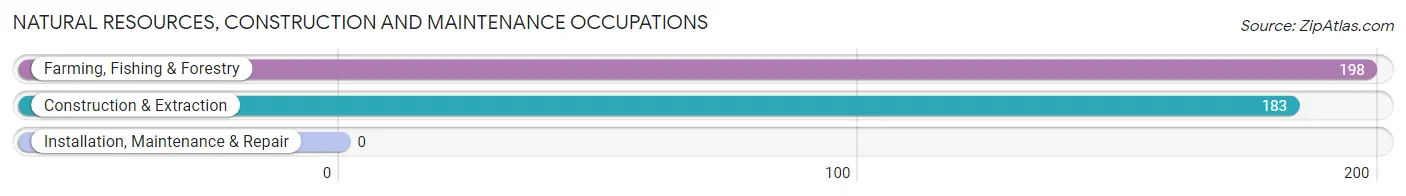
Natural Resources, Construction and Maintenance Occupations
The most common Natural Resources, Construction and Maintenance occupations in Las Marias Municipio are Farming, Fishing & Forestry (198 | 8.7%), and Construction & Extraction (183 | 8.1%).
Natural Resources, Construction and Maintenance Occupations by Sex
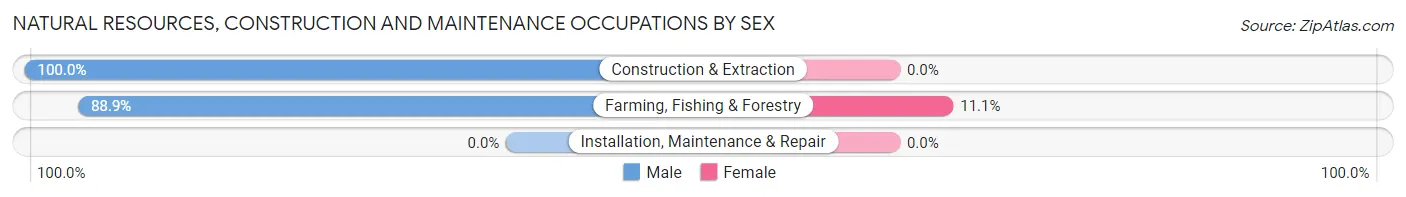
| Occupation | Male | Female |
| Farming, Fishing & Forestry | 176 (88.9%) | 22 (11.1%) |
| Construction & Extraction | 183 (100.0%) | 0 (0.0%) |
| Installation, Maintenance & Repair | 0 (0.0%) | 0 (0.0%) |
| Total (Category) | 359 (94.2%) | 22 (5.8%) |
| Total (Overall) | 1,268 (56.0%) | 998 (44.0%) |
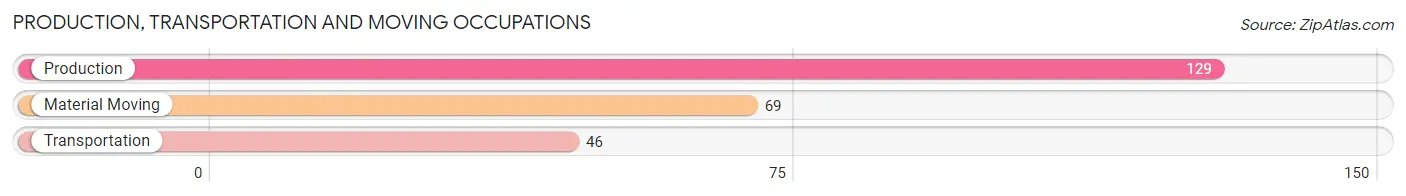
Production, Transportation and Moving Occupations
The most common Production, Transportation and Moving occupations in Las Marias Municipio are Production (129 | 5.7%), Material Moving (69 | 3.0%), and Transportation (46 | 2.0%).
Production, Transportation and Moving Occupations by Sex
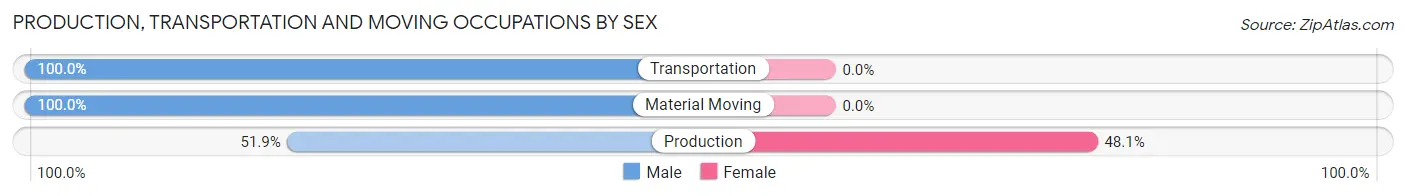
| Occupation | Male | Female |
| Production | 67 (51.9%) | 62 (48.1%) |
| Transportation | 46 (100.0%) | 0 (0.0%) |
| Material Moving | 69 (100.0%) | 0 (0.0%) |
| Total (Category) | 182 (74.6%) | 62 (25.4%) |
| Total (Overall) | 1,268 (56.0%) | 998 (44.0%) |
Employment Industries by Sex in Las Marias Municipio
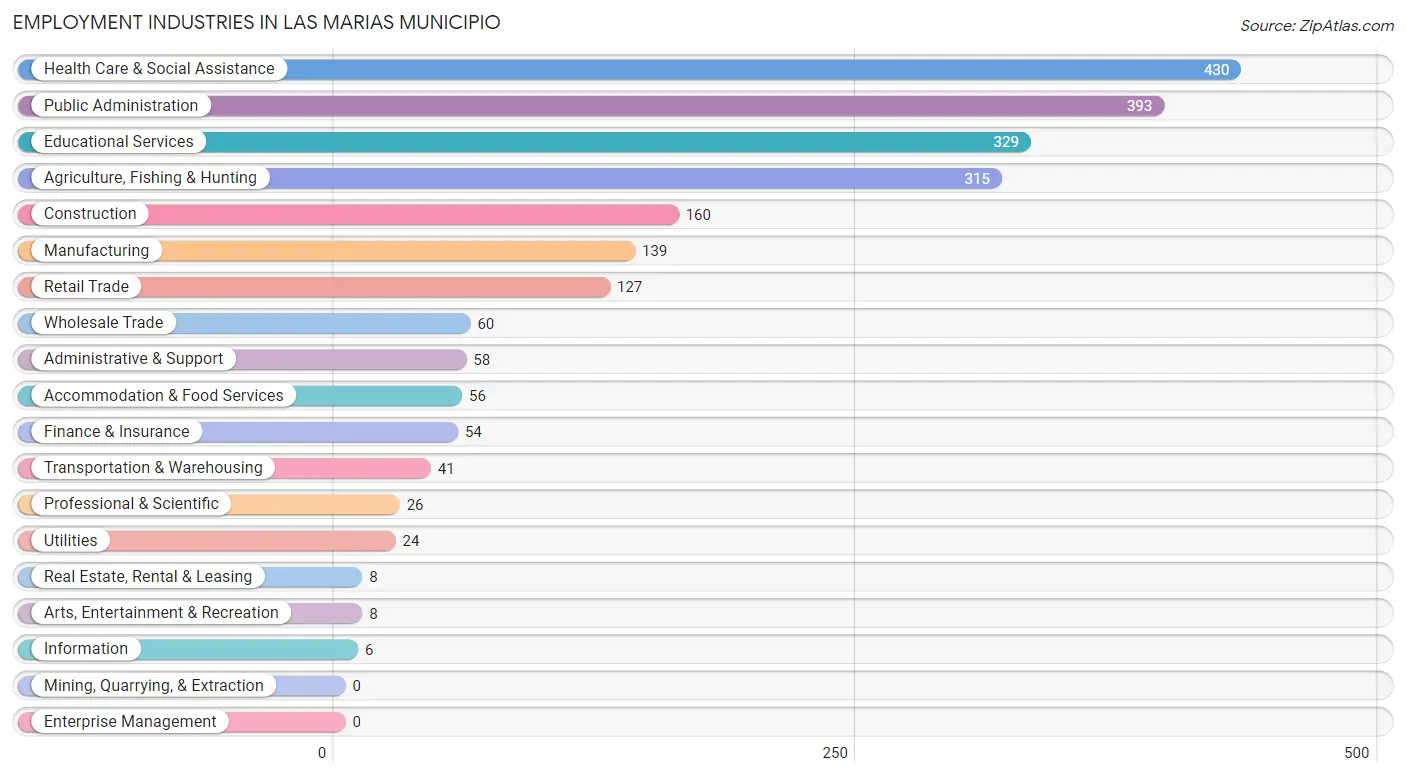
Employment Industries in Las Marias Municipio
The major employment industries in Las Marias Municipio include Health Care & Social Assistance (430 | 19.0%), Public Administration (393 | 17.3%), Educational Services (329 | 14.5%), Agriculture, Fishing & Hunting (315 | 13.9%), and Construction (160 | 7.1%).
Employment Industries by Sex in Las Marias Municipio
The Las Marias Municipio industries that see more men than women are Transportation & Warehousing (100.0%), Utilities (100.0%), and Real Estate, Rental & Leasing (100.0%), whereas the industries that tend to have a higher number of women are Information (100.0%), Finance & Insurance (100.0%), and Health Care & Social Assistance (70.7%).
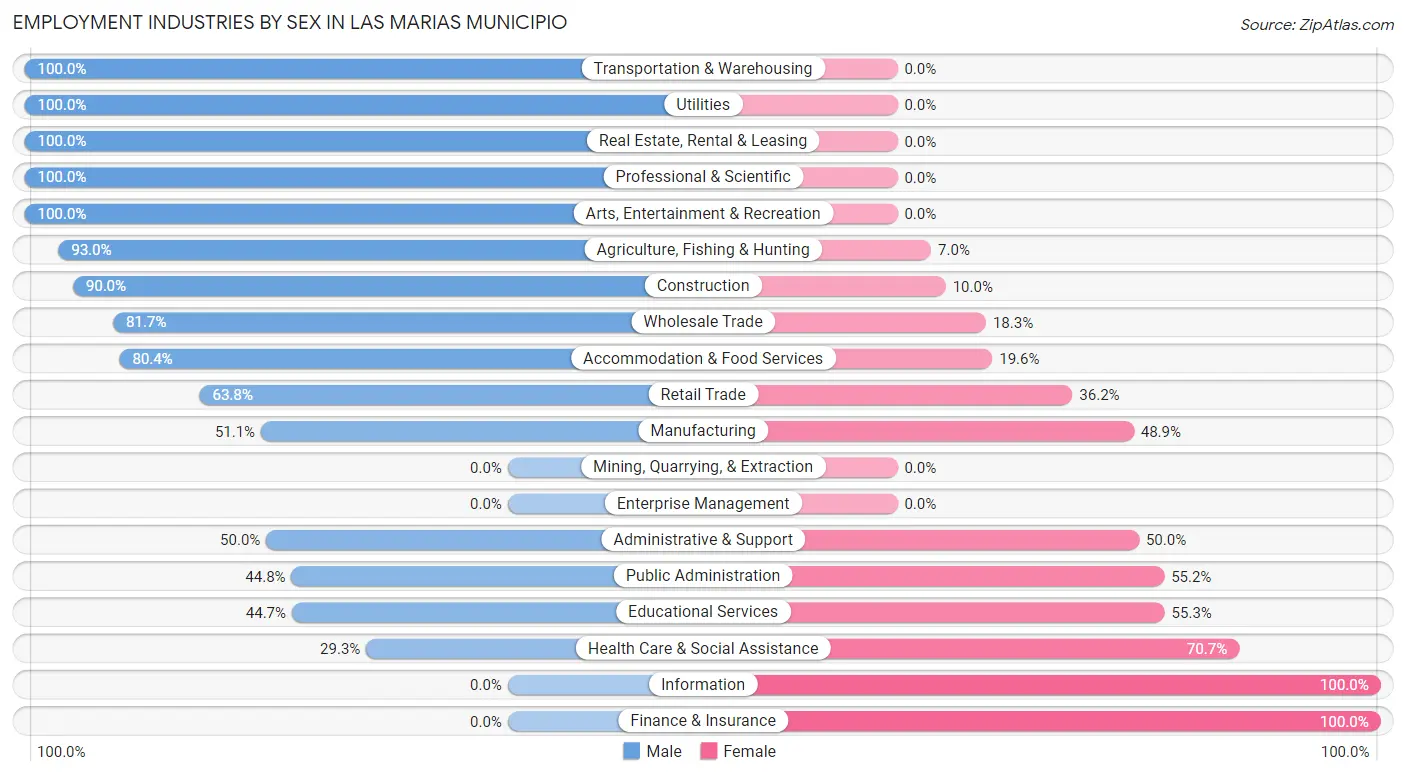
| Industry | Male | Female |
| Agriculture, Fishing & Hunting | 293 (93.0%) | 22 (7.0%) |
| Mining, Quarrying, & Extraction | 0 (0.0%) | 0 (0.0%) |
| Construction | 144 (90.0%) | 16 (10.0%) |
| Manufacturing | 71 (51.1%) | 68 (48.9%) |
| Wholesale Trade | 49 (81.7%) | 11 (18.3%) |
| Retail Trade | 81 (63.8%) | 46 (36.2%) |
| Transportation & Warehousing | 41 (100.0%) | 0 (0.0%) |
| Utilities | 24 (100.0%) | 0 (0.0%) |
| Information | 0 (0.0%) | 6 (100.0%) |
| Finance & Insurance | 0 (0.0%) | 54 (100.0%) |
| Real Estate, Rental & Leasing | 8 (100.0%) | 0 (0.0%) |
| Professional & Scientific | 26 (100.0%) | 0 (0.0%) |
| Enterprise Management | 0 (0.0%) | 0 (0.0%) |
| Administrative & Support | 29 (50.0%) | 29 (50.0%) |
| Educational Services | 147 (44.7%) | 182 (55.3%) |
| Health Care & Social Assistance | 126 (29.3%) | 304 (70.7%) |
| Arts, Entertainment & Recreation | 8 (100.0%) | 0 (0.0%) |
| Accommodation & Food Services | 45 (80.4%) | 11 (19.6%) |
| Public Administration | 176 (44.8%) | 217 (55.2%) |
| Total | 1,268 (56.0%) | 998 (44.0%) |
Education in Las Marias Municipio
School Enrollment in Las Marias Municipio
The most common levels of schooling among the 2,013 students in Las Marias Municipio are high school (542 | 26.9%), college / undergraduate (477 | 23.7%), and elementary school (434 | 21.6%).
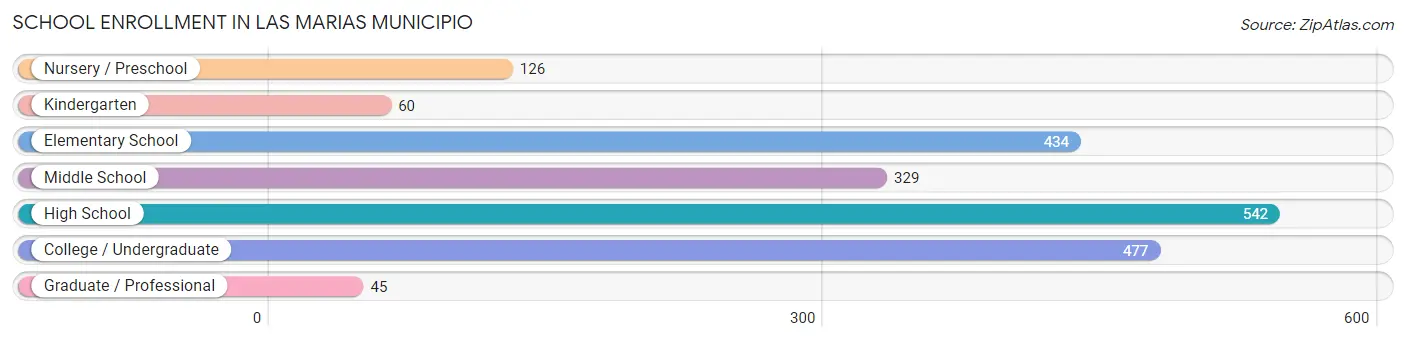
| School Level | # Students | % Students |
| Nursery / Preschool | 126 | 6.3% |
| Kindergarten | 60 | 3.0% |
| Elementary School | 434 | 21.6% |
| Middle School | 329 | 16.3% |
| High School | 542 | 26.9% |
| College / Undergraduate | 477 | 23.7% |
| Graduate / Professional | 45 | 2.2% |
| Total | 2,013 | 100.0% |
School Enrollment by Age by Funding Source in Las Marias Municipio
Out of a total of 2,013 students who are enrolled in schools in Las Marias Municipio, 431 (21.4%) attend a private institution, while the remaining 1,582 (78.6%) are enrolled in public schools. The age group of 35 years and over has the highest likelihood of being enrolled in private schools, with 53 (71.6% in the age bracket) enrolled. Conversely, the age group of 10 to 14 year olds has the lowest likelihood of being enrolled in a private school, with 543 (95.3% in the age bracket) attending a public institution.
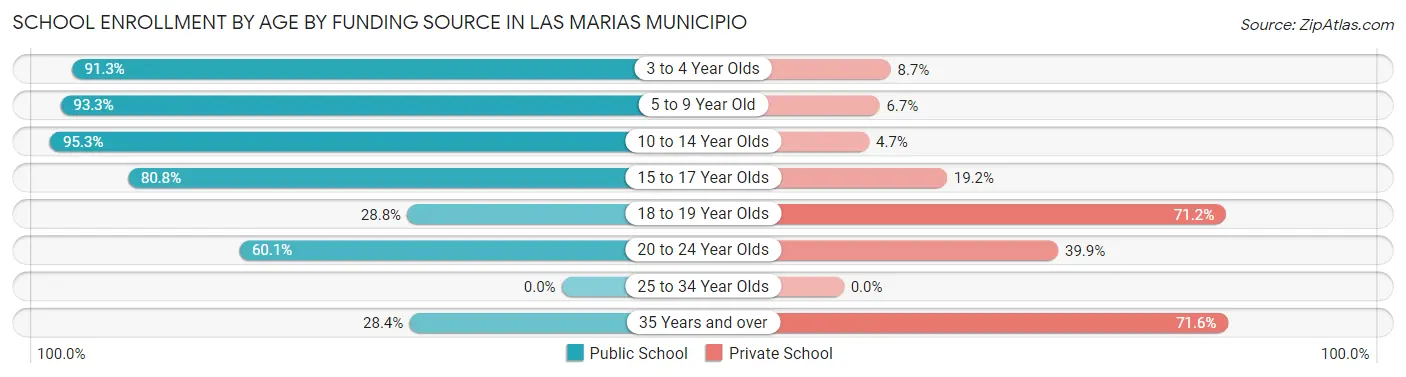
| Age Bracket | Public School | Private School |
| 3 to 4 Year Olds | 115 (91.3%) | 11 (8.7%) |
| 5 to 9 Year Old | 434 (93.3%) | 31 (6.7%) |
| 10 to 14 Year Olds | 543 (95.3%) | 27 (4.7%) |
| 15 to 17 Year Olds | 248 (80.8%) | 59 (19.2%) |
| 18 to 19 Year Olds | 57 (28.8%) | 141 (71.2%) |
| 20 to 24 Year Olds | 164 (60.1%) | 109 (39.9%) |
| 25 to 34 Year Olds | 0 (0.0%) | 0 (0.0%) |
| 35 Years and over | 21 (28.4%) | 53 (71.6%) |
| Total | 1,582 (78.6%) | 431 (21.4%) |
Educational Attainment by Field of Study in Las Marias Municipio
Education (451 | 40.9%), bio, nature & agricultural (146 | 13.3%), business (139 | 12.6%), science & technology (113 | 10.2%), and arts & humanities (98 | 8.9%) are the most common fields of study among 1,102 individuals in Las Marias Municipio who have obtained a bachelor's degree or higher.
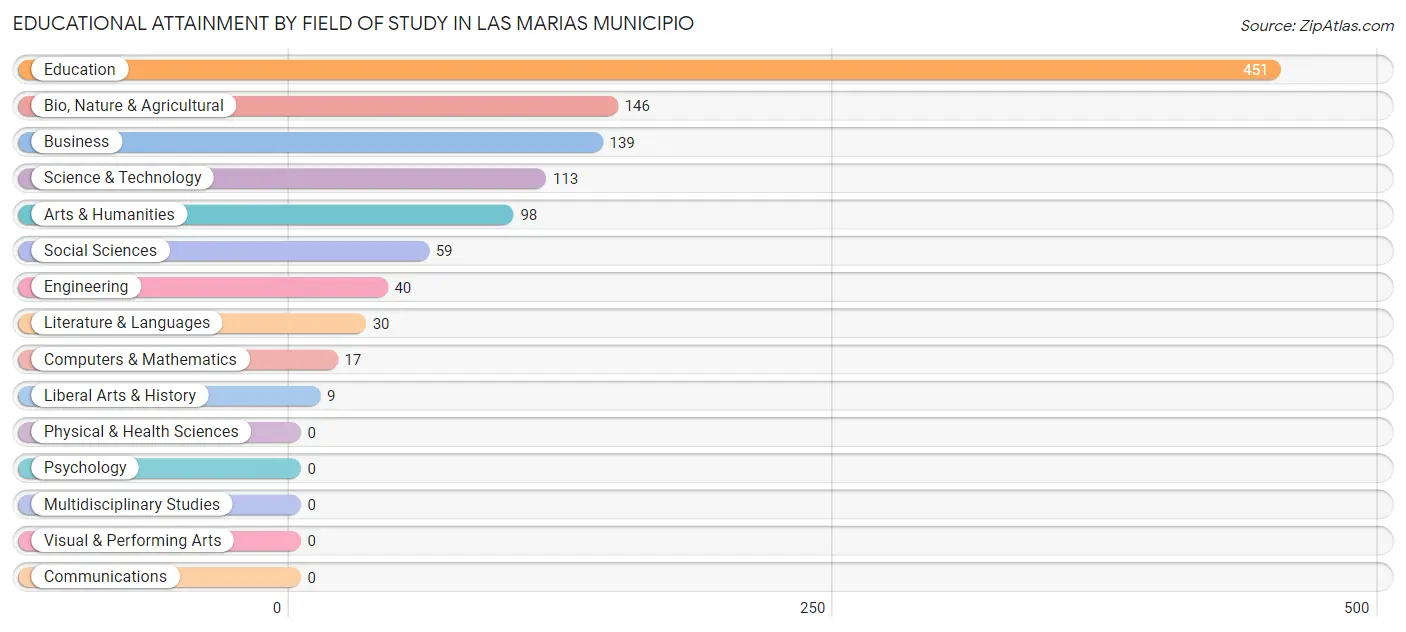
| Field of Study | # Graduates | % Graduates |
| Computers & Mathematics | 17 | 1.5% |
| Bio, Nature & Agricultural | 146 | 13.3% |
| Physical & Health Sciences | 0 | 0.0% |
| Psychology | 0 | 0.0% |
| Social Sciences | 59 | 5.3% |
| Engineering | 40 | 3.6% |
| Multidisciplinary Studies | 0 | 0.0% |
| Science & Technology | 113 | 10.2% |
| Business | 139 | 12.6% |
| Education | 451 | 40.9% |
| Literature & Languages | 30 | 2.7% |
| Liberal Arts & History | 9 | 0.8% |
| Visual & Performing Arts | 0 | 0.0% |
| Communications | 0 | 0.0% |
| Arts & Humanities | 98 | 8.9% |
| Total | 1,102 | 100.0% |
Transportation & Commute in Las Marias Municipio
Vehicle Availability by Sex in Las Marias Municipio
The most prevalent vehicle ownership categories in Las Marias Municipio are males with 2 vehicles (523, accounting for 41.4%) and females with 2 vehicles (391, making up 53.0%).
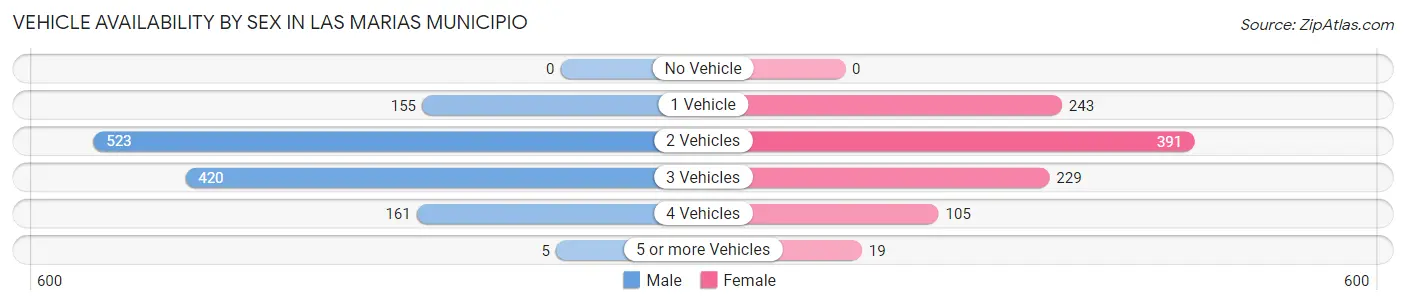
| Vehicles Available | Male | Female |
| No Vehicle | 0 (0.0%) | 0 (0.0%) |
| 1 Vehicle | 155 (12.3%) | 243 (24.6%) |
| 2 Vehicles | 523 (41.4%) | 391 (39.6%) |
| 3 Vehicles | 420 (33.2%) | 229 (23.2%) |
| 4 Vehicles | 161 (12.7%) | 105 (10.6%) |
| 5 or more Vehicles | 5 (0.4%) | 19 (1.9%) |
| Total | 1,264 (100.0%) | 987 (100.0%) |
Commute Time in Las Marias Municipio
The most frequently occuring commute durations in Las Marias Municipio are 20 to 24 minutes (590 commuters, 26.3%), 10 to 14 minutes (521 commuters, 23.3%), and 30 to 34 minutes (344 commuters, 15.4%).
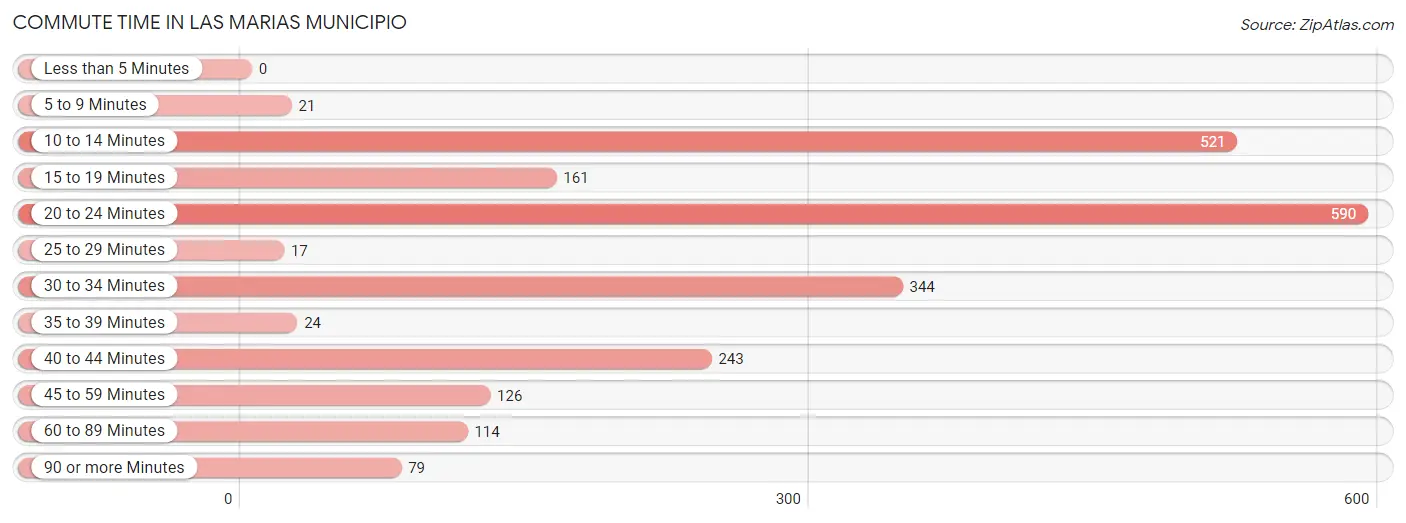
| Commute Time | # Commuters | % Commuters |
| Less than 5 Minutes | 0 | 0.0% |
| 5 to 9 Minutes | 21 | 0.9% |
| 10 to 14 Minutes | 521 | 23.3% |
| 15 to 19 Minutes | 161 | 7.2% |
| 20 to 24 Minutes | 590 | 26.3% |
| 25 to 29 Minutes | 17 | 0.8% |
| 30 to 34 Minutes | 344 | 15.4% |
| 35 to 39 Minutes | 24 | 1.1% |
| 40 to 44 Minutes | 243 | 10.8% |
| 45 to 59 Minutes | 126 | 5.6% |
| 60 to 89 Minutes | 114 | 5.1% |
| 90 or more Minutes | 79 | 3.5% |
Commute Time by Sex in Las Marias Municipio
The most common commute times in Las Marias Municipio are 10 to 14 minutes (351 commuters, 28.0%) for males and 20 to 24 minutes (298 commuters, 30.2%) for females.
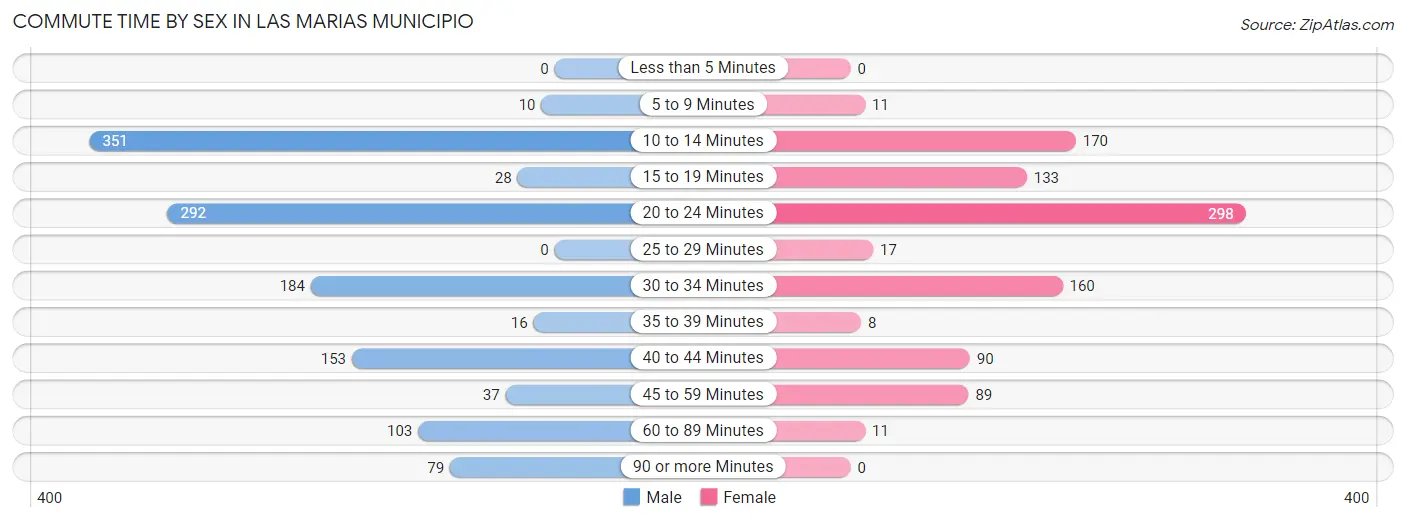
| Commute Time | Male | Female |
| Less than 5 Minutes | 0 (0.0%) | 0 (0.0%) |
| 5 to 9 Minutes | 10 (0.8%) | 11 (1.1%) |
| 10 to 14 Minutes | 351 (28.0%) | 170 (17.2%) |
| 15 to 19 Minutes | 28 (2.2%) | 133 (13.5%) |
| 20 to 24 Minutes | 292 (23.3%) | 298 (30.2%) |
| 25 to 29 Minutes | 0 (0.0%) | 17 (1.7%) |
| 30 to 34 Minutes | 184 (14.7%) | 160 (16.2%) |
| 35 to 39 Minutes | 16 (1.3%) | 8 (0.8%) |
| 40 to 44 Minutes | 153 (12.2%) | 90 (9.1%) |
| 45 to 59 Minutes | 37 (2.9%) | 89 (9.0%) |
| 60 to 89 Minutes | 103 (8.2%) | 11 (1.1%) |
| 90 or more Minutes | 79 (6.3%) | 0 (0.0%) |
Time of Departure to Work by Sex in Las Marias Municipio
The most frequent times of departure to work in Las Marias Municipio are 12:00 AM to 4:59 AM (275, 22.0%) for males and 7:00 AM to 7:29 AM (382, 38.7%) for females.
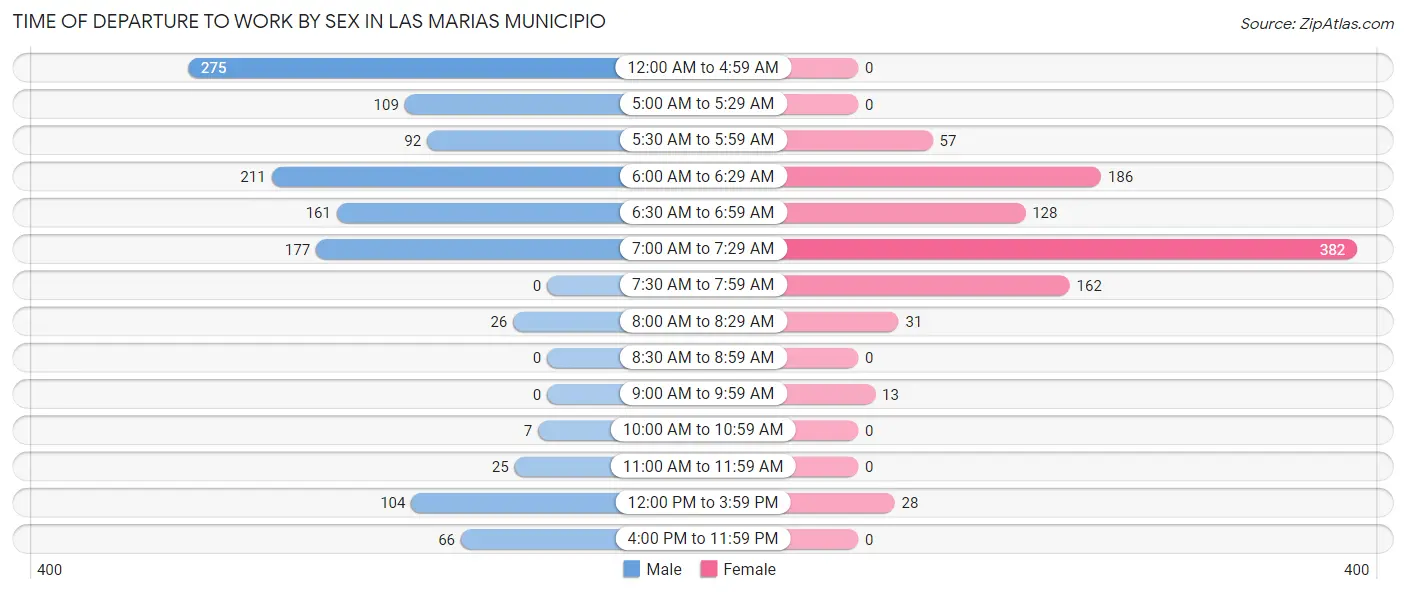
| Time of Departure | Male | Female |
| 12:00 AM to 4:59 AM | 275 (22.0%) | 0 (0.0%) |
| 5:00 AM to 5:29 AM | 109 (8.7%) | 0 (0.0%) |
| 5:30 AM to 5:59 AM | 92 (7.3%) | 57 (5.8%) |
| 6:00 AM to 6:29 AM | 211 (16.8%) | 186 (18.8%) |
| 6:30 AM to 6:59 AM | 161 (12.9%) | 128 (13.0%) |
| 7:00 AM to 7:29 AM | 177 (14.1%) | 382 (38.7%) |
| 7:30 AM to 7:59 AM | 0 (0.0%) | 162 (16.4%) |
| 8:00 AM to 8:29 AM | 26 (2.1%) | 31 (3.1%) |
| 8:30 AM to 8:59 AM | 0 (0.0%) | 0 (0.0%) |
| 9:00 AM to 9:59 AM | 0 (0.0%) | 13 (1.3%) |
| 10:00 AM to 10:59 AM | 7 (0.6%) | 0 (0.0%) |
| 11:00 AM to 11:59 AM | 25 (2.0%) | 0 (0.0%) |
| 12:00 PM to 3:59 PM | 104 (8.3%) | 28 (2.8%) |
| 4:00 PM to 11:59 PM | 66 (5.3%) | 0 (0.0%) |
| Total | 1,253 (100.0%) | 987 (100.0%) |
Housing Occupancy in Las Marias Municipio
Occupancy by Ownership in Las Marias Municipio
Of the total 2,722 dwellings in Las Marias Municipio, owner-occupied units account for 2,023 (74.3%), while renter-occupied units make up 699 (25.7%).
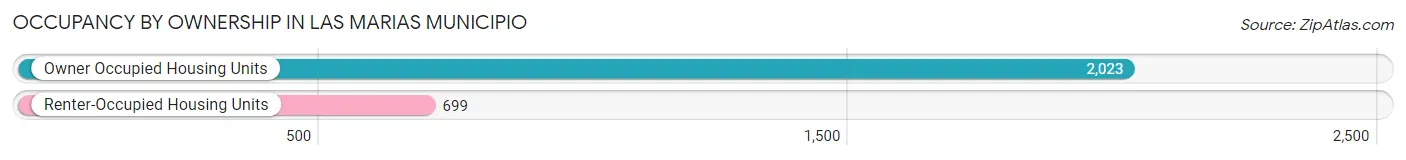
| Occupancy | # Housing Units | % Housing Units |
| Owner Occupied Housing Units | 2,023 | 74.3% |
| Renter-Occupied Housing Units | 699 | 25.7% |
| Total Occupied Housing Units | 2,722 | 100.0% |
Occupancy by Household Size in Las Marias Municipio
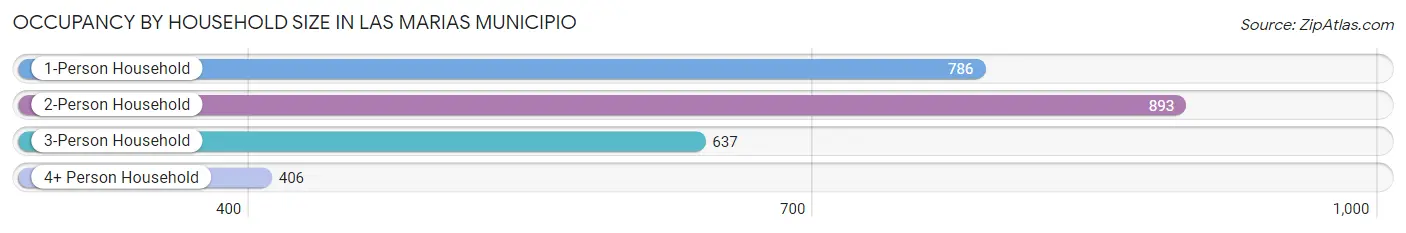
| Household Size | # Housing Units | % Housing Units |
| 1-Person Household | 786 | 28.9% |
| 2-Person Household | 893 | 32.8% |
| 3-Person Household | 637 | 23.4% |
| 4+ Person Household | 406 | 14.9% |
| Total Housing Units | 2,722 | 100.0% |
Occupancy by Ownership by Household Size in Las Marias Municipio
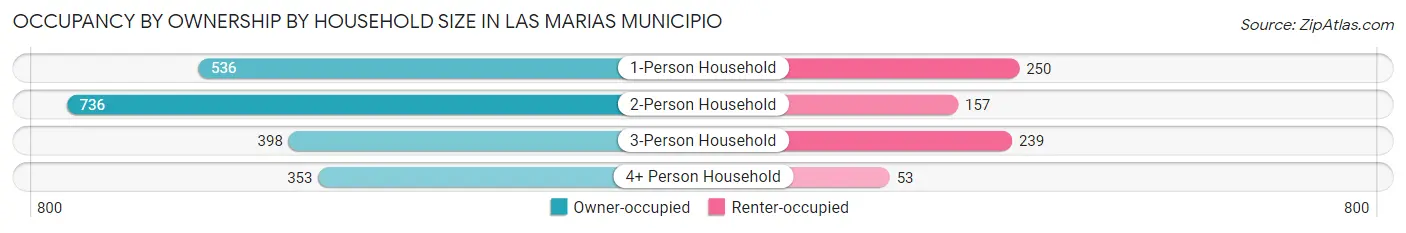
| Household Size | Owner-occupied | Renter-occupied |
| 1-Person Household | 536 (68.2%) | 250 (31.8%) |
| 2-Person Household | 736 (82.4%) | 157 (17.6%) |
| 3-Person Household | 398 (62.5%) | 239 (37.5%) |
| 4+ Person Household | 353 (87.0%) | 53 (13.1%) |
| Total Housing Units | 2,023 (74.3%) | 699 (25.7%) |
Occupancy by Educational Attainment in Las Marias Municipio
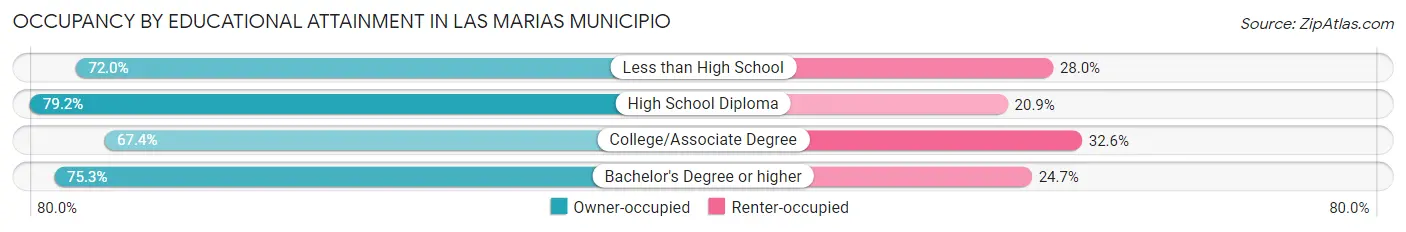
| Household Size | Owner-occupied | Renter-occupied |
| Less than High School | 734 (72.0%) | 286 (28.0%) |
| High School Diploma | 672 (79.1%) | 177 (20.8%) |
| College/Associate Degree | 217 (67.4%) | 105 (32.6%) |
| Bachelor's Degree or higher | 400 (75.3%) | 131 (24.7%) |
Occupancy by Age of Householder in Las Marias Municipio
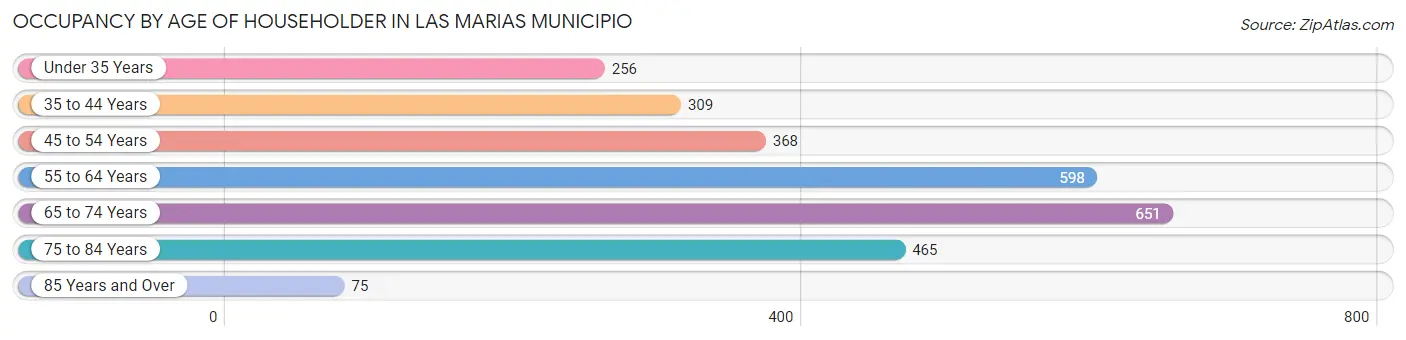
| Age Bracket | # Households | % Households |
| Under 35 Years | 256 | 9.4% |
| 35 to 44 Years | 309 | 11.4% |
| 45 to 54 Years | 368 | 13.5% |
| 55 to 64 Years | 598 | 22.0% |
| 65 to 74 Years | 651 | 23.9% |
| 75 to 84 Years | 465 | 17.1% |
| 85 Years and Over | 75 | 2.8% |
| Total | 2,722 | 100.0% |
Housing Finances in Las Marias Municipio
Median Income by Occupancy in Las Marias Municipio
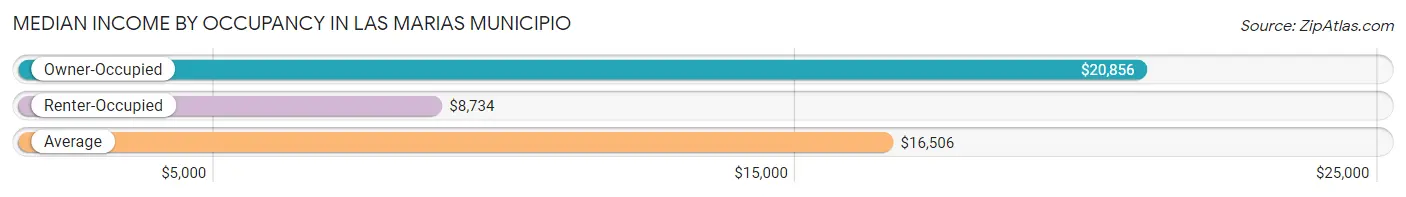
| Occupancy Type | # Households | Median Income |
| Owner-Occupied | 2,023 (74.3%) | $20,856 |
| Renter-Occupied | 699 (25.7%) | $8,734 |
| Average | 2,722 (100.0%) | $16,506 |
Occupancy by Householder Income Bracket in Las Marias Municipio
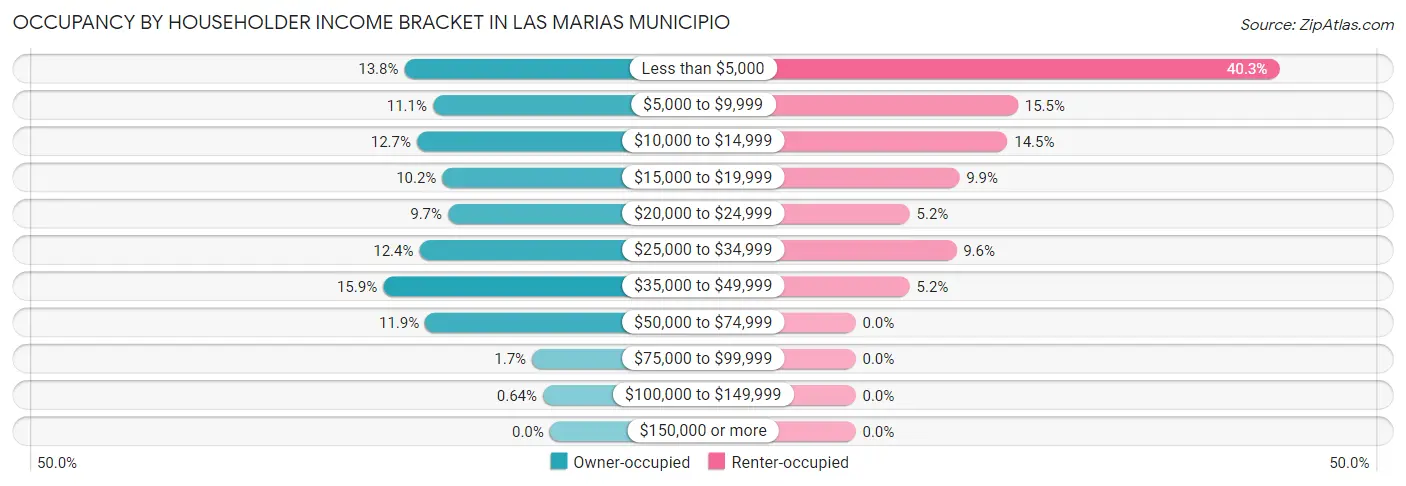
| Income Bracket | Owner-occupied | Renter-occupied |
| Less than $5,000 | 280 (13.8%) | 282 (40.3%) |
| $5,000 to $9,999 | 225 (11.1%) | 108 (15.4%) |
| $10,000 to $14,999 | 256 (12.7%) | 101 (14.4%) |
| $15,000 to $19,999 | 207 (10.2%) | 69 (9.9%) |
| $20,000 to $24,999 | 196 (9.7%) | 36 (5.1%) |
| $25,000 to $34,999 | 251 (12.4%) | 67 (9.6%) |
| $35,000 to $49,999 | 321 (15.9%) | 36 (5.1%) |
| $50,000 to $74,999 | 240 (11.9%) | 0 (0.0%) |
| $75,000 to $99,999 | 34 (1.7%) | 0 (0.0%) |
| $100,000 to $149,999 | 13 (0.6%) | 0 (0.0%) |
| $150,000 or more | 0 (0.0%) | 0 (0.0%) |
| Total | 2,023 (100.0%) | 699 (100.0%) |
Monthly Housing Cost Tiers in Las Marias Municipio
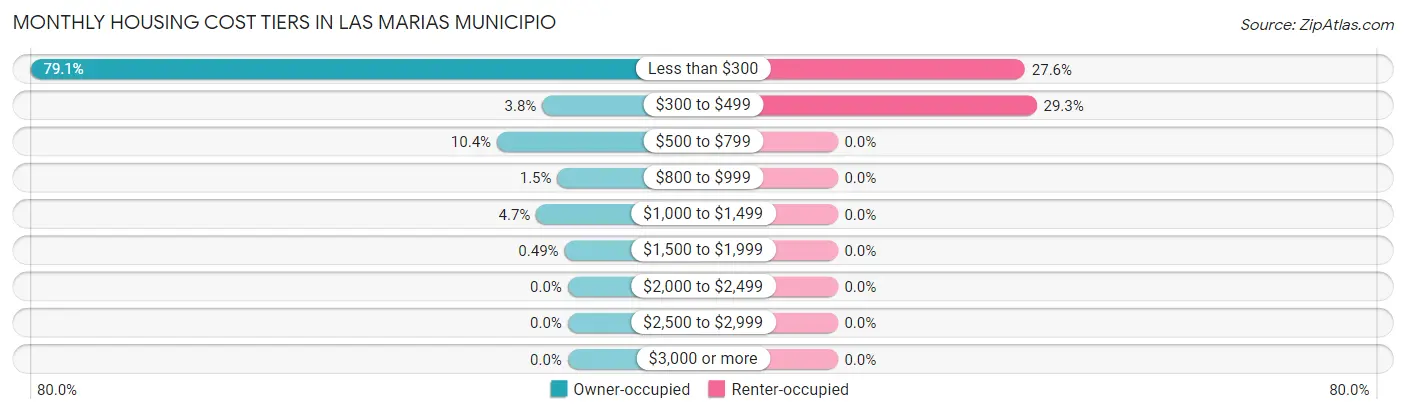
| Monthly Cost | Owner-occupied | Renter-occupied |
| Less than $300 | 1,601 (79.1%) | 193 (27.6%) |
| $300 to $499 | 76 (3.8%) | 205 (29.3%) |
| $500 to $799 | 211 (10.4%) | 0 (0.0%) |
| $800 to $999 | 31 (1.5%) | 0 (0.0%) |
| $1,000 to $1,499 | 94 (4.6%) | 0 (0.0%) |
| $1,500 to $1,999 | 10 (0.5%) | 0 (0.0%) |
| $2,000 to $2,499 | 0 (0.0%) | 0 (0.0%) |
| $2,500 to $2,999 | 0 (0.0%) | 0 (0.0%) |
| $3,000 or more | 0 (0.0%) | 0 (0.0%) |
| Total | 2,023 (100.0%) | 699 (100.0%) |
Physical Housing Characteristics in Las Marias Municipio
Housing Structures in Las Marias Municipio
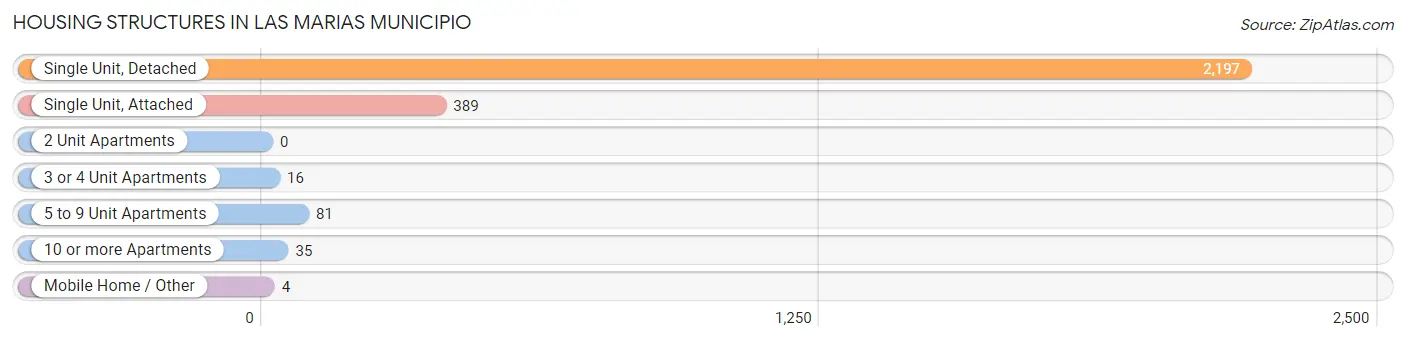
| Structure Type | # Housing Units | % Housing Units |
| Single Unit, Detached | 2,197 | 80.7% |
| Single Unit, Attached | 389 | 14.3% |
| 2 Unit Apartments | 0 | 0.0% |
| 3 or 4 Unit Apartments | 16 | 0.6% |
| 5 to 9 Unit Apartments | 81 | 3.0% |
| 10 or more Apartments | 35 | 1.3% |
| Mobile Home / Other | 4 | 0.2% |
| Total | 2,722 | 100.0% |
Housing Structures by Occupancy in Las Marias Municipio
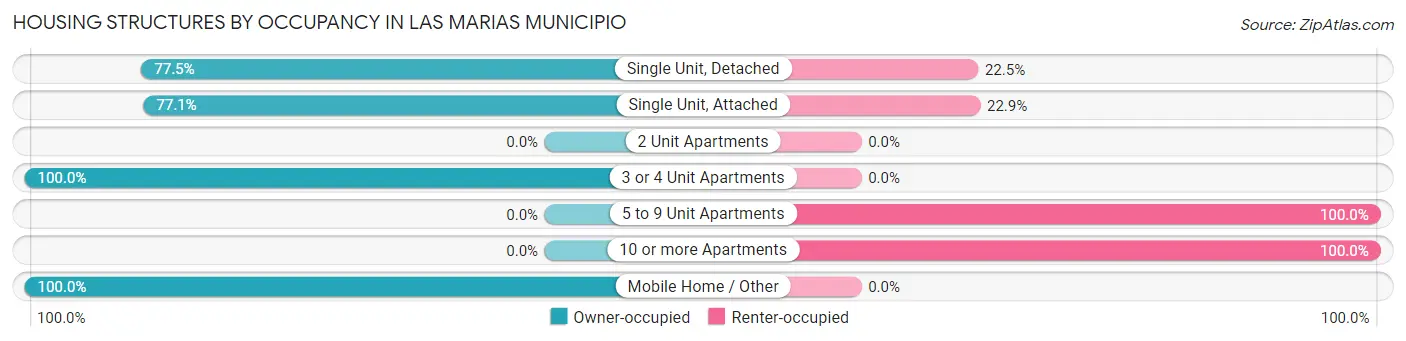
| Structure Type | Owner-occupied | Renter-occupied |
| Single Unit, Detached | 1,703 (77.5%) | 494 (22.5%) |
| Single Unit, Attached | 300 (77.1%) | 89 (22.9%) |
| 2 Unit Apartments | 0 (0.0%) | 0 (0.0%) |
| 3 or 4 Unit Apartments | 16 (100.0%) | 0 (0.0%) |
| 5 to 9 Unit Apartments | 0 (0.0%) | 81 (100.0%) |
| 10 or more Apartments | 0 (0.0%) | 35 (100.0%) |
| Mobile Home / Other | 4 (100.0%) | 0 (0.0%) |
| Total | 2,023 (74.3%) | 699 (25.7%) |
Housing Structures by Number of Rooms in Las Marias Municipio
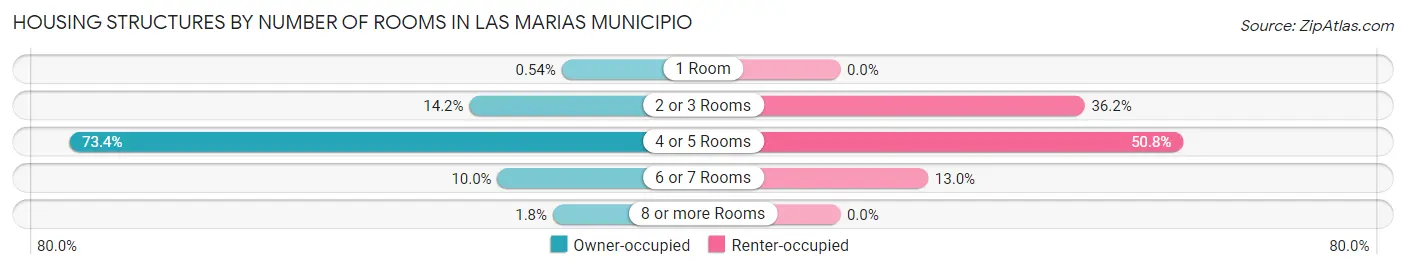
| Number of Rooms | Owner-occupied | Renter-occupied |
| 1 Room | 11 (0.5%) | 0 (0.0%) |
| 2 or 3 Rooms | 287 (14.2%) | 253 (36.2%) |
| 4 or 5 Rooms | 1,485 (73.4%) | 355 (50.8%) |
| 6 or 7 Rooms | 203 (10.0%) | 91 (13.0%) |
| 8 or more Rooms | 37 (1.8%) | 0 (0.0%) |
| Total | 2,023 (100.0%) | 699 (100.0%) |
Housing Structure by Heating Type in Las Marias Municipio
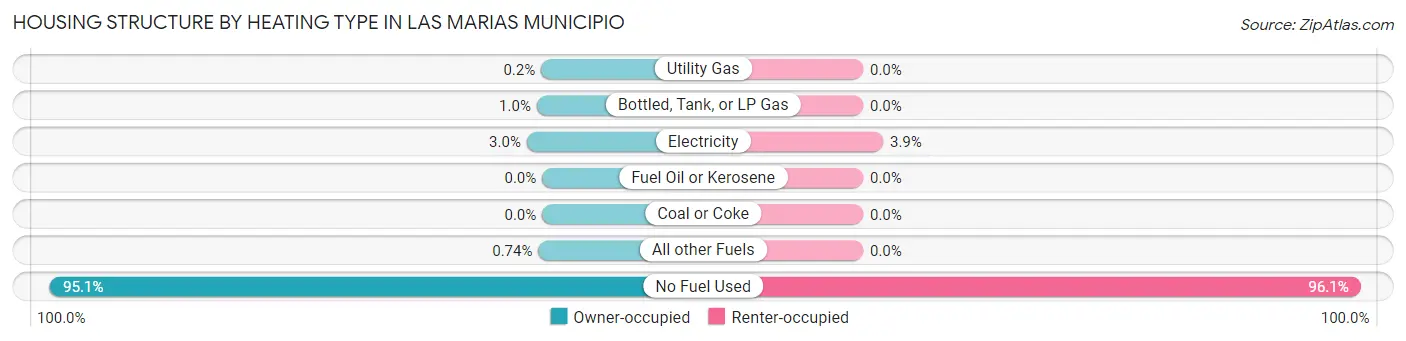
| Heating Type | Owner-occupied | Renter-occupied |
| Utility Gas | 4 (0.2%) | 0 (0.0%) |
| Bottled, Tank, or LP Gas | 21 (1.0%) | 0 (0.0%) |
| Electricity | 60 (3.0%) | 27 (3.9%) |
| Fuel Oil or Kerosene | 0 (0.0%) | 0 (0.0%) |
| Coal or Coke | 0 (0.0%) | 0 (0.0%) |
| All other Fuels | 15 (0.7%) | 0 (0.0%) |
| No Fuel Used | 1,923 (95.1%) | 672 (96.1%) |
| Total | 2,023 (100.0%) | 699 (100.0%) |
Household Vehicle Usage in Las Marias Municipio
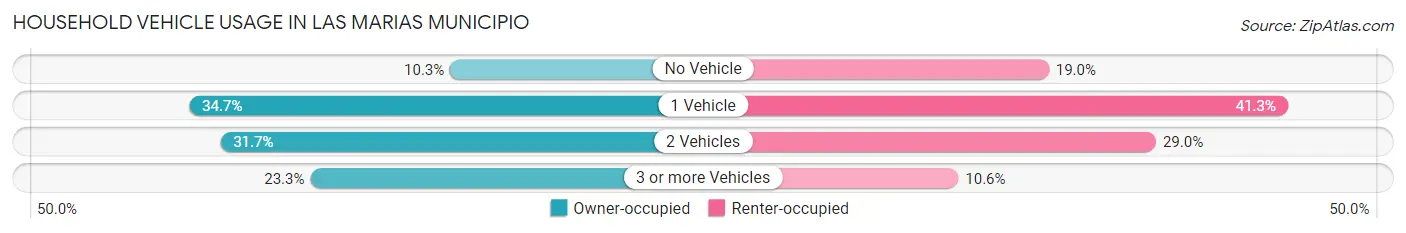
| Vehicles per Household | Owner-occupied | Renter-occupied |
| No Vehicle | 208 (10.3%) | 133 (19.0%) |
| 1 Vehicle | 701 (34.6%) | 289 (41.3%) |
| 2 Vehicles | 642 (31.7%) | 203 (29.0%) |
| 3 or more Vehicles | 472 (23.3%) | 74 (10.6%) |
| Total | 2,023 (100.0%) | 699 (100.0%) |
Real Estate & Mortgages in Las Marias Municipio
Real Estate and Mortgage Overview in Las Marias Municipio
| Characteristic | Without Mortgage | With Mortgage |
| Housing Units | 1,616 | 407 |
| Median Property Value | $88,600 | $117,300 |
| Median Household Income | $18,026 | $0 |
| Monthly Housing Costs | $110 | $0 |
| Real Estate Taxes | $200 | $367 |
Property Value by Mortgage Status in Las Marias Municipio
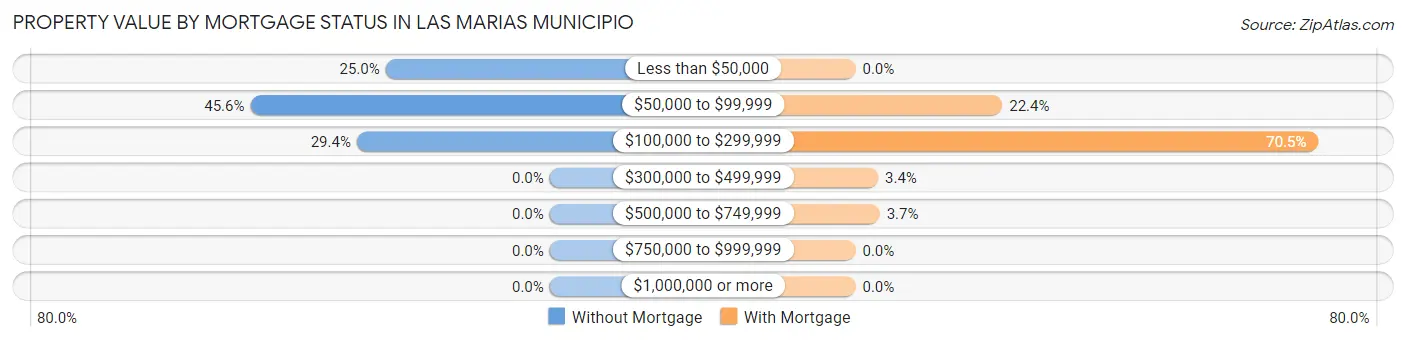
| Property Value | Without Mortgage | With Mortgage |
| Less than $50,000 | 404 (25.0%) | 0 (0.0%) |
| $50,000 to $99,999 | 737 (45.6%) | 91 (22.4%) |
| $100,000 to $299,999 | 475 (29.4%) | 287 (70.5%) |
| $300,000 to $499,999 | 0 (0.0%) | 14 (3.4%) |
| $500,000 to $749,999 | 0 (0.0%) | 15 (3.7%) |
| $750,000 to $999,999 | 0 (0.0%) | 0 (0.0%) |
| $1,000,000 or more | 0 (0.0%) | 0 (0.0%) |
| Total | 1,616 (100.0%) | 407 (100.0%) |
Household Income by Mortgage Status in Las Marias Municipio
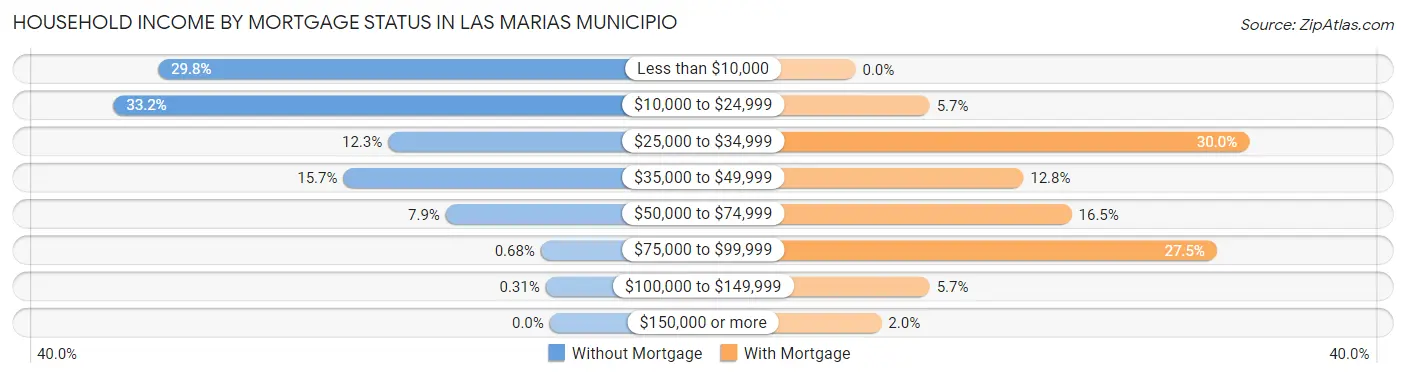
| Household Income | Without Mortgage | With Mortgage |
| Less than $10,000 | 482 (29.8%) | 0 (0.0%) |
| $10,000 to $24,999 | 537 (33.2%) | 23 (5.7%) |
| $25,000 to $34,999 | 199 (12.3%) | 122 (30.0%) |
| $35,000 to $49,999 | 254 (15.7%) | 52 (12.8%) |
| $50,000 to $74,999 | 128 (7.9%) | 67 (16.5%) |
| $75,000 to $99,999 | 11 (0.7%) | 112 (27.5%) |
| $100,000 to $149,999 | 5 (0.3%) | 23 (5.7%) |
| $150,000 or more | 0 (0.0%) | 8 (2.0%) |
| Total | 1,616 (100.0%) | 407 (100.0%) |
Property Value to Household Income Ratio in Las Marias Municipio
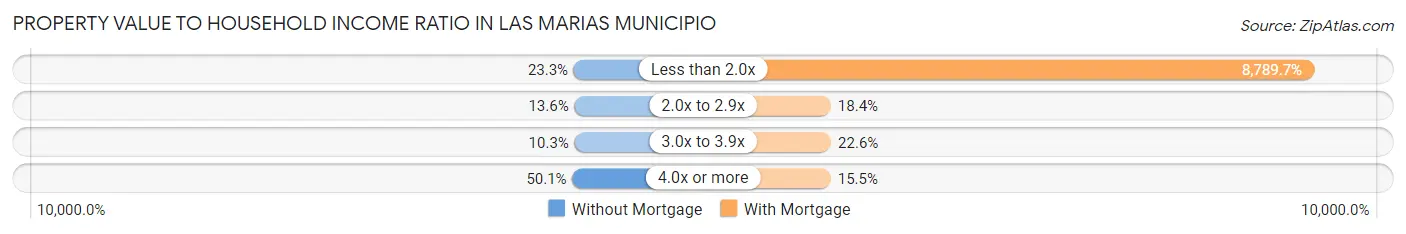
| Value-to-Income Ratio | Without Mortgage | With Mortgage |
| Less than 2.0x | 376 (23.3%) | 35,774 (8,789.7%) |
| 2.0x to 2.9x | 220 (13.6%) | 75 (18.4%) |
| 3.0x to 3.9x | 167 (10.3%) | 92 (22.6%) |
| 4.0x or more | 809 (50.1%) | 63 (15.5%) |
| Total | 1,616 (100.0%) | 407 (100.0%) |
Real Estate Taxes by Mortgage Status in Las Marias Municipio
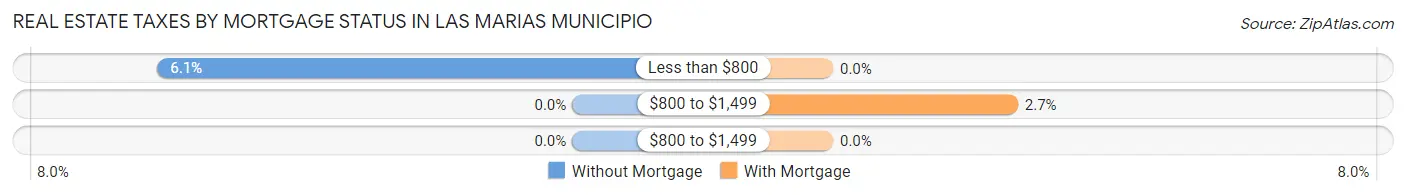
| Property Taxes | Without Mortgage | With Mortgage |
| Less than $800 | 98 (6.1%) | 0 (0.0%) |
| $800 to $1,499 | 0 (0.0%) | 11 (2.7%) |
| $800 to $1,499 | 0 (0.0%) | 0 (0.0%) |
| Total | 1,616 (100.0%) | 407 (100.0%) |
Health & Disability in Las Marias Municipio
Health Insurance Coverage by Age in Las Marias Municipio
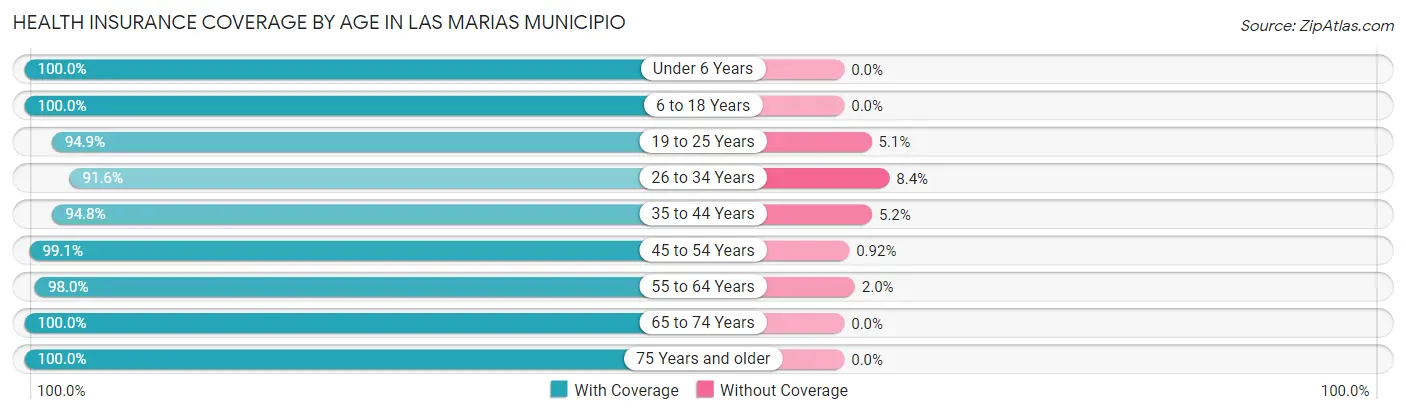
| Age Bracket | With Coverage | Without Coverage |
| Under 6 Years | 366 (100.0%) | 0 (0.0%) |
| 6 to 18 Years | 1,433 (100.0%) | 0 (0.0%) |
| 19 to 25 Years | 896 (94.9%) | 48 (5.1%) |
| 26 to 34 Years | 731 (91.6%) | 67 (8.4%) |
| 35 to 44 Years | 953 (94.8%) | 52 (5.2%) |
| 45 to 54 Years | 1,074 (99.1%) | 10 (0.9%) |
| 55 to 64 Years | 1,202 (98.0%) | 24 (2.0%) |
| 65 to 74 Years | 1,060 (100.0%) | 0 (0.0%) |
| 75 Years and older | 836 (100.0%) | 0 (0.0%) |
| Total | 8,551 (97.7%) | 201 (2.3%) |
Health Insurance Coverage by Citizenship Status in Las Marias Municipio
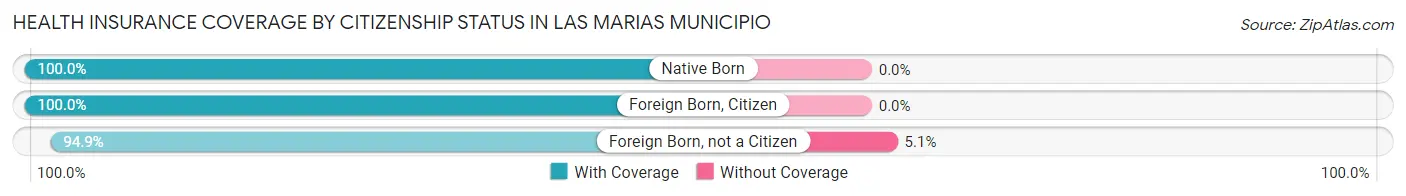
| Citizenship Status | With Coverage | Without Coverage |
| Native Born | 366 (100.0%) | 0 (0.0%) |
| Foreign Born, Citizen | 1,433 (100.0%) | 0 (0.0%) |
| Foreign Born, not a Citizen | 896 (94.9%) | 48 (5.1%) |
Health Insurance Coverage by Household Income in Las Marias Municipio
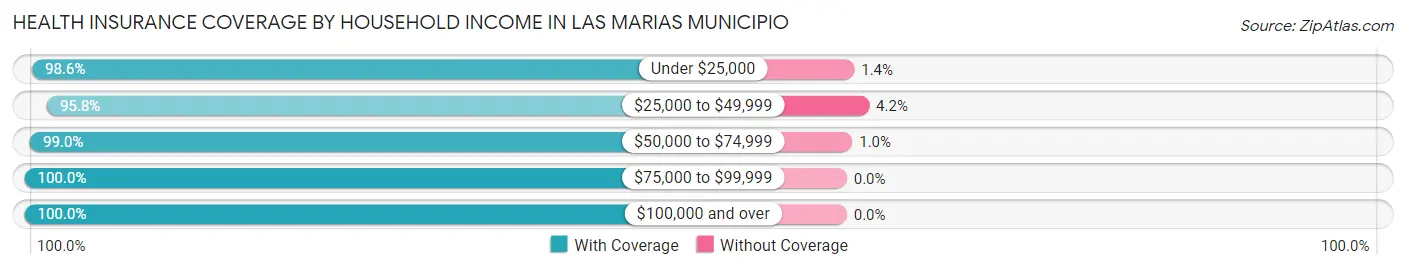
| Household Income | With Coverage | Without Coverage |
| Under $25,000 | 4,645 (98.6%) | 66 (1.4%) |
| $25,000 to $49,999 | 2,724 (95.8%) | 119 (4.2%) |
| $50,000 to $74,999 | 1,062 (99.0%) | 11 (1.0%) |
| $75,000 to $99,999 | 83 (100.0%) | 0 (0.0%) |
| $100,000 and over | 27 (100.0%) | 0 (0.0%) |
Public vs Private Health Insurance Coverage by Age in Las Marias Municipio
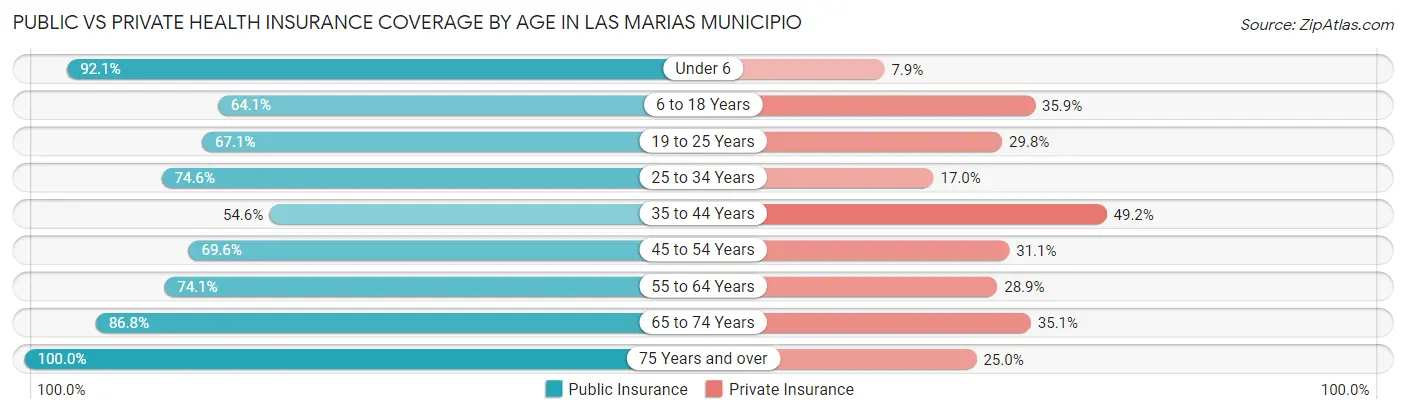
| Age Bracket | Public Insurance | Private Insurance |
| Under 6 | 337 (92.1%) | 29 (7.9%) |
| 6 to 18 Years | 919 (64.1%) | 514 (35.9%) |
| 19 to 25 Years | 633 (67.1%) | 281 (29.8%) |
| 25 to 34 Years | 595 (74.6%) | 136 (17.0%) |
| 35 to 44 Years | 549 (54.6%) | 494 (49.1%) |
| 45 to 54 Years | 754 (69.6%) | 337 (31.1%) |
| 55 to 64 Years | 908 (74.1%) | 354 (28.9%) |
| 65 to 74 Years | 920 (86.8%) | 372 (35.1%) |
| 75 Years and over | 836 (100.0%) | 209 (25.0%) |
| Total | 6,451 (73.7%) | 2,726 (31.1%) |
Disability Status by Sex by Age in Las Marias Municipio
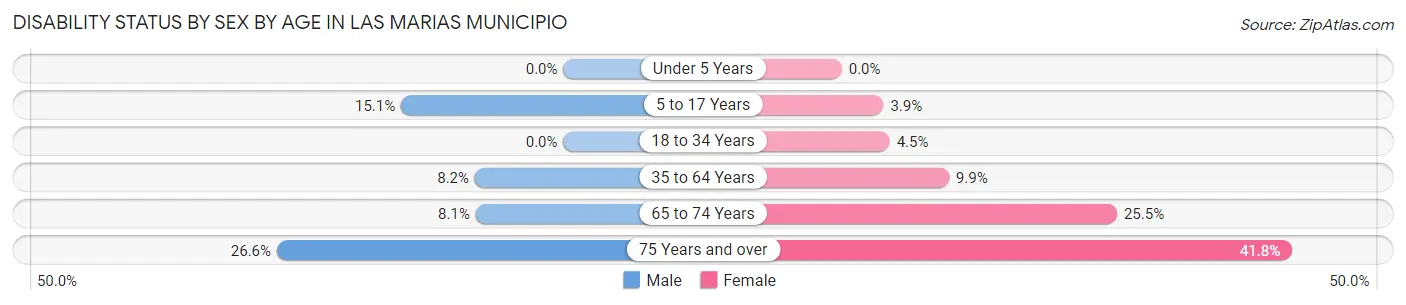
| Age Bracket | Male | Female |
| Under 5 Years | 0 (0.0%) | 0 (0.0%) |
| 5 to 17 Years | 103 (15.1%) | 26 (3.9%) |
| 18 to 34 Years | 0 (0.0%) | 41 (4.4%) |
| 35 to 64 Years | 135 (8.2%) | 166 (9.9%) |
| 65 to 74 Years | 41 (8.1%) | 142 (25.5%) |
| 75 Years and over | 109 (26.6%) | 178 (41.8%) |
Disability Class by Sex by Age in Las Marias Municipio
Disability Class: Hearing Difficulty
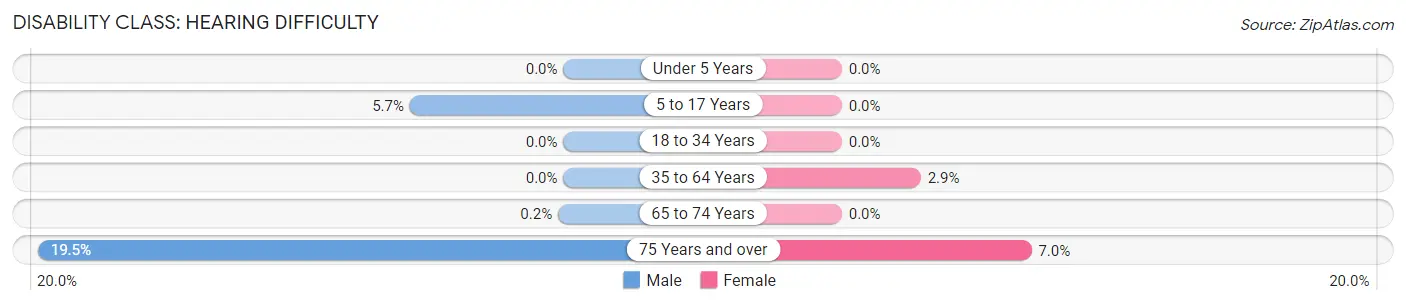
| Age Bracket | Male | Female |
| Under 5 Years | 0 (0.0%) | 0 (0.0%) |
| 5 to 17 Years | 39 (5.7%) | 0 (0.0%) |
| 18 to 34 Years | 0 (0.0%) | 0 (0.0%) |
| 35 to 64 Years | 0 (0.0%) | 49 (2.9%) |
| 65 to 74 Years | 1 (0.2%) | 0 (0.0%) |
| 75 Years and over | 80 (19.5%) | 30 (7.0%) |
Disability Class: Vision Difficulty
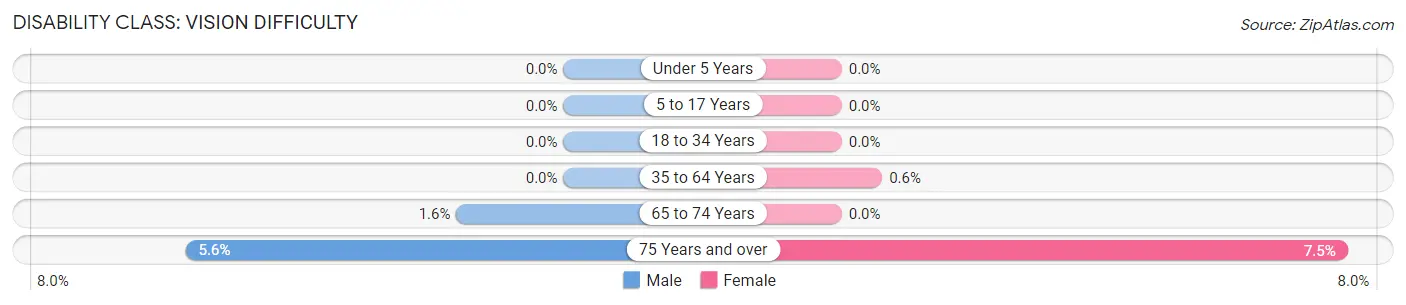
| Age Bracket | Male | Female |
| Under 5 Years | 0 (0.0%) | 0 (0.0%) |
| 5 to 17 Years | 0 (0.0%) | 0 (0.0%) |
| 18 to 34 Years | 0 (0.0%) | 0 (0.0%) |
| 35 to 64 Years | 0 (0.0%) | 10 (0.6%) |
| 65 to 74 Years | 8 (1.6%) | 0 (0.0%) |
| 75 Years and over | 23 (5.6%) | 32 (7.5%) |
Disability Class: Cognitive Difficulty
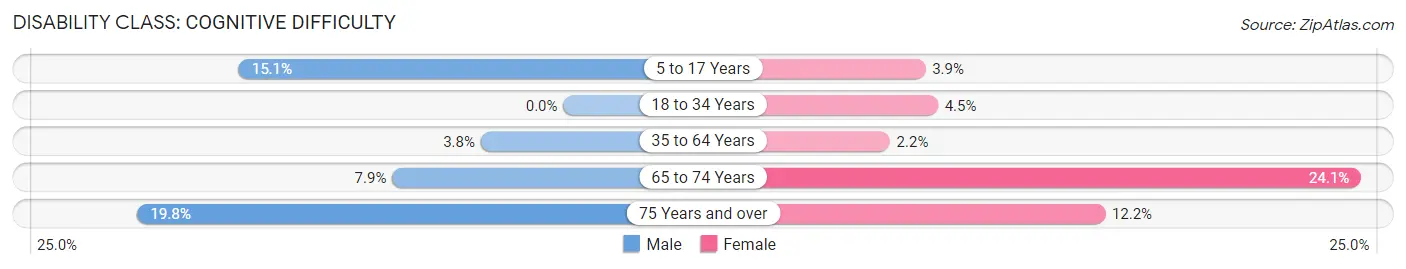
| Age Bracket | Male | Female |
| 5 to 17 Years | 103 (15.1%) | 26 (3.9%) |
| 18 to 34 Years | 0 (0.0%) | 41 (4.4%) |
| 35 to 64 Years | 63 (3.8%) | 37 (2.2%) |
| 65 to 74 Years | 40 (7.9%) | 134 (24.1%) |
| 75 Years and over | 81 (19.8%) | 52 (12.2%) |
Disability Class: Ambulatory Difficulty
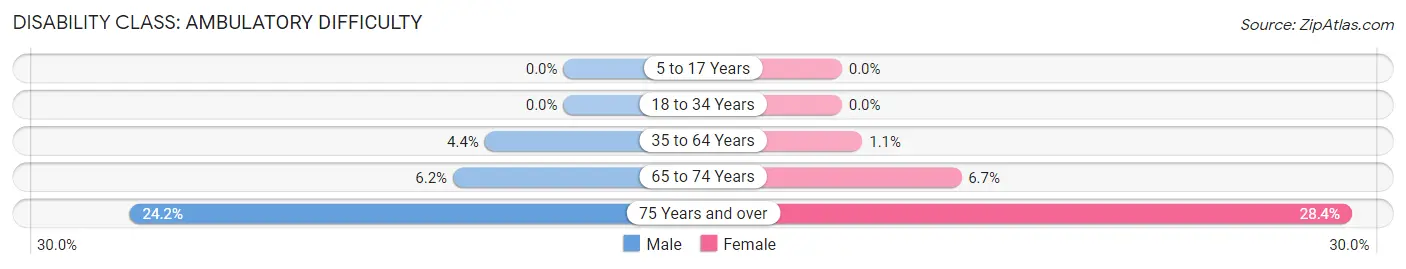
| Age Bracket | Male | Female |
| 5 to 17 Years | 0 (0.0%) | 0 (0.0%) |
| 18 to 34 Years | 0 (0.0%) | 0 (0.0%) |
| 35 to 64 Years | 72 (4.4%) | 19 (1.1%) |
| 65 to 74 Years | 31 (6.1%) | 37 (6.7%) |
| 75 Years and over | 99 (24.1%) | 121 (28.4%) |
Disability Class: Self-Care Difficulty
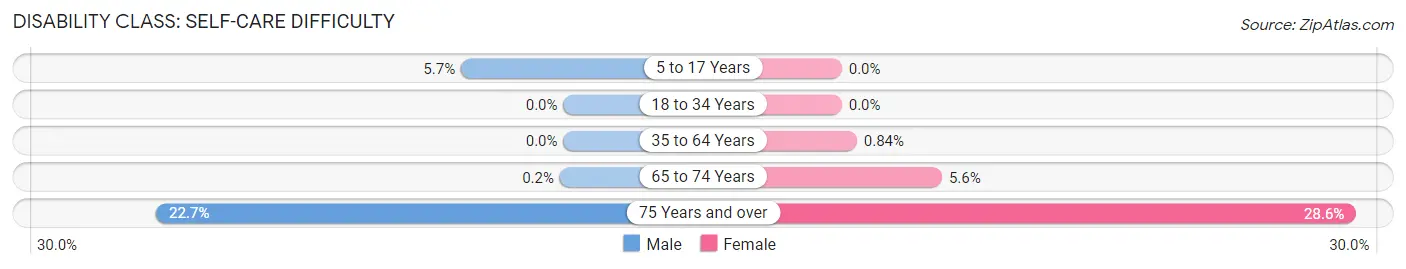
| Age Bracket | Male | Female |
| 5 to 17 Years | 39 (5.7%) | 0 (0.0%) |
| 18 to 34 Years | 0 (0.0%) | 0 (0.0%) |
| 35 to 64 Years | 0 (0.0%) | 14 (0.8%) |
| 65 to 74 Years | 1 (0.2%) | 31 (5.6%) |
| 75 Years and over | 93 (22.7%) | 122 (28.6%) |
Technology Access in Las Marias Municipio
Computing Device Access in Las Marias Municipio
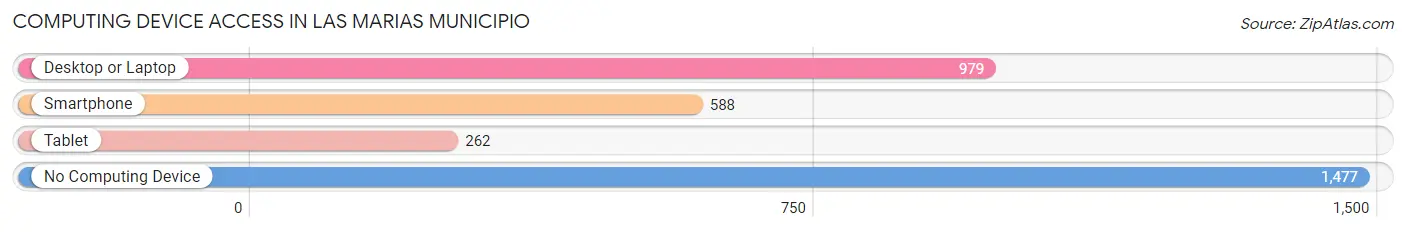
| Device Type | # Households | % Households |
| Desktop or Laptop | 979 | 36.0% |
| Smartphone | 588 | 21.6% |
| Tablet | 262 | 9.6% |
| No Computing Device | 1,477 | 54.3% |
| Total | 2,722 | 100.0% |
Internet Access in Las Marias Municipio
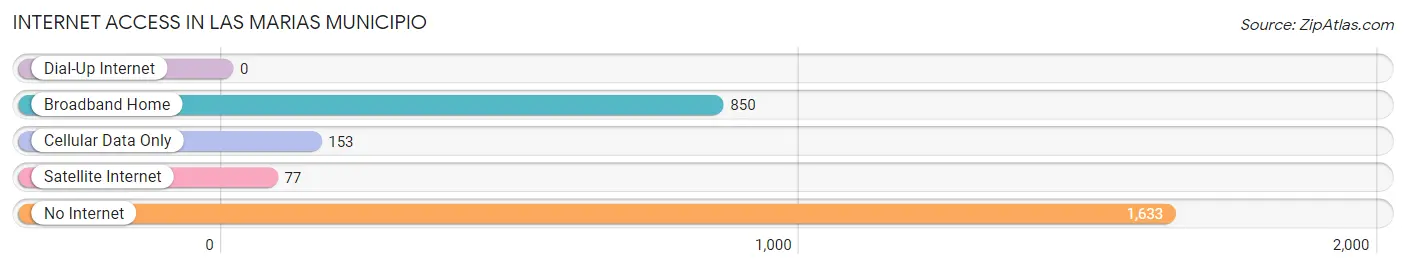
| Internet Type | # Households | % Households |
| Dial-Up Internet | 0 | 0.0% |
| Broadband Home | 850 | 31.2% |
| Cellular Data Only | 153 | 5.6% |
| Satellite Internet | 77 | 2.8% |
| No Internet | 1,633 | 60.0% |
| Total | 2,722 | 100.0% |
Las Marias Municipio Summary
Marías Municipio is a municipality located in the northwest region of Puerto Rico. It is part of the San Juan-Caguas-Guaynabo Metropolitan Statistical Area. The municipality is located in the northern part of the island, bordering the municipalities of San Sebastián, Las Piedras, and Canóvanas. As of the 2010 census, the population of Marías was 24,845.
Geography
Marías Municipio is located in the northern part of Puerto Rico, bordering the municipalities of San Sebastián, Las Piedras, and Canóvanas. The municipality is located in the San Juan-Caguas-Guaynabo Metropolitan Statistical Area. The municipality is divided into five barrios: Coto Norte, Coto Sur, Marías, Palmarejo, and Río Cañas. The total area of the municipality is 39.3 square miles (101.8 km2).
History
Marías Municipio was founded in 1813. The municipality was named after the Marías River, which runs through the area. The area was originally inhabited by the Taíno Indians, who were later displaced by Spanish settlers. The municipality was originally part of the municipality of San Sebastián, but was separated in 1813.
Economy
The economy of Marías Municipio is largely based on agriculture and tourism. The municipality is home to several farms, which produce a variety of fruits and vegetables. The municipality is also home to several tourist attractions, including the Marías River, which is popular for fishing and kayaking.
Demographics
As of the 2010 census, the population of Marías was 24,845. The population is largely of Hispanic or Latino origin, with 95.3% of the population identifying as such. The median household income in the municipality is $17,845, and the median age is 37.7 years.
Marías Municipio is a vibrant and diverse community, with a rich history and culture. The municipality is home to a variety of attractions, from its beautiful rivers and beaches to its vibrant agricultural industry. The municipality is also home to a variety of businesses, from small family-owned restaurants to larger corporations. Marías Municipio is a great place to live, work, and visit.
Common Questions
What is Per Capita Income in Las Marias Municipio?
Per Capita income in Las Marias Municipio is $8,514.
What is the Median Family Income in Las Marias Municipio?
Median Family Income in Las Marias Municipio is $21,612.
What is the Median Household income in Las Marias Municipio?
Median Household Income in Las Marias Municipio is $16,506.
What is Income or Wage Gap in Las Marias Municipio?
Income or Wage Gap in Las Marias Municipio is 21.7%.
Women in Las Marias Municipio earn 78.3 cents for every dollar earned by a man.
What is Family Income Deficit in Las Marias Municipio?
Family Income Deficit in Las Marias Municipio is $12,405.
Families that are below poverty line in Las Marias Municipio earn $12,405 less on average than the poverty threshold level.
What is Inequality or Gini Index in Las Marias Municipio?
Inequality or Gini Index in Las Marias Municipio is 0.48.
What is the Total Population of Las Marias Municipio?
Total Population of Las Marias Municipio is 8,826.
What is the Total Male Population of Las Marias Municipio?
Total Male Population of Las Marias Municipio is 4,369.
What is the Total Female Population of Las Marias Municipio?
Total Female Population of Las Marias Municipio is 4,457.
What is the Ratio of Males per 100 Females in Las Marias Municipio?
There are 98.03 Males per 100 Females in Las Marias Municipio.
What is the Ratio of Females per 100 Males in Las Marias Municipio?
There are 102.01 Females per 100 Males in Las Marias Municipio.
What is the Median Population Age in Las Marias Municipio?
Median Population Age in Las Marias Municipio is 43.9 Years.
What is the Average Family Size in Las Marias Municipio
Average Family Size in Las Marias Municipio is 4.2 People.
What is the Average Household Size in Las Marias Municipio
Average Household Size in Las Marias Municipio is 3.2 People.
How Large is the Labor Force in Las Marias Municipio?
There are 2,465 People in the Labor Forcein in Las Marias Municipio.
What is the Percentage of People in the Labor Force in Las Marias Municipio?
33.3% of People are in the Labor Force in Las Marias Municipio.
What is the Unemployment Rate in Las Marias Municipio?
Unemployment Rate in Las Marias Municipio is 8.1%.