Isabela Municipio, PR Map & Demographics
Isabela Municipio Map
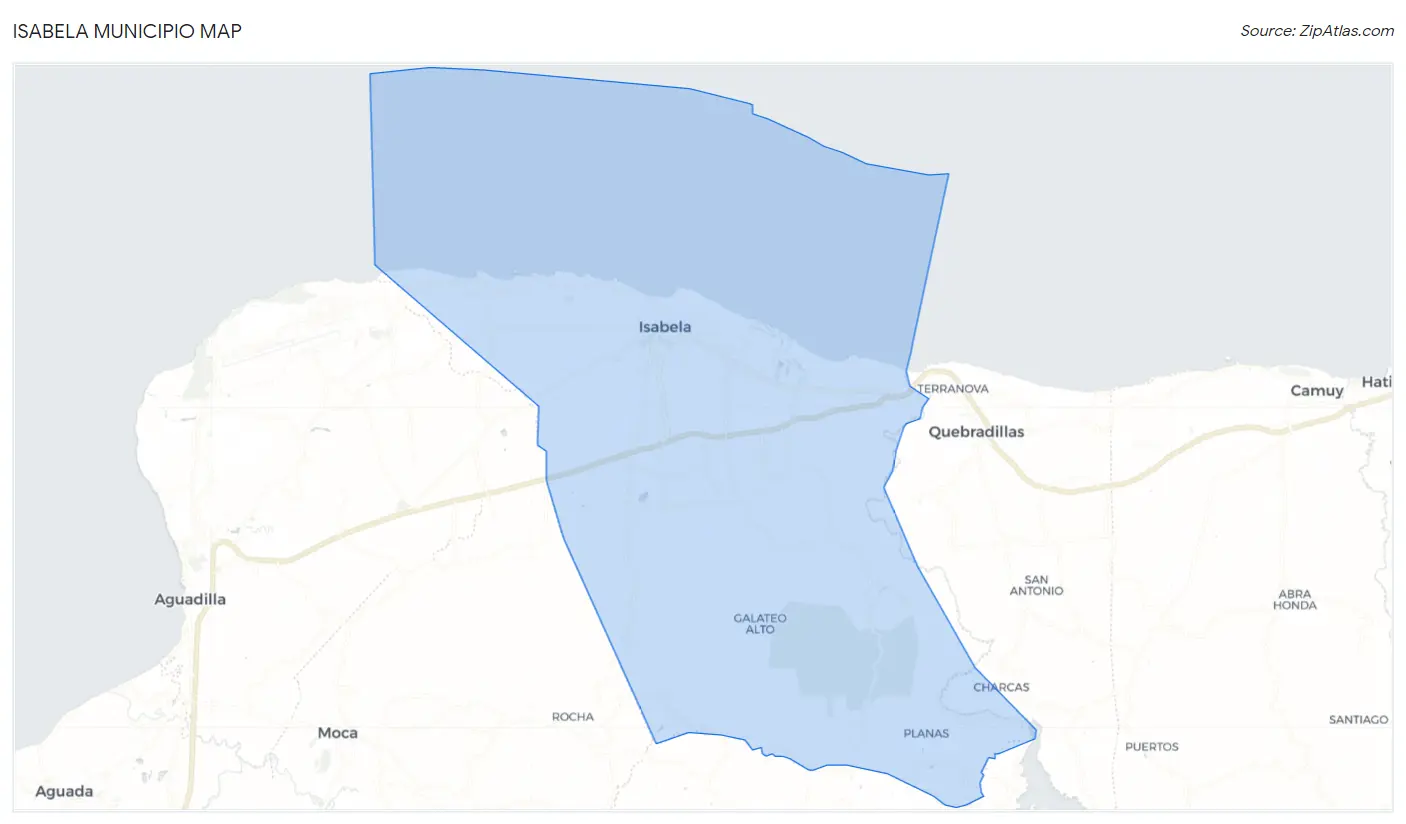
Isabela Municipio Overview
$12,242
PER CAPITA INCOME
$24,697
AVG FAMILY INCOME
$19,965
AVG HOUSEHOLD INCOME
21.3%
WAGE / INCOME GAP [ % ]
78.7¢/ $1
WAGE / INCOME GAP [ $ ]
$11,155
FAMILY INCOME DEFICIT
0.52
INEQUALITY / GINI INDEX
42,817
TOTAL POPULATION
20,828
MALE POPULATION
21,989
FEMALE POPULATION
94.72
MALES / 100 FEMALES
105.57
FEMALES / 100 MALES
44.3
MEDIAN AGE
3.6
AVG FAMILY SIZE
2.9
AVG HOUSEHOLD SIZE
13,322
LABOR FORCE [ PEOPLE ]
36.2%
PERCENT IN LABOR FORCE
7.0%
UNEMPLOYMENT RATE
Isabela Municipio Area Codes
Income in Isabela Municipio
Income Overview in Isabela Municipio
Per Capita Income in Isabela Municipio is $12,242, while median incomes of families and households are $24,697 and $19,965 respectively.
| Characteristic | Number | Measure |
| Per Capita Income | 42,817 | $12,242 |
| Median Family Income | 9,966 | $24,697 |
| Mean Family Income | 9,966 | $32,292 |
| Median Household Income | 14,843 | $19,965 |
| Mean Household Income | 14,843 | $28,937 |
| Income Deficit | 9,966 | $11,155 |
| Wage / Income Gap (%) | 42,817 | 21.27% |
| Wage / Income Gap ($) | 42,817 | 78.73¢ per $1 |
| Gini / Inequality Index | 42,817 | 0.52 |
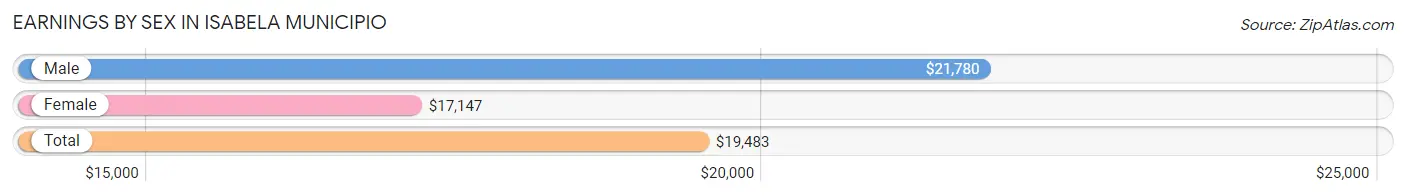
Earnings by Sex in Isabela Municipio
Average Earnings in Isabela Municipio are $19,483, $21,780 for men and $17,147 for women, a difference of 21.3%.
| Sex | Number | Average Earnings |
| Male | 6,814 (53.3%) | $21,780 |
| Female | 5,974 (46.7%) | $17,147 |
| Total | 12,788 (100.0%) | $19,483 |
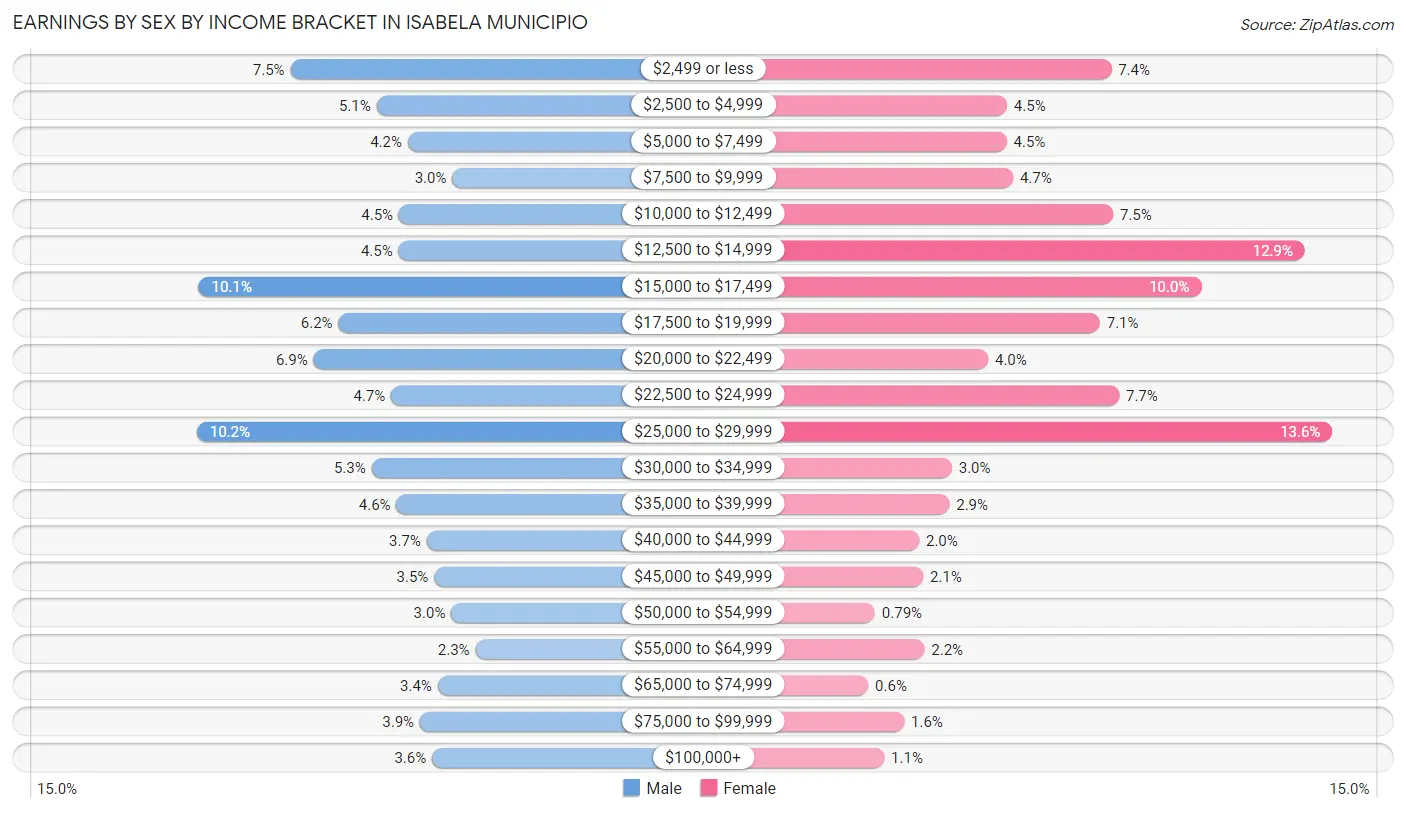
Earnings by Sex by Income Bracket in Isabela Municipio
The most common earnings brackets in Isabela Municipio are $25,000 to $29,999 for men (692 | 10.2%) and $25,000 to $29,999 for women (815 | 13.6%).
| Income | Male | Female |
| $2,499 or less | 513 (7.5%) | 444 (7.4%) |
| $2,500 to $4,999 | 348 (5.1%) | 269 (4.5%) |
| $5,000 to $7,499 | 288 (4.2%) | 268 (4.5%) |
| $7,500 to $9,999 | 203 (3.0%) | 279 (4.7%) |
| $10,000 to $12,499 | 305 (4.5%) | 447 (7.5%) |
| $12,500 to $14,999 | 306 (4.5%) | 769 (12.9%) |
| $15,000 to $17,499 | 689 (10.1%) | 595 (10.0%) |
| $17,500 to $19,999 | 421 (6.2%) | 425 (7.1%) |
| $20,000 to $22,499 | 469 (6.9%) | 237 (4.0%) |
| $22,500 to $24,999 | 320 (4.7%) | 457 (7.6%) |
| $25,000 to $29,999 | 692 (10.2%) | 815 (13.6%) |
| $30,000 to $34,999 | 358 (5.2%) | 176 (2.9%) |
| $35,000 to $39,999 | 310 (4.5%) | 172 (2.9%) |
| $40,000 to $44,999 | 252 (3.7%) | 121 (2.0%) |
| $45,000 to $49,999 | 238 (3.5%) | 128 (2.1%) |
| $50,000 to $54,999 | 205 (3.0%) | 47 (0.8%) |
| $55,000 to $64,999 | 159 (2.3%) | 130 (2.2%) |
| $65,000 to $74,999 | 231 (3.4%) | 36 (0.6%) |
| $75,000 to $99,999 | 265 (3.9%) | 96 (1.6%) |
| $100,000+ | 242 (3.5%) | 63 (1.1%) |
| Total | 6,814 (100.0%) | 5,974 (100.0%) |
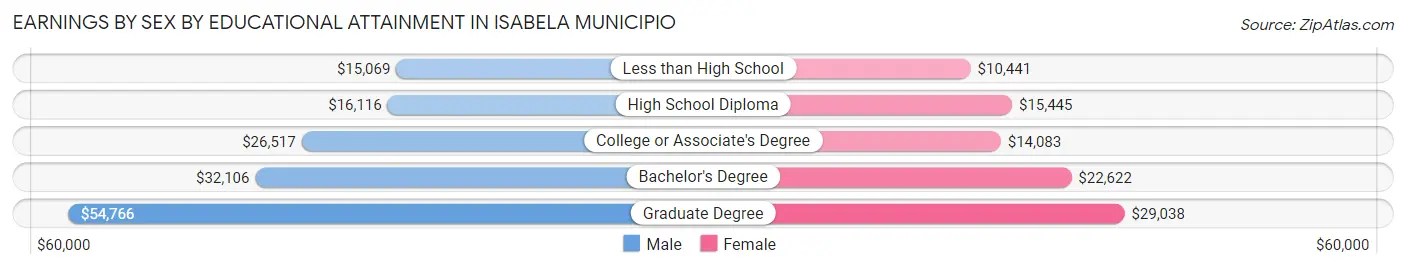
Earnings by Sex by Educational Attainment in Isabela Municipio
Average earnings in Isabela Municipio are $23,000 for men and $18,249 for women, a difference of 20.7%. Men with an educational attainment of graduate degree enjoy the highest average annual earnings of $54,766, while those with less than high school education earn the least with $15,069. Women with an educational attainment of graduate degree earn the most with the average annual earnings of $29,038, while those with less than high school education have the smallest earnings of $10,441.
| Educational Attainment | Male Income | Female Income |
| Less than High School | $15,069 | $10,441 |
| High School Diploma | $16,116 | $15,445 |
| College or Associate's Degree | $26,517 | $14,083 |
| Bachelor's Degree | $32,106 | $22,622 |
| Graduate Degree | $54,766 | $29,038 |
| Total | $23,000 | $18,249 |
Family Income in Isabela Municipio
Family Income Brackets in Isabela Municipio
According to the Isabela Municipio family income data, there are 2,292 families falling into the less than $10,000 income range, which is the most common income bracket and makes up 23.0% of all families. Conversely, the $200,000+ income bracket is the least frequent group with only 20 families (0.2%) belonging to this category.
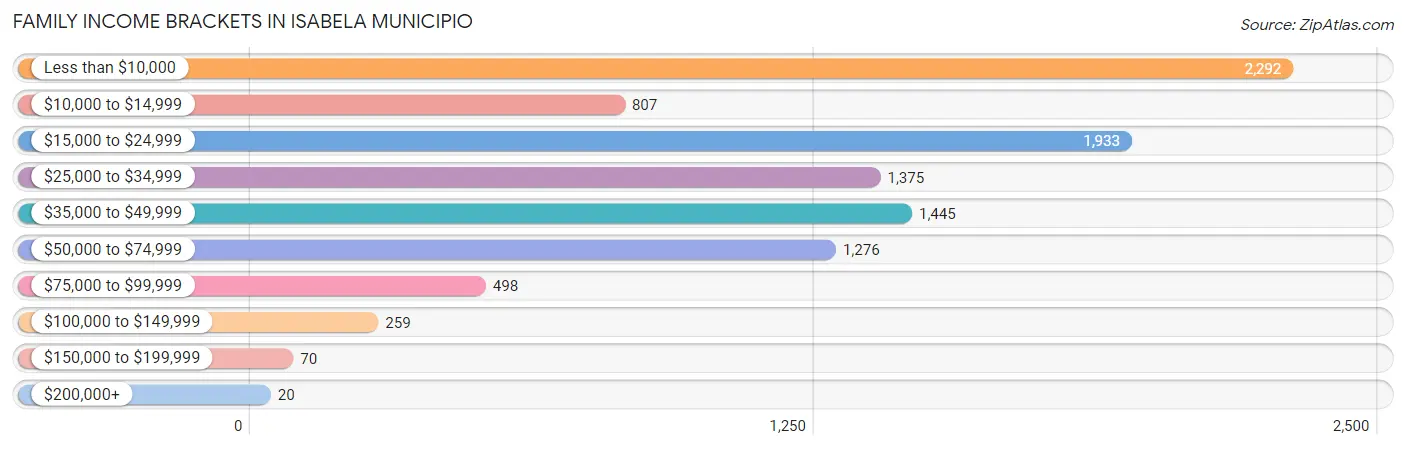
| Income Bracket | # Families | % Families |
| Less than $10,000 | 2,292 | 23.0% |
| $10,000 to $14,999 | 807 | 8.1% |
| $15,000 to $24,999 | 1,933 | 19.4% |
| $25,000 to $34,999 | 1,375 | 13.8% |
| $35,000 to $49,999 | 1,445 | 14.5% |
| $50,000 to $74,999 | 1,276 | 12.8% |
| $75,000 to $99,999 | 498 | 5.0% |
| $100,000 to $149,999 | 259 | 2.6% |
| $150,000 to $199,999 | 70 | 0.7% |
| $200,000+ | 20 | 0.2% |
Family Income by Famaliy Size in Isabela Municipio
5-person families (325 | 3.3%) account for the highest median family income in Isabela Municipio with $52,875 per family, while 2-person families (5,605 | 56.2%) have the highest median income of $10,849 per family member.
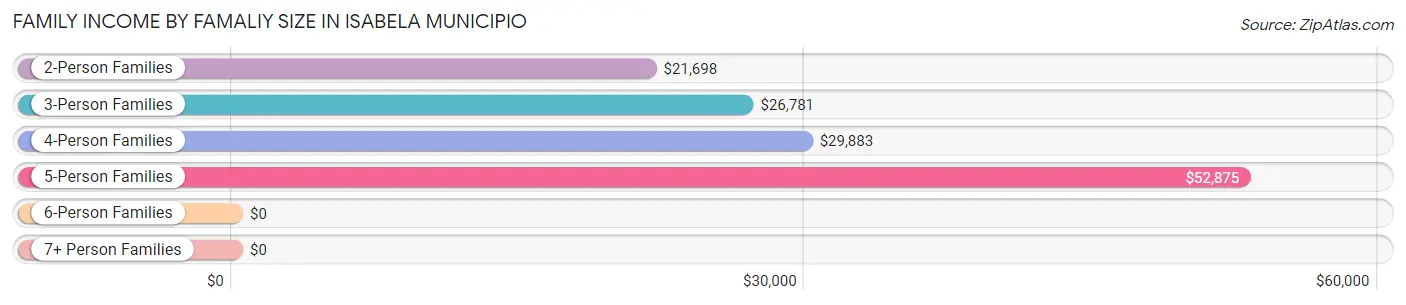
| Income Bracket | # Families | Median Income |
| 2-Person Families | 5,605 (56.2%) | $21,698 |
| 3-Person Families | 2,561 (25.7%) | $26,781 |
| 4-Person Families | 1,397 (14.0%) | $29,883 |
| 5-Person Families | 325 (3.3%) | $52,875 |
| 6-Person Families | 45 (0.4%) | $0 |
| 7+ Person Families | 33 (0.3%) | $0 |
| Total | 9,966 (100.0%) | $24,697 |
Family Income by Number of Earners in Isabela Municipio
The median family income in Isabela Municipio is $24,697, with families comprising 2 earners (1,905) having the highest median family income of $52,419, while families with no earners (4,551) have the lowest median family income of $14,478, accounting for 19.1% and 45.7% of families, respectively.
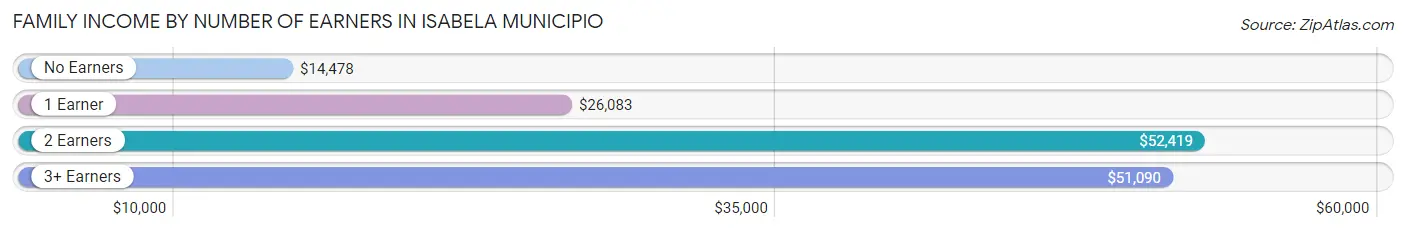
| Number of Earners | # Families | Median Income |
| No Earners | 4,551 (45.7%) | $14,478 |
| 1 Earner | 3,314 (33.3%) | $26,083 |
| 2 Earners | 1,905 (19.1%) | $52,419 |
| 3+ Earners | 196 (2.0%) | $51,090 |
| Total | 9,966 (100.0%) | $24,697 |
Household Income in Isabela Municipio
Household Income Brackets in Isabela Municipio
With 4,112 households falling in the category, the less than $10,000 income range is the most frequent in Isabela Municipio, accounting for 27.7% of all households. In contrast, only 74 households (0.5%) fall into the $200,000+ income bracket, making it the least populous group.
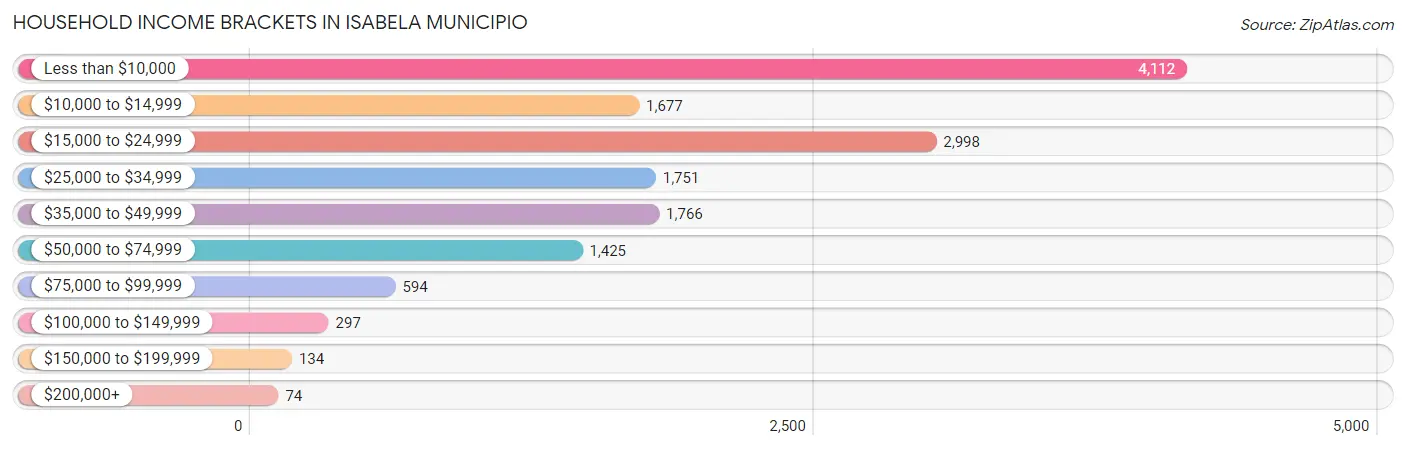
| Income Bracket | # Households | % Households |
| Less than $10,000 | 4,112 | 27.7% |
| $10,000 to $14,999 | 1,677 | 11.3% |
| $15,000 to $24,999 | 2,998 | 20.2% |
| $25,000 to $34,999 | 1,751 | 11.8% |
| $35,000 to $49,999 | 1,766 | 11.9% |
| $50,000 to $74,999 | 1,425 | 9.6% |
| $75,000 to $99,999 | 594 | 4.0% |
| $100,000 to $149,999 | 297 | 2.0% |
| $150,000 to $199,999 | 134 | 0.9% |
| $200,000+ | 74 | 0.5% |
Household Income by Householder Age in Isabela Municipio
The median household income in Isabela Municipio is $19,965, with the highest median household income of $25,880 found in the 25 to 44 years age bracket for the primary householder. A total of 3,445 households (23.2%) fall into this category. Meanwhile, the 65+ years age bracket for the primary householder has the lowest median household income of $16,352, with 4,825 households (32.5%) in this group.
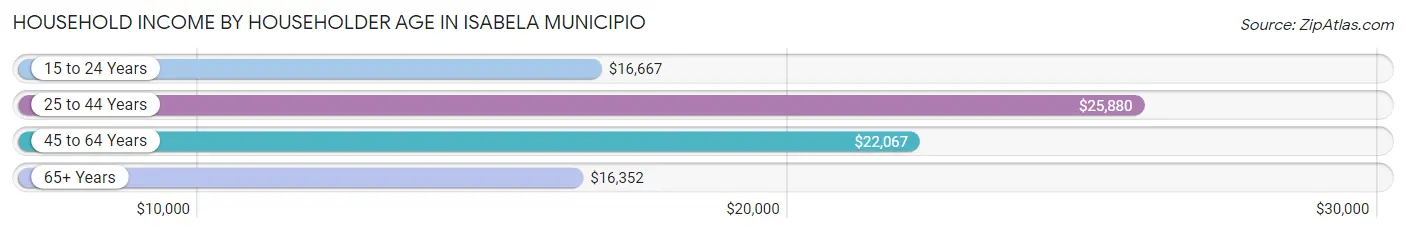
| Income Bracket | # Households | Median Income |
| 15 to 24 Years | 138 (0.9%) | $16,667 |
| 25 to 44 Years | 3,445 (23.2%) | $25,880 |
| 45 to 64 Years | 6,435 (43.3%) | $22,067 |
| 65+ Years | 4,825 (32.5%) | $16,352 |
| Total | 14,843 (100.0%) | $19,965 |
Poverty in Isabela Municipio
Income Below Poverty by Sex and Age in Isabela Municipio
With 47.1% poverty level for males and 49.3% for females among the residents of Isabela Municipio, 5 year old males and 5 year old females are the most vulnerable to poverty, with 146 males (100.0%) and 50 females (100.0%) in their respective age groups living below the poverty level.
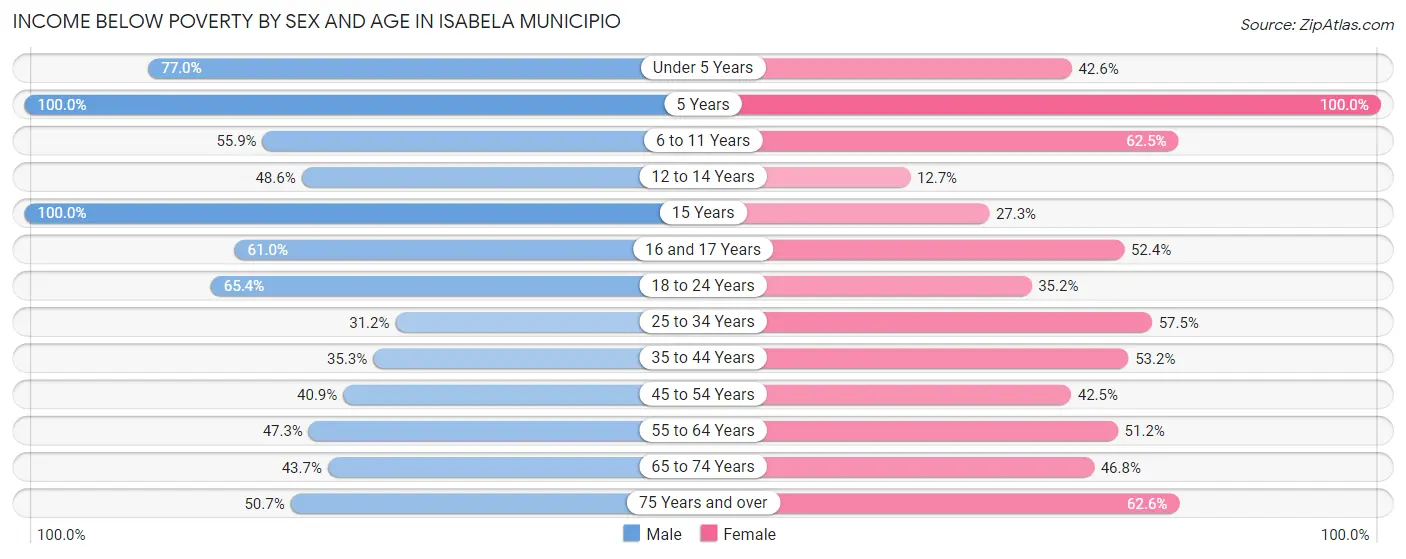
| Age Bracket | Male | Female |
| Under 5 Years | 530 (77.0%) | 289 (42.6%) |
| 5 Years | 146 (100.0%) | 50 (100.0%) |
| 6 to 11 Years | 726 (55.8%) | 741 (62.5%) |
| 12 to 14 Years | 351 (48.6%) | 92 (12.7%) |
| 15 Years | 167 (100.0%) | 65 (27.3%) |
| 16 and 17 Years | 391 (61.0%) | 242 (52.4%) |
| 18 to 24 Years | 1,298 (65.4%) | 643 (35.2%) |
| 25 to 34 Years | 881 (31.2%) | 1,556 (57.5%) |
| 35 to 44 Years | 930 (35.3%) | 1,449 (53.2%) |
| 45 to 54 Years | 1,159 (40.9%) | 1,294 (42.5%) |
| 55 to 64 Years | 1,307 (47.3%) | 1,606 (51.2%) |
| 65 to 74 Years | 986 (43.7%) | 1,220 (46.8%) |
| 75 Years and over | 891 (50.6%) | 1,442 (62.6%) |
| Total | 9,763 (47.1%) | 10,689 (49.3%) |
Income Above Poverty by Sex and Age in Isabela Municipio
According to the poverty statistics in Isabela Municipio, males aged 25 to 34 years and females aged 12 to 14 years are the age groups that are most secure financially, with 68.8% of males and 87.4% of females in these age groups living above the poverty line.
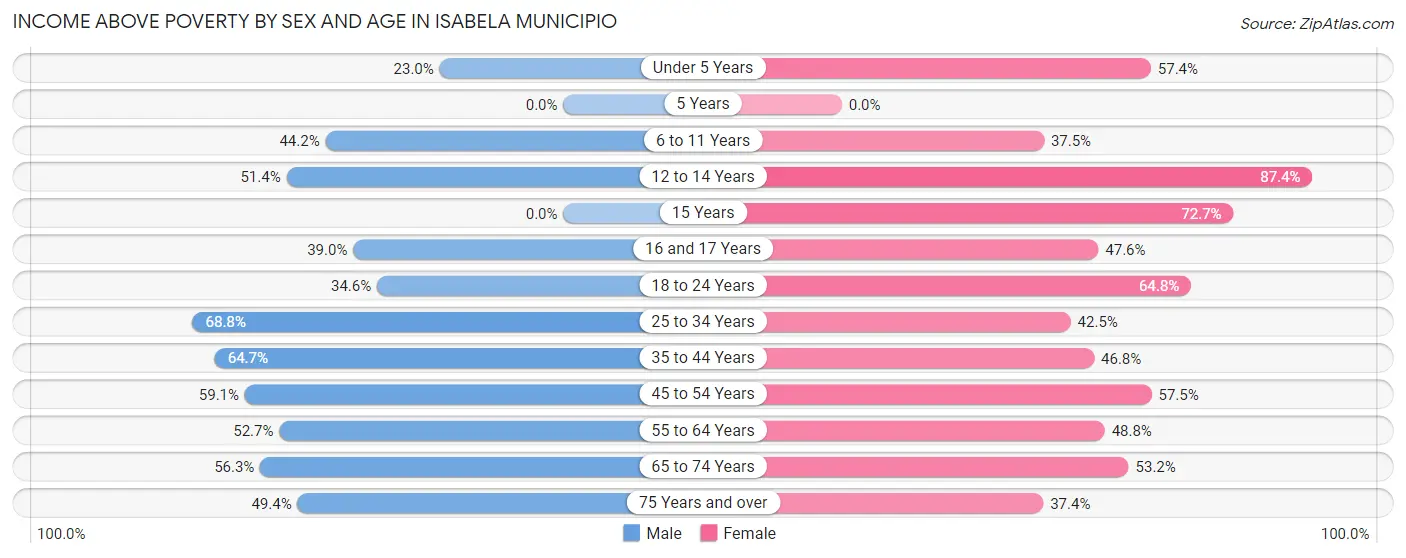
| Age Bracket | Male | Female |
| Under 5 Years | 158 (23.0%) | 389 (57.4%) |
| 5 Years | 0 (0.0%) | 0 (0.0%) |
| 6 to 11 Years | 574 (44.2%) | 445 (37.5%) |
| 12 to 14 Years | 371 (51.4%) | 635 (87.4%) |
| 15 Years | 0 (0.0%) | 173 (72.7%) |
| 16 and 17 Years | 250 (39.0%) | 220 (47.6%) |
| 18 to 24 Years | 686 (34.6%) | 1,186 (64.8%) |
| 25 to 34 Years | 1,944 (68.8%) | 1,149 (42.5%) |
| 35 to 44 Years | 1,704 (64.7%) | 1,276 (46.8%) |
| 45 to 54 Years | 1,676 (59.1%) | 1,751 (57.5%) |
| 55 to 64 Years | 1,458 (52.7%) | 1,531 (48.8%) |
| 65 to 74 Years | 1,269 (56.3%) | 1,389 (53.2%) |
| 75 Years and over | 868 (49.3%) | 861 (37.4%) |
| Total | 10,958 (52.9%) | 11,005 (50.7%) |
Income Below Poverty Among Married-Couple Families in Isabela Municipio
The poverty statistics for married-couple families in Isabela Municipio show that 33.3% or 1,987 of the total 5,972 families live below the poverty line. Families with no children have the highest poverty rate of 36.3%, comprising of 1,551 families. On the other hand, families with 3 or 4 children have the lowest poverty rate of 13.7%, which includes 19 families.
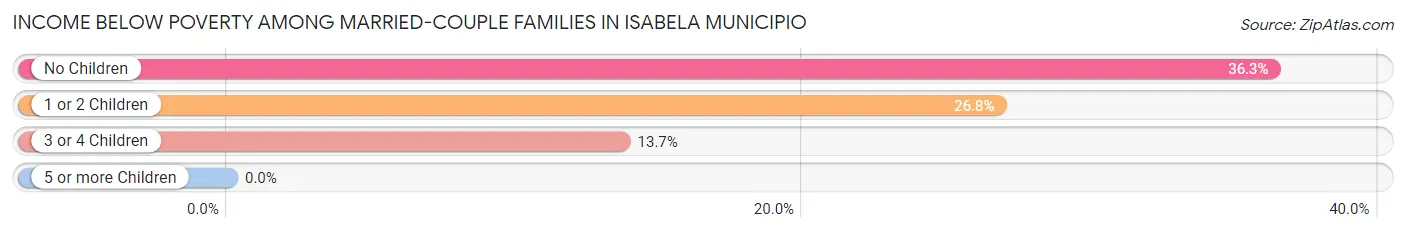
| Children | Above Poverty | Below Poverty |
| No Children | 2,723 (63.7%) | 1,551 (36.3%) |
| 1 or 2 Children | 1,142 (73.3%) | 417 (26.8%) |
| 3 or 4 Children | 120 (86.3%) | 19 (13.7%) |
| 5 or more Children | 0 (0.0%) | 0 (0.0%) |
| Total | 3,985 (66.7%) | 1,987 (33.3%) |
Income Below Poverty Among Single-Parent Households in Isabela Municipio
According to the poverty data in Isabela Municipio, 58.3% or 542 single-father households and 62.3% or 1,909 single-mother households are living below the poverty line. Among single-father households, those with 3 or 4 children have the highest poverty rate, with 17 households (100.0%) experiencing poverty. Likewise, among single-mother households, those with 3 or 4 children have the highest poverty rate, with 14 households (100.0%) falling below the poverty line.
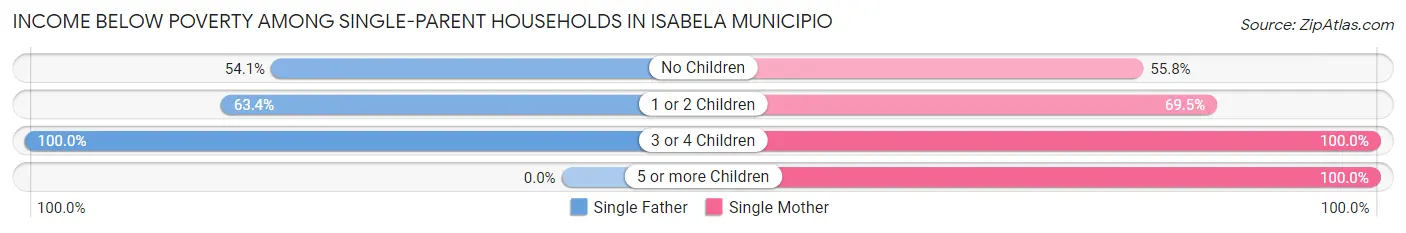
| Children | Single Father | Single Mother |
| No Children | 315 (54.1%) | 938 (55.8%) |
| 1 or 2 Children | 210 (63.4%) | 943 (69.5%) |
| 3 or 4 Children | 17 (100.0%) | 14 (100.0%) |
| 5 or more Children | 0 (0.0%) | 14 (100.0%) |
| Total | 542 (58.3%) | 1,909 (62.3%) |
Income Below Poverty Among Married-Couple vs Single-Parent Households in Isabela Municipio
The poverty data for Isabela Municipio shows that 1,987 of the married-couple family households (33.3%) and 2,451 of the single-parent households (61.4%) are living below the poverty level. Within the married-couple family households, those with no children have the highest poverty rate, with 1,551 households (36.3%) falling below the poverty line. Among the single-parent households, those with 3 or 4 children have the highest poverty rate, with 31 household (100.0%) living below poverty.
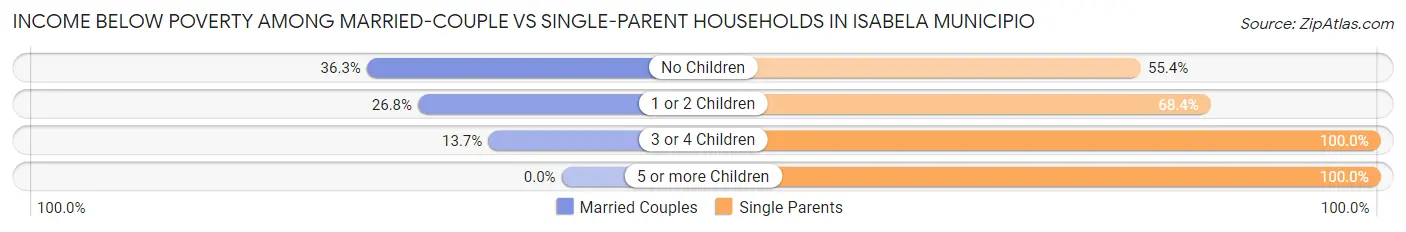
| Children | Married-Couple Families | Single-Parent Households |
| No Children | 1,551 (36.3%) | 1,253 (55.4%) |
| 1 or 2 Children | 417 (26.8%) | 1,153 (68.3%) |
| 3 or 4 Children | 19 (13.7%) | 31 (100.0%) |
| 5 or more Children | 0 (0.0%) | 14 (100.0%) |
| Total | 1,987 (33.3%) | 2,451 (61.4%) |
Race in Isabela Municipio
The most populous races in Isabela Municipio are Hispanic or Latino (41,919 | 97.9%), White / Caucasian (24,011 | 56.1%), and Some other Race (10,564 | 24.7%).
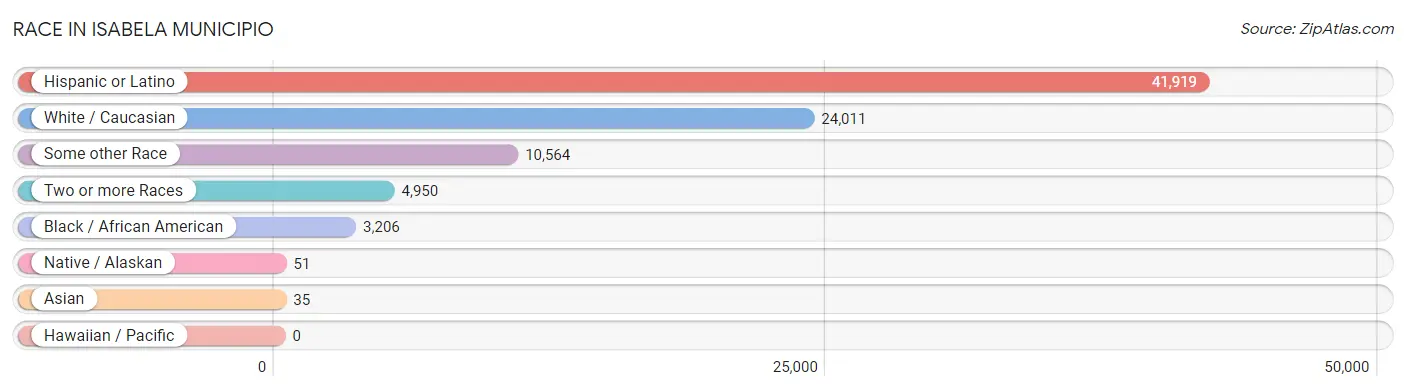
| Race | # Population | % Population |
| Asian | 35 | 0.1% |
| Black / African American | 3,206 | 7.5% |
| Hawaiian / Pacific | 0 | 0.0% |
| Hispanic or Latino | 41,919 | 97.9% |
| Native / Alaskan | 51 | 0.1% |
| White / Caucasian | 24,011 | 56.1% |
| Two or more Races | 4,950 | 11.6% |
| Some other Race | 10,564 | 24.7% |
| Total | 42,817 | 100.0% |
Ancestry in Isabela Municipio
The most populous ancestries reported in Isabela Municipio are Puerto Rican (41,462 | 96.8%), American (2,143 | 5.0%), German (178 | 0.4%), Dominican (177 | 0.4%), and South American (92 | 0.2%), together accounting for 102.9% of all Isabela Municipio residents.
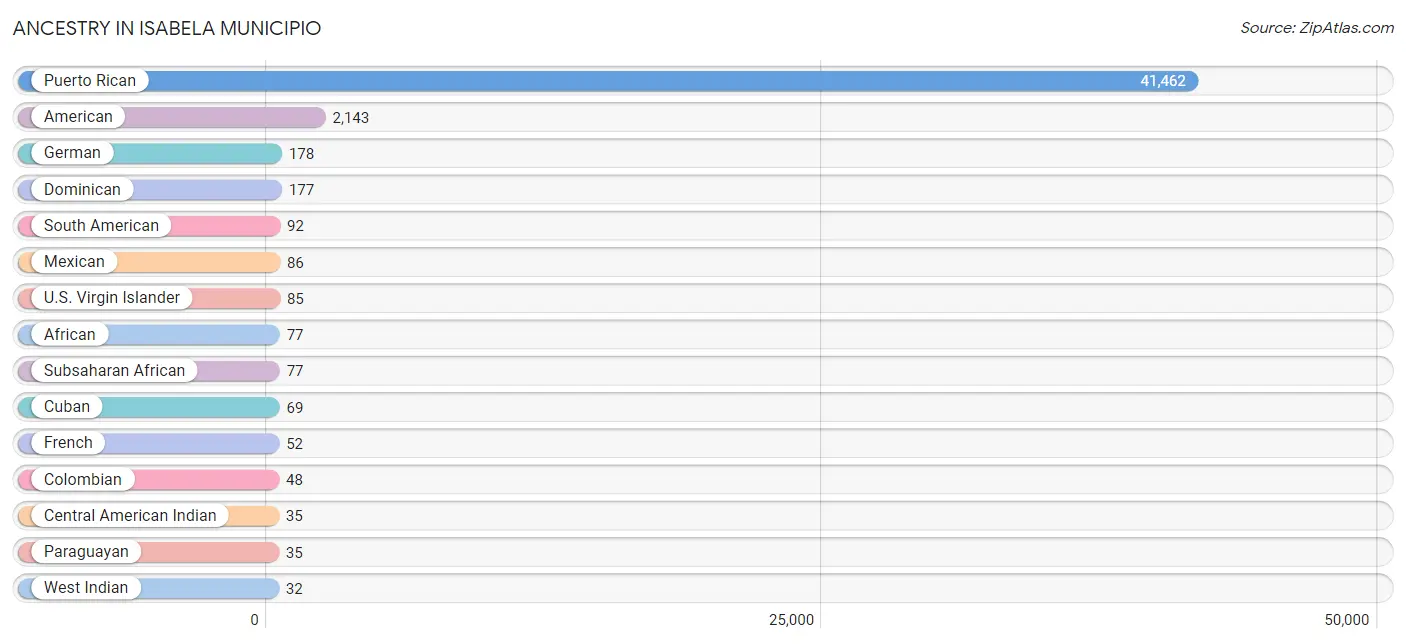
| Ancestry | # Population | % Population |
| African | 77 | 0.2% |
| American | 2,143 | 5.0% |
| Arab | 15 | 0.0% |
| Central American | 20 | 0.1% |
| Central American Indian | 35 | 0.1% |
| Colombian | 48 | 0.1% |
| Cuban | 69 | 0.2% |
| Dominican | 177 | 0.4% |
| French | 52 | 0.1% |
| German | 178 | 0.4% |
| Guatemalan | 20 | 0.1% |
| Indian (Asian) | 19 | 0.0% |
| Irish | 17 | 0.0% |
| Italian | 17 | 0.0% |
| Korean | 16 | 0.0% |
| Lebanese | 15 | 0.0% |
| Mexican | 86 | 0.2% |
| Paraguayan | 35 | 0.1% |
| Polish | 7 | 0.0% |
| Puerto Rican | 41,462 | 96.8% |
| Scottish | 7 | 0.0% |
| South American | 92 | 0.2% |
| Spaniard | 13 | 0.0% |
| Spanish American Indian | 12 | 0.0% |
| Subsaharan African | 77 | 0.2% |
| U.S. Virgin Islander | 85 | 0.2% |
| Venezuelan | 9 | 0.0% |
| West Indian | 32 | 0.1% | View All 28 Rows |
Immigrants in Isabela Municipio

| Immigration Origin | # Population | % Population | View All 0 Rows |
Sex and Age in Isabela Municipio
Sex and Age in Isabela Municipio
The most populous age groups in Isabela Municipio are 40 to 44 Years (1,547 | 7.4%) for men and 60 to 64 Years (1,664 | 7.6%) for women.
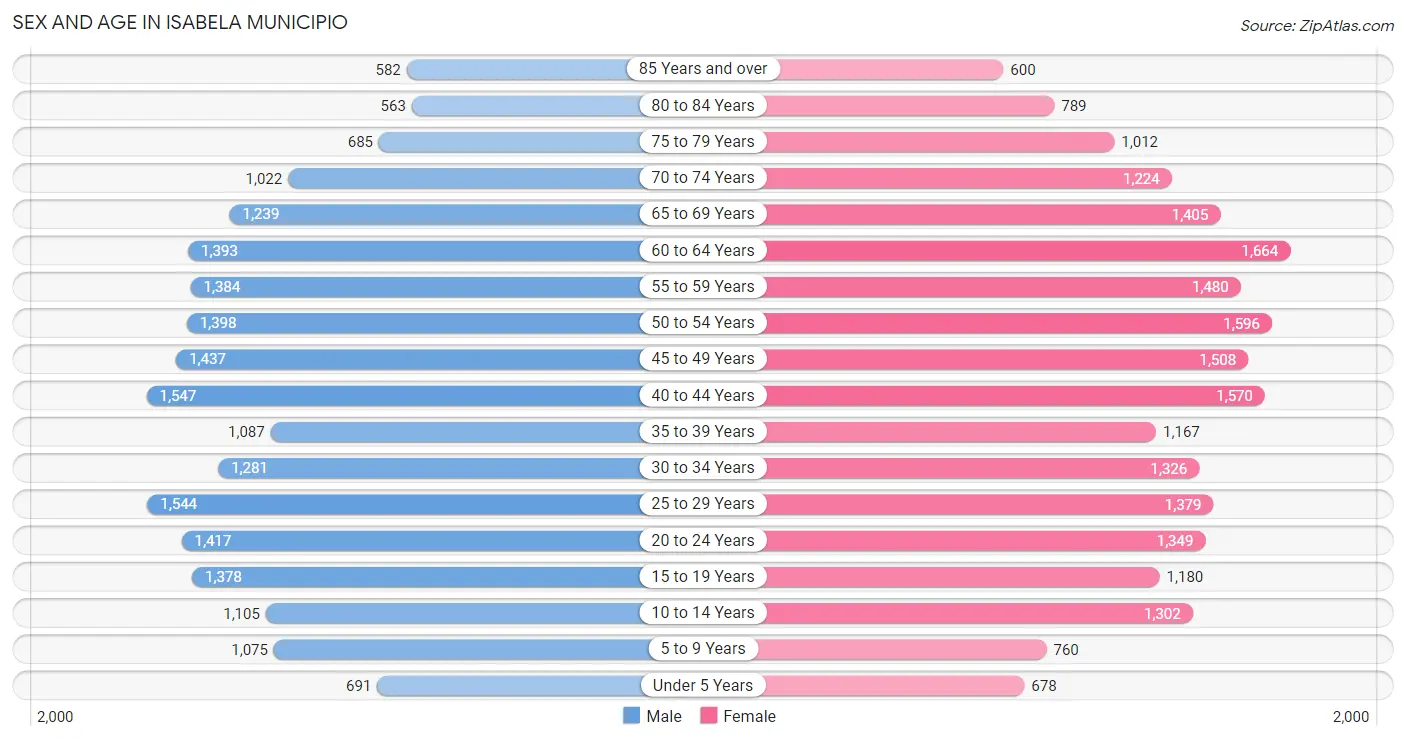
| Age Bracket | Male | Female |
| Under 5 Years | 691 (3.3%) | 678 (3.1%) |
| 5 to 9 Years | 1,075 (5.2%) | 760 (3.5%) |
| 10 to 14 Years | 1,105 (5.3%) | 1,302 (5.9%) |
| 15 to 19 Years | 1,378 (6.6%) | 1,180 (5.4%) |
| 20 to 24 Years | 1,417 (6.8%) | 1,349 (6.1%) |
| 25 to 29 Years | 1,544 (7.4%) | 1,379 (6.3%) |
| 30 to 34 Years | 1,281 (6.1%) | 1,326 (6.0%) |
| 35 to 39 Years | 1,087 (5.2%) | 1,167 (5.3%) |
| 40 to 44 Years | 1,547 (7.4%) | 1,570 (7.1%) |
| 45 to 49 Years | 1,437 (6.9%) | 1,508 (6.9%) |
| 50 to 54 Years | 1,398 (6.7%) | 1,596 (7.3%) |
| 55 to 59 Years | 1,384 (6.6%) | 1,480 (6.7%) |
| 60 to 64 Years | 1,393 (6.7%) | 1,664 (7.6%) |
| 65 to 69 Years | 1,239 (5.9%) | 1,405 (6.4%) |
| 70 to 74 Years | 1,022 (4.9%) | 1,224 (5.6%) |
| 75 to 79 Years | 685 (3.3%) | 1,012 (4.6%) |
| 80 to 84 Years | 563 (2.7%) | 789 (3.6%) |
| 85 Years and over | 582 (2.8%) | 600 (2.7%) |
| Total | 20,828 (100.0%) | 21,989 (100.0%) |
Families and Households in Isabela Municipio
Median Family Size in Isabela Municipio
The median family size in Isabela Municipio is 3.58 persons per family, with single male/father families (930 | 9.3%) accounting for the largest median family size of 4.51 persons per family. On the other hand, married-couple families (5,972 | 59.9%) represent the smallest median family size with 3.29 persons per family.
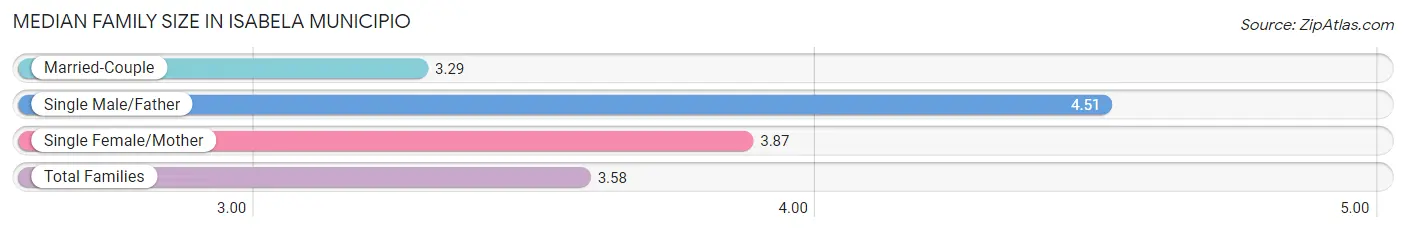
| Family Type | # Families | Family Size |
| Married-Couple | 5,972 (59.9%) | 3.29 |
| Single Male/Father | 930 (9.3%) | 4.51 |
| Single Female/Mother | 3,064 (30.7%) | 3.87 |
| Total Families | 9,966 (100.0%) | 3.58 |
Median Household Size in Isabela Municipio
The median household size in Isabela Municipio is 2.86 persons per household, with single male/father households (930 | 6.3%) accounting for the largest median household size of 4.94 persons per household. non-family households (4,877 | 32.9%) represent the smallest median household size with 1.14 persons per household.
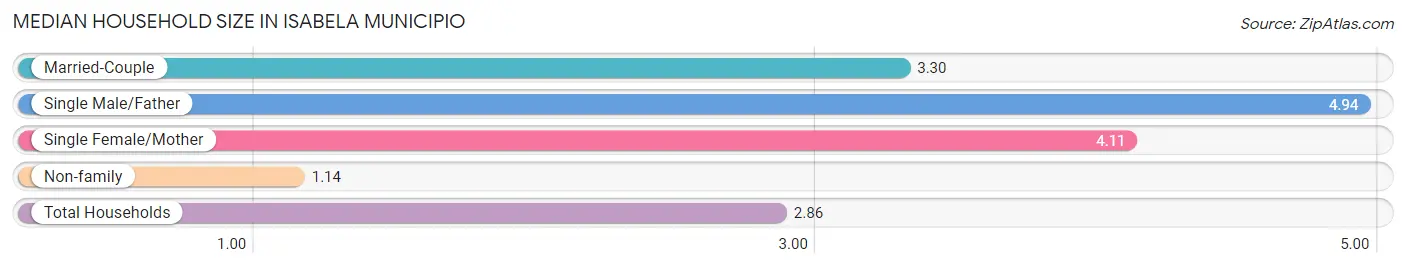
| Household Type | # Households | Household Size |
| Married-Couple | 5,972 (40.2%) | 3.30 |
| Single Male/Father | 930 (6.3%) | 4.94 |
| Single Female/Mother | 3,064 (20.6%) | 4.11 |
| Non-family | 4,877 (32.9%) | 1.14 |
| Total Households | 14,843 (100.0%) | 2.86 |
Household Size by Marriage Status in Isabela Municipio
Out of a total of 14,843 households in Isabela Municipio, 9,966 (67.1%) are family households, while 4,877 (32.9%) are nonfamily households. The most numerous type of family households are 2-person households, comprising 5,231, and the most common type of nonfamily households are 1-person households, comprising 4,531.
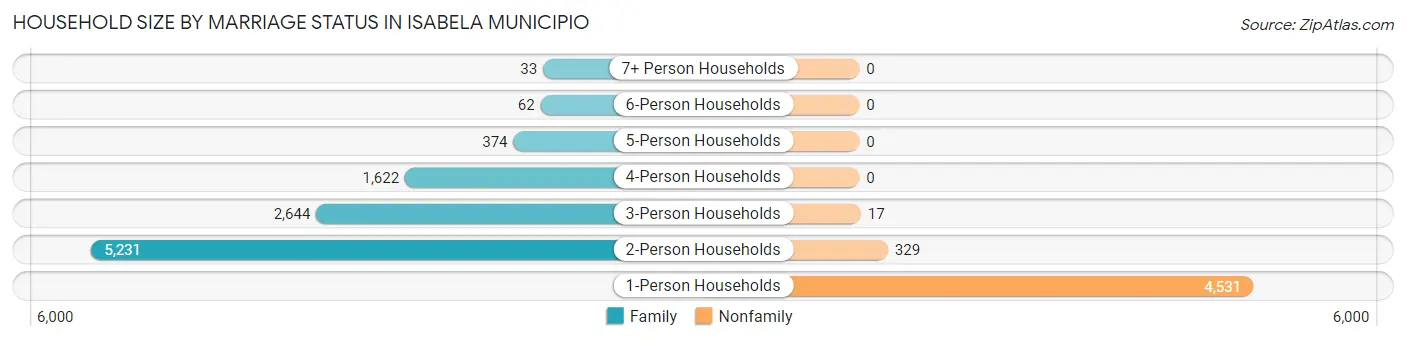
| Household Size | Family Households | Nonfamily Households |
| 1-Person Households | - | 4,531 (30.5%) |
| 2-Person Households | 5,231 (35.2%) | 329 (2.2%) |
| 3-Person Households | 2,644 (17.8%) | 17 (0.1%) |
| 4-Person Households | 1,622 (10.9%) | 0 (0.0%) |
| 5-Person Households | 374 (2.5%) | 0 (0.0%) |
| 6-Person Households | 62 (0.4%) | 0 (0.0%) |
| 7+ Person Households | 33 (0.2%) | 0 (0.0%) |
| Total | 9,966 (67.1%) | 4,877 (32.9%) |
Female Fertility in Isabela Municipio
Fertility by Age in Isabela Municipio
Average fertility rate in Isabela Municipio is 34.0 births per 1,000 women. Women in the age bracket of 20 to 34 years have the highest fertility rate with 74.0 births per 1,000 women. Women in the age bracket of 20 to 34 years acount for 90.7% of all women with births.
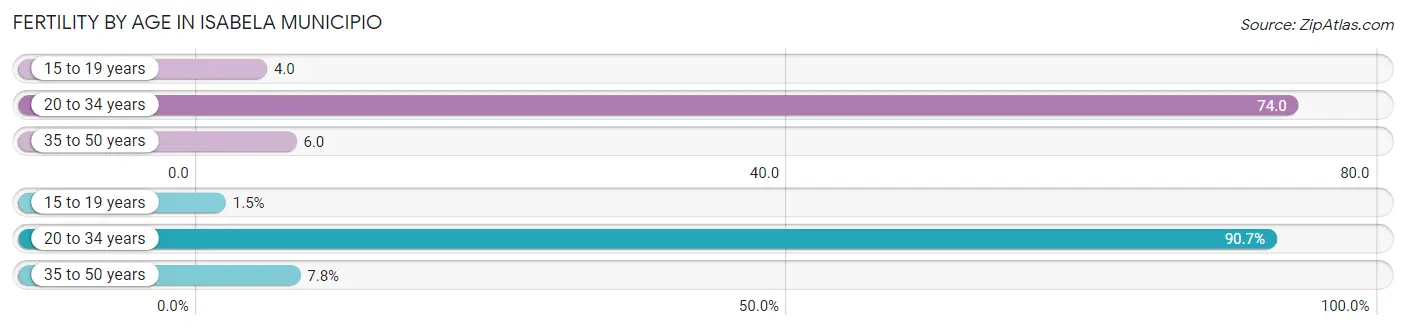
| Age Bracket | Women with Births | Births / 1,000 Women |
| 15 to 19 years | 5 (1.5%) | 4.0 |
| 20 to 34 years | 301 (90.7%) | 74.0 |
| 35 to 50 years | 26 (7.8%) | 6.0 |
| Total | 332 (100.0%) | 34.0 |
Fertility by Age by Marriage Status in Isabela Municipio
64.2% of women with births (332) in Isabela Municipio are married. The highest percentage of unmarried women with births falls into 15 to 19 years age bracket with 100.0% of them unmarried at the time of birth, while the lowest percentage of unmarried women with births belong to 35 to 50 years age bracket with 0.0% of them unmarried.
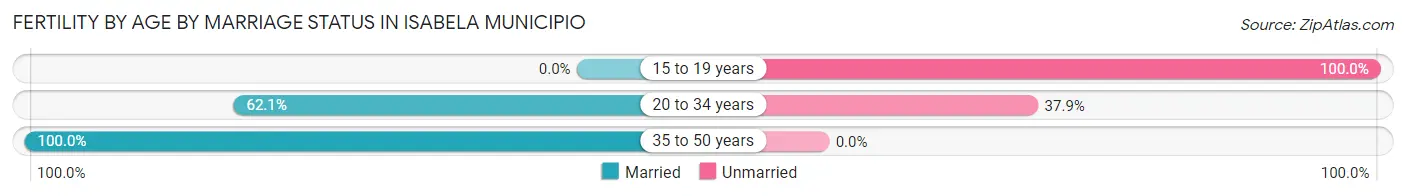
| Age Bracket | Married | Unmarried |
| 15 to 19 years | 0 (0.0%) | 5 (100.0%) |
| 20 to 34 years | 187 (62.1%) | 114 (37.9%) |
| 35 to 50 years | 26 (100.0%) | 0 (0.0%) |
| Total | 213 (64.2%) | 119 (35.8%) |
Fertility by Education in Isabela Municipio
Average fertility rate in Isabela Municipio is 34.0 births per 1,000 women. Women with the education attainment of graduate degree have the highest fertility rate of 90.0 births per 1,000 women, while women with the education attainment of less than high school have the lowest fertility at 12.0 births per 1,000 women. Women with the education attainment of bachelor's degree represent 33.4% of all women with births.
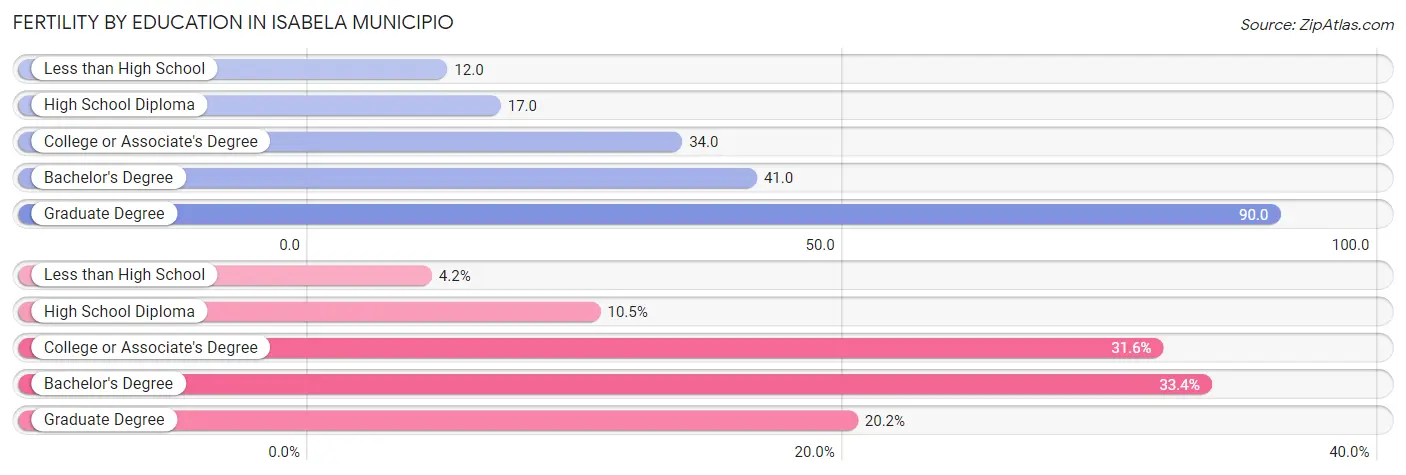
| Educational Attainment | Women with Births | Births / 1,000 Women |
| Less than High School | 14 (4.2%) | 12.0 |
| High School Diploma | 35 (10.5%) | 17.0 |
| College or Associate's Degree | 105 (31.6%) | 34.0 |
| Bachelor's Degree | 111 (33.4%) | 41.0 |
| Graduate Degree | 67 (20.2%) | 90.0 |
| Total | 332 (100.0%) | 34.0 |
Fertility by Education by Marriage Status in Isabela Municipio
35.8% of women with births in Isabela Municipio are unmarried. Women with the educational attainment of high school diploma are most likely to be married with 100.0% of them married at childbirth, while women with the educational attainment of less than high school are least likely to be married with 100.0% of them unmarried at childbirth.
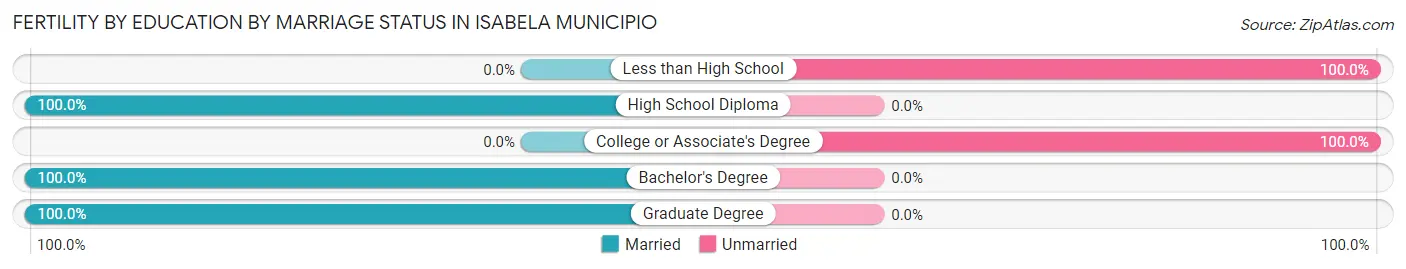
| Educational Attainment | Married | Unmarried |
| Less than High School | 0 (0.0%) | 14 (100.0%) |
| High School Diploma | 35 (100.0%) | 0 (0.0%) |
| College or Associate's Degree | 0 (0.0%) | 105 (100.0%) |
| Bachelor's Degree | 111 (100.0%) | 0 (0.0%) |
| Graduate Degree | 67 (100.0%) | 0 (0.0%) |
| Total | 213 (64.2%) | 119 (35.8%) |
Employment Characteristics in Isabela Municipio
Employment by Class of Employer in Isabela Municipio
Among the 12,250 employed individuals in Isabela Municipio, private company employees (7,467 | 61.0%), state government employees (1,643 | 13.4%), and self-employed (not incorporated) (1,358 | 11.1%) make up the most common classes of employment.
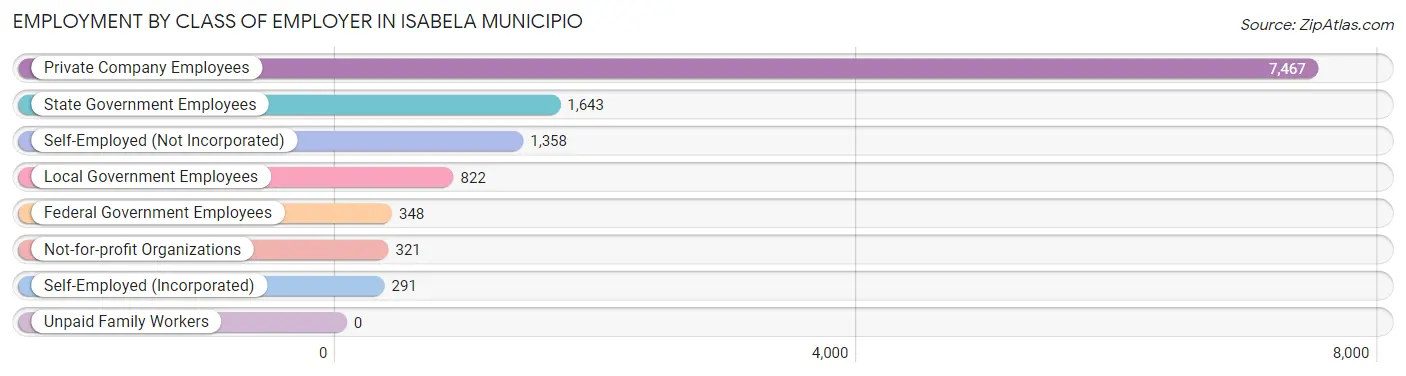
| Employer Class | # Employees | % Employees |
| Private Company Employees | 7,467 | 61.0% |
| Self-Employed (Incorporated) | 291 | 2.4% |
| Self-Employed (Not Incorporated) | 1,358 | 11.1% |
| Not-for-profit Organizations | 321 | 2.6% |
| Local Government Employees | 822 | 6.7% |
| State Government Employees | 1,643 | 13.4% |
| Federal Government Employees | 348 | 2.8% |
| Unpaid Family Workers | 0 | 0.0% |
| Total | 12,250 | 100.0% |
Employment Status by Age in Isabela Municipio
According to the labor force statistics for Isabela Municipio, out of the total population over 16 years of age (36,801), 36.2% or 13,322 individuals are in the labor force, with 7.0% or 933 of them unemployed. The age group with the highest labor force participation rate is 30 to 34 years, with 75.0% or 1,955 individuals in the labor force. Within the labor force, the 16 to 19 years age range has the highest percentage of unemployed individuals, with 55.6% or 71 of them being unemployed.
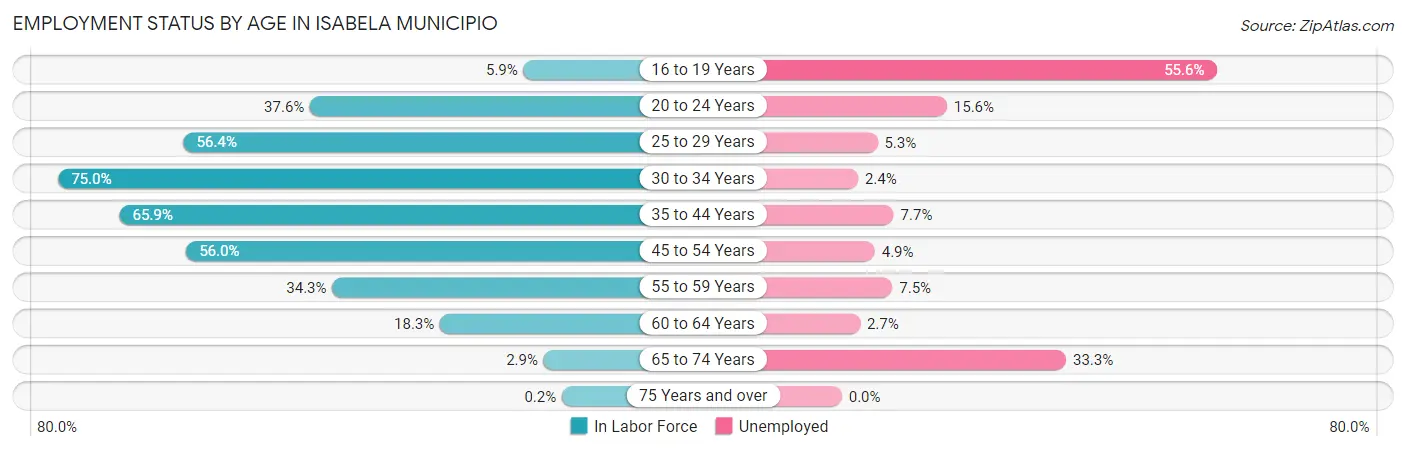
| Age Bracket | In Labor Force | Unemployed |
| 16 to 19 Years | 127 (5.9%) | 71 (55.6%) |
| 20 to 24 Years | 1,040 (37.6%) | 162 (15.6%) |
| 25 to 29 Years | 1,649 (56.4%) | 87 (5.3%) |
| 30 to 34 Years | 1,955 (75.0%) | 47 (2.4%) |
| 35 to 44 Years | 3,539 (65.9%) | 273 (7.7%) |
| 45 to 54 Years | 3,326 (56.0%) | 163 (4.9%) |
| 55 to 59 Years | 982 (34.3%) | 74 (7.5%) |
| 60 to 64 Years | 559 (18.3%) | 15 (2.7%) |
| 65 to 74 Years | 142 (2.9%) | 47 (33.3%) |
| 75 Years and over | 8 (0.2%) | 0 (0.0%) |
| Total | 13,322 (36.2%) | 933 (7.0%) |
Employment Status by Educational Attainment in Isabela Municipio
According to labor force statistics for Isabela Municipio, 52.8% of individuals (12,018) out of the total population between 25 and 64 years of age (22,761) are in the labor force, with 5.5% or 661 of them being unemployed. The group with the highest labor force participation rate are those with the educational attainment of bachelor's degree or higher, with 71.6% or 4,832 individuals in the labor force. Within the labor force, individuals with less than high school education have the highest percentage of unemployment, with 10.3% or 90 of them being unemployed.
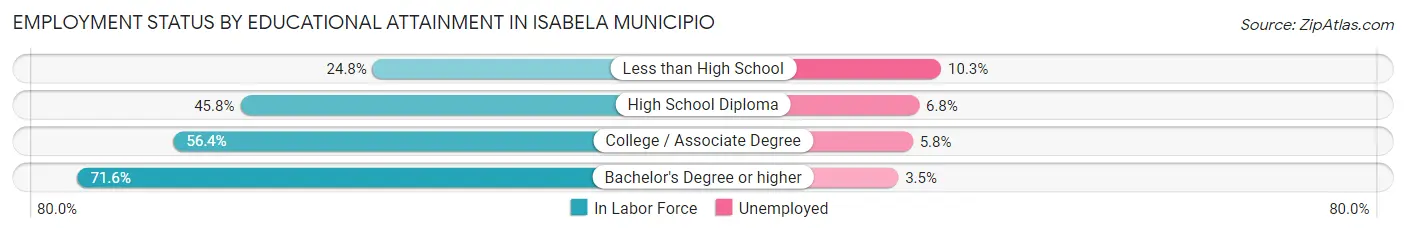
| Educational Attainment | In Labor Force | Unemployed |
| Less than High School | 873 (24.8%) | 363 (10.3%) |
| High School Diploma | 3,193 (45.8%) | 474 (6.8%) |
| College / Associate Degree | 3,113 (56.4%) | 320 (5.8%) |
| Bachelor's Degree or higher | 4,832 (71.6%) | 236 (3.5%) |
| Total | 12,018 (52.8%) | 1,252 (5.5%) |
Employment Occupations by Sex in Isabela Municipio
Management, Business, Science and Arts Occupations
The most common Management, Business, Science and Arts occupations in Isabela Municipio are Community & Social Service (1,254 | 10.1%), Education Instruction & Library (860 | 7.0%), Health Diagnosing & Treating (792 | 6.4%), Computers, Engineering & Science (615 | 5.0%), and Management (612 | 5.0%).
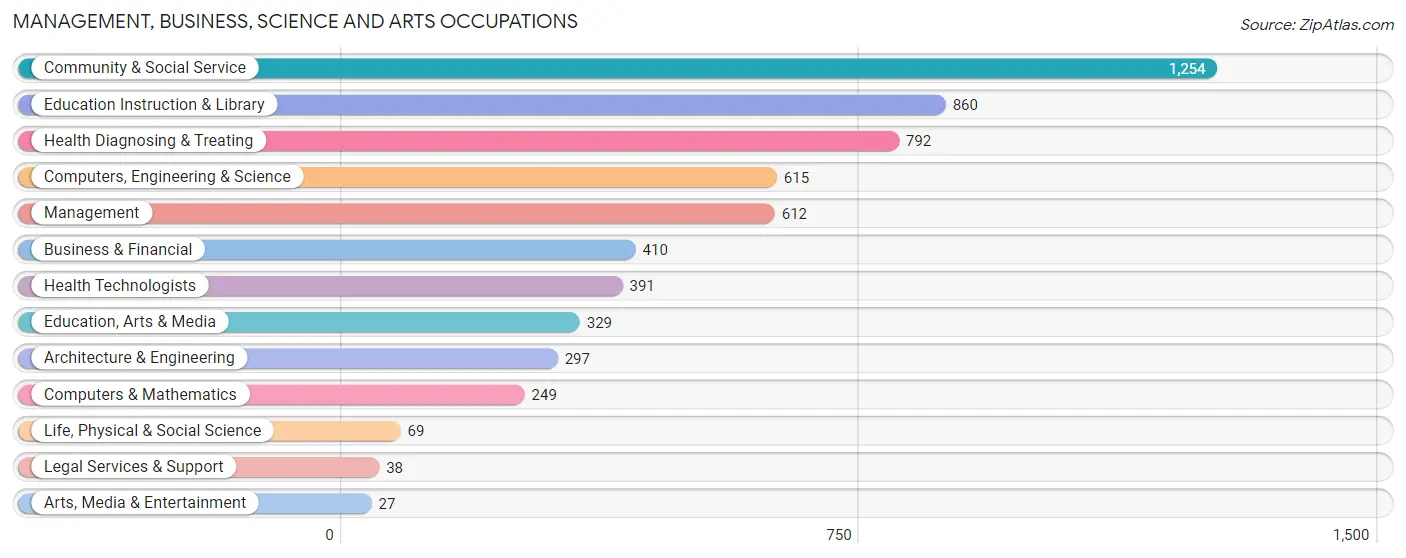
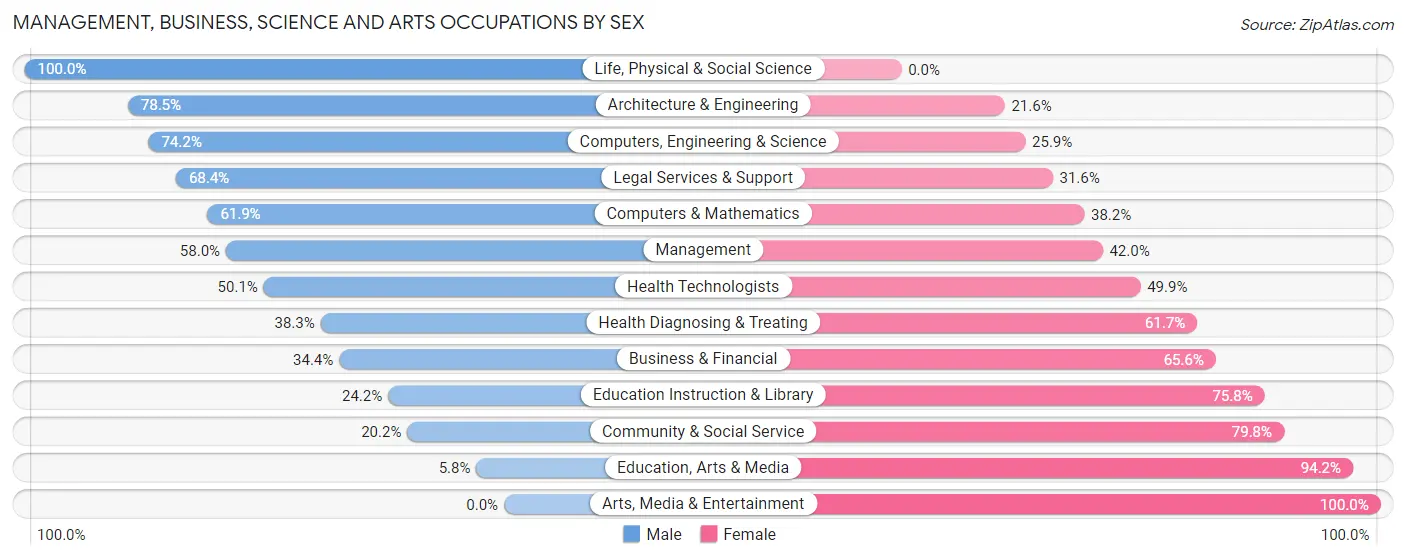
Management, Business, Science and Arts Occupations by Sex
Within the Management, Business, Science and Arts occupations in Isabela Municipio, the most male-oriented occupations are Life, Physical & Social Science (100.0%), Architecture & Engineering (78.4%), and Computers, Engineering & Science (74.2%), while the most female-oriented occupations are Arts, Media & Entertainment (100.0%), Education, Arts & Media (94.2%), and Community & Social Service (79.8%).
| Occupation | Male | Female |
| Management | 355 (58.0%) | 257 (42.0%) |
| Business & Financial | 141 (34.4%) | 269 (65.6%) |
| Computers, Engineering & Science | 456 (74.2%) | 159 (25.9%) |
| Computers & Mathematics | 154 (61.9%) | 95 (38.2%) |
| Architecture & Engineering | 233 (78.4%) | 64 (21.5%) |
| Life, Physical & Social Science | 69 (100.0%) | 0 (0.0%) |
| Community & Social Service | 253 (20.2%) | 1,001 (79.8%) |
| Education, Arts & Media | 19 (5.8%) | 310 (94.2%) |
| Legal Services & Support | 26 (68.4%) | 12 (31.6%) |
| Education Instruction & Library | 208 (24.2%) | 652 (75.8%) |
| Arts, Media & Entertainment | 0 (0.0%) | 27 (100.0%) |
| Health Diagnosing & Treating | 303 (38.3%) | 489 (61.7%) |
| Health Technologists | 196 (50.1%) | 195 (49.9%) |
| Total (Category) | 1,508 (40.9%) | 2,175 (59.1%) |
| Total (Overall) | 6,615 (53.5%) | 5,757 (46.5%) |
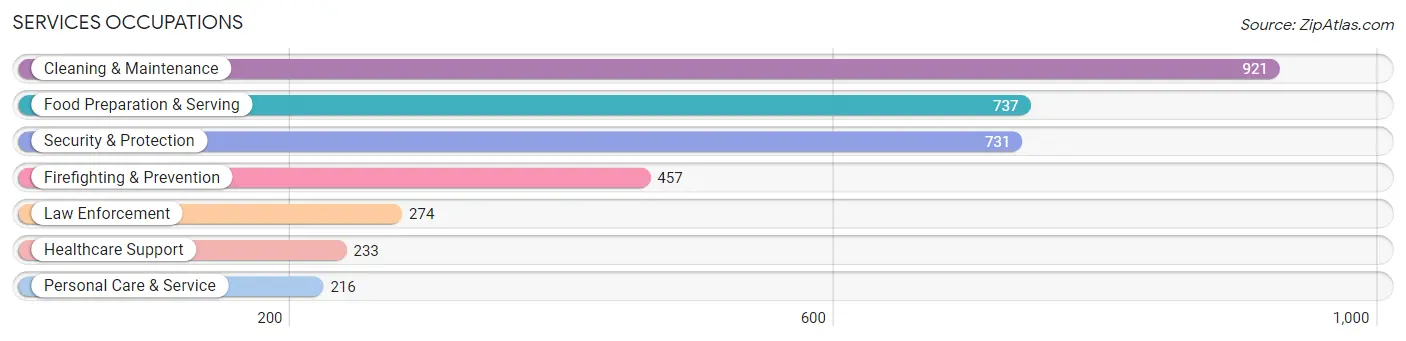
Services Occupations
The most common Services occupations in Isabela Municipio are Cleaning & Maintenance (921 | 7.4%), Food Preparation & Serving (737 | 6.0%), Security & Protection (731 | 5.9%), Firefighting & Prevention (457 | 3.7%), and Law Enforcement (274 | 2.2%).
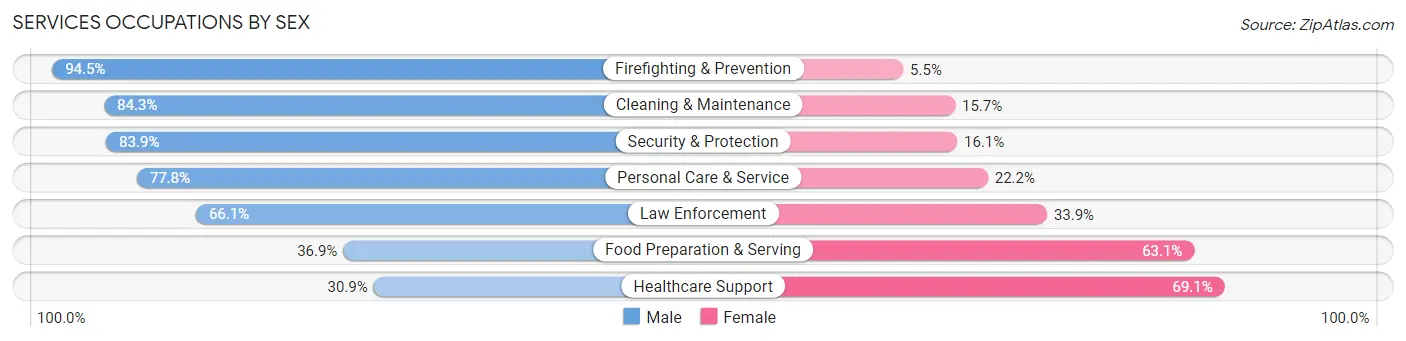
Services Occupations by Sex
Within the Services occupations in Isabela Municipio, the most male-oriented occupations are Firefighting & Prevention (94.5%), Cleaning & Maintenance (84.3%), and Security & Protection (83.9%), while the most female-oriented occupations are Healthcare Support (69.1%), Food Preparation & Serving (63.1%), and Law Enforcement (33.9%).
| Occupation | Male | Female |
| Healthcare Support | 72 (30.9%) | 161 (69.1%) |
| Security & Protection | 613 (83.9%) | 118 (16.1%) |
| Firefighting & Prevention | 432 (94.5%) | 25 (5.5%) |
| Law Enforcement | 181 (66.1%) | 93 (33.9%) |
| Food Preparation & Serving | 272 (36.9%) | 465 (63.1%) |
| Cleaning & Maintenance | 776 (84.3%) | 145 (15.7%) |
| Personal Care & Service | 168 (77.8%) | 48 (22.2%) |
| Total (Category) | 1,901 (67.0%) | 937 (33.0%) |
| Total (Overall) | 6,615 (53.5%) | 5,757 (46.5%) |
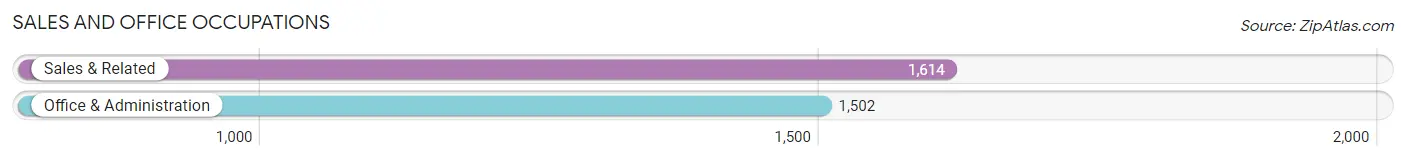
Sales and Office Occupations
The most common Sales and Office occupations in Isabela Municipio are Sales & Related (1,614 | 13.1%), and Office & Administration (1,502 | 12.1%).
Sales and Office Occupations by Sex
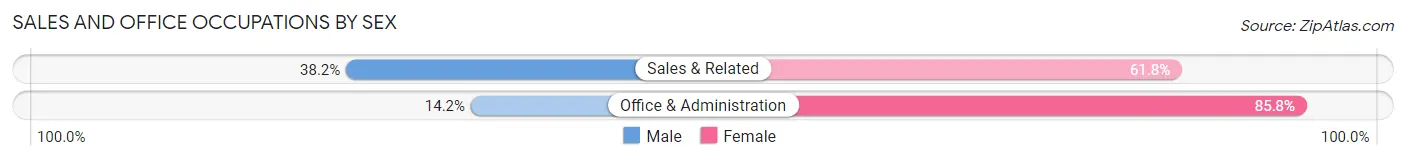
| Occupation | Male | Female |
| Sales & Related | 616 (38.2%) | 998 (61.8%) |
| Office & Administration | 213 (14.2%) | 1,289 (85.8%) |
| Total (Category) | 829 (26.6%) | 2,287 (73.4%) |
| Total (Overall) | 6,615 (53.5%) | 5,757 (46.5%) |
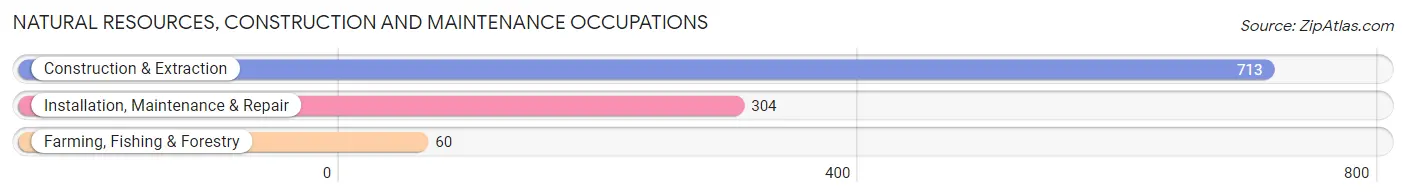
Natural Resources, Construction and Maintenance Occupations
The most common Natural Resources, Construction and Maintenance occupations in Isabela Municipio are Construction & Extraction (713 | 5.8%), Installation, Maintenance & Repair (304 | 2.5%), and Farming, Fishing & Forestry (60 | 0.5%).
Natural Resources, Construction and Maintenance Occupations by Sex
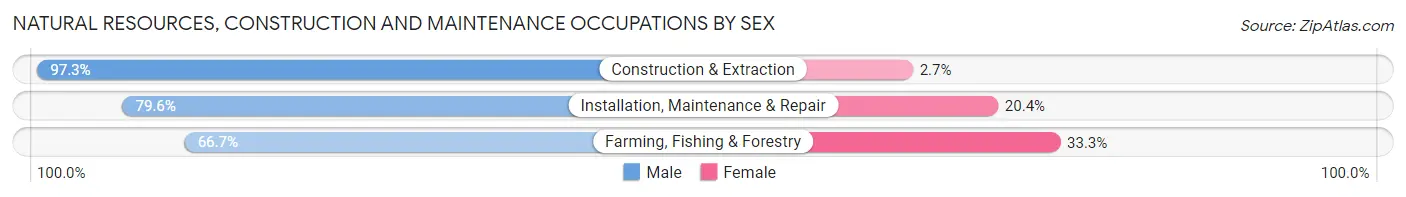
| Occupation | Male | Female |
| Farming, Fishing & Forestry | 40 (66.7%) | 20 (33.3%) |
| Construction & Extraction | 694 (97.3%) | 19 (2.7%) |
| Installation, Maintenance & Repair | 242 (79.6%) | 62 (20.4%) |
| Total (Category) | 976 (90.6%) | 101 (9.4%) |
| Total (Overall) | 6,615 (53.5%) | 5,757 (46.5%) |
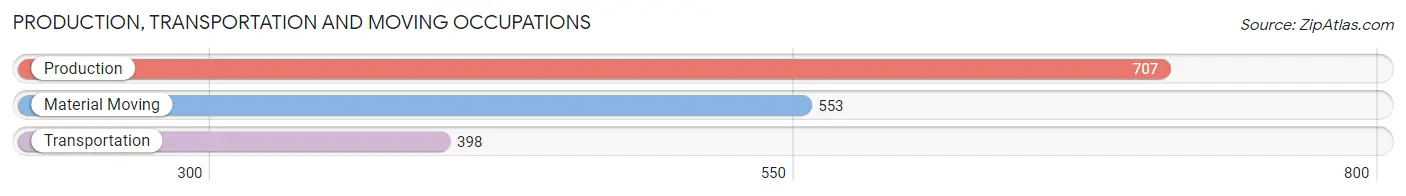
Production, Transportation and Moving Occupations
The most common Production, Transportation and Moving occupations in Isabela Municipio are Production (707 | 5.7%), Material Moving (553 | 4.5%), and Transportation (398 | 3.2%).
Production, Transportation and Moving Occupations by Sex
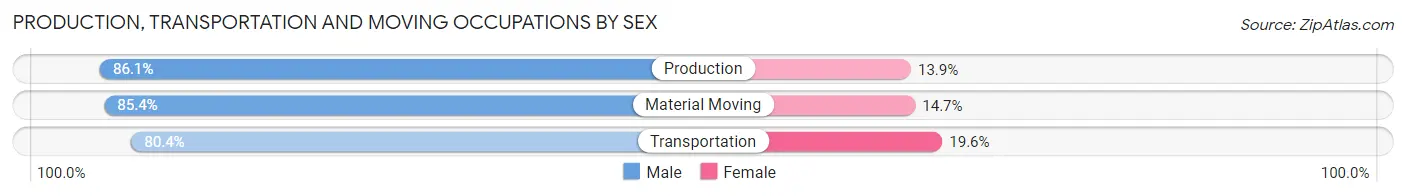
| Occupation | Male | Female |
| Production | 609 (86.1%) | 98 (13.9%) |
| Transportation | 320 (80.4%) | 78 (19.6%) |
| Material Moving | 472 (85.4%) | 81 (14.6%) |
| Total (Category) | 1,401 (84.5%) | 257 (15.5%) |
| Total (Overall) | 6,615 (53.5%) | 5,757 (46.5%) |
Employment Industries by Sex in Isabela Municipio
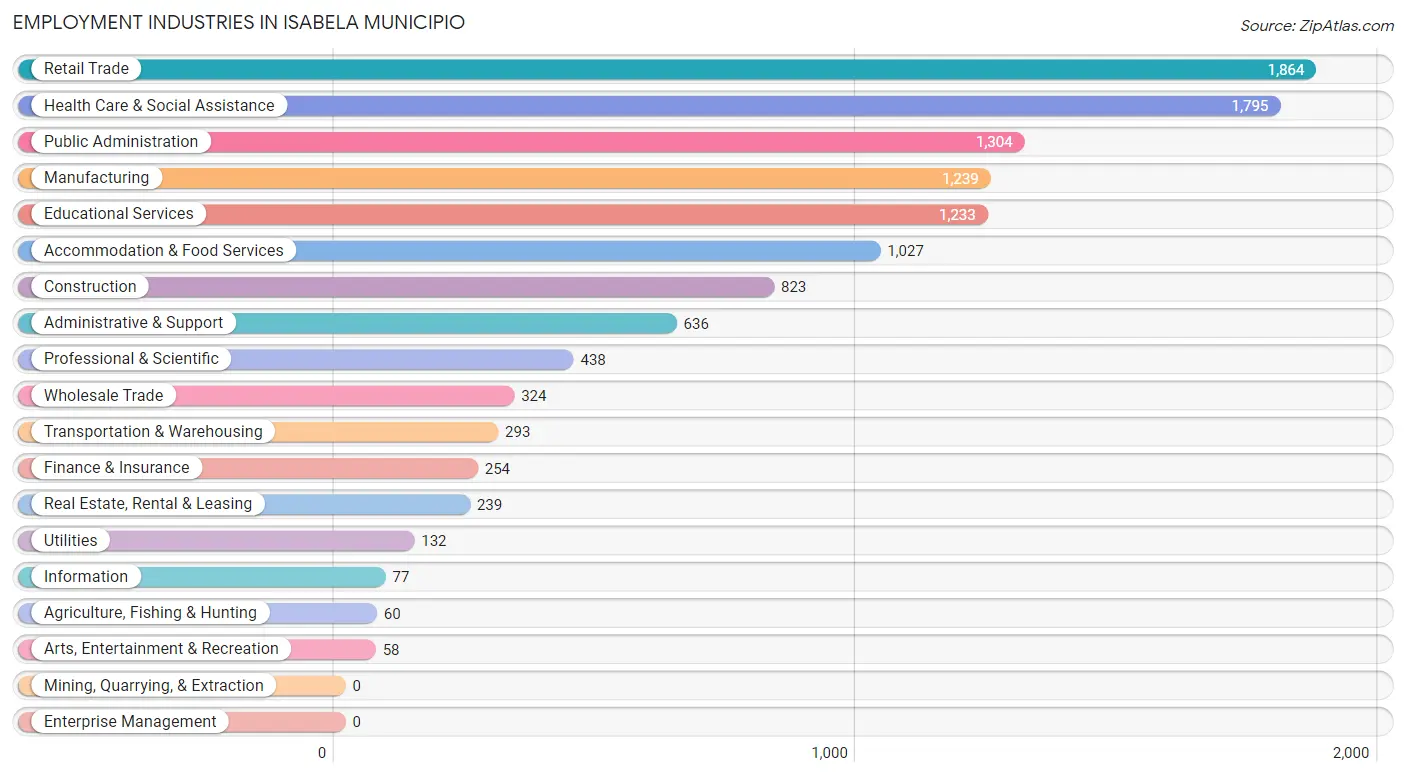
Employment Industries in Isabela Municipio
The major employment industries in Isabela Municipio include Retail Trade (1,864 | 15.1%), Health Care & Social Assistance (1,795 | 14.5%), Public Administration (1,304 | 10.5%), Manufacturing (1,239 | 10.0%), and Educational Services (1,233 | 10.0%).
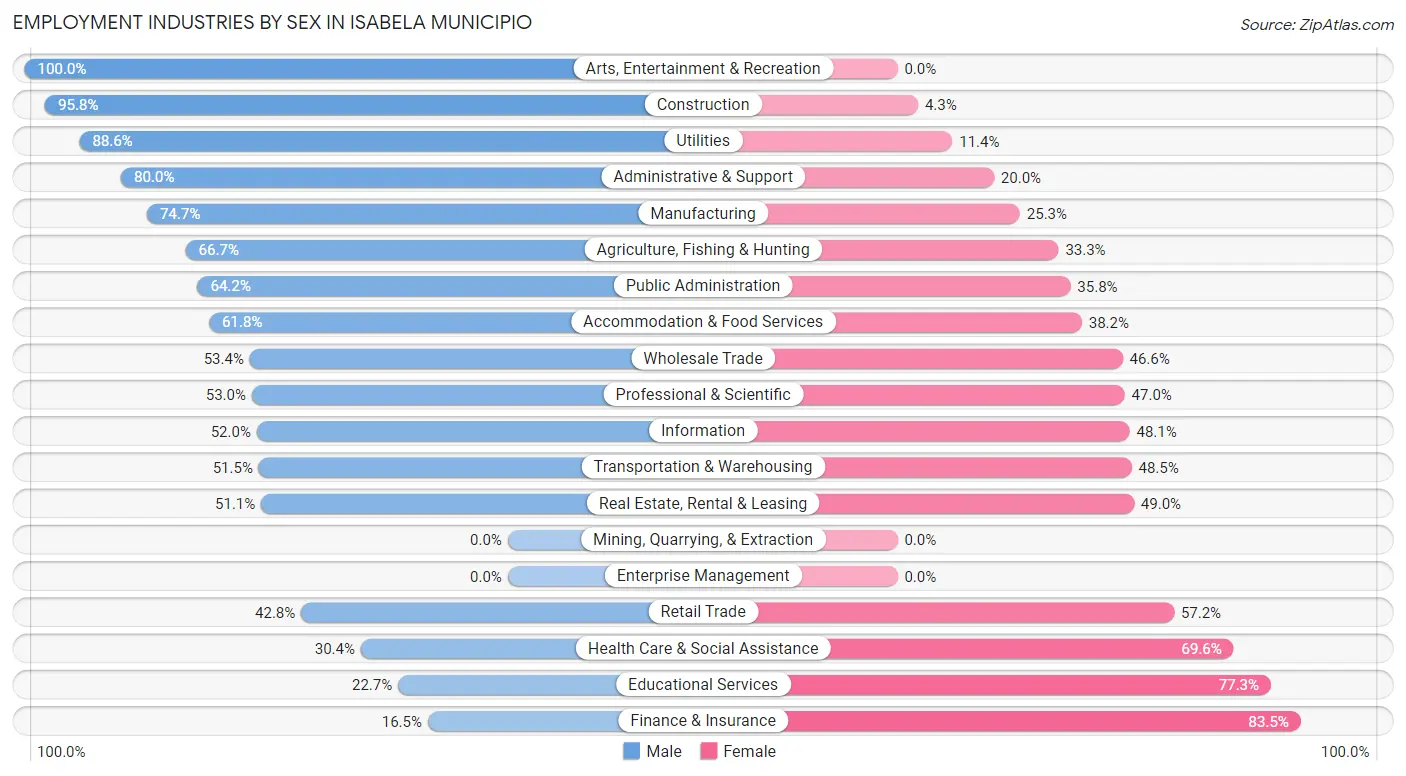
Employment Industries by Sex in Isabela Municipio
The Isabela Municipio industries that see more men than women are Arts, Entertainment & Recreation (100.0%), Construction (95.8%), and Utilities (88.6%), whereas the industries that tend to have a higher number of women are Finance & Insurance (83.5%), Educational Services (77.3%), and Health Care & Social Assistance (69.6%).
| Industry | Male | Female |
| Agriculture, Fishing & Hunting | 40 (66.7%) | 20 (33.3%) |
| Mining, Quarrying, & Extraction | 0 (0.0%) | 0 (0.0%) |
| Construction | 788 (95.8%) | 35 (4.3%) |
| Manufacturing | 925 (74.7%) | 314 (25.3%) |
| Wholesale Trade | 173 (53.4%) | 151 (46.6%) |
| Retail Trade | 797 (42.8%) | 1,067 (57.2%) |
| Transportation & Warehousing | 151 (51.5%) | 142 (48.5%) |
| Utilities | 117 (88.6%) | 15 (11.4%) |
| Information | 40 (51.9%) | 37 (48.0%) |
| Finance & Insurance | 42 (16.5%) | 212 (83.5%) |
| Real Estate, Rental & Leasing | 122 (51.0%) | 117 (48.9%) |
| Professional & Scientific | 232 (53.0%) | 206 (47.0%) |
| Enterprise Management | 0 (0.0%) | 0 (0.0%) |
| Administrative & Support | 509 (80.0%) | 127 (20.0%) |
| Educational Services | 280 (22.7%) | 953 (77.3%) |
| Health Care & Social Assistance | 546 (30.4%) | 1,249 (69.6%) |
| Arts, Entertainment & Recreation | 58 (100.0%) | 0 (0.0%) |
| Accommodation & Food Services | 635 (61.8%) | 392 (38.2%) |
| Public Administration | 837 (64.2%) | 467 (35.8%) |
| Total | 6,615 (53.5%) | 5,757 (46.5%) |
Education in Isabela Municipio
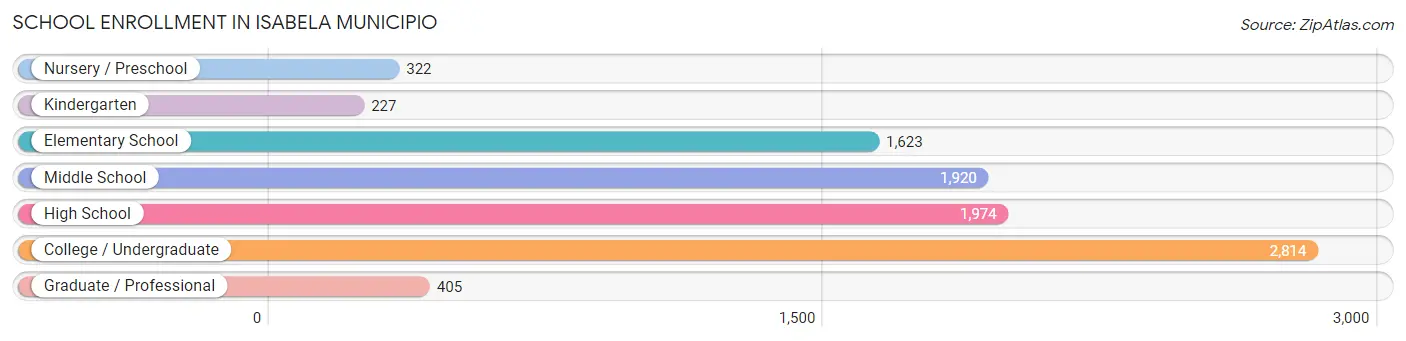
School Enrollment in Isabela Municipio
The most common levels of schooling among the 9,285 students in Isabela Municipio are college / undergraduate (2,814 | 30.3%), high school (1,974 | 21.3%), and middle school (1,920 | 20.7%).
| School Level | # Students | % Students |
| Nursery / Preschool | 322 | 3.5% |
| Kindergarten | 227 | 2.4% |
| Elementary School | 1,623 | 17.5% |
| Middle School | 1,920 | 20.7% |
| High School | 1,974 | 21.3% |
| College / Undergraduate | 2,814 | 30.3% |
| Graduate / Professional | 405 | 4.4% |
| Total | 9,285 | 100.0% |
School Enrollment by Age by Funding Source in Isabela Municipio
Out of a total of 9,285 students who are enrolled in schools in Isabela Municipio, 3,213 (34.6%) attend a private institution, while the remaining 6,072 (65.4%) are enrolled in public schools. The age group of 25 to 34 year olds has the highest likelihood of being enrolled in private schools, with 567 (87.0% in the age bracket) enrolled. Conversely, the age group of 3 to 4 year olds has the lowest likelihood of being enrolled in a private school, with 262 (88.8% in the age bracket) attending a public institution.
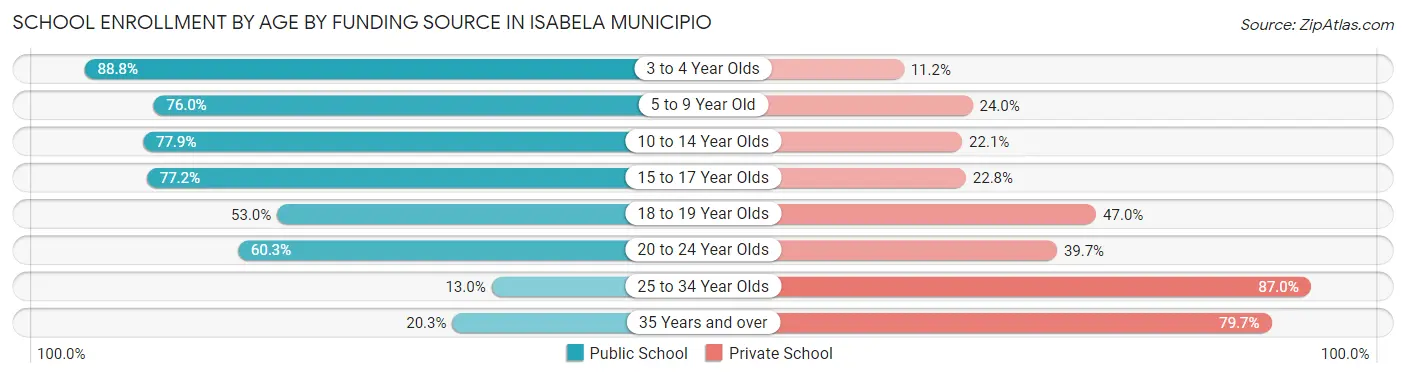
| Age Bracket | Public School | Private School |
| 3 to 4 Year Olds | 262 (88.8%) | 33 (11.2%) |
| 5 to 9 Year Old | 1,346 (76.0%) | 425 (24.0%) |
| 10 to 14 Year Olds | 1,819 (77.9%) | 515 (22.1%) |
| 15 to 17 Year Olds | 1,110 (77.2%) | 327 (22.8%) |
| 18 to 19 Year Olds | 383 (53.0%) | 340 (47.0%) |
| 20 to 24 Year Olds | 968 (60.3%) | 638 (39.7%) |
| 25 to 34 Year Olds | 85 (13.0%) | 567 (87.0%) |
| 35 Years and over | 95 (20.3%) | 372 (79.7%) |
| Total | 6,072 (65.4%) | 3,213 (34.6%) |
Educational Attainment by Field of Study in Isabela Municipio
Business (2,336 | 28.4%), education (1,469 | 17.9%), science & technology (1,116 | 13.6%), arts & humanities (830 | 10.1%), and engineering (567 | 6.9%) are the most common fields of study among 8,224 individuals in Isabela Municipio who have obtained a bachelor's degree or higher.
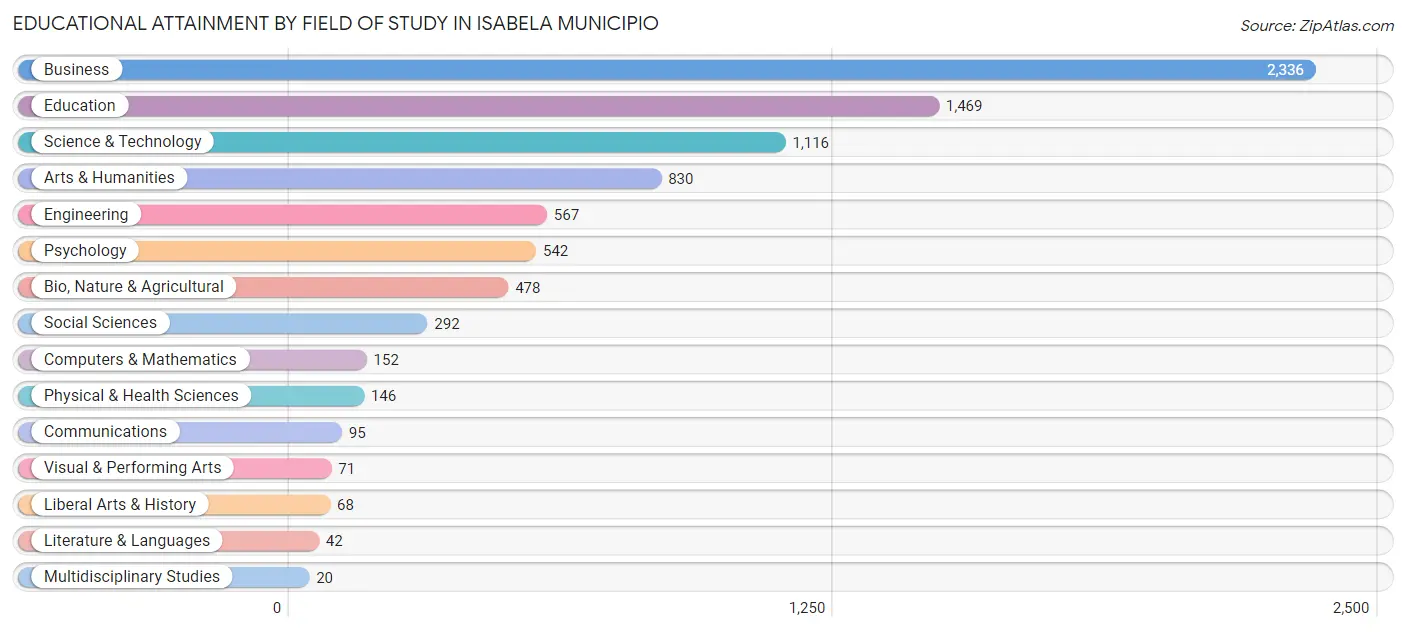
| Field of Study | # Graduates | % Graduates |
| Computers & Mathematics | 152 | 1.8% |
| Bio, Nature & Agricultural | 478 | 5.8% |
| Physical & Health Sciences | 146 | 1.8% |
| Psychology | 542 | 6.6% |
| Social Sciences | 292 | 3.5% |
| Engineering | 567 | 6.9% |
| Multidisciplinary Studies | 20 | 0.2% |
| Science & Technology | 1,116 | 13.6% |
| Business | 2,336 | 28.4% |
| Education | 1,469 | 17.9% |
| Literature & Languages | 42 | 0.5% |
| Liberal Arts & History | 68 | 0.8% |
| Visual & Performing Arts | 71 | 0.9% |
| Communications | 95 | 1.2% |
| Arts & Humanities | 830 | 10.1% |
| Total | 8,224 | 100.0% |
Transportation & Commute in Isabela Municipio
Vehicle Availability by Sex in Isabela Municipio
The most prevalent vehicle ownership categories in Isabela Municipio are males with 2 vehicles (2,769, accounting for 41.9%) and females with 2 vehicles (2,154, making up 49.1%).
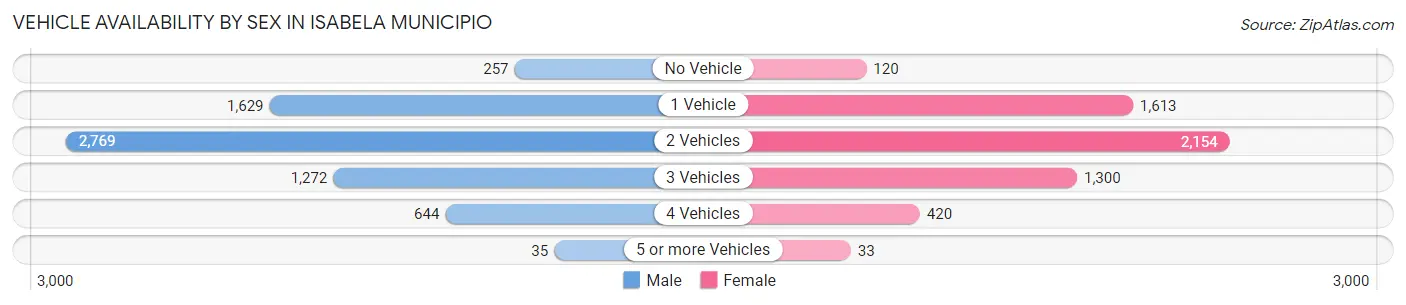
| Vehicles Available | Male | Female |
| No Vehicle | 257 (3.9%) | 120 (2.1%) |
| 1 Vehicle | 1,629 (24.7%) | 1,613 (28.6%) |
| 2 Vehicles | 2,769 (41.9%) | 2,154 (38.2%) |
| 3 Vehicles | 1,272 (19.3%) | 1,300 (23.1%) |
| 4 Vehicles | 644 (9.8%) | 420 (7.4%) |
| 5 or more Vehicles | 35 (0.5%) | 33 (0.6%) |
| Total | 6,606 (100.0%) | 5,640 (100.0%) |
Commute Time in Isabela Municipio
The most frequently occuring commute durations in Isabela Municipio are 20 to 24 minutes (2,671 commuters, 22.4%), 15 to 19 minutes (1,726 commuters, 14.5%), and 10 to 14 minutes (1,386 commuters, 11.7%).
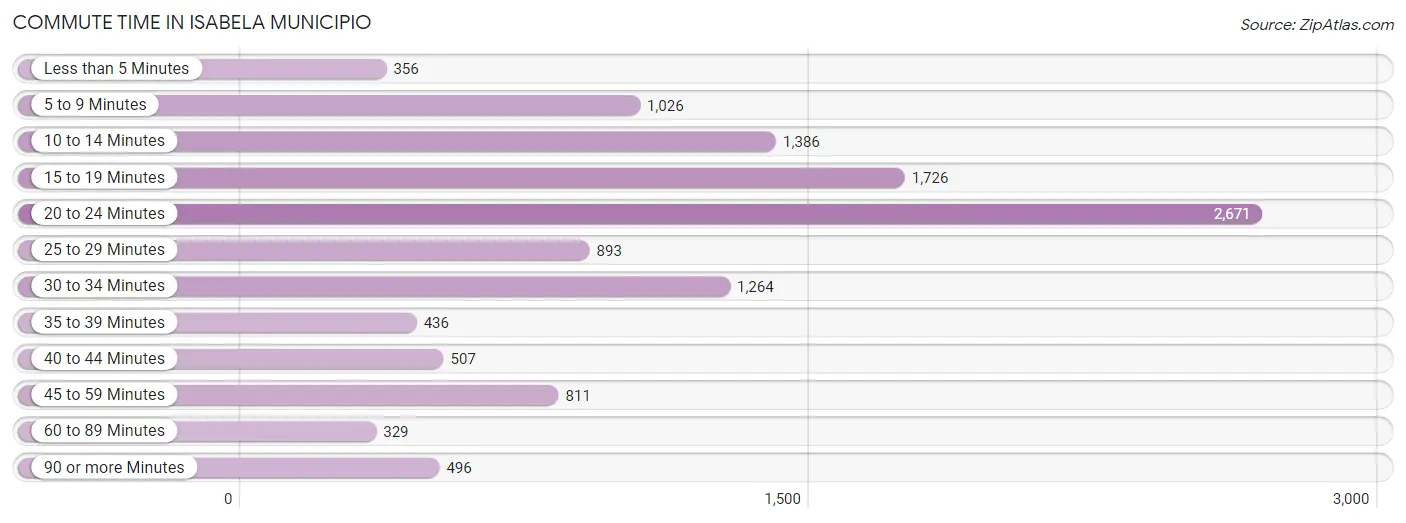
| Commute Time | # Commuters | % Commuters |
| Less than 5 Minutes | 356 | 3.0% |
| 5 to 9 Minutes | 1,026 | 8.6% |
| 10 to 14 Minutes | 1,386 | 11.7% |
| 15 to 19 Minutes | 1,726 | 14.5% |
| 20 to 24 Minutes | 2,671 | 22.4% |
| 25 to 29 Minutes | 893 | 7.5% |
| 30 to 34 Minutes | 1,264 | 10.6% |
| 35 to 39 Minutes | 436 | 3.7% |
| 40 to 44 Minutes | 507 | 4.3% |
| 45 to 59 Minutes | 811 | 6.8% |
| 60 to 89 Minutes | 329 | 2.8% |
| 90 or more Minutes | 496 | 4.2% |
Commute Time by Sex in Isabela Municipio
The most common commute times in Isabela Municipio are 20 to 24 minutes (1,690 commuters, 26.2%) for males and 20 to 24 minutes (981 commuters, 18.0%) for females.
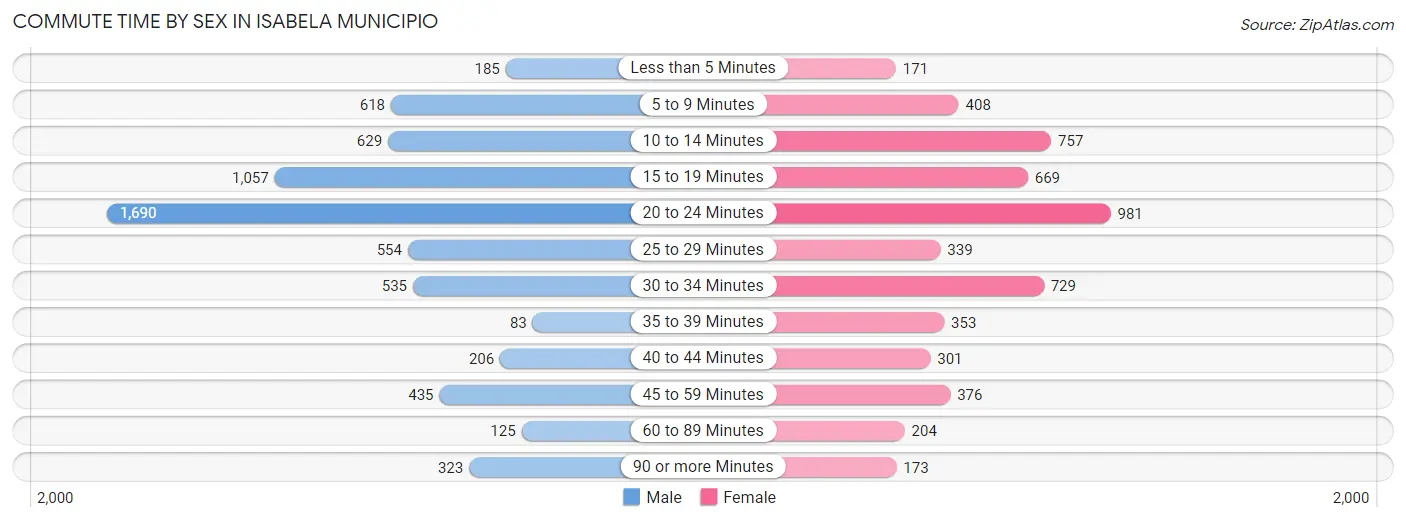
| Commute Time | Male | Female |
| Less than 5 Minutes | 185 (2.9%) | 171 (3.1%) |
| 5 to 9 Minutes | 618 (9.6%) | 408 (7.5%) |
| 10 to 14 Minutes | 629 (9.8%) | 757 (13.9%) |
| 15 to 19 Minutes | 1,057 (16.4%) | 669 (12.2%) |
| 20 to 24 Minutes | 1,690 (26.2%) | 981 (18.0%) |
| 25 to 29 Minutes | 554 (8.6%) | 339 (6.2%) |
| 30 to 34 Minutes | 535 (8.3%) | 729 (13.4%) |
| 35 to 39 Minutes | 83 (1.3%) | 353 (6.5%) |
| 40 to 44 Minutes | 206 (3.2%) | 301 (5.5%) |
| 45 to 59 Minutes | 435 (6.8%) | 376 (6.9%) |
| 60 to 89 Minutes | 125 (1.9%) | 204 (3.7%) |
| 90 or more Minutes | 323 (5.0%) | 173 (3.2%) |
Time of Departure to Work by Sex in Isabela Municipio
The most frequent times of departure to work in Isabela Municipio are 7:00 AM to 7:29 AM (1,987, 30.8%) for males and 7:00 AM to 7:29 AM (1,548, 28.3%) for females.
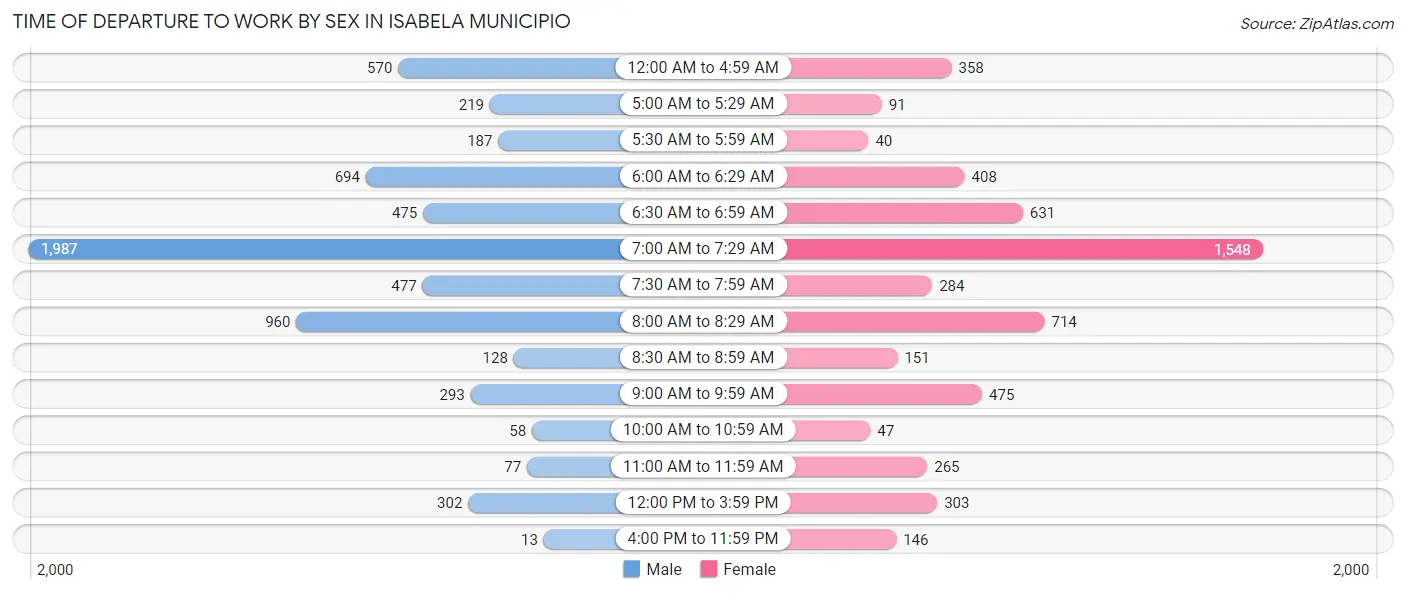
| Time of Departure | Male | Female |
| 12:00 AM to 4:59 AM | 570 (8.8%) | 358 (6.6%) |
| 5:00 AM to 5:29 AM | 219 (3.4%) | 91 (1.7%) |
| 5:30 AM to 5:59 AM | 187 (2.9%) | 40 (0.7%) |
| 6:00 AM to 6:29 AM | 694 (10.8%) | 408 (7.5%) |
| 6:30 AM to 6:59 AM | 475 (7.4%) | 631 (11.6%) |
| 7:00 AM to 7:29 AM | 1,987 (30.8%) | 1,548 (28.3%) |
| 7:30 AM to 7:59 AM | 477 (7.4%) | 284 (5.2%) |
| 8:00 AM to 8:29 AM | 960 (14.9%) | 714 (13.1%) |
| 8:30 AM to 8:59 AM | 128 (2.0%) | 151 (2.8%) |
| 9:00 AM to 9:59 AM | 293 (4.5%) | 475 (8.7%) |
| 10:00 AM to 10:59 AM | 58 (0.9%) | 47 (0.9%) |
| 11:00 AM to 11:59 AM | 77 (1.2%) | 265 (4.9%) |
| 12:00 PM to 3:59 PM | 302 (4.7%) | 303 (5.6%) |
| 4:00 PM to 11:59 PM | 13 (0.2%) | 146 (2.7%) |
| Total | 6,440 (100.0%) | 5,461 (100.0%) |
Housing Occupancy in Isabela Municipio
Occupancy by Ownership in Isabela Municipio
Of the total 14,843 dwellings in Isabela Municipio, owner-occupied units account for 8,825 (59.5%), while renter-occupied units make up 6,018 (40.5%).
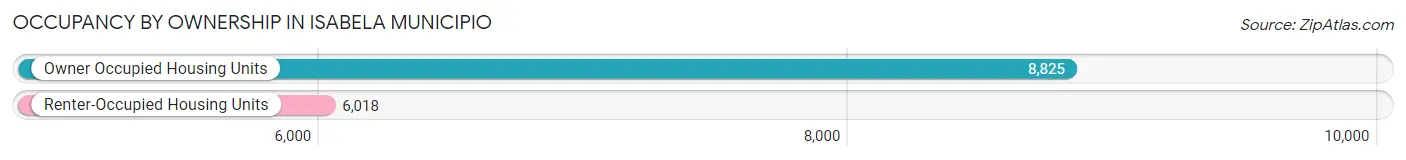
| Occupancy | # Housing Units | % Housing Units |
| Owner Occupied Housing Units | 8,825 | 59.5% |
| Renter-Occupied Housing Units | 6,018 | 40.5% |
| Total Occupied Housing Units | 14,843 | 100.0% |
Occupancy by Household Size in Isabela Municipio
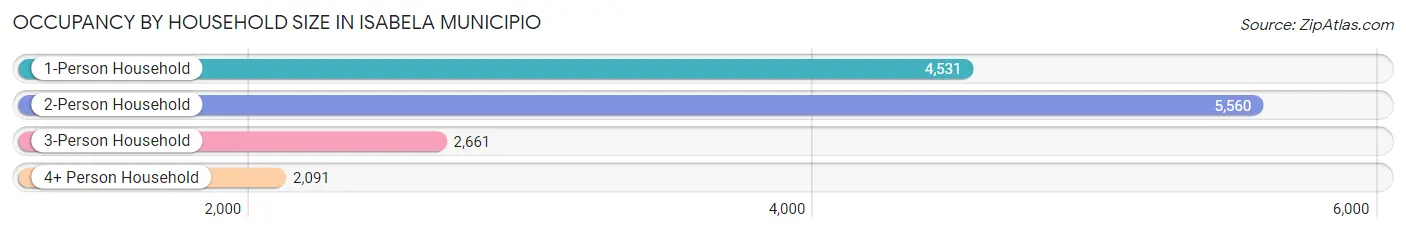
| Household Size | # Housing Units | % Housing Units |
| 1-Person Household | 4,531 | 30.5% |
| 2-Person Household | 5,560 | 37.5% |
| 3-Person Household | 2,661 | 17.9% |
| 4+ Person Household | 2,091 | 14.1% |
| Total Housing Units | 14,843 | 100.0% |
Occupancy by Ownership by Household Size in Isabela Municipio
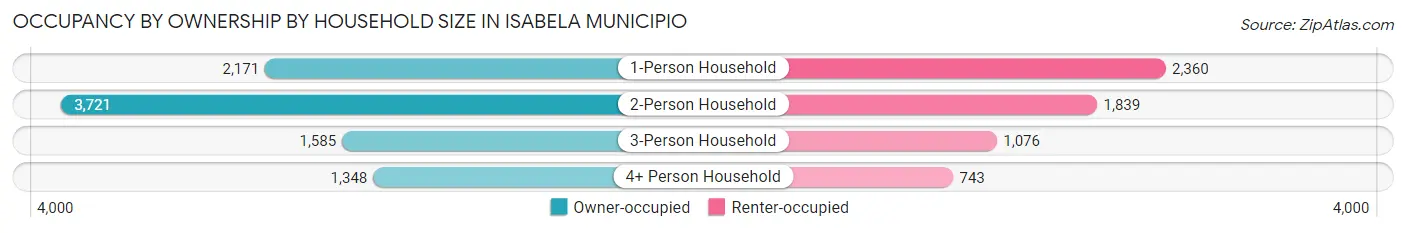
| Household Size | Owner-occupied | Renter-occupied |
| 1-Person Household | 2,171 (47.9%) | 2,360 (52.1%) |
| 2-Person Household | 3,721 (66.9%) | 1,839 (33.1%) |
| 3-Person Household | 1,585 (59.6%) | 1,076 (40.4%) |
| 4+ Person Household | 1,348 (64.5%) | 743 (35.5%) |
| Total Housing Units | 8,825 (59.5%) | 6,018 (40.5%) |
Occupancy by Educational Attainment in Isabela Municipio
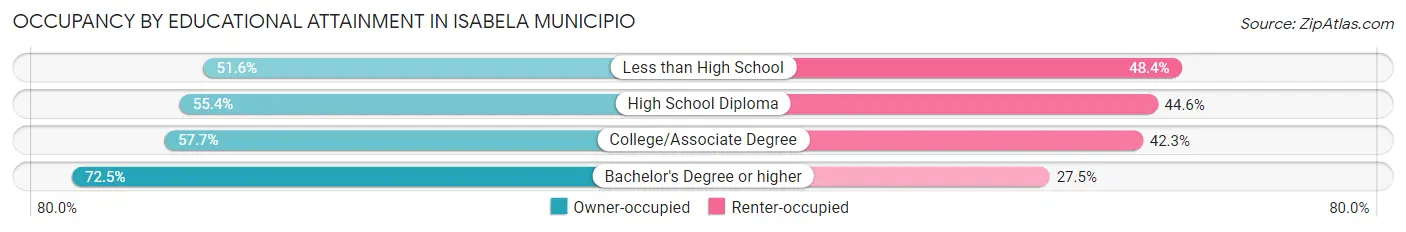
| Household Size | Owner-occupied | Renter-occupied |
| Less than High School | 1,836 (51.6%) | 1,723 (48.4%) |
| High School Diploma | 2,360 (55.4%) | 1,903 (44.6%) |
| College/Associate Degree | 1,796 (57.7%) | 1,316 (42.3%) |
| Bachelor's Degree or higher | 2,833 (72.5%) | 1,076 (27.5%) |
Occupancy by Age of Householder in Isabela Municipio
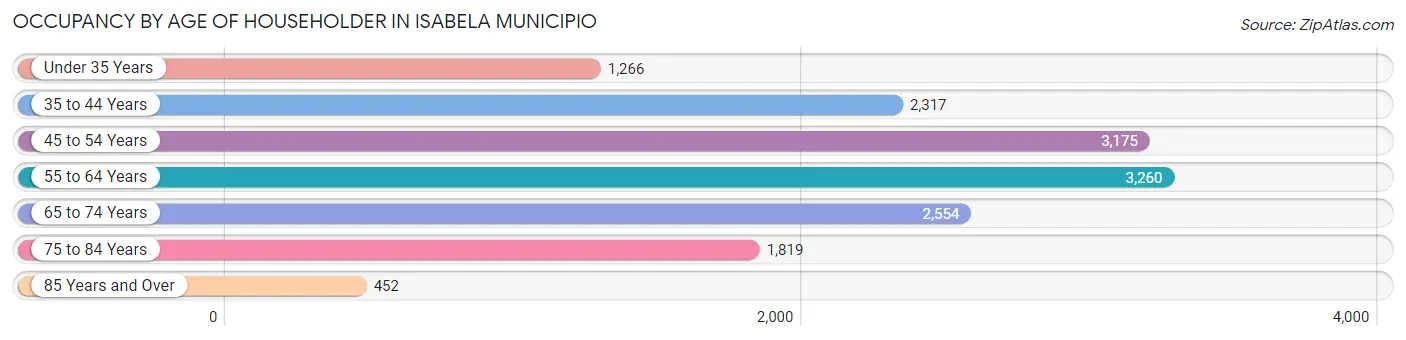
| Age Bracket | # Households | % Households |
| Under 35 Years | 1,266 | 8.5% |
| 35 to 44 Years | 2,317 | 15.6% |
| 45 to 54 Years | 3,175 | 21.4% |
| 55 to 64 Years | 3,260 | 22.0% |
| 65 to 74 Years | 2,554 | 17.2% |
| 75 to 84 Years | 1,819 | 12.2% |
| 85 Years and Over | 452 | 3.0% |
| Total | 14,843 | 100.0% |
Housing Finances in Isabela Municipio
Median Income by Occupancy in Isabela Municipio
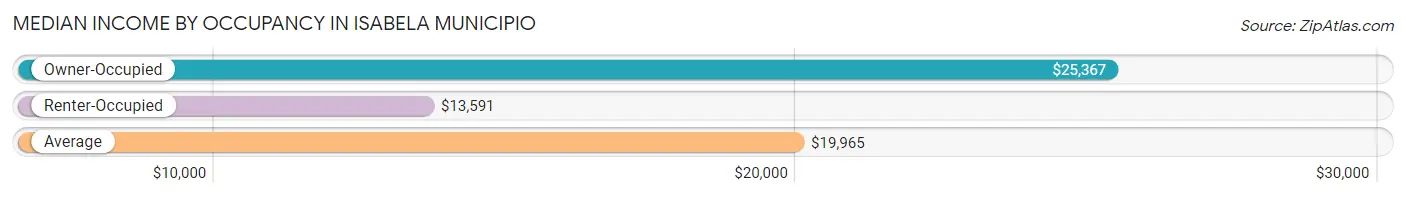
| Occupancy Type | # Households | Median Income |
| Owner-Occupied | 8,825 (59.5%) | $25,367 |
| Renter-Occupied | 6,018 (40.5%) | $13,591 |
| Average | 14,843 (100.0%) | $19,965 |
Occupancy by Householder Income Bracket in Isabela Municipio
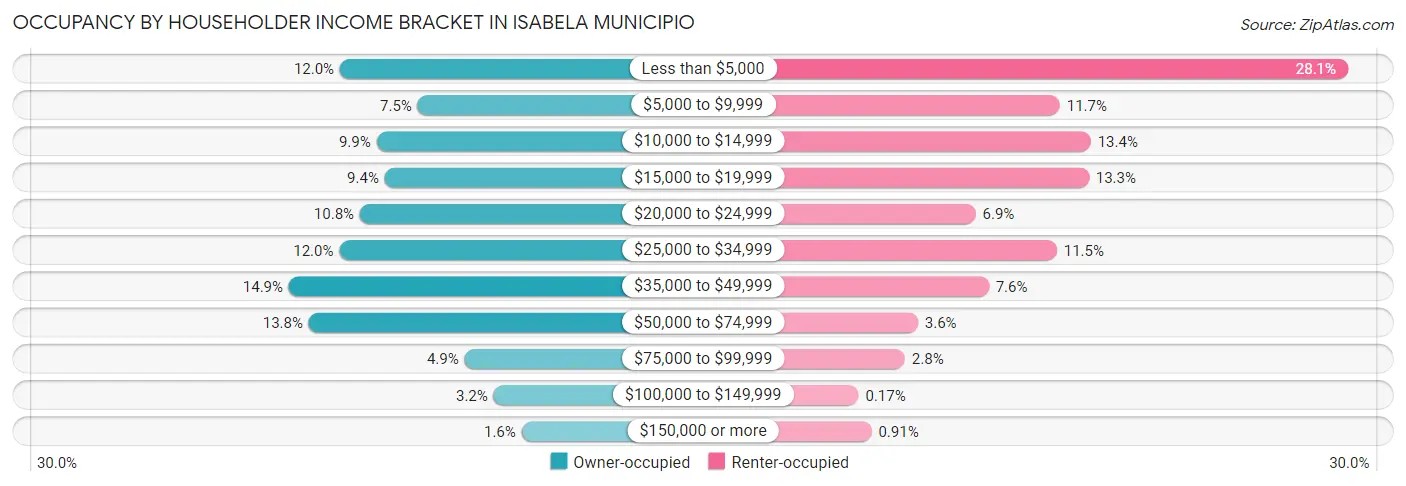
| Income Bracket | Owner-occupied | Renter-occupied |
| Less than $5,000 | 1,057 (12.0%) | 1,693 (28.1%) |
| $5,000 to $9,999 | 665 (7.5%) | 702 (11.7%) |
| $10,000 to $14,999 | 873 (9.9%) | 809 (13.4%) |
| $15,000 to $19,999 | 831 (9.4%) | 802 (13.3%) |
| $20,000 to $24,999 | 957 (10.8%) | 413 (6.9%) |
| $25,000 to $34,999 | 1,061 (12.0%) | 692 (11.5%) |
| $35,000 to $49,999 | 1,315 (14.9%) | 458 (7.6%) |
| $50,000 to $74,999 | 1,214 (13.8%) | 214 (3.6%) |
| $75,000 to $99,999 | 429 (4.9%) | 170 (2.8%) |
| $100,000 to $149,999 | 282 (3.2%) | 10 (0.2%) |
| $150,000 or more | 141 (1.6%) | 55 (0.9%) |
| Total | 8,825 (100.0%) | 6,018 (100.0%) |
Monthly Housing Cost Tiers in Isabela Municipio
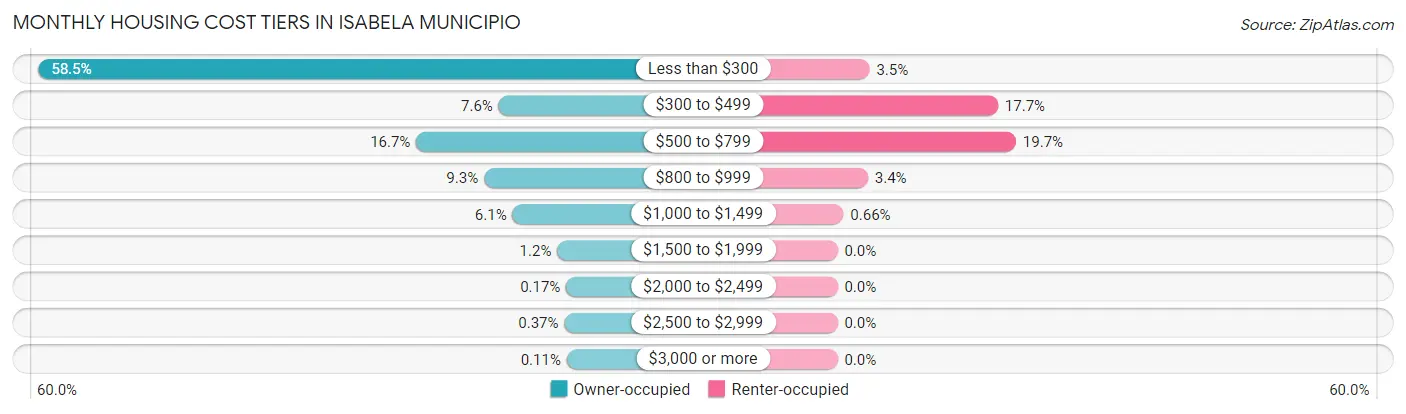
| Monthly Cost | Owner-occupied | Renter-occupied |
| Less than $300 | 5,161 (58.5%) | 213 (3.5%) |
| $300 to $499 | 673 (7.6%) | 1,067 (17.7%) |
| $500 to $799 | 1,477 (16.7%) | 1,187 (19.7%) |
| $800 to $999 | 816 (9.2%) | 202 (3.4%) |
| $1,000 to $1,499 | 538 (6.1%) | 40 (0.7%) |
| $1,500 to $1,999 | 102 (1.2%) | 0 (0.0%) |
| $2,000 to $2,499 | 15 (0.2%) | 0 (0.0%) |
| $2,500 to $2,999 | 33 (0.4%) | 0 (0.0%) |
| $3,000 or more | 10 (0.1%) | 0 (0.0%) |
| Total | 8,825 (100.0%) | 6,018 (100.0%) |
Physical Housing Characteristics in Isabela Municipio
Housing Structures in Isabela Municipio
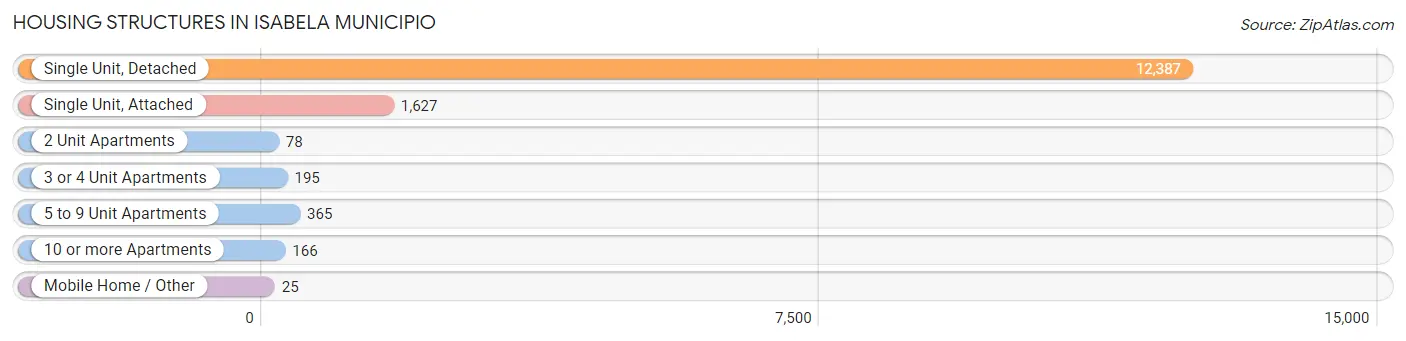
| Structure Type | # Housing Units | % Housing Units |
| Single Unit, Detached | 12,387 | 83.5% |
| Single Unit, Attached | 1,627 | 11.0% |
| 2 Unit Apartments | 78 | 0.5% |
| 3 or 4 Unit Apartments | 195 | 1.3% |
| 5 to 9 Unit Apartments | 365 | 2.5% |
| 10 or more Apartments | 166 | 1.1% |
| Mobile Home / Other | 25 | 0.2% |
| Total | 14,843 | 100.0% |
Housing Structures by Occupancy in Isabela Municipio
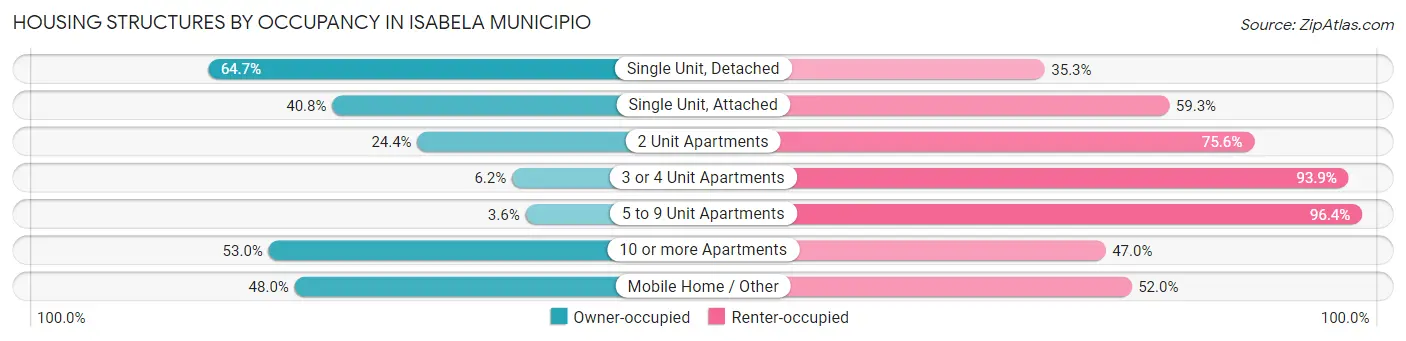
| Structure Type | Owner-occupied | Renter-occupied |
| Single Unit, Detached | 8,018 (64.7%) | 4,369 (35.3%) |
| Single Unit, Attached | 663 (40.7%) | 964 (59.3%) |
| 2 Unit Apartments | 19 (24.4%) | 59 (75.6%) |
| 3 or 4 Unit Apartments | 12 (6.1%) | 183 (93.9%) |
| 5 to 9 Unit Apartments | 13 (3.6%) | 352 (96.4%) |
| 10 or more Apartments | 88 (53.0%) | 78 (47.0%) |
| Mobile Home / Other | 12 (48.0%) | 13 (52.0%) |
| Total | 8,825 (59.5%) | 6,018 (40.5%) |
Housing Structures by Number of Rooms in Isabela Municipio
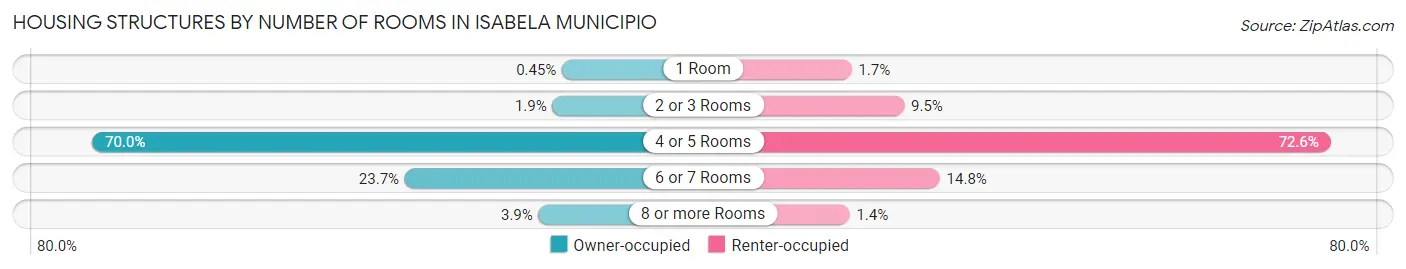
| Number of Rooms | Owner-occupied | Renter-occupied |
| 1 Room | 40 (0.4%) | 103 (1.7%) |
| 2 or 3 Rooms | 165 (1.9%) | 572 (9.5%) |
| 4 or 5 Rooms | 6,179 (70.0%) | 4,370 (72.6%) |
| 6 or 7 Rooms | 2,093 (23.7%) | 888 (14.8%) |
| 8 or more Rooms | 348 (3.9%) | 85 (1.4%) |
| Total | 8,825 (100.0%) | 6,018 (100.0%) |
Housing Structure by Heating Type in Isabela Municipio
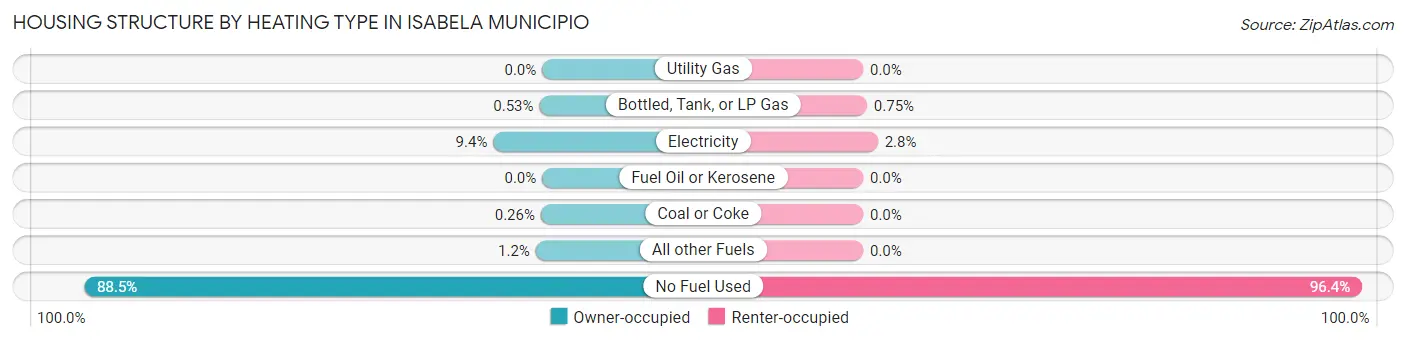
| Heating Type | Owner-occupied | Renter-occupied |
| Utility Gas | 0 (0.0%) | 0 (0.0%) |
| Bottled, Tank, or LP Gas | 47 (0.5%) | 45 (0.7%) |
| Electricity | 833 (9.4%) | 171 (2.8%) |
| Fuel Oil or Kerosene | 0 (0.0%) | 0 (0.0%) |
| Coal or Coke | 23 (0.3%) | 0 (0.0%) |
| All other Fuels | 109 (1.2%) | 0 (0.0%) |
| No Fuel Used | 7,813 (88.5%) | 5,802 (96.4%) |
| Total | 8,825 (100.0%) | 6,018 (100.0%) |
Household Vehicle Usage in Isabela Municipio
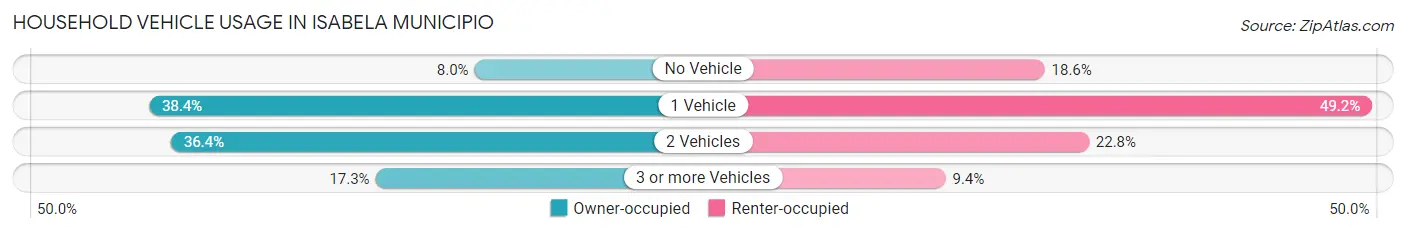
| Vehicles per Household | Owner-occupied | Renter-occupied |
| No Vehicle | 707 (8.0%) | 1,122 (18.6%) |
| 1 Vehicle | 3,388 (38.4%) | 2,961 (49.2%) |
| 2 Vehicles | 3,208 (36.3%) | 1,370 (22.8%) |
| 3 or more Vehicles | 1,522 (17.2%) | 565 (9.4%) |
| Total | 8,825 (100.0%) | 6,018 (100.0%) |
Real Estate & Mortgages in Isabela Municipio
Real Estate and Mortgage Overview in Isabela Municipio
| Characteristic | Without Mortgage | With Mortgage |
| Housing Units | 5,771 | 3,054 |
| Median Property Value | $110,000 | $143,000 |
| Median Household Income | $21,103 | $80 |
| Monthly Housing Costs | $148 | $0 |
| Real Estate Taxes | $535 | $2,832 |
Property Value by Mortgage Status in Isabela Municipio
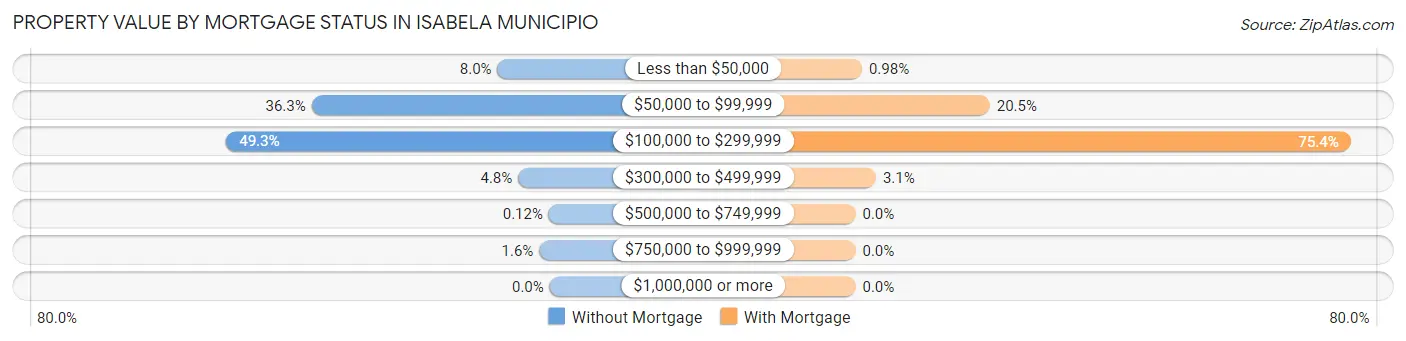
| Property Value | Without Mortgage | With Mortgage |
| Less than $50,000 | 459 (8.0%) | 30 (1.0%) |
| $50,000 to $99,999 | 2,093 (36.3%) | 625 (20.5%) |
| $100,000 to $299,999 | 2,843 (49.3%) | 2,304 (75.4%) |
| $300,000 to $499,999 | 277 (4.8%) | 95 (3.1%) |
| $500,000 to $749,999 | 7 (0.1%) | 0 (0.0%) |
| $750,000 to $999,999 | 92 (1.6%) | 0 (0.0%) |
| $1,000,000 or more | 0 (0.0%) | 0 (0.0%) |
| Total | 5,771 (100.0%) | 3,054 (100.0%) |
Household Income by Mortgage Status in Isabela Municipio
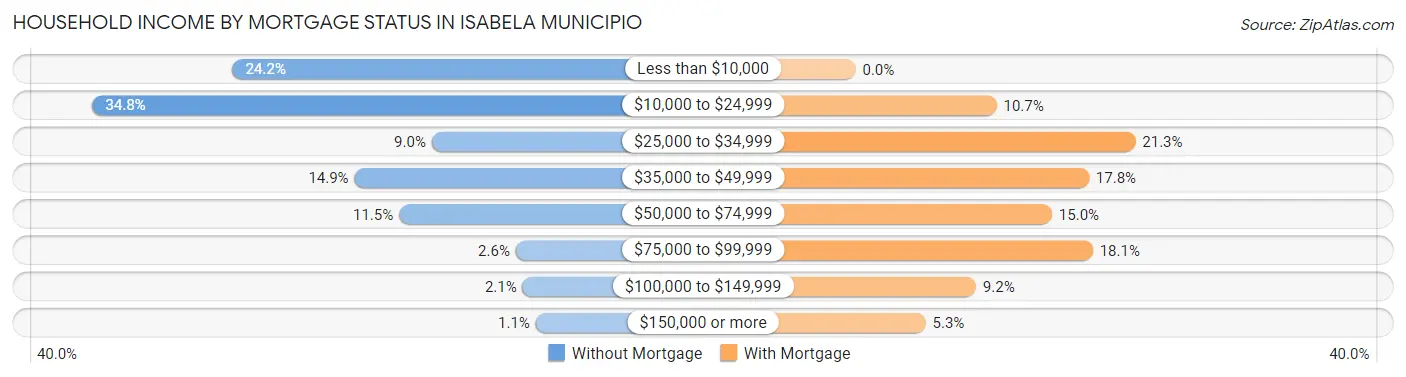
| Household Income | Without Mortgage | With Mortgage |
| Less than $10,000 | 1,394 (24.2%) | 0 (0.0%) |
| $10,000 to $24,999 | 2,010 (34.8%) | 328 (10.7%) |
| $25,000 to $34,999 | 518 (9.0%) | 651 (21.3%) |
| $35,000 to $49,999 | 858 (14.9%) | 543 (17.8%) |
| $50,000 to $74,999 | 662 (11.5%) | 457 (15.0%) |
| $75,000 to $99,999 | 149 (2.6%) | 552 (18.1%) |
| $100,000 to $149,999 | 119 (2.1%) | 280 (9.2%) |
| $150,000 or more | 61 (1.1%) | 163 (5.3%) |
| Total | 5,771 (100.0%) | 3,054 (100.0%) |
Property Value to Household Income Ratio in Isabela Municipio
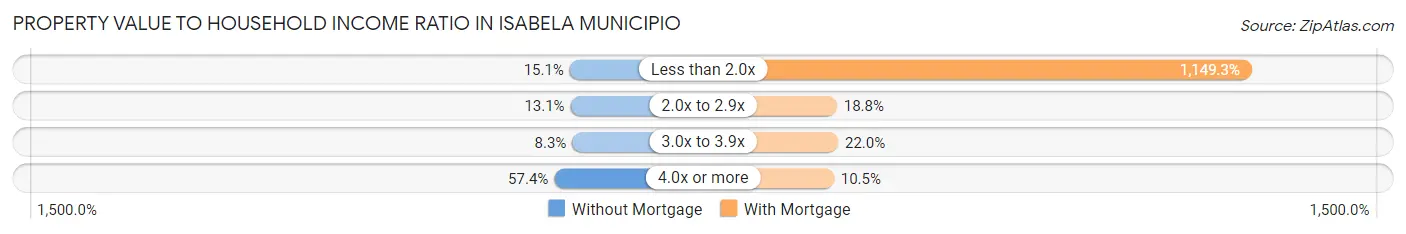
| Value-to-Income Ratio | Without Mortgage | With Mortgage |
| Less than 2.0x | 871 (15.1%) | 35,098 (1,149.2%) |
| 2.0x to 2.9x | 754 (13.1%) | 575 (18.8%) |
| 3.0x to 3.9x | 481 (8.3%) | 673 (22.0%) |
| 4.0x or more | 3,314 (57.4%) | 321 (10.5%) |
| Total | 5,771 (100.0%) | 3,054 (100.0%) |
Real Estate Taxes by Mortgage Status in Isabela Municipio
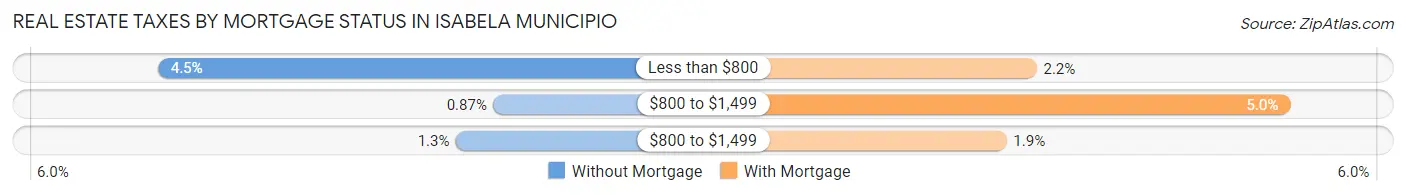
| Property Taxes | Without Mortgage | With Mortgage |
| Less than $800 | 262 (4.5%) | 68 (2.2%) |
| $800 to $1,499 | 50 (0.9%) | 153 (5.0%) |
| $800 to $1,499 | 74 (1.3%) | 58 (1.9%) |
| Total | 5,771 (100.0%) | 3,054 (100.0%) |
Health & Disability in Isabela Municipio
Health Insurance Coverage by Age in Isabela Municipio
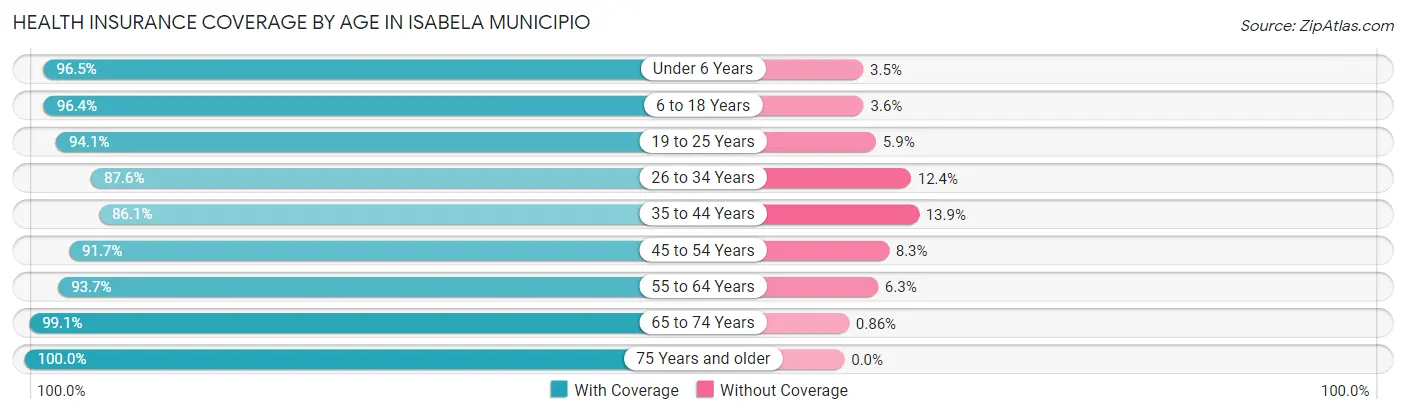
| Age Bracket | With Coverage | Without Coverage |
| Under 6 Years | 1,507 (96.5%) | 55 (3.5%) |
| 6 to 18 Years | 5,964 (96.4%) | 223 (3.6%) |
| 19 to 25 Years | 3,836 (94.1%) | 240 (5.9%) |
| 26 to 34 Years | 4,049 (87.6%) | 573 (12.4%) |
| 35 to 44 Years | 4,615 (86.1%) | 744 (13.9%) |
| 45 to 54 Years | 5,372 (91.7%) | 486 (8.3%) |
| 55 to 64 Years | 5,532 (93.7%) | 370 (6.3%) |
| 65 to 74 Years | 4,822 (99.1%) | 42 (0.9%) |
| 75 Years and older | 4,062 (100.0%) | 0 (0.0%) |
| Total | 39,759 (93.6%) | 2,733 (6.4%) |
Health Insurance Coverage by Citizenship Status in Isabela Municipio
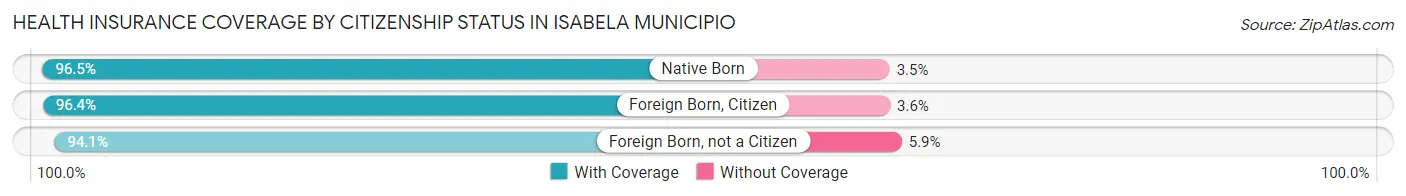
| Citizenship Status | With Coverage | Without Coverage |
| Native Born | 1,507 (96.5%) | 55 (3.5%) |
| Foreign Born, Citizen | 5,964 (96.4%) | 223 (3.6%) |
| Foreign Born, not a Citizen | 3,836 (94.1%) | 240 (5.9%) |
Health Insurance Coverage by Household Income in Isabela Municipio
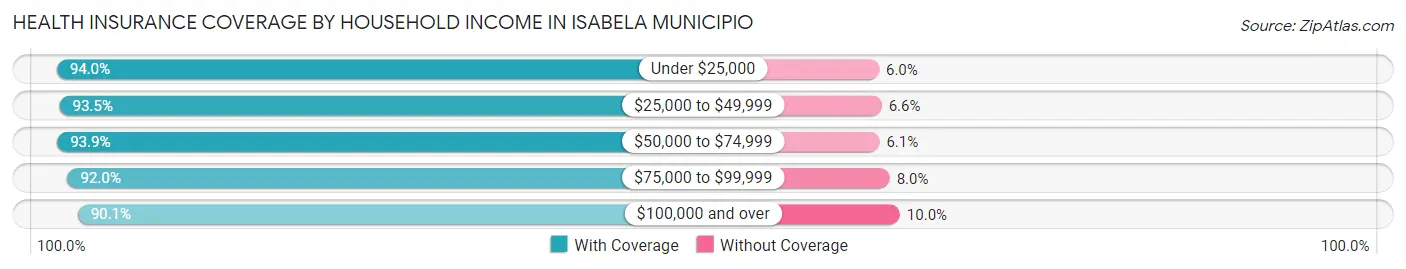
| Household Income | With Coverage | Without Coverage |
| Under $25,000 | 20,470 (94.0%) | 1,315 (6.0%) |
| $25,000 to $49,999 | 10,468 (93.4%) | 734 (6.6%) |
| $50,000 to $74,999 | 5,384 (93.9%) | 351 (6.1%) |
| $75,000 to $99,999 | 1,613 (92.0%) | 141 (8.0%) |
| $100,000 and over | 1,729 (90.0%) | 191 (10.0%) |
Public vs Private Health Insurance Coverage by Age in Isabela Municipio
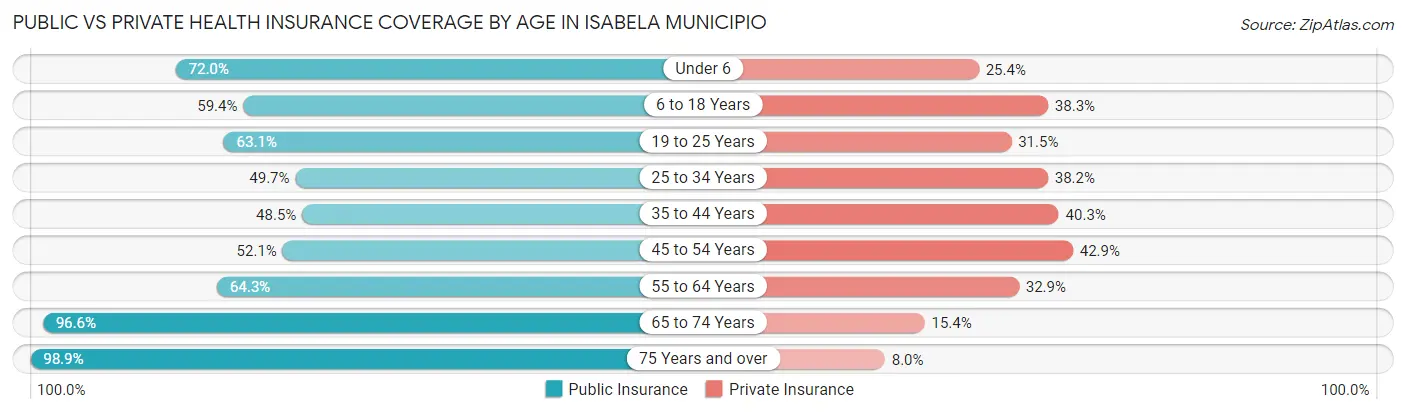
| Age Bracket | Public Insurance | Private Insurance |
| Under 6 | 1,124 (72.0%) | 397 (25.4%) |
| 6 to 18 Years | 3,676 (59.4%) | 2,367 (38.3%) |
| 19 to 25 Years | 2,570 (63.0%) | 1,282 (31.5%) |
| 25 to 34 Years | 2,299 (49.7%) | 1,767 (38.2%) |
| 35 to 44 Years | 2,598 (48.5%) | 2,157 (40.3%) |
| 45 to 54 Years | 3,052 (52.1%) | 2,512 (42.9%) |
| 55 to 64 Years | 3,795 (64.3%) | 1,939 (32.9%) |
| 65 to 74 Years | 4,700 (96.6%) | 747 (15.4%) |
| 75 Years and over | 4,019 (98.9%) | 324 (8.0%) |
| Total | 27,833 (65.5%) | 13,492 (31.8%) |
Disability Status by Sex by Age in Isabela Municipio
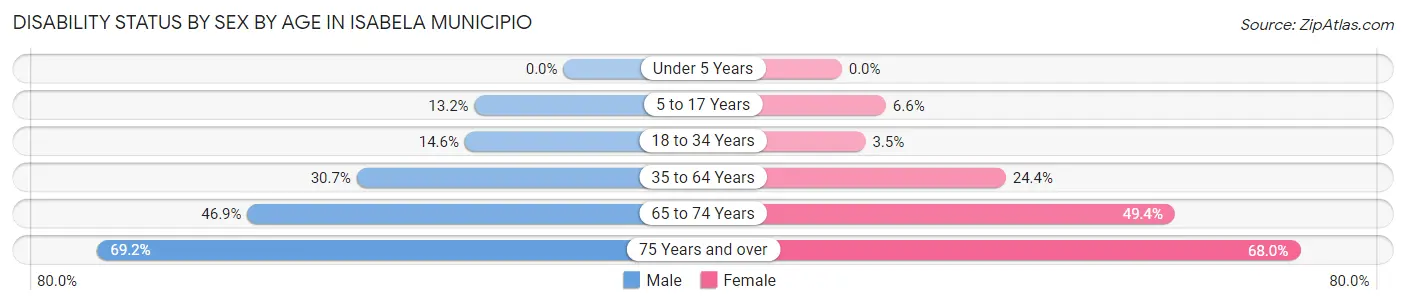
| Age Bracket | Male | Female |
| Under 5 Years | 0 (0.0%) | 0 (0.0%) |
| 5 to 17 Years | 393 (13.2%) | 181 (6.6%) |
| 18 to 34 Years | 704 (14.6%) | 159 (3.5%) |
| 35 to 64 Years | 2,520 (30.7%) | 2,169 (24.3%) |
| 65 to 74 Years | 1,058 (46.9%) | 1,290 (49.4%) |
| 75 Years and over | 1,217 (69.2%) | 1,567 (68.0%) |
Disability Class by Sex by Age in Isabela Municipio
Disability Class: Hearing Difficulty
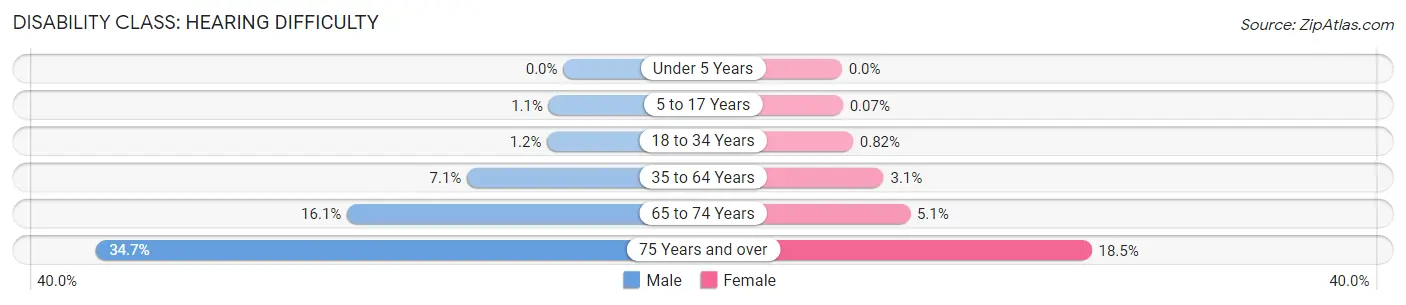
| Age Bracket | Male | Female |
| Under 5 Years | 0 (0.0%) | 0 (0.0%) |
| 5 to 17 Years | 32 (1.1%) | 2 (0.1%) |
| 18 to 34 Years | 57 (1.2%) | 37 (0.8%) |
| 35 to 64 Years | 586 (7.1%) | 276 (3.1%) |
| 65 to 74 Years | 362 (16.1%) | 132 (5.1%) |
| 75 Years and over | 610 (34.7%) | 427 (18.5%) |
Disability Class: Vision Difficulty
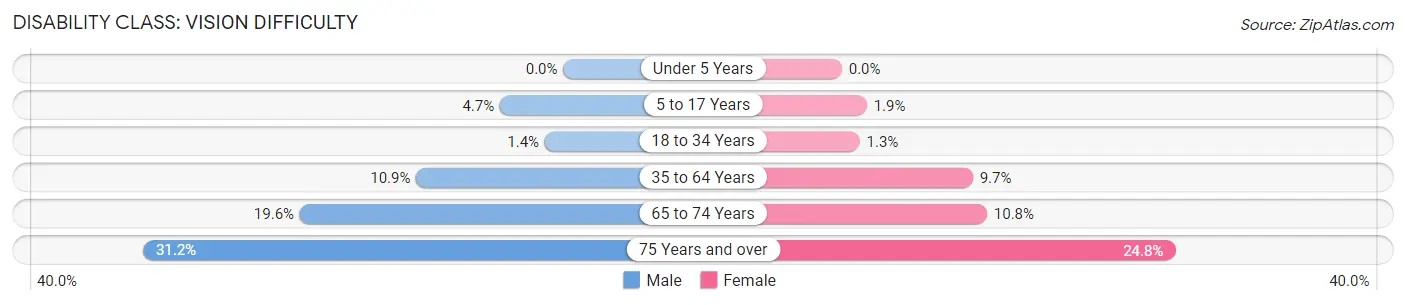
| Age Bracket | Male | Female |
| Under 5 Years | 0 (0.0%) | 0 (0.0%) |
| 5 to 17 Years | 140 (4.7%) | 51 (1.8%) |
| 18 to 34 Years | 66 (1.4%) | 60 (1.3%) |
| 35 to 64 Years | 897 (10.9%) | 866 (9.7%) |
| 65 to 74 Years | 441 (19.6%) | 281 (10.8%) |
| 75 Years and over | 549 (31.2%) | 570 (24.7%) |
Disability Class: Cognitive Difficulty
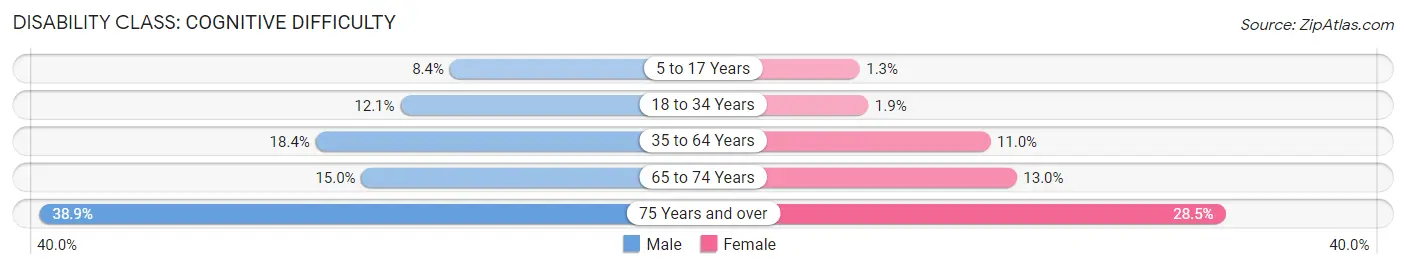
| Age Bracket | Male | Female |
| 5 to 17 Years | 251 (8.4%) | 36 (1.3%) |
| 18 to 34 Years | 582 (12.1%) | 88 (1.9%) |
| 35 to 64 Years | 1,510 (18.4%) | 980 (11.0%) |
| 65 to 74 Years | 338 (15.0%) | 338 (13.0%) |
| 75 Years and over | 684 (38.9%) | 656 (28.5%) |
Disability Class: Ambulatory Difficulty
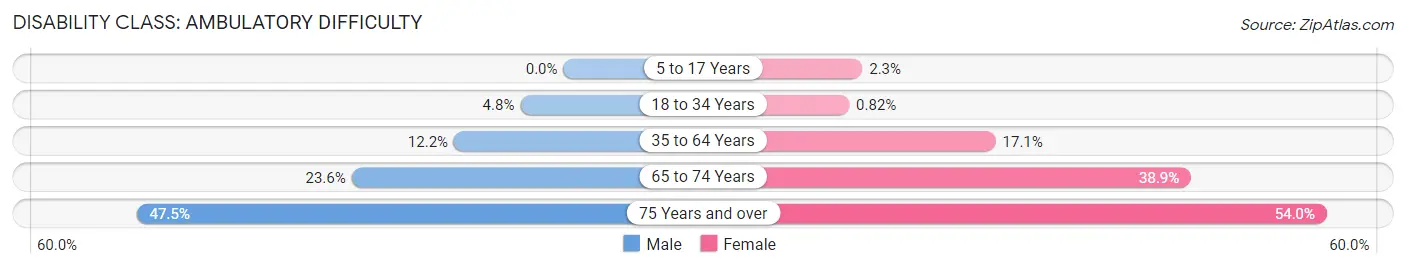
| Age Bracket | Male | Female |
| 5 to 17 Years | 0 (0.0%) | 63 (2.3%) |
| 18 to 34 Years | 231 (4.8%) | 37 (0.8%) |
| 35 to 64 Years | 1,001 (12.2%) | 1,526 (17.1%) |
| 65 to 74 Years | 532 (23.6%) | 1,015 (38.9%) |
| 75 Years and over | 836 (47.5%) | 1,244 (54.0%) |
Disability Class: Self-Care Difficulty
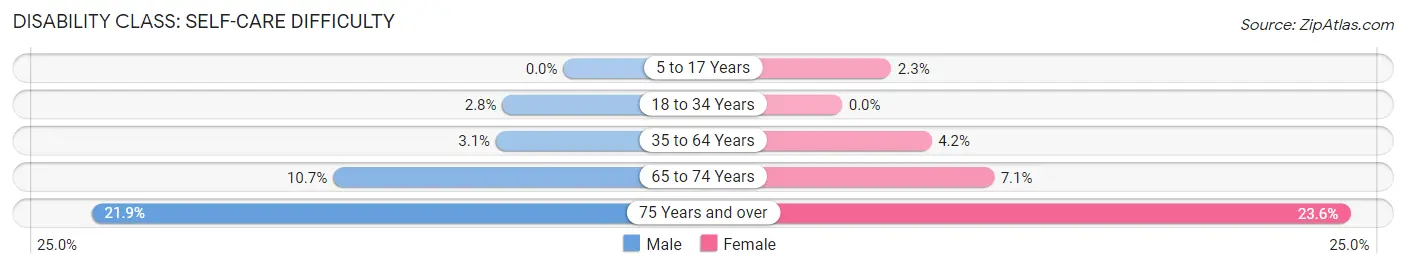
| Age Bracket | Male | Female |
| 5 to 17 Years | 0 (0.0%) | 63 (2.3%) |
| 18 to 34 Years | 136 (2.8%) | 0 (0.0%) |
| 35 to 64 Years | 257 (3.1%) | 370 (4.2%) |
| 65 to 74 Years | 241 (10.7%) | 184 (7.0%) |
| 75 Years and over | 385 (21.9%) | 543 (23.6%) |
Technology Access in Isabela Municipio
Computing Device Access in Isabela Municipio
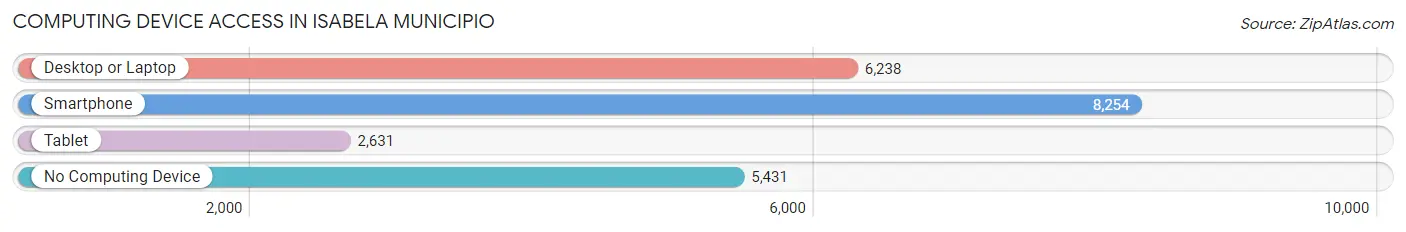
| Device Type | # Households | % Households |
| Desktop or Laptop | 6,238 | 42.0% |
| Smartphone | 8,254 | 55.6% |
| Tablet | 2,631 | 17.7% |
| No Computing Device | 5,431 | 36.6% |
| Total | 14,843 | 100.0% |
Internet Access in Isabela Municipio
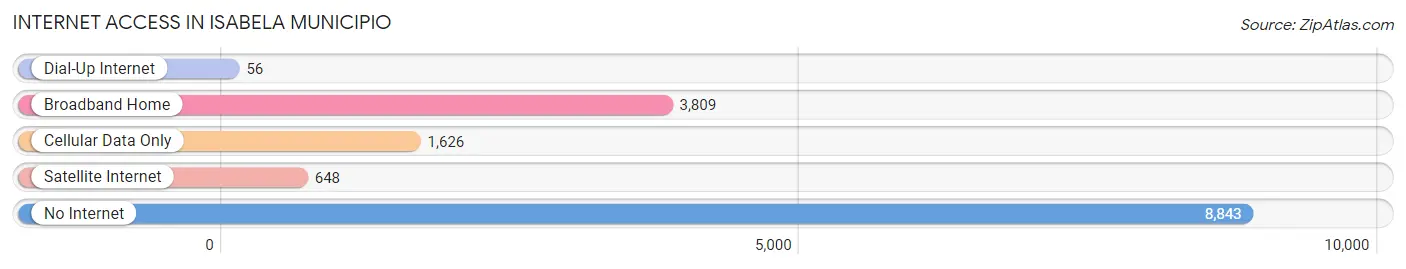
| Internet Type | # Households | % Households |
| Dial-Up Internet | 56 | 0.4% |
| Broadband Home | 3,809 | 25.7% |
| Cellular Data Only | 1,626 | 11.0% |
| Satellite Internet | 648 | 4.4% |
| No Internet | 8,843 | 59.6% |
| Total | 14,843 | 100.0% |
Isabela Municipio Summary
Isabela Municipio is a municipality located in the northwest region of Puerto Rico. It is part of the San Juan-Caguas-Guaynabo Metropolitan Statistical Area. As of the 2010 census, the municipality had a population of 39,918.
History
The area of Isabela was originally inhabited by the Taíno Indians. The first European settlers arrived in the area in the late 16th century. The area was originally part of the municipality of Aguadilla, but in 1831 it was separated and became its own municipality.
In the early 20th century, Isabela was a small agricultural town. The economy was based on the production of sugar cane, coffee, and tobacco. In the 1950s, the economy began to diversify and the town began to grow. In the 1970s, the town experienced a period of rapid growth as people moved to the area from other parts of Puerto Rico.
Geography
Isabela is located in the northwest region of Puerto Rico, on the northern coast of the island. It is bordered by the municipalities of Aguadilla to the west, San Sebastián to the south, and Quebradillas to the east. The municipality covers an area of 44.7 square miles (115.9 km2).
The terrain of Isabela is mostly flat, with some hills in the northern part of the municipality. The highest point is Cerro de Punta, which has an elevation of 1,065 feet (325 m). The climate is tropical, with an average temperature of 79°F (26°C).
Economy
The economy of Isabela is largely based on tourism and agriculture. The main agricultural products are sugar cane, coffee, and tobacco. The town is also home to several manufacturing plants, including a pharmaceutical plant and a plastics factory.
The town is also home to several beaches, which attract tourists from all over Puerto Rico and the Caribbean. The beaches are popular for swimming, snorkeling, and other water sports.
Demographics
As of the 2010 census, the population of Isabela was 39,918. The population is mostly of mixed European and African descent. The majority of the population (90.3%) is Hispanic or Latino. The median household income is $19,845.
The town is home to several churches, including the Iglesia de Nuestra Señora de la Candelaria, which was built in the 18th century. The town also has several schools, including the Colegio San Antonio de Padua, which was founded in 1891.
Conclusion
Isabela Municipio is a municipality located in the northwest region of Puerto Rico. It has a population of 39,918 and is part of the San Juan-Caguas-Guaynabo Metropolitan Statistical Area. The economy of Isabela is largely based on tourism and agriculture, with the main agricultural products being sugar cane, coffee, and tobacco. The town is also home to several manufacturing plants and several beaches, which attract tourists from all over Puerto Rico and the Caribbean. The population is mostly of mixed European and African descent, and the median household income is $19,845.
Common Questions
What is Per Capita Income in Isabela Municipio?
Per Capita income in Isabela Municipio is $12,242.
What is the Median Family Income in Isabela Municipio?
Median Family Income in Isabela Municipio is $24,697.
What is the Median Household income in Isabela Municipio?
Median Household Income in Isabela Municipio is $19,965.
What is Income or Wage Gap in Isabela Municipio?
Income or Wage Gap in Isabela Municipio is 21.3%.
Women in Isabela Municipio earn 78.7 cents for every dollar earned by a man.
What is Family Income Deficit in Isabela Municipio?
Family Income Deficit in Isabela Municipio is $11,155.
Families that are below poverty line in Isabela Municipio earn $11,155 less on average than the poverty threshold level.
What is Inequality or Gini Index in Isabela Municipio?
Inequality or Gini Index in Isabela Municipio is 0.52.
What is the Total Population of Isabela Municipio?
Total Population of Isabela Municipio is 42,817.
What is the Total Male Population of Isabela Municipio?
Total Male Population of Isabela Municipio is 20,828.
What is the Total Female Population of Isabela Municipio?
Total Female Population of Isabela Municipio is 21,989.
What is the Ratio of Males per 100 Females in Isabela Municipio?
There are 94.72 Males per 100 Females in Isabela Municipio.
What is the Ratio of Females per 100 Males in Isabela Municipio?
There are 105.57 Females per 100 Males in Isabela Municipio.
What is the Median Population Age in Isabela Municipio?
Median Population Age in Isabela Municipio is 44.3 Years.
What is the Average Family Size in Isabela Municipio
Average Family Size in Isabela Municipio is 3.6 People.
What is the Average Household Size in Isabela Municipio
Average Household Size in Isabela Municipio is 2.9 People.
How Large is the Labor Force in Isabela Municipio?
There are 13,322 People in the Labor Forcein in Isabela Municipio.
What is the Percentage of People in the Labor Force in Isabela Municipio?
36.2% of People are in the Labor Force in Isabela Municipio.
What is the Unemployment Rate in Isabela Municipio?
Unemployment Rate in Isabela Municipio is 7.0%.