Humacao Municipio, PR Map & Demographics
Humacao Municipio Map
Humacao Municipio Overview
$15,510
PER CAPITA INCOME
$31,016
AVG FAMILY INCOME
$25,940
AVG HOUSEHOLD INCOME
4.0%
WAGE / INCOME GAP [ % ]
96.0¢/ $1
WAGE / INCOME GAP [ $ ]
$9,944
FAMILY INCOME DEFICIT
0.51
INEQUALITY / GINI INDEX
50,729
TOTAL POPULATION
23,923
MALE POPULATION
26,806
FEMALE POPULATION
89.24
MALES / 100 FEMALES
112.05
FEMALES / 100 MALES
45.9
MEDIAN AGE
3.5
AVG FAMILY SIZE
2.8
AVG HOUSEHOLD SIZE
16,736
LABOR FORCE [ PEOPLE ]
38.6%
PERCENT IN LABOR FORCE
7.3%
UNEMPLOYMENT RATE
Humacao Municipio Area Codes
Income in Humacao Municipio
Income Overview in Humacao Municipio
Per Capita Income in Humacao Municipio is $15,510, while median incomes of families and households are $31,016 and $25,940 respectively.
| Characteristic | Number | Measure |
| Per Capita Income | 50,729 | $15,510 |
| Median Family Income | 12,118 | $31,016 |
| Mean Family Income | 12,118 | $45,686 |
| Median Household Income | 18,206 | $25,940 |
| Mean Household Income | 18,206 | $38,593 |
| Income Deficit | 12,118 | $9,944 |
| Wage / Income Gap (%) | 50,729 | 4.03% |
| Wage / Income Gap ($) | 50,729 | 95.97¢ per $1 |
| Gini / Inequality Index | 50,729 | 0.51 |
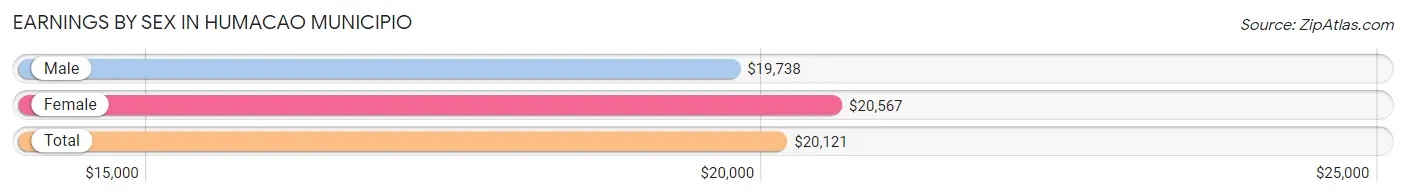
Earnings by Sex in Humacao Municipio
Average Earnings in Humacao Municipio are $20,121, $19,738 for men and $20,567 for women, a difference of 4.0%.
| Sex | Number | Average Earnings |
| Male | 9,269 (55.5%) | $19,738 |
| Female | 7,435 (44.5%) | $20,567 |
| Total | 16,704 (100.0%) | $20,121 |
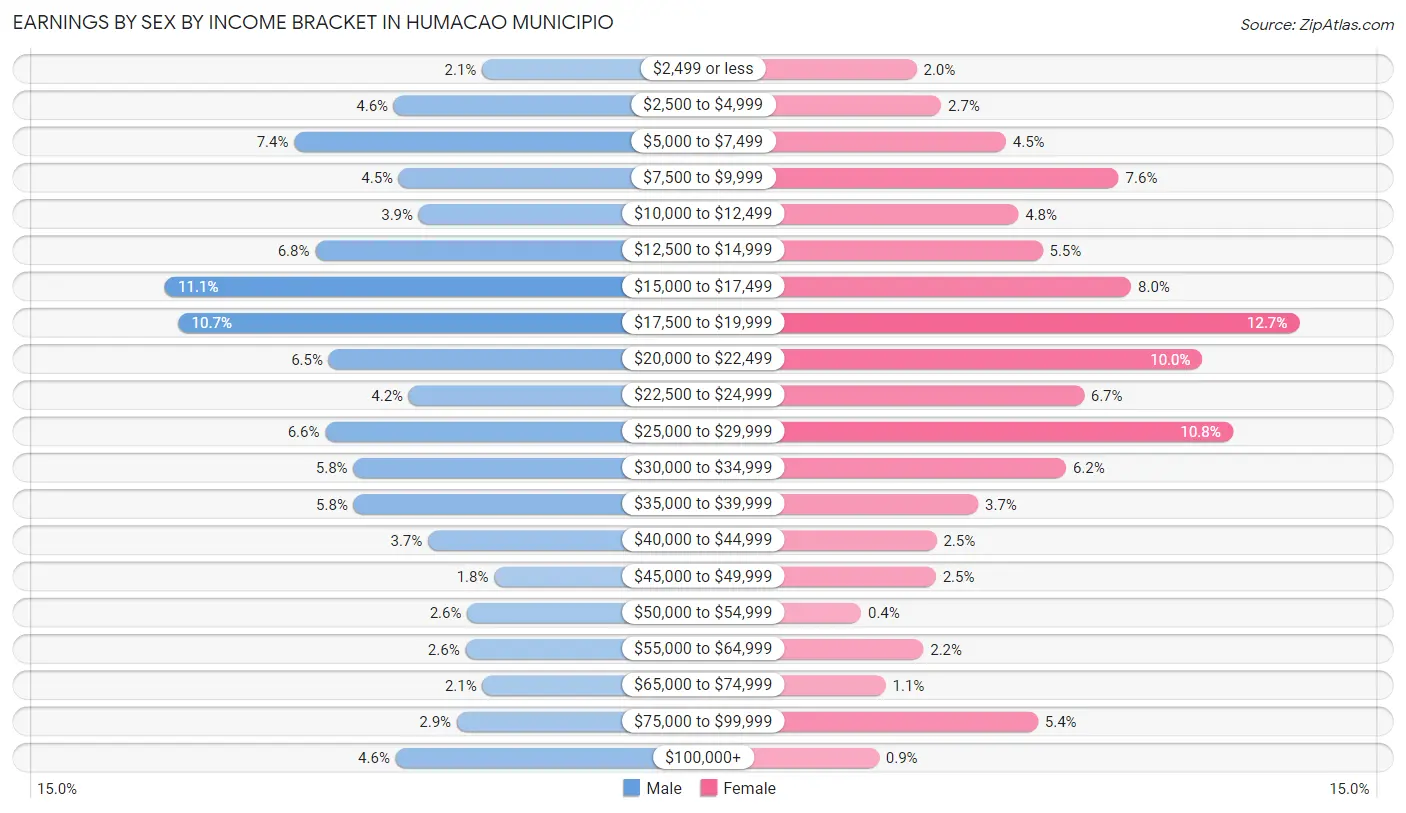
Earnings by Sex by Income Bracket in Humacao Municipio
The most common earnings brackets in Humacao Municipio are $15,000 to $17,499 for men (1,024 | 11.1%) and $17,500 to $19,999 for women (945 | 12.7%).
| Income | Male | Female |
| $2,499 or less | 198 (2.1%) | 146 (2.0%) |
| $2,500 to $4,999 | 428 (4.6%) | 197 (2.6%) |
| $5,000 to $7,499 | 688 (7.4%) | 332 (4.5%) |
| $7,500 to $9,999 | 415 (4.5%) | 568 (7.6%) |
| $10,000 to $12,499 | 363 (3.9%) | 358 (4.8%) |
| $12,500 to $14,999 | 633 (6.8%) | 409 (5.5%) |
| $15,000 to $17,499 | 1,024 (11.1%) | 594 (8.0%) |
| $17,500 to $19,999 | 989 (10.7%) | 945 (12.7%) |
| $20,000 to $22,499 | 598 (6.5%) | 743 (10.0%) |
| $22,500 to $24,999 | 389 (4.2%) | 495 (6.7%) |
| $25,000 to $29,999 | 607 (6.6%) | 806 (10.8%) |
| $30,000 to $34,999 | 534 (5.8%) | 458 (6.2%) |
| $35,000 to $39,999 | 533 (5.8%) | 274 (3.7%) |
| $40,000 to $44,999 | 339 (3.7%) | 187 (2.5%) |
| $45,000 to $49,999 | 167 (1.8%) | 186 (2.5%) |
| $50,000 to $54,999 | 237 (2.6%) | 30 (0.4%) |
| $55,000 to $64,999 | 242 (2.6%) | 160 (2.1%) |
| $65,000 to $74,999 | 197 (2.1%) | 81 (1.1%) |
| $75,000 to $99,999 | 264 (2.9%) | 399 (5.4%) |
| $100,000+ | 424 (4.6%) | 67 (0.9%) |
| Total | 9,269 (100.0%) | 7,435 (100.0%) |
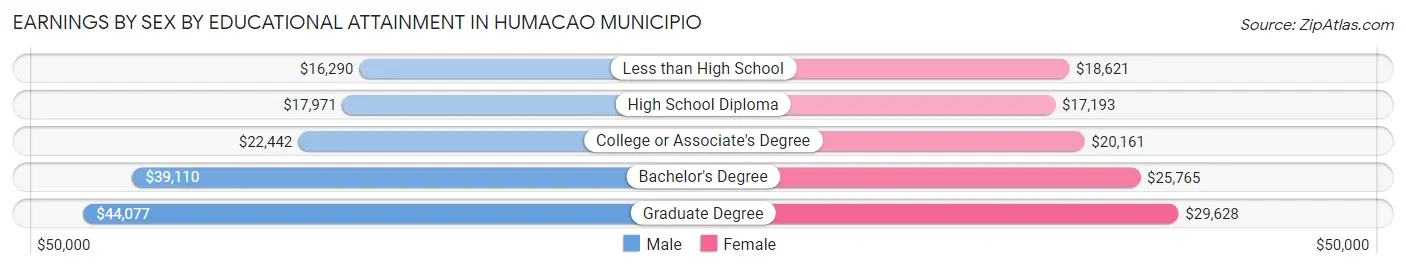
Earnings by Sex by Educational Attainment in Humacao Municipio
Average earnings in Humacao Municipio are $21,035 for men and $21,263 for women, a difference of 1.1%. Men with an educational attainment of graduate degree enjoy the highest average annual earnings of $44,077, while those with less than high school education earn the least with $16,290. Women with an educational attainment of graduate degree earn the most with the average annual earnings of $29,628, while those with high school diploma education have the smallest earnings of $17,193.
| Educational Attainment | Male Income | Female Income |
| Less than High School | $16,290 | $18,621 |
| High School Diploma | $17,971 | $17,193 |
| College or Associate's Degree | $22,442 | $20,161 |
| Bachelor's Degree | $39,110 | $25,765 |
| Graduate Degree | $44,077 | $29,628 |
| Total | $21,035 | $21,263 |
Family Income in Humacao Municipio
Family Income Brackets in Humacao Municipio
According to the Humacao Municipio family income data, there are 2,496 families falling into the $15,000 to $24,999 income range, which is the most common income bracket and makes up 20.6% of all families. Conversely, the $150,000 to $199,999 income bracket is the least frequent group with only 121 families (1.0%) belonging to this category.
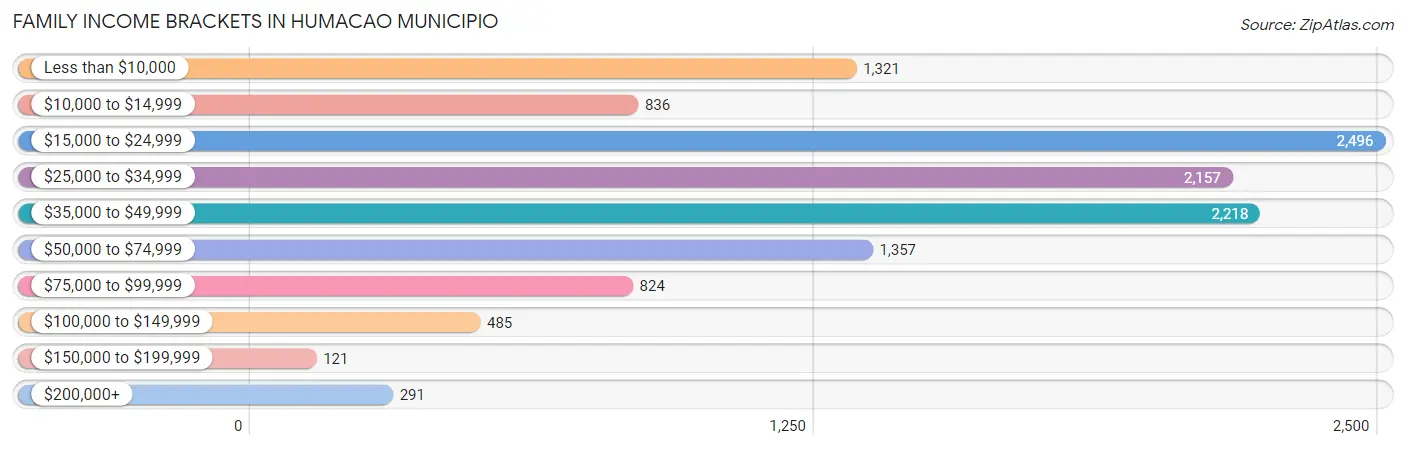
| Income Bracket | # Families | % Families |
| Less than $10,000 | 1,321 | 10.9% |
| $10,000 to $14,999 | 836 | 6.9% |
| $15,000 to $24,999 | 2,496 | 20.6% |
| $25,000 to $34,999 | 2,157 | 17.8% |
| $35,000 to $49,999 | 2,218 | 18.3% |
| $50,000 to $74,999 | 1,357 | 11.2% |
| $75,000 to $99,999 | 824 | 6.8% |
| $100,000 to $149,999 | 485 | 4.0% |
| $150,000 to $199,999 | 121 | 1.0% |
| $200,000+ | 291 | 2.4% |
Family Income by Famaliy Size in Humacao Municipio
4-person families (1,923 | 15.9%) account for the highest median family income in Humacao Municipio with $42,256 per family, while 2-person families (6,278 | 51.8%) have the highest median income of $13,430 per family member.
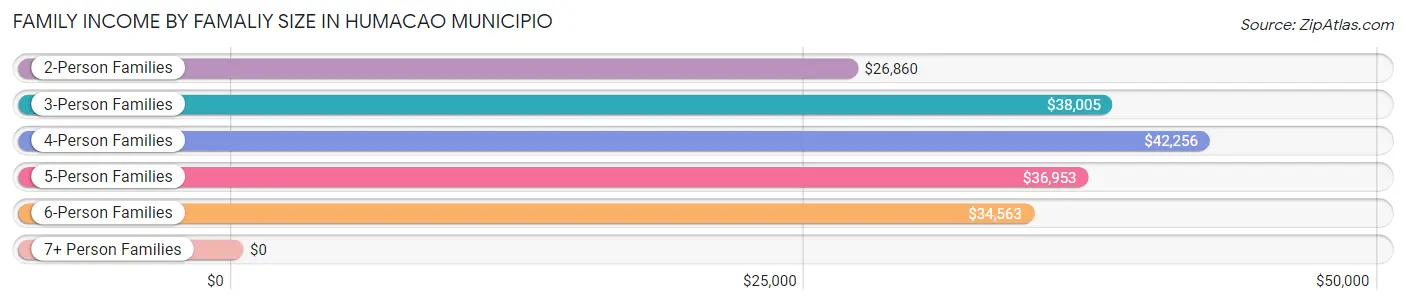
| Income Bracket | # Families | Median Income |
| 2-Person Families | 6,278 (51.8%) | $26,860 |
| 3-Person Families | 3,093 (25.5%) | $38,005 |
| 4-Person Families | 1,923 (15.9%) | $42,256 |
| 5-Person Families | 562 (4.6%) | $36,953 |
| 6-Person Families | 177 (1.5%) | $34,563 |
| 7+ Person Families | 85 (0.7%) | $0 |
| Total | 12,118 (100.0%) | $31,016 |
Family Income by Number of Earners in Humacao Municipio
The median family income in Humacao Municipio is $31,016, with families comprising 3+ earners (619) having the highest median family income of $87,036, while families with no earners (4,844) have the lowest median family income of $23,028, accounting for 5.1% and 40.0% of families, respectively.
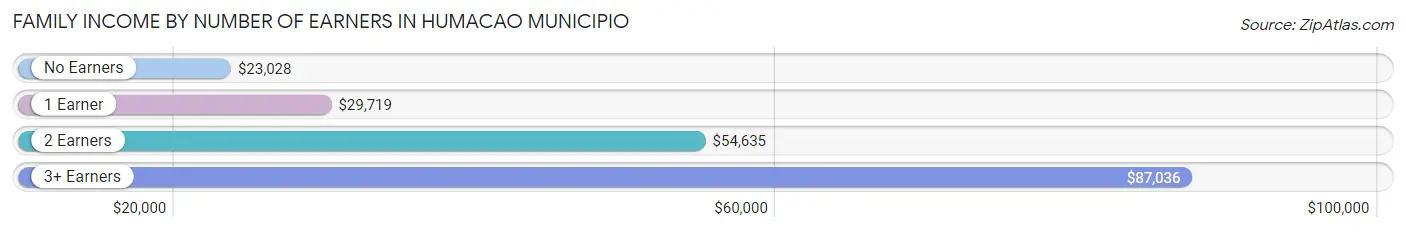
| Number of Earners | # Families | Median Income |
| No Earners | 4,844 (40.0%) | $23,028 |
| 1 Earner | 4,222 (34.8%) | $29,719 |
| 2 Earners | 2,433 (20.1%) | $54,635 |
| 3+ Earners | 619 (5.1%) | $87,036 |
| Total | 12,118 (100.0%) | $31,016 |
Household Income in Humacao Municipio
Household Income Brackets in Humacao Municipio
With 3,732 households falling in the category, the $15,000 to $24,999 income range is the most frequent in Humacao Municipio, accounting for 20.5% of all households. In contrast, only 146 households (0.8%) fall into the $150,000 to $199,999 income bracket, making it the least populous group.
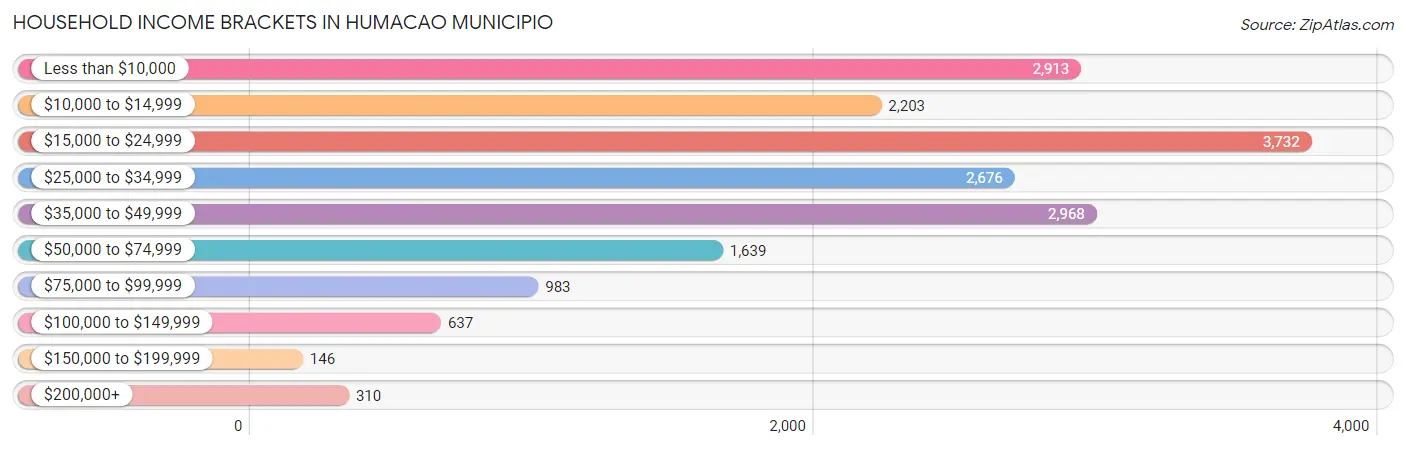
| Income Bracket | # Households | % Households |
| Less than $10,000 | 2,913 | 16.0% |
| $10,000 to $14,999 | 2,203 | 12.1% |
| $15,000 to $24,999 | 3,732 | 20.5% |
| $25,000 to $34,999 | 2,676 | 14.7% |
| $35,000 to $49,999 | 2,968 | 16.3% |
| $50,000 to $74,999 | 1,639 | 9.0% |
| $75,000 to $99,999 | 983 | 5.4% |
| $100,000 to $149,999 | 637 | 3.5% |
| $150,000 to $199,999 | 146 | 0.8% |
| $200,000+ | 310 | 1.7% |
Household Income by Householder Age in Humacao Municipio
The median household income in Humacao Municipio is $25,940, with the highest median household income of $32,656 found in the 45 to 64 years age bracket for the primary householder. A total of 6,758 households (37.1%) fall into this category. Meanwhile, the 15 to 24 years age bracket for the primary householder has the lowest median household income of $17,000, with 172 households (0.9%) in this group.
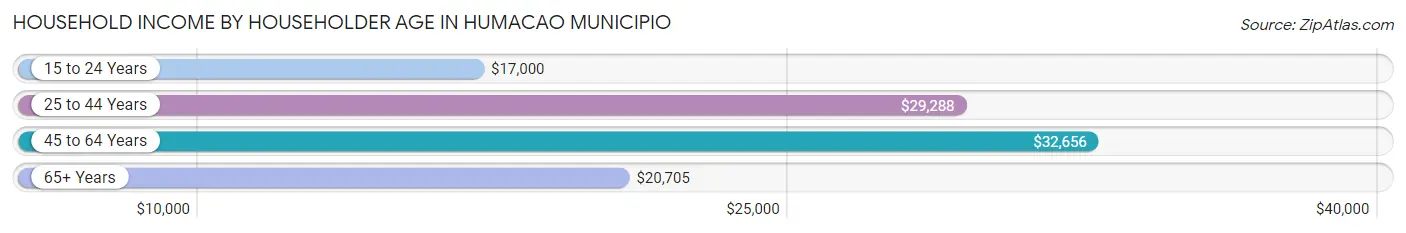
| Income Bracket | # Households | Median Income |
| 15 to 24 Years | 172 (0.9%) | $17,000 |
| 25 to 44 Years | 3,866 (21.2%) | $29,288 |
| 45 to 64 Years | 6,758 (37.1%) | $32,656 |
| 65+ Years | 7,410 (40.7%) | $20,705 |
| Total | 18,206 (100.0%) | $25,940 |
Poverty in Humacao Municipio
Income Below Poverty by Sex and Age in Humacao Municipio
With 34.7% poverty level for males and 39.3% for females among the residents of Humacao Municipio, 15 year old males and under 5 year old females are the most vulnerable to poverty, with 251 males (65.5%) and 661 females (79.2%) in their respective age groups living below the poverty level.
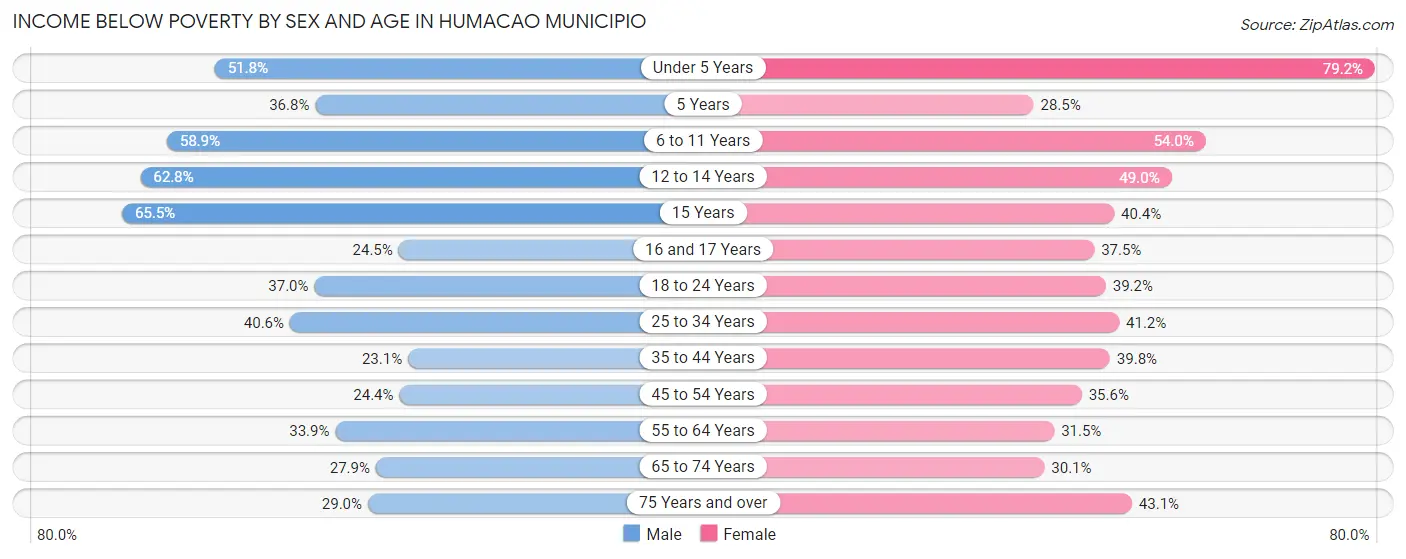
| Age Bracket | Male | Female |
| Under 5 Years | 441 (51.8%) | 661 (79.2%) |
| 5 Years | 63 (36.8%) | 80 (28.5%) |
| 6 to 11 Years | 895 (58.9%) | 736 (54.0%) |
| 12 to 14 Years | 478 (62.8%) | 395 (48.9%) |
| 15 Years | 251 (65.5%) | 110 (40.4%) |
| 16 and 17 Years | 125 (24.5%) | 235 (37.5%) |
| 18 to 24 Years | 838 (37.0%) | 869 (39.2%) |
| 25 to 34 Years | 1,124 (40.6%) | 1,261 (41.2%) |
| 35 to 44 Years | 659 (23.1%) | 1,237 (39.8%) |
| 45 to 54 Years | 762 (24.3%) | 1,264 (35.6%) |
| 55 to 64 Years | 1,056 (33.9%) | 1,199 (31.5%) |
| 65 to 74 Years | 841 (27.9%) | 1,103 (30.1%) |
| 75 Years and over | 676 (29.0%) | 1,351 (43.1%) |
| Total | 8,209 (34.7%) | 10,501 (39.3%) |
Income Above Poverty by Sex and Age in Humacao Municipio
According to the poverty statistics in Humacao Municipio, males aged 35 to 44 years and females aged 5 years are the age groups that are most secure financially, with 76.9% of males and 71.5% of females in these age groups living above the poverty line.
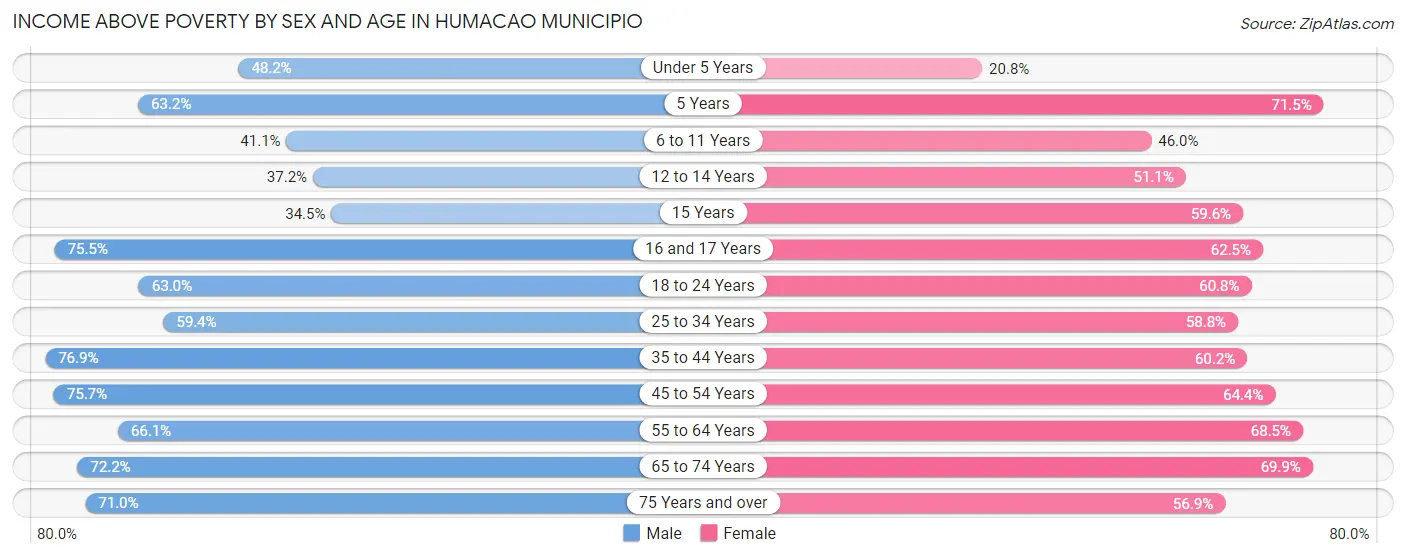
| Age Bracket | Male | Female |
| Under 5 Years | 411 (48.2%) | 174 (20.8%) |
| 5 Years | 108 (63.2%) | 201 (71.5%) |
| 6 to 11 Years | 625 (41.1%) | 626 (46.0%) |
| 12 to 14 Years | 283 (37.2%) | 412 (51.0%) |
| 15 Years | 132 (34.5%) | 162 (59.6%) |
| 16 and 17 Years | 386 (75.5%) | 392 (62.5%) |
| 18 to 24 Years | 1,429 (63.0%) | 1,348 (60.8%) |
| 25 to 34 Years | 1,644 (59.4%) | 1,801 (58.8%) |
| 35 to 44 Years | 2,197 (76.9%) | 1,870 (60.2%) |
| 45 to 54 Years | 2,368 (75.6%) | 2,284 (64.4%) |
| 55 to 64 Years | 2,063 (66.1%) | 2,603 (68.5%) |
| 65 to 74 Years | 2,179 (72.2%) | 2,564 (69.9%) |
| 75 Years and over | 1,653 (71.0%) | 1,785 (56.9%) |
| Total | 15,478 (65.3%) | 16,222 (60.7%) |
Income Below Poverty Among Married-Couple Families in Humacao Municipio
The poverty statistics for married-couple families in Humacao Municipio show that 20.8% or 1,595 of the total 7,666 families live below the poverty line. Families with 3 or 4 children have the highest poverty rate of 100.0%, comprising of 50 families. On the other hand, families with no children have the lowest poverty rate of 16.4%, which includes 898 families.
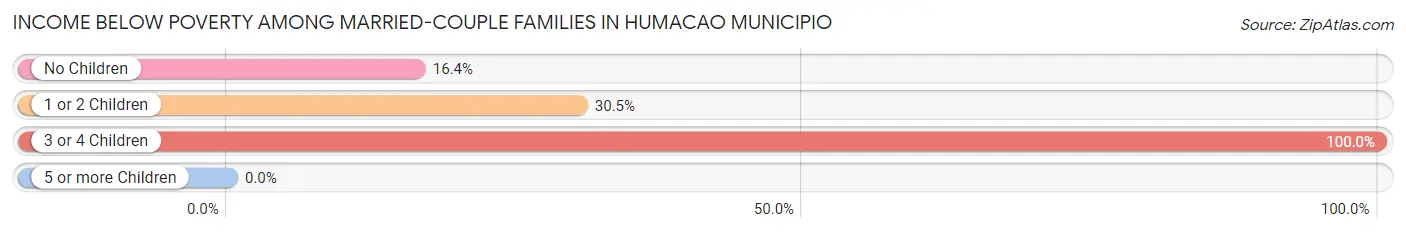
| Children | Above Poverty | Below Poverty |
| No Children | 4,593 (83.7%) | 898 (16.4%) |
| 1 or 2 Children | 1,478 (69.6%) | 647 (30.4%) |
| 3 or 4 Children | 0 (0.0%) | 50 (100.0%) |
| 5 or more Children | 0 (0.0%) | 0 (0.0%) |
| Total | 6,071 (79.2%) | 1,595 (20.8%) |
Income Below Poverty Among Single-Parent Households in Humacao Municipio
According to the poverty data in Humacao Municipio, 33.6% or 331 single-father households and 54.4% or 1,885 single-mother households are living below the poverty line. Among single-father households, those with 5 or more children have the highest poverty rate, with 35 households (100.0%) experiencing poverty. Likewise, among single-mother households, those with 3 or 4 children have the highest poverty rate, with 149 households (100.0%) falling below the poverty line.
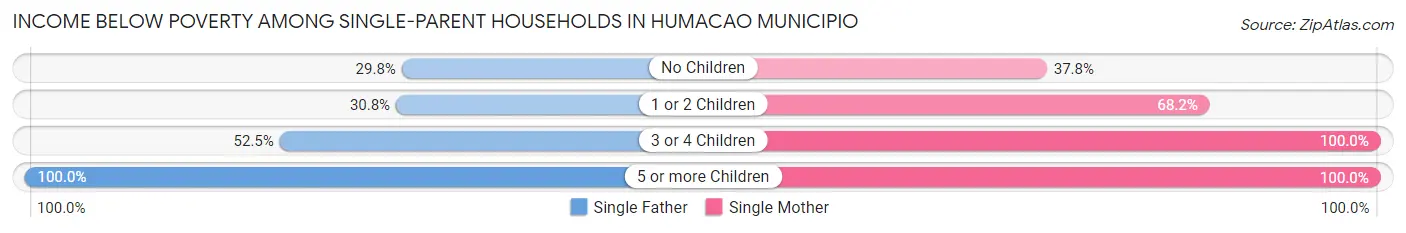
| Children | Single Father | Single Mother |
| No Children | 156 (29.8%) | 664 (37.8%) |
| 1 or 2 Children | 119 (30.8%) | 1,051 (68.2%) |
| 3 or 4 Children | 21 (52.5%) | 149 (100.0%) |
| 5 or more Children | 35 (100.0%) | 21 (100.0%) |
| Total | 331 (33.6%) | 1,885 (54.4%) |
Income Below Poverty Among Married-Couple vs Single-Parent Households in Humacao Municipio
The poverty data for Humacao Municipio shows that 1,595 of the married-couple family households (20.8%) and 2,216 of the single-parent households (49.8%) are living below the poverty level. Within the married-couple family households, those with 3 or 4 children have the highest poverty rate, with 50 households (100.0%) falling below the poverty line. Among the single-parent households, those with 5 or more children have the highest poverty rate, with 56 household (100.0%) living below poverty.
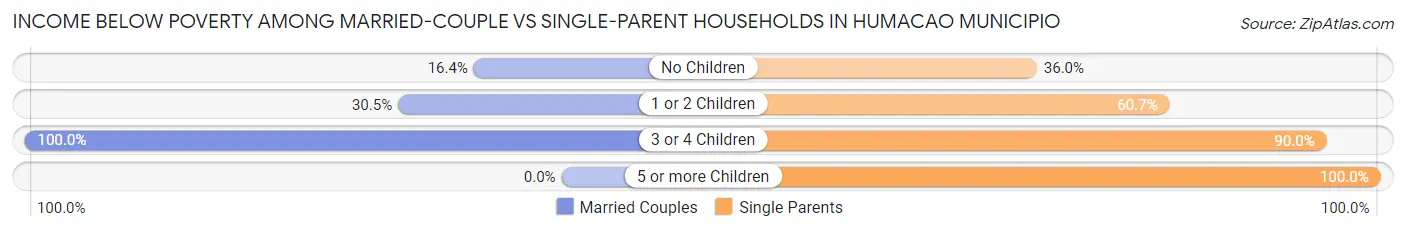
| Children | Married-Couple Families | Single-Parent Households |
| No Children | 898 (16.4%) | 820 (36.0%) |
| 1 or 2 Children | 647 (30.4%) | 1,170 (60.7%) |
| 3 or 4 Children | 50 (100.0%) | 170 (89.9%) |
| 5 or more Children | 0 (0.0%) | 56 (100.0%) |
| Total | 1,595 (20.8%) | 2,216 (49.8%) |
Race in Humacao Municipio
The most populous races in Humacao Municipio are Hispanic or Latino (50,123 | 98.8%), Some other Race (31,019 | 61.2%), and White / Caucasian (11,623 | 22.9%).
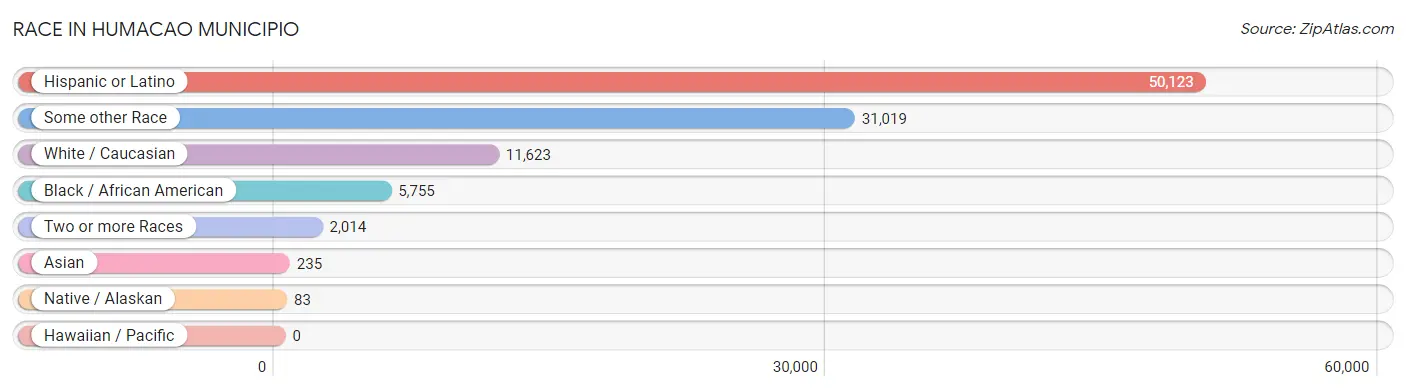
| Race | # Population | % Population |
| Asian | 235 | 0.5% |
| Black / African American | 5,755 | 11.3% |
| Hawaiian / Pacific | 0 | 0.0% |
| Hispanic or Latino | 50,123 | 98.8% |
| Native / Alaskan | 83 | 0.2% |
| White / Caucasian | 11,623 | 22.9% |
| Two or more Races | 2,014 | 4.0% |
| Some other Race | 31,019 | 61.2% |
| Total | 50,729 | 100.0% |
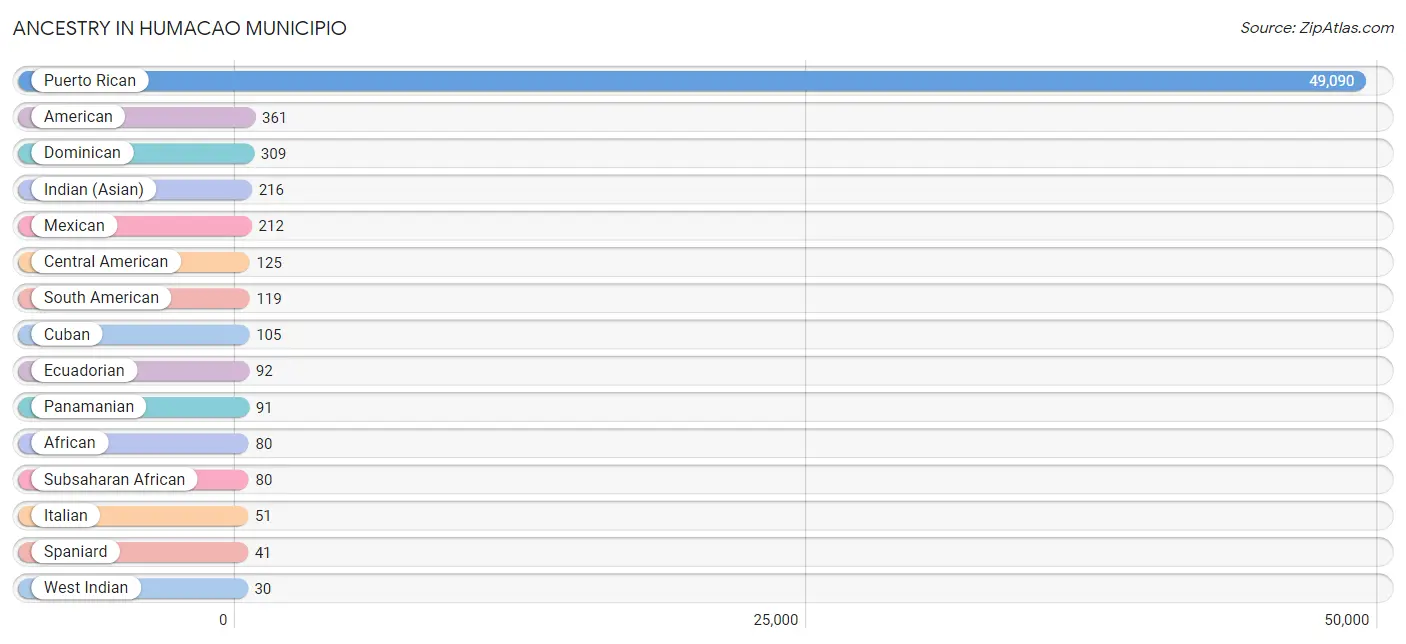
Ancestry in Humacao Municipio
The most populous ancestries reported in Humacao Municipio are Puerto Rican (49,090 | 96.8%), American (361 | 0.7%), Dominican (309 | 0.6%), Indian (Asian) (216 | 0.4%), and Mexican (212 | 0.4%), together accounting for 98.9% of all Humacao Municipio residents.
| Ancestry | # Population | % Population |
| African | 80 | 0.2% |
| American | 361 | 0.7% |
| Arab | 19 | 0.0% |
| Central American | 125 | 0.3% |
| Chilean | 19 | 0.0% |
| Colombian | 8 | 0.0% |
| Costa Rican | 10 | 0.0% |
| Cuban | 105 | 0.2% |
| Dominican | 309 | 0.6% |
| Ecuadorian | 92 | 0.2% |
| German | 28 | 0.1% |
| Guatemalan | 9 | 0.0% |
| Indian (Asian) | 216 | 0.4% |
| Italian | 51 | 0.1% |
| Mexican | 212 | 0.4% |
| Native Hawaiian | 16 | 0.0% |
| Palestinian | 19 | 0.0% |
| Panamanian | 91 | 0.2% |
| Puerto Rican | 49,090 | 96.8% |
| Salvadoran | 15 | 0.0% |
| South American | 119 | 0.2% |
| Spaniard | 41 | 0.1% |
| Subsaharan African | 80 | 0.2% |
| Thai | 19 | 0.0% |
| West Indian | 30 | 0.1% | View All 25 Rows |
Immigrants in Humacao Municipio

| Immigration Origin | # Population | % Population | View All 0 Rows |
Sex and Age in Humacao Municipio
Sex and Age in Humacao Municipio
The most populous age groups in Humacao Municipio are 55 to 59 Years (1,725 | 7.2%) for men and 55 to 59 Years (1,955 | 7.3%) for women.
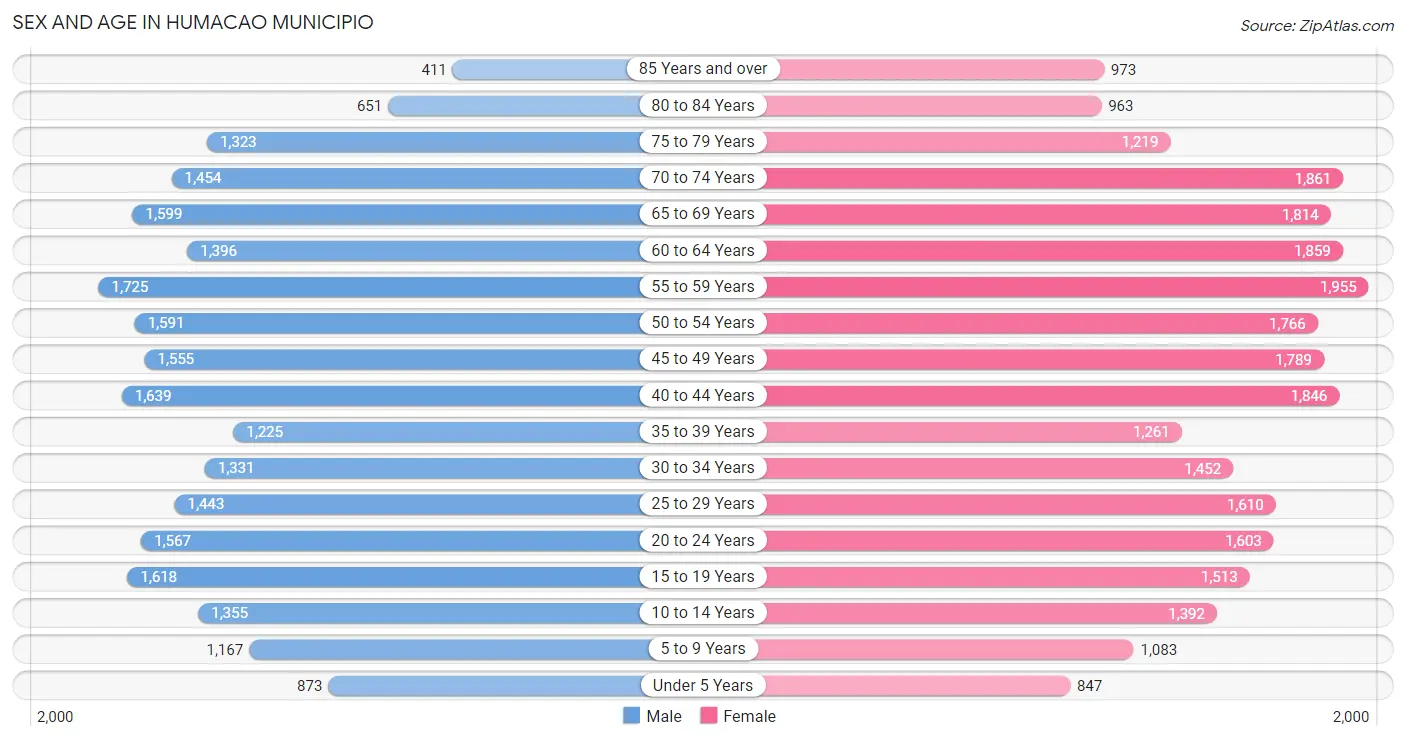
| Age Bracket | Male | Female |
| Under 5 Years | 873 (3.6%) | 847 (3.2%) |
| 5 to 9 Years | 1,167 (4.9%) | 1,083 (4.0%) |
| 10 to 14 Years | 1,355 (5.7%) | 1,392 (5.2%) |
| 15 to 19 Years | 1,618 (6.8%) | 1,513 (5.6%) |
| 20 to 24 Years | 1,567 (6.6%) | 1,603 (6.0%) |
| 25 to 29 Years | 1,443 (6.0%) | 1,610 (6.0%) |
| 30 to 34 Years | 1,331 (5.6%) | 1,452 (5.4%) |
| 35 to 39 Years | 1,225 (5.1%) | 1,261 (4.7%) |
| 40 to 44 Years | 1,639 (6.9%) | 1,846 (6.9%) |
| 45 to 49 Years | 1,555 (6.5%) | 1,789 (6.7%) |
| 50 to 54 Years | 1,591 (6.7%) | 1,766 (6.6%) |
| 55 to 59 Years | 1,725 (7.2%) | 1,955 (7.3%) |
| 60 to 64 Years | 1,396 (5.8%) | 1,859 (6.9%) |
| 65 to 69 Years | 1,599 (6.7%) | 1,814 (6.8%) |
| 70 to 74 Years | 1,454 (6.1%) | 1,861 (6.9%) |
| 75 to 79 Years | 1,323 (5.5%) | 1,219 (4.5%) |
| 80 to 84 Years | 651 (2.7%) | 963 (3.6%) |
| 85 Years and over | 411 (1.7%) | 973 (3.6%) |
| Total | 23,923 (100.0%) | 26,806 (100.0%) |
Families and Households in Humacao Municipio
Median Family Size in Humacao Municipio
The median family size in Humacao Municipio is 3.45 persons per family, with single male/father families (985 | 8.1%) accounting for the largest median family size of 4.21 persons per family. On the other hand, married-couple families (7,666 | 63.3%) represent the smallest median family size with 3.33 persons per family.
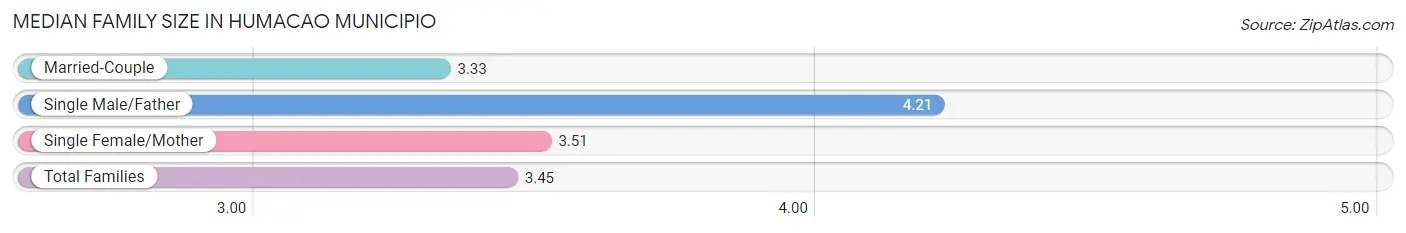
| Family Type | # Families | Family Size |
| Married-Couple | 7,666 (63.3%) | 3.33 |
| Single Male/Father | 985 (8.1%) | 4.21 |
| Single Female/Mother | 3,467 (28.6%) | 3.51 |
| Total Families | 12,118 (100.0%) | 3.45 |
Median Household Size in Humacao Municipio
The median household size in Humacao Municipio is 2.76 persons per household, with single male/father households (985 | 5.4%) accounting for the largest median household size of 4.79 persons per household. non-family households (6,088 | 33.4%) represent the smallest median household size with 1.14 persons per household.
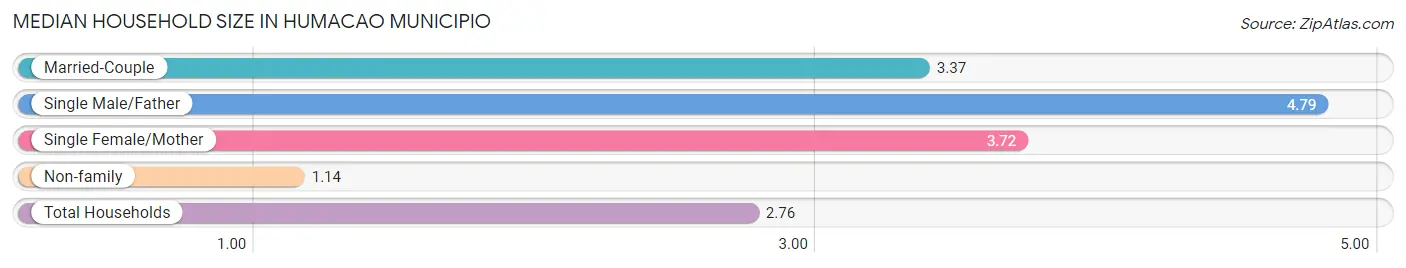
| Household Type | # Households | Household Size |
| Married-Couple | 7,666 (42.1%) | 3.37 |
| Single Male/Father | 985 (5.4%) | 4.79 |
| Single Female/Mother | 3,467 (19.0%) | 3.72 |
| Non-family | 6,088 (33.4%) | 1.14 |
| Total Households | 18,206 (100.0%) | 2.76 |
Household Size by Marriage Status in Humacao Municipio
Out of a total of 18,206 households in Humacao Municipio, 12,118 (66.6%) are family households, while 6,088 (33.4%) are nonfamily households. The most numerous type of family households are 2-person households, comprising 5,817, and the most common type of nonfamily households are 1-person households, comprising 5,444.
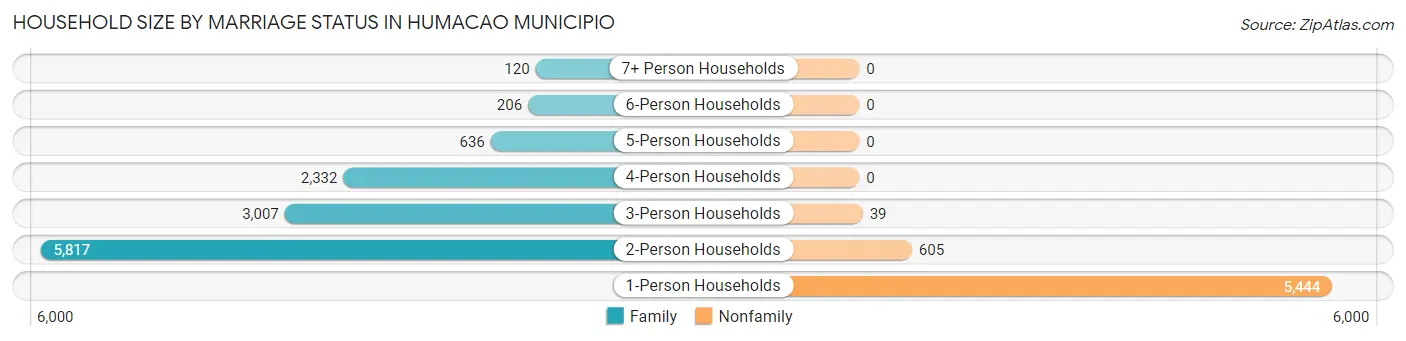
| Household Size | Family Households | Nonfamily Households |
| 1-Person Households | - | 5,444 (29.9%) |
| 2-Person Households | 5,817 (32.0%) | 605 (3.3%) |
| 3-Person Households | 3,007 (16.5%) | 39 (0.2%) |
| 4-Person Households | 2,332 (12.8%) | 0 (0.0%) |
| 5-Person Households | 636 (3.5%) | 0 (0.0%) |
| 6-Person Households | 206 (1.1%) | 0 (0.0%) |
| 7+ Person Households | 120 (0.7%) | 0 (0.0%) |
| Total | 12,118 (66.6%) | 6,088 (33.4%) |
Female Fertility in Humacao Municipio
Fertility by Age in Humacao Municipio
Average fertility rate in Humacao Municipio is 20.0 births per 1,000 women. Women in the age bracket of 20 to 34 years have the highest fertility rate with 35.0 births per 1,000 women. Women in the age bracket of 20 to 34 years acount for 68.8% of all women with births.
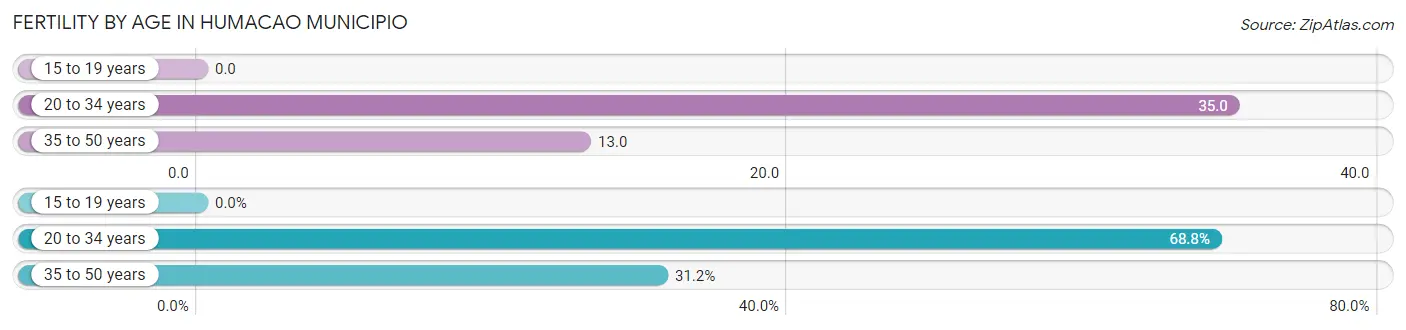
| Age Bracket | Women with Births | Births / 1,000 Women |
| 15 to 19 years | 0 (0.0%) | 0.0 |
| 20 to 34 years | 163 (68.8%) | 35.0 |
| 35 to 50 years | 74 (31.2%) | 13.0 |
| Total | 237 (100.0%) | 20.0 |
Fertility by Age by Marriage Status in Humacao Municipio
49.4% of women with births (237) in Humacao Municipio are married. The highest percentage of unmarried women with births falls into 20 to 34 years age bracket with 62.0% of them unmarried at the time of birth, while the lowest percentage of unmarried women with births belong to 35 to 50 years age bracket with 25.7% of them unmarried.
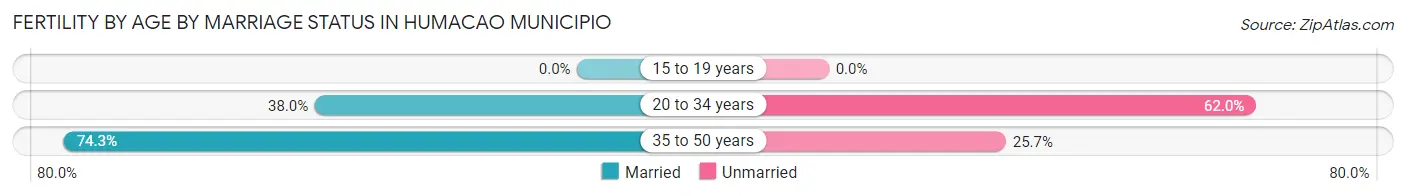
| Age Bracket | Married | Unmarried |
| 15 to 19 years | 0 (0.0%) | 0 (0.0%) |
| 20 to 34 years | 62 (38.0%) | 101 (62.0%) |
| 35 to 50 years | 55 (74.3%) | 19 (25.7%) |
| Total | 117 (49.4%) | 120 (50.6%) |
Fertility by Education in Humacao Municipio
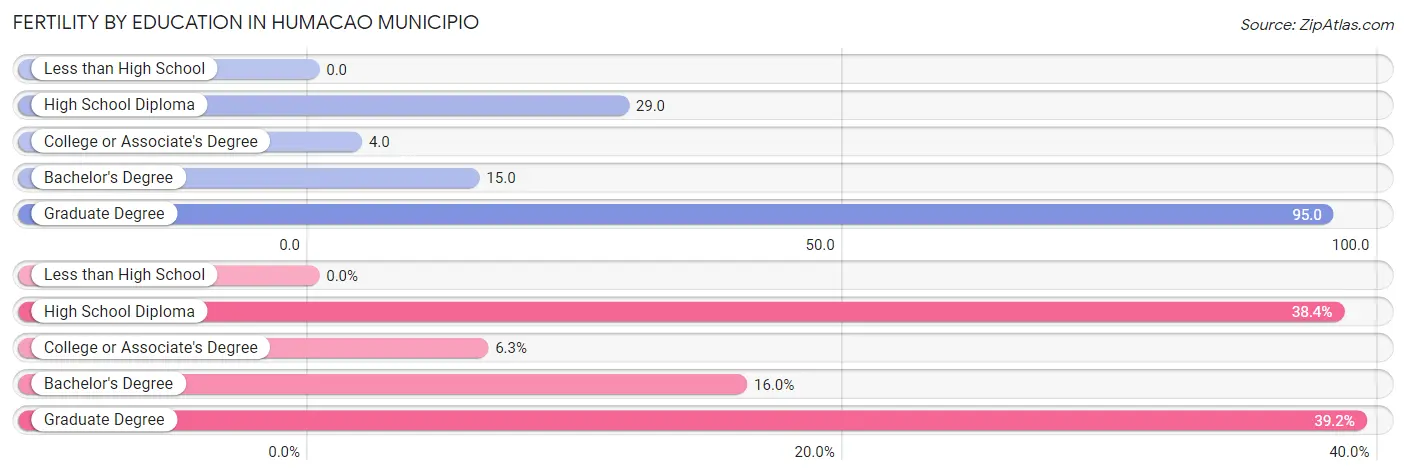
| Educational Attainment | Women with Births | Births / 1,000 Women |
| Less than High School | 0 (0.0%) | 0.0 |
| High School Diploma | 91 (38.4%) | 29.0 |
| College or Associate's Degree | 15 (6.3%) | 4.0 |
| Bachelor's Degree | 38 (16.0%) | 15.0 |
| Graduate Degree | 93 (39.2%) | 95.0 |
| Total | 237 (100.0%) | 20.0 |
Fertility by Education by Marriage Status in Humacao Municipio
50.6% of women with births in Humacao Municipio are unmarried. Women with the educational attainment of college or associate's degree are most likely to be married with 100.0% of them married at childbirth, while women with the educational attainment of bachelor's degree are least likely to be married with 100.0% of them unmarried at childbirth.
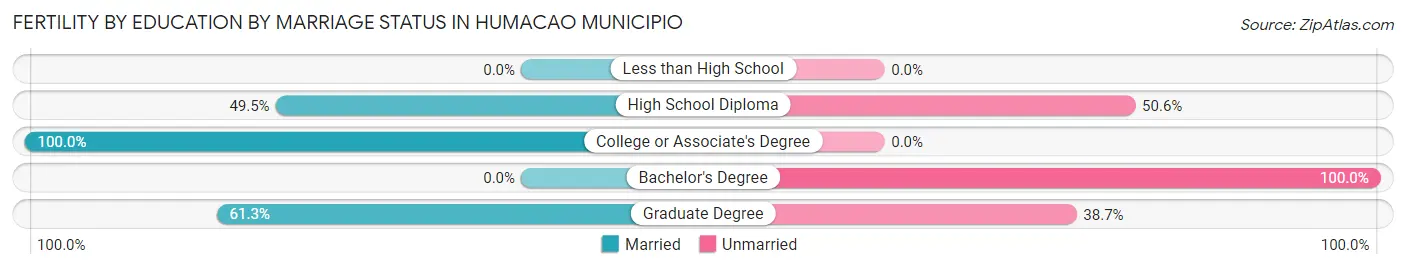
| Educational Attainment | Married | Unmarried |
| Less than High School | 0 (0.0%) | 0 (0.0%) |
| High School Diploma | 45 (49.4%) | 46 (50.5%) |
| College or Associate's Degree | 15 (100.0%) | 0 (0.0%) |
| Bachelor's Degree | 0 (0.0%) | 38 (100.0%) |
| Graduate Degree | 57 (61.3%) | 36 (38.7%) |
| Total | 117 (49.4%) | 120 (50.6%) |
Employment Characteristics in Humacao Municipio
Employment by Class of Employer in Humacao Municipio
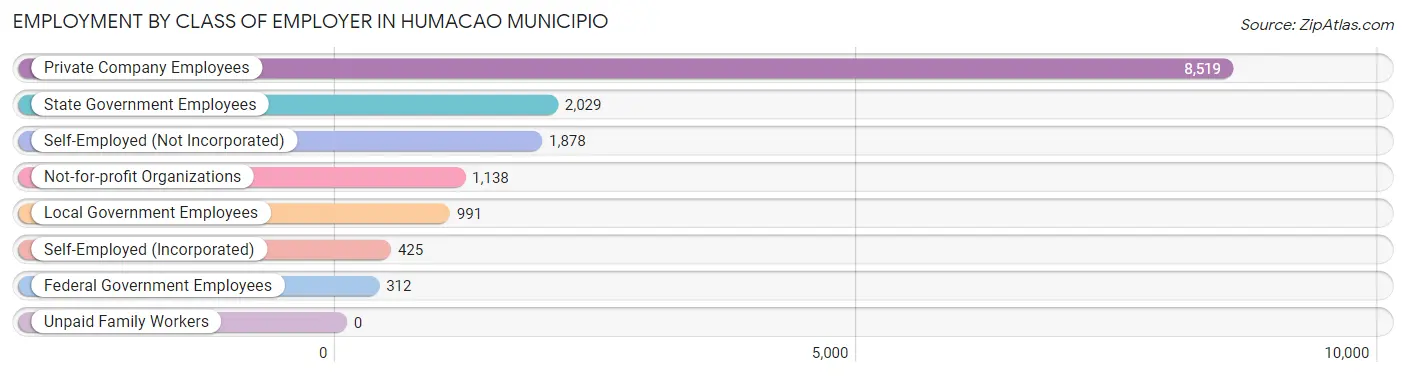
Among the 15,292 employed individuals in Humacao Municipio, private company employees (8,519 | 55.7%), state government employees (2,029 | 13.3%), and self-employed (not incorporated) (1,878 | 12.3%) make up the most common classes of employment.
| Employer Class | # Employees | % Employees |
| Private Company Employees | 8,519 | 55.7% |
| Self-Employed (Incorporated) | 425 | 2.8% |
| Self-Employed (Not Incorporated) | 1,878 | 12.3% |
| Not-for-profit Organizations | 1,138 | 7.4% |
| Local Government Employees | 991 | 6.5% |
| State Government Employees | 2,029 | 13.3% |
| Federal Government Employees | 312 | 2.0% |
| Unpaid Family Workers | 0 | 0.0% |
| Total | 15,292 | 100.0% |
Employment Status by Age in Humacao Municipio
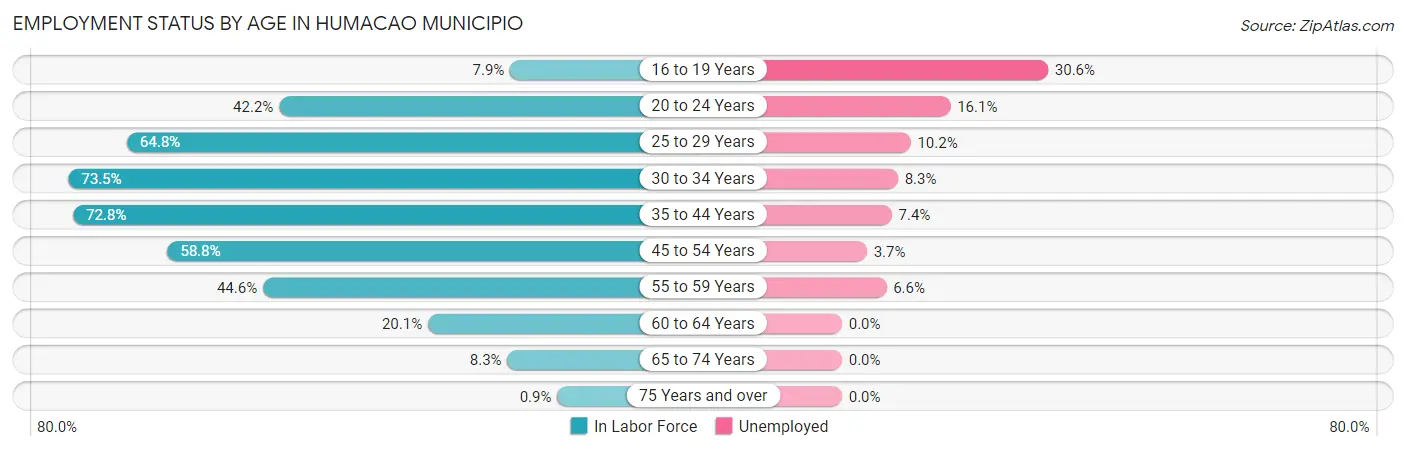
According to the labor force statistics for Humacao Municipio, out of the total population over 16 years of age (43,357), 38.6% or 16,736 individuals are in the labor force, with 7.3% or 1,222 of them unemployed. The age group with the highest labor force participation rate is 30 to 34 years, with 73.5% or 2,046 individuals in the labor force. Within the labor force, the 16 to 19 years age range has the highest percentage of unemployed individuals, with 30.6% or 60 of them being unemployed.
| Age Bracket | In Labor Force | Unemployed |
| 16 to 19 Years | 196 (7.9%) | 60 (30.6%) |
| 20 to 24 Years | 1,338 (42.2%) | 215 (16.1%) |
| 25 to 29 Years | 1,978 (64.8%) | 202 (10.2%) |
| 30 to 34 Years | 2,046 (73.5%) | 170 (8.3%) |
| 35 to 44 Years | 4,347 (72.8%) | 322 (7.4%) |
| 45 to 54 Years | 3,940 (58.8%) | 146 (3.7%) |
| 55 to 59 Years | 1,641 (44.6%) | 108 (6.6%) |
| 60 to 64 Years | 654 (20.1%) | 0 (0.0%) |
| 65 to 74 Years | 558 (8.3%) | 0 (0.0%) |
| 75 Years and over | 50 (0.9%) | 0 (0.0%) |
| Total | 16,736 (38.6%) | 1,222 (7.3%) |
Employment Status by Educational Attainment in Humacao Municipio
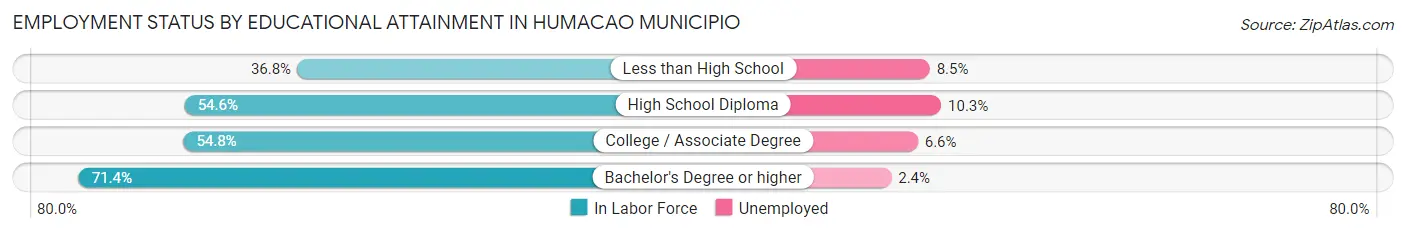
According to labor force statistics for Humacao Municipio, 57.4% of individuals (14,604) out of the total population between 25 and 64 years of age (25,443) are in the labor force, with 6.5% or 949 of them being unemployed. The group with the highest labor force participation rate are those with the educational attainment of bachelor's degree or higher, with 71.4% or 5,195 individuals in the labor force. Within the labor force, individuals with high school diploma education have the highest percentage of unemployment, with 10.3% or 497 of them being unemployed.
| Educational Attainment | In Labor Force | Unemployed |
| Less than High School | 1,088 (36.8%) | 251 (8.5%) |
| High School Diploma | 4,824 (54.6%) | 910 (10.3%) |
| College / Associate Degree | 3,494 (54.8%) | 421 (6.6%) |
| Bachelor's Degree or higher | 5,195 (71.4%) | 175 (2.4%) |
| Total | 14,604 (57.4%) | 1,654 (6.5%) |
Employment Occupations by Sex in Humacao Municipio
Management, Business, Science and Arts Occupations
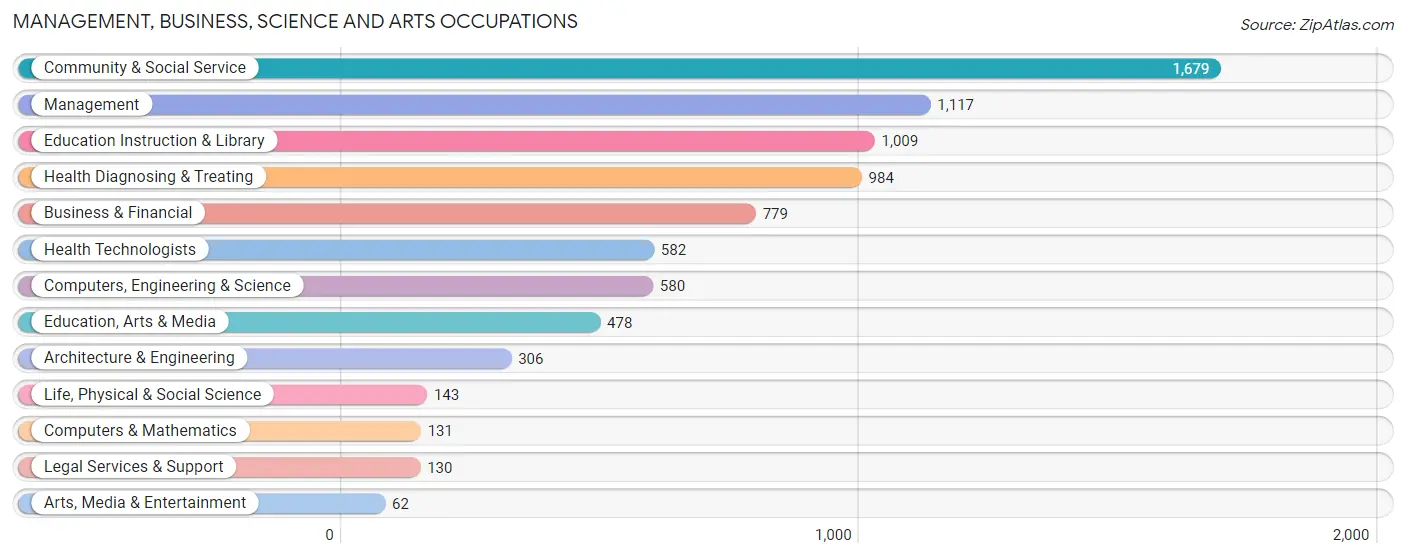
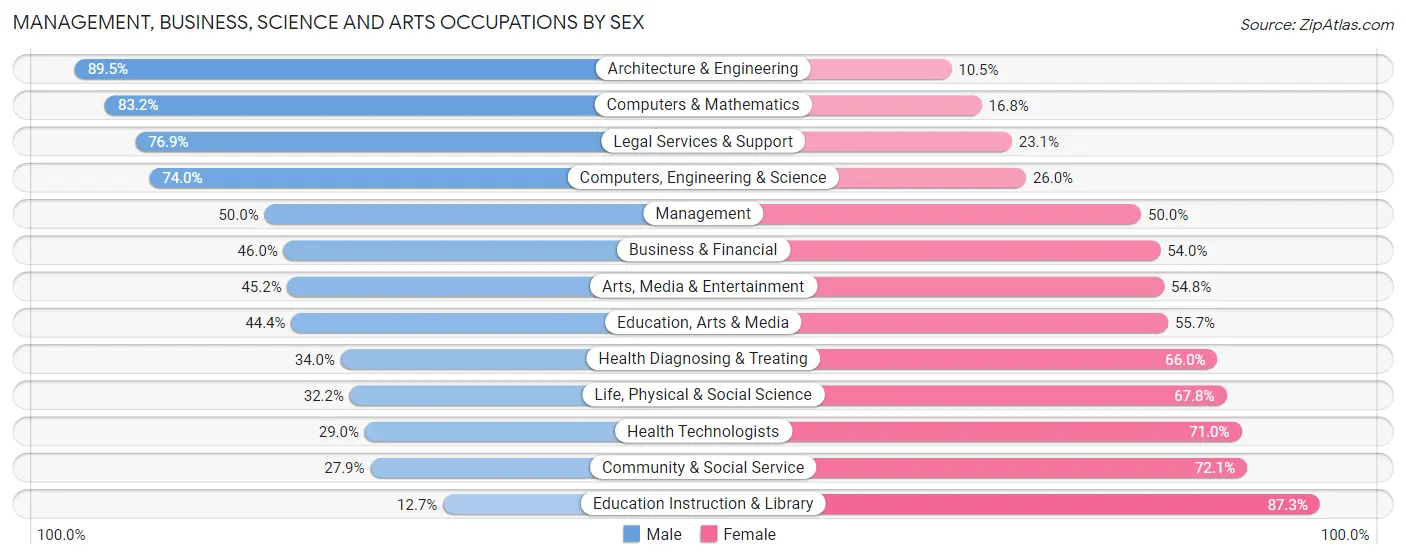
The most common Management, Business, Science and Arts occupations in Humacao Municipio are Community & Social Service (1,679 | 10.8%), Management (1,117 | 7.2%), Education Instruction & Library (1,009 | 6.5%), Health Diagnosing & Treating (984 | 6.3%), and Business & Financial (779 | 5.0%).
Management, Business, Science and Arts Occupations by Sex
Within the Management, Business, Science and Arts occupations in Humacao Municipio, the most male-oriented occupations are Architecture & Engineering (89.5%), Computers & Mathematics (83.2%), and Legal Services & Support (76.9%), while the most female-oriented occupations are Education Instruction & Library (87.3%), Community & Social Service (72.1%), and Health Technologists (71.0%).
| Occupation | Male | Female |
| Management | 558 (50.0%) | 559 (50.0%) |
| Business & Financial | 358 (46.0%) | 421 (54.0%) |
| Computers, Engineering & Science | 429 (74.0%) | 151 (26.0%) |
| Computers & Mathematics | 109 (83.2%) | 22 (16.8%) |
| Architecture & Engineering | 274 (89.5%) | 32 (10.5%) |
| Life, Physical & Social Science | 46 (32.2%) | 97 (67.8%) |
| Community & Social Service | 468 (27.9%) | 1,211 (72.1%) |
| Education, Arts & Media | 212 (44.4%) | 266 (55.6%) |
| Legal Services & Support | 100 (76.9%) | 30 (23.1%) |
| Education Instruction & Library | 128 (12.7%) | 881 (87.3%) |
| Arts, Media & Entertainment | 28 (45.2%) | 34 (54.8%) |
| Health Diagnosing & Treating | 335 (34.0%) | 649 (66.0%) |
| Health Technologists | 169 (29.0%) | 413 (71.0%) |
| Total (Category) | 2,148 (41.8%) | 2,991 (58.2%) |
| Total (Overall) | 8,451 (54.5%) | 7,058 (45.5%) |
Services Occupations
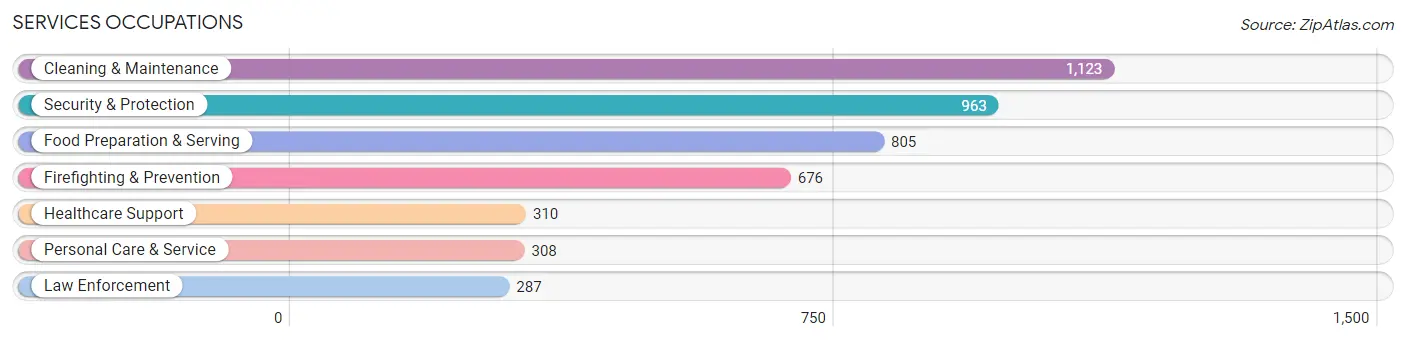
The most common Services occupations in Humacao Municipio are Cleaning & Maintenance (1,123 | 7.2%), Security & Protection (963 | 6.2%), Food Preparation & Serving (805 | 5.2%), Firefighting & Prevention (676 | 4.4%), and Healthcare Support (310 | 2.0%).
Services Occupations by Sex
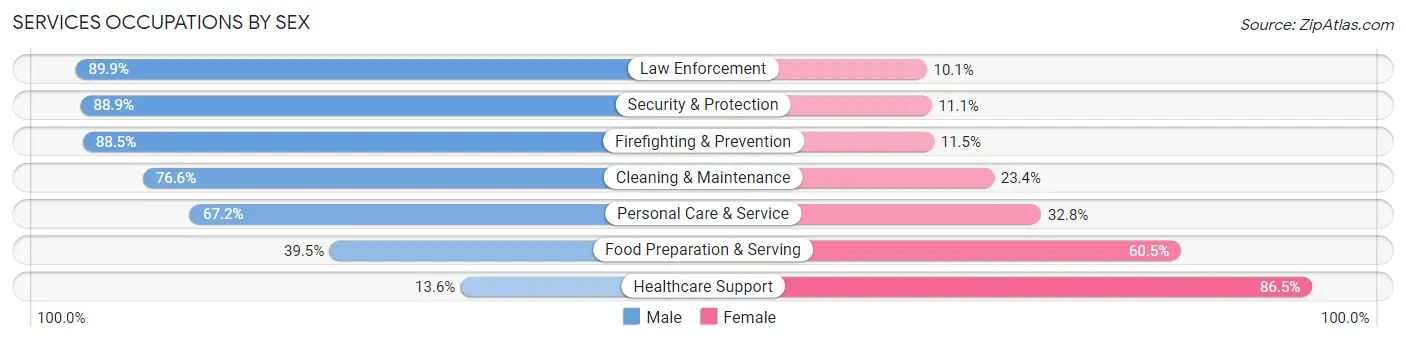
Within the Services occupations in Humacao Municipio, the most male-oriented occupations are Law Enforcement (89.9%), Security & Protection (88.9%), and Firefighting & Prevention (88.5%), while the most female-oriented occupations are Healthcare Support (86.5%), Food Preparation & Serving (60.5%), and Personal Care & Service (32.8%).
| Occupation | Male | Female |
| Healthcare Support | 42 (13.6%) | 268 (86.5%) |
| Security & Protection | 856 (88.9%) | 107 (11.1%) |
| Firefighting & Prevention | 598 (88.5%) | 78 (11.5%) |
| Law Enforcement | 258 (89.9%) | 29 (10.1%) |
| Food Preparation & Serving | 318 (39.5%) | 487 (60.5%) |
| Cleaning & Maintenance | 860 (76.6%) | 263 (23.4%) |
| Personal Care & Service | 207 (67.2%) | 101 (32.8%) |
| Total (Category) | 2,283 (65.1%) | 1,226 (34.9%) |
| Total (Overall) | 8,451 (54.5%) | 7,058 (45.5%) |
Sales and Office Occupations
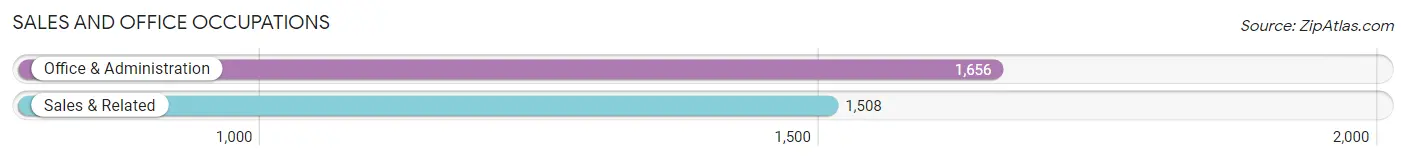
The most common Sales and Office occupations in Humacao Municipio are Office & Administration (1,656 | 10.7%), and Sales & Related (1,508 | 9.7%).
Sales and Office Occupations by Sex
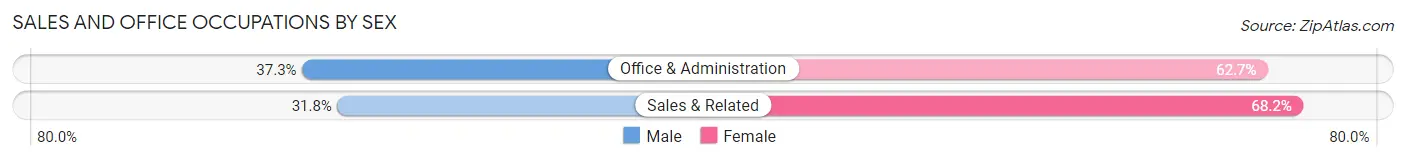
| Occupation | Male | Female |
| Sales & Related | 480 (31.8%) | 1,028 (68.2%) |
| Office & Administration | 617 (37.3%) | 1,039 (62.7%) |
| Total (Category) | 1,097 (34.7%) | 2,067 (65.3%) |
| Total (Overall) | 8,451 (54.5%) | 7,058 (45.5%) |
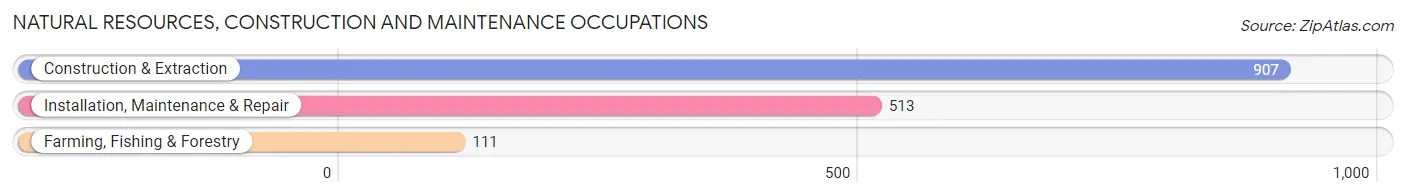
Natural Resources, Construction and Maintenance Occupations
The most common Natural Resources, Construction and Maintenance occupations in Humacao Municipio are Construction & Extraction (907 | 5.9%), Installation, Maintenance & Repair (513 | 3.3%), and Farming, Fishing & Forestry (111 | 0.7%).
Natural Resources, Construction and Maintenance Occupations by Sex
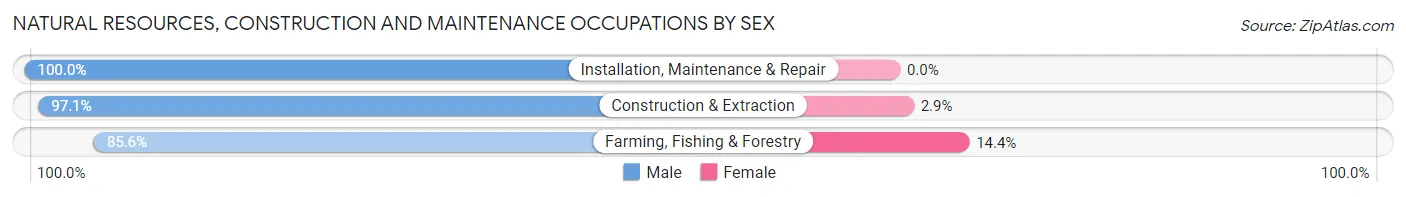
| Occupation | Male | Female |
| Farming, Fishing & Forestry | 95 (85.6%) | 16 (14.4%) |
| Construction & Extraction | 881 (97.1%) | 26 (2.9%) |
| Installation, Maintenance & Repair | 513 (100.0%) | 0 (0.0%) |
| Total (Category) | 1,489 (97.3%) | 42 (2.7%) |
| Total (Overall) | 8,451 (54.5%) | 7,058 (45.5%) |
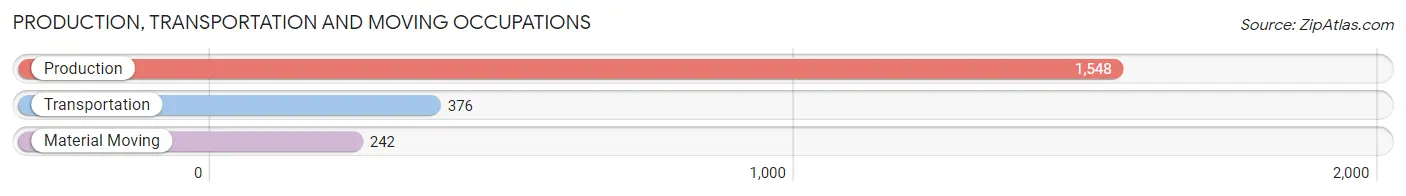
Production, Transportation and Moving Occupations
The most common Production, Transportation and Moving occupations in Humacao Municipio are Production (1,548 | 10.0%), Transportation (376 | 2.4%), and Material Moving (242 | 1.6%).
Production, Transportation and Moving Occupations by Sex
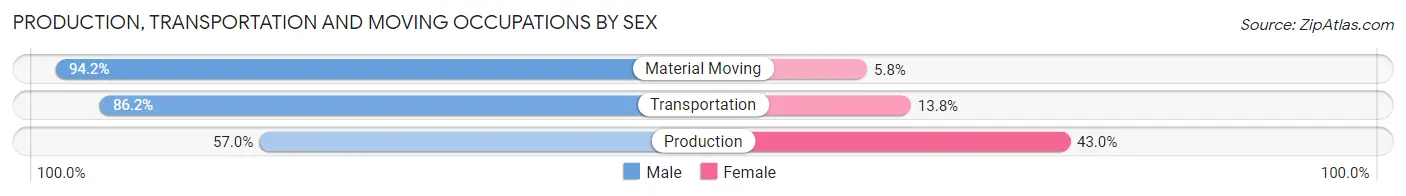
| Occupation | Male | Female |
| Production | 882 (57.0%) | 666 (43.0%) |
| Transportation | 324 (86.2%) | 52 (13.8%) |
| Material Moving | 228 (94.2%) | 14 (5.8%) |
| Total (Category) | 1,434 (66.2%) | 732 (33.8%) |
| Total (Overall) | 8,451 (54.5%) | 7,058 (45.5%) |
Employment Industries by Sex in Humacao Municipio
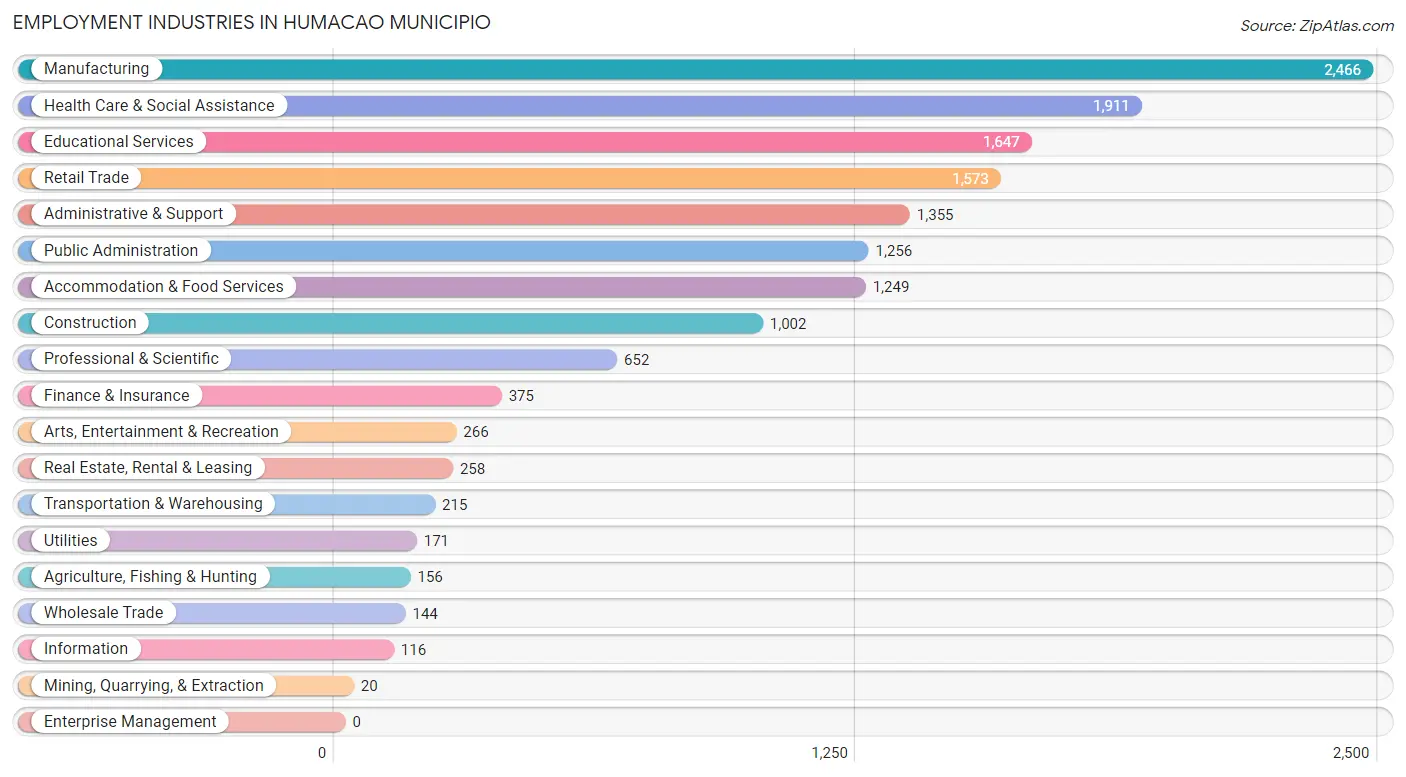
Employment Industries in Humacao Municipio
The major employment industries in Humacao Municipio include Manufacturing (2,466 | 15.9%), Health Care & Social Assistance (1,911 | 12.3%), Educational Services (1,647 | 10.6%), Retail Trade (1,573 | 10.1%), and Administrative & Support (1,355 | 8.7%).
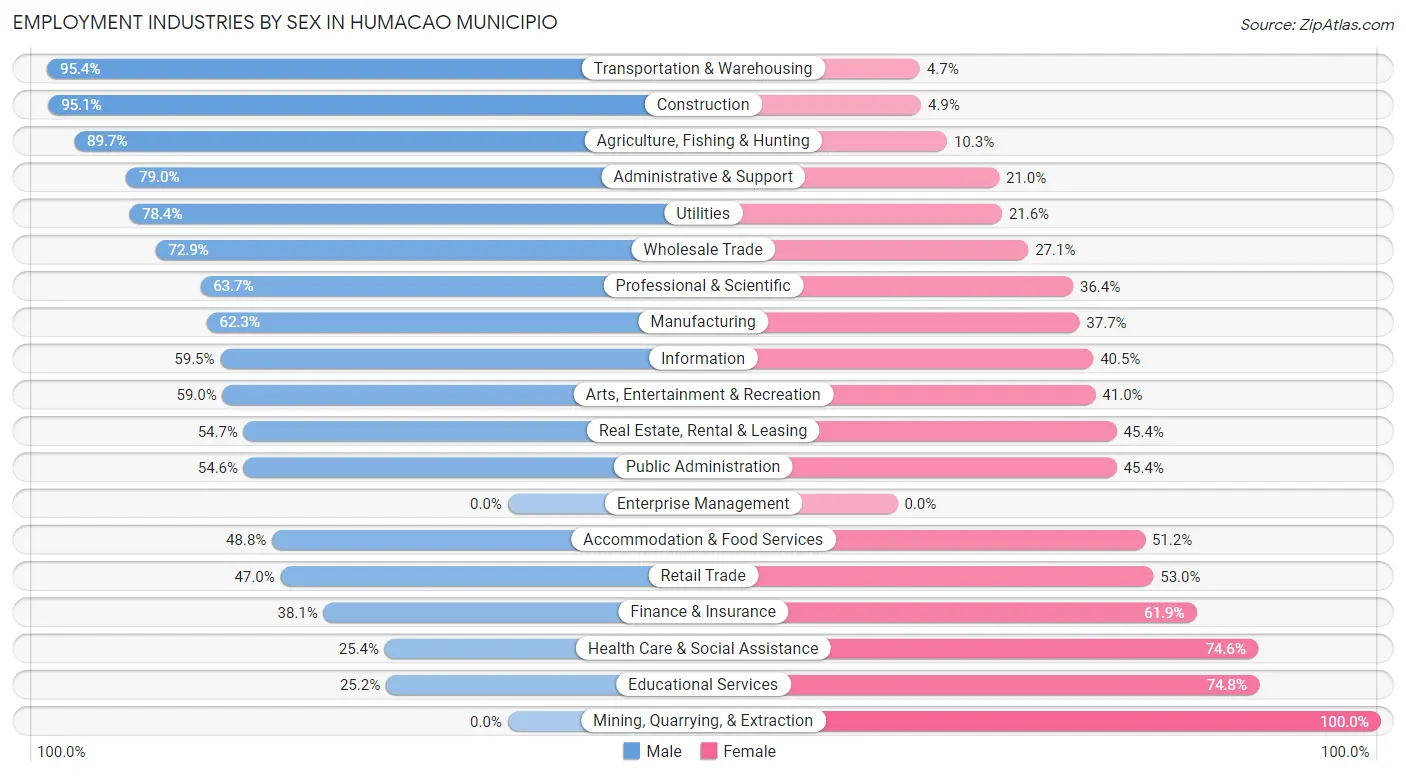
Employment Industries by Sex in Humacao Municipio
The Humacao Municipio industries that see more men than women are Transportation & Warehousing (95.4%), Construction (95.1%), and Agriculture, Fishing & Hunting (89.7%), whereas the industries that tend to have a higher number of women are Mining, Quarrying, & Extraction (100.0%), Educational Services (74.8%), and Health Care & Social Assistance (74.6%).
| Industry | Male | Female |
| Agriculture, Fishing & Hunting | 140 (89.7%) | 16 (10.3%) |
| Mining, Quarrying, & Extraction | 0 (0.0%) | 20 (100.0%) |
| Construction | 953 (95.1%) | 49 (4.9%) |
| Manufacturing | 1,537 (62.3%) | 929 (37.7%) |
| Wholesale Trade | 105 (72.9%) | 39 (27.1%) |
| Retail Trade | 740 (47.0%) | 833 (53.0%) |
| Transportation & Warehousing | 205 (95.4%) | 10 (4.6%) |
| Utilities | 134 (78.4%) | 37 (21.6%) |
| Information | 69 (59.5%) | 47 (40.5%) |
| Finance & Insurance | 143 (38.1%) | 232 (61.9%) |
| Real Estate, Rental & Leasing | 141 (54.6%) | 117 (45.4%) |
| Professional & Scientific | 415 (63.6%) | 237 (36.3%) |
| Enterprise Management | 0 (0.0%) | 0 (0.0%) |
| Administrative & Support | 1,070 (79.0%) | 285 (21.0%) |
| Educational Services | 415 (25.2%) | 1,232 (74.8%) |
| Health Care & Social Assistance | 486 (25.4%) | 1,425 (74.6%) |
| Arts, Entertainment & Recreation | 157 (59.0%) | 109 (41.0%) |
| Accommodation & Food Services | 609 (48.8%) | 640 (51.2%) |
| Public Administration | 686 (54.6%) | 570 (45.4%) |
| Total | 8,451 (54.5%) | 7,058 (45.5%) |
Education in Humacao Municipio
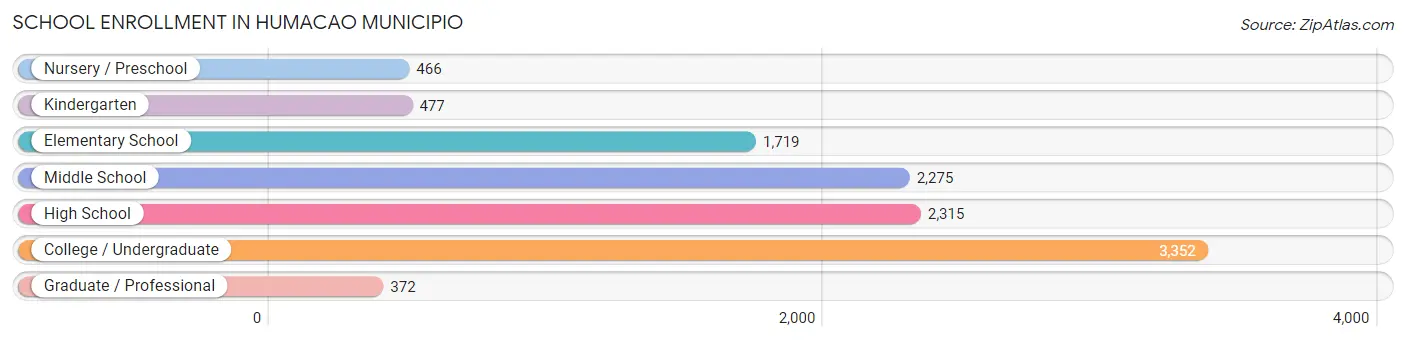
School Enrollment in Humacao Municipio
The most common levels of schooling among the 10,976 students in Humacao Municipio are college / undergraduate (3,352 | 30.5%), high school (2,315 | 21.1%), and middle school (2,275 | 20.7%).
| School Level | # Students | % Students |
| Nursery / Preschool | 466 | 4.3% |
| Kindergarten | 477 | 4.3% |
| Elementary School | 1,719 | 15.7% |
| Middle School | 2,275 | 20.7% |
| High School | 2,315 | 21.1% |
| College / Undergraduate | 3,352 | 30.5% |
| Graduate / Professional | 372 | 3.4% |
| Total | 10,976 | 100.0% |
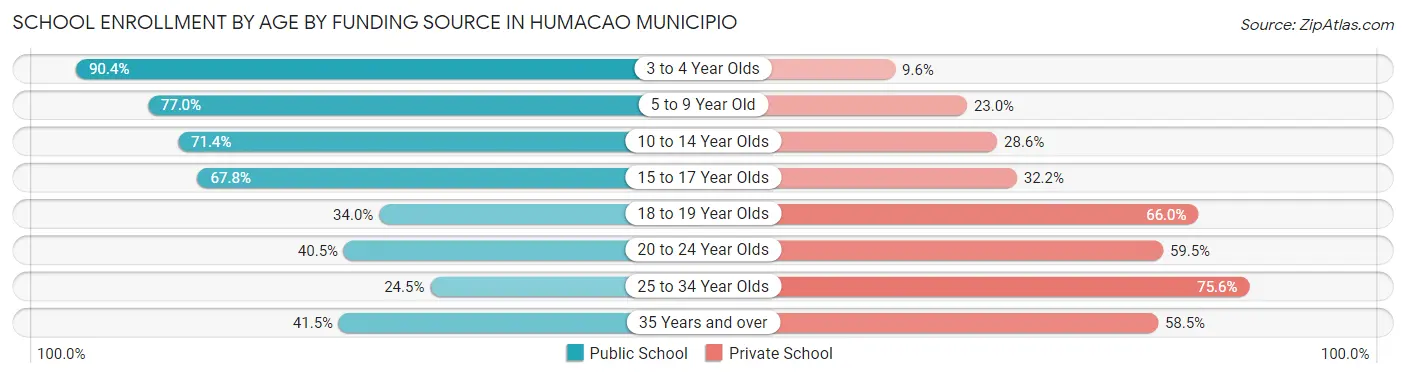
School Enrollment by Age by Funding Source in Humacao Municipio
Out of a total of 10,976 students who are enrolled in schools in Humacao Municipio, 4,325 (39.4%) attend a private institution, while the remaining 6,651 (60.6%) are enrolled in public schools. The age group of 25 to 34 year olds has the highest likelihood of being enrolled in private schools, with 553 (75.5% in the age bracket) enrolled. Conversely, the age group of 3 to 4 year olds has the lowest likelihood of being enrolled in a private school, with 491 (90.4% in the age bracket) attending a public institution.
| Age Bracket | Public School | Private School |
| 3 to 4 Year Olds | 491 (90.4%) | 52 (9.6%) |
| 5 to 9 Year Old | 1,634 (77.0%) | 487 (23.0%) |
| 10 to 14 Year Olds | 1,962 (71.4%) | 785 (28.6%) |
| 15 to 17 Year Olds | 1,221 (67.8%) | 581 (32.2%) |
| 18 to 19 Year Olds | 377 (34.0%) | 733 (66.0%) |
| 20 to 24 Year Olds | 629 (40.5%) | 923 (59.5%) |
| 25 to 34 Year Olds | 179 (24.4%) | 553 (75.5%) |
| 35 Years and over | 153 (41.5%) | 216 (58.5%) |
| Total | 6,651 (60.6%) | 4,325 (39.4%) |
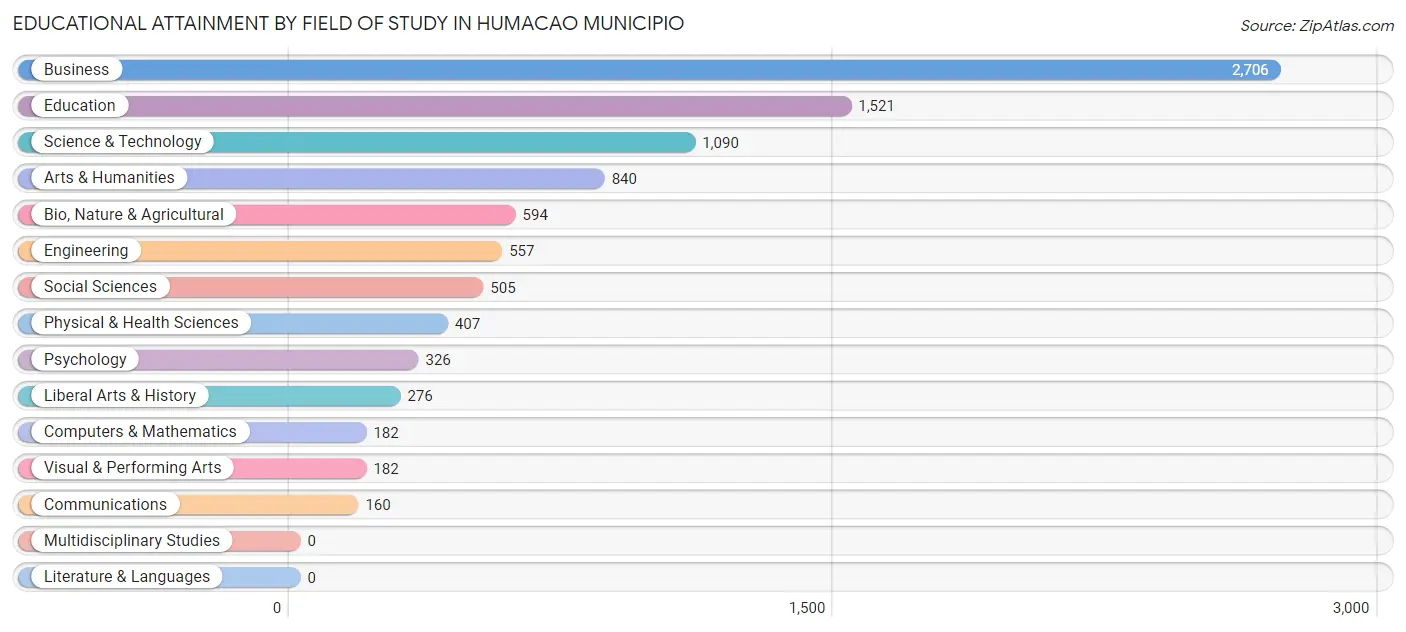
Educational Attainment by Field of Study in Humacao Municipio
Business (2,706 | 28.9%), education (1,521 | 16.3%), science & technology (1,090 | 11.7%), arts & humanities (840 | 9.0%), and bio, nature & agricultural (594 | 6.4%) are the most common fields of study among 9,346 individuals in Humacao Municipio who have obtained a bachelor's degree or higher.
| Field of Study | # Graduates | % Graduates |
| Computers & Mathematics | 182 | 1.9% |
| Bio, Nature & Agricultural | 594 | 6.4% |
| Physical & Health Sciences | 407 | 4.3% |
| Psychology | 326 | 3.5% |
| Social Sciences | 505 | 5.4% |
| Engineering | 557 | 6.0% |
| Multidisciplinary Studies | 0 | 0.0% |
| Science & Technology | 1,090 | 11.7% |
| Business | 2,706 | 28.9% |
| Education | 1,521 | 16.3% |
| Literature & Languages | 0 | 0.0% |
| Liberal Arts & History | 276 | 2.9% |
| Visual & Performing Arts | 182 | 1.9% |
| Communications | 160 | 1.7% |
| Arts & Humanities | 840 | 9.0% |
| Total | 9,346 | 100.0% |
Transportation & Commute in Humacao Municipio
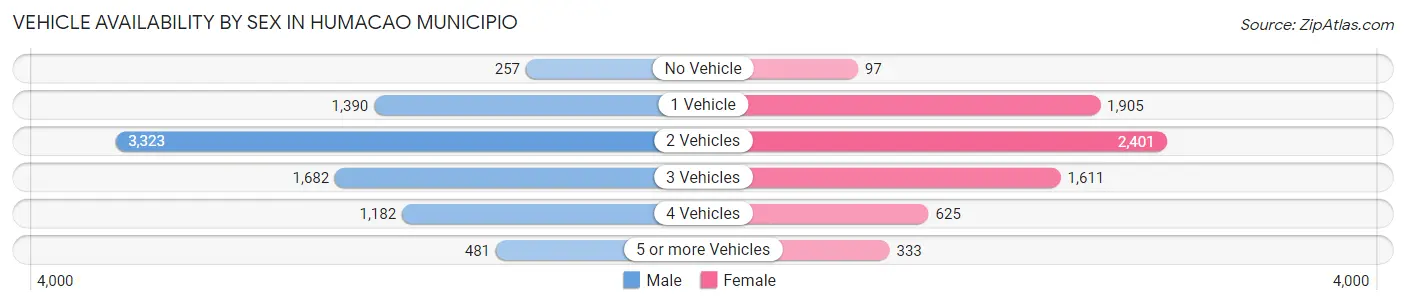
Vehicle Availability by Sex in Humacao Municipio
The most prevalent vehicle ownership categories in Humacao Municipio are males with 2 vehicles (3,323, accounting for 40.0%) and females with 2 vehicles (2,401, making up 47.7%).
| Vehicles Available | Male | Female |
| No Vehicle | 257 (3.1%) | 97 (1.4%) |
| 1 Vehicle | 1,390 (16.7%) | 1,905 (27.3%) |
| 2 Vehicles | 3,323 (40.0%) | 2,401 (34.4%) |
| 3 Vehicles | 1,682 (20.2%) | 1,611 (23.1%) |
| 4 Vehicles | 1,182 (14.2%) | 625 (9.0%) |
| 5 or more Vehicles | 481 (5.8%) | 333 (4.8%) |
| Total | 8,315 (100.0%) | 6,972 (100.0%) |
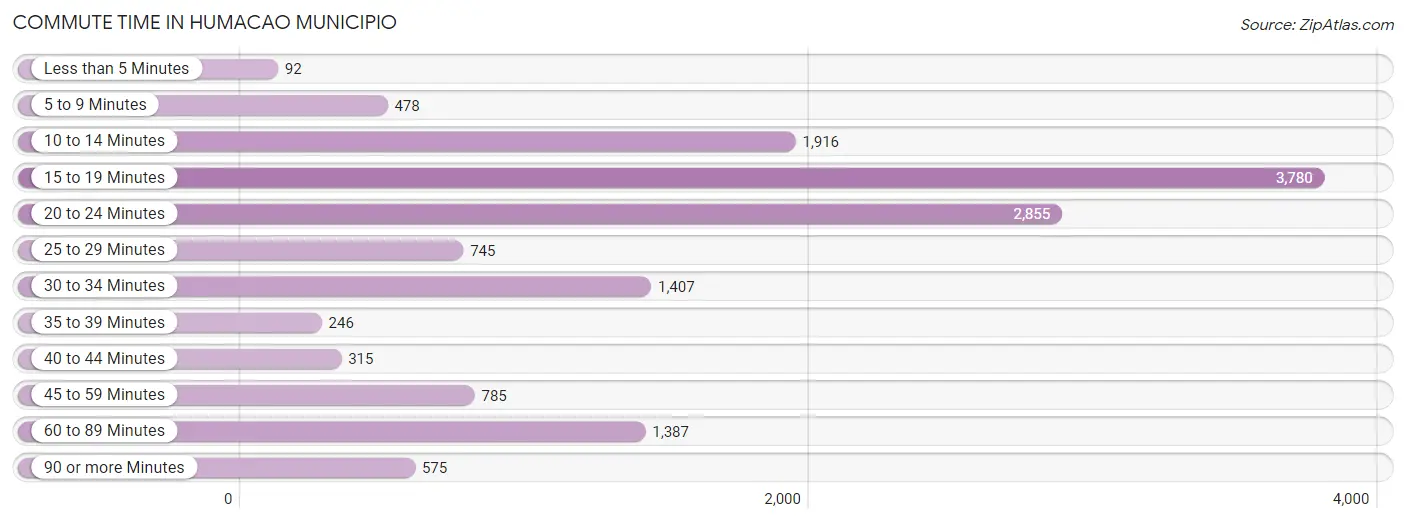
Commute Time in Humacao Municipio
The most frequently occuring commute durations in Humacao Municipio are 15 to 19 minutes (3,780 commuters, 25.9%), 20 to 24 minutes (2,855 commuters, 19.6%), and 10 to 14 minutes (1,916 commuters, 13.1%).
| Commute Time | # Commuters | % Commuters |
| Less than 5 Minutes | 92 | 0.6% |
| 5 to 9 Minutes | 478 | 3.3% |
| 10 to 14 Minutes | 1,916 | 13.1% |
| 15 to 19 Minutes | 3,780 | 25.9% |
| 20 to 24 Minutes | 2,855 | 19.6% |
| 25 to 29 Minutes | 745 | 5.1% |
| 30 to 34 Minutes | 1,407 | 9.7% |
| 35 to 39 Minutes | 246 | 1.7% |
| 40 to 44 Minutes | 315 | 2.2% |
| 45 to 59 Minutes | 785 | 5.4% |
| 60 to 89 Minutes | 1,387 | 9.5% |
| 90 or more Minutes | 575 | 3.9% |
Commute Time by Sex in Humacao Municipio
The most common commute times in Humacao Municipio are 15 to 19 minutes (1,741 commuters, 22.0%) for males and 15 to 19 minutes (2,039 commuters, 30.5%) for females.
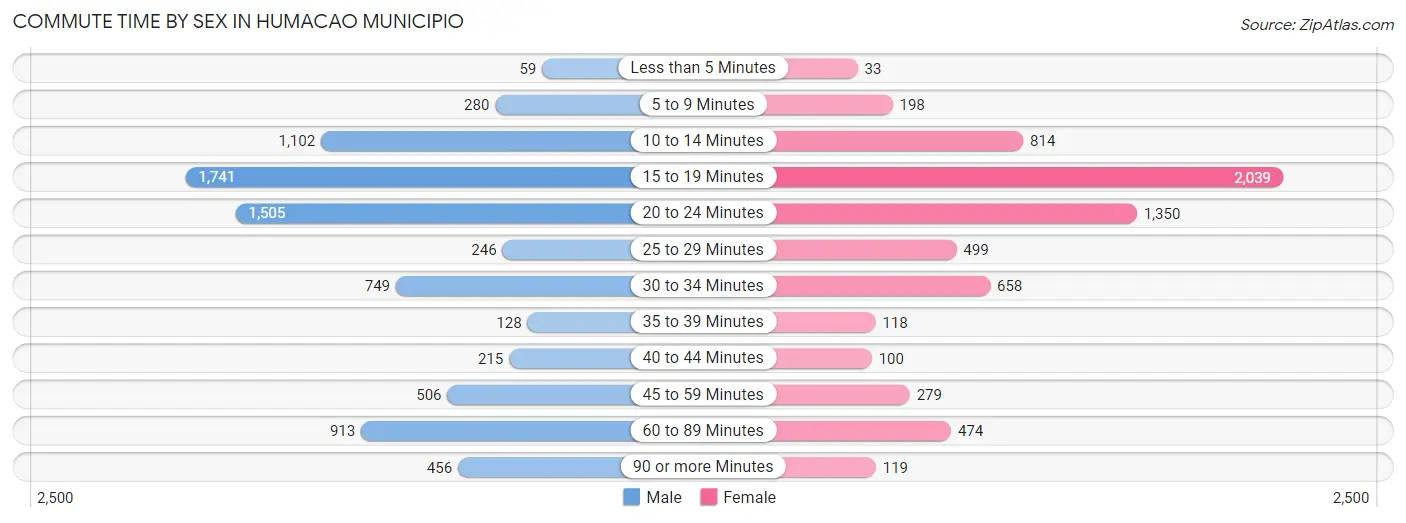
| Commute Time | Male | Female |
| Less than 5 Minutes | 59 (0.7%) | 33 (0.5%) |
| 5 to 9 Minutes | 280 (3.5%) | 198 (3.0%) |
| 10 to 14 Minutes | 1,102 (14.0%) | 814 (12.2%) |
| 15 to 19 Minutes | 1,741 (22.0%) | 2,039 (30.5%) |
| 20 to 24 Minutes | 1,505 (19.1%) | 1,350 (20.2%) |
| 25 to 29 Minutes | 246 (3.1%) | 499 (7.5%) |
| 30 to 34 Minutes | 749 (9.5%) | 658 (9.9%) |
| 35 to 39 Minutes | 128 (1.6%) | 118 (1.8%) |
| 40 to 44 Minutes | 215 (2.7%) | 100 (1.5%) |
| 45 to 59 Minutes | 506 (6.4%) | 279 (4.2%) |
| 60 to 89 Minutes | 913 (11.6%) | 474 (7.1%) |
| 90 or more Minutes | 456 (5.8%) | 119 (1.8%) |
Time of Departure to Work by Sex in Humacao Municipio
The most frequent times of departure to work in Humacao Municipio are 8:00 AM to 8:29 AM (1,025, 13.0%) for males and 7:00 AM to 7:29 AM (1,110, 16.6%) for females.
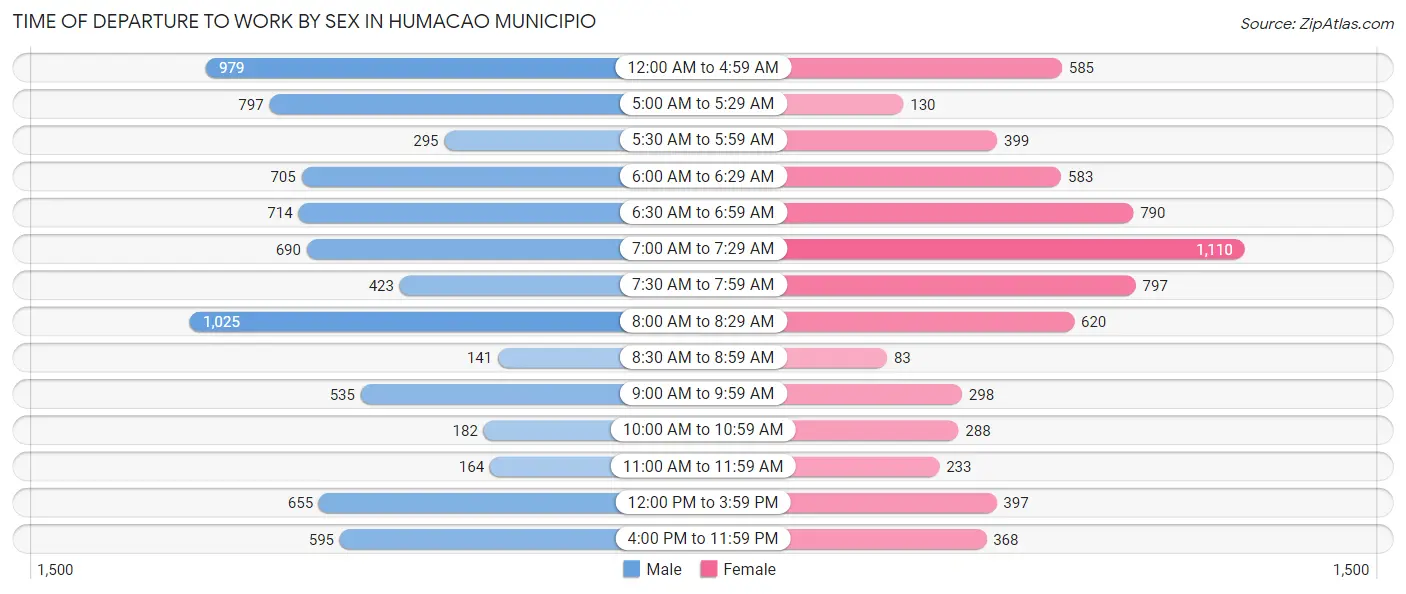
| Time of Departure | Male | Female |
| 12:00 AM to 4:59 AM | 979 (12.4%) | 585 (8.8%) |
| 5:00 AM to 5:29 AM | 797 (10.1%) | 130 (1.9%) |
| 5:30 AM to 5:59 AM | 295 (3.7%) | 399 (6.0%) |
| 6:00 AM to 6:29 AM | 705 (8.9%) | 583 (8.7%) |
| 6:30 AM to 6:59 AM | 714 (9.0%) | 790 (11.8%) |
| 7:00 AM to 7:29 AM | 690 (8.7%) | 1,110 (16.6%) |
| 7:30 AM to 7:59 AM | 423 (5.3%) | 797 (11.9%) |
| 8:00 AM to 8:29 AM | 1,025 (13.0%) | 620 (9.3%) |
| 8:30 AM to 8:59 AM | 141 (1.8%) | 83 (1.2%) |
| 9:00 AM to 9:59 AM | 535 (6.8%) | 298 (4.5%) |
| 10:00 AM to 10:59 AM | 182 (2.3%) | 288 (4.3%) |
| 11:00 AM to 11:59 AM | 164 (2.1%) | 233 (3.5%) |
| 12:00 PM to 3:59 PM | 655 (8.3%) | 397 (5.9%) |
| 4:00 PM to 11:59 PM | 595 (7.5%) | 368 (5.5%) |
| Total | 7,900 (100.0%) | 6,681 (100.0%) |
Housing Occupancy in Humacao Municipio
Occupancy by Ownership in Humacao Municipio
Of the total 18,206 dwellings in Humacao Municipio, owner-occupied units account for 13,733 (75.4%), while renter-occupied units make up 4,473 (24.6%).
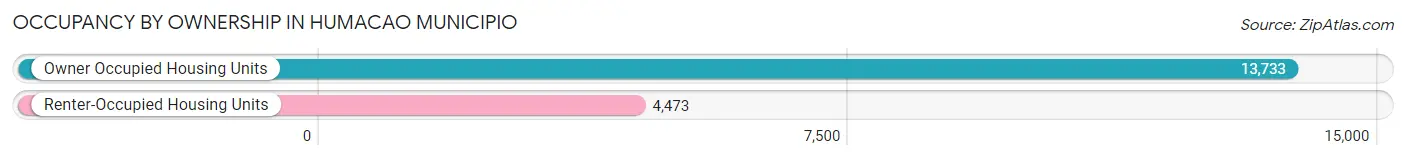
| Occupancy | # Housing Units | % Housing Units |
| Owner Occupied Housing Units | 13,733 | 75.4% |
| Renter-Occupied Housing Units | 4,473 | 24.6% |
| Total Occupied Housing Units | 18,206 | 100.0% |
Occupancy by Household Size in Humacao Municipio
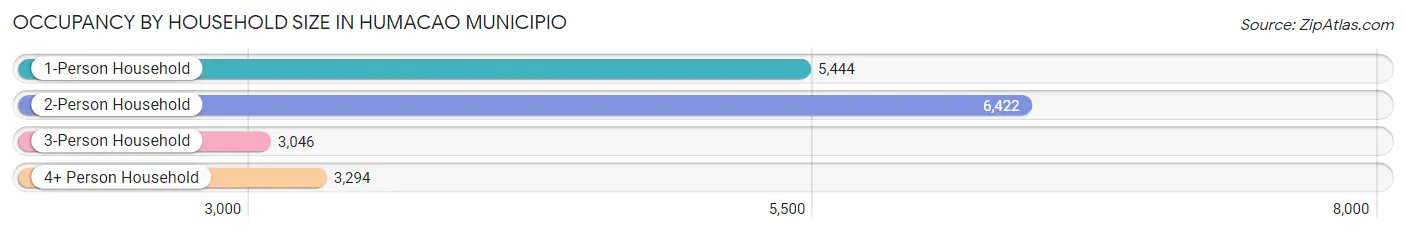
| Household Size | # Housing Units | % Housing Units |
| 1-Person Household | 5,444 | 29.9% |
| 2-Person Household | 6,422 | 35.3% |
| 3-Person Household | 3,046 | 16.7% |
| 4+ Person Household | 3,294 | 18.1% |
| Total Housing Units | 18,206 | 100.0% |
Occupancy by Ownership by Household Size in Humacao Municipio
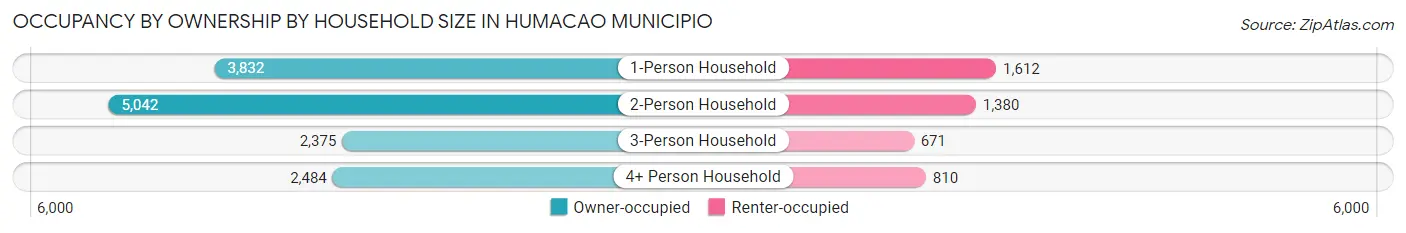
| Household Size | Owner-occupied | Renter-occupied |
| 1-Person Household | 3,832 (70.4%) | 1,612 (29.6%) |
| 2-Person Household | 5,042 (78.5%) | 1,380 (21.5%) |
| 3-Person Household | 2,375 (78.0%) | 671 (22.0%) |
| 4+ Person Household | 2,484 (75.4%) | 810 (24.6%) |
| Total Housing Units | 13,733 (75.4%) | 4,473 (24.6%) |
Occupancy by Educational Attainment in Humacao Municipio
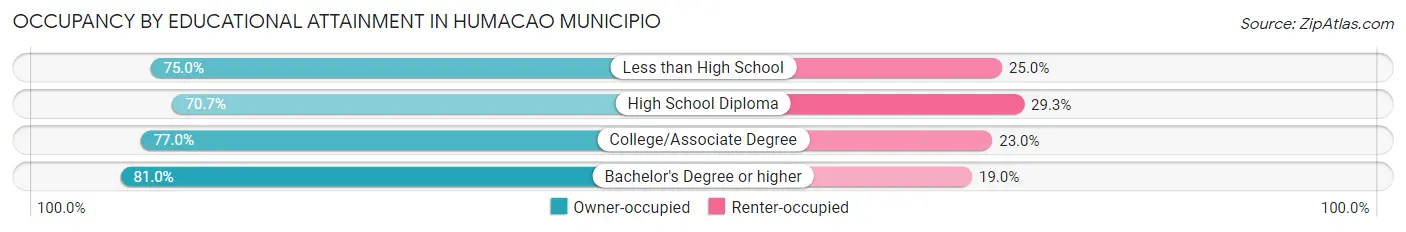
| Household Size | Owner-occupied | Renter-occupied |
| Less than High School | 2,701 (75.0%) | 899 (25.0%) |
| High School Diploma | 4,443 (70.7%) | 1,844 (29.3%) |
| College/Associate Degree | 2,844 (77.0%) | 851 (23.0%) |
| Bachelor's Degree or higher | 3,745 (81.0%) | 879 (19.0%) |
Occupancy by Age of Householder in Humacao Municipio
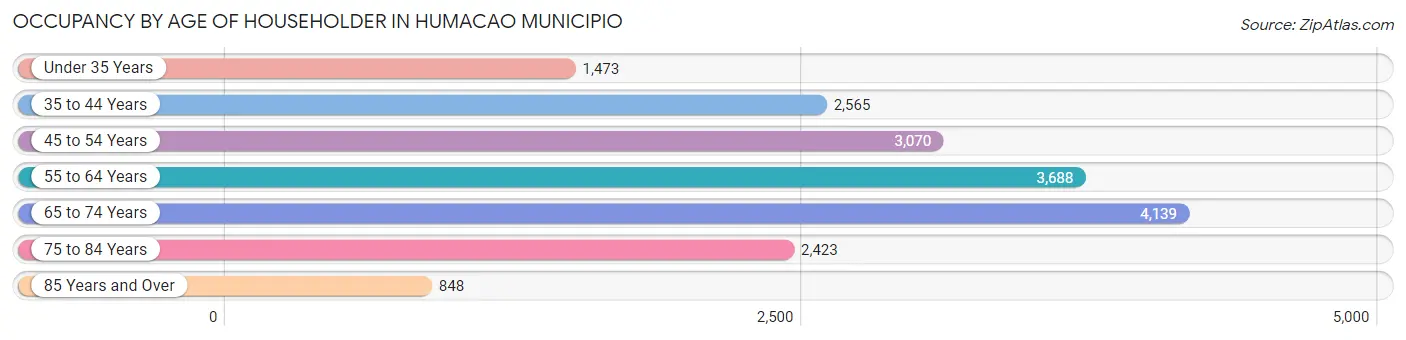
| Age Bracket | # Households | % Households |
| Under 35 Years | 1,473 | 8.1% |
| 35 to 44 Years | 2,565 | 14.1% |
| 45 to 54 Years | 3,070 | 16.9% |
| 55 to 64 Years | 3,688 | 20.3% |
| 65 to 74 Years | 4,139 | 22.7% |
| 75 to 84 Years | 2,423 | 13.3% |
| 85 Years and Over | 848 | 4.7% |
| Total | 18,206 | 100.0% |
Housing Finances in Humacao Municipio
Median Income by Occupancy in Humacao Municipio
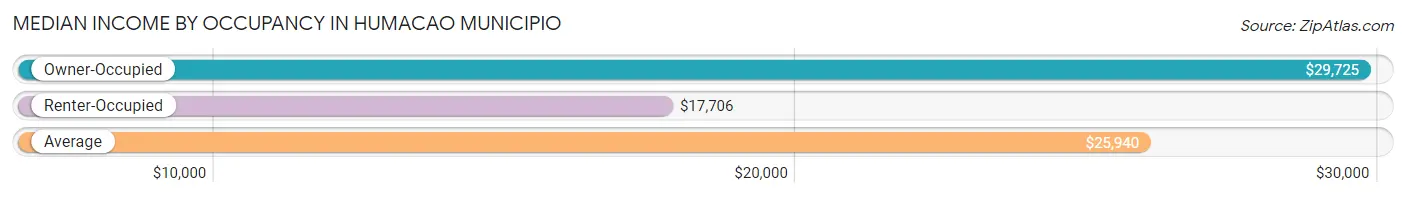
| Occupancy Type | # Households | Median Income |
| Owner-Occupied | 13,733 (75.4%) | $29,725 |
| Renter-Occupied | 4,473 (24.6%) | $17,706 |
| Average | 18,206 (100.0%) | $25,940 |
Occupancy by Householder Income Bracket in Humacao Municipio
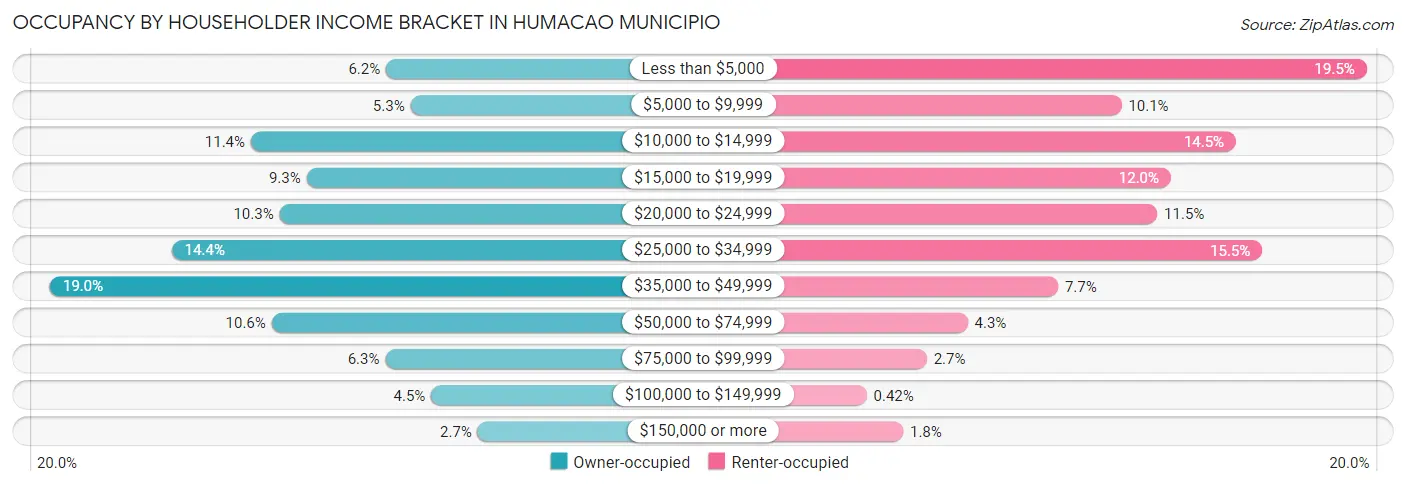
| Income Bracket | Owner-occupied | Renter-occupied |
| Less than $5,000 | 856 (6.2%) | 871 (19.5%) |
| $5,000 to $9,999 | 728 (5.3%) | 453 (10.1%) |
| $10,000 to $14,999 | 1,563 (11.4%) | 648 (14.5%) |
| $15,000 to $19,999 | 1,271 (9.3%) | 537 (12.0%) |
| $20,000 to $24,999 | 1,413 (10.3%) | 514 (11.5%) |
| $25,000 to $34,999 | 1,977 (14.4%) | 693 (15.5%) |
| $35,000 to $49,999 | 2,615 (19.0%) | 345 (7.7%) |
| $50,000 to $74,999 | 1,454 (10.6%) | 191 (4.3%) |
| $75,000 to $99,999 | 860 (6.3%) | 121 (2.7%) |
| $100,000 to $149,999 | 620 (4.5%) | 19 (0.4%) |
| $150,000 or more | 376 (2.7%) | 81 (1.8%) |
| Total | 13,733 (100.0%) | 4,473 (100.0%) |
Monthly Housing Cost Tiers in Humacao Municipio
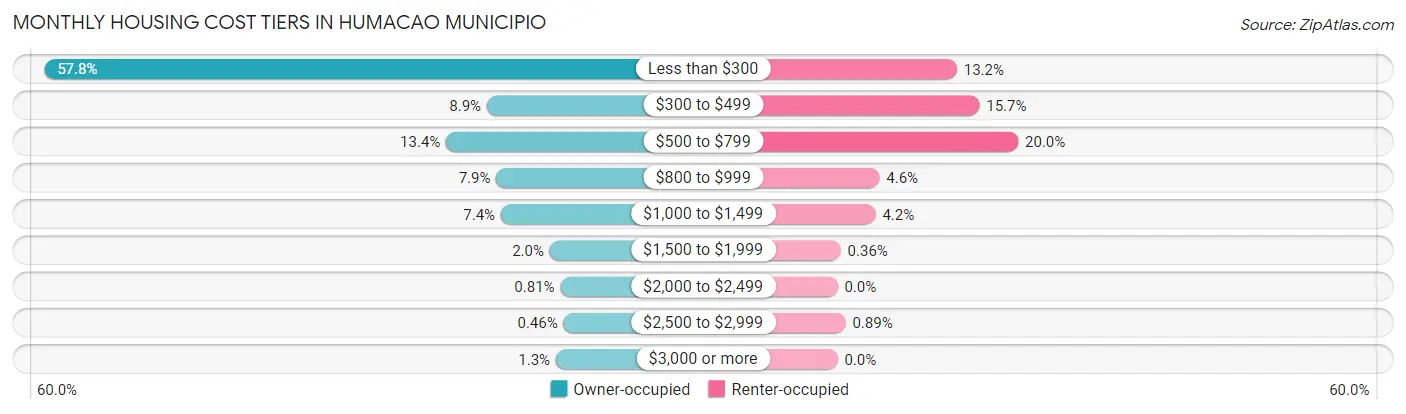
| Monthly Cost | Owner-occupied | Renter-occupied |
| Less than $300 | 7,942 (57.8%) | 590 (13.2%) |
| $300 to $499 | 1,227 (8.9%) | 701 (15.7%) |
| $500 to $799 | 1,844 (13.4%) | 893 (20.0%) |
| $800 to $999 | 1,083 (7.9%) | 207 (4.6%) |
| $1,000 to $1,499 | 1,013 (7.4%) | 188 (4.2%) |
| $1,500 to $1,999 | 272 (2.0%) | 16 (0.4%) |
| $2,000 to $2,499 | 111 (0.8%) | 0 (0.0%) |
| $2,500 to $2,999 | 63 (0.5%) | 40 (0.9%) |
| $3,000 or more | 178 (1.3%) | 0 (0.0%) |
| Total | 13,733 (100.0%) | 4,473 (100.0%) |
Physical Housing Characteristics in Humacao Municipio
Housing Structures in Humacao Municipio
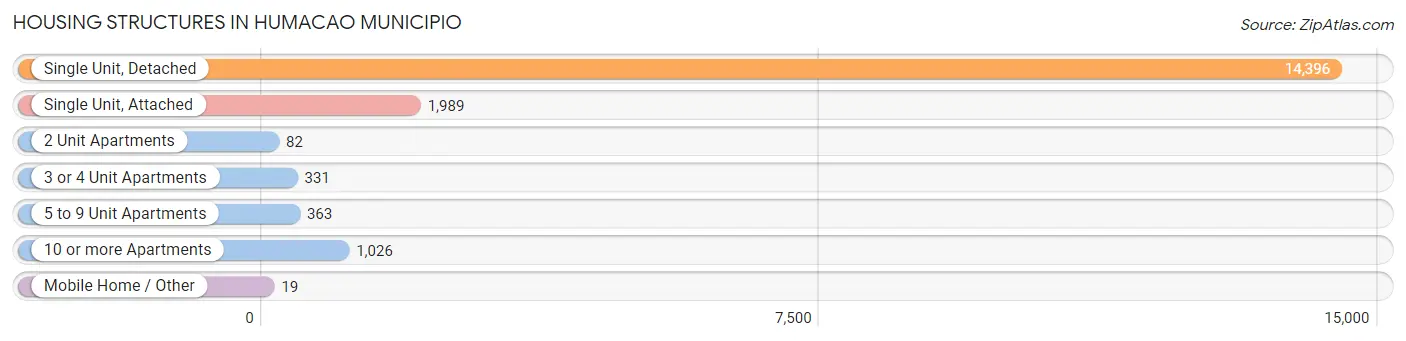
| Structure Type | # Housing Units | % Housing Units |
| Single Unit, Detached | 14,396 | 79.1% |
| Single Unit, Attached | 1,989 | 10.9% |
| 2 Unit Apartments | 82 | 0.4% |
| 3 or 4 Unit Apartments | 331 | 1.8% |
| 5 to 9 Unit Apartments | 363 | 2.0% |
| 10 or more Apartments | 1,026 | 5.6% |
| Mobile Home / Other | 19 | 0.1% |
| Total | 18,206 | 100.0% |
Housing Structures by Occupancy in Humacao Municipio
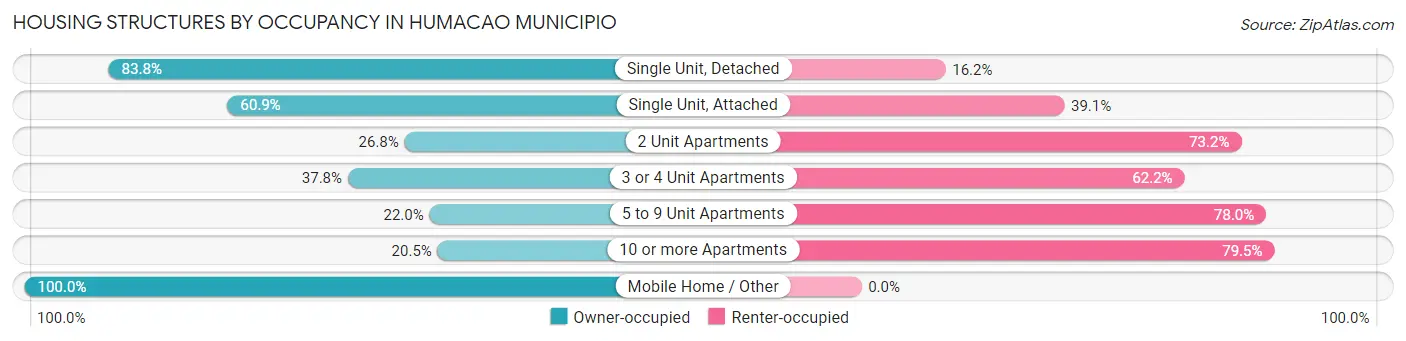
| Structure Type | Owner-occupied | Renter-occupied |
| Single Unit, Detached | 12,065 (83.8%) | 2,331 (16.2%) |
| Single Unit, Attached | 1,212 (60.9%) | 777 (39.1%) |
| 2 Unit Apartments | 22 (26.8%) | 60 (73.2%) |
| 3 or 4 Unit Apartments | 125 (37.8%) | 206 (62.2%) |
| 5 to 9 Unit Apartments | 80 (22.0%) | 283 (78.0%) |
| 10 or more Apartments | 210 (20.5%) | 816 (79.5%) |
| Mobile Home / Other | 19 (100.0%) | 0 (0.0%) |
| Total | 13,733 (75.4%) | 4,473 (24.6%) |
Housing Structures by Number of Rooms in Humacao Municipio
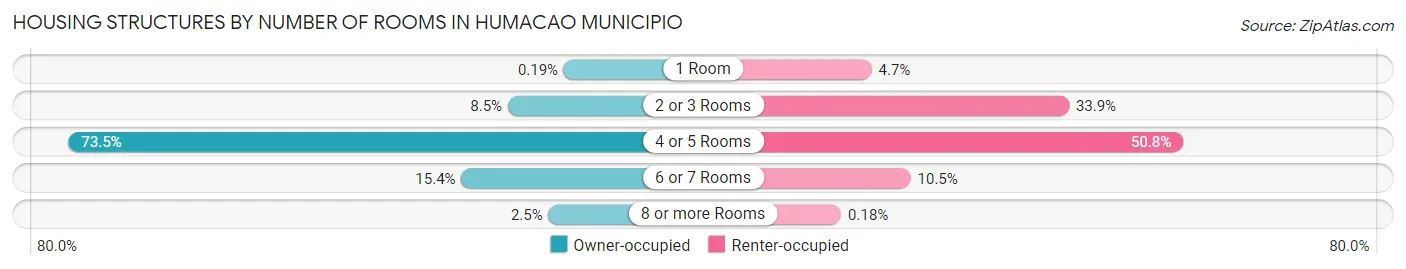
| Number of Rooms | Owner-occupied | Renter-occupied |
| 1 Room | 26 (0.2%) | 210 (4.7%) |
| 2 or 3 Rooms | 1,164 (8.5%) | 1,516 (33.9%) |
| 4 or 5 Rooms | 10,095 (73.5%) | 2,271 (50.8%) |
| 6 or 7 Rooms | 2,109 (15.4%) | 468 (10.5%) |
| 8 or more Rooms | 339 (2.5%) | 8 (0.2%) |
| Total | 13,733 (100.0%) | 4,473 (100.0%) |
Housing Structure by Heating Type in Humacao Municipio
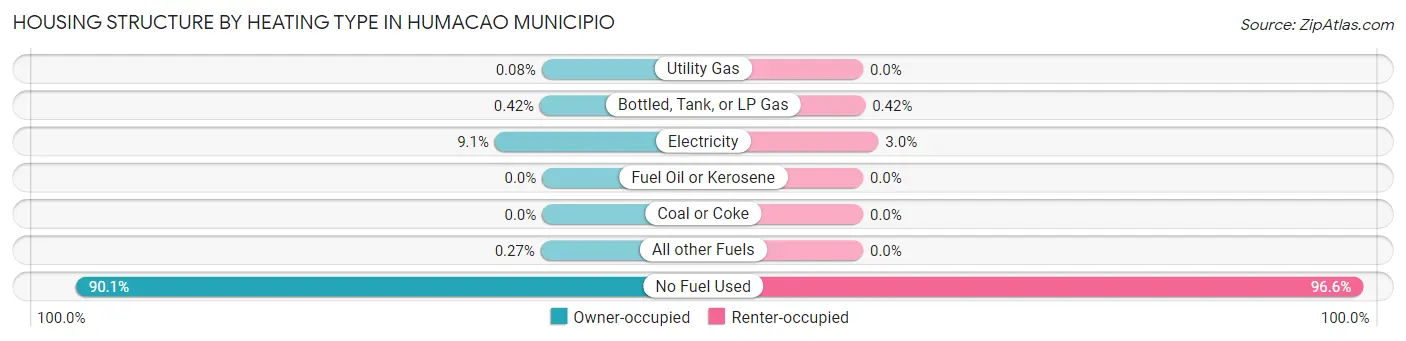
| Heating Type | Owner-occupied | Renter-occupied |
| Utility Gas | 11 (0.1%) | 0 (0.0%) |
| Bottled, Tank, or LP Gas | 57 (0.4%) | 19 (0.4%) |
| Electricity | 1,255 (9.1%) | 133 (3.0%) |
| Fuel Oil or Kerosene | 0 (0.0%) | 0 (0.0%) |
| Coal or Coke | 0 (0.0%) | 0 (0.0%) |
| All other Fuels | 37 (0.3%) | 0 (0.0%) |
| No Fuel Used | 12,373 (90.1%) | 4,321 (96.6%) |
| Total | 13,733 (100.0%) | 4,473 (100.0%) |
Household Vehicle Usage in Humacao Municipio
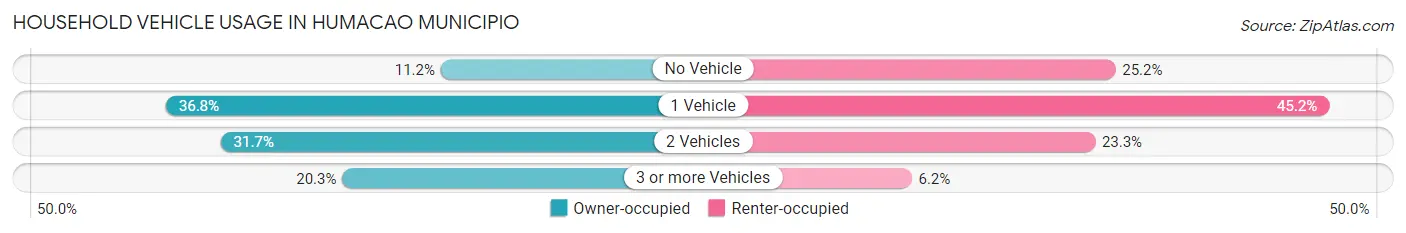
| Vehicles per Household | Owner-occupied | Renter-occupied |
| No Vehicle | 1,531 (11.2%) | 1,129 (25.2%) |
| 1 Vehicle | 5,055 (36.8%) | 2,022 (45.2%) |
| 2 Vehicles | 4,354 (31.7%) | 1,044 (23.3%) |
| 3 or more Vehicles | 2,793 (20.3%) | 278 (6.2%) |
| Total | 13,733 (100.0%) | 4,473 (100.0%) |
Real Estate & Mortgages in Humacao Municipio
Real Estate and Mortgage Overview in Humacao Municipio
| Characteristic | Without Mortgage | With Mortgage |
| Housing Units | 9,156 | 4,577 |
| Median Property Value | $108,600 | $126,800 |
| Median Household Income | $23,660 | $270 |
| Monthly Housing Costs | $171 | $178 |
| Real Estate Taxes | $562 | $3,730 |
Property Value by Mortgage Status in Humacao Municipio
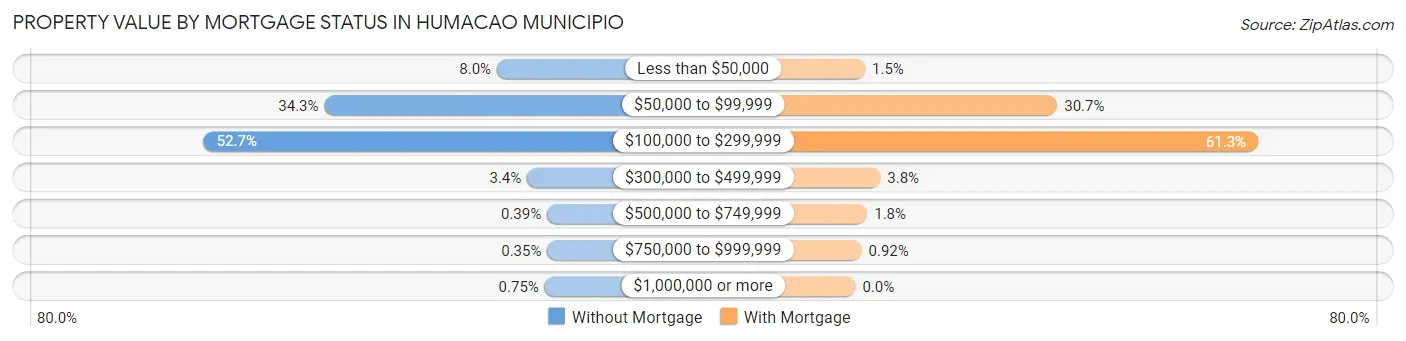
| Property Value | Without Mortgage | With Mortgage |
| Less than $50,000 | 735 (8.0%) | 67 (1.5%) |
| $50,000 to $99,999 | 3,142 (34.3%) | 1,407 (30.7%) |
| $100,000 to $299,999 | 4,828 (52.7%) | 2,806 (61.3%) |
| $300,000 to $499,999 | 314 (3.4%) | 173 (3.8%) |
| $500,000 to $749,999 | 36 (0.4%) | 82 (1.8%) |
| $750,000 to $999,999 | 32 (0.4%) | 42 (0.9%) |
| $1,000,000 or more | 69 (0.7%) | 0 (0.0%) |
| Total | 9,156 (100.0%) | 4,577 (100.0%) |
Household Income by Mortgage Status in Humacao Municipio
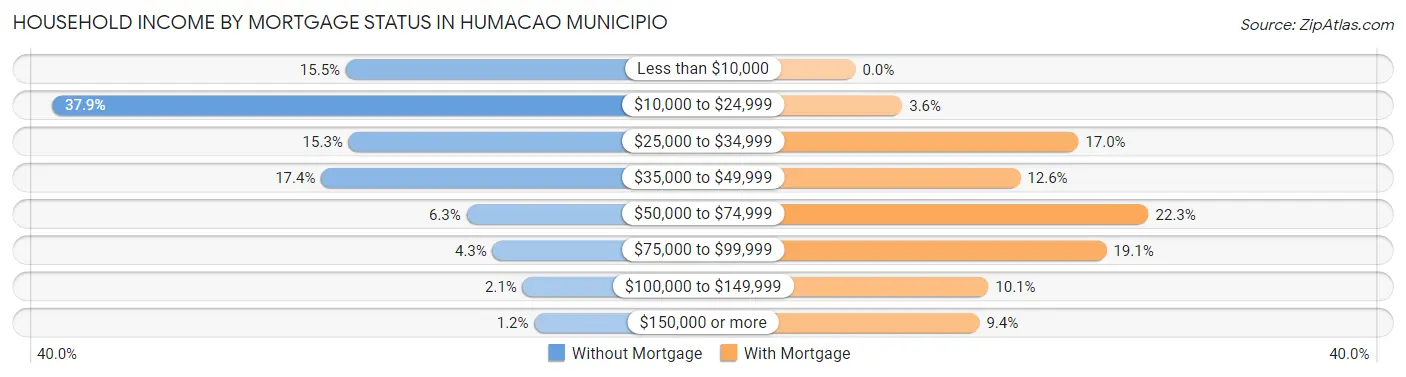
| Household Income | Without Mortgage | With Mortgage |
| Less than $10,000 | 1,421 (15.5%) | 0 (0.0%) |
| $10,000 to $24,999 | 3,470 (37.9%) | 163 (3.6%) |
| $25,000 to $34,999 | 1,402 (15.3%) | 777 (17.0%) |
| $35,000 to $49,999 | 1,593 (17.4%) | 575 (12.6%) |
| $50,000 to $74,999 | 579 (6.3%) | 1,022 (22.3%) |
| $75,000 to $99,999 | 397 (4.3%) | 875 (19.1%) |
| $100,000 to $149,999 | 188 (2.1%) | 463 (10.1%) |
| $150,000 or more | 106 (1.2%) | 432 (9.4%) |
| Total | 9,156 (100.0%) | 4,577 (100.0%) |
Property Value to Household Income Ratio in Humacao Municipio
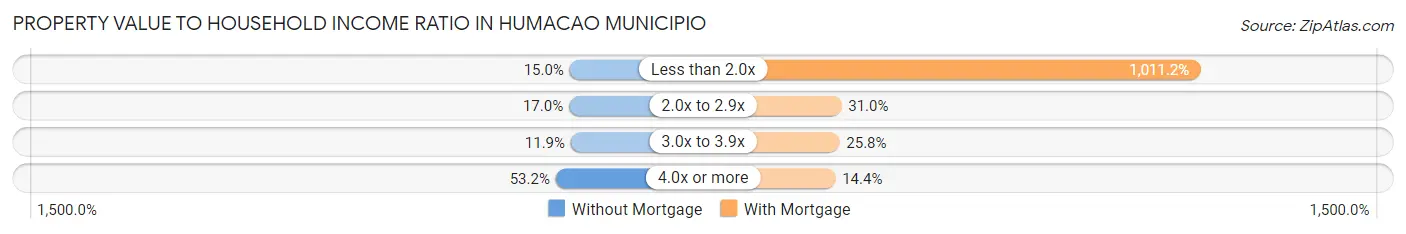
| Value-to-Income Ratio | Without Mortgage | With Mortgage |
| Less than 2.0x | 1,377 (15.0%) | 46,284 (1,011.2%) |
| 2.0x to 2.9x | 1,555 (17.0%) | 1,419 (31.0%) |
| 3.0x to 3.9x | 1,093 (11.9%) | 1,180 (25.8%) |
| 4.0x or more | 4,866 (53.1%) | 660 (14.4%) |
| Total | 9,156 (100.0%) | 4,577 (100.0%) |
Real Estate Taxes by Mortgage Status in Humacao Municipio
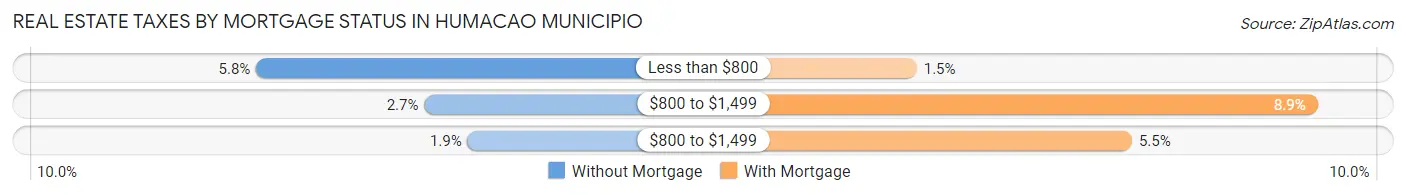
| Property Taxes | Without Mortgage | With Mortgage |
| Less than $800 | 528 (5.8%) | 70 (1.5%) |
| $800 to $1,499 | 247 (2.7%) | 405 (8.8%) |
| $800 to $1,499 | 175 (1.9%) | 250 (5.5%) |
| Total | 9,156 (100.0%) | 4,577 (100.0%) |
Health & Disability in Humacao Municipio
Health Insurance Coverage by Age in Humacao Municipio
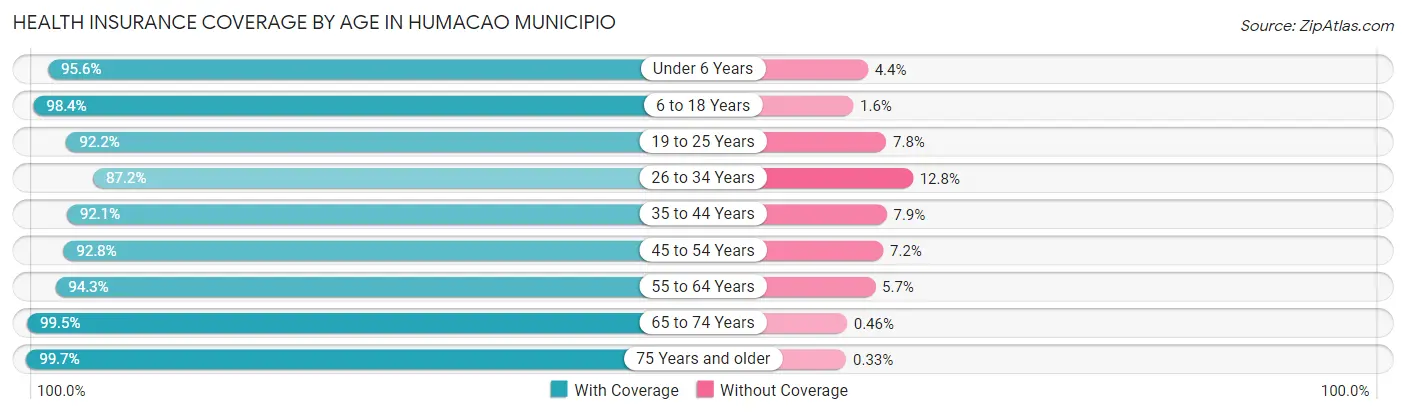
| Age Bracket | With Coverage | Without Coverage |
| Under 6 Years | 2,057 (95.6%) | 94 (4.4%) |
| 6 to 18 Years | 6,826 (98.4%) | 114 (1.6%) |
| 19 to 25 Years | 4,491 (92.2%) | 380 (7.8%) |
| 26 to 34 Years | 4,162 (87.2%) | 609 (12.8%) |
| 35 to 44 Years | 5,493 (92.1%) | 470 (7.9%) |
| 45 to 54 Years | 6,177 (92.8%) | 482 (7.2%) |
| 55 to 64 Years | 6,524 (94.3%) | 397 (5.7%) |
| 65 to 74 Years | 6,656 (99.5%) | 31 (0.5%) |
| 75 Years and older | 5,447 (99.7%) | 18 (0.3%) |
| Total | 47,833 (94.9%) | 2,595 (5.1%) |
Health Insurance Coverage by Citizenship Status in Humacao Municipio
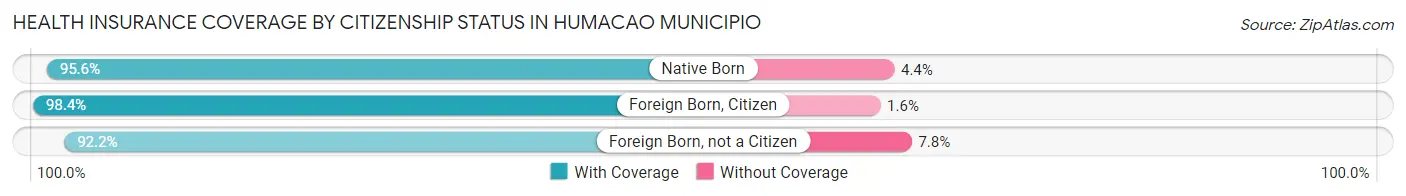
| Citizenship Status | With Coverage | Without Coverage |
| Native Born | 2,057 (95.6%) | 94 (4.4%) |
| Foreign Born, Citizen | 6,826 (98.4%) | 114 (1.6%) |
| Foreign Born, not a Citizen | 4,491 (92.2%) | 380 (7.8%) |
Health Insurance Coverage by Household Income in Humacao Municipio
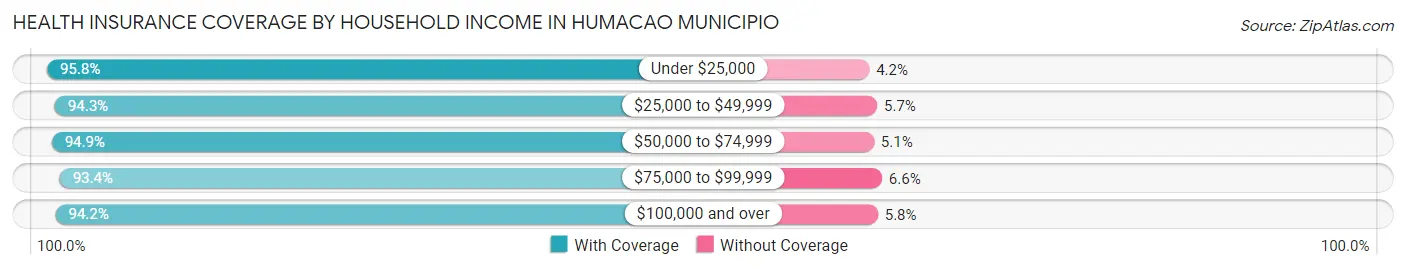
| Household Income | With Coverage | Without Coverage |
| Under $25,000 | 17,696 (95.8%) | 775 (4.2%) |
| $25,000 to $49,999 | 16,520 (94.3%) | 995 (5.7%) |
| $50,000 to $74,999 | 5,496 (94.9%) | 294 (5.1%) |
| $75,000 to $99,999 | 3,509 (93.4%) | 247 (6.6%) |
| $100,000 and over | 4,498 (94.2%) | 277 (5.8%) |
Public vs Private Health Insurance Coverage by Age in Humacao Municipio
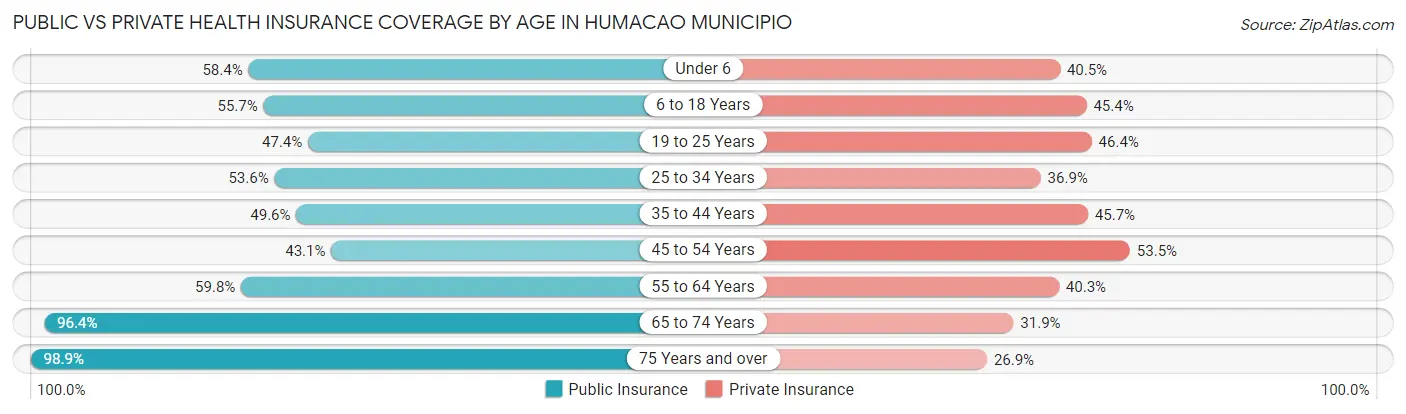
| Age Bracket | Public Insurance | Private Insurance |
| Under 6 | 1,257 (58.4%) | 871 (40.5%) |
| 6 to 18 Years | 3,862 (55.6%) | 3,152 (45.4%) |
| 19 to 25 Years | 2,308 (47.4%) | 2,259 (46.4%) |
| 25 to 34 Years | 2,558 (53.6%) | 1,761 (36.9%) |
| 35 to 44 Years | 2,955 (49.6%) | 2,724 (45.7%) |
| 45 to 54 Years | 2,868 (43.1%) | 3,561 (53.5%) |
| 55 to 64 Years | 4,139 (59.8%) | 2,789 (40.3%) |
| 65 to 74 Years | 6,444 (96.4%) | 2,130 (31.9%) |
| 75 Years and over | 5,403 (98.9%) | 1,472 (26.9%) |
| Total | 31,794 (63.0%) | 20,719 (41.1%) |
Disability Status by Sex by Age in Humacao Municipio
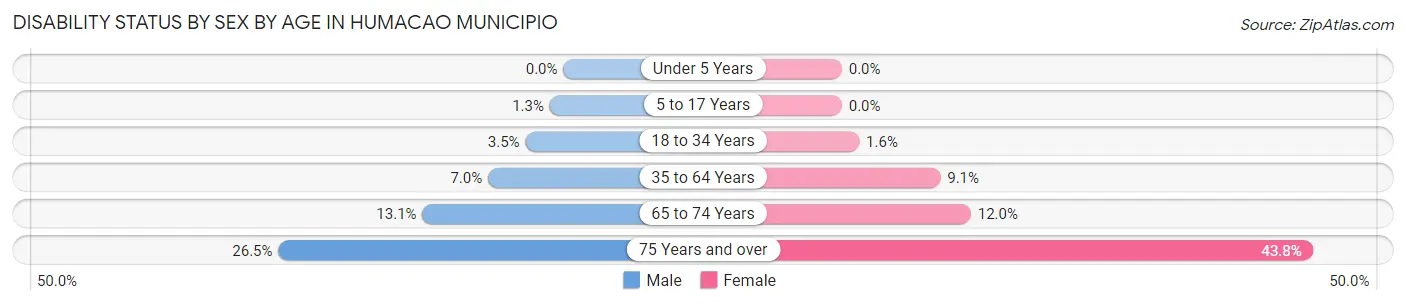
| Age Bracket | Male | Female |
| Under 5 Years | 0 (0.0%) | 0 (0.0%) |
| 5 to 17 Years | 42 (1.3%) | 0 (0.0%) |
| 18 to 34 Years | 177 (3.5%) | 85 (1.6%) |
| 35 to 64 Years | 635 (7.0%) | 956 (9.1%) |
| 65 to 74 Years | 395 (13.1%) | 439 (12.0%) |
| 75 Years and over | 616 (26.5%) | 1,373 (43.8%) |
Disability Class by Sex by Age in Humacao Municipio
Disability Class: Hearing Difficulty
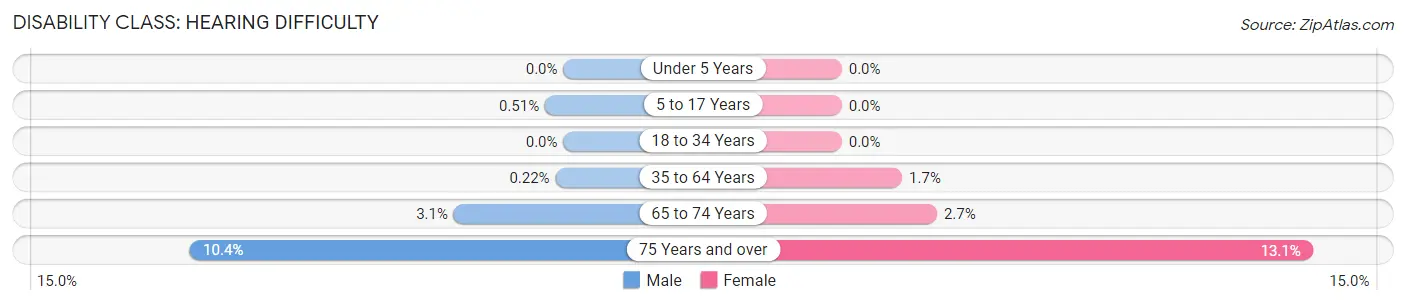
| Age Bracket | Male | Female |
| Under 5 Years | 0 (0.0%) | 0 (0.0%) |
| 5 to 17 Years | 17 (0.5%) | 0 (0.0%) |
| 18 to 34 Years | 0 (0.0%) | 0 (0.0%) |
| 35 to 64 Years | 20 (0.2%) | 176 (1.7%) |
| 65 to 74 Years | 92 (3.0%) | 97 (2.6%) |
| 75 Years and over | 242 (10.4%) | 411 (13.1%) |
Disability Class: Vision Difficulty
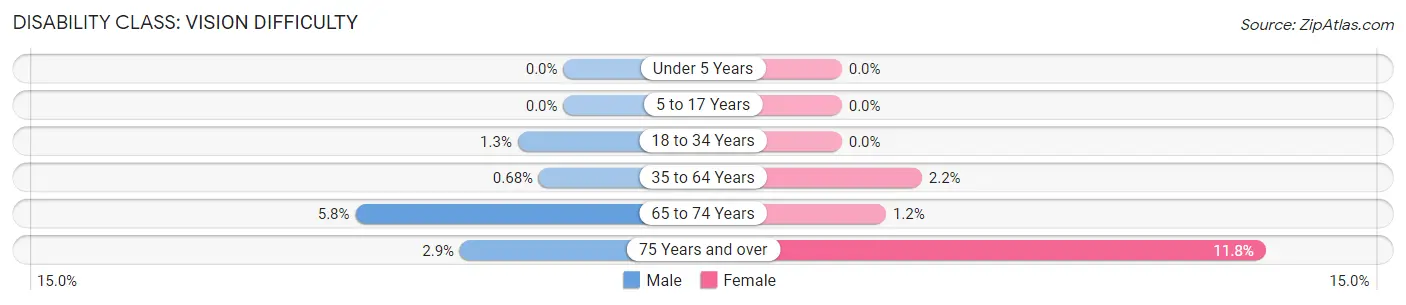
| Age Bracket | Male | Female |
| Under 5 Years | 0 (0.0%) | 0 (0.0%) |
| 5 to 17 Years | 0 (0.0%) | 0 (0.0%) |
| 18 to 34 Years | 64 (1.3%) | 0 (0.0%) |
| 35 to 64 Years | 62 (0.7%) | 233 (2.2%) |
| 65 to 74 Years | 175 (5.8%) | 45 (1.2%) |
| 75 Years and over | 67 (2.9%) | 370 (11.8%) |
Disability Class: Cognitive Difficulty
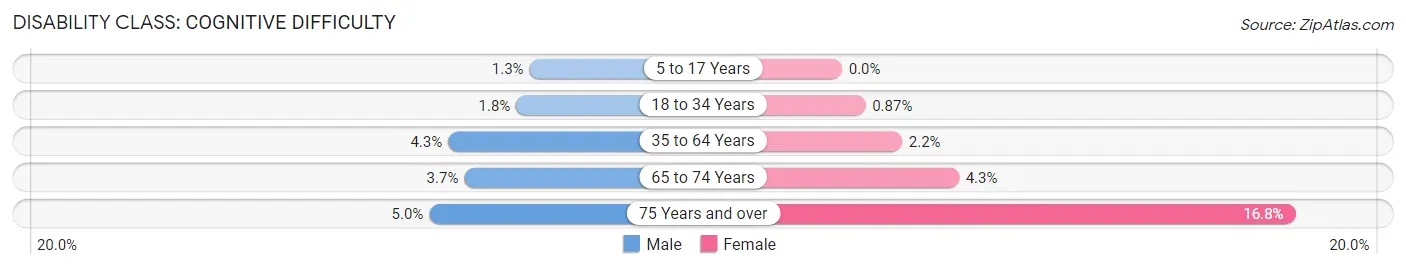
| Age Bracket | Male | Female |
| 5 to 17 Years | 42 (1.3%) | 0 (0.0%) |
| 18 to 34 Years | 88 (1.8%) | 46 (0.9%) |
| 35 to 64 Years | 389 (4.3%) | 233 (2.2%) |
| 65 to 74 Years | 111 (3.7%) | 159 (4.3%) |
| 75 Years and over | 116 (5.0%) | 528 (16.8%) |
Disability Class: Ambulatory Difficulty
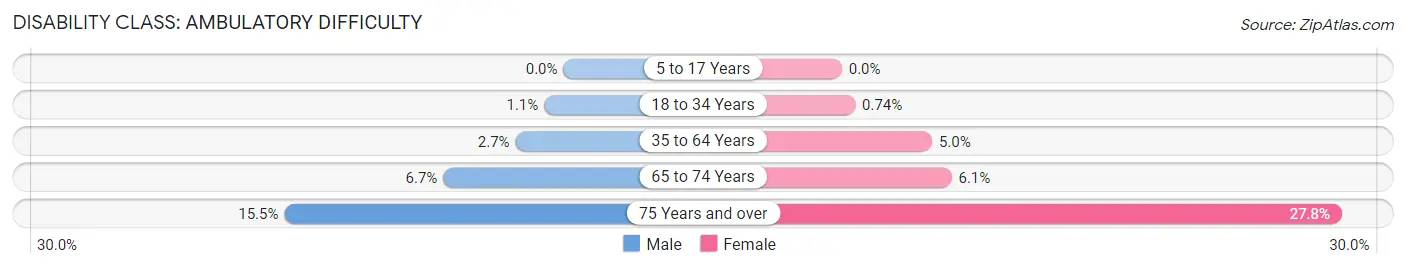
| Age Bracket | Male | Female |
| 5 to 17 Years | 0 (0.0%) | 0 (0.0%) |
| 18 to 34 Years | 54 (1.1%) | 39 (0.7%) |
| 35 to 64 Years | 243 (2.7%) | 525 (5.0%) |
| 65 to 74 Years | 202 (6.7%) | 224 (6.1%) |
| 75 Years and over | 362 (15.5%) | 873 (27.8%) |
Disability Class: Self-Care Difficulty
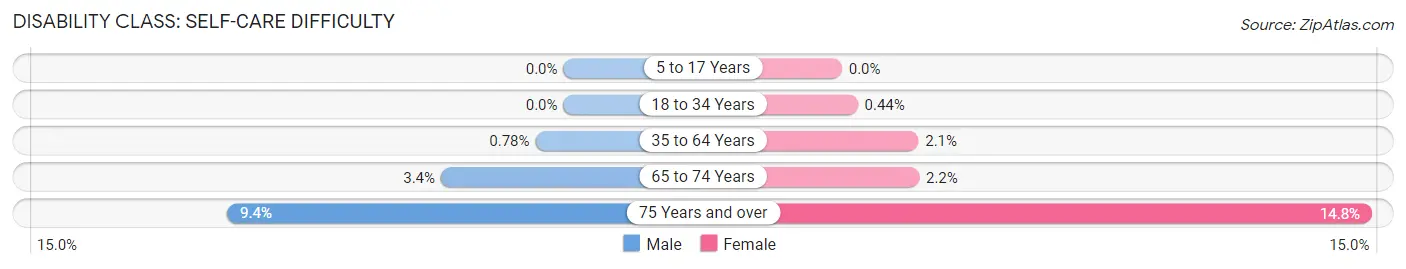
| Age Bracket | Male | Female |
| 5 to 17 Years | 0 (0.0%) | 0 (0.0%) |
| 18 to 34 Years | 0 (0.0%) | 23 (0.4%) |
| 35 to 64 Years | 71 (0.8%) | 223 (2.1%) |
| 65 to 74 Years | 103 (3.4%) | 79 (2.1%) |
| 75 Years and over | 218 (9.4%) | 463 (14.8%) |
Technology Access in Humacao Municipio
Computing Device Access in Humacao Municipio
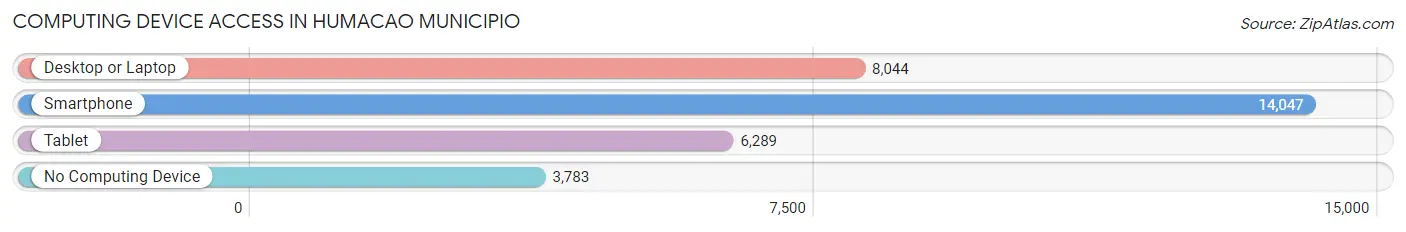
| Device Type | # Households | % Households |
| Desktop or Laptop | 8,044 | 44.2% |
| Smartphone | 14,047 | 77.2% |
| Tablet | 6,289 | 34.5% |
| No Computing Device | 3,783 | 20.8% |
| Total | 18,206 | 100.0% |
Internet Access in Humacao Municipio
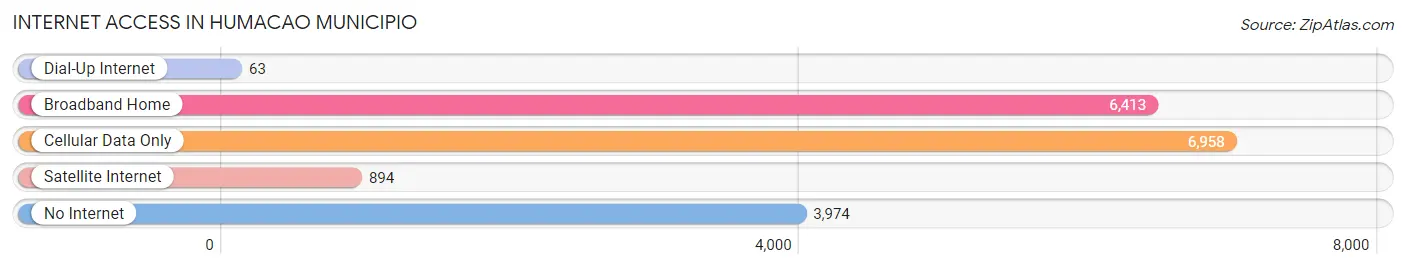
| Internet Type | # Households | % Households |
| Dial-Up Internet | 63 | 0.4% |
| Broadband Home | 6,413 | 35.2% |
| Cellular Data Only | 6,958 | 38.2% |
| Satellite Internet | 894 | 4.9% |
| No Internet | 3,974 | 21.8% |
| Total | 18,206 | 100.0% |
Humacao Municipio Summary
Humacao Municipio is located in the eastern part of Puerto Rico, on the Caribbean Sea. It is the second largest municipality in the island, with a population of approximately 90,000 people. The municipality is divided into two districts, Humacao and Naguabo.
Geography
Humacao Municipio is located in the eastern part of Puerto Rico, on the Caribbean Sea. It is bordered by the municipalities of Yabucoa to the east, Las Piedras to the west, and Naguabo to the south. The municipality is divided into two districts, Humacao and Naguabo. The municipality covers an area of approximately 545 square kilometers. The terrain is mostly flat, with some hills in the northern part of the municipality. The highest point in the municipality is Cerro La Santa, which is located in the northern part of the municipality and has an elevation of 845 meters.
The climate in Humacao Municipio is tropical, with temperatures ranging from an average low of 22°C in the winter to an average high of 32°C in the summer. The average annual precipitation is approximately 1,400 millimeters.
Economy
The economy of Humacao Municipio is largely based on agriculture and tourism. The main agricultural products are sugarcane, coffee, and bananas. The municipality is also home to several industrial parks, which are home to a variety of manufacturing and service companies. Tourism is also an important part of the economy, with the municipality being home to several resorts and beaches.
Demographics
As of the 2010 census, the population of Humacao Municipio was approximately 90,000 people. The population is predominantly of Puerto Rican descent, with a small minority of other ethnicities. The median household income in the municipality is approximately $20,000, and the unemployment rate is approximately 10%.
Education
Humacao Municipio is served by the Puerto Rico Department of Education. The municipality has several public schools, as well as several private schools. The University of Puerto Rico at Humacao is also located in the municipality.
Culture
Humacao Municipio is home to a variety of cultural attractions, including several museums, galleries, and theaters. The municipality is also home to several festivals and events, such as the Humacao International Film Festival and the Humacao Music Festival.
Conclusion
Humacao Municipio is a vibrant and diverse municipality located in the eastern part of Puerto Rico. The economy of the municipality is largely based on agriculture and tourism, and the population is predominantly of Puerto Rican descent. The municipality is home to a variety of cultural attractions, and is served by the Puerto Rico Department of Education.
Common Questions
What is Per Capita Income in Humacao Municipio?
Per Capita income in Humacao Municipio is $15,510.
What is the Median Family Income in Humacao Municipio?
Median Family Income in Humacao Municipio is $31,016.
What is the Median Household income in Humacao Municipio?
Median Household Income in Humacao Municipio is $25,940.
What is Income or Wage Gap in Humacao Municipio?
Income or Wage Gap in Humacao Municipio is 4.0%.
Women in Humacao Municipio earn 96.0 cents for every dollar earned by a man.
What is Family Income Deficit in Humacao Municipio?
Family Income Deficit in Humacao Municipio is $9,944.
Families that are below poverty line in Humacao Municipio earn $9,944 less on average than the poverty threshold level.
What is Inequality or Gini Index in Humacao Municipio?
Inequality or Gini Index in Humacao Municipio is 0.51.
What is the Total Population of Humacao Municipio?
Total Population of Humacao Municipio is 50,729.
What is the Total Male Population of Humacao Municipio?
Total Male Population of Humacao Municipio is 23,923.
What is the Total Female Population of Humacao Municipio?
Total Female Population of Humacao Municipio is 26,806.
What is the Ratio of Males per 100 Females in Humacao Municipio?
There are 89.24 Males per 100 Females in Humacao Municipio.
What is the Ratio of Females per 100 Males in Humacao Municipio?
There are 112.05 Females per 100 Males in Humacao Municipio.
What is the Median Population Age in Humacao Municipio?
Median Population Age in Humacao Municipio is 45.9 Years.
What is the Average Family Size in Humacao Municipio
Average Family Size in Humacao Municipio is 3.5 People.
What is the Average Household Size in Humacao Municipio
Average Household Size in Humacao Municipio is 2.8 People.
How Large is the Labor Force in Humacao Municipio?
There are 16,736 People in the Labor Forcein in Humacao Municipio.
What is the Percentage of People in the Labor Force in Humacao Municipio?
38.6% of People are in the Labor Force in Humacao Municipio.
What is the Unemployment Rate in Humacao Municipio?
Unemployment Rate in Humacao Municipio is 7.3%.