Hatillo Municipio, PR Map & Demographics
Hatillo Municipio Map
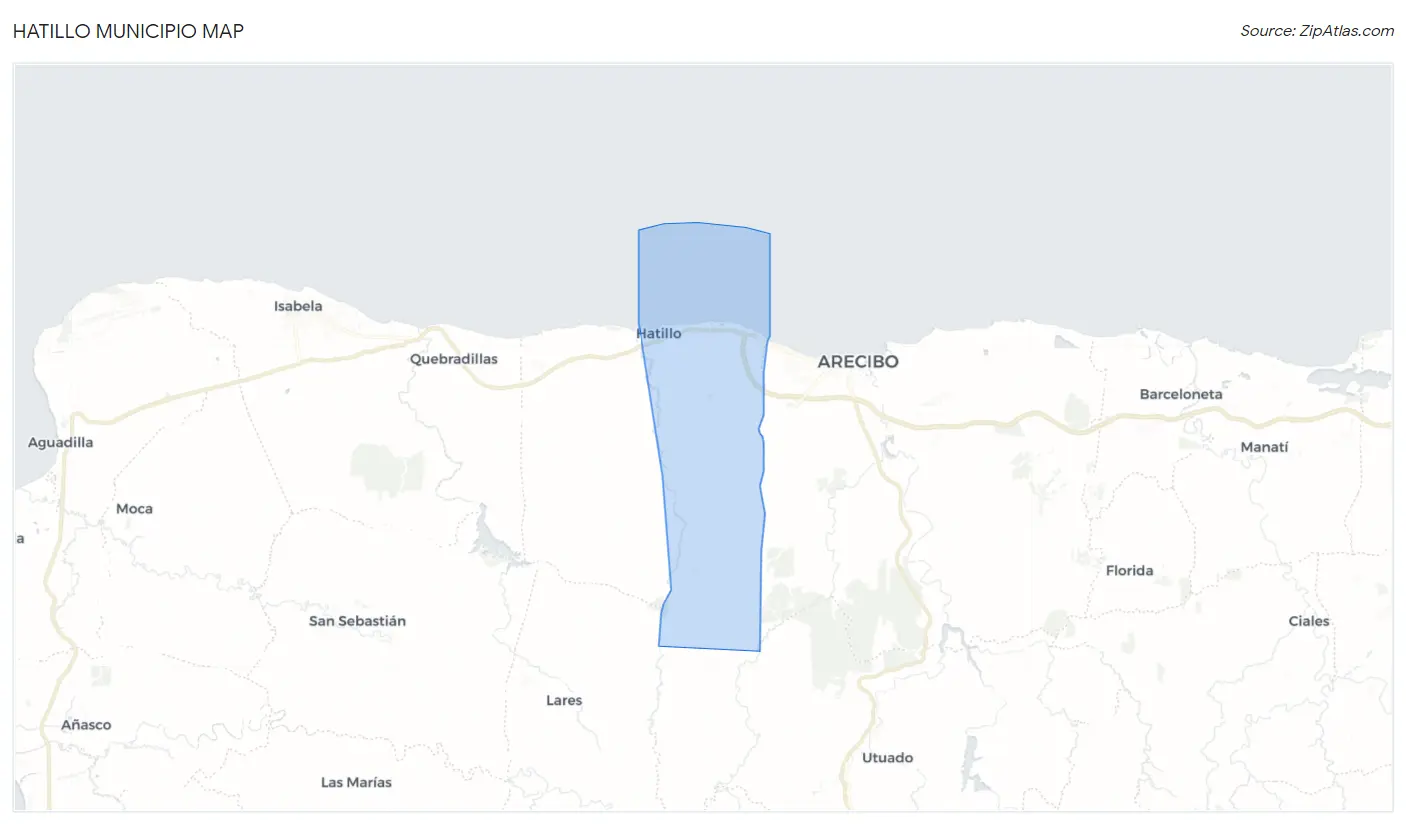
Hatillo Municipio Overview
$14,528
PER CAPITA INCOME
$31,888
AVG FAMILY INCOME
$24,407
AVG HOUSEHOLD INCOME
3.6%
WAGE / INCOME GAP [ % ]
96.4¢/ $1
WAGE / INCOME GAP [ $ ]
$9,212
FAMILY INCOME DEFICIT
0.48
INEQUALITY / GINI INDEX
38,330
TOTAL POPULATION
18,284
MALE POPULATION
20,046
FEMALE POPULATION
91.21
MALES / 100 FEMALES
109.64
FEMALES / 100 MALES
44.6
MEDIAN AGE
3.4
AVG FAMILY SIZE
2.8
AVG HOUSEHOLD SIZE
14,214
LABOR FORCE [ PEOPLE ]
43.2%
PERCENT IN LABOR FORCE
6.0%
UNEMPLOYMENT RATE
Income in Hatillo Municipio
Income Overview in Hatillo Municipio
Per Capita Income in Hatillo Municipio is $14,528, while median incomes of families and households are $31,888 and $24,407 respectively.
| Characteristic | Number | Measure |
| Per Capita Income | 38,330 | $14,528 |
| Median Family Income | 9,969 | $31,888 |
| Mean Family Income | 9,969 | $42,385 |
| Median Household Income | 13,503 | $24,407 |
| Mean Household Income | 13,503 | $36,977 |
| Income Deficit | 9,969 | $9,212 |
| Wage / Income Gap (%) | 38,330 | 3.62% |
| Wage / Income Gap ($) | 38,330 | 96.38¢ per $1 |
| Gini / Inequality Index | 38,330 | 0.48 |
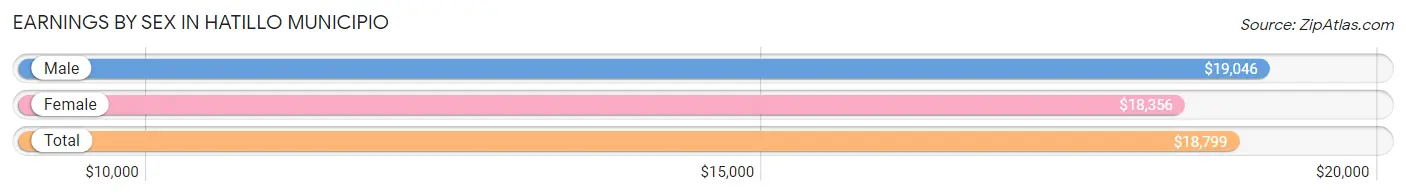
Earnings by Sex in Hatillo Municipio
Average Earnings in Hatillo Municipio are $18,799, $19,046 for men and $18,356 for women, a difference of 3.6%.
| Sex | Number | Average Earnings |
| Male | 7,671 (55.8%) | $19,046 |
| Female | 6,070 (44.2%) | $18,356 |
| Total | 13,741 (100.0%) | $18,799 |
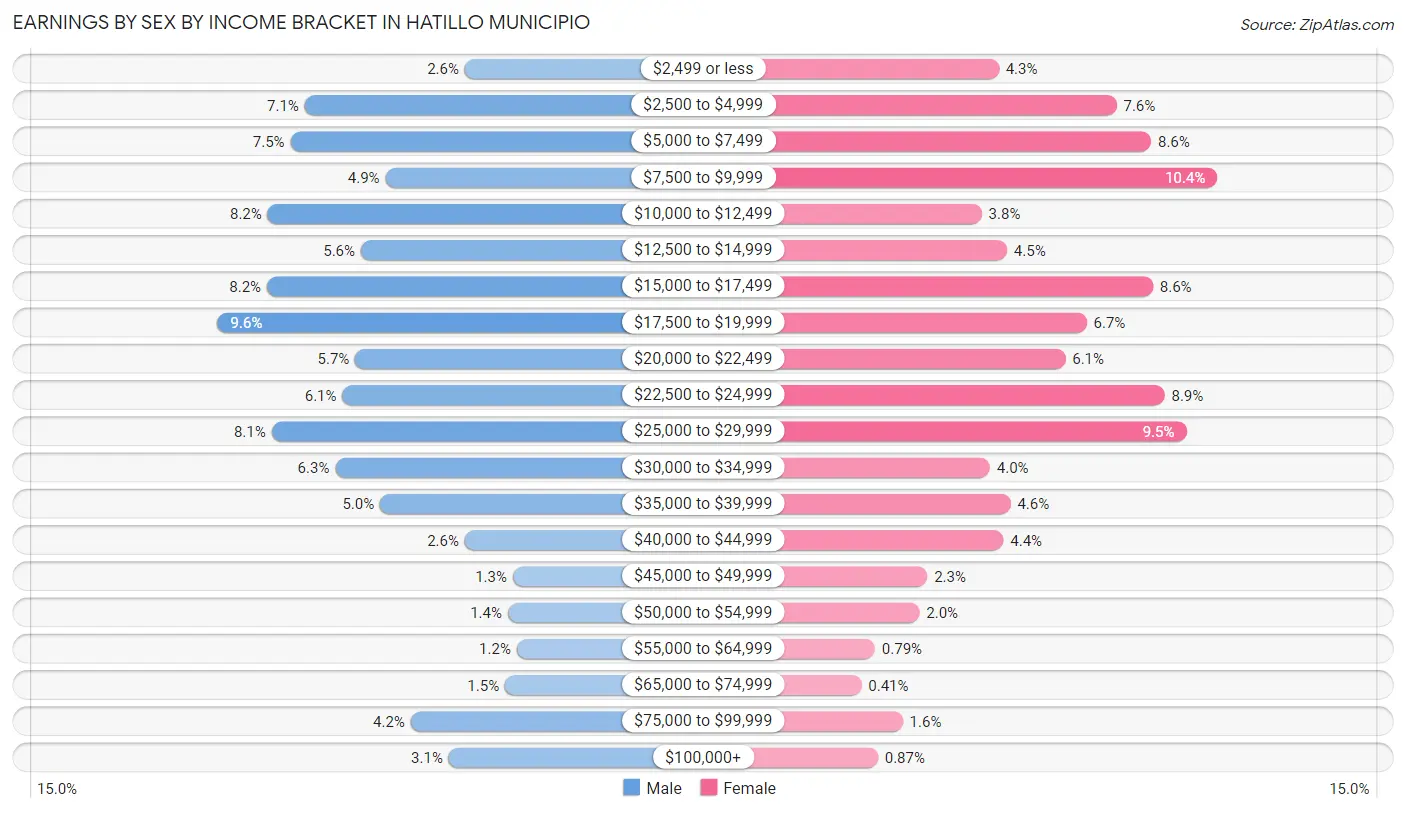
Earnings by Sex by Income Bracket in Hatillo Municipio
The most common earnings brackets in Hatillo Municipio are $17,500 to $19,999 for men (735 | 9.6%) and $7,500 to $9,999 for women (632 | 10.4%).
| Income | Male | Female |
| $2,499 or less | 202 (2.6%) | 259 (4.3%) |
| $2,500 to $4,999 | 547 (7.1%) | 460 (7.6%) |
| $5,000 to $7,499 | 578 (7.5%) | 519 (8.6%) |
| $7,500 to $9,999 | 373 (4.9%) | 632 (10.4%) |
| $10,000 to $12,499 | 627 (8.2%) | 230 (3.8%) |
| $12,500 to $14,999 | 426 (5.6%) | 273 (4.5%) |
| $15,000 to $17,499 | 628 (8.2%) | 522 (8.6%) |
| $17,500 to $19,999 | 735 (9.6%) | 409 (6.7%) |
| $20,000 to $22,499 | 438 (5.7%) | 373 (6.1%) |
| $22,500 to $24,999 | 466 (6.1%) | 542 (8.9%) |
| $25,000 to $29,999 | 618 (8.1%) | 579 (9.5%) |
| $30,000 to $34,999 | 481 (6.3%) | 244 (4.0%) |
| $35,000 to $39,999 | 384 (5.0%) | 279 (4.6%) |
| $40,000 to $44,999 | 202 (2.6%) | 267 (4.4%) |
| $45,000 to $49,999 | 98 (1.3%) | 137 (2.3%) |
| $50,000 to $54,999 | 109 (1.4%) | 124 (2.0%) |
| $55,000 to $64,999 | 90 (1.2%) | 48 (0.8%) |
| $65,000 to $74,999 | 115 (1.5%) | 25 (0.4%) |
| $75,000 to $99,999 | 318 (4.2%) | 95 (1.6%) |
| $100,000+ | 236 (3.1%) | 53 (0.9%) |
| Total | 7,671 (100.0%) | 6,070 (100.0%) |
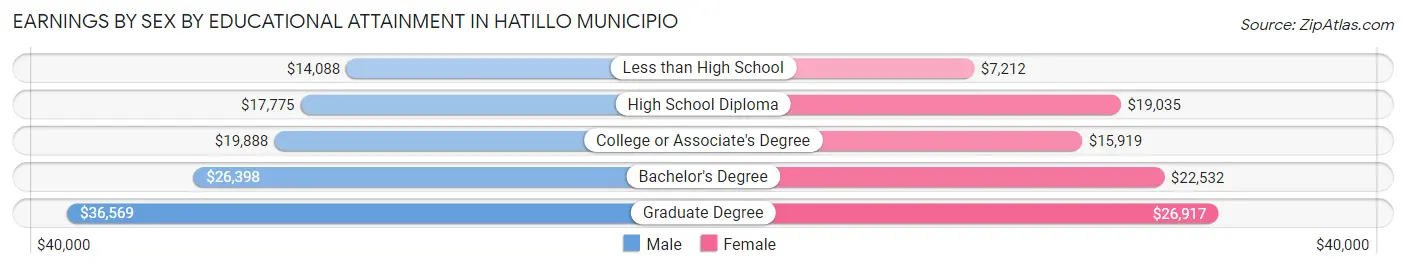
Earnings by Sex by Educational Attainment in Hatillo Municipio
Average earnings in Hatillo Municipio are $20,017 for men and $20,369 for women, a difference of 1.7%. Men with an educational attainment of graduate degree enjoy the highest average annual earnings of $36,569, while those with less than high school education earn the least with $14,088. Women with an educational attainment of graduate degree earn the most with the average annual earnings of $26,917, while those with less than high school education have the smallest earnings of $7,212.
| Educational Attainment | Male Income | Female Income |
| Less than High School | $14,088 | $7,212 |
| High School Diploma | $17,775 | $19,035 |
| College or Associate's Degree | $19,888 | $15,919 |
| Bachelor's Degree | $26,398 | $22,532 |
| Graduate Degree | $36,569 | $26,917 |
| Total | $20,017 | $20,369 |
Family Income in Hatillo Municipio
Family Income Brackets in Hatillo Municipio
According to the Hatillo Municipio family income data, there are 1,774 families falling into the $15,000 to $24,999 income range, which is the most common income bracket and makes up 17.8% of all families. Conversely, the $150,000 to $199,999 income bracket is the least frequent group with only 90 families (0.9%) belonging to this category.
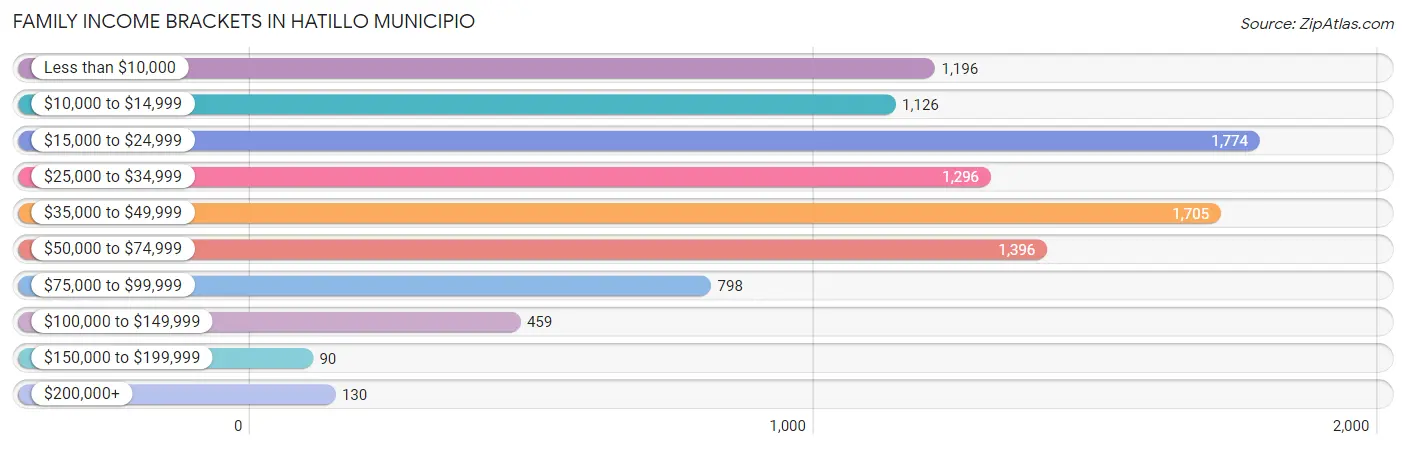
| Income Bracket | # Families | % Families |
| Less than $10,000 | 1,196 | 12.0% |
| $10,000 to $14,999 | 1,126 | 11.3% |
| $15,000 to $24,999 | 1,774 | 17.8% |
| $25,000 to $34,999 | 1,296 | 13.0% |
| $35,000 to $49,999 | 1,705 | 17.1% |
| $50,000 to $74,999 | 1,396 | 14.0% |
| $75,000 to $99,999 | 798 | 8.0% |
| $100,000 to $149,999 | 459 | 4.6% |
| $150,000 to $199,999 | 90 | 0.9% |
| $200,000+ | 130 | 1.3% |
Family Income by Famaliy Size in Hatillo Municipio
5-person families (572 | 5.7%) account for the highest median family income in Hatillo Municipio with $44,730 per family, while 2-person families (4,392 | 44.1%) have the highest median income of $13,170 per family member.
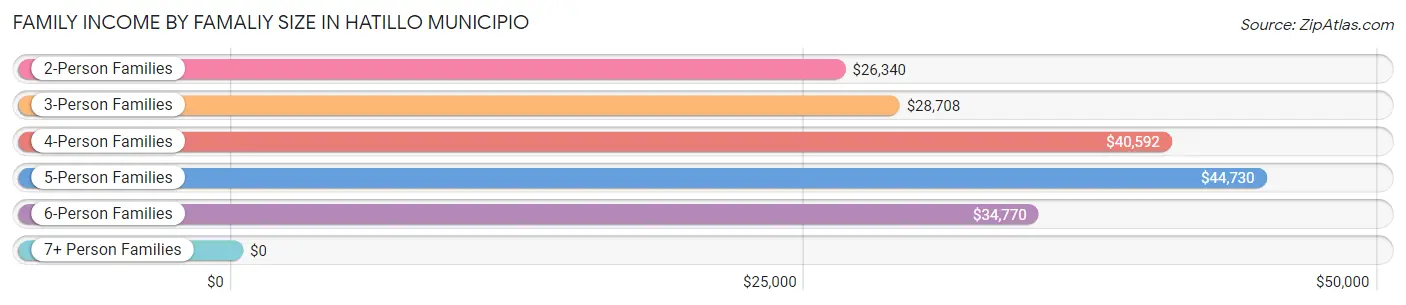
| Income Bracket | # Families | Median Income |
| 2-Person Families | 4,392 (44.1%) | $26,340 |
| 3-Person Families | 2,810 (28.2%) | $28,708 |
| 4-Person Families | 2,023 (20.3%) | $40,592 |
| 5-Person Families | 572 (5.7%) | $44,730 |
| 6-Person Families | 131 (1.3%) | $34,770 |
| 7+ Person Families | 41 (0.4%) | $0 |
| Total | 9,969 (100.0%) | $31,888 |
Family Income by Number of Earners in Hatillo Municipio
The median family income in Hatillo Municipio is $31,888, with families comprising 3+ earners (495) having the highest median family income of $70,813, while families with no earners (3,210) have the lowest median family income of $17,378, accounting for 5.0% and 32.2% of families, respectively.
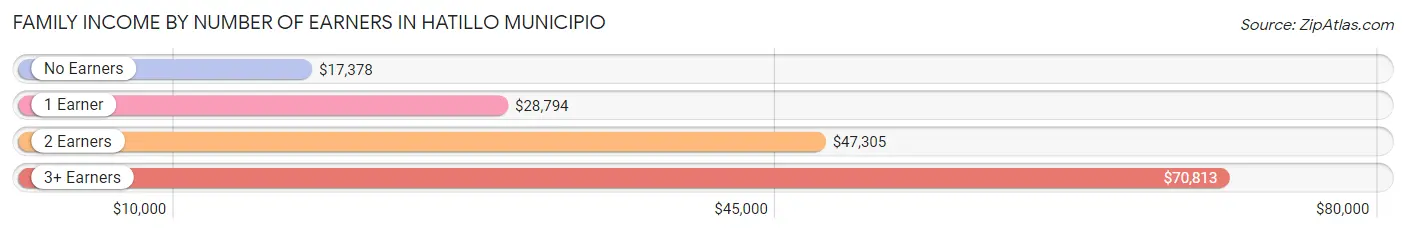
| Number of Earners | # Families | Median Income |
| No Earners | 3,210 (32.2%) | $17,378 |
| 1 Earner | 3,658 (36.7%) | $28,794 |
| 2 Earners | 2,606 (26.1%) | $47,305 |
| 3+ Earners | 495 (5.0%) | $70,813 |
| Total | 9,969 (100.0%) | $31,888 |
Household Income in Hatillo Municipio
Household Income Brackets in Hatillo Municipio
With 2,863 households falling in the category, the $15,000 to $24,999 income range is the most frequent in Hatillo Municipio, accounting for 21.2% of all households. In contrast, only 95 households (0.7%) fall into the $150,000 to $199,999 income bracket, making it the least populous group.
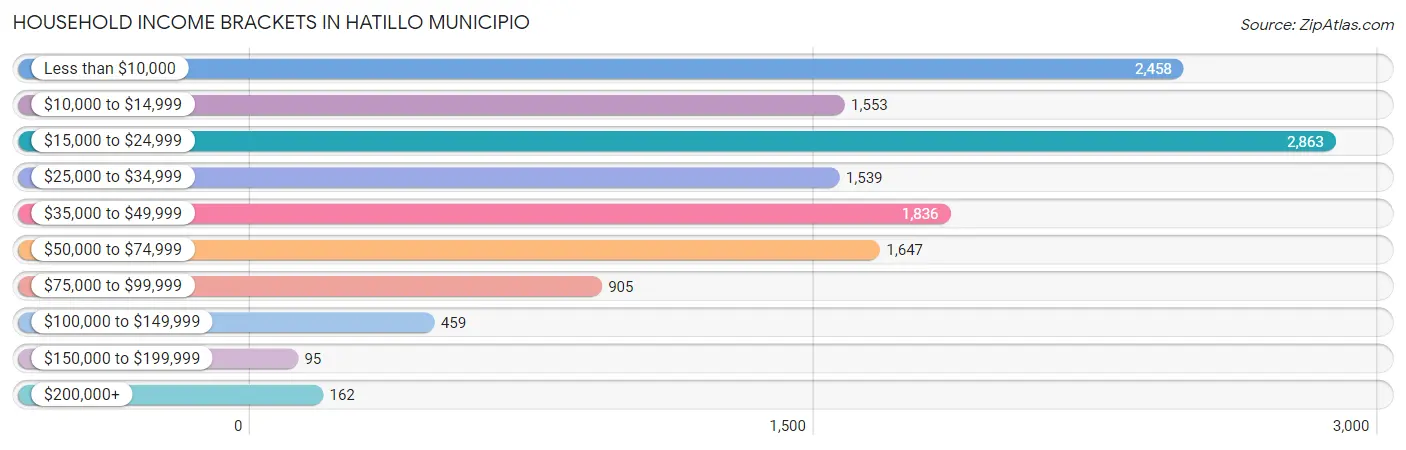
| Income Bracket | # Households | % Households |
| Less than $10,000 | 2,458 | 18.2% |
| $10,000 to $14,999 | 1,553 | 11.5% |
| $15,000 to $24,999 | 2,863 | 21.2% |
| $25,000 to $34,999 | 1,539 | 11.4% |
| $35,000 to $49,999 | 1,836 | 13.6% |
| $50,000 to $74,999 | 1,647 | 12.2% |
| $75,000 to $99,999 | 905 | 6.7% |
| $100,000 to $149,999 | 459 | 3.4% |
| $150,000 to $199,999 | 95 | 0.7% |
| $200,000+ | 162 | 1.2% |
Household Income by Householder Age in Hatillo Municipio
The median household income in Hatillo Municipio is $24,407, with the highest median household income of $33,642 found in the 45 to 64 years age bracket for the primary householder. A total of 5,329 households (39.5%) fall into this category. Meanwhile, the 15 to 24 years age bracket for the primary householder has the lowest median household income of $13,958, with 321 households (2.4%) in this group.
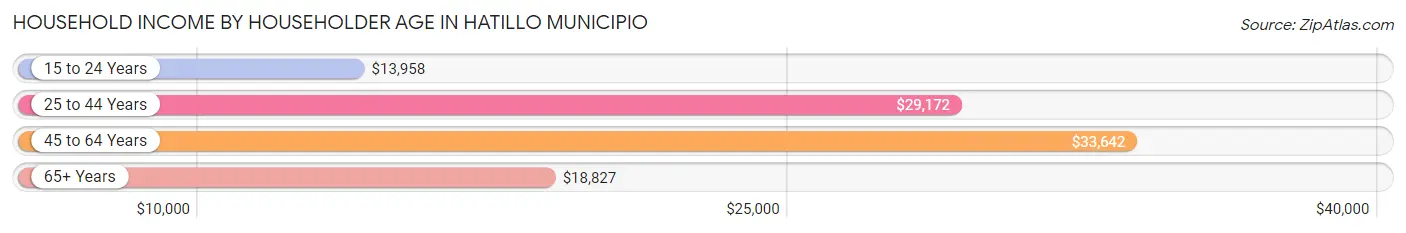
| Income Bracket | # Households | Median Income |
| 15 to 24 Years | 321 (2.4%) | $13,958 |
| 25 to 44 Years | 3,453 (25.6%) | $29,172 |
| 45 to 64 Years | 5,329 (39.5%) | $33,642 |
| 65+ Years | 4,400 (32.6%) | $18,827 |
| Total | 13,503 (100.0%) | $24,407 |
Poverty in Hatillo Municipio
Income Below Poverty by Sex and Age in Hatillo Municipio
With 37.5% poverty level for males and 41.0% for females among the residents of Hatillo Municipio, under 5 year old males and under 5 year old females are the most vulnerable to poverty, with 347 males (65.8%) and 356 females (64.3%) in their respective age groups living below the poverty level.
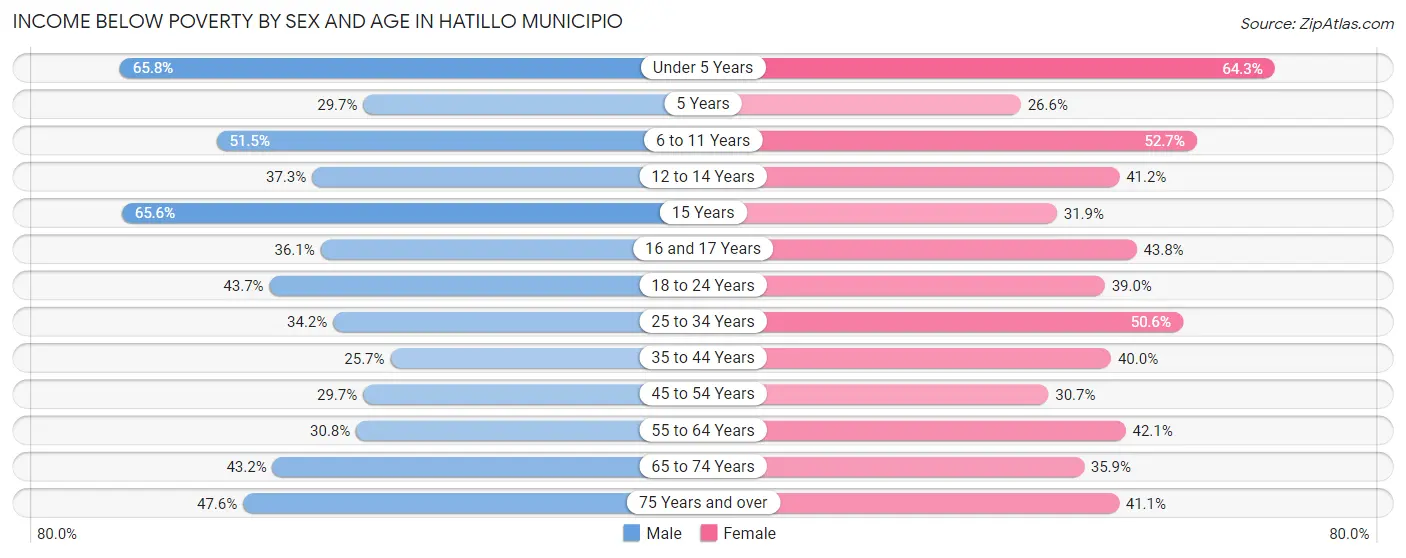
| Age Bracket | Male | Female |
| Under 5 Years | 347 (65.8%) | 356 (64.3%) |
| 5 Years | 52 (29.7%) | 38 (26.6%) |
| 6 to 11 Years | 566 (51.5%) | 501 (52.7%) |
| 12 to 14 Years | 265 (37.3%) | 318 (41.2%) |
| 15 Years | 99 (65.6%) | 98 (31.9%) |
| 16 and 17 Years | 190 (36.0%) | 140 (43.8%) |
| 18 to 24 Years | 725 (43.6%) | 634 (39.0%) |
| 25 to 34 Years | 827 (34.2%) | 1,250 (50.6%) |
| 35 to 44 Years | 595 (25.7%) | 1,024 (40.0%) |
| 45 to 54 Years | 743 (29.7%) | 855 (30.7%) |
| 55 to 64 Years | 747 (30.8%) | 1,183 (42.1%) |
| 65 to 74 Years | 895 (43.2%) | 889 (35.9%) |
| 75 Years and over | 778 (47.6%) | 916 (41.1%) |
| Total | 6,829 (37.5%) | 8,202 (41.0%) |
Income Above Poverty by Sex and Age in Hatillo Municipio
According to the poverty statistics in Hatillo Municipio, males aged 35 to 44 years and females aged 5 years are the age groups that are most secure financially, with 74.3% of males and 73.4% of females in these age groups living above the poverty line.
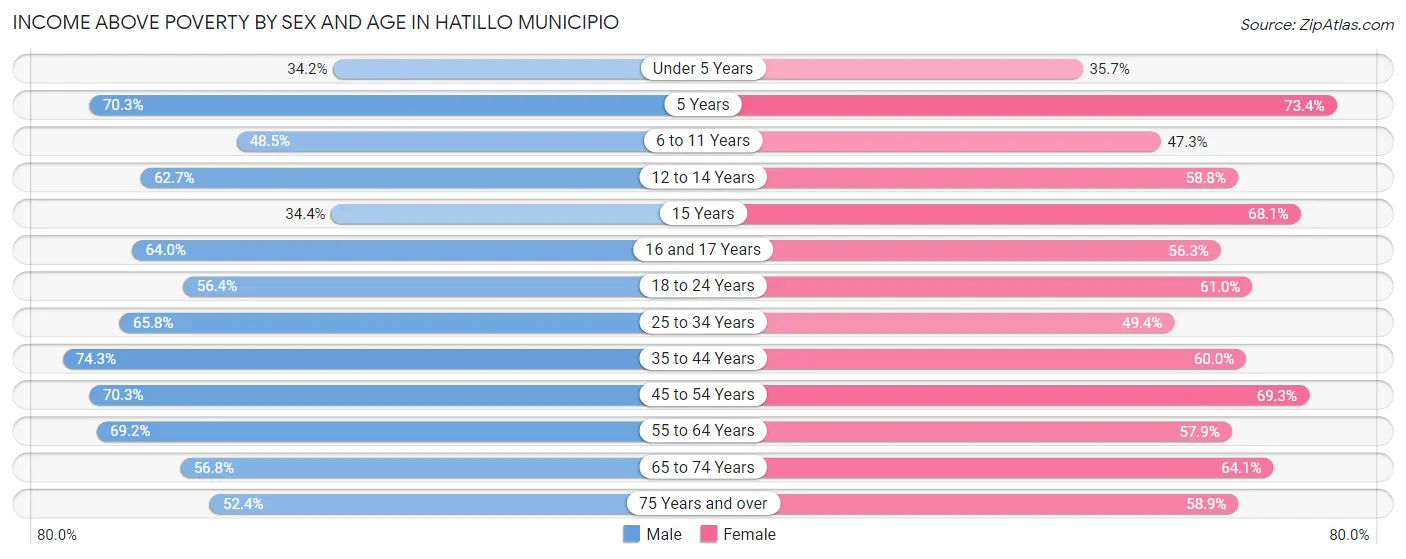
| Age Bracket | Male | Female |
| Under 5 Years | 180 (34.2%) | 198 (35.7%) |
| 5 Years | 123 (70.3%) | 105 (73.4%) |
| 6 to 11 Years | 533 (48.5%) | 450 (47.3%) |
| 12 to 14 Years | 445 (62.7%) | 454 (58.8%) |
| 15 Years | 52 (34.4%) | 209 (68.1%) |
| 16 and 17 Years | 337 (63.9%) | 180 (56.2%) |
| 18 to 24 Years | 936 (56.4%) | 990 (61.0%) |
| 25 to 34 Years | 1,592 (65.8%) | 1,219 (49.4%) |
| 35 to 44 Years | 1,721 (74.3%) | 1,538 (60.0%) |
| 45 to 54 Years | 1,755 (70.3%) | 1,934 (69.3%) |
| 55 to 64 Years | 1,681 (69.2%) | 1,625 (57.9%) |
| 65 to 74 Years | 1,177 (56.8%) | 1,585 (64.1%) |
| 75 Years and over | 858 (52.4%) | 1,311 (58.9%) |
| Total | 11,390 (62.5%) | 11,798 (59.0%) |
Income Below Poverty Among Married-Couple Families in Hatillo Municipio
The poverty statistics for married-couple families in Hatillo Municipio show that 28.6% or 1,914 of the total 6,694 families live below the poverty line. Families with 3 or 4 children have the highest poverty rate of 47.9%, comprising of 56 families. On the other hand, families with no children have the lowest poverty rate of 26.7%, which includes 1,161 families.
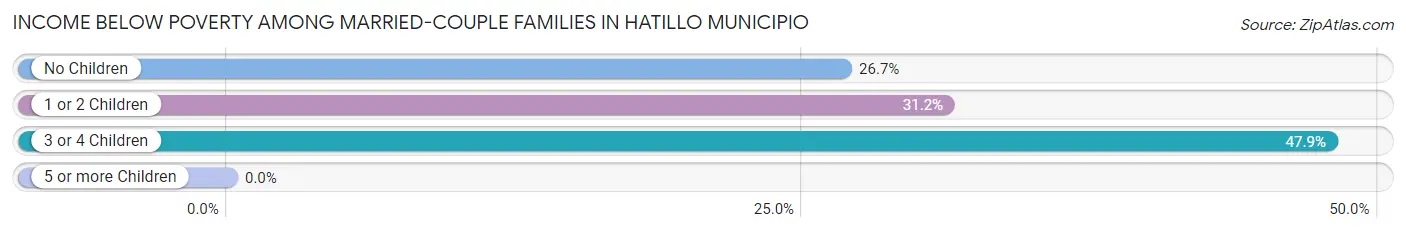
| Children | Above Poverty | Below Poverty |
| No Children | 3,182 (73.3%) | 1,161 (26.7%) |
| 1 or 2 Children | 1,537 (68.8%) | 697 (31.2%) |
| 3 or 4 Children | 61 (52.1%) | 56 (47.9%) |
| 5 or more Children | 0 (0.0%) | 0 (0.0%) |
| Total | 4,780 (71.4%) | 1,914 (28.6%) |
Income Below Poverty Among Single-Parent Households in Hatillo Municipio
According to the poverty data in Hatillo Municipio, 43.9% or 315 single-father households and 60.2% or 1,539 single-mother households are living below the poverty line. Among single-father households, those with 3 or 4 children have the highest poverty rate, with 25 households (100.0%) experiencing poverty. Likewise, among single-mother households, those with 1 or 2 children have the highest poverty rate, with 789 households (71.3%) falling below the poverty line.
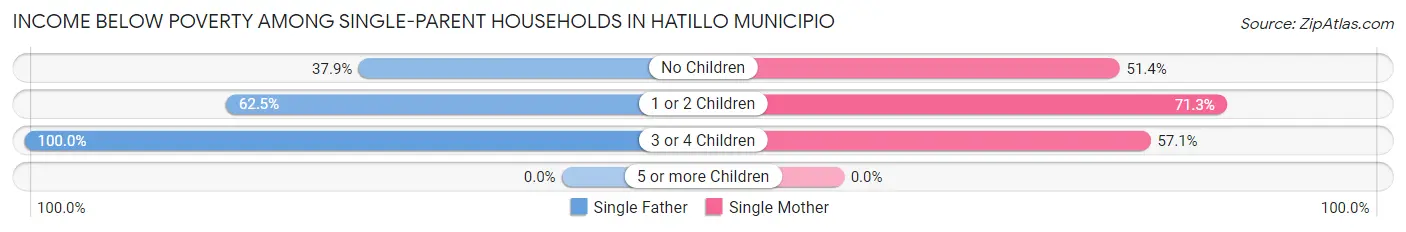
| Children | Single Father | Single Mother |
| No Children | 220 (37.9%) | 706 (51.4%) |
| 1 or 2 Children | 70 (62.5%) | 789 (71.3%) |
| 3 or 4 Children | 25 (100.0%) | 44 (57.1%) |
| 5 or more Children | 0 (0.0%) | 0 (0.0%) |
| Total | 315 (43.9%) | 1,539 (60.2%) |
Income Below Poverty Among Married-Couple vs Single-Parent Households in Hatillo Municipio
The poverty data for Hatillo Municipio shows that 1,914 of the married-couple family households (28.6%) and 1,854 of the single-parent households (56.6%) are living below the poverty level. Within the married-couple family households, those with 3 or 4 children have the highest poverty rate, with 56 households (47.9%) falling below the poverty line. Among the single-parent households, those with 1 or 2 children have the highest poverty rate, with 859 household (70.5%) living below poverty.
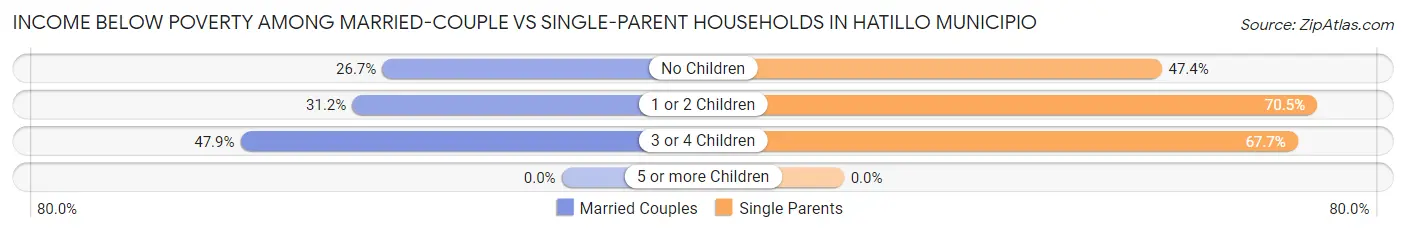
| Children | Married-Couple Families | Single-Parent Households |
| No Children | 1,161 (26.7%) | 926 (47.4%) |
| 1 or 2 Children | 697 (31.2%) | 859 (70.5%) |
| 3 or 4 Children | 56 (47.9%) | 69 (67.6%) |
| 5 or more Children | 0 (0.0%) | 0 (0.0%) |
| Total | 1,914 (28.6%) | 1,854 (56.6%) |
Race in Hatillo Municipio
The most populous races in Hatillo Municipio are Hispanic or Latino (38,153 | 99.5%), White / Caucasian (29,908 | 78.0%), and Some other Race (3,776 | 9.9%).
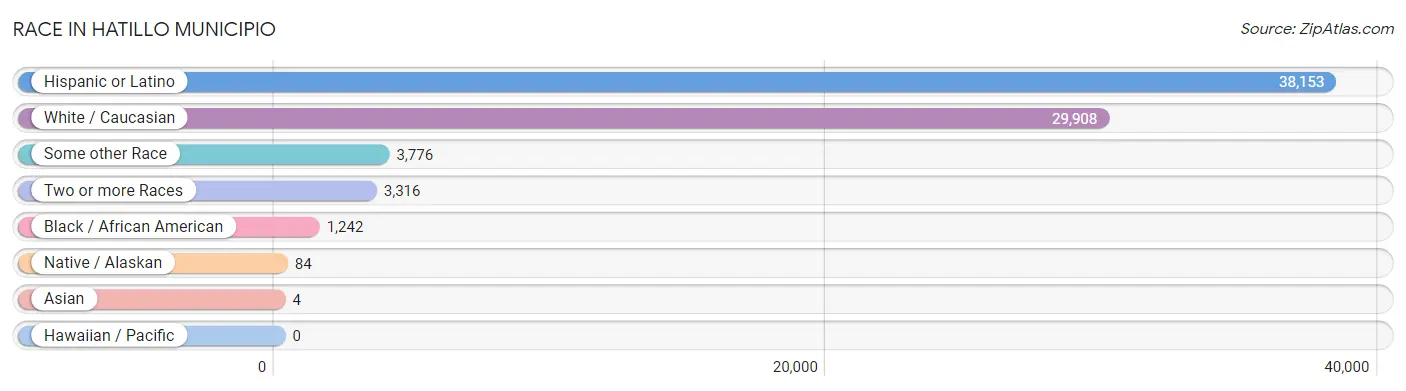
| Race | # Population | % Population |
| Asian | 4 | 0.0% |
| Black / African American | 1,242 | 3.2% |
| Hawaiian / Pacific | 0 | 0.0% |
| Hispanic or Latino | 38,153 | 99.5% |
| Native / Alaskan | 84 | 0.2% |
| White / Caucasian | 29,908 | 78.0% |
| Two or more Races | 3,316 | 8.6% |
| Some other Race | 3,776 | 9.9% |
| Total | 38,330 | 100.0% |
Ancestry in Hatillo Municipio
The most populous ancestries reported in Hatillo Municipio are Puerto Rican (38,066 | 99.3%), American (233 | 0.6%), Central American Indian (144 | 0.4%), Dominican (49 | 0.1%), and West Indian (32 | 0.1%), together accounting for 100.5% of all Hatillo Municipio residents.
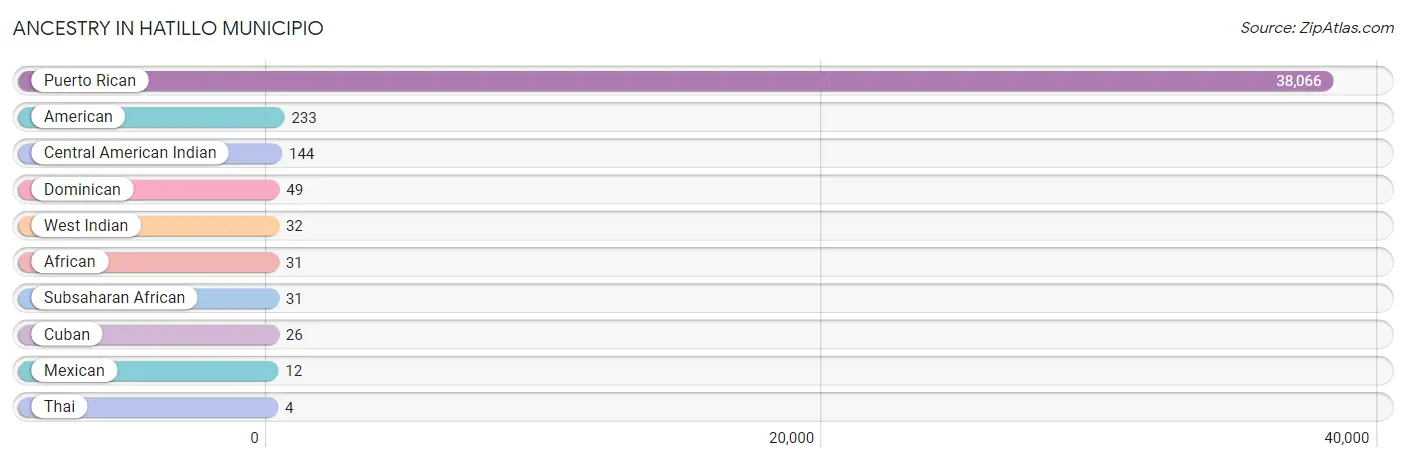
| Ancestry | # Population | % Population |
| African | 31 | 0.1% |
| American | 233 | 0.6% |
| Central American Indian | 144 | 0.4% |
| Cuban | 26 | 0.1% |
| Dominican | 49 | 0.1% |
| Mexican | 12 | 0.0% |
| Puerto Rican | 38,066 | 99.3% |
| Subsaharan African | 31 | 0.1% |
| Thai | 4 | 0.0% |
| West Indian | 32 | 0.1% | View All 10 Rows |
Immigrants in Hatillo Municipio

| Immigration Origin | # Population | % Population | View All 0 Rows |
Sex and Age in Hatillo Municipio
Sex and Age in Hatillo Municipio
The most populous age groups in Hatillo Municipio are 60 to 64 Years (1,492 | 8.2%) for men and 70 to 74 Years (1,479 | 7.4%) for women.
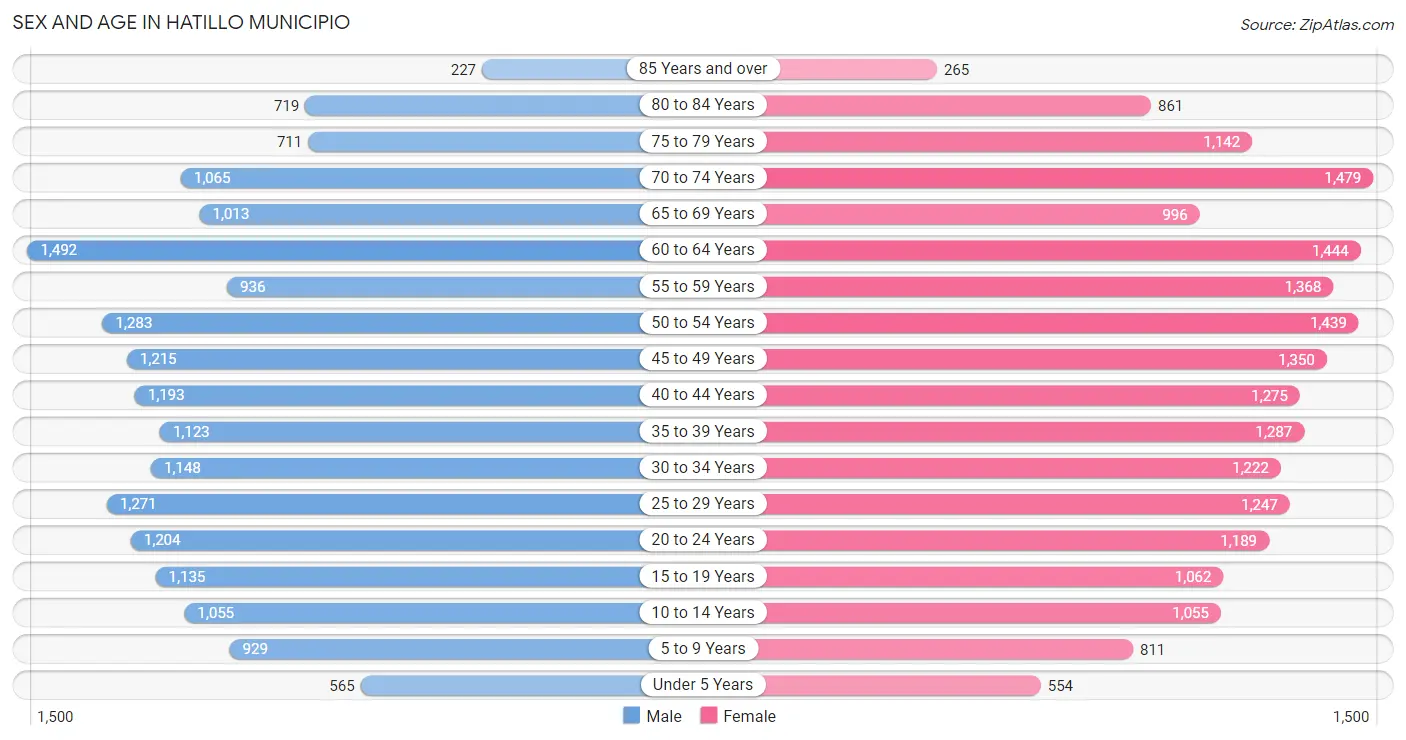
| Age Bracket | Male | Female |
| Under 5 Years | 565 (3.1%) | 554 (2.8%) |
| 5 to 9 Years | 929 (5.1%) | 811 (4.1%) |
| 10 to 14 Years | 1,055 (5.8%) | 1,055 (5.3%) |
| 15 to 19 Years | 1,135 (6.2%) | 1,062 (5.3%) |
| 20 to 24 Years | 1,204 (6.6%) | 1,189 (5.9%) |
| 25 to 29 Years | 1,271 (7.0%) | 1,247 (6.2%) |
| 30 to 34 Years | 1,148 (6.3%) | 1,222 (6.1%) |
| 35 to 39 Years | 1,123 (6.1%) | 1,287 (6.4%) |
| 40 to 44 Years | 1,193 (6.5%) | 1,275 (6.4%) |
| 45 to 49 Years | 1,215 (6.7%) | 1,350 (6.7%) |
| 50 to 54 Years | 1,283 (7.0%) | 1,439 (7.2%) |
| 55 to 59 Years | 936 (5.1%) | 1,368 (6.8%) |
| 60 to 64 Years | 1,492 (8.2%) | 1,444 (7.2%) |
| 65 to 69 Years | 1,013 (5.5%) | 996 (5.0%) |
| 70 to 74 Years | 1,065 (5.8%) | 1,479 (7.4%) |
| 75 to 79 Years | 711 (3.9%) | 1,142 (5.7%) |
| 80 to 84 Years | 719 (3.9%) | 861 (4.3%) |
| 85 Years and over | 227 (1.2%) | 265 (1.3%) |
| Total | 18,284 (100.0%) | 20,046 (100.0%) |
Families and Households in Hatillo Municipio
Median Family Size in Hatillo Municipio
The median family size in Hatillo Municipio is 3.38 persons per family, with single male/father families (718 | 7.2%) accounting for the largest median family size of 3.68 persons per family. On the other hand, single female/mother families (2,557 | 25.7%) represent the smallest median family size with 3.34 persons per family.
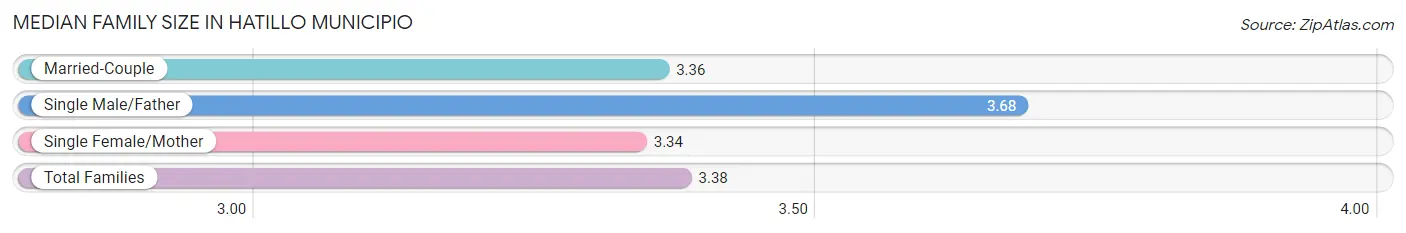
| Family Type | # Families | Family Size |
| Married-Couple | 6,694 (67.1%) | 3.36 |
| Single Male/Father | 718 (7.2%) | 3.68 |
| Single Female/Mother | 2,557 (25.7%) | 3.34 |
| Total Families | 9,969 (100.0%) | 3.38 |
Median Household Size in Hatillo Municipio
The median household size in Hatillo Municipio is 2.83 persons per household, with single male/father households (718 | 5.3%) accounting for the largest median household size of 3.98 persons per household. non-family households (3,534 | 26.2%) represent the smallest median household size with 1.10 persons per household.
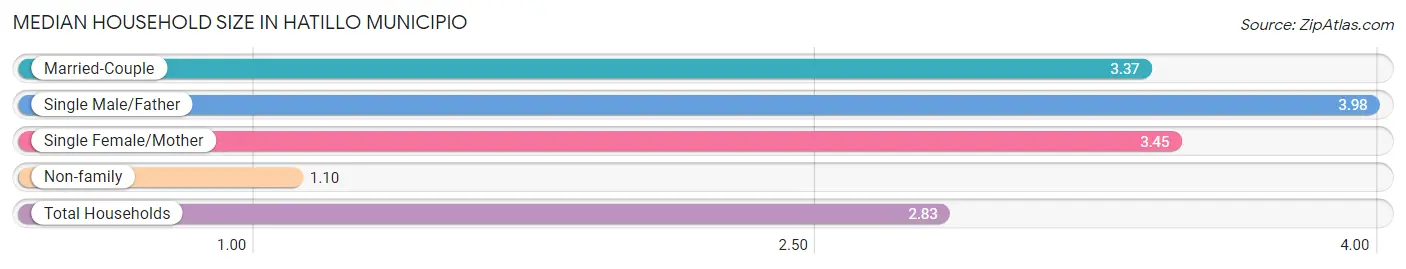
| Household Type | # Households | Household Size |
| Married-Couple | 6,694 (49.6%) | 3.37 |
| Single Male/Father | 718 (5.3%) | 3.98 |
| Single Female/Mother | 2,557 (18.9%) | 3.45 |
| Non-family | 3,534 (26.2%) | 1.10 |
| Total Households | 13,503 (100.0%) | 2.83 |
Household Size by Marriage Status in Hatillo Municipio
Out of a total of 13,503 households in Hatillo Municipio, 9,969 (73.8%) are family households, while 3,534 (26.2%) are nonfamily households. The most numerous type of family households are 2-person households, comprising 4,151, and the most common type of nonfamily households are 1-person households, comprising 3,204.
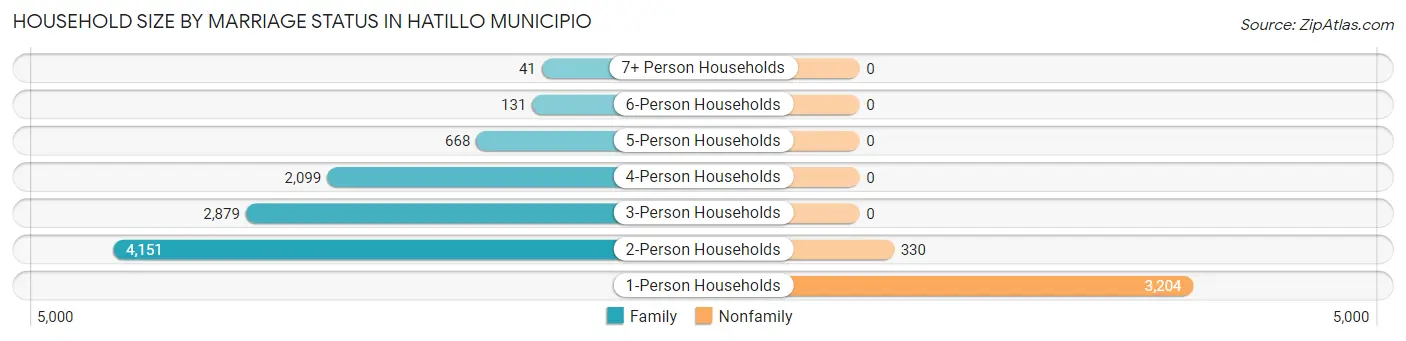
| Household Size | Family Households | Nonfamily Households |
| 1-Person Households | - | 3,204 (23.7%) |
| 2-Person Households | 4,151 (30.7%) | 330 (2.4%) |
| 3-Person Households | 2,879 (21.3%) | 0 (0.0%) |
| 4-Person Households | 2,099 (15.5%) | 0 (0.0%) |
| 5-Person Households | 668 (5.0%) | 0 (0.0%) |
| 6-Person Households | 131 (1.0%) | 0 (0.0%) |
| 7+ Person Households | 41 (0.3%) | 0 (0.0%) |
| Total | 9,969 (73.8%) | 3,534 (26.2%) |
Female Fertility in Hatillo Municipio
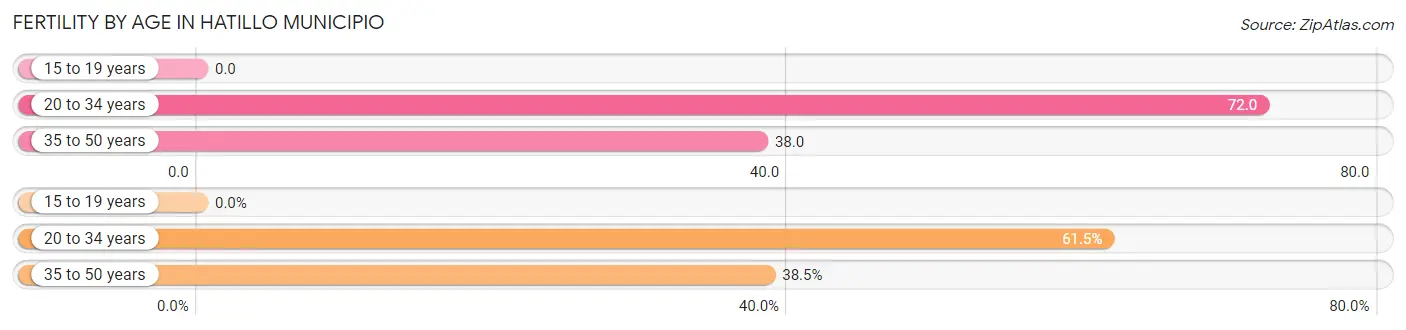
Fertility by Age in Hatillo Municipio
Average fertility rate in Hatillo Municipio is 47.0 births per 1,000 women. Women in the age bracket of 20 to 34 years have the highest fertility rate with 72.0 births per 1,000 women. Women in the age bracket of 20 to 34 years acount for 61.5% of all women with births.
| Age Bracket | Women with Births | Births / 1,000 Women |
| 15 to 19 years | 0 (0.0%) | 0.0 |
| 20 to 34 years | 262 (61.5%) | 72.0 |
| 35 to 50 years | 164 (38.5%) | 38.0 |
| Total | 426 (100.0%) | 47.0 |
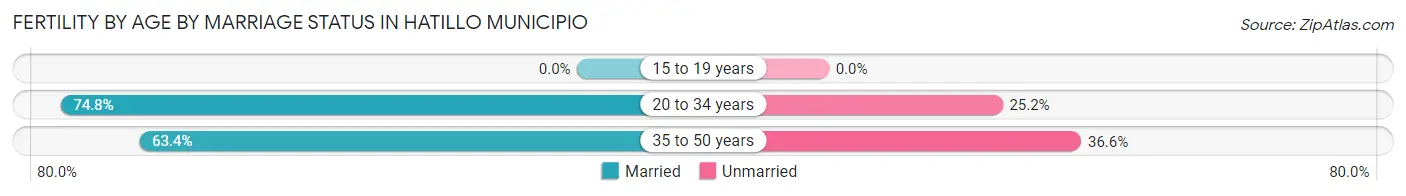
Fertility by Age by Marriage Status in Hatillo Municipio
70.4% of women with births (426) in Hatillo Municipio are married. The highest percentage of unmarried women with births falls into 35 to 50 years age bracket with 36.6% of them unmarried at the time of birth, while the lowest percentage of unmarried women with births belong to 20 to 34 years age bracket with 25.2% of them unmarried.
| Age Bracket | Married | Unmarried |
| 15 to 19 years | 0 (0.0%) | 0 (0.0%) |
| 20 to 34 years | 196 (74.8%) | 66 (25.2%) |
| 35 to 50 years | 104 (63.4%) | 60 (36.6%) |
| Total | 300 (70.4%) | 126 (29.6%) |
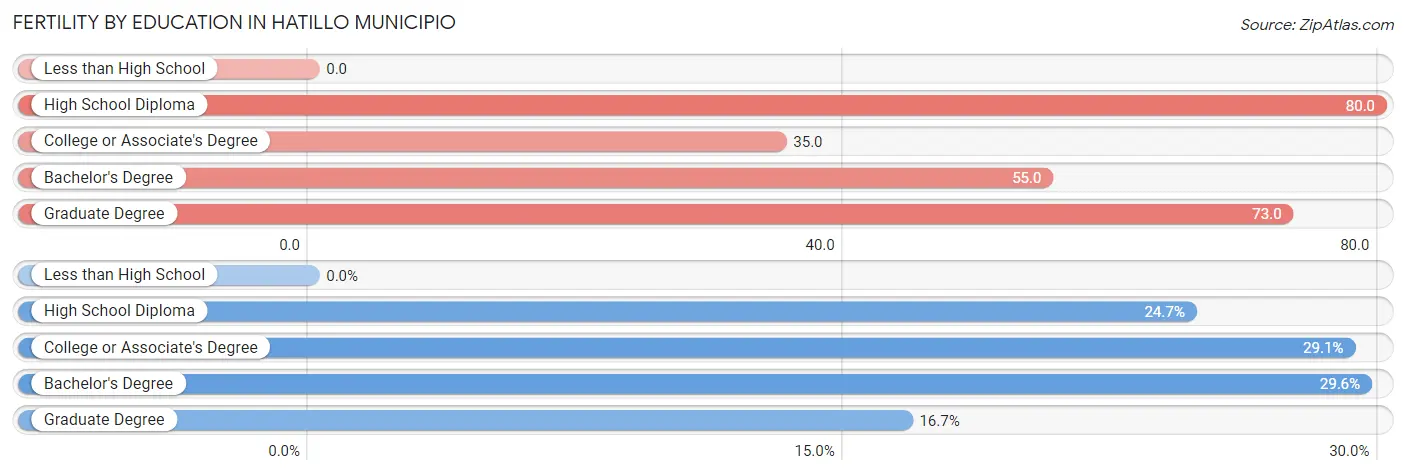
Fertility by Education in Hatillo Municipio
| Educational Attainment | Women with Births | Births / 1,000 Women |
| Less than High School | 0 (0.0%) | 0.0 |
| High School Diploma | 105 (24.6%) | 80.0 |
| College or Associate's Degree | 124 (29.1%) | 35.0 |
| Bachelor's Degree | 126 (29.6%) | 55.0 |
| Graduate Degree | 71 (16.7%) | 73.0 |
| Total | 426 (100.0%) | 47.0 |
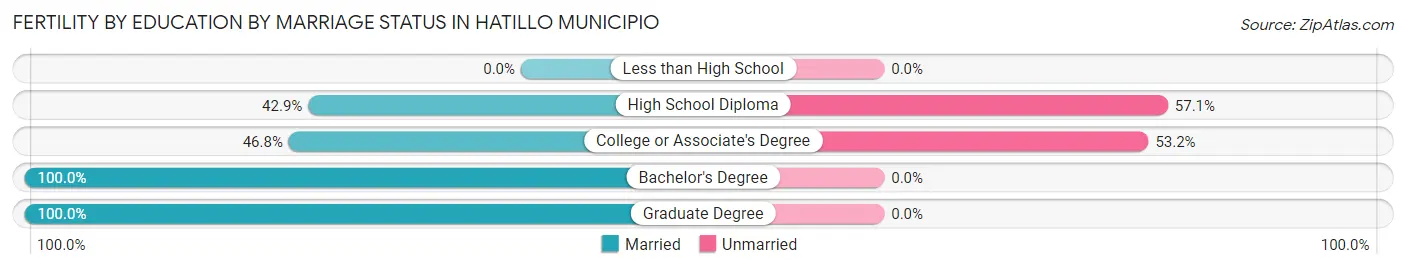
Fertility by Education by Marriage Status in Hatillo Municipio
29.6% of women with births in Hatillo Municipio are unmarried. Women with the educational attainment of bachelor's degree are most likely to be married with 100.0% of them married at childbirth, while women with the educational attainment of high school diploma are least likely to be married with 57.1% of them unmarried at childbirth.
| Educational Attainment | Married | Unmarried |
| Less than High School | 0 (0.0%) | 0 (0.0%) |
| High School Diploma | 45 (42.9%) | 60 (57.1%) |
| College or Associate's Degree | 58 (46.8%) | 66 (53.2%) |
| Bachelor's Degree | 126 (100.0%) | 0 (0.0%) |
| Graduate Degree | 71 (100.0%) | 0 (0.0%) |
| Total | 300 (70.4%) | 126 (29.6%) |
Employment Characteristics in Hatillo Municipio
Employment by Class of Employer in Hatillo Municipio
Among the 13,223 employed individuals in Hatillo Municipio, private company employees (8,516 | 64.4%), state government employees (1,857 | 14.0%), and self-employed (not incorporated) (1,505 | 11.4%) make up the most common classes of employment.
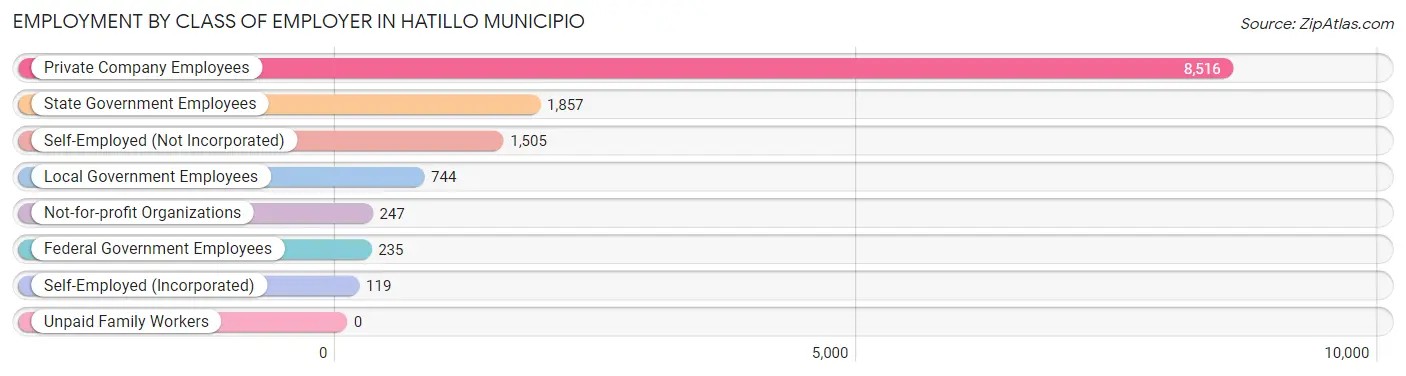
| Employer Class | # Employees | % Employees |
| Private Company Employees | 8,516 | 64.4% |
| Self-Employed (Incorporated) | 119 | 0.9% |
| Self-Employed (Not Incorporated) | 1,505 | 11.4% |
| Not-for-profit Organizations | 247 | 1.9% |
| Local Government Employees | 744 | 5.6% |
| State Government Employees | 1,857 | 14.0% |
| Federal Government Employees | 235 | 1.8% |
| Unpaid Family Workers | 0 | 0.0% |
| Total | 13,223 | 100.0% |
Employment Status by Age in Hatillo Municipio
According to the labor force statistics for Hatillo Municipio, out of the total population over 16 years of age (32,903), 43.2% or 14,214 individuals are in the labor force, with 6.0% or 853 of them unemployed. The age group with the highest labor force participation rate is 35 to 44 years, with 75.7% or 3,693 individuals in the labor force. Within the labor force, the 25 to 29 years age range has the highest percentage of unemployed individuals, with 13.1% or 224 of them being unemployed.
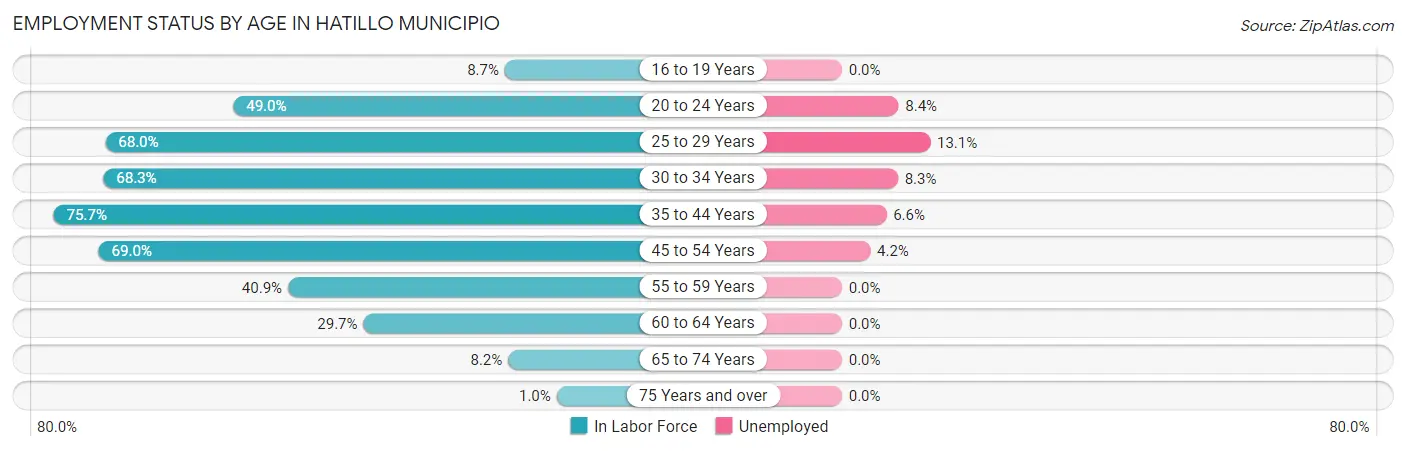
| Age Bracket | In Labor Force | Unemployed |
| 16 to 19 Years | 151 (8.7%) | 0 (0.0%) |
| 20 to 24 Years | 1,173 (49.0%) | 99 (8.4%) |
| 25 to 29 Years | 1,712 (68.0%) | 224 (13.1%) |
| 30 to 34 Years | 1,619 (68.3%) | 134 (8.3%) |
| 35 to 44 Years | 3,693 (75.7%) | 244 (6.6%) |
| 45 to 54 Years | 3,648 (69.0%) | 153 (4.2%) |
| 55 to 59 Years | 942 (40.9%) | 0 (0.0%) |
| 60 to 64 Years | 872 (29.7%) | 0 (0.0%) |
| 65 to 74 Years | 373 (8.2%) | 0 (0.0%) |
| 75 Years and over | 39 (1.0%) | 0 (0.0%) |
| Total | 14,214 (43.2%) | 853 (6.0%) |
Employment Status by Educational Attainment in Hatillo Municipio
According to labor force statistics for Hatillo Municipio, 61.5% of individuals (12,480) out of the total population between 25 and 64 years of age (20,293) are in the labor force, with 6.0% or 749 of them being unemployed. The group with the highest labor force participation rate are those with the educational attainment of bachelor's degree or higher, with 75.5% or 5,440 individuals in the labor force. Within the labor force, individuals with less than high school education have the highest percentage of unemployment, with 8.1% or 77 of them being unemployed.
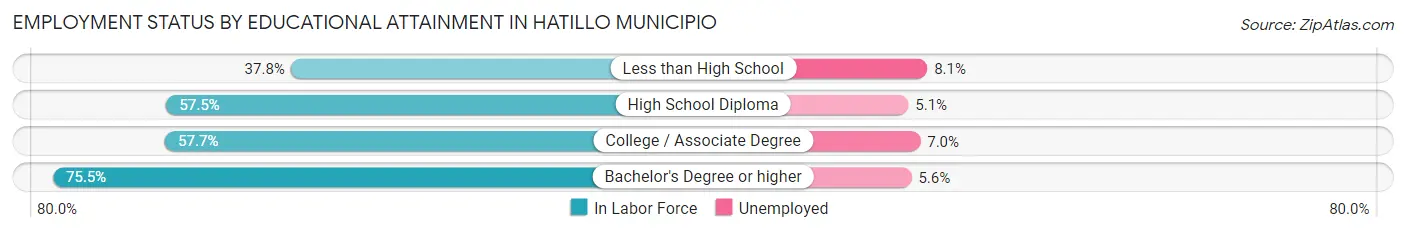
| Educational Attainment | In Labor Force | Unemployed |
| Less than High School | 946 (37.8%) | 203 (8.1%) |
| High School Diploma | 2,728 (57.5%) | 242 (5.1%) |
| College / Associate Degree | 3,370 (57.7%) | 409 (7.0%) |
| Bachelor's Degree or higher | 5,440 (75.5%) | 403 (5.6%) |
| Total | 12,480 (61.5%) | 1,218 (6.0%) |
Employment Occupations by Sex in Hatillo Municipio
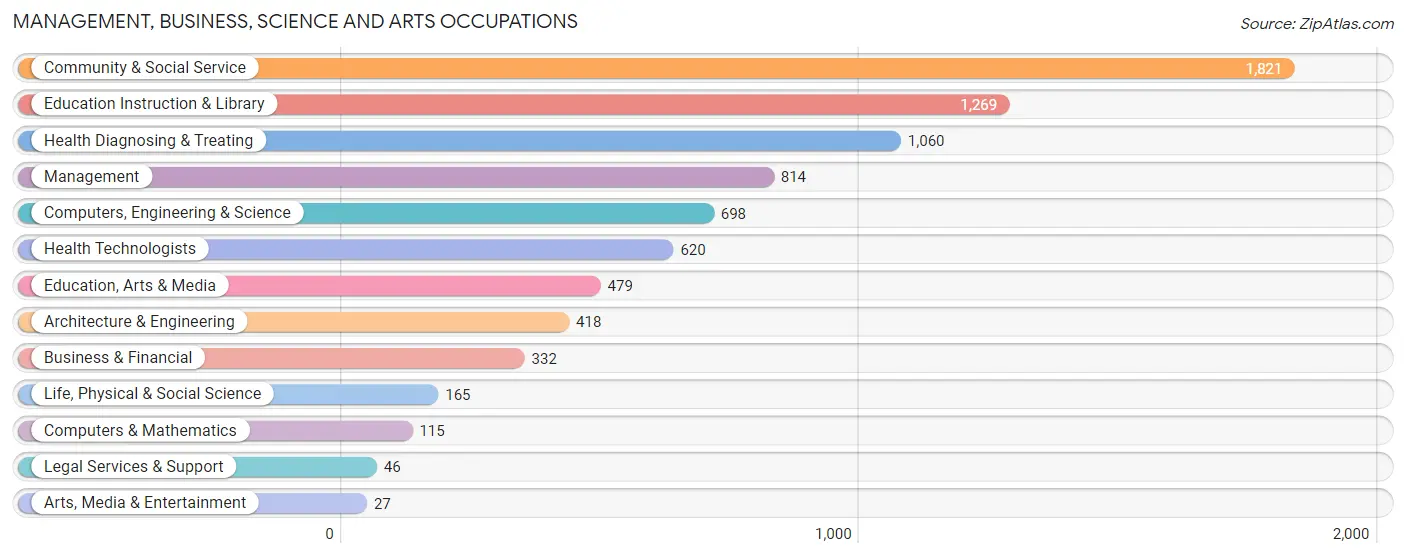
Management, Business, Science and Arts Occupations
The most common Management, Business, Science and Arts occupations in Hatillo Municipio are Community & Social Service (1,821 | 13.6%), Education Instruction & Library (1,269 | 9.5%), Health Diagnosing & Treating (1,060 | 7.9%), Management (814 | 6.1%), and Computers, Engineering & Science (698 | 5.2%).
Management, Business, Science and Arts Occupations by Sex
Within the Management, Business, Science and Arts occupations in Hatillo Municipio, the most male-oriented occupations are Arts, Media & Entertainment (100.0%), Architecture & Engineering (84.7%), and Computers, Engineering & Science (82.2%), while the most female-oriented occupations are Legal Services & Support (100.0%), Education, Arts & Media (83.3%), and Community & Social Service (76.9%).
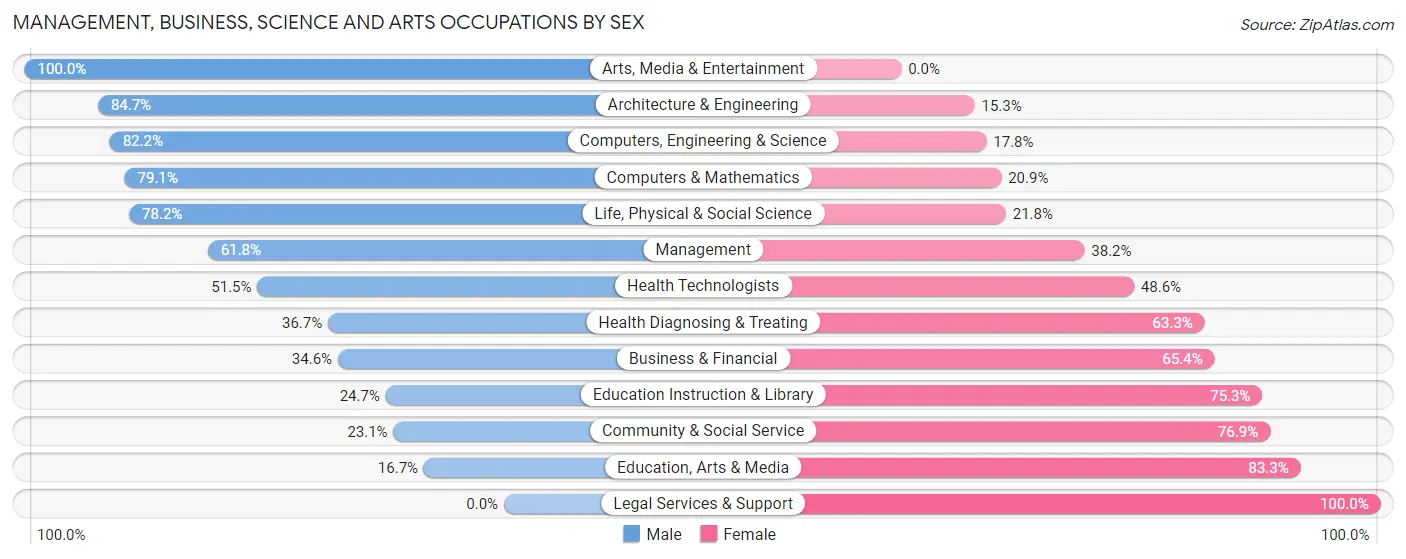
| Occupation | Male | Female |
| Management | 503 (61.8%) | 311 (38.2%) |
| Business & Financial | 115 (34.6%) | 217 (65.4%) |
| Computers, Engineering & Science | 574 (82.2%) | 124 (17.8%) |
| Computers & Mathematics | 91 (79.1%) | 24 (20.9%) |
| Architecture & Engineering | 354 (84.7%) | 64 (15.3%) |
| Life, Physical & Social Science | 129 (78.2%) | 36 (21.8%) |
| Community & Social Service | 420 (23.1%) | 1,401 (76.9%) |
| Education, Arts & Media | 80 (16.7%) | 399 (83.3%) |
| Legal Services & Support | 0 (0.0%) | 46 (100.0%) |
| Education Instruction & Library | 313 (24.7%) | 956 (75.3%) |
| Arts, Media & Entertainment | 27 (100.0%) | 0 (0.0%) |
| Health Diagnosing & Treating | 389 (36.7%) | 671 (63.3%) |
| Health Technologists | 319 (51.4%) | 301 (48.5%) |
| Total (Category) | 2,001 (42.3%) | 2,724 (57.7%) |
| Total (Overall) | 7,348 (55.0%) | 5,999 (45.0%) |
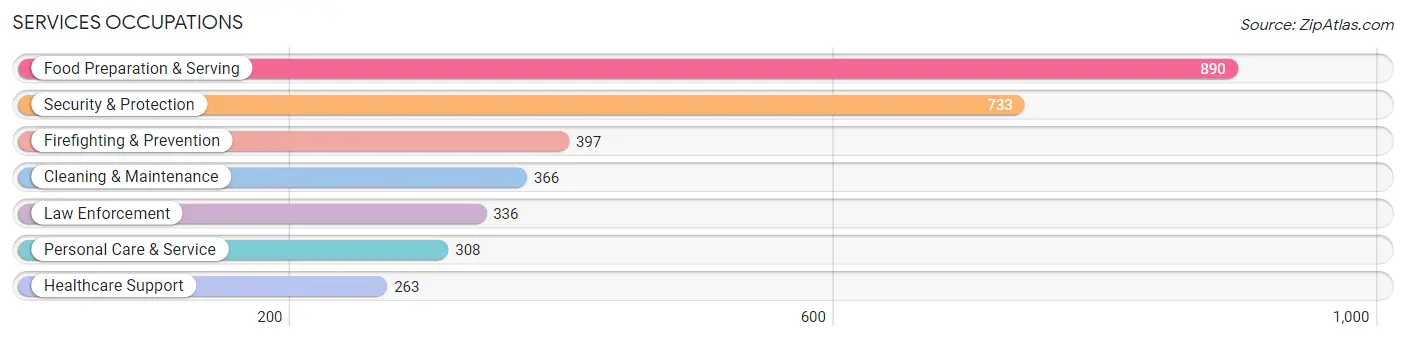
Services Occupations
The most common Services occupations in Hatillo Municipio are Food Preparation & Serving (890 | 6.7%), Security & Protection (733 | 5.5%), Firefighting & Prevention (397 | 3.0%), Cleaning & Maintenance (366 | 2.7%), and Law Enforcement (336 | 2.5%).
Services Occupations by Sex
Within the Services occupations in Hatillo Municipio, the most male-oriented occupations are Firefighting & Prevention (90.9%), Security & Protection (87.9%), and Law Enforcement (84.2%), while the most female-oriented occupations are Healthcare Support (85.6%), Personal Care & Service (53.2%), and Food Preparation & Serving (50.3%).
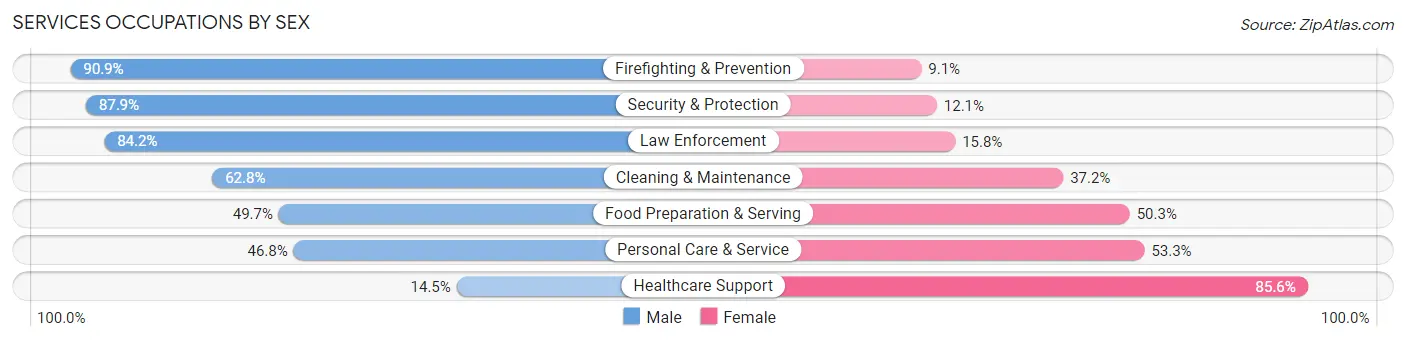
| Occupation | Male | Female |
| Healthcare Support | 38 (14.4%) | 225 (85.6%) |
| Security & Protection | 644 (87.9%) | 89 (12.1%) |
| Firefighting & Prevention | 361 (90.9%) | 36 (9.1%) |
| Law Enforcement | 283 (84.2%) | 53 (15.8%) |
| Food Preparation & Serving | 442 (49.7%) | 448 (50.3%) |
| Cleaning & Maintenance | 230 (62.8%) | 136 (37.2%) |
| Personal Care & Service | 144 (46.8%) | 164 (53.2%) |
| Total (Category) | 1,498 (58.5%) | 1,062 (41.5%) |
| Total (Overall) | 7,348 (55.0%) | 5,999 (45.0%) |
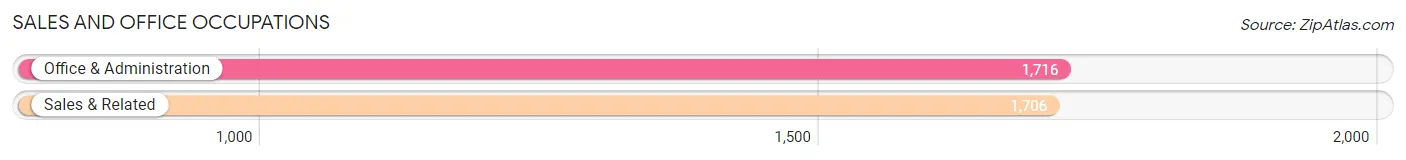
Sales and Office Occupations
The most common Sales and Office occupations in Hatillo Municipio are Office & Administration (1,716 | 12.9%), and Sales & Related (1,706 | 12.8%).
Sales and Office Occupations by Sex
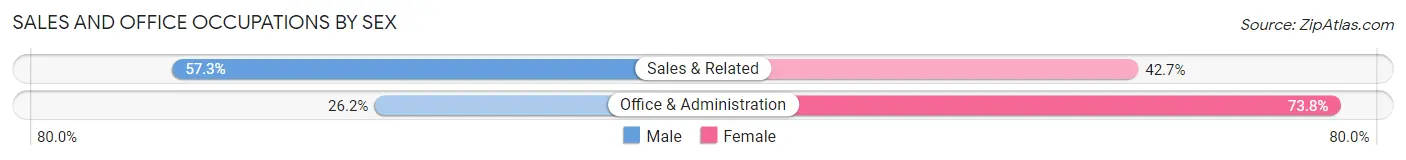
| Occupation | Male | Female |
| Sales & Related | 977 (57.3%) | 729 (42.7%) |
| Office & Administration | 450 (26.2%) | 1,266 (73.8%) |
| Total (Category) | 1,427 (41.7%) | 1,995 (58.3%) |
| Total (Overall) | 7,348 (55.0%) | 5,999 (45.0%) |
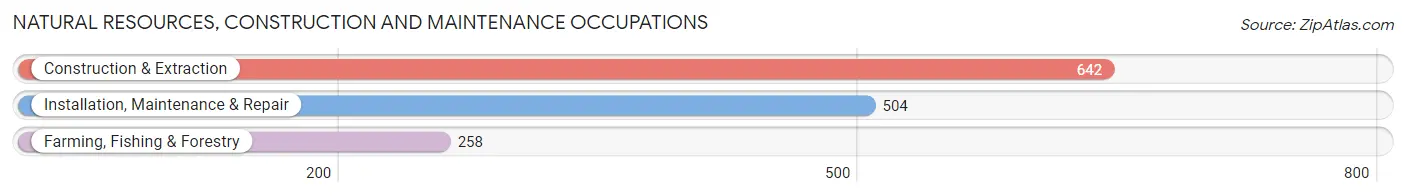
Natural Resources, Construction and Maintenance Occupations
The most common Natural Resources, Construction and Maintenance occupations in Hatillo Municipio are Construction & Extraction (642 | 4.8%), Installation, Maintenance & Repair (504 | 3.8%), and Farming, Fishing & Forestry (258 | 1.9%).
Natural Resources, Construction and Maintenance Occupations by Sex
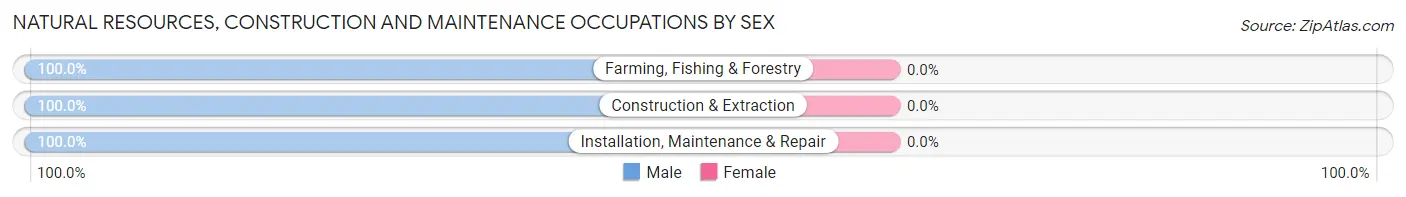
| Occupation | Male | Female |
| Farming, Fishing & Forestry | 258 (100.0%) | 0 (0.0%) |
| Construction & Extraction | 642 (100.0%) | 0 (0.0%) |
| Installation, Maintenance & Repair | 504 (100.0%) | 0 (0.0%) |
| Total (Category) | 1,404 (100.0%) | 0 (0.0%) |
| Total (Overall) | 7,348 (55.0%) | 5,999 (45.0%) |
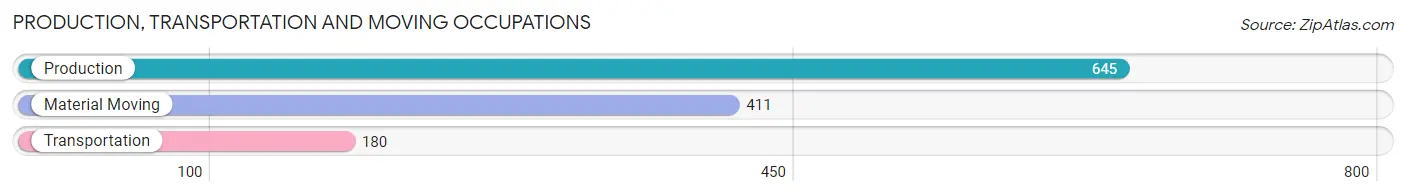
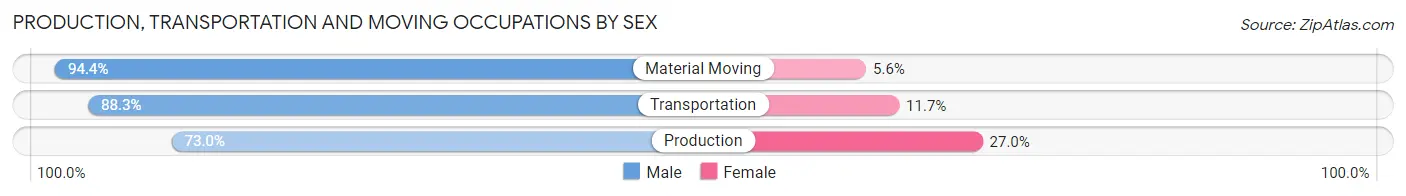
Production, Transportation and Moving Occupations
The most common Production, Transportation and Moving occupations in Hatillo Municipio are Production (645 | 4.8%), Material Moving (411 | 3.1%), and Transportation (180 | 1.3%).
Production, Transportation and Moving Occupations by Sex
| Occupation | Male | Female |
| Production | 471 (73.0%) | 174 (27.0%) |
| Transportation | 159 (88.3%) | 21 (11.7%) |
| Material Moving | 388 (94.4%) | 23 (5.6%) |
| Total (Category) | 1,018 (82.4%) | 218 (17.6%) |
| Total (Overall) | 7,348 (55.0%) | 5,999 (45.0%) |
Employment Industries by Sex in Hatillo Municipio
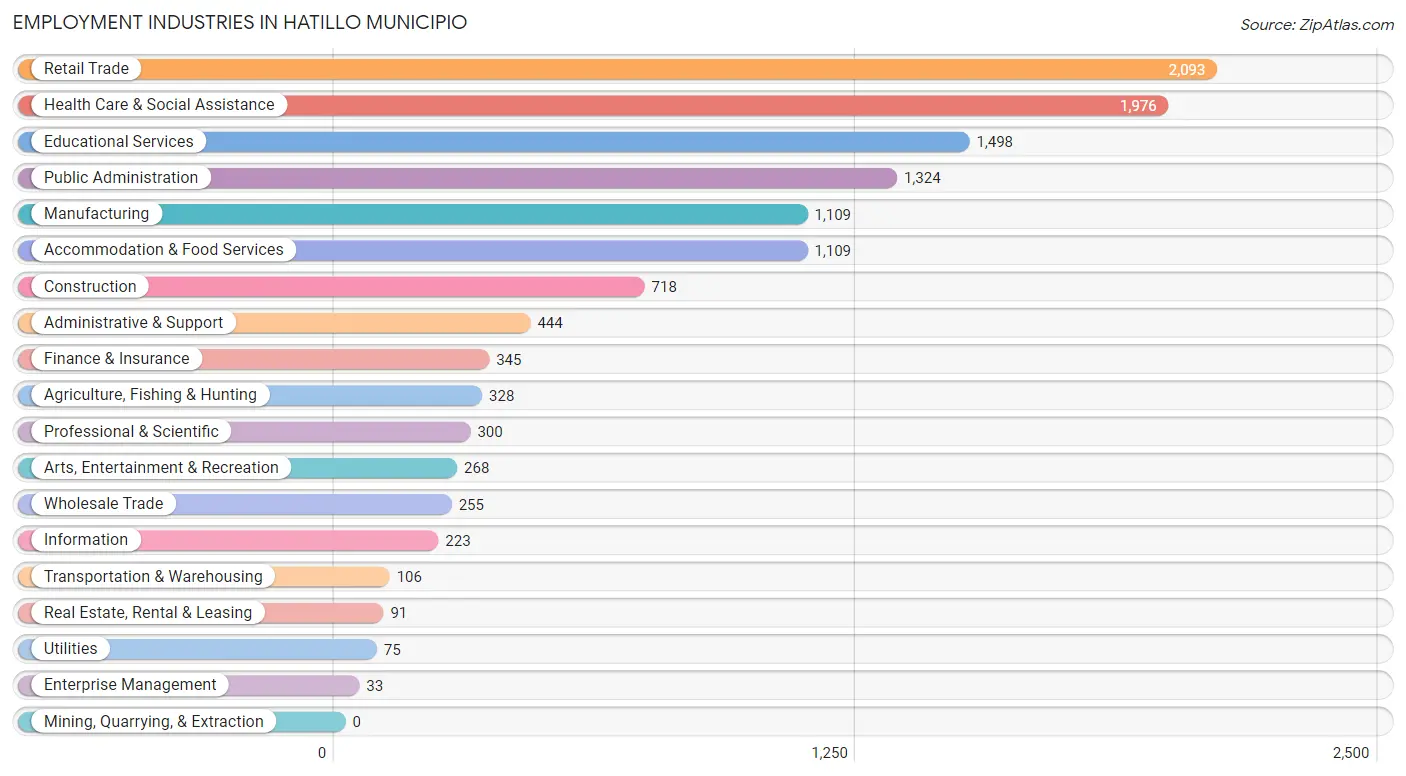
Employment Industries in Hatillo Municipio
The major employment industries in Hatillo Municipio include Retail Trade (2,093 | 15.7%), Health Care & Social Assistance (1,976 | 14.8%), Educational Services (1,498 | 11.2%), Public Administration (1,324 | 9.9%), and Manufacturing (1,109 | 8.3%).
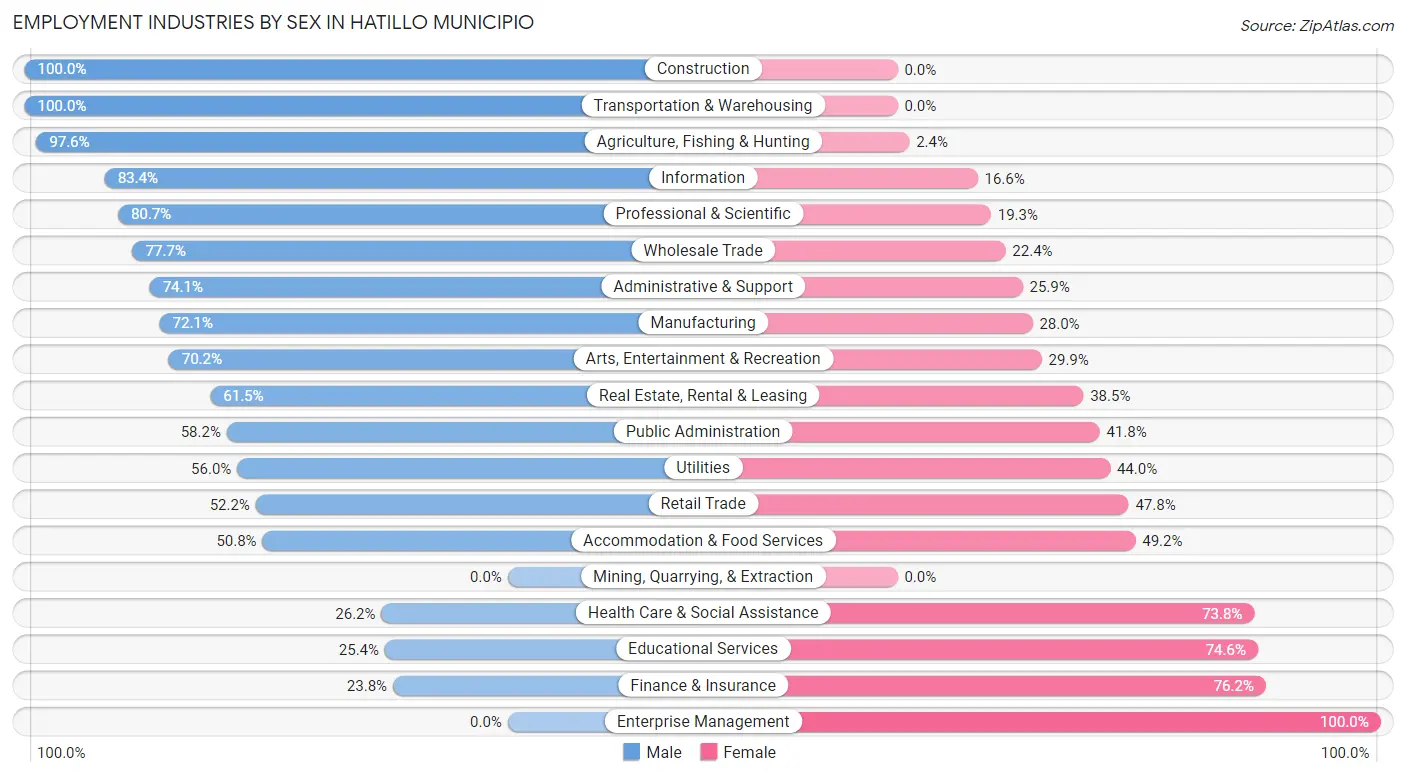
Employment Industries by Sex in Hatillo Municipio
The Hatillo Municipio industries that see more men than women are Construction (100.0%), Transportation & Warehousing (100.0%), and Agriculture, Fishing & Hunting (97.6%), whereas the industries that tend to have a higher number of women are Enterprise Management (100.0%), Finance & Insurance (76.2%), and Educational Services (74.6%).
| Industry | Male | Female |
| Agriculture, Fishing & Hunting | 320 (97.6%) | 8 (2.4%) |
| Mining, Quarrying, & Extraction | 0 (0.0%) | 0 (0.0%) |
| Construction | 718 (100.0%) | 0 (0.0%) |
| Manufacturing | 799 (72.1%) | 310 (28.0%) |
| Wholesale Trade | 198 (77.6%) | 57 (22.4%) |
| Retail Trade | 1,092 (52.2%) | 1,001 (47.8%) |
| Transportation & Warehousing | 106 (100.0%) | 0 (0.0%) |
| Utilities | 42 (56.0%) | 33 (44.0%) |
| Information | 186 (83.4%) | 37 (16.6%) |
| Finance & Insurance | 82 (23.8%) | 263 (76.2%) |
| Real Estate, Rental & Leasing | 56 (61.5%) | 35 (38.5%) |
| Professional & Scientific | 242 (80.7%) | 58 (19.3%) |
| Enterprise Management | 0 (0.0%) | 33 (100.0%) |
| Administrative & Support | 329 (74.1%) | 115 (25.9%) |
| Educational Services | 381 (25.4%) | 1,117 (74.6%) |
| Health Care & Social Assistance | 517 (26.2%) | 1,459 (73.8%) |
| Arts, Entertainment & Recreation | 188 (70.2%) | 80 (29.8%) |
| Accommodation & Food Services | 563 (50.8%) | 546 (49.2%) |
| Public Administration | 770 (58.2%) | 554 (41.8%) |
| Total | 7,348 (55.0%) | 5,999 (45.0%) |
Education in Hatillo Municipio
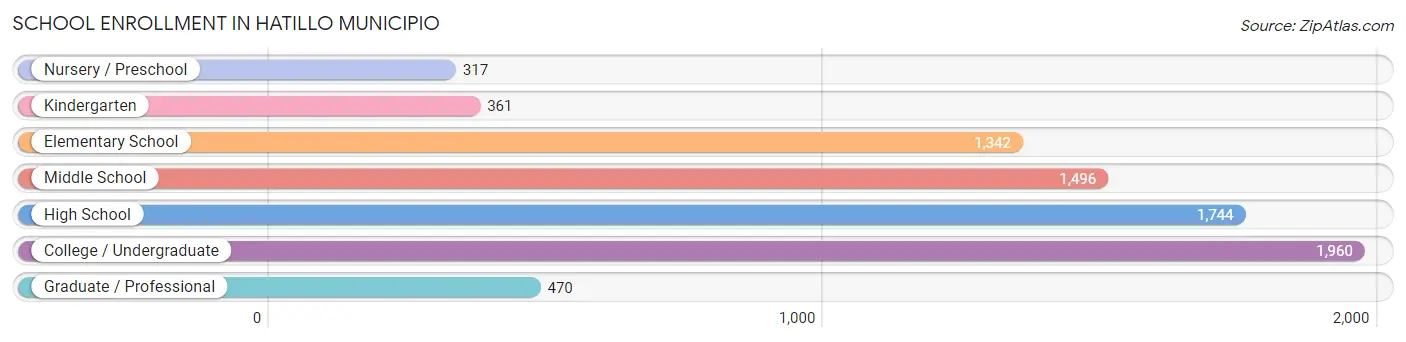
School Enrollment in Hatillo Municipio
The most common levels of schooling among the 7,690 students in Hatillo Municipio are college / undergraduate (1,960 | 25.5%), high school (1,744 | 22.7%), and middle school (1,496 | 19.5%).
| School Level | # Students | % Students |
| Nursery / Preschool | 317 | 4.1% |
| Kindergarten | 361 | 4.7% |
| Elementary School | 1,342 | 17.4% |
| Middle School | 1,496 | 19.5% |
| High School | 1,744 | 22.7% |
| College / Undergraduate | 1,960 | 25.5% |
| Graduate / Professional | 470 | 6.1% |
| Total | 7,690 | 100.0% |
School Enrollment by Age by Funding Source in Hatillo Municipio
Out of a total of 7,690 students who are enrolled in schools in Hatillo Municipio, 1,938 (25.2%) attend a private institution, while the remaining 5,752 (74.8%) are enrolled in public schools. The age group of 35 years and over has the highest likelihood of being enrolled in private schools, with 159 (85.5% in the age bracket) enrolled. Conversely, the age group of 5 to 9 year old has the lowest likelihood of being enrolled in a private school, with 1,466 (88.9% in the age bracket) attending a public institution.
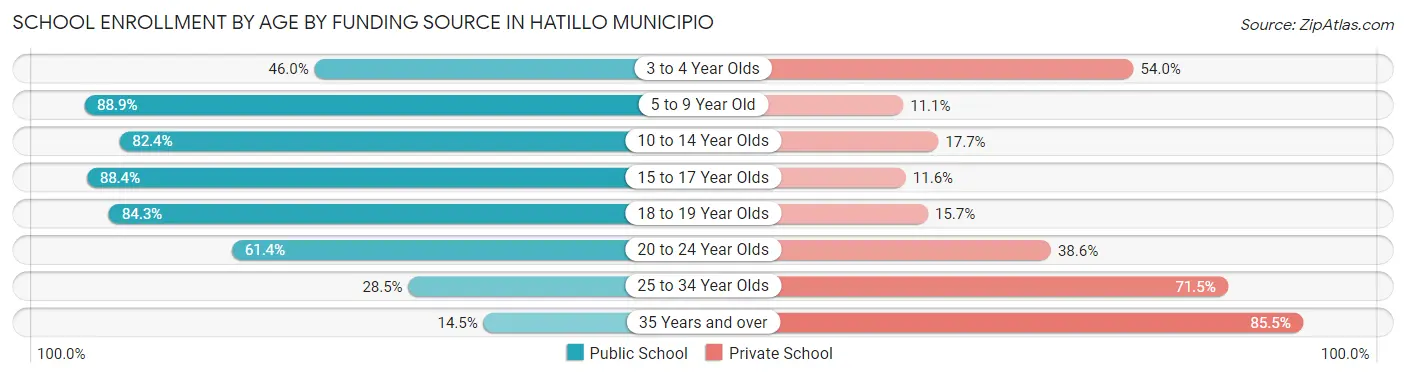
| Age Bracket | Public School | Private School |
| 3 to 4 Year Olds | 109 (46.0%) | 128 (54.0%) |
| 5 to 9 Year Old | 1,466 (88.9%) | 183 (11.1%) |
| 10 to 14 Year Olds | 1,624 (82.4%) | 348 (17.6%) |
| 15 to 17 Year Olds | 1,083 (88.4%) | 142 (11.6%) |
| 18 to 19 Year Olds | 590 (84.3%) | 110 (15.7%) |
| 20 to 24 Year Olds | 671 (61.4%) | 422 (38.6%) |
| 25 to 34 Year Olds | 179 (28.5%) | 449 (71.5%) |
| 35 Years and over | 27 (14.5%) | 159 (85.5%) |
| Total | 5,752 (74.8%) | 1,938 (25.2%) |
Educational Attainment by Field of Study in Hatillo Municipio
Education (2,286 | 25.8%), business (1,899 | 21.5%), science & technology (1,291 | 14.6%), arts & humanities (1,064 | 12.0%), and bio, nature & agricultural (621 | 7.0%) are the most common fields of study among 8,851 individuals in Hatillo Municipio who have obtained a bachelor's degree or higher.
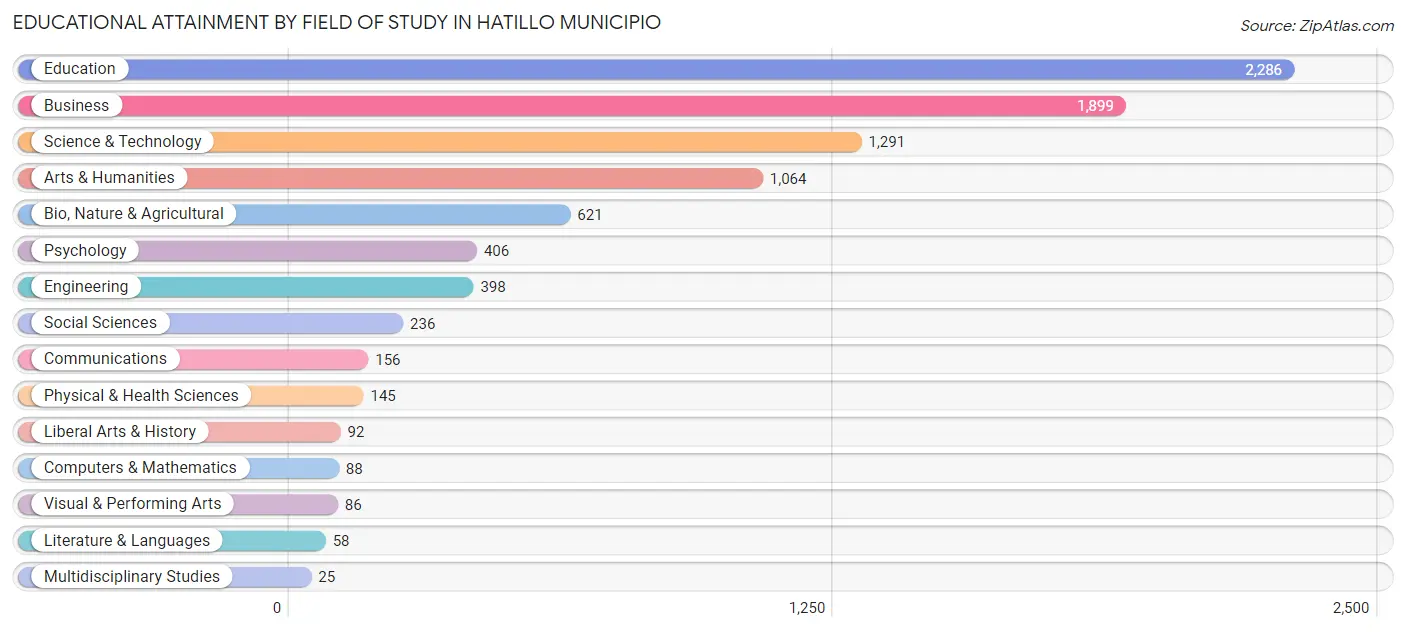
| Field of Study | # Graduates | % Graduates |
| Computers & Mathematics | 88 | 1.0% |
| Bio, Nature & Agricultural | 621 | 7.0% |
| Physical & Health Sciences | 145 | 1.6% |
| Psychology | 406 | 4.6% |
| Social Sciences | 236 | 2.7% |
| Engineering | 398 | 4.5% |
| Multidisciplinary Studies | 25 | 0.3% |
| Science & Technology | 1,291 | 14.6% |
| Business | 1,899 | 21.5% |
| Education | 2,286 | 25.8% |
| Literature & Languages | 58 | 0.7% |
| Liberal Arts & History | 92 | 1.0% |
| Visual & Performing Arts | 86 | 1.0% |
| Communications | 156 | 1.8% |
| Arts & Humanities | 1,064 | 12.0% |
| Total | 8,851 | 100.0% |
Transportation & Commute in Hatillo Municipio
Vehicle Availability by Sex in Hatillo Municipio
The most prevalent vehicle ownership categories in Hatillo Municipio are males with 2 vehicles (3,556, accounting for 49.1%) and females with 2 vehicles (2,674, making up 59.6%).
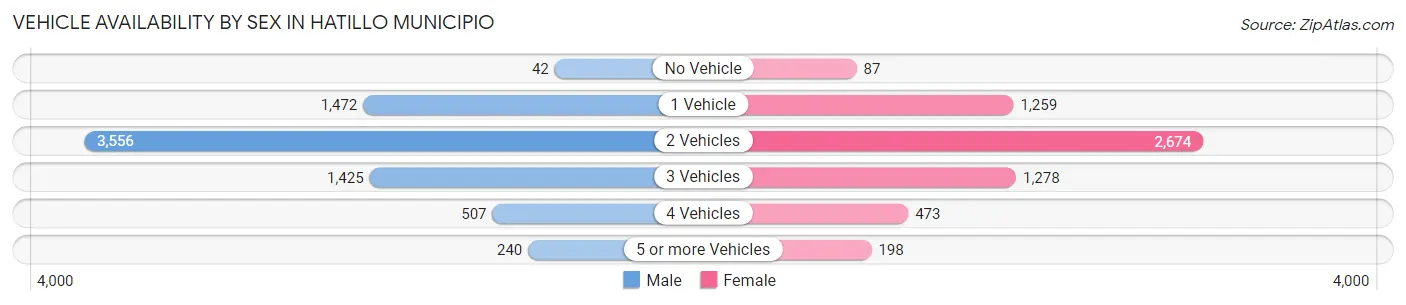
| Vehicles Available | Male | Female |
| No Vehicle | 42 (0.6%) | 87 (1.5%) |
| 1 Vehicle | 1,472 (20.3%) | 1,259 (21.1%) |
| 2 Vehicles | 3,556 (49.1%) | 2,674 (44.8%) |
| 3 Vehicles | 1,425 (19.7%) | 1,278 (21.4%) |
| 4 Vehicles | 507 (7.0%) | 473 (7.9%) |
| 5 or more Vehicles | 240 (3.3%) | 198 (3.3%) |
| Total | 7,242 (100.0%) | 5,969 (100.0%) |
Commute Time in Hatillo Municipio
The most frequently occuring commute durations in Hatillo Municipio are 20 to 24 minutes (5,050 commuters, 40.1%), 15 to 19 minutes (1,802 commuters, 14.3%), and 10 to 14 minutes (1,163 commuters, 9.2%).
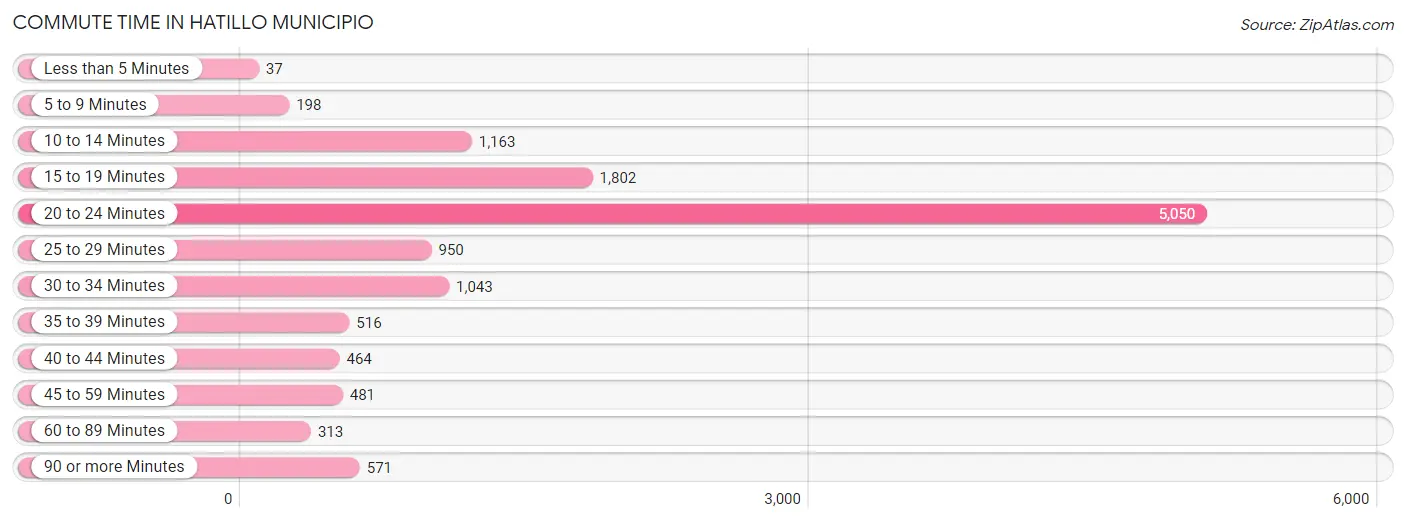
| Commute Time | # Commuters | % Commuters |
| Less than 5 Minutes | 37 | 0.3% |
| 5 to 9 Minutes | 198 | 1.6% |
| 10 to 14 Minutes | 1,163 | 9.2% |
| 15 to 19 Minutes | 1,802 | 14.3% |
| 20 to 24 Minutes | 5,050 | 40.1% |
| 25 to 29 Minutes | 950 | 7.5% |
| 30 to 34 Minutes | 1,043 | 8.3% |
| 35 to 39 Minutes | 516 | 4.1% |
| 40 to 44 Minutes | 464 | 3.7% |
| 45 to 59 Minutes | 481 | 3.8% |
| 60 to 89 Minutes | 313 | 2.5% |
| 90 or more Minutes | 571 | 4.5% |
Commute Time by Sex in Hatillo Municipio
The most common commute times in Hatillo Municipio are 20 to 24 minutes (2,799 commuters, 40.5%) for males and 20 to 24 minutes (2,251 commuters, 39.6%) for females.
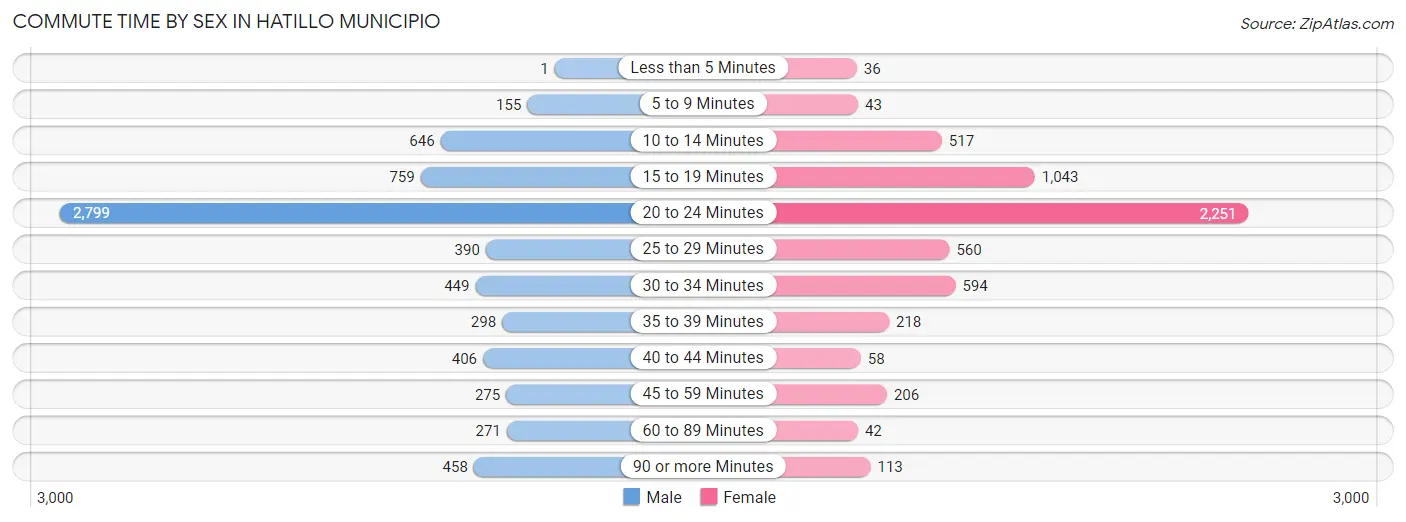
| Commute Time | Male | Female |
| Less than 5 Minutes | 1 (0.0%) | 36 (0.6%) |
| 5 to 9 Minutes | 155 (2.2%) | 43 (0.8%) |
| 10 to 14 Minutes | 646 (9.3%) | 517 (9.1%) |
| 15 to 19 Minutes | 759 (11.0%) | 1,043 (18.4%) |
| 20 to 24 Minutes | 2,799 (40.5%) | 2,251 (39.6%) |
| 25 to 29 Minutes | 390 (5.7%) | 560 (9.9%) |
| 30 to 34 Minutes | 449 (6.5%) | 594 (10.5%) |
| 35 to 39 Minutes | 298 (4.3%) | 218 (3.8%) |
| 40 to 44 Minutes | 406 (5.9%) | 58 (1.0%) |
| 45 to 59 Minutes | 275 (4.0%) | 206 (3.6%) |
| 60 to 89 Minutes | 271 (3.9%) | 42 (0.7%) |
| 90 or more Minutes | 458 (6.6%) | 113 (2.0%) |
Time of Departure to Work by Sex in Hatillo Municipio
The most frequent times of departure to work in Hatillo Municipio are 7:00 AM to 7:29 AM (2,486, 36.0%) for males and 7:00 AM to 7:29 AM (2,040, 35.9%) for females.
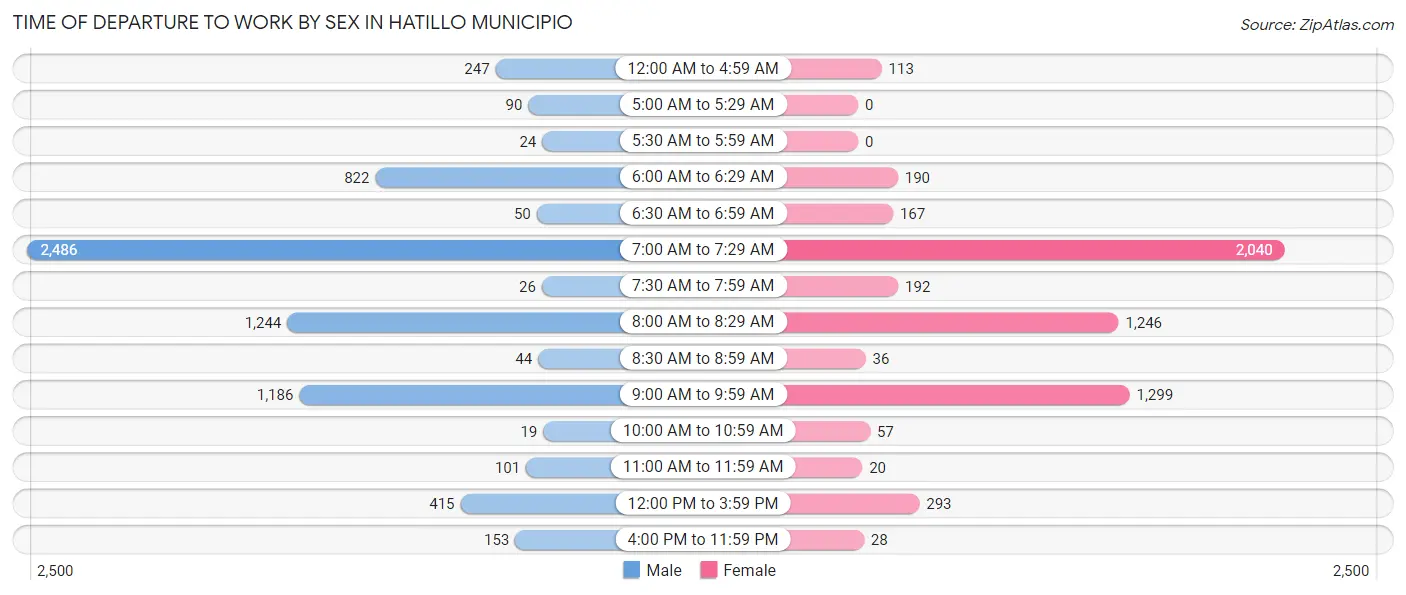
| Time of Departure | Male | Female |
| 12:00 AM to 4:59 AM | 247 (3.6%) | 113 (2.0%) |
| 5:00 AM to 5:29 AM | 90 (1.3%) | 0 (0.0%) |
| 5:30 AM to 5:59 AM | 24 (0.4%) | 0 (0.0%) |
| 6:00 AM to 6:29 AM | 822 (11.9%) | 190 (3.3%) |
| 6:30 AM to 6:59 AM | 50 (0.7%) | 167 (2.9%) |
| 7:00 AM to 7:29 AM | 2,486 (36.0%) | 2,040 (35.9%) |
| 7:30 AM to 7:59 AM | 26 (0.4%) | 192 (3.4%) |
| 8:00 AM to 8:29 AM | 1,244 (18.0%) | 1,246 (21.9%) |
| 8:30 AM to 8:59 AM | 44 (0.6%) | 36 (0.6%) |
| 9:00 AM to 9:59 AM | 1,186 (17.2%) | 1,299 (22.9%) |
| 10:00 AM to 10:59 AM | 19 (0.3%) | 57 (1.0%) |
| 11:00 AM to 11:59 AM | 101 (1.5%) | 20 (0.4%) |
| 12:00 PM to 3:59 PM | 415 (6.0%) | 293 (5.2%) |
| 4:00 PM to 11:59 PM | 153 (2.2%) | 28 (0.5%) |
| Total | 6,907 (100.0%) | 5,681 (100.0%) |
Housing Occupancy in Hatillo Municipio
Occupancy by Ownership in Hatillo Municipio
Of the total 13,503 dwellings in Hatillo Municipio, owner-occupied units account for 9,992 (74.0%), while renter-occupied units make up 3,511 (26.0%).
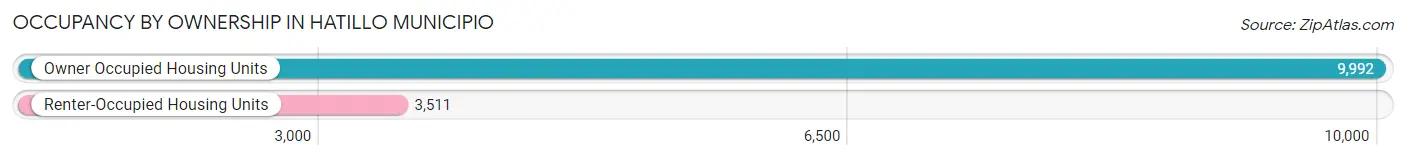
| Occupancy | # Housing Units | % Housing Units |
| Owner Occupied Housing Units | 9,992 | 74.0% |
| Renter-Occupied Housing Units | 3,511 | 26.0% |
| Total Occupied Housing Units | 13,503 | 100.0% |
Occupancy by Household Size in Hatillo Municipio
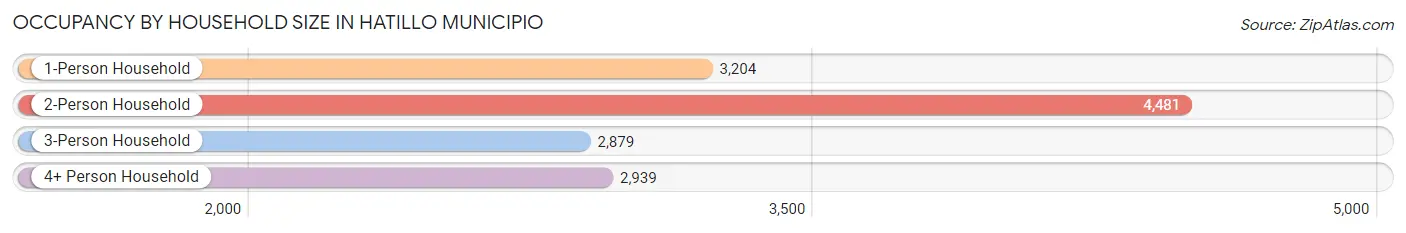
| Household Size | # Housing Units | % Housing Units |
| 1-Person Household | 3,204 | 23.7% |
| 2-Person Household | 4,481 | 33.2% |
| 3-Person Household | 2,879 | 21.3% |
| 4+ Person Household | 2,939 | 21.8% |
| Total Housing Units | 13,503 | 100.0% |
Occupancy by Ownership by Household Size in Hatillo Municipio
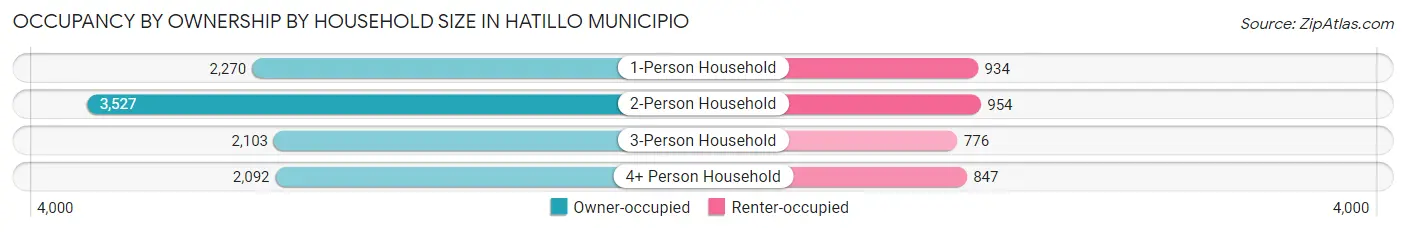
| Household Size | Owner-occupied | Renter-occupied |
| 1-Person Household | 2,270 (70.9%) | 934 (29.1%) |
| 2-Person Household | 3,527 (78.7%) | 954 (21.3%) |
| 3-Person Household | 2,103 (73.1%) | 776 (27.0%) |
| 4+ Person Household | 2,092 (71.2%) | 847 (28.8%) |
| Total Housing Units | 9,992 (74.0%) | 3,511 (26.0%) |
Occupancy by Educational Attainment in Hatillo Municipio
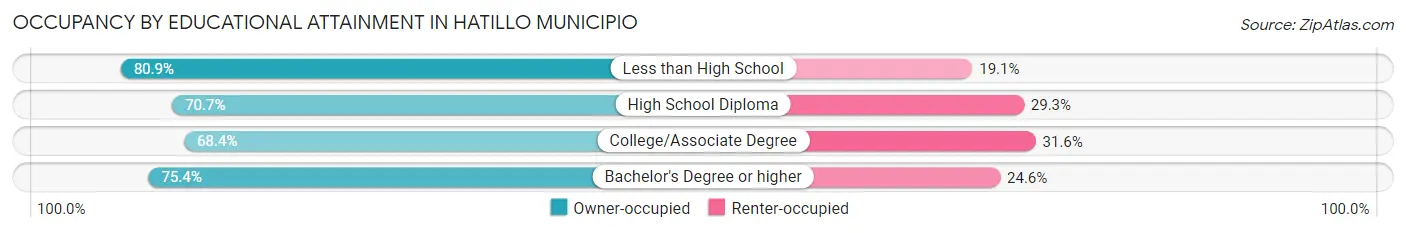
| Household Size | Owner-occupied | Renter-occupied |
| Less than High School | 2,599 (80.9%) | 612 (19.1%) |
| High School Diploma | 1,990 (70.7%) | 824 (29.3%) |
| College/Associate Degree | 2,308 (68.4%) | 1,067 (31.6%) |
| Bachelor's Degree or higher | 3,095 (75.4%) | 1,008 (24.6%) |
Occupancy by Age of Householder in Hatillo Municipio
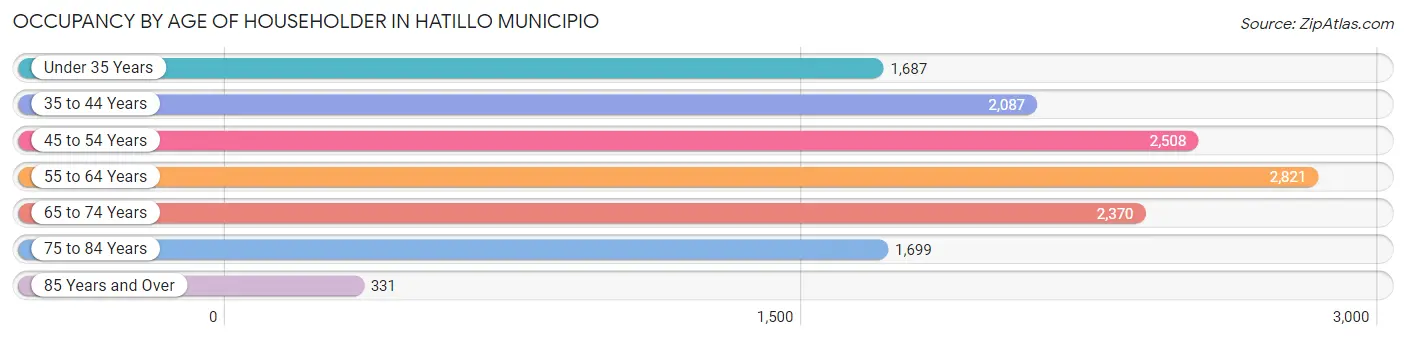
| Age Bracket | # Households | % Households |
| Under 35 Years | 1,687 | 12.5% |
| 35 to 44 Years | 2,087 | 15.5% |
| 45 to 54 Years | 2,508 | 18.6% |
| 55 to 64 Years | 2,821 | 20.9% |
| 65 to 74 Years | 2,370 | 17.5% |
| 75 to 84 Years | 1,699 | 12.6% |
| 85 Years and Over | 331 | 2.5% |
| Total | 13,503 | 100.0% |
Housing Finances in Hatillo Municipio
Median Income by Occupancy in Hatillo Municipio
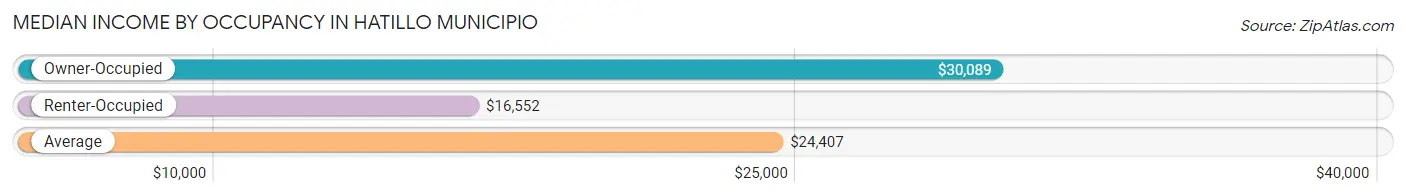
| Occupancy Type | # Households | Median Income |
| Owner-Occupied | 9,992 (74.0%) | $30,089 |
| Renter-Occupied | 3,511 (26.0%) | $16,552 |
| Average | 13,503 (100.0%) | $24,407 |
Occupancy by Householder Income Bracket in Hatillo Municipio
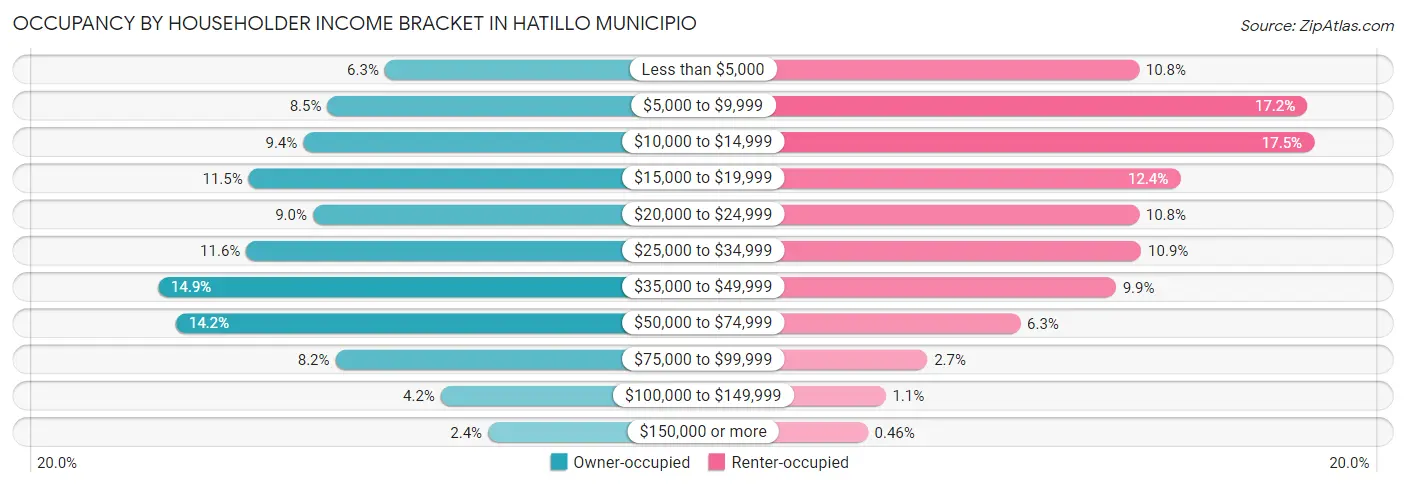
| Income Bracket | Owner-occupied | Renter-occupied |
| Less than $5,000 | 627 (6.3%) | 379 (10.8%) |
| $5,000 to $9,999 | 846 (8.5%) | 604 (17.2%) |
| $10,000 to $14,999 | 938 (9.4%) | 613 (17.5%) |
| $15,000 to $19,999 | 1,146 (11.5%) | 434 (12.4%) |
| $20,000 to $24,999 | 901 (9.0%) | 379 (10.8%) |
| $25,000 to $34,999 | 1,155 (11.6%) | 382 (10.9%) |
| $35,000 to $49,999 | 1,491 (14.9%) | 348 (9.9%) |
| $50,000 to $74,999 | 1,423 (14.2%) | 220 (6.3%) |
| $75,000 to $99,999 | 815 (8.2%) | 96 (2.7%) |
| $100,000 to $149,999 | 415 (4.2%) | 40 (1.1%) |
| $150,000 or more | 235 (2.4%) | 16 (0.5%) |
| Total | 9,992 (100.0%) | 3,511 (100.0%) |
Monthly Housing Cost Tiers in Hatillo Municipio
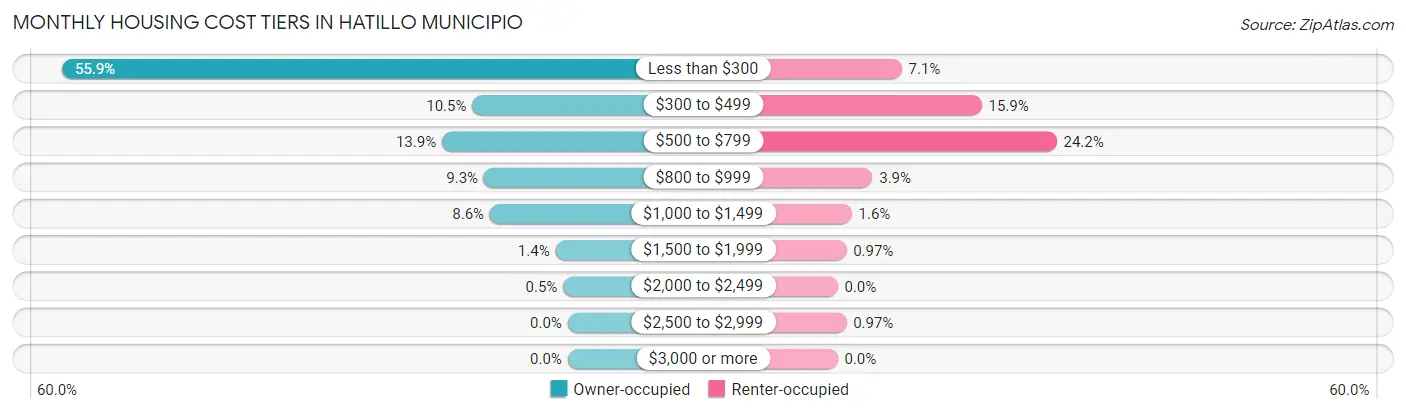
| Monthly Cost | Owner-occupied | Renter-occupied |
| Less than $300 | 5,583 (55.9%) | 249 (7.1%) |
| $300 to $499 | 1,053 (10.5%) | 559 (15.9%) |
| $500 to $799 | 1,388 (13.9%) | 850 (24.2%) |
| $800 to $999 | 925 (9.3%) | 135 (3.8%) |
| $1,000 to $1,499 | 858 (8.6%) | 55 (1.6%) |
| $1,500 to $1,999 | 135 (1.3%) | 34 (1.0%) |
| $2,000 to $2,499 | 50 (0.5%) | 0 (0.0%) |
| $2,500 to $2,999 | 0 (0.0%) | 34 (1.0%) |
| $3,000 or more | 0 (0.0%) | 0 (0.0%) |
| Total | 9,992 (100.0%) | 3,511 (100.0%) |
Physical Housing Characteristics in Hatillo Municipio
Housing Structures in Hatillo Municipio
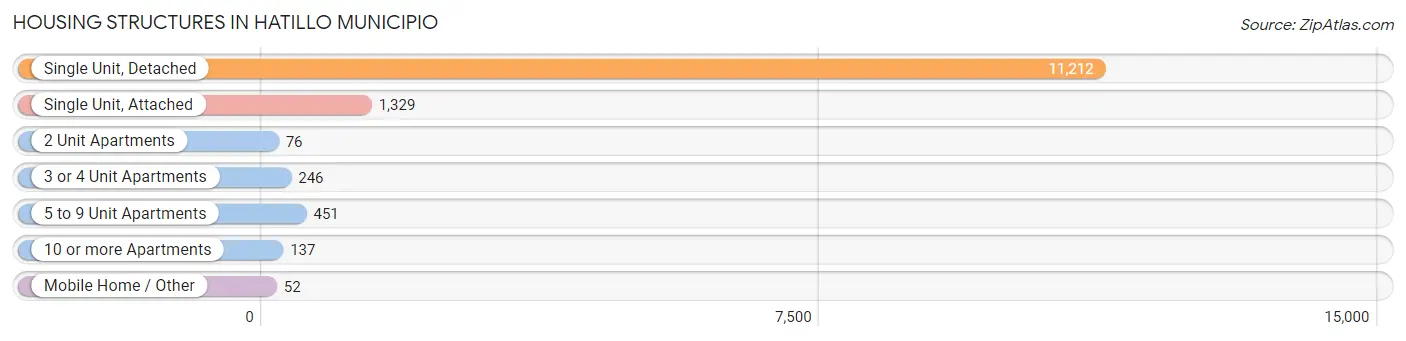
| Structure Type | # Housing Units | % Housing Units |
| Single Unit, Detached | 11,212 | 83.0% |
| Single Unit, Attached | 1,329 | 9.8% |
| 2 Unit Apartments | 76 | 0.6% |
| 3 or 4 Unit Apartments | 246 | 1.8% |
| 5 to 9 Unit Apartments | 451 | 3.3% |
| 10 or more Apartments | 137 | 1.0% |
| Mobile Home / Other | 52 | 0.4% |
| Total | 13,503 | 100.0% |
Housing Structures by Occupancy in Hatillo Municipio
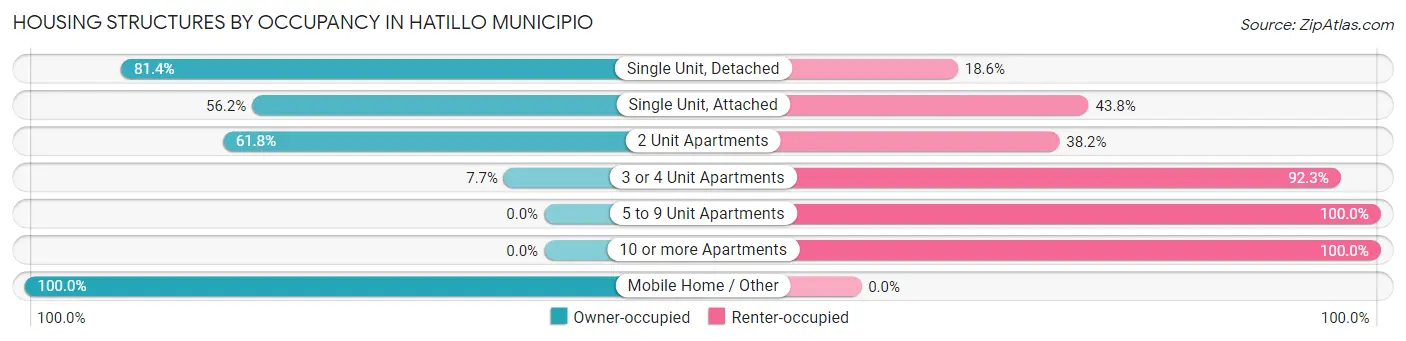
| Structure Type | Owner-occupied | Renter-occupied |
| Single Unit, Detached | 9,127 (81.4%) | 2,085 (18.6%) |
| Single Unit, Attached | 747 (56.2%) | 582 (43.8%) |
| 2 Unit Apartments | 47 (61.8%) | 29 (38.2%) |
| 3 or 4 Unit Apartments | 19 (7.7%) | 227 (92.3%) |
| 5 to 9 Unit Apartments | 0 (0.0%) | 451 (100.0%) |
| 10 or more Apartments | 0 (0.0%) | 137 (100.0%) |
| Mobile Home / Other | 52 (100.0%) | 0 (0.0%) |
| Total | 9,992 (74.0%) | 3,511 (26.0%) |
Housing Structures by Number of Rooms in Hatillo Municipio
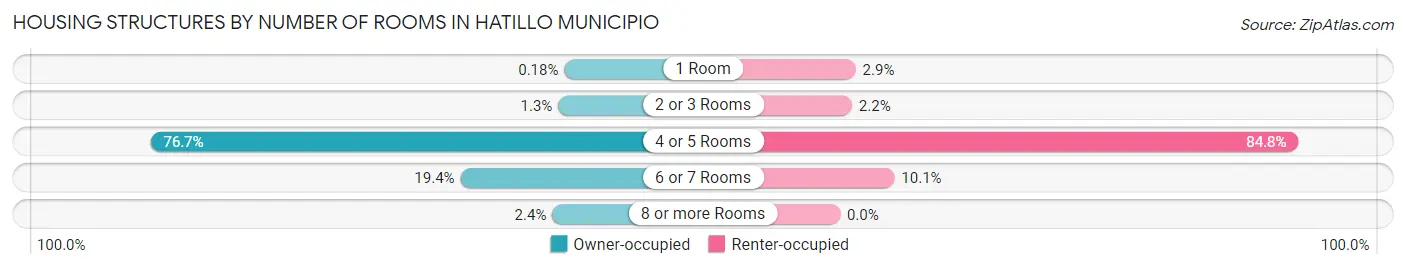
| Number of Rooms | Owner-occupied | Renter-occupied |
| 1 Room | 18 (0.2%) | 102 (2.9%) |
| 2 or 3 Rooms | 130 (1.3%) | 78 (2.2%) |
| 4 or 5 Rooms | 7,667 (76.7%) | 2,977 (84.8%) |
| 6 or 7 Rooms | 1,937 (19.4%) | 354 (10.1%) |
| 8 or more Rooms | 240 (2.4%) | 0 (0.0%) |
| Total | 9,992 (100.0%) | 3,511 (100.0%) |
Housing Structure by Heating Type in Hatillo Municipio
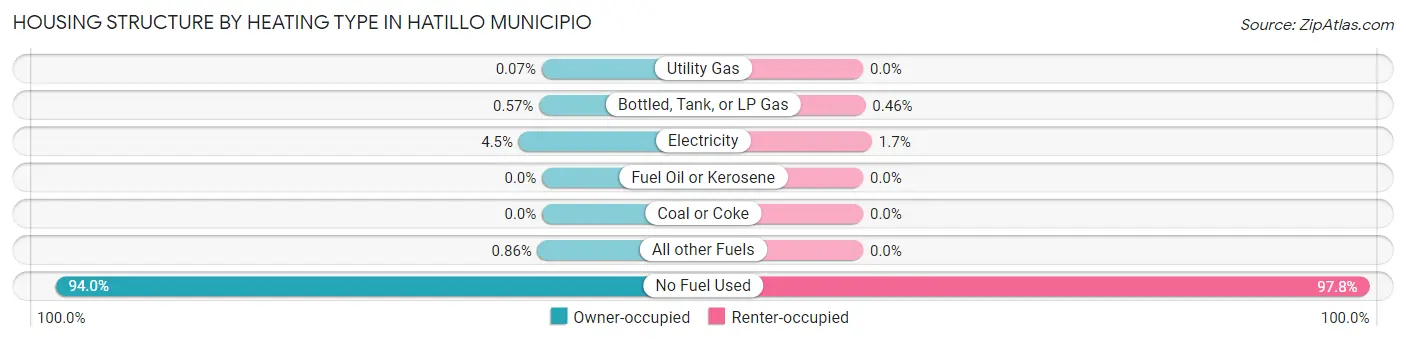
| Heating Type | Owner-occupied | Renter-occupied |
| Utility Gas | 7 (0.1%) | 0 (0.0%) |
| Bottled, Tank, or LP Gas | 57 (0.6%) | 16 (0.5%) |
| Electricity | 449 (4.5%) | 60 (1.7%) |
| Fuel Oil or Kerosene | 0 (0.0%) | 0 (0.0%) |
| Coal or Coke | 0 (0.0%) | 0 (0.0%) |
| All other Fuels | 86 (0.9%) | 0 (0.0%) |
| No Fuel Used | 9,393 (94.0%) | 3,435 (97.8%) |
| Total | 9,992 (100.0%) | 3,511 (100.0%) |
Household Vehicle Usage in Hatillo Municipio
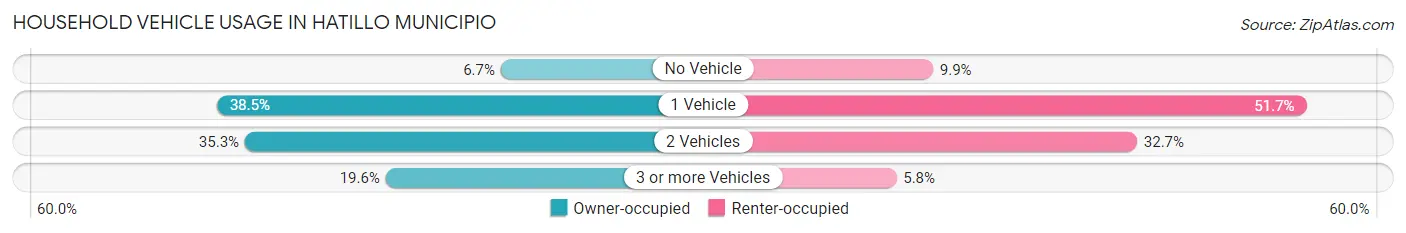
| Vehicles per Household | Owner-occupied | Renter-occupied |
| No Vehicle | 665 (6.7%) | 346 (9.9%) |
| 1 Vehicle | 3,845 (38.5%) | 1,815 (51.7%) |
| 2 Vehicles | 3,529 (35.3%) | 1,148 (32.7%) |
| 3 or more Vehicles | 1,953 (19.6%) | 202 (5.8%) |
| Total | 9,992 (100.0%) | 3,511 (100.0%) |
Real Estate & Mortgages in Hatillo Municipio
Real Estate and Mortgage Overview in Hatillo Municipio
| Characteristic | Without Mortgage | With Mortgage |
| Housing Units | 6,691 | 3,301 |
| Median Property Value | $111,800 | $132,400 |
| Median Household Income | $22,104 | $112 |
| Monthly Housing Costs | $165 | $0 |
| Real Estate Taxes | $507 | $3,194 |
Property Value by Mortgage Status in Hatillo Municipio
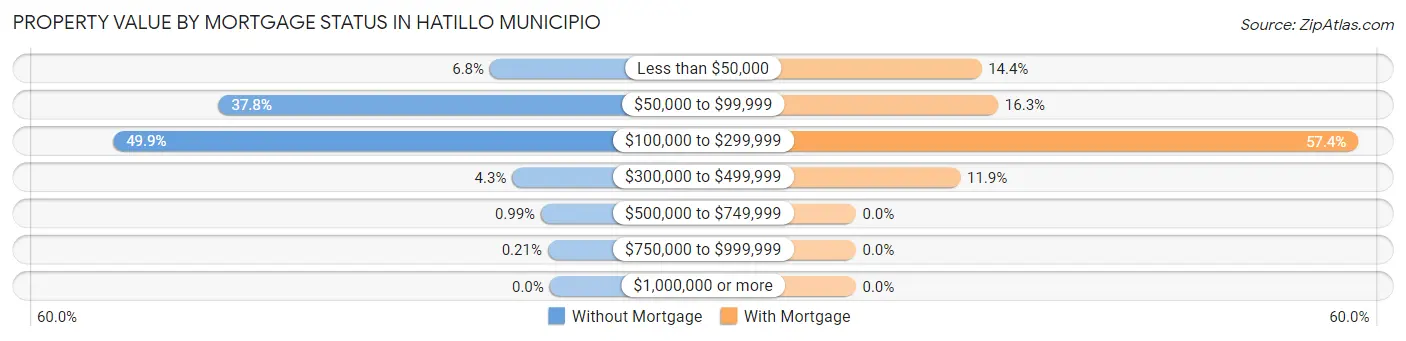
| Property Value | Without Mortgage | With Mortgage |
| Less than $50,000 | 457 (6.8%) | 474 (14.4%) |
| $50,000 to $99,999 | 2,531 (37.8%) | 537 (16.3%) |
| $100,000 to $299,999 | 3,337 (49.9%) | 1,896 (57.4%) |
| $300,000 to $499,999 | 286 (4.3%) | 394 (11.9%) |
| $500,000 to $749,999 | 66 (1.0%) | 0 (0.0%) |
| $750,000 to $999,999 | 14 (0.2%) | 0 (0.0%) |
| $1,000,000 or more | 0 (0.0%) | 0 (0.0%) |
| Total | 6,691 (100.0%) | 3,301 (100.0%) |
Household Income by Mortgage Status in Hatillo Municipio
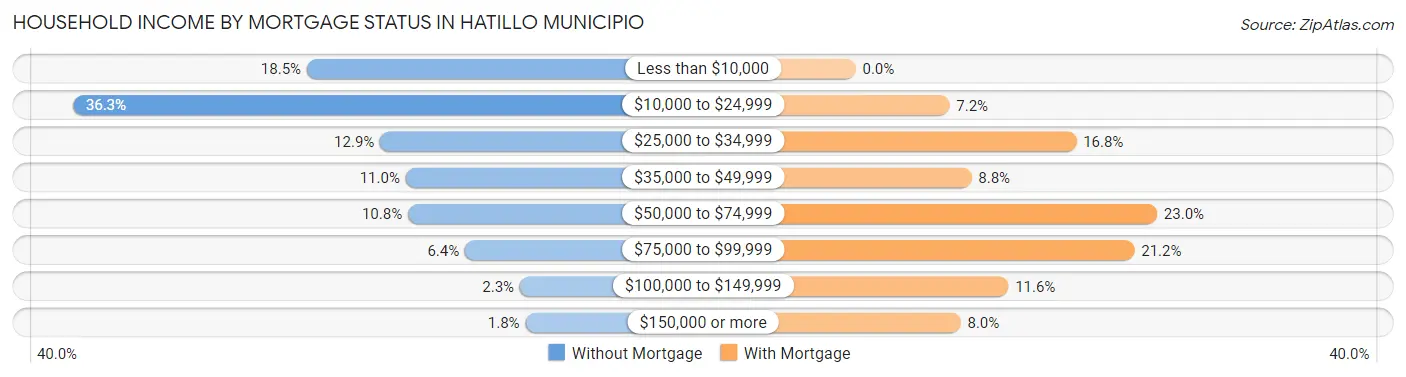
| Household Income | Without Mortgage | With Mortgage |
| Less than $10,000 | 1,237 (18.5%) | 0 (0.0%) |
| $10,000 to $24,999 | 2,430 (36.3%) | 236 (7.1%) |
| $25,000 to $34,999 | 864 (12.9%) | 555 (16.8%) |
| $35,000 to $49,999 | 733 (11.0%) | 291 (8.8%) |
| $50,000 to $74,999 | 722 (10.8%) | 758 (23.0%) |
| $75,000 to $99,999 | 431 (6.4%) | 701 (21.2%) |
| $100,000 to $149,999 | 151 (2.3%) | 384 (11.6%) |
| $150,000 or more | 123 (1.8%) | 264 (8.0%) |
| Total | 6,691 (100.0%) | 3,301 (100.0%) |
Property Value to Household Income Ratio in Hatillo Municipio
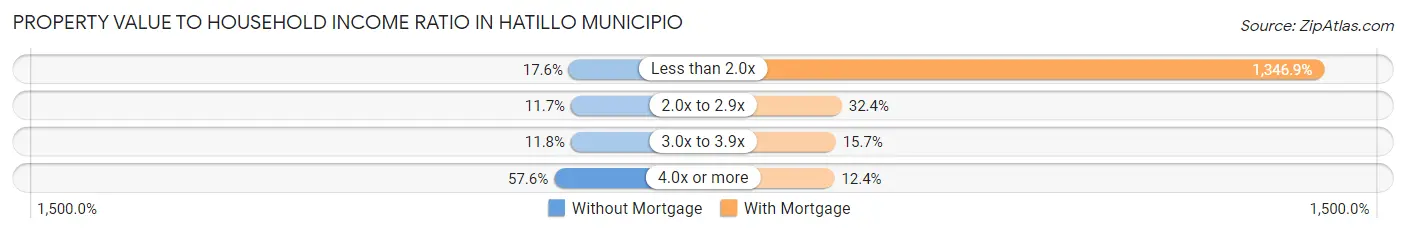
| Value-to-Income Ratio | Without Mortgage | With Mortgage |
| Less than 2.0x | 1,178 (17.6%) | 44,460 (1,346.9%) |
| 2.0x to 2.9x | 784 (11.7%) | 1,070 (32.4%) |
| 3.0x to 3.9x | 791 (11.8%) | 519 (15.7%) |
| 4.0x or more | 3,852 (57.6%) | 408 (12.4%) |
| Total | 6,691 (100.0%) | 3,301 (100.0%) |
Real Estate Taxes by Mortgage Status in Hatillo Municipio
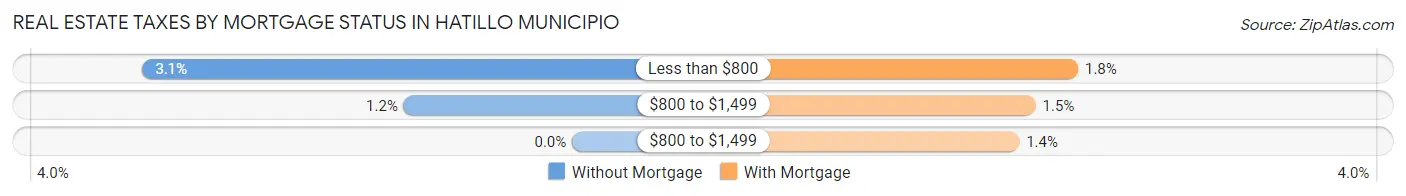
| Property Taxes | Without Mortgage | With Mortgage |
| Less than $800 | 210 (3.1%) | 59 (1.8%) |
| $800 to $1,499 | 82 (1.2%) | 49 (1.5%) |
| $800 to $1,499 | 0 (0.0%) | 45 (1.4%) |
| Total | 6,691 (100.0%) | 3,301 (100.0%) |
Health & Disability in Hatillo Municipio
Health Insurance Coverage by Age in Hatillo Municipio
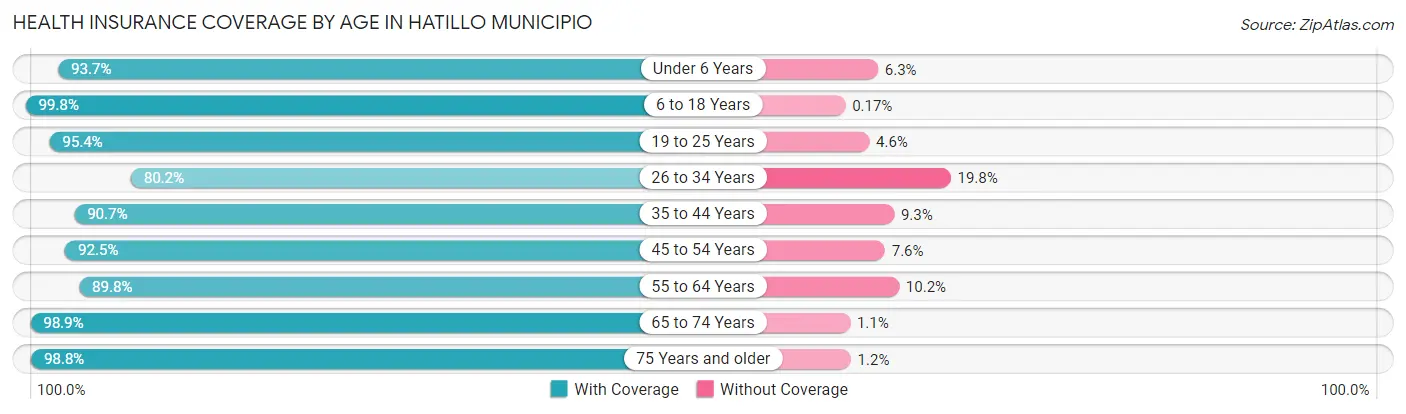
| Age Bracket | With Coverage | Without Coverage |
| Under 6 Years | 1,347 (93.7%) | 90 (6.3%) |
| 6 to 18 Years | 5,144 (99.8%) | 9 (0.2%) |
| 19 to 25 Years | 3,295 (95.4%) | 160 (4.6%) |
| 26 to 34 Years | 3,530 (80.2%) | 872 (19.8%) |
| 35 to 44 Years | 4,408 (90.7%) | 450 (9.3%) |
| 45 to 54 Years | 4,888 (92.4%) | 399 (7.5%) |
| 55 to 64 Years | 4,703 (89.8%) | 533 (10.2%) |
| 65 to 74 Years | 4,498 (98.9%) | 48 (1.1%) |
| 75 Years and older | 3,817 (98.8%) | 46 (1.2%) |
| Total | 35,630 (93.2%) | 2,607 (6.8%) |
Health Insurance Coverage by Citizenship Status in Hatillo Municipio
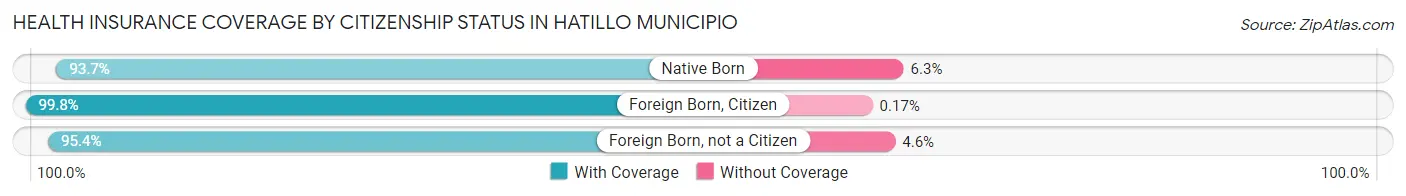
| Citizenship Status | With Coverage | Without Coverage |
| Native Born | 1,347 (93.7%) | 90 (6.3%) |
| Foreign Born, Citizen | 5,144 (99.8%) | 9 (0.2%) |
| Foreign Born, not a Citizen | 3,295 (95.4%) | 160 (4.6%) |
Health Insurance Coverage by Household Income in Hatillo Municipio
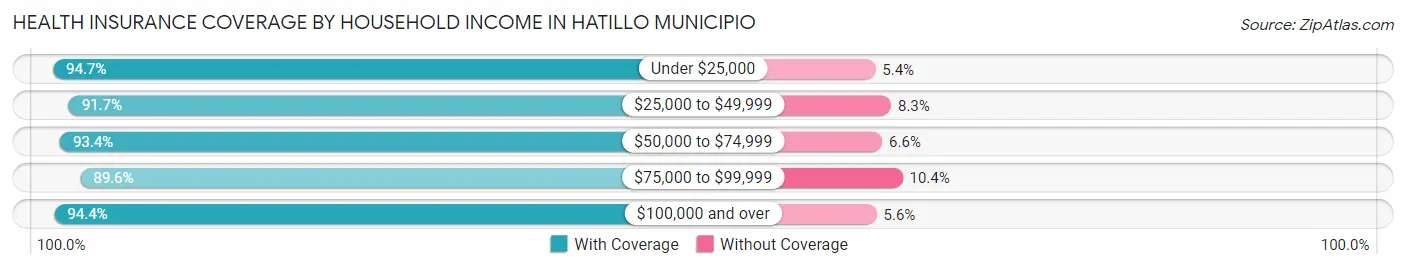
| Household Income | With Coverage | Without Coverage |
| Under $25,000 | 14,977 (94.7%) | 846 (5.3%) |
| $25,000 to $49,999 | 9,770 (91.7%) | 883 (8.3%) |
| $50,000 to $74,999 | 5,143 (93.4%) | 365 (6.6%) |
| $75,000 to $99,999 | 3,106 (89.6%) | 362 (10.4%) |
| $100,000 and over | 2,550 (94.4%) | 151 (5.6%) |
Public vs Private Health Insurance Coverage by Age in Hatillo Municipio
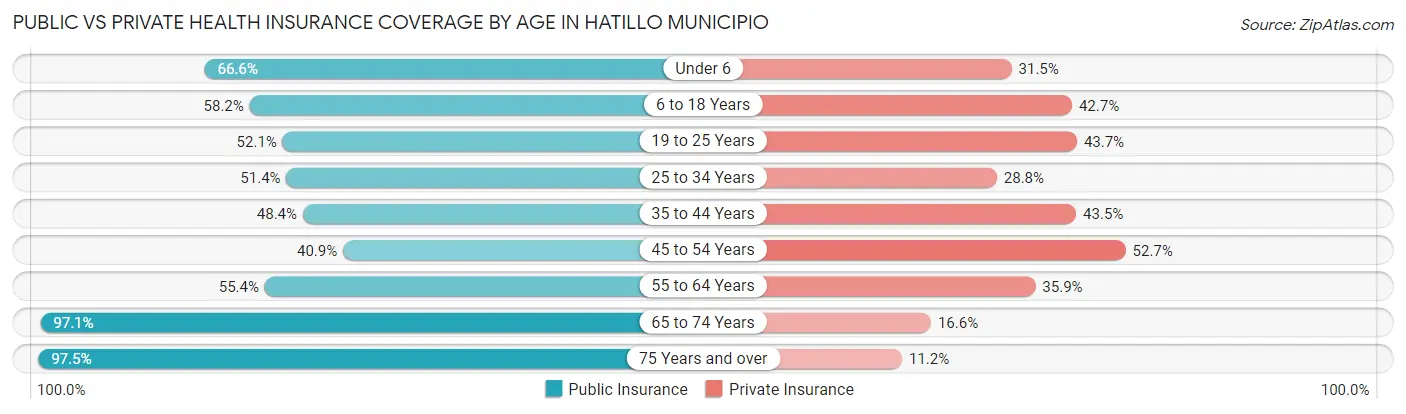
| Age Bracket | Public Insurance | Private Insurance |
| Under 6 | 957 (66.6%) | 453 (31.5%) |
| 6 to 18 Years | 3,001 (58.2%) | 2,202 (42.7%) |
| 19 to 25 Years | 1,800 (52.1%) | 1,508 (43.6%) |
| 25 to 34 Years | 2,263 (51.4%) | 1,267 (28.8%) |
| 35 to 44 Years | 2,349 (48.3%) | 2,113 (43.5%) |
| 45 to 54 Years | 2,162 (40.9%) | 2,785 (52.7%) |
| 55 to 64 Years | 2,902 (55.4%) | 1,882 (35.9%) |
| 65 to 74 Years | 4,413 (97.1%) | 753 (16.6%) |
| 75 Years and over | 3,765 (97.5%) | 432 (11.2%) |
| Total | 23,612 (61.8%) | 13,395 (35.0%) |
Disability Status by Sex by Age in Hatillo Municipio
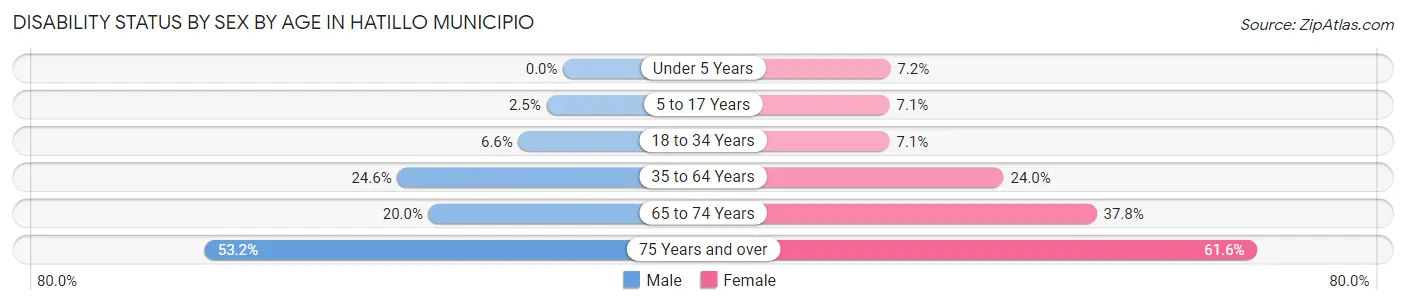
| Age Bracket | Male | Female |
| Under 5 Years | 0 (0.0%) | 40 (7.2%) |
| 5 to 17 Years | 66 (2.5%) | 177 (7.1%) |
| 18 to 34 Years | 271 (6.6%) | 290 (7.1%) |
| 35 to 64 Years | 1,779 (24.6%) | 1,960 (24.0%) |
| 65 to 74 Years | 414 (20.0%) | 936 (37.8%) |
| 75 Years and over | 871 (53.2%) | 1,371 (61.6%) |
Disability Class by Sex by Age in Hatillo Municipio
Disability Class: Hearing Difficulty
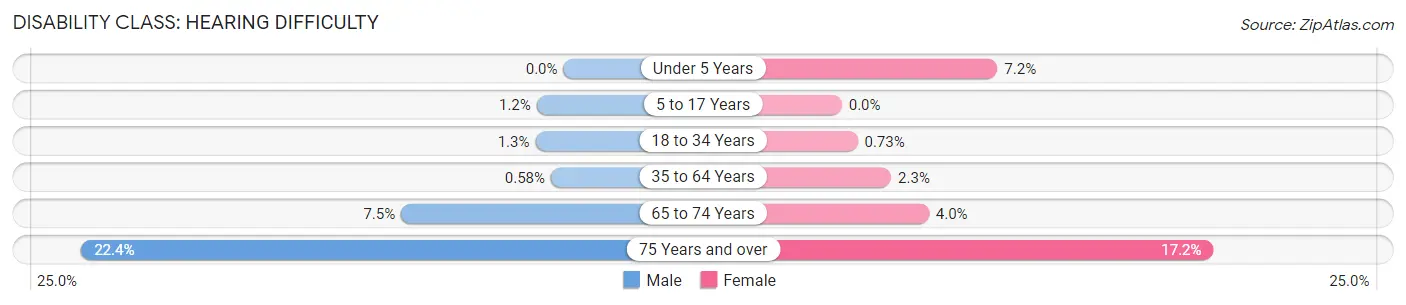
| Age Bracket | Male | Female |
| Under 5 Years | 0 (0.0%) | 40 (7.2%) |
| 5 to 17 Years | 33 (1.2%) | 0 (0.0%) |
| 18 to 34 Years | 53 (1.3%) | 30 (0.7%) |
| 35 to 64 Years | 42 (0.6%) | 187 (2.3%) |
| 65 to 74 Years | 156 (7.5%) | 100 (4.0%) |
| 75 Years and over | 366 (22.4%) | 384 (17.2%) |
Disability Class: Vision Difficulty
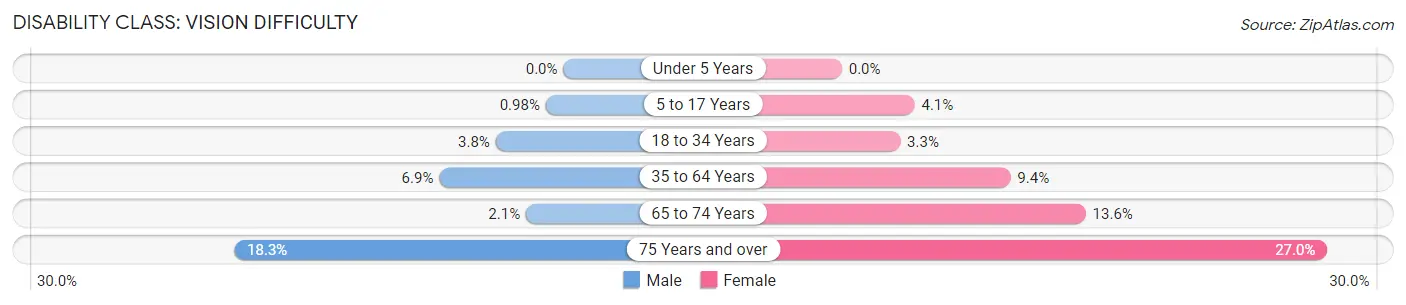
| Age Bracket | Male | Female |
| Under 5 Years | 0 (0.0%) | 0 (0.0%) |
| 5 to 17 Years | 26 (1.0%) | 101 (4.1%) |
| 18 to 34 Years | 154 (3.8%) | 133 (3.3%) |
| 35 to 64 Years | 499 (6.9%) | 766 (9.4%) |
| 65 to 74 Years | 43 (2.1%) | 336 (13.6%) |
| 75 Years and over | 300 (18.3%) | 602 (27.0%) |
Disability Class: Cognitive Difficulty
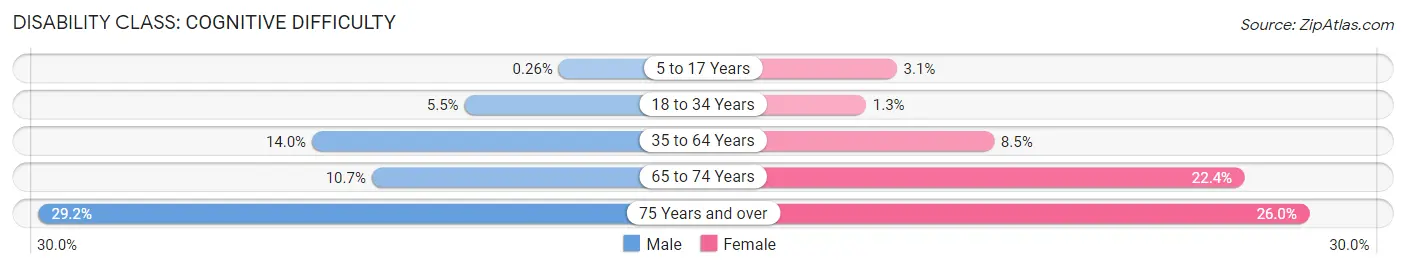
| Age Bracket | Male | Female |
| 5 to 17 Years | 7 (0.3%) | 76 (3.0%) |
| 18 to 34 Years | 225 (5.5%) | 55 (1.3%) |
| 35 to 64 Years | 1,011 (14.0%) | 691 (8.5%) |
| 65 to 74 Years | 221 (10.7%) | 554 (22.4%) |
| 75 Years and over | 478 (29.2%) | 579 (26.0%) |
Disability Class: Ambulatory Difficulty
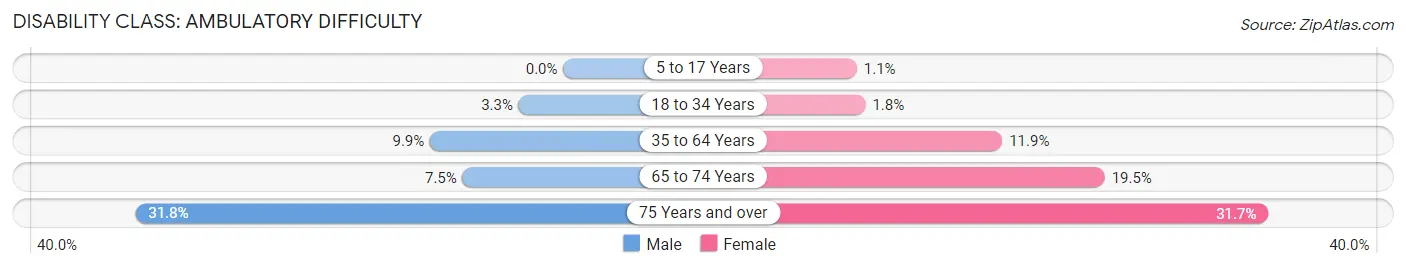
| Age Bracket | Male | Female |
| 5 to 17 Years | 0 (0.0%) | 28 (1.1%) |
| 18 to 34 Years | 135 (3.3%) | 72 (1.8%) |
| 35 to 64 Years | 714 (9.9%) | 972 (11.9%) |
| 65 to 74 Years | 155 (7.5%) | 483 (19.5%) |
| 75 Years and over | 520 (31.8%) | 705 (31.7%) |
Disability Class: Self-Care Difficulty
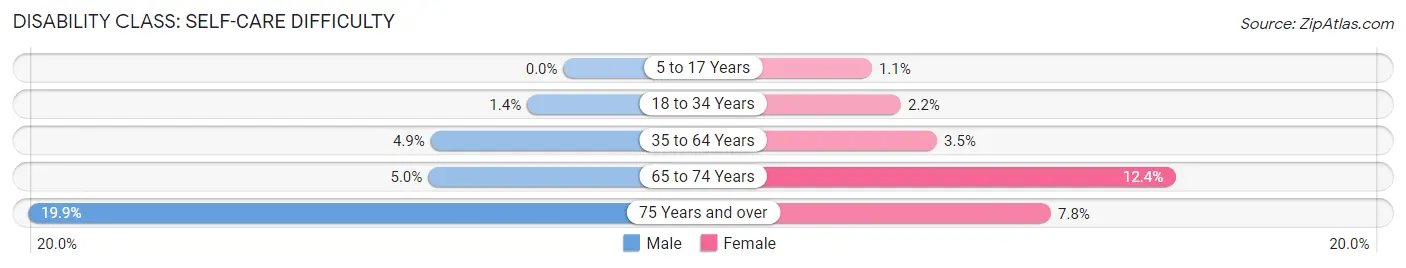
| Age Bracket | Male | Female |
| 5 to 17 Years | 0 (0.0%) | 28 (1.1%) |
| 18 to 34 Years | 55 (1.3%) | 90 (2.2%) |
| 35 to 64 Years | 356 (4.9%) | 289 (3.5%) |
| 65 to 74 Years | 104 (5.0%) | 306 (12.4%) |
| 75 Years and over | 325 (19.9%) | 173 (7.8%) |
Technology Access in Hatillo Municipio
Computing Device Access in Hatillo Municipio
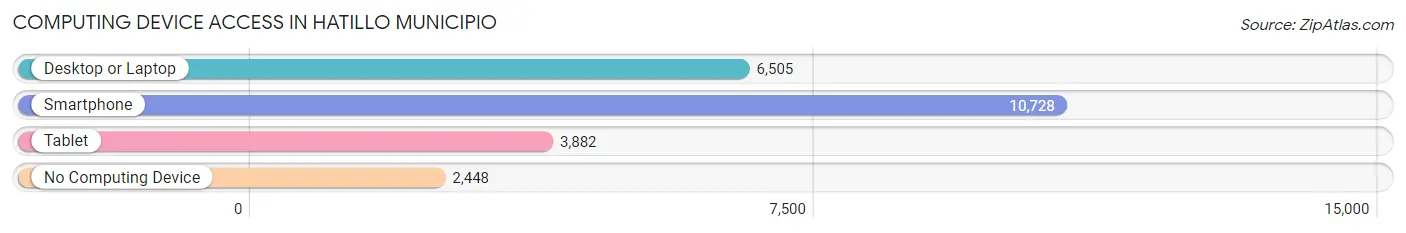
| Device Type | # Households | % Households |
| Desktop or Laptop | 6,505 | 48.2% |
| Smartphone | 10,728 | 79.4% |
| Tablet | 3,882 | 28.7% |
| No Computing Device | 2,448 | 18.1% |
| Total | 13,503 | 100.0% |
Internet Access in Hatillo Municipio
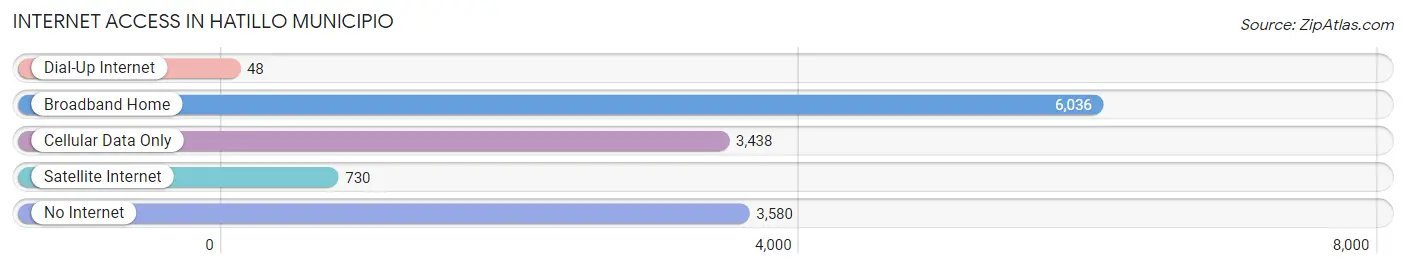
| Internet Type | # Households | % Households |
| Dial-Up Internet | 48 | 0.4% |
| Broadband Home | 6,036 | 44.7% |
| Cellular Data Only | 3,438 | 25.5% |
| Satellite Internet | 730 | 5.4% |
| No Internet | 3,580 | 26.5% |
| Total | 13,503 | 100.0% |
Hatillo Municipio Summary
Hatillo Municipio is a municipality located in the northern coast of Puerto Rico. It is part of the San Juan-Caguas-Guaynabo Metropolitan Statistical Area. As of the 2010 census, the municipality had a population of 41,067.
History
The area of Hatillo was originally inhabited by the indigenous Taíno people. The first European settlers arrived in the area in the 16th century. The area was then part of the municipality of San German. In 1824, Hatillo was officially established as a municipality.
Geography
Hatillo is located in the northern coast of Puerto Rico, bordered by the municipalities of Arecibo to the north, Camuy to the east, and San Sebastian to the south. The municipality covers an area of 44.9 square miles (116.2 km2). The terrain is mostly flat, with some hills in the northern part of the municipality. The highest point is Cerro La Santa, which has an elevation of 1,065 feet (325 m).
The municipality is home to several rivers, including the Rio Grande de Manati, Rio Cibuco, and Rio Grande de Arecibo. The municipality also has several beaches, including Playa de Hatillo, Playa de Jobos, and Playa de Punta Salinas.
Economy
The economy of Hatillo is largely based on agriculture. The main crops grown in the municipality are sugarcane, tobacco, and coffee. The municipality is also home to several manufacturing plants, including a pharmaceutical plant and a plastics factory.
Demographics
As of the 2010 census, the population of Hatillo was 41,067. The population is mostly of mixed European and African descent. The majority of the population (90.2%) is Hispanic or Latino. The median household income in the municipality is $17,845.
The municipality has a high poverty rate, with 28.3% of the population living below the poverty line. The unemployment rate is also high, at 16.2%. The majority of the population (90.2%) is Catholic.
Conclusion
Hatillo Municipio is a municipality located in the northern coast of Puerto Rico. It has a population of 41,067 and is part of the San Juan-Caguas-Guaynabo Metropolitan Statistical Area. The economy of the municipality is largely based on agriculture, with the main crops being sugarcane, tobacco, and coffee. The population is mostly of mixed European and African descent, and the majority of the population (90.2%) is Catholic. The municipality has a high poverty rate, with 28.3% of the population living below the poverty line.
Common Questions
What is Per Capita Income in Hatillo Municipio?
Per Capita income in Hatillo Municipio is $14,528.
What is the Median Family Income in Hatillo Municipio?
Median Family Income in Hatillo Municipio is $31,888.
What is the Median Household income in Hatillo Municipio?
Median Household Income in Hatillo Municipio is $24,407.
What is Income or Wage Gap in Hatillo Municipio?
Income or Wage Gap in Hatillo Municipio is 3.6%.
Women in Hatillo Municipio earn 96.4 cents for every dollar earned by a man.
What is Family Income Deficit in Hatillo Municipio?
Family Income Deficit in Hatillo Municipio is $9,212.
Families that are below poverty line in Hatillo Municipio earn $9,212 less on average than the poverty threshold level.
What is Inequality or Gini Index in Hatillo Municipio?
Inequality or Gini Index in Hatillo Municipio is 0.48.
What is the Total Population of Hatillo Municipio?
Total Population of Hatillo Municipio is 38,330.
What is the Total Male Population of Hatillo Municipio?
Total Male Population of Hatillo Municipio is 18,284.
What is the Total Female Population of Hatillo Municipio?
Total Female Population of Hatillo Municipio is 20,046.
What is the Ratio of Males per 100 Females in Hatillo Municipio?
There are 91.21 Males per 100 Females in Hatillo Municipio.
What is the Ratio of Females per 100 Males in Hatillo Municipio?
There are 109.64 Females per 100 Males in Hatillo Municipio.
What is the Median Population Age in Hatillo Municipio?
Median Population Age in Hatillo Municipio is 44.6 Years.
What is the Average Family Size in Hatillo Municipio
Average Family Size in Hatillo Municipio is 3.4 People.
What is the Average Household Size in Hatillo Municipio
Average Household Size in Hatillo Municipio is 2.8 People.
How Large is the Labor Force in Hatillo Municipio?
There are 14,214 People in the Labor Forcein in Hatillo Municipio.
What is the Percentage of People in the Labor Force in Hatillo Municipio?
43.2% of People are in the Labor Force in Hatillo Municipio.
What is the Unemployment Rate in Hatillo Municipio?
Unemployment Rate in Hatillo Municipio is 6.0%.