Gurabo Municipio, PR Map & Demographics
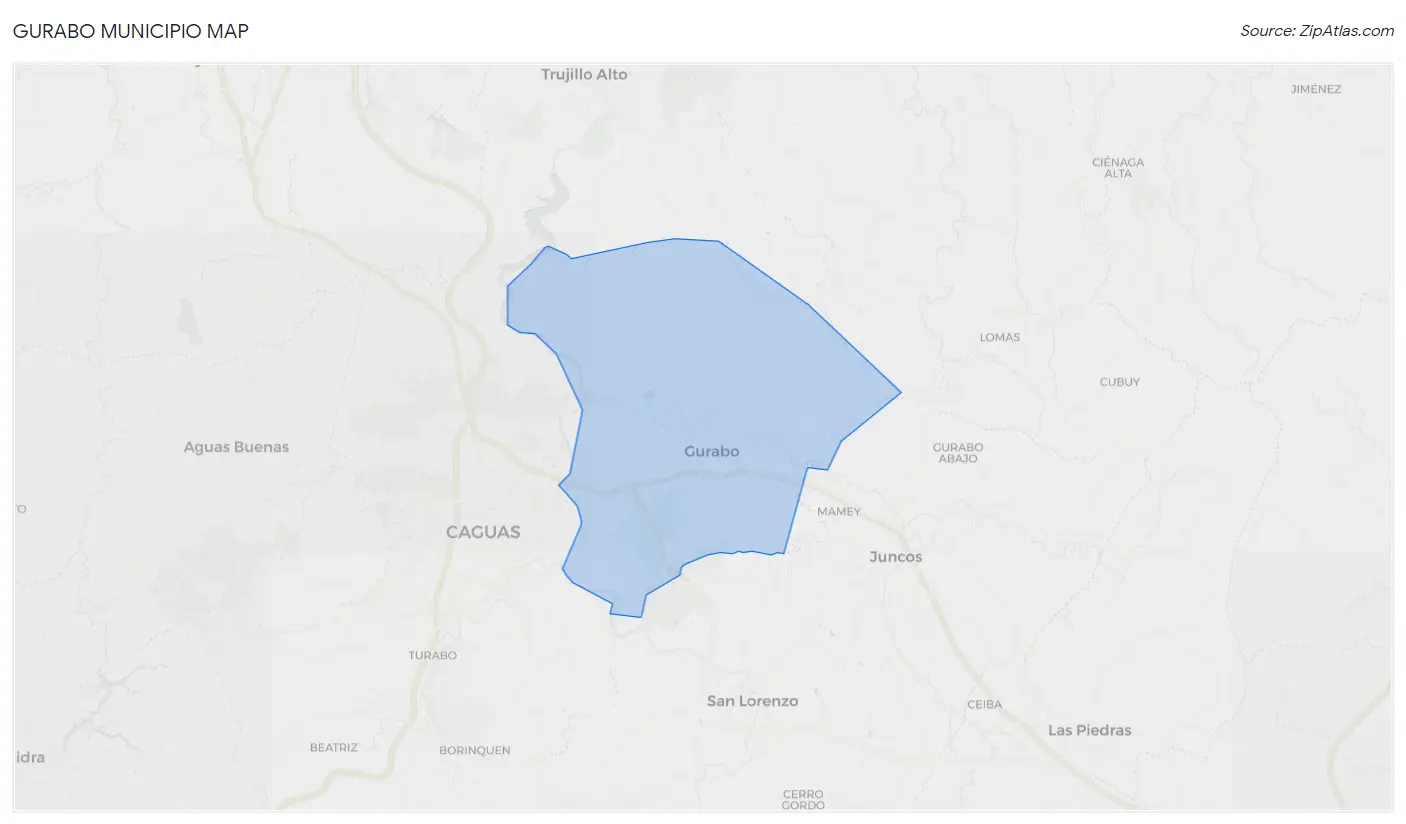
Gurabo Municipio Map
Gurabo Municipio Overview
$25,112
PER CAPITA INCOME
$45,609
AVG FAMILY INCOME
$39,533
AVG HOUSEHOLD INCOME
8.8%
WAGE / INCOME GAP [ % ]
91.2¢/ $1
WAGE / INCOME GAP [ $ ]
$10,917
FAMILY INCOME DEFICIT
0.59
INEQUALITY / GINI INDEX
40,517
TOTAL POPULATION
19,038
MALE POPULATION
21,479
FEMALE POPULATION
88.64
MALES / 100 FEMALES
112.82
FEMALES / 100 MALES
41.2
MEDIAN AGE
3.3
AVG FAMILY SIZE
2.7
AVG HOUSEHOLD SIZE
19,714
LABOR FORCE [ PEOPLE ]
57.7%
PERCENT IN LABOR FORCE
14.7%
UNEMPLOYMENT RATE
Gurabo Municipio Area Codes
Income in Gurabo Municipio
Income Overview in Gurabo Municipio
Per Capita Income in Gurabo Municipio is $25,112, while median incomes of families and households are $45,609 and $39,533 respectively.
| Characteristic | Number | Measure |
| Per Capita Income | 40,517 | $25,112 |
| Median Family Income | 10,520 | $45,609 |
| Mean Family Income | 10,520 | $71,780 |
| Median Household Income | 14,850 | $39,533 |
| Mean Household Income | 14,850 | $65,368 |
| Income Deficit | 10,520 | $10,917 |
| Wage / Income Gap (%) | 40,517 | 8.79% |
| Wage / Income Gap ($) | 40,517 | 91.21¢ per $1 |
| Gini / Inequality Index | 40,517 | 0.59 |
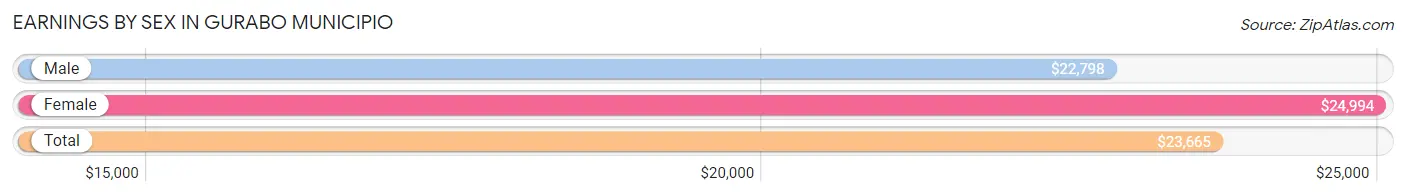
Earnings by Sex in Gurabo Municipio
Average Earnings in Gurabo Municipio are $23,665, $22,798 for men and $24,994 for women, a difference of 8.8%.
| Sex | Number | Average Earnings |
| Male | 9,957 (53.0%) | $22,798 |
| Female | 8,811 (46.9%) | $24,994 |
| Total | 18,768 (100.0%) | $23,665 |
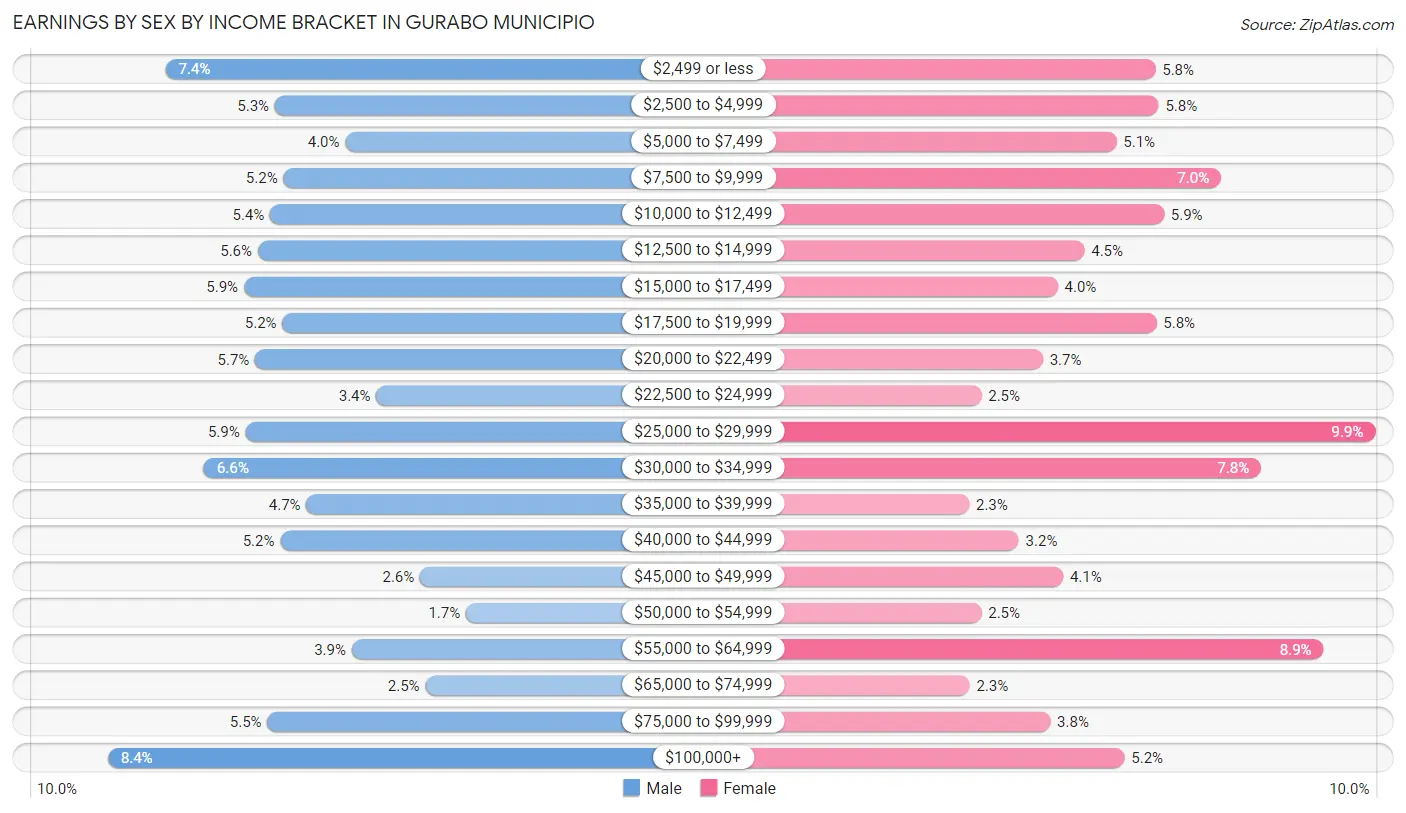
Earnings by Sex by Income Bracket in Gurabo Municipio
The most common earnings brackets in Gurabo Municipio are $100,000+ for men (840 | 8.4%) and $25,000 to $29,999 for women (872 | 9.9%).
| Income | Male | Female |
| $2,499 or less | 733 (7.4%) | 509 (5.8%) |
| $2,500 to $4,999 | 529 (5.3%) | 515 (5.8%) |
| $5,000 to $7,499 | 397 (4.0%) | 445 (5.1%) |
| $7,500 to $9,999 | 513 (5.1%) | 618 (7.0%) |
| $10,000 to $12,499 | 538 (5.4%) | 523 (5.9%) |
| $12,500 to $14,999 | 561 (5.6%) | 392 (4.4%) |
| $15,000 to $17,499 | 586 (5.9%) | 348 (4.0%) |
| $17,500 to $19,999 | 515 (5.2%) | 511 (5.8%) |
| $20,000 to $22,499 | 566 (5.7%) | 323 (3.7%) |
| $22,500 to $24,999 | 340 (3.4%) | 222 (2.5%) |
| $25,000 to $29,999 | 583 (5.9%) | 872 (9.9%) |
| $30,000 to $34,999 | 661 (6.6%) | 684 (7.8%) |
| $35,000 to $39,999 | 470 (4.7%) | 202 (2.3%) |
| $40,000 to $44,999 | 519 (5.2%) | 284 (3.2%) |
| $45,000 to $49,999 | 258 (2.6%) | 357 (4.1%) |
| $50,000 to $54,999 | 172 (1.7%) | 222 (2.5%) |
| $55,000 to $64,999 | 385 (3.9%) | 787 (8.9%) |
| $65,000 to $74,999 | 248 (2.5%) | 203 (2.3%) |
| $75,000 to $99,999 | 543 (5.4%) | 336 (3.8%) |
| $100,000+ | 840 (8.4%) | 458 (5.2%) |
| Total | 9,957 (100.0%) | 8,811 (100.0%) |
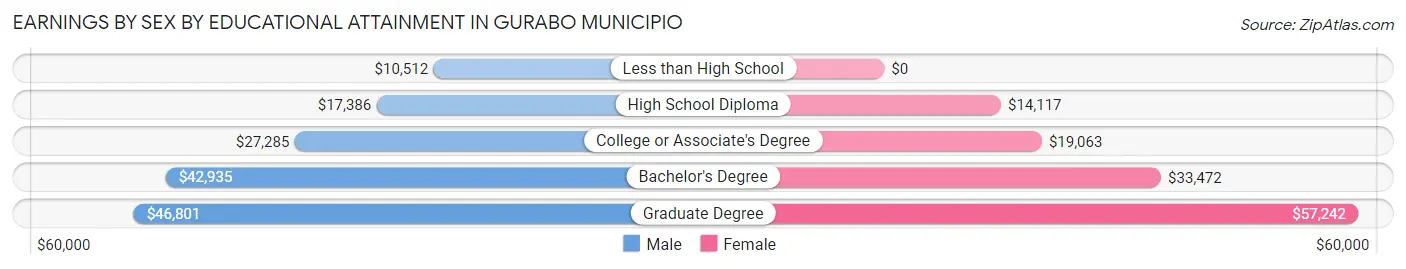
Earnings by Sex by Educational Attainment in Gurabo Municipio
Average earnings in Gurabo Municipio are $25,613 for men and $28,251 for women, a difference of 9.3%. Men with an educational attainment of graduate degree enjoy the highest average annual earnings of $46,801, while those with less than high school education earn the least with $10,512. Women with an educational attainment of graduate degree earn the most with the average annual earnings of $57,242, while those with high school diploma education have the smallest earnings of $14,117.
| Educational Attainment | Male Income | Female Income |
| Less than High School | $10,512 | $0 |
| High School Diploma | $17,386 | $14,117 |
| College or Associate's Degree | $27,285 | $19,063 |
| Bachelor's Degree | $42,935 | $33,472 |
| Graduate Degree | $46,801 | $57,242 |
| Total | $25,613 | $28,251 |
Family Income in Gurabo Municipio
Family Income Brackets in Gurabo Municipio
According to the Gurabo Municipio family income data, there are 1,999 families falling into the $50,000 to $74,999 income range, which is the most common income bracket and makes up 19.0% of all families. Conversely, the $150,000 to $199,999 income bracket is the least frequent group with only 368 families (3.5%) belonging to this category.
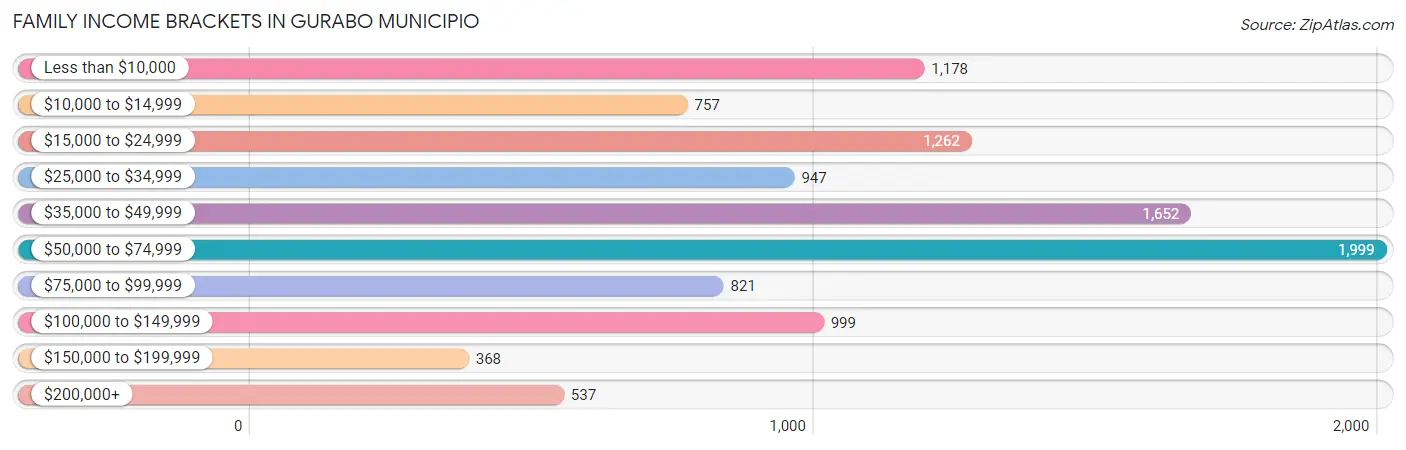
| Income Bracket | # Families | % Families |
| Less than $10,000 | 1,178 | 11.2% |
| $10,000 to $14,999 | 757 | 7.2% |
| $15,000 to $24,999 | 1,262 | 12.0% |
| $25,000 to $34,999 | 947 | 9.0% |
| $35,000 to $49,999 | 1,652 | 15.7% |
| $50,000 to $74,999 | 1,999 | 19.0% |
| $75,000 to $99,999 | 821 | 7.8% |
| $100,000 to $149,999 | 999 | 9.5% |
| $150,000 to $199,999 | 368 | 3.5% |
| $200,000+ | 537 | 5.1% |
Family Income by Famaliy Size in Gurabo Municipio
6-person families (99 | 0.9%) account for the highest median family income in Gurabo Municipio with $83,372 per family, while 2-person families (4,555 | 43.3%) have the highest median income of $19,438 per family member.
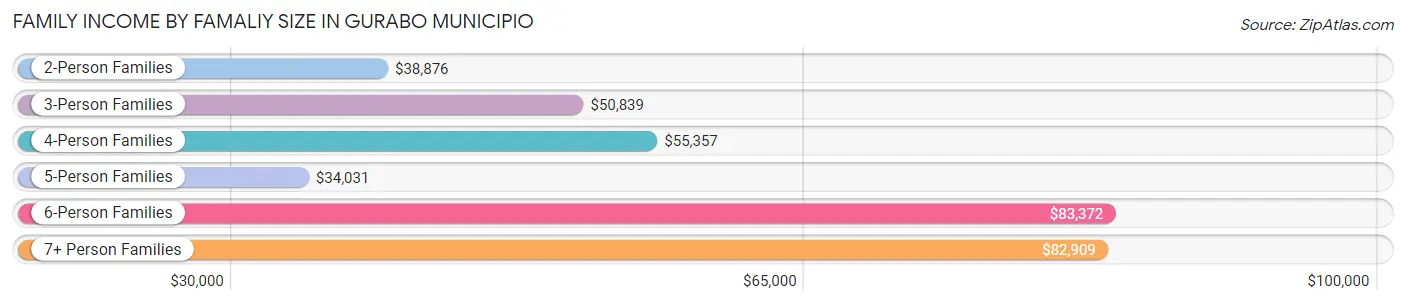
| Income Bracket | # Families | Median Income |
| 2-Person Families | 4,555 (43.3%) | $38,876 |
| 3-Person Families | 2,805 (26.7%) | $50,839 |
| 4-Person Families | 2,152 (20.5%) | $55,357 |
| 5-Person Families | 750 (7.1%) | $34,031 |
| 6-Person Families | 99 (0.9%) | $83,372 |
| 7+ Person Families | 159 (1.5%) | $82,909 |
| Total | 10,520 (100.0%) | $45,609 |
Family Income by Number of Earners in Gurabo Municipio
The median family income in Gurabo Municipio is $45,609, with families comprising 3+ earners (1,010) having the highest median family income of $83,667, while families with no earners (2,558) have the lowest median family income of $20,116, accounting for 9.6% and 24.3% of families, respectively.
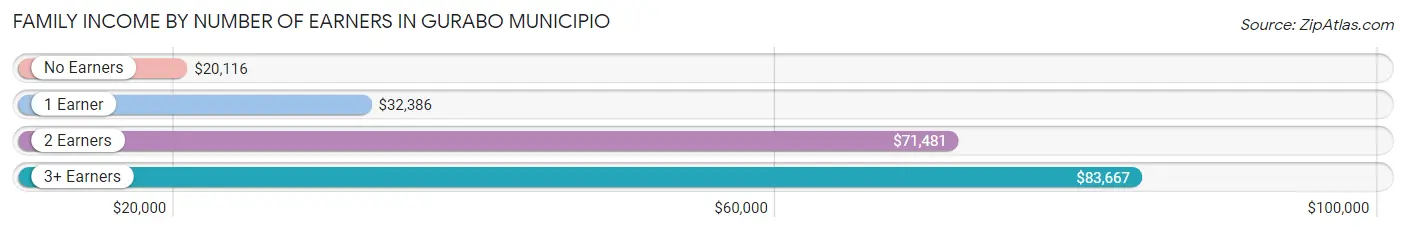
| Number of Earners | # Families | Median Income |
| No Earners | 2,558 (24.3%) | $20,116 |
| 1 Earner | 3,400 (32.3%) | $32,386 |
| 2 Earners | 3,552 (33.8%) | $71,481 |
| 3+ Earners | 1,010 (9.6%) | $83,667 |
| Total | 10,520 (100.0%) | $45,609 |
Household Income in Gurabo Municipio
Household Income Brackets in Gurabo Municipio
With 2,421 households falling in the category, the less than $10,000 income range is the most frequent in Gurabo Municipio, accounting for 16.3% of all households. In contrast, only 401 households (2.7%) fall into the $150,000 to $199,999 income bracket, making it the least populous group.
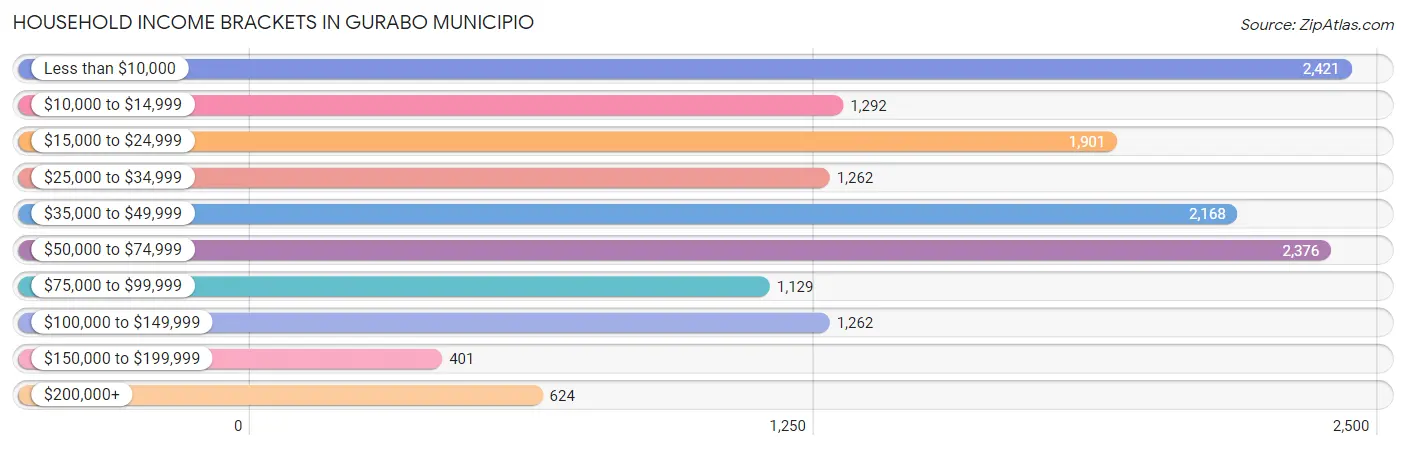
| Income Bracket | # Households | % Households |
| Less than $10,000 | 2,421 | 16.3% |
| $10,000 to $14,999 | 1,292 | 8.7% |
| $15,000 to $24,999 | 1,901 | 12.8% |
| $25,000 to $34,999 | 1,262 | 8.5% |
| $35,000 to $49,999 | 2,168 | 14.6% |
| $50,000 to $74,999 | 2,376 | 16.0% |
| $75,000 to $99,999 | 1,129 | 7.6% |
| $100,000 to $149,999 | 1,262 | 8.5% |
| $150,000 to $199,999 | 401 | 2.7% |
| $200,000+ | 624 | 4.2% |
Household Income by Householder Age in Gurabo Municipio
The median household income in Gurabo Municipio is $39,533, with the highest median household income of $45,850 found in the 45 to 64 years age bracket for the primary householder. A total of 6,049 households (40.7%) fall into this category. Meanwhile, the 15 to 24 years age bracket for the primary householder has the lowest median household income of $0, with 131 households (0.9%) in this group.
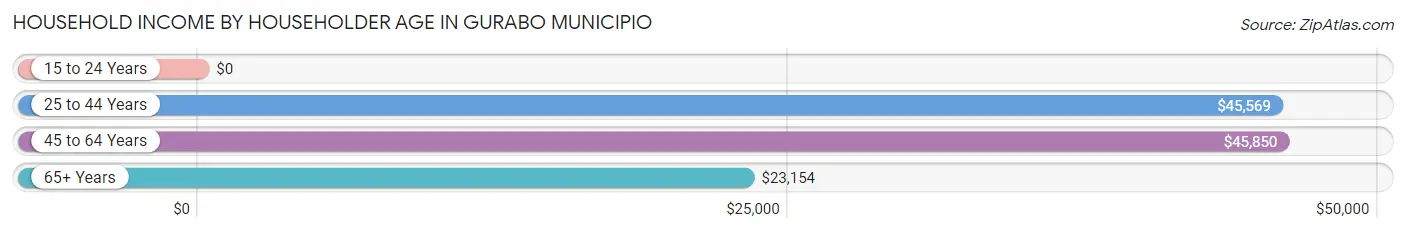
| Income Bracket | # Households | Median Income |
| 15 to 24 Years | 131 (0.9%) | $0 |
| 25 to 44 Years | 4,648 (31.3%) | $45,569 |
| 45 to 64 Years | 6,049 (40.7%) | $45,850 |
| 65+ Years | 4,022 (27.1%) | $23,154 |
| Total | 14,850 (100.0%) | $39,533 |
Poverty in Gurabo Municipio
Income Below Poverty by Sex and Age in Gurabo Municipio
With 29.0% poverty level for males and 34.6% for females among the residents of Gurabo Municipio, 12 to 14 year old males and 6 to 11 year old females are the most vulnerable to poverty, with 378 males (51.5%) and 664 females (54.2%) in their respective age groups living below the poverty level.
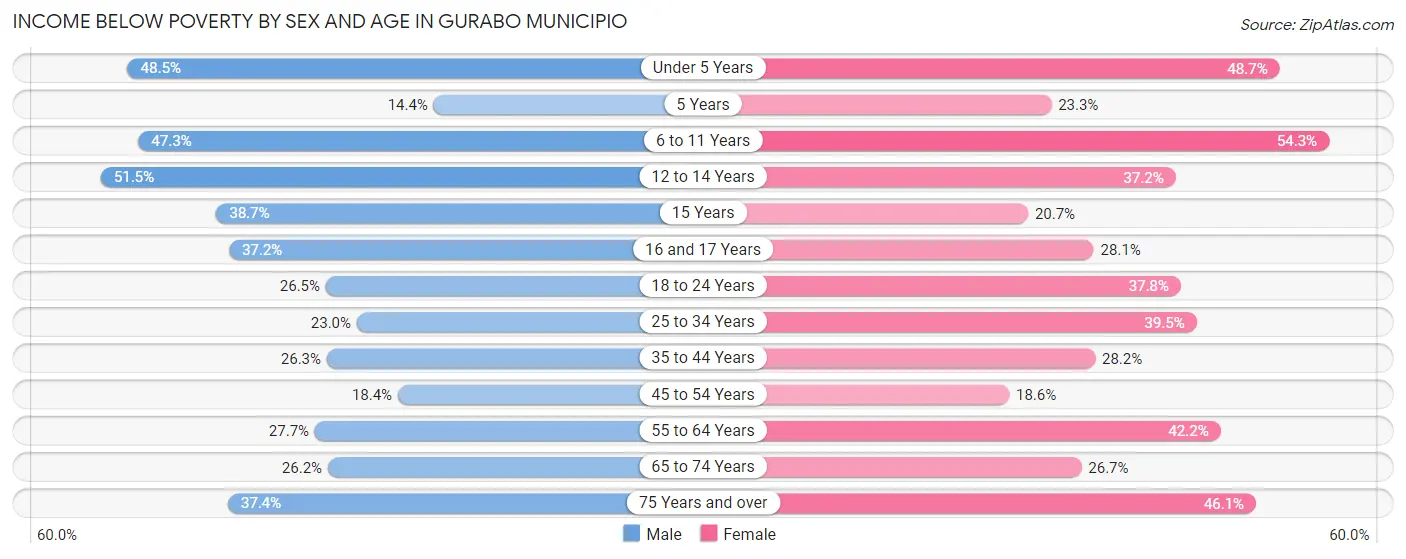
| Age Bracket | Male | Female |
| Under 5 Years | 327 (48.5%) | 309 (48.7%) |
| 5 Years | 40 (14.4%) | 45 (23.3%) |
| 6 to 11 Years | 573 (47.3%) | 664 (54.2%) |
| 12 to 14 Years | 378 (51.5%) | 278 (37.2%) |
| 15 Years | 97 (38.7%) | 80 (20.7%) |
| 16 and 17 Years | 197 (37.2%) | 115 (28.1%) |
| 18 to 24 Years | 493 (26.5%) | 742 (37.8%) |
| 25 to 34 Years | 611 (23.0%) | 1,190 (39.5%) |
| 35 to 44 Years | 697 (26.3%) | 864 (28.2%) |
| 45 to 54 Years | 522 (18.4%) | 592 (18.6%) |
| 55 to 64 Years | 642 (27.7%) | 1,185 (42.2%) |
| 65 to 74 Years | 450 (26.2%) | 556 (26.7%) |
| 75 Years and over | 467 (37.4%) | 766 (46.1%) |
| Total | 5,494 (29.0%) | 7,386 (34.6%) |
Income Above Poverty by Sex and Age in Gurabo Municipio
According to the poverty statistics in Gurabo Municipio, males aged 5 years and females aged 45 to 54 years are the age groups that are most secure financially, with 85.6% of males and 81.4% of females in these age groups living above the poverty line.
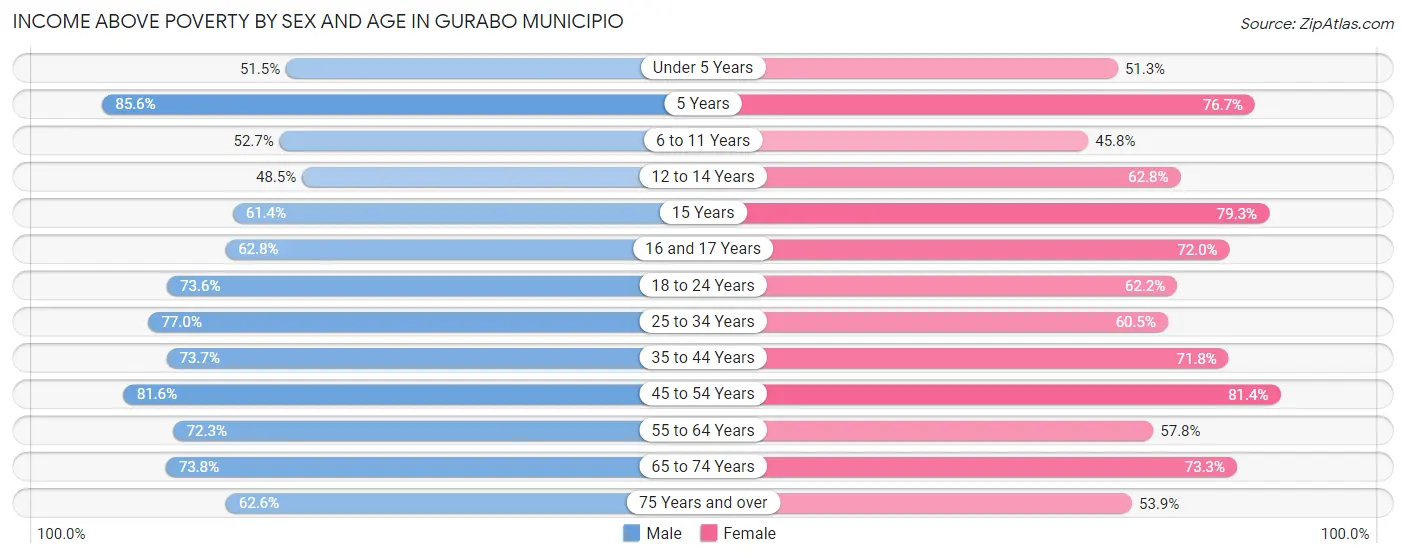
| Age Bracket | Male | Female |
| Under 5 Years | 347 (51.5%) | 325 (51.3%) |
| 5 Years | 237 (85.6%) | 148 (76.7%) |
| 6 to 11 Years | 638 (52.7%) | 560 (45.8%) |
| 12 to 14 Years | 356 (48.5%) | 470 (62.8%) |
| 15 Years | 154 (61.4%) | 306 (79.3%) |
| 16 and 17 Years | 332 (62.8%) | 295 (72.0%) |
| 18 to 24 Years | 1,371 (73.6%) | 1,223 (62.2%) |
| 25 to 34 Years | 2,046 (77.0%) | 1,822 (60.5%) |
| 35 to 44 Years | 1,949 (73.7%) | 2,200 (71.8%) |
| 45 to 54 Years | 2,312 (81.6%) | 2,585 (81.4%) |
| 55 to 64 Years | 1,678 (72.3%) | 1,625 (57.8%) |
| 65 to 74 Years | 1,266 (73.8%) | 1,528 (73.3%) |
| 75 Years and over | 783 (62.6%) | 895 (53.9%) |
| Total | 13,469 (71.0%) | 13,982 (65.4%) |
Income Below Poverty Among Married-Couple Families in Gurabo Municipio
The poverty statistics for married-couple families in Gurabo Municipio show that 17.4% or 1,129 of the total 6,491 families live below the poverty line. Families with 3 or 4 children have the highest poverty rate of 52.2%, comprising of 129 families. On the other hand, families with 1 or 2 children have the lowest poverty rate of 9.3%, which includes 186 families.
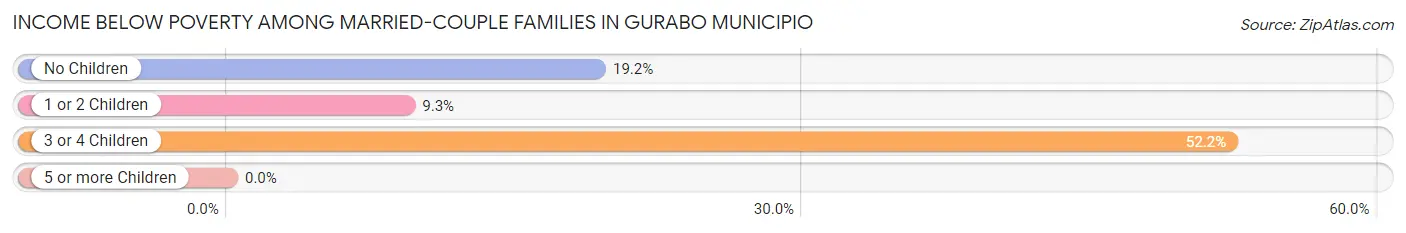
| Children | Above Poverty | Below Poverty |
| No Children | 3,421 (80.8%) | 814 (19.2%) |
| 1 or 2 Children | 1,823 (90.7%) | 186 (9.3%) |
| 3 or 4 Children | 118 (47.8%) | 129 (52.2%) |
| 5 or more Children | 0 (0.0%) | 0 (0.0%) |
| Total | 5,362 (82.6%) | 1,129 (17.4%) |
Income Below Poverty Among Single-Parent Households in Gurabo Municipio
According to the poverty data in Gurabo Municipio, 46.3% or 466 single-father households and 47.9% or 1,448 single-mother households are living below the poverty line. Among single-father households, those with 3 or 4 children have the highest poverty rate, with 119 households (79.9%) experiencing poverty. Likewise, among single-mother households, those with 3 or 4 children have the highest poverty rate, with 346 households (100.0%) falling below the poverty line.
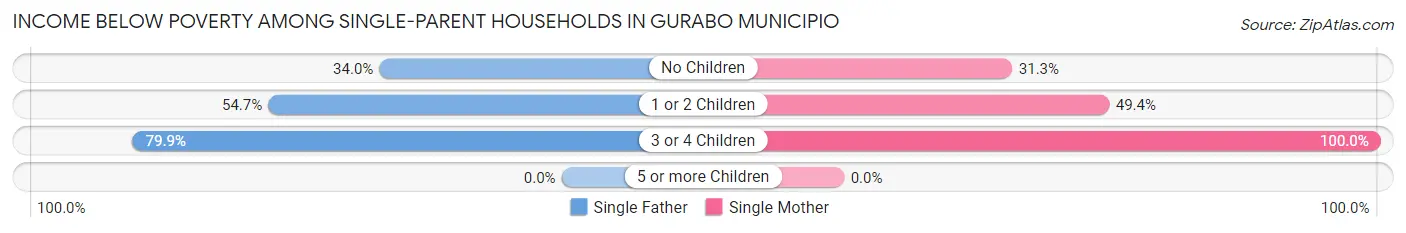
| Children | Single Father | Single Mother |
| No Children | 200 (34.0%) | 381 (31.3%) |
| 1 or 2 Children | 147 (54.6%) | 721 (49.4%) |
| 3 or 4 Children | 119 (79.9%) | 346 (100.0%) |
| 5 or more Children | 0 (0.0%) | 0 (0.0%) |
| Total | 466 (46.3%) | 1,448 (47.9%) |
Income Below Poverty Among Married-Couple vs Single-Parent Households in Gurabo Municipio
The poverty data for Gurabo Municipio shows that 1,129 of the married-couple family households (17.4%) and 1,914 of the single-parent households (47.5%) are living below the poverty level. Within the married-couple family households, those with 3 or 4 children have the highest poverty rate, with 129 households (52.2%) falling below the poverty line. Among the single-parent households, those with 3 or 4 children have the highest poverty rate, with 465 household (93.9%) living below poverty.
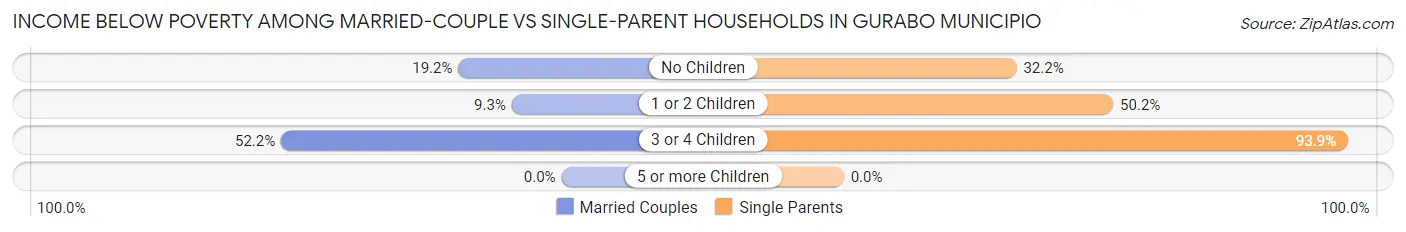
| Children | Married-Couple Families | Single-Parent Households |
| No Children | 814 (19.2%) | 581 (32.2%) |
| 1 or 2 Children | 186 (9.3%) | 868 (50.2%) |
| 3 or 4 Children | 129 (52.2%) | 465 (93.9%) |
| 5 or more Children | 0 (0.0%) | 0 (0.0%) |
| Total | 1,129 (17.4%) | 1,914 (47.5%) |
Race in Gurabo Municipio
The most populous races in Gurabo Municipio are Hispanic or Latino (38,983 | 96.2%), White / Caucasian (17,082 | 42.2%), and Some other Race (11,914 | 29.4%).
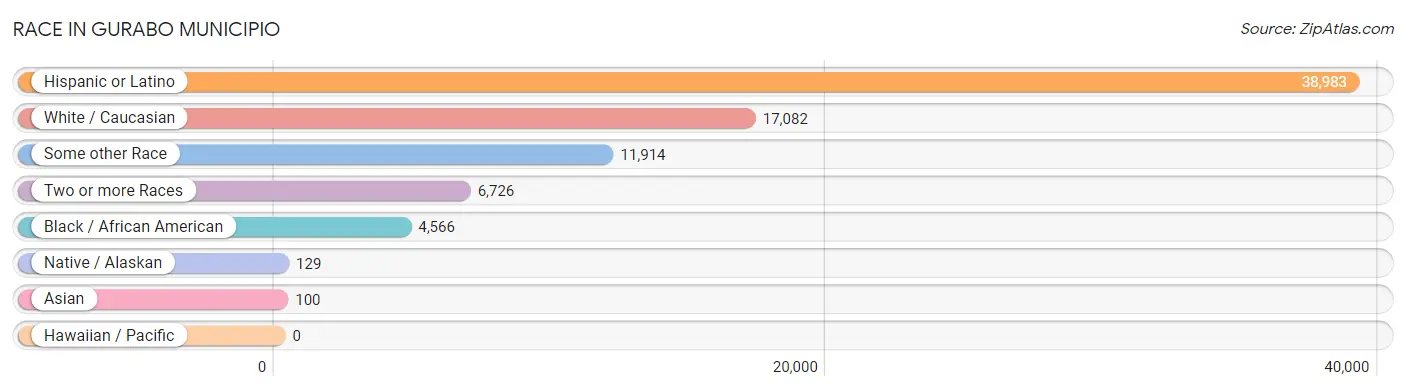
| Race | # Population | % Population |
| Asian | 100 | 0.3% |
| Black / African American | 4,566 | 11.3% |
| Hawaiian / Pacific | 0 | 0.0% |
| Hispanic or Latino | 38,983 | 96.2% |
| Native / Alaskan | 129 | 0.3% |
| White / Caucasian | 17,082 | 42.2% |
| Two or more Races | 6,726 | 16.6% |
| Some other Race | 11,914 | 29.4% |
| Total | 40,517 | 100.0% |
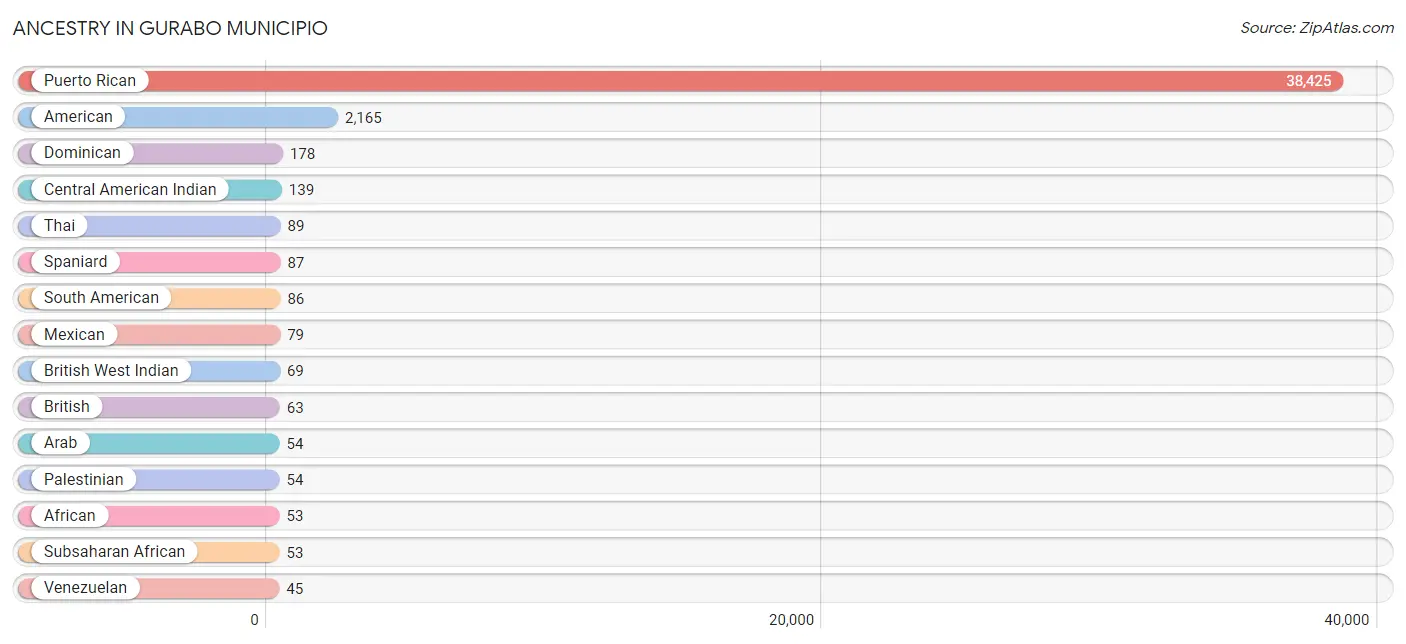
Ancestry in Gurabo Municipio
The most populous ancestries reported in Gurabo Municipio are Puerto Rican (38,425 | 94.8%), American (2,165 | 5.3%), Dominican (178 | 0.4%), Central American Indian (139 | 0.3%), and Thai (89 | 0.2%), together accounting for 101.2% of all Gurabo Municipio residents.
| Ancestry | # Population | % Population |
| African | 53 | 0.1% |
| American | 2,165 | 5.3% |
| Arab | 54 | 0.1% |
| Argentinean | 13 | 0.0% |
| British | 63 | 0.2% |
| British West Indian | 69 | 0.2% |
| Central American | 17 | 0.0% |
| Central American Indian | 139 | 0.3% |
| Colombian | 28 | 0.1% |
| Costa Rican | 9 | 0.0% |
| Cuban | 28 | 0.1% |
| Dominican | 178 | 0.4% |
| French Canadian | 1 | 0.0% |
| German | 42 | 0.1% |
| Honduran | 2 | 0.0% |
| Indian (Asian) | 34 | 0.1% |
| Italian | 32 | 0.1% |
| Jamaican | 19 | 0.1% |
| Laotian | 12 | 0.0% |
| Mexican | 79 | 0.2% |
| Palestinian | 54 | 0.1% |
| Panamanian | 6 | 0.0% |
| Puerto Rican | 38,425 | 94.8% |
| Russian | 17 | 0.0% |
| Scottish | 18 | 0.0% |
| South American | 86 | 0.2% |
| Spaniard | 87 | 0.2% |
| Spanish American Indian | 30 | 0.1% |
| Subsaharan African | 53 | 0.1% |
| Thai | 89 | 0.2% |
| Venezuelan | 45 | 0.1% |
| West Indian | 8 | 0.0% | View All 32 Rows |
Immigrants in Gurabo Municipio

| Immigration Origin | # Population | % Population | View All 0 Rows |
Sex and Age in Gurabo Municipio
Sex and Age in Gurabo Municipio
The most populous age groups in Gurabo Municipio are 45 to 49 Years (1,494 | 7.9%) for men and 40 to 44 Years (1,792 | 8.3%) for women.
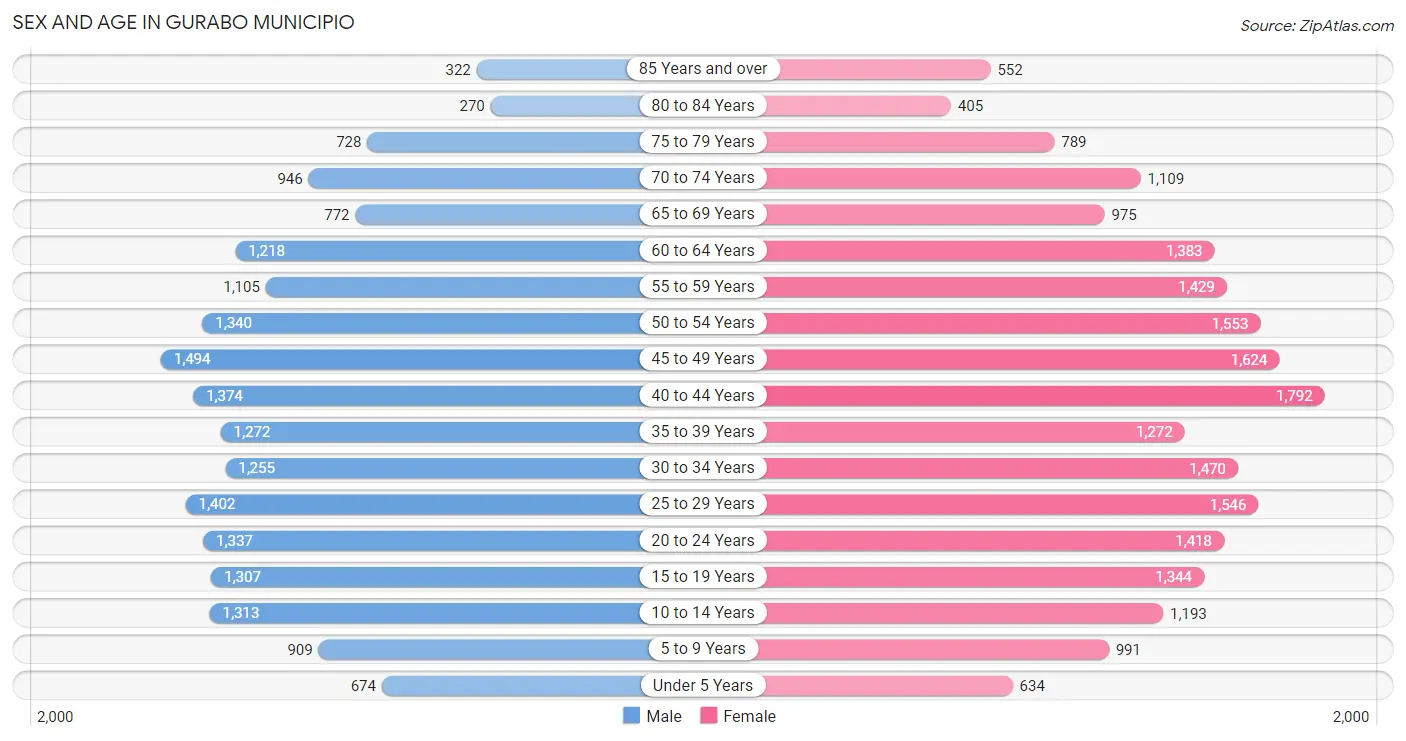
| Age Bracket | Male | Female |
| Under 5 Years | 674 (3.5%) | 634 (2.9%) |
| 5 to 9 Years | 909 (4.8%) | 991 (4.6%) |
| 10 to 14 Years | 1,313 (6.9%) | 1,193 (5.6%) |
| 15 to 19 Years | 1,307 (6.9%) | 1,344 (6.3%) |
| 20 to 24 Years | 1,337 (7.0%) | 1,418 (6.6%) |
| 25 to 29 Years | 1,402 (7.4%) | 1,546 (7.2%) |
| 30 to 34 Years | 1,255 (6.6%) | 1,470 (6.8%) |
| 35 to 39 Years | 1,272 (6.7%) | 1,272 (5.9%) |
| 40 to 44 Years | 1,374 (7.2%) | 1,792 (8.3%) |
| 45 to 49 Years | 1,494 (7.9%) | 1,624 (7.6%) |
| 50 to 54 Years | 1,340 (7.0%) | 1,553 (7.2%) |
| 55 to 59 Years | 1,105 (5.8%) | 1,429 (6.7%) |
| 60 to 64 Years | 1,218 (6.4%) | 1,383 (6.4%) |
| 65 to 69 Years | 772 (4.1%) | 975 (4.5%) |
| 70 to 74 Years | 946 (5.0%) | 1,109 (5.2%) |
| 75 to 79 Years | 728 (3.8%) | 789 (3.7%) |
| 80 to 84 Years | 270 (1.4%) | 405 (1.9%) |
| 85 Years and over | 322 (1.7%) | 552 (2.6%) |
| Total | 19,038 (100.0%) | 21,479 (100.0%) |
Families and Households in Gurabo Municipio
Median Family Size in Gurabo Municipio
The median family size in Gurabo Municipio is 3.26 persons per family, with single female/mother families (3,022 | 28.7%) accounting for the largest median family size of 3.47 persons per family. On the other hand, single male/father families (1,007 | 9.6%) represent the smallest median family size with 3.05 persons per family.
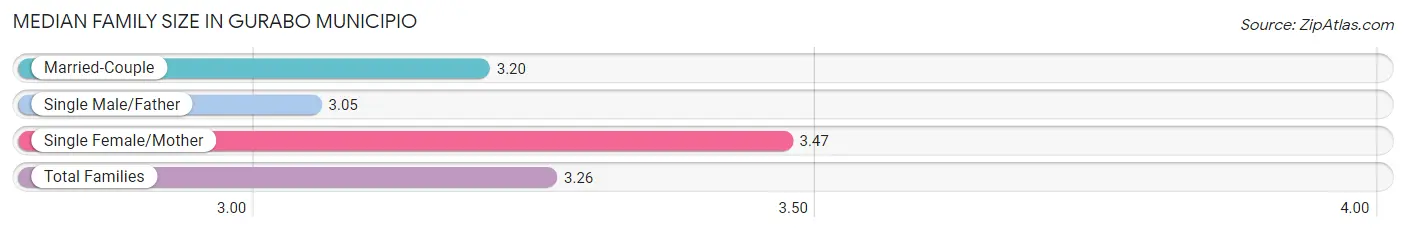
| Family Type | # Families | Family Size |
| Married-Couple | 6,491 (61.7%) | 3.20 |
| Single Male/Father | 1,007 (9.6%) | 3.05 |
| Single Female/Mother | 3,022 (28.7%) | 3.47 |
| Total Families | 10,520 (100.0%) | 3.26 |
Median Household Size in Gurabo Municipio
The median household size in Gurabo Municipio is 2.71 persons per household, with single female/mother households (3,022 | 20.3%) accounting for the largest median household size of 3.6 persons per household. non-family households (4,330 | 29.2%) represent the smallest median household size with 1.14 persons per household.
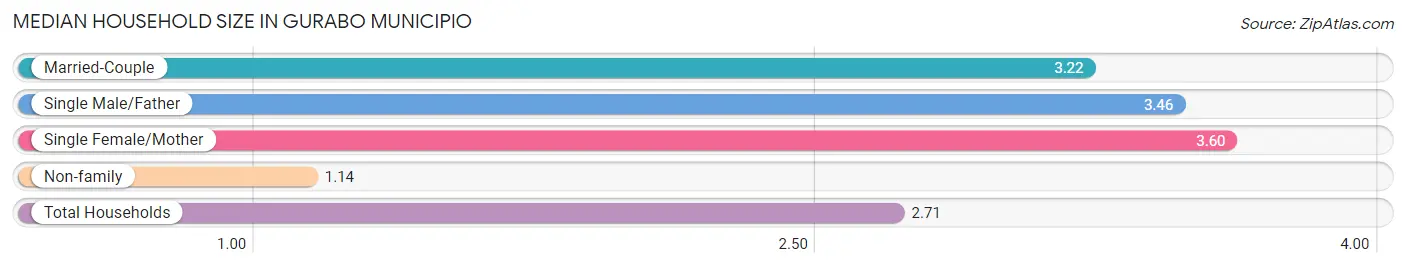
| Household Type | # Households | Household Size |
| Married-Couple | 6,491 (43.7%) | 3.22 |
| Single Male/Father | 1,007 (6.8%) | 3.46 |
| Single Female/Mother | 3,022 (20.3%) | 3.60 |
| Non-family | 4,330 (29.2%) | 1.14 |
| Total Households | 14,850 (100.0%) | 2.71 |
Household Size by Marriage Status in Gurabo Municipio
Out of a total of 14,850 households in Gurabo Municipio, 10,520 (70.8%) are family households, while 4,330 (29.2%) are nonfamily households. The most numerous type of family households are 2-person households, comprising 4,159, and the most common type of nonfamily households are 1-person households, comprising 3,720.
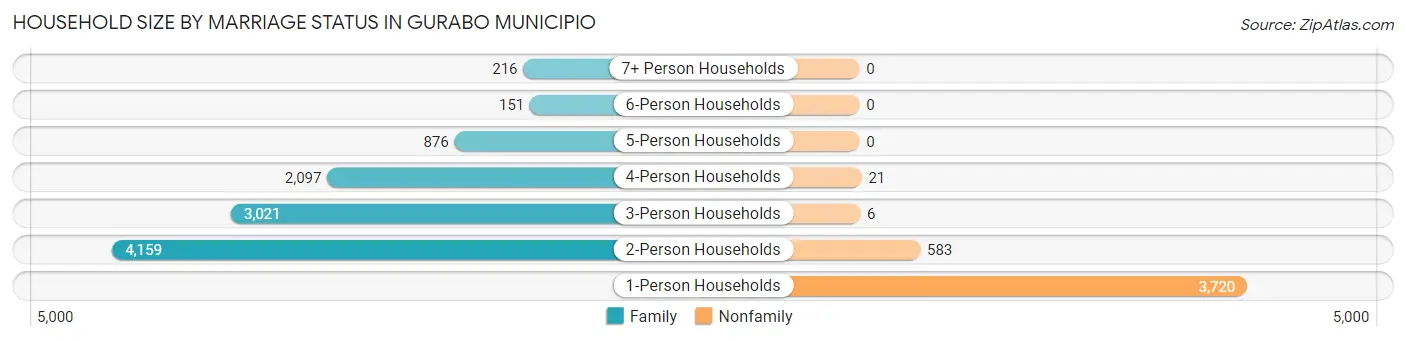
| Household Size | Family Households | Nonfamily Households |
| 1-Person Households | - | 3,720 (25.1%) |
| 2-Person Households | 4,159 (28.0%) | 583 (3.9%) |
| 3-Person Households | 3,021 (20.3%) | 6 (0.0%) |
| 4-Person Households | 2,097 (14.1%) | 21 (0.1%) |
| 5-Person Households | 876 (5.9%) | 0 (0.0%) |
| 6-Person Households | 151 (1.0%) | 0 (0.0%) |
| 7+ Person Households | 216 (1.5%) | 0 (0.0%) |
| Total | 10,520 (70.8%) | 4,330 (29.2%) |
Female Fertility in Gurabo Municipio
Fertility by Age in Gurabo Municipio
Average fertility rate in Gurabo Municipio is 20.0 births per 1,000 women. Women in the age bracket of 20 to 34 years have the highest fertility rate with 36.0 births per 1,000 women. Women in the age bracket of 20 to 34 years acount for 73.8% of all women with births.
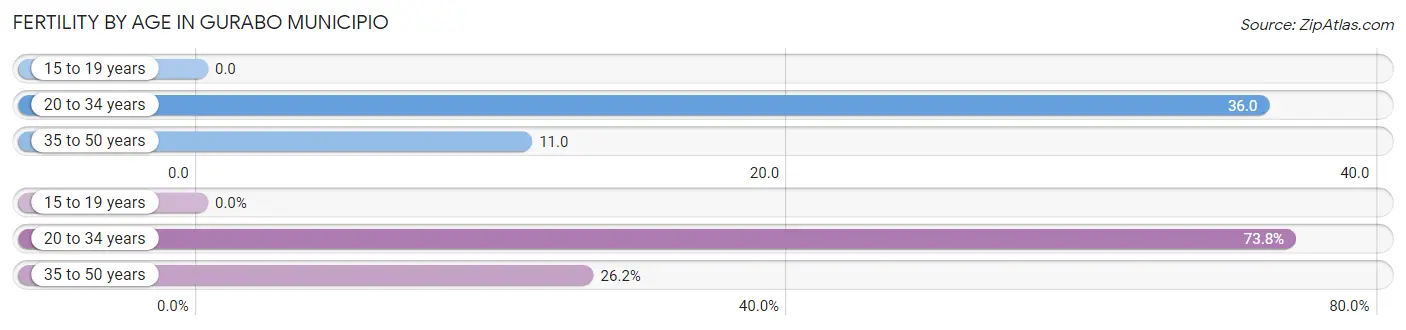
| Age Bracket | Women with Births | Births / 1,000 Women |
| 15 to 19 years | 0 (0.0%) | 0.0 |
| 20 to 34 years | 158 (73.8%) | 36.0 |
| 35 to 50 years | 56 (26.2%) | 11.0 |
| Total | 214 (100.0%) | 20.0 |
Fertility by Age by Marriage Status in Gurabo Municipio
49.5% of women with births (214) in Gurabo Municipio are married. The highest percentage of unmarried women with births falls into 20 to 34 years age bracket with 54.4% of them unmarried at the time of birth, while the lowest percentage of unmarried women with births belong to 35 to 50 years age bracket with 39.3% of them unmarried.
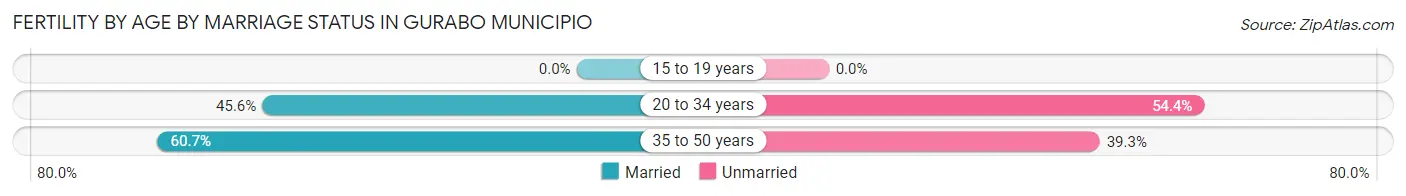
| Age Bracket | Married | Unmarried |
| 15 to 19 years | 0 (0.0%) | 0 (0.0%) |
| 20 to 34 years | 72 (45.6%) | 86 (54.4%) |
| 35 to 50 years | 34 (60.7%) | 22 (39.3%) |
| Total | 106 (49.5%) | 108 (50.5%) |
Fertility by Education in Gurabo Municipio
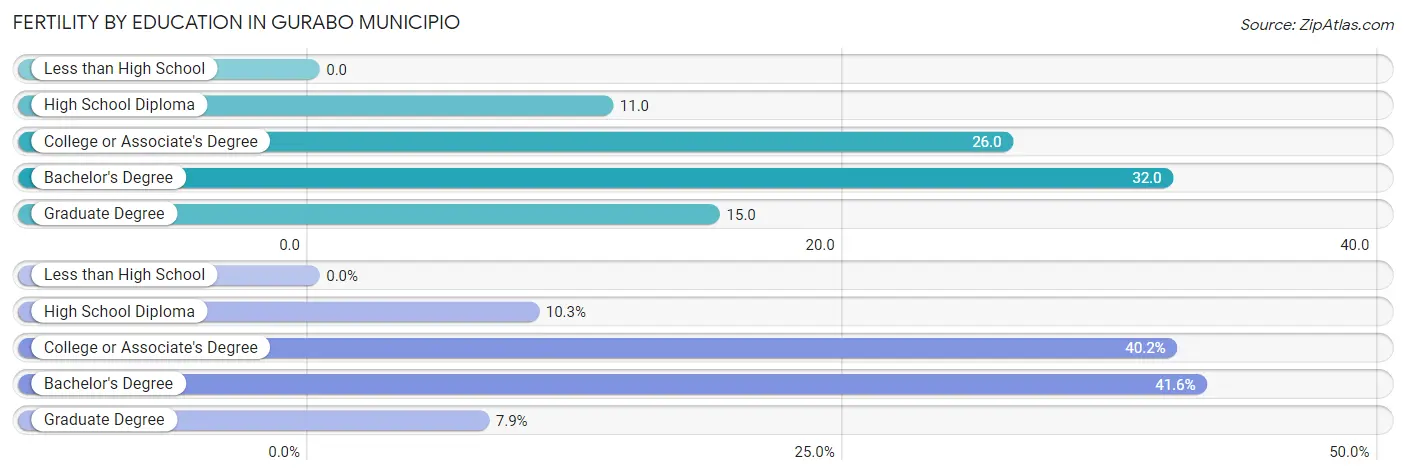
| Educational Attainment | Women with Births | Births / 1,000 Women |
| Less than High School | 0 (0.0%) | 0.0 |
| High School Diploma | 22 (10.3%) | 11.0 |
| College or Associate's Degree | 86 (40.2%) | 26.0 |
| Bachelor's Degree | 89 (41.6%) | 32.0 |
| Graduate Degree | 17 (7.9%) | 15.0 |
| Total | 214 (100.0%) | 20.0 |
Fertility by Education by Marriage Status in Gurabo Municipio
50.5% of women with births in Gurabo Municipio are unmarried. Women with the educational attainment of bachelor's degree are most likely to be married with 100.0% of them married at childbirth, while women with the educational attainment of high school diploma are least likely to be married with 100.0% of them unmarried at childbirth.
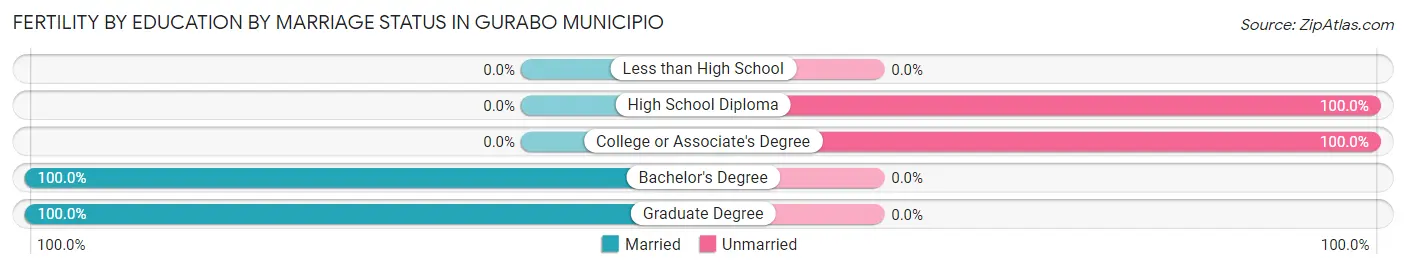
| Educational Attainment | Married | Unmarried |
| Less than High School | 0 (0.0%) | 0 (0.0%) |
| High School Diploma | 0 (0.0%) | 22 (100.0%) |
| College or Associate's Degree | 0 (0.0%) | 86 (100.0%) |
| Bachelor's Degree | 89 (100.0%) | 0 (0.0%) |
| Graduate Degree | 17 (100.0%) | 0 (0.0%) |
| Total | 106 (49.5%) | 108 (50.5%) |
Employment Characteristics in Gurabo Municipio
Employment by Class of Employer in Gurabo Municipio
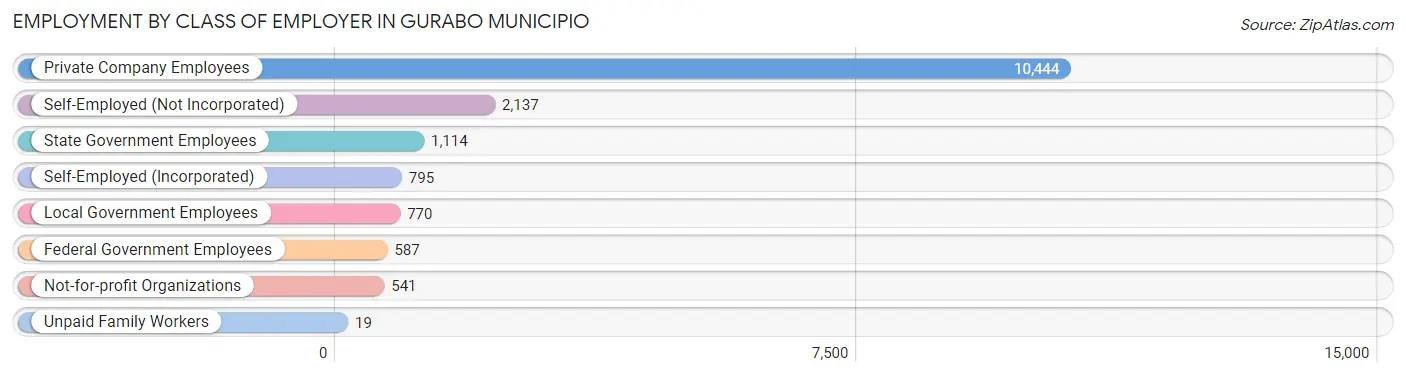
Among the 16,407 employed individuals in Gurabo Municipio, private company employees (10,444 | 63.7%), self-employed (not incorporated) (2,137 | 13.0%), and state government employees (1,114 | 6.8%) make up the most common classes of employment.
| Employer Class | # Employees | % Employees |
| Private Company Employees | 10,444 | 63.7% |
| Self-Employed (Incorporated) | 795 | 4.9% |
| Self-Employed (Not Incorporated) | 2,137 | 13.0% |
| Not-for-profit Organizations | 541 | 3.3% |
| Local Government Employees | 770 | 4.7% |
| State Government Employees | 1,114 | 6.8% |
| Federal Government Employees | 587 | 3.6% |
| Unpaid Family Workers | 19 | 0.1% |
| Total | 16,407 | 100.0% |
Employment Status by Age in Gurabo Municipio
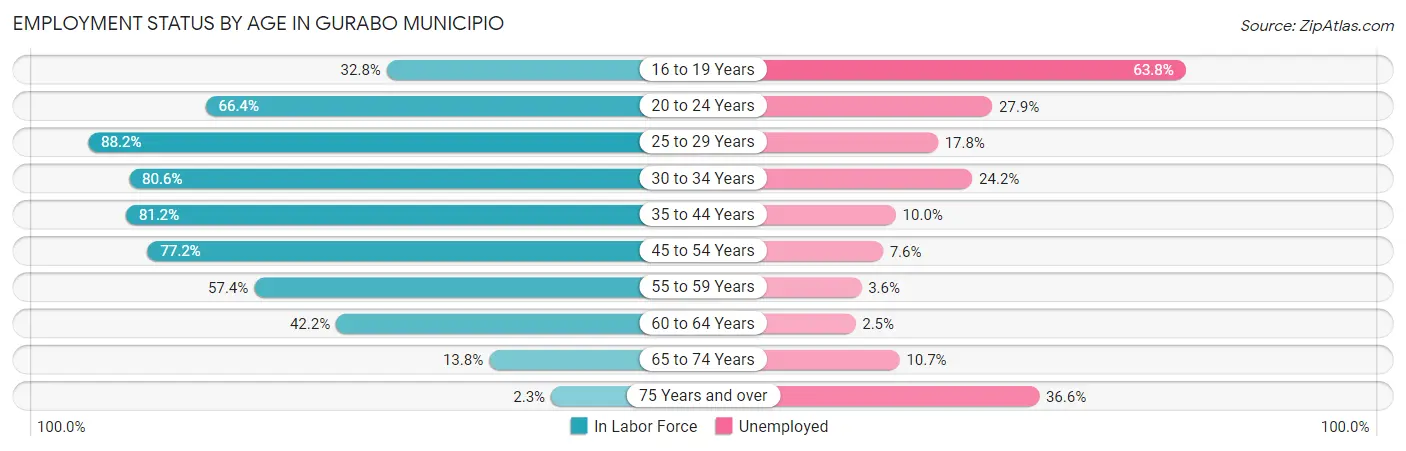
According to the labor force statistics for Gurabo Municipio, out of the total population over 16 years of age (34,166), 57.7% or 19,714 individuals are in the labor force, with 14.7% or 2,898 of them unemployed. The age group with the highest labor force participation rate is 25 to 29 years, with 88.2% or 2,600 individuals in the labor force. Within the labor force, the 16 to 19 years age range has the highest percentage of unemployed individuals, with 63.8% or 422 of them being unemployed.
| Age Bracket | In Labor Force | Unemployed |
| 16 to 19 Years | 661 (32.8%) | 422 (63.8%) |
| 20 to 24 Years | 1,829 (66.4%) | 510 (27.9%) |
| 25 to 29 Years | 2,600 (88.2%) | 463 (17.8%) |
| 30 to 34 Years | 2,196 (80.6%) | 531 (24.2%) |
| 35 to 44 Years | 4,637 (81.2%) | 464 (10.0%) |
| 45 to 54 Years | 4,640 (77.2%) | 353 (7.6%) |
| 55 to 59 Years | 1,455 (57.4%) | 52 (3.6%) |
| 60 to 64 Years | 1,098 (42.2%) | 27 (2.5%) |
| 65 to 74 Years | 525 (13.8%) | 56 (10.7%) |
| 75 Years and over | 71 (2.3%) | 26 (36.6%) |
| Total | 19,714 (57.7%) | 2,898 (14.7%) |
Employment Status by Educational Attainment in Gurabo Municipio
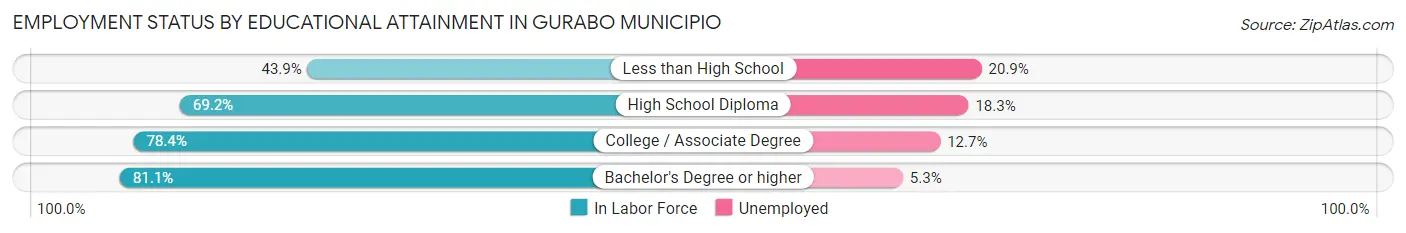
According to labor force statistics for Gurabo Municipio, 73.8% of individuals (16,626) out of the total population between 25 and 64 years of age (22,529) are in the labor force, with 11.3% or 1,879 of them being unemployed. The group with the highest labor force participation rate are those with the educational attainment of bachelor's degree or higher, with 81.1% or 6,996 individuals in the labor force. Within the labor force, individuals with less than high school education have the highest percentage of unemployment, with 20.9% or 211 of them being unemployed.
| Educational Attainment | In Labor Force | Unemployed |
| Less than High School | 1,009 (43.9%) | 480 (20.9%) |
| High School Diploma | 3,559 (69.2%) | 941 (18.3%) |
| College / Associate Degree | 5,065 (78.4%) | 821 (12.7%) |
| Bachelor's Degree or higher | 6,996 (81.1%) | 457 (5.3%) |
| Total | 16,626 (73.8%) | 2,546 (11.3%) |
Employment Occupations by Sex in Gurabo Municipio
Management, Business, Science and Arts Occupations
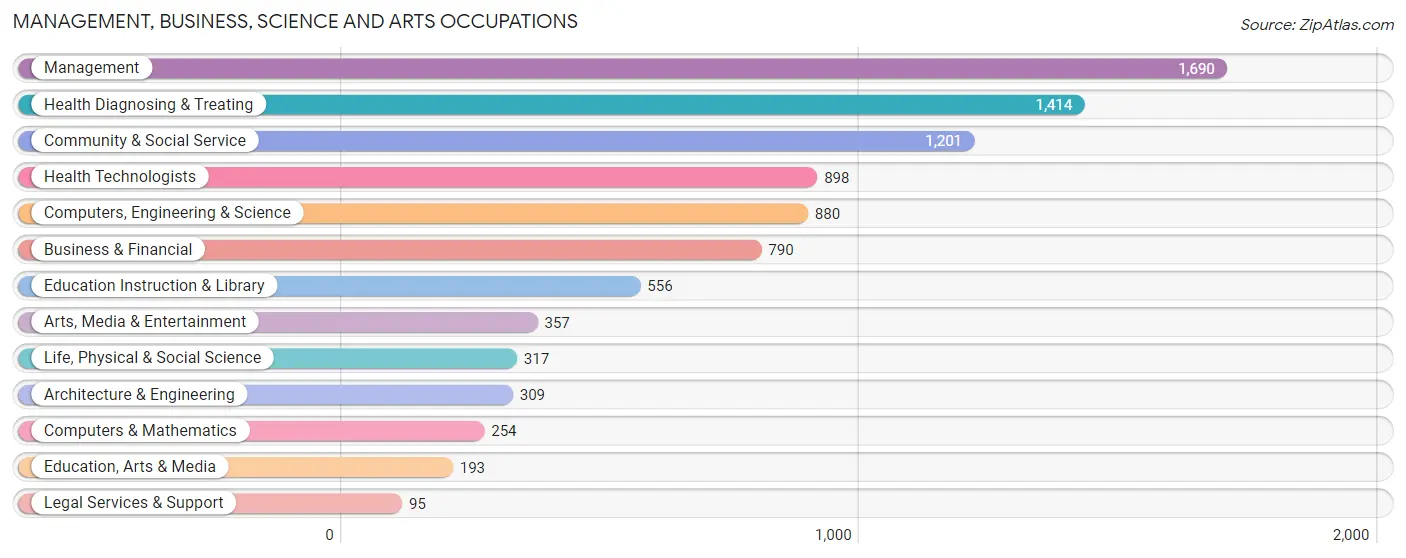
The most common Management, Business, Science and Arts occupations in Gurabo Municipio are Management (1,690 | 10.1%), Health Diagnosing & Treating (1,414 | 8.5%), Community & Social Service (1,201 | 7.2%), Health Technologists (898 | 5.4%), and Computers, Engineering & Science (880 | 5.3%).
Management, Business, Science and Arts Occupations by Sex
Within the Management, Business, Science and Arts occupations in Gurabo Municipio, the most male-oriented occupations are Computers & Mathematics (92.1%), Architecture & Engineering (80.6%), and Computers, Engineering & Science (64.5%), while the most female-oriented occupations are Health Technologists (78.5%), Health Diagnosing & Treating (75.4%), and Education Instruction & Library (74.1%).
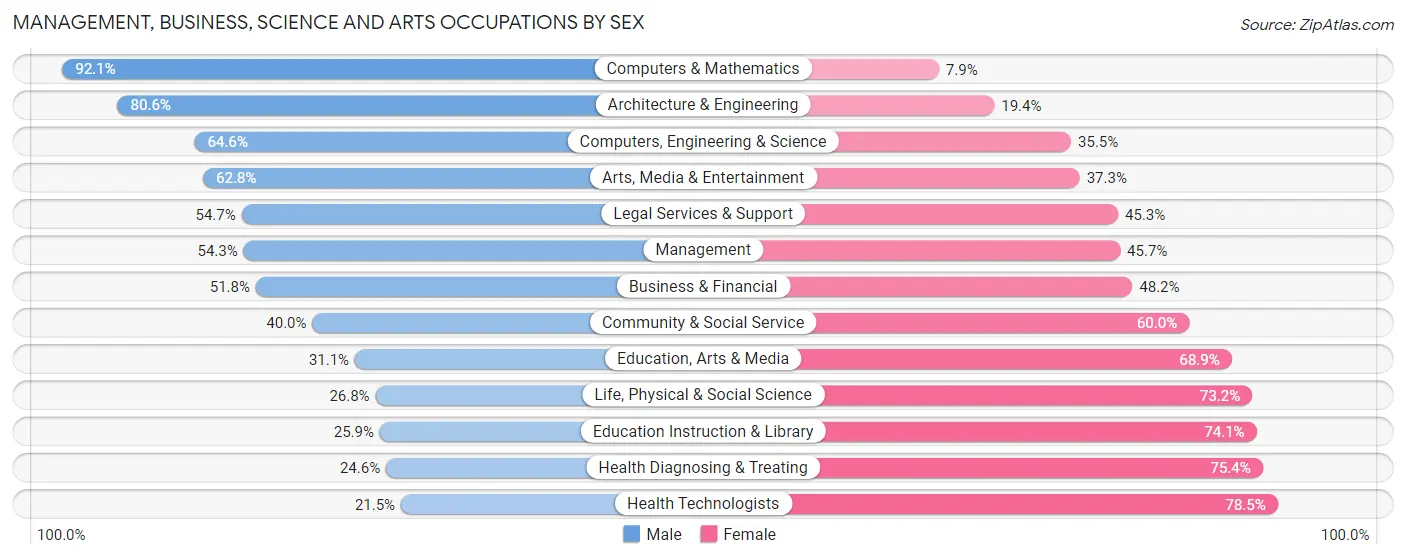
| Occupation | Male | Female |
| Management | 918 (54.3%) | 772 (45.7%) |
| Business & Financial | 409 (51.8%) | 381 (48.2%) |
| Computers, Engineering & Science | 568 (64.5%) | 312 (35.4%) |
| Computers & Mathematics | 234 (92.1%) | 20 (7.9%) |
| Architecture & Engineering | 249 (80.6%) | 60 (19.4%) |
| Life, Physical & Social Science | 85 (26.8%) | 232 (73.2%) |
| Community & Social Service | 480 (40.0%) | 721 (60.0%) |
| Education, Arts & Media | 60 (31.1%) | 133 (68.9%) |
| Legal Services & Support | 52 (54.7%) | 43 (45.3%) |
| Education Instruction & Library | 144 (25.9%) | 412 (74.1%) |
| Arts, Media & Entertainment | 224 (62.7%) | 133 (37.2%) |
| Health Diagnosing & Treating | 348 (24.6%) | 1,066 (75.4%) |
| Health Technologists | 193 (21.5%) | 705 (78.5%) |
| Total (Category) | 2,723 (45.6%) | 3,252 (54.4%) |
| Total (Overall) | 8,926 (53.5%) | 7,760 (46.5%) |
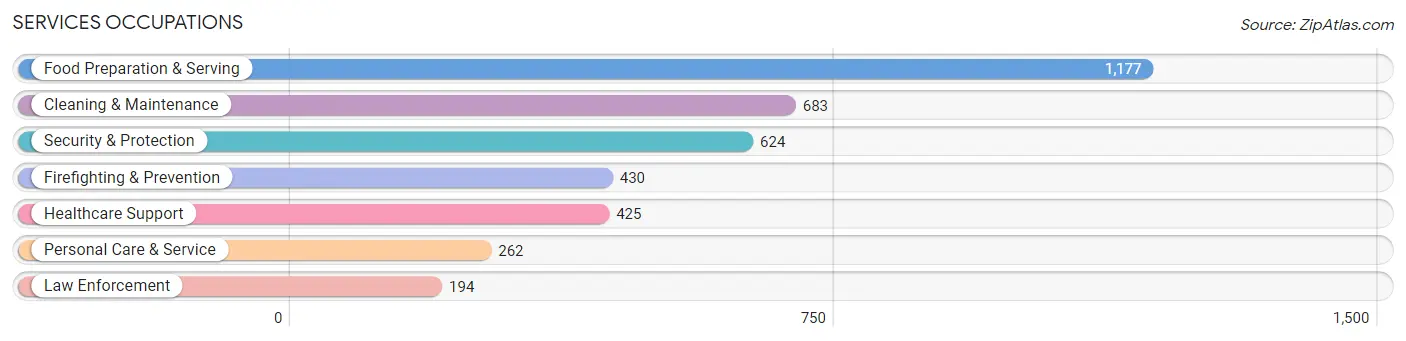
Services Occupations
The most common Services occupations in Gurabo Municipio are Food Preparation & Serving (1,177 | 7.0%), Cleaning & Maintenance (683 | 4.1%), Security & Protection (624 | 3.7%), Firefighting & Prevention (430 | 2.6%), and Healthcare Support (425 | 2.5%).
Services Occupations by Sex
Within the Services occupations in Gurabo Municipio, the most male-oriented occupations are Firefighting & Prevention (94.4%), Cleaning & Maintenance (87.1%), and Security & Protection (80.1%), while the most female-oriented occupations are Healthcare Support (96.0%), Law Enforcement (51.5%), and Food Preparation & Serving (49.4%).
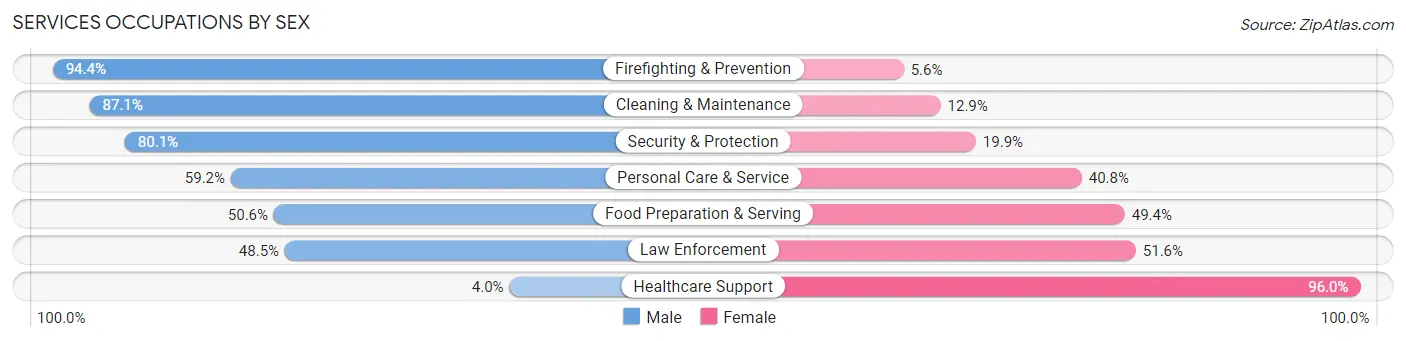
| Occupation | Male | Female |
| Healthcare Support | 17 (4.0%) | 408 (96.0%) |
| Security & Protection | 500 (80.1%) | 124 (19.9%) |
| Firefighting & Prevention | 406 (94.4%) | 24 (5.6%) |
| Law Enforcement | 94 (48.4%) | 100 (51.5%) |
| Food Preparation & Serving | 596 (50.6%) | 581 (49.4%) |
| Cleaning & Maintenance | 595 (87.1%) | 88 (12.9%) |
| Personal Care & Service | 155 (59.2%) | 107 (40.8%) |
| Total (Category) | 1,863 (58.8%) | 1,308 (41.2%) |
| Total (Overall) | 8,926 (53.5%) | 7,760 (46.5%) |
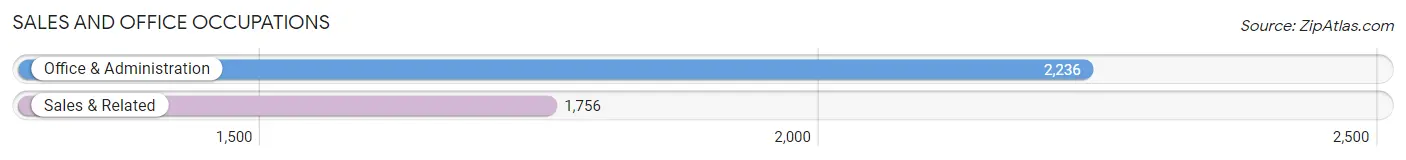
Sales and Office Occupations
The most common Sales and Office occupations in Gurabo Municipio are Office & Administration (2,236 | 13.4%), and Sales & Related (1,756 | 10.5%).
Sales and Office Occupations by Sex
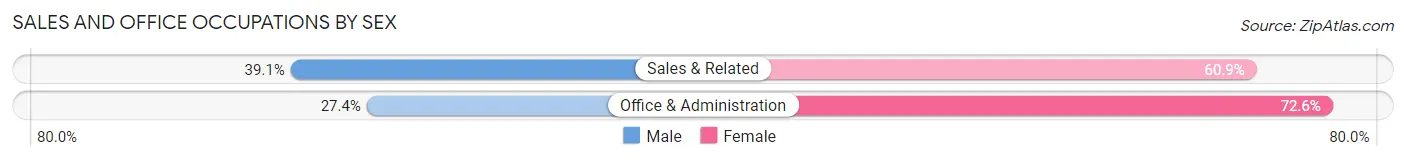
| Occupation | Male | Female |
| Sales & Related | 686 (39.1%) | 1,070 (60.9%) |
| Office & Administration | 612 (27.4%) | 1,624 (72.6%) |
| Total (Category) | 1,298 (32.5%) | 2,694 (67.5%) |
| Total (Overall) | 8,926 (53.5%) | 7,760 (46.5%) |
Natural Resources, Construction and Maintenance Occupations
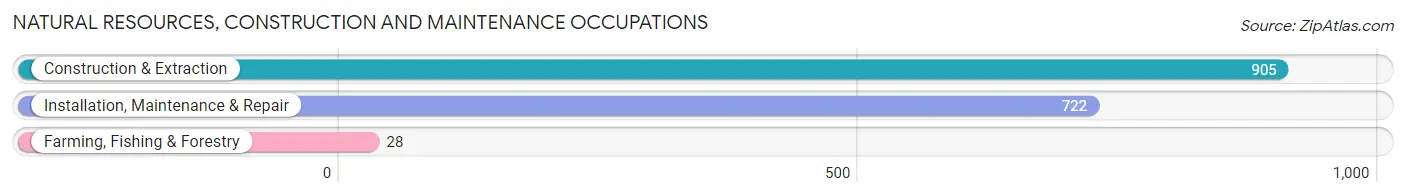
The most common Natural Resources, Construction and Maintenance occupations in Gurabo Municipio are Construction & Extraction (905 | 5.4%), Installation, Maintenance & Repair (722 | 4.3%), and Farming, Fishing & Forestry (28 | 0.2%).
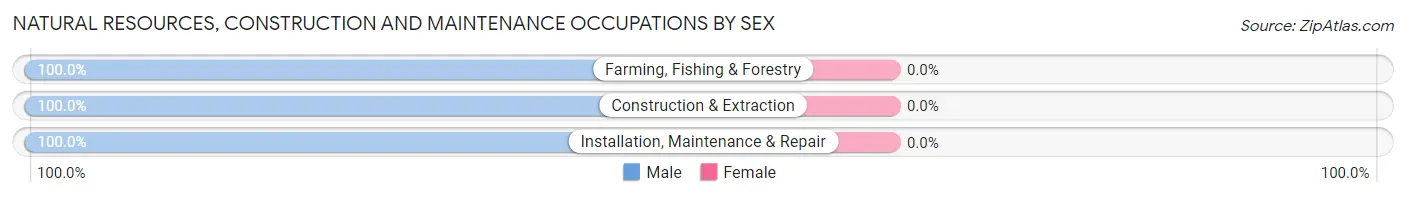
Natural Resources, Construction and Maintenance Occupations by Sex
| Occupation | Male | Female |
| Farming, Fishing & Forestry | 28 (100.0%) | 0 (0.0%) |
| Construction & Extraction | 905 (100.0%) | 0 (0.0%) |
| Installation, Maintenance & Repair | 722 (100.0%) | 0 (0.0%) |
| Total (Category) | 1,655 (100.0%) | 0 (0.0%) |
| Total (Overall) | 8,926 (53.5%) | 7,760 (46.5%) |
Production, Transportation and Moving Occupations
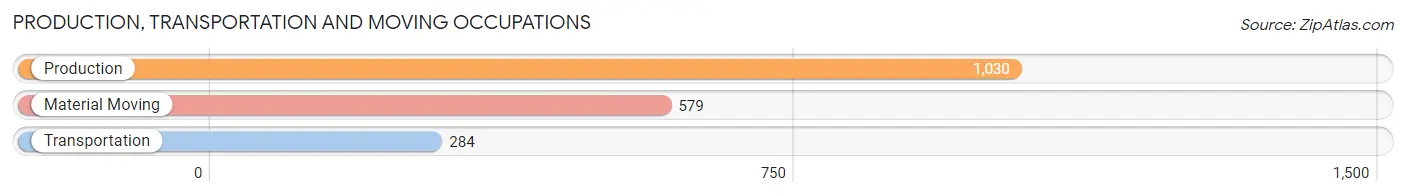
The most common Production, Transportation and Moving occupations in Gurabo Municipio are Production (1,030 | 6.2%), Material Moving (579 | 3.5%), and Transportation (284 | 1.7%).
Production, Transportation and Moving Occupations by Sex
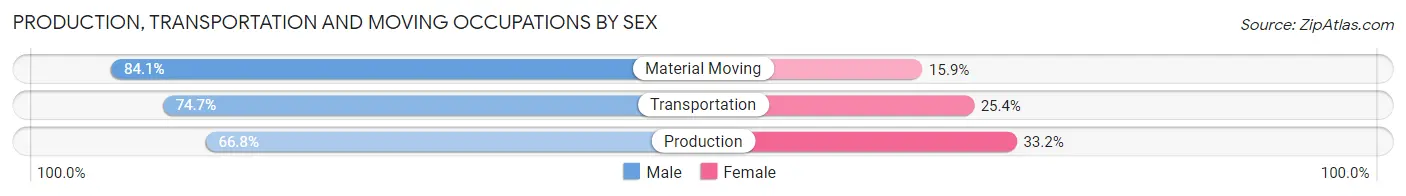
| Occupation | Male | Female |
| Production | 688 (66.8%) | 342 (33.2%) |
| Transportation | 212 (74.7%) | 72 (25.4%) |
| Material Moving | 487 (84.1%) | 92 (15.9%) |
| Total (Category) | 1,387 (73.3%) | 506 (26.7%) |
| Total (Overall) | 8,926 (53.5%) | 7,760 (46.5%) |
Employment Industries by Sex in Gurabo Municipio
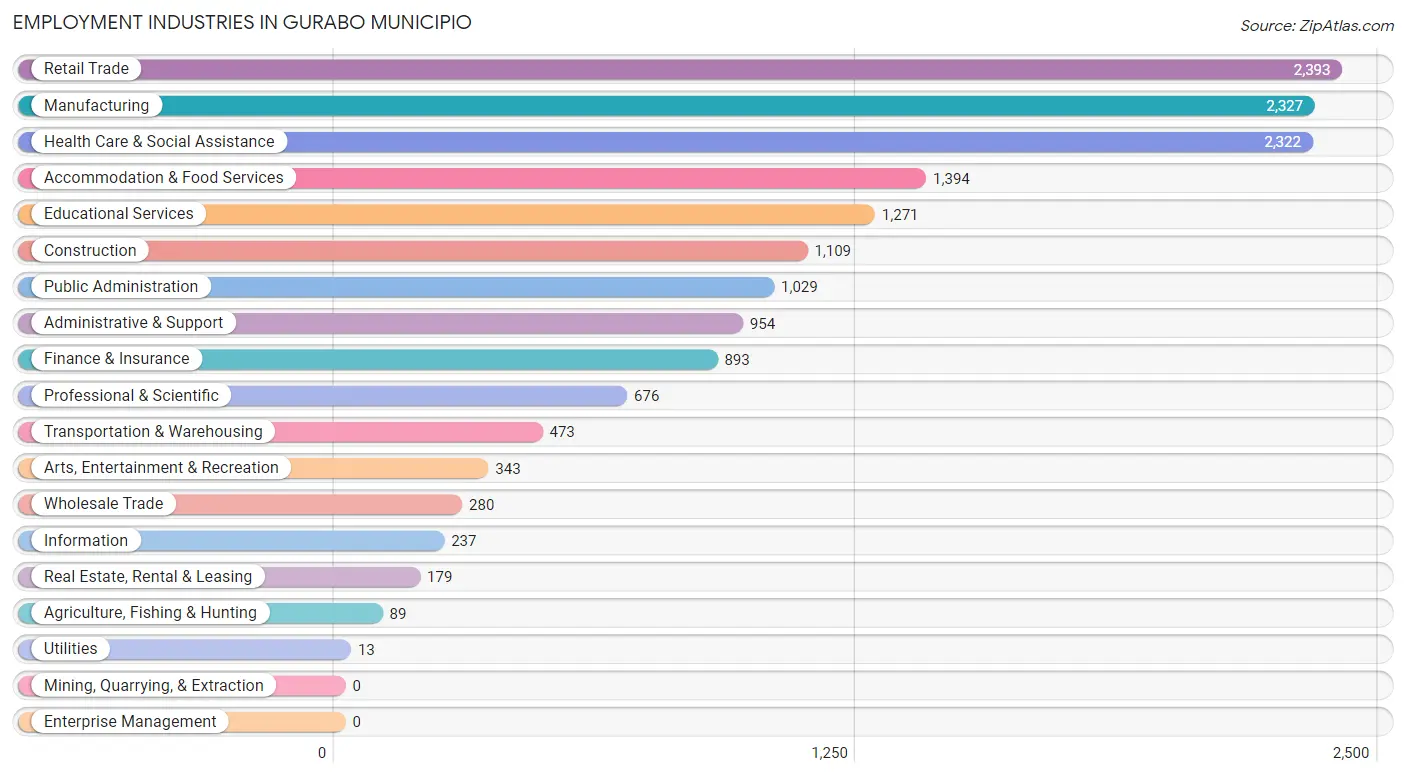
Employment Industries in Gurabo Municipio
The major employment industries in Gurabo Municipio include Retail Trade (2,393 | 14.3%), Manufacturing (2,327 | 14.0%), Health Care & Social Assistance (2,322 | 13.9%), Accommodation & Food Services (1,394 | 8.4%), and Educational Services (1,271 | 7.6%).
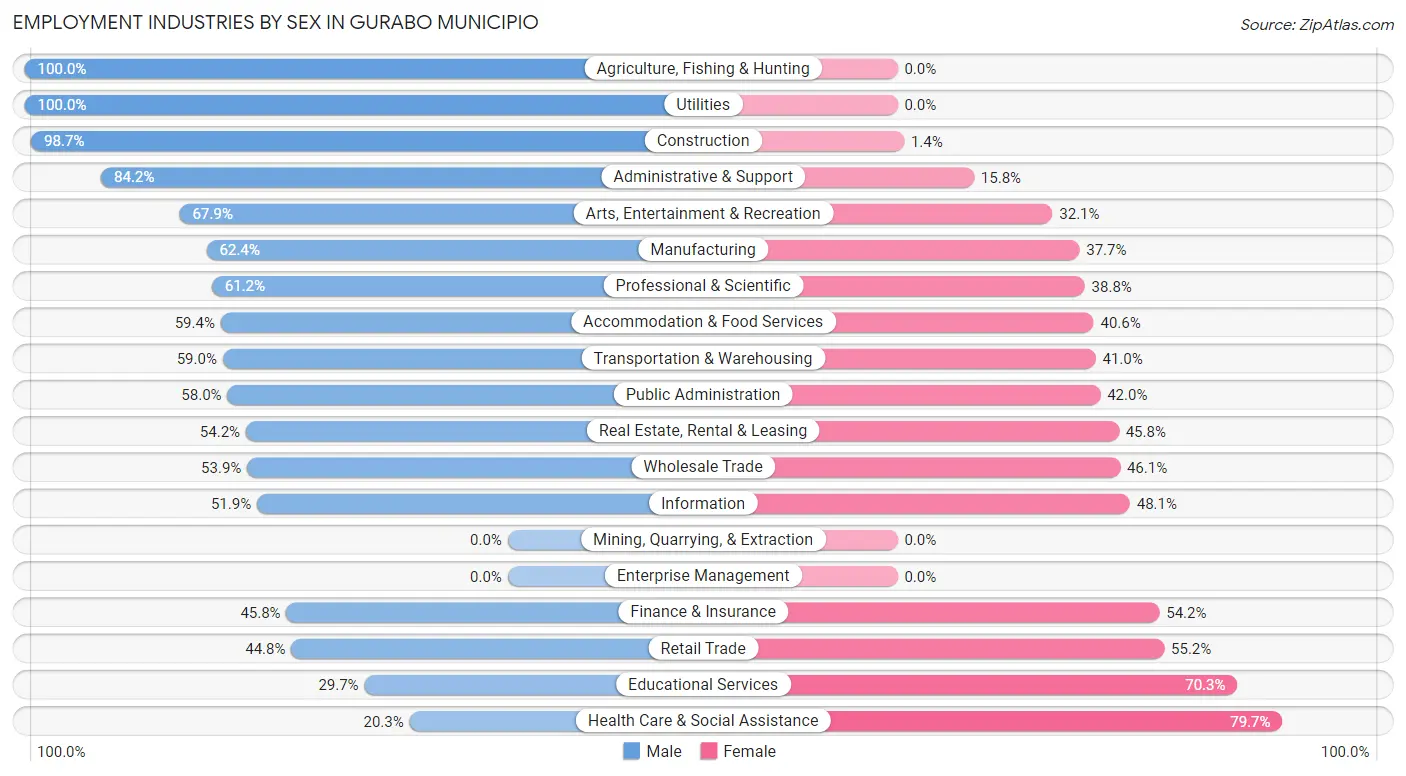
Employment Industries by Sex in Gurabo Municipio
The Gurabo Municipio industries that see more men than women are Agriculture, Fishing & Hunting (100.0%), Utilities (100.0%), and Construction (98.7%), whereas the industries that tend to have a higher number of women are Health Care & Social Assistance (79.7%), Educational Services (70.3%), and Retail Trade (55.2%).
| Industry | Male | Female |
| Agriculture, Fishing & Hunting | 89 (100.0%) | 0 (0.0%) |
| Mining, Quarrying, & Extraction | 0 (0.0%) | 0 (0.0%) |
| Construction | 1,094 (98.7%) | 15 (1.3%) |
| Manufacturing | 1,451 (62.4%) | 876 (37.7%) |
| Wholesale Trade | 151 (53.9%) | 129 (46.1%) |
| Retail Trade | 1,072 (44.8%) | 1,321 (55.2%) |
| Transportation & Warehousing | 279 (59.0%) | 194 (41.0%) |
| Utilities | 13 (100.0%) | 0 (0.0%) |
| Information | 123 (51.9%) | 114 (48.1%) |
| Finance & Insurance | 409 (45.8%) | 484 (54.2%) |
| Real Estate, Rental & Leasing | 97 (54.2%) | 82 (45.8%) |
| Professional & Scientific | 414 (61.2%) | 262 (38.8%) |
| Enterprise Management | 0 (0.0%) | 0 (0.0%) |
| Administrative & Support | 803 (84.2%) | 151 (15.8%) |
| Educational Services | 377 (29.7%) | 894 (70.3%) |
| Health Care & Social Assistance | 472 (20.3%) | 1,850 (79.7%) |
| Arts, Entertainment & Recreation | 233 (67.9%) | 110 (32.1%) |
| Accommodation & Food Services | 828 (59.4%) | 566 (40.6%) |
| Public Administration | 597 (58.0%) | 432 (42.0%) |
| Total | 8,926 (53.5%) | 7,760 (46.5%) |
Education in Gurabo Municipio
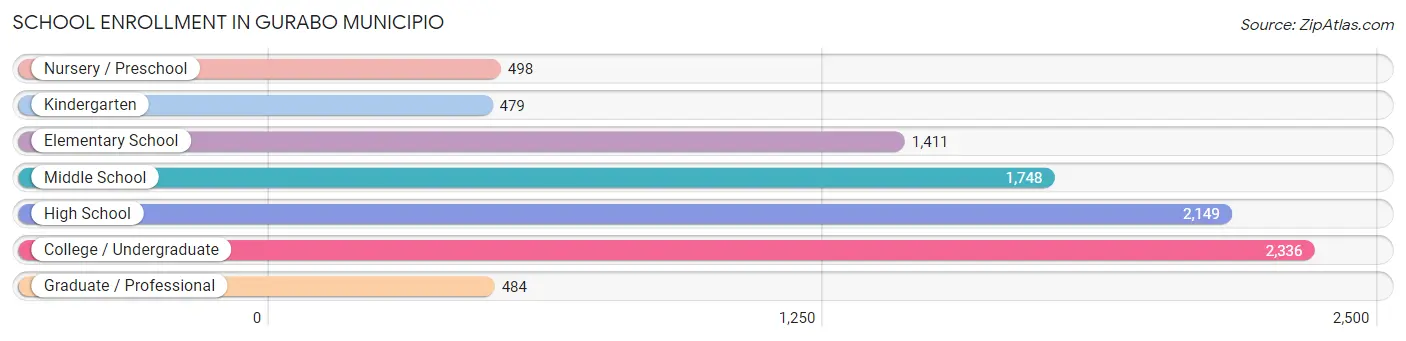
School Enrollment in Gurabo Municipio
The most common levels of schooling among the 9,105 students in Gurabo Municipio are college / undergraduate (2,336 | 25.7%), high school (2,149 | 23.6%), and middle school (1,748 | 19.2%).
| School Level | # Students | % Students |
| Nursery / Preschool | 498 | 5.5% |
| Kindergarten | 479 | 5.3% |
| Elementary School | 1,411 | 15.5% |
| Middle School | 1,748 | 19.2% |
| High School | 2,149 | 23.6% |
| College / Undergraduate | 2,336 | 25.7% |
| Graduate / Professional | 484 | 5.3% |
| Total | 9,105 | 100.0% |
School Enrollment by Age by Funding Source in Gurabo Municipio
Out of a total of 9,105 students who are enrolled in schools in Gurabo Municipio, 4,343 (47.7%) attend a private institution, while the remaining 4,762 (52.3%) are enrolled in public schools. The age group of 25 to 34 year olds has the highest likelihood of being enrolled in private schools, with 414 (86.1% in the age bracket) enrolled. Conversely, the age group of 18 to 19 year olds has the lowest likelihood of being enrolled in a private school, with 455 (67.9% in the age bracket) attending a public institution.
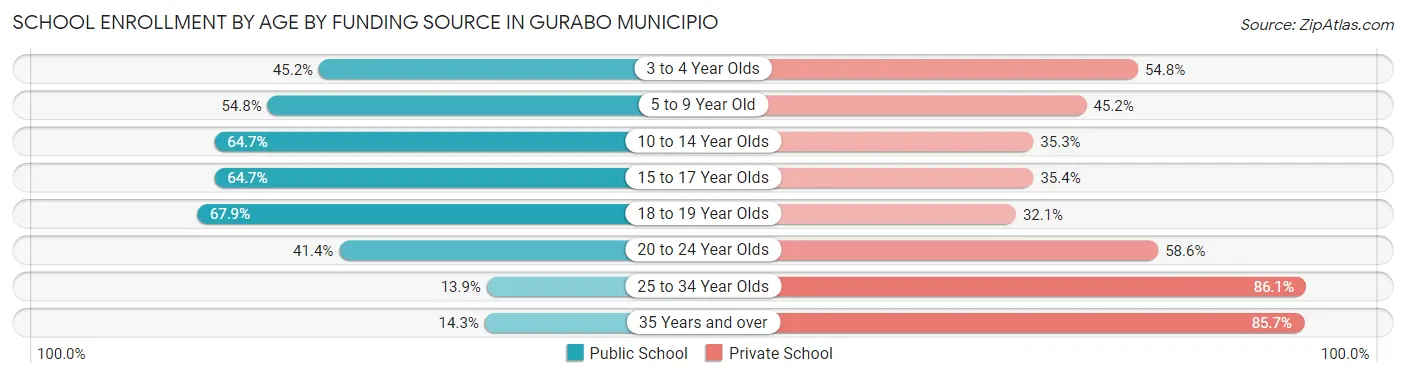
| Age Bracket | Public School | Private School |
| 3 to 4 Year Olds | 192 (45.2%) | 233 (54.8%) |
| 5 to 9 Year Old | 983 (54.8%) | 812 (45.2%) |
| 10 to 14 Year Olds | 1,462 (64.7%) | 799 (35.3%) |
| 15 to 17 Year Olds | 949 (64.6%) | 519 (35.3%) |
| 18 to 19 Year Olds | 455 (67.9%) | 215 (32.1%) |
| 20 to 24 Year Olds | 564 (41.4%) | 798 (58.6%) |
| 25 to 34 Year Olds | 67 (13.9%) | 414 (86.1%) |
| 35 Years and over | 92 (14.3%) | 551 (85.7%) |
| Total | 4,762 (52.3%) | 4,343 (47.7%) |
Educational Attainment by Field of Study in Gurabo Municipio
Business (2,959 | 27.7%), science & technology (1,685 | 15.8%), physical & health sciences (1,010 | 9.4%), education (912 | 8.5%), and engineering (893 | 8.4%) are the most common fields of study among 10,701 individuals in Gurabo Municipio who have obtained a bachelor's degree or higher.
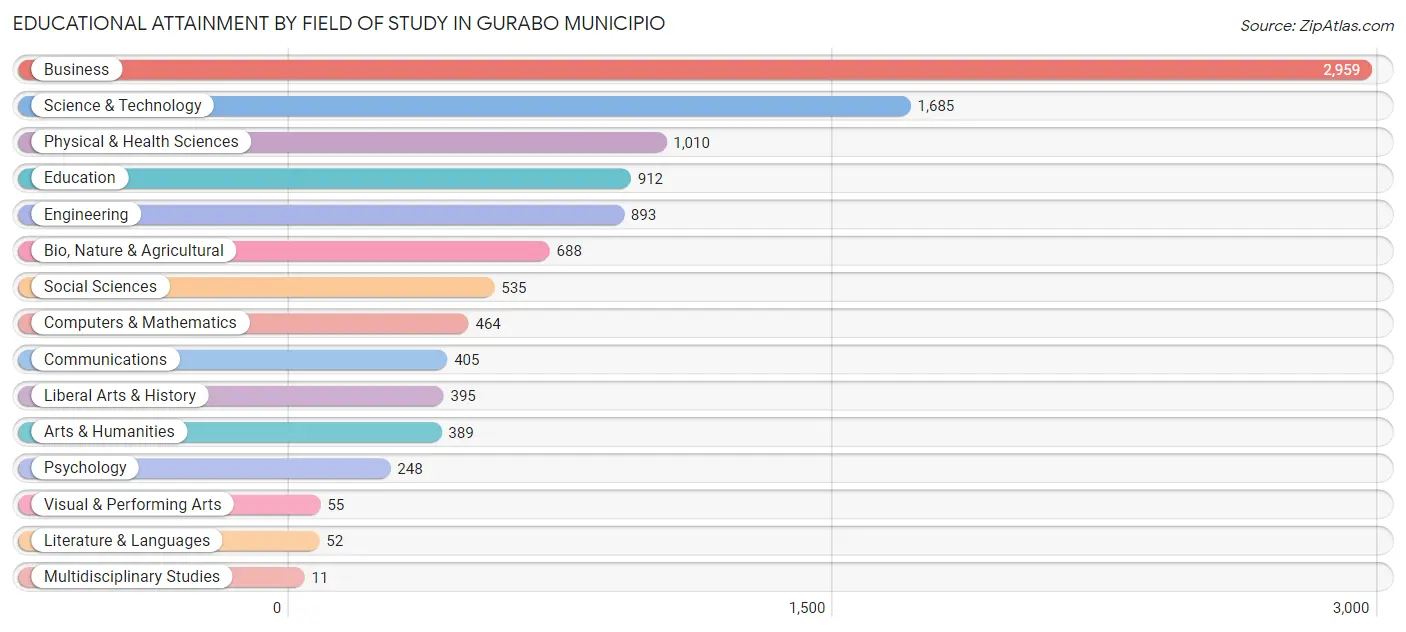
| Field of Study | # Graduates | % Graduates |
| Computers & Mathematics | 464 | 4.3% |
| Bio, Nature & Agricultural | 688 | 6.4% |
| Physical & Health Sciences | 1,010 | 9.4% |
| Psychology | 248 | 2.3% |
| Social Sciences | 535 | 5.0% |
| Engineering | 893 | 8.4% |
| Multidisciplinary Studies | 11 | 0.1% |
| Science & Technology | 1,685 | 15.8% |
| Business | 2,959 | 27.7% |
| Education | 912 | 8.5% |
| Literature & Languages | 52 | 0.5% |
| Liberal Arts & History | 395 | 3.7% |
| Visual & Performing Arts | 55 | 0.5% |
| Communications | 405 | 3.8% |
| Arts & Humanities | 389 | 3.6% |
| Total | 10,701 | 100.0% |
Transportation & Commute in Gurabo Municipio
Vehicle Availability by Sex in Gurabo Municipio
The most prevalent vehicle ownership categories in Gurabo Municipio are males with 2 vehicles (3,803, accounting for 43.5%) and females with 2 vehicles (2,958, making up 49.7%).
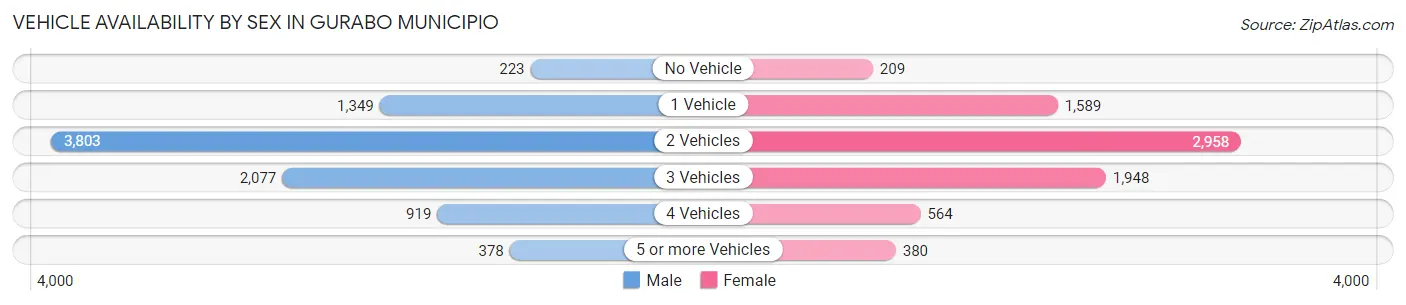
| Vehicles Available | Male | Female |
| No Vehicle | 223 (2.5%) | 209 (2.7%) |
| 1 Vehicle | 1,349 (15.4%) | 1,589 (20.8%) |
| 2 Vehicles | 3,803 (43.5%) | 2,958 (38.7%) |
| 3 Vehicles | 2,077 (23.7%) | 1,948 (25.5%) |
| 4 Vehicles | 919 (10.5%) | 564 (7.4%) |
| 5 or more Vehicles | 378 (4.3%) | 380 (5.0%) |
| Total | 8,749 (100.0%) | 7,648 (100.0%) |
Commute Time in Gurabo Municipio
The most frequently occuring commute durations in Gurabo Municipio are 60 to 89 minutes (2,242 commuters, 14.6%), 15 to 19 minutes (2,170 commuters, 14.2%), and 45 to 59 minutes (2,120 commuters, 13.9%).
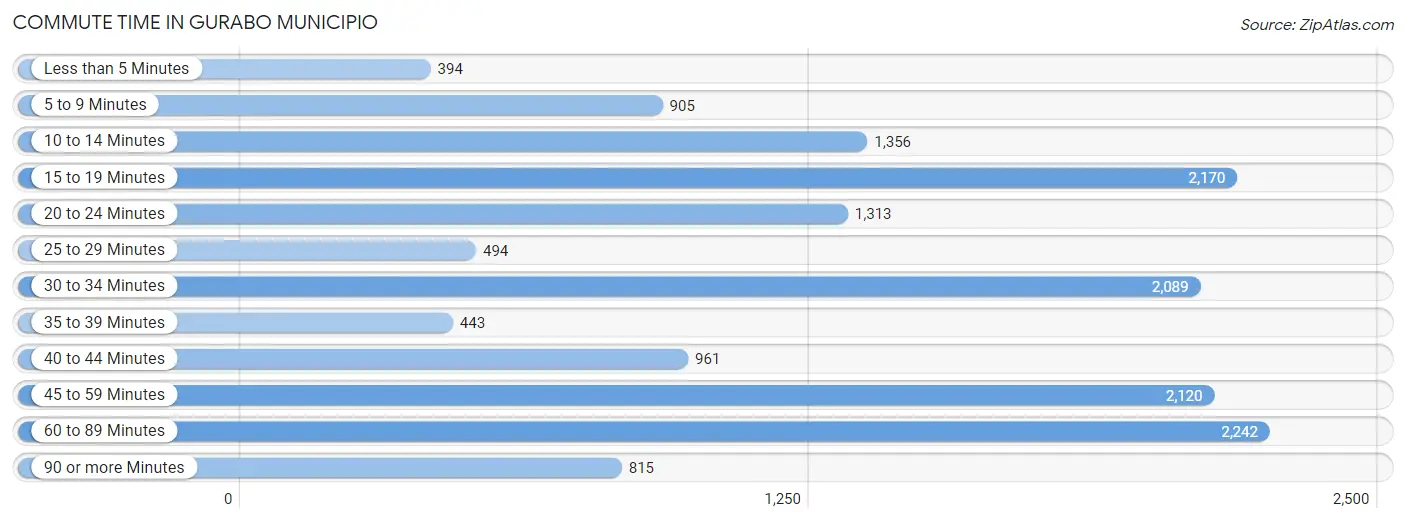
| Commute Time | # Commuters | % Commuters |
| Less than 5 Minutes | 394 | 2.6% |
| 5 to 9 Minutes | 905 | 5.9% |
| 10 to 14 Minutes | 1,356 | 8.9% |
| 15 to 19 Minutes | 2,170 | 14.2% |
| 20 to 24 Minutes | 1,313 | 8.6% |
| 25 to 29 Minutes | 494 | 3.2% |
| 30 to 34 Minutes | 2,089 | 13.7% |
| 35 to 39 Minutes | 443 | 2.9% |
| 40 to 44 Minutes | 961 | 6.3% |
| 45 to 59 Minutes | 2,120 | 13.9% |
| 60 to 89 Minutes | 2,242 | 14.6% |
| 90 or more Minutes | 815 | 5.3% |
Commute Time by Sex in Gurabo Municipio
The most common commute times in Gurabo Municipio are 15 to 19 minutes (1,405 commuters, 16.8%) for males and 45 to 59 minutes (1,092 commuters, 15.7%) for females.
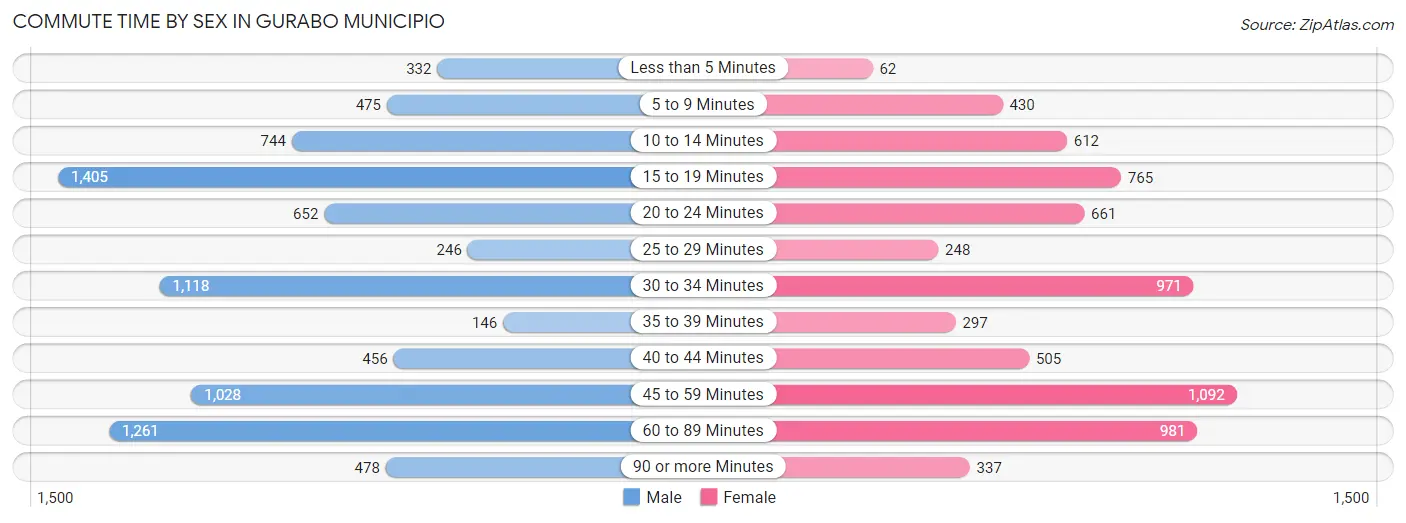
| Commute Time | Male | Female |
| Less than 5 Minutes | 332 (4.0%) | 62 (0.9%) |
| 5 to 9 Minutes | 475 (5.7%) | 430 (6.2%) |
| 10 to 14 Minutes | 744 (8.9%) | 612 (8.8%) |
| 15 to 19 Minutes | 1,405 (16.8%) | 765 (11.0%) |
| 20 to 24 Minutes | 652 (7.8%) | 661 (9.5%) |
| 25 to 29 Minutes | 246 (2.9%) | 248 (3.6%) |
| 30 to 34 Minutes | 1,118 (13.4%) | 971 (14.0%) |
| 35 to 39 Minutes | 146 (1.8%) | 297 (4.3%) |
| 40 to 44 Minutes | 456 (5.5%) | 505 (7.2%) |
| 45 to 59 Minutes | 1,028 (12.3%) | 1,092 (15.7%) |
| 60 to 89 Minutes | 1,261 (15.1%) | 981 (14.1%) |
| 90 or more Minutes | 478 (5.7%) | 337 (4.8%) |
Time of Departure to Work by Sex in Gurabo Municipio
The most frequent times of departure to work in Gurabo Municipio are 6:00 AM to 6:29 AM (1,266, 15.2%) for males and 6:00 AM to 6:29 AM (1,458, 20.9%) for females.
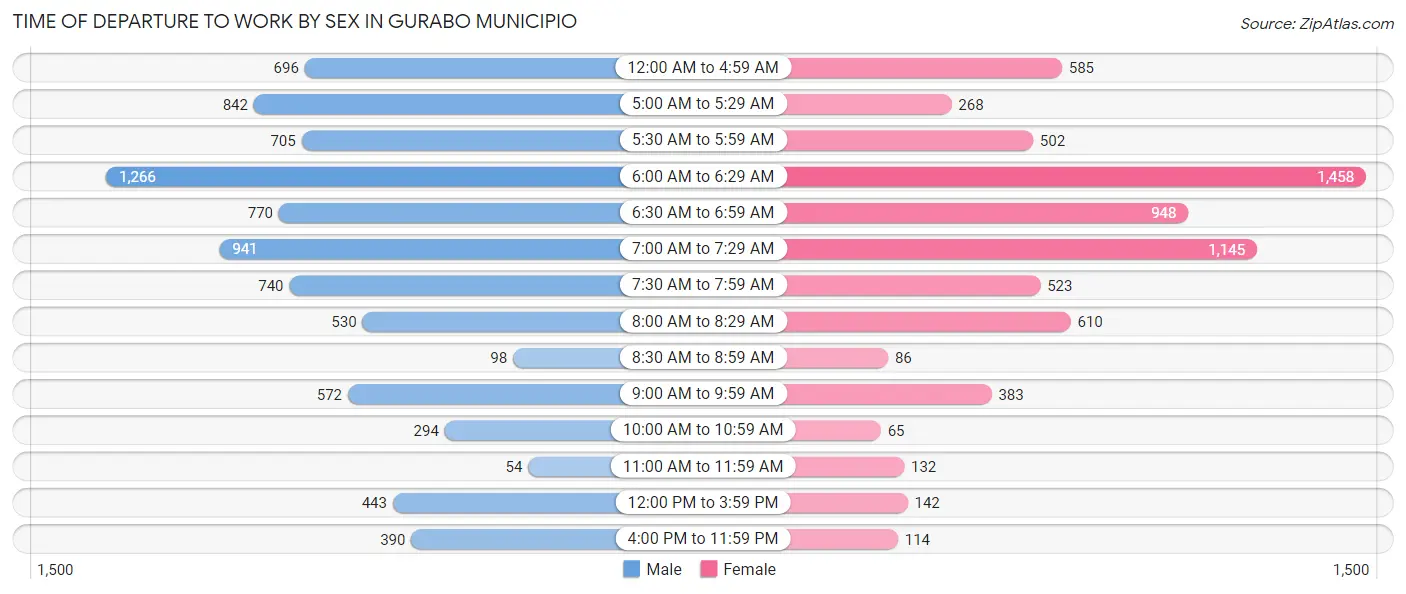
| Time of Departure | Male | Female |
| 12:00 AM to 4:59 AM | 696 (8.3%) | 585 (8.4%) |
| 5:00 AM to 5:29 AM | 842 (10.1%) | 268 (3.8%) |
| 5:30 AM to 5:59 AM | 705 (8.5%) | 502 (7.2%) |
| 6:00 AM to 6:29 AM | 1,266 (15.2%) | 1,458 (20.9%) |
| 6:30 AM to 6:59 AM | 770 (9.2%) | 948 (13.6%) |
| 7:00 AM to 7:29 AM | 941 (11.3%) | 1,145 (16.5%) |
| 7:30 AM to 7:59 AM | 740 (8.9%) | 523 (7.5%) |
| 8:00 AM to 8:29 AM | 530 (6.4%) | 610 (8.8%) |
| 8:30 AM to 8:59 AM | 98 (1.2%) | 86 (1.2%) |
| 9:00 AM to 9:59 AM | 572 (6.9%) | 383 (5.5%) |
| 10:00 AM to 10:59 AM | 294 (3.5%) | 65 (0.9%) |
| 11:00 AM to 11:59 AM | 54 (0.6%) | 132 (1.9%) |
| 12:00 PM to 3:59 PM | 443 (5.3%) | 142 (2.0%) |
| 4:00 PM to 11:59 PM | 390 (4.7%) | 114 (1.6%) |
| Total | 8,341 (100.0%) | 6,961 (100.0%) |
Housing Occupancy in Gurabo Municipio
Occupancy by Ownership in Gurabo Municipio
Of the total 14,850 dwellings in Gurabo Municipio, owner-occupied units account for 11,429 (77.0%), while renter-occupied units make up 3,421 (23.0%).
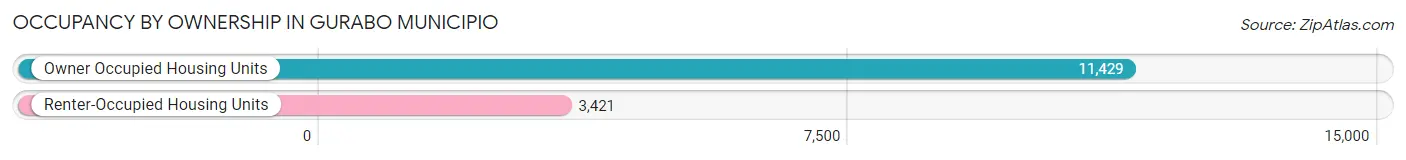
| Occupancy | # Housing Units | % Housing Units |
| Owner Occupied Housing Units | 11,429 | 77.0% |
| Renter-Occupied Housing Units | 3,421 | 23.0% |
| Total Occupied Housing Units | 14,850 | 100.0% |
Occupancy by Household Size in Gurabo Municipio
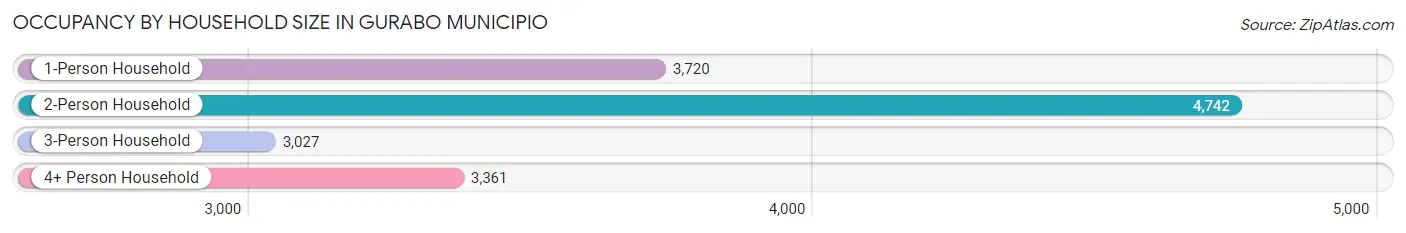
| Household Size | # Housing Units | % Housing Units |
| 1-Person Household | 3,720 | 25.1% |
| 2-Person Household | 4,742 | 31.9% |
| 3-Person Household | 3,027 | 20.4% |
| 4+ Person Household | 3,361 | 22.6% |
| Total Housing Units | 14,850 | 100.0% |
Occupancy by Ownership by Household Size in Gurabo Municipio
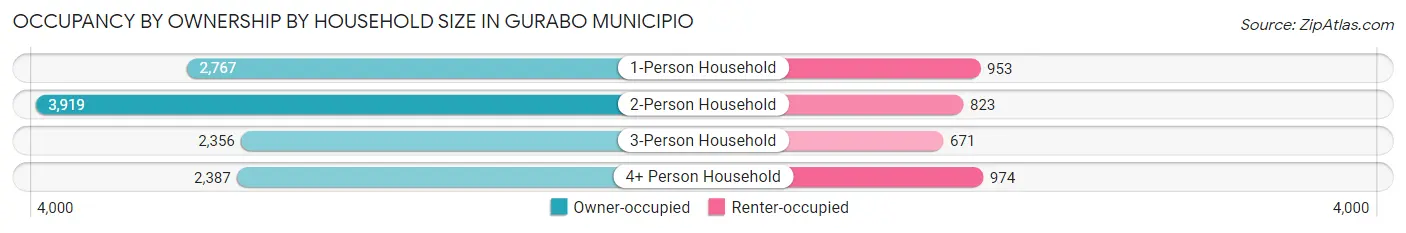
| Household Size | Owner-occupied | Renter-occupied |
| 1-Person Household | 2,767 (74.4%) | 953 (25.6%) |
| 2-Person Household | 3,919 (82.6%) | 823 (17.4%) |
| 3-Person Household | 2,356 (77.8%) | 671 (22.2%) |
| 4+ Person Household | 2,387 (71.0%) | 974 (29.0%) |
| Total Housing Units | 11,429 (77.0%) | 3,421 (23.0%) |
Occupancy by Educational Attainment in Gurabo Municipio
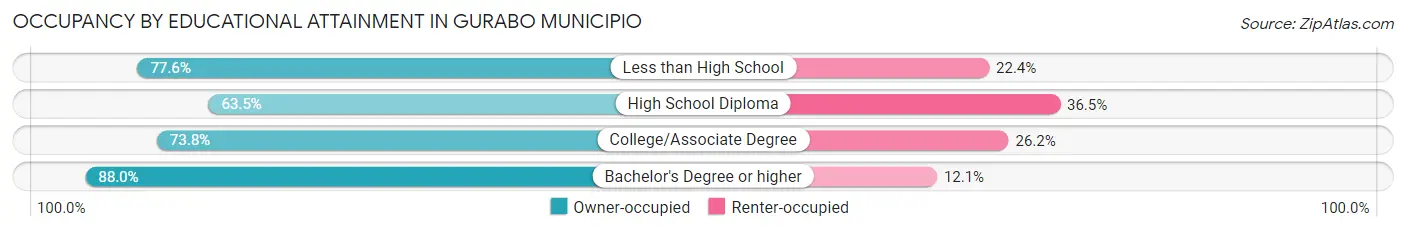
| Household Size | Owner-occupied | Renter-occupied |
| Less than High School | 1,861 (77.6%) | 537 (22.4%) |
| High School Diploma | 2,252 (63.5%) | 1,292 (36.5%) |
| College/Associate Degree | 2,696 (73.8%) | 959 (26.2%) |
| Bachelor's Degree or higher | 4,620 (87.9%) | 633 (12.0%) |
Occupancy by Age of Householder in Gurabo Municipio
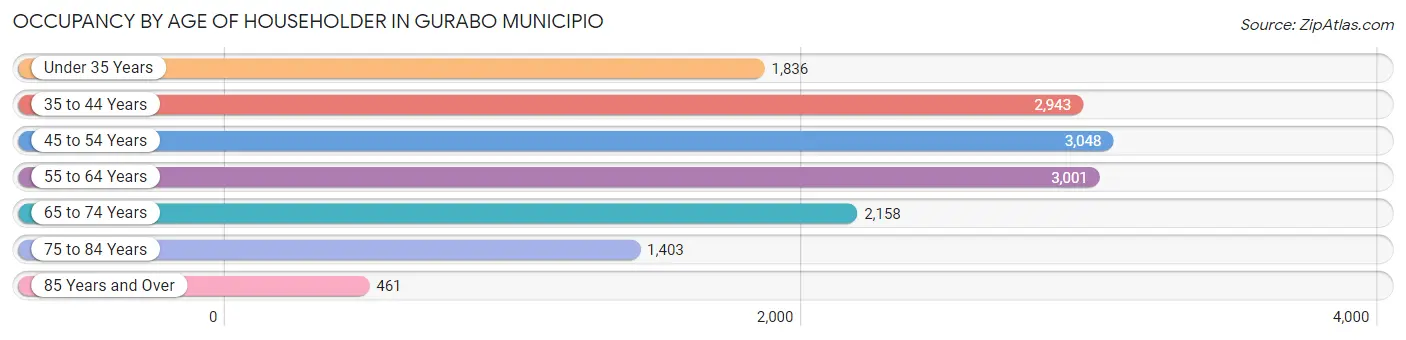
| Age Bracket | # Households | % Households |
| Under 35 Years | 1,836 | 12.4% |
| 35 to 44 Years | 2,943 | 19.8% |
| 45 to 54 Years | 3,048 | 20.5% |
| 55 to 64 Years | 3,001 | 20.2% |
| 65 to 74 Years | 2,158 | 14.5% |
| 75 to 84 Years | 1,403 | 9.5% |
| 85 Years and Over | 461 | 3.1% |
| Total | 14,850 | 100.0% |
Housing Finances in Gurabo Municipio
Median Income by Occupancy in Gurabo Municipio
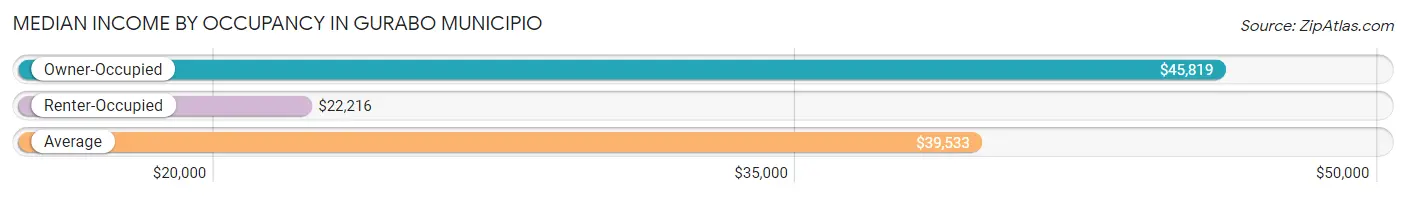
| Occupancy Type | # Households | Median Income |
| Owner-Occupied | 11,429 (77.0%) | $45,819 |
| Renter-Occupied | 3,421 (23.0%) | $22,216 |
| Average | 14,850 (100.0%) | $39,533 |
Occupancy by Householder Income Bracket in Gurabo Municipio
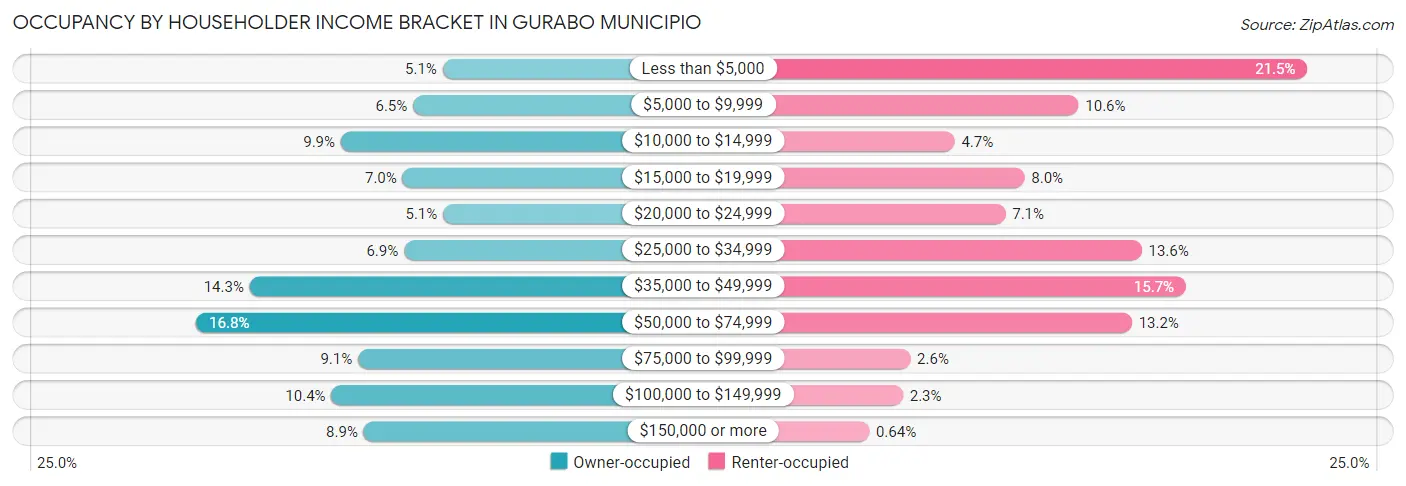
| Income Bracket | Owner-occupied | Renter-occupied |
| Less than $5,000 | 582 (5.1%) | 736 (21.5%) |
| $5,000 to $9,999 | 743 (6.5%) | 363 (10.6%) |
| $10,000 to $14,999 | 1,136 (9.9%) | 161 (4.7%) |
| $15,000 to $19,999 | 800 (7.0%) | 275 (8.0%) |
| $20,000 to $24,999 | 580 (5.1%) | 244 (7.1%) |
| $25,000 to $34,999 | 792 (6.9%) | 466 (13.6%) |
| $35,000 to $49,999 | 1,632 (14.3%) | 538 (15.7%) |
| $50,000 to $74,999 | 1,923 (16.8%) | 450 (13.2%) |
| $75,000 to $99,999 | 1,042 (9.1%) | 89 (2.6%) |
| $100,000 to $149,999 | 1,188 (10.4%) | 77 (2.2%) |
| $150,000 or more | 1,011 (8.8%) | 22 (0.6%) |
| Total | 11,429 (100.0%) | 3,421 (100.0%) |
Monthly Housing Cost Tiers in Gurabo Municipio
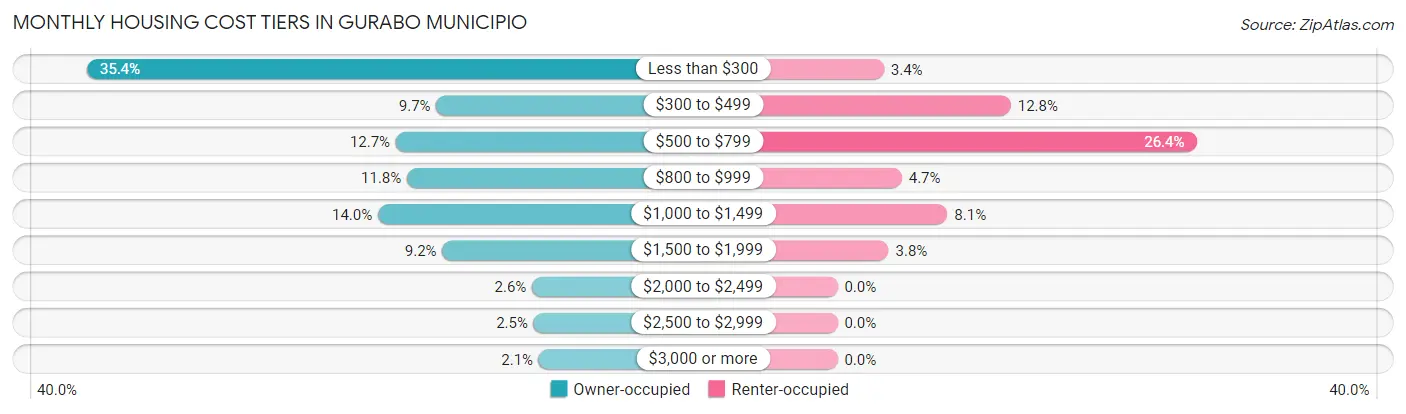
| Monthly Cost | Owner-occupied | Renter-occupied |
| Less than $300 | 4,047 (35.4%) | 117 (3.4%) |
| $300 to $499 | 1,105 (9.7%) | 437 (12.8%) |
| $500 to $799 | 1,446 (12.7%) | 904 (26.4%) |
| $800 to $999 | 1,352 (11.8%) | 162 (4.7%) |
| $1,000 to $1,499 | 1,597 (14.0%) | 277 (8.1%) |
| $1,500 to $1,999 | 1,055 (9.2%) | 129 (3.8%) |
| $2,000 to $2,499 | 299 (2.6%) | 0 (0.0%) |
| $2,500 to $2,999 | 286 (2.5%) | 0 (0.0%) |
| $3,000 or more | 242 (2.1%) | 0 (0.0%) |
| Total | 11,429 (100.0%) | 3,421 (100.0%) |
Physical Housing Characteristics in Gurabo Municipio
Housing Structures in Gurabo Municipio
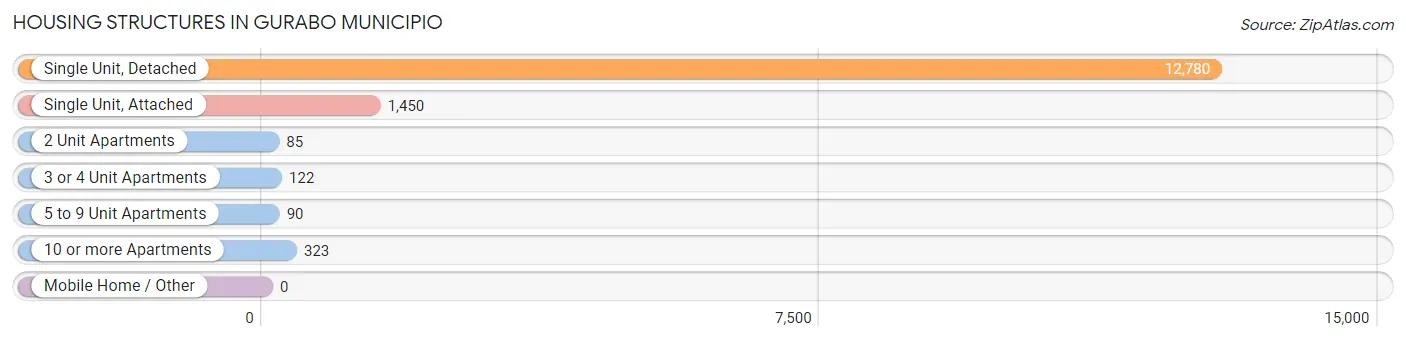
| Structure Type | # Housing Units | % Housing Units |
| Single Unit, Detached | 12,780 | 86.1% |
| Single Unit, Attached | 1,450 | 9.8% |
| 2 Unit Apartments | 85 | 0.6% |
| 3 or 4 Unit Apartments | 122 | 0.8% |
| 5 to 9 Unit Apartments | 90 | 0.6% |
| 10 or more Apartments | 323 | 2.2% |
| Mobile Home / Other | 0 | 0.0% |
| Total | 14,850 | 100.0% |
Housing Structures by Occupancy in Gurabo Municipio
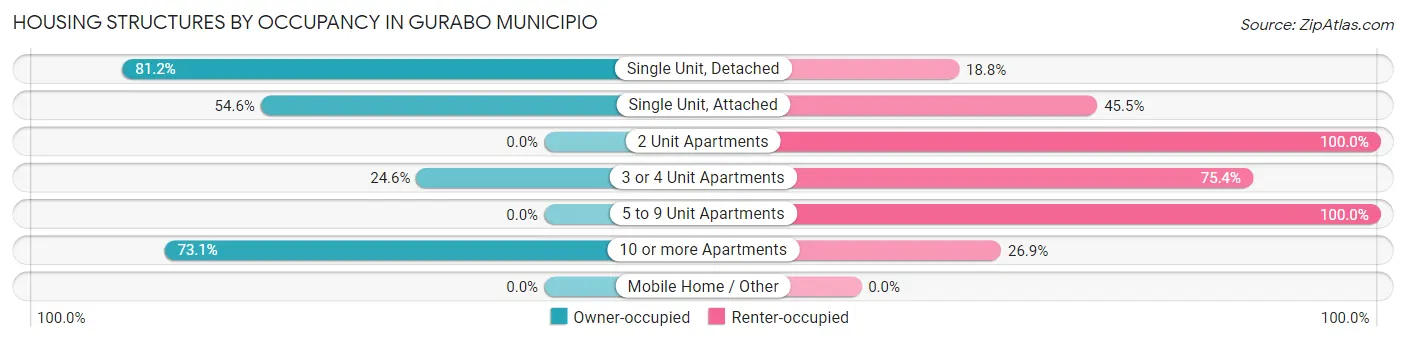
| Structure Type | Owner-occupied | Renter-occupied |
| Single Unit, Detached | 10,372 (81.2%) | 2,408 (18.8%) |
| Single Unit, Attached | 791 (54.5%) | 659 (45.5%) |
| 2 Unit Apartments | 0 (0.0%) | 85 (100.0%) |
| 3 or 4 Unit Apartments | 30 (24.6%) | 92 (75.4%) |
| 5 to 9 Unit Apartments | 0 (0.0%) | 90 (100.0%) |
| 10 or more Apartments | 236 (73.1%) | 87 (26.9%) |
| Mobile Home / Other | 0 (0.0%) | 0 (0.0%) |
| Total | 11,429 (77.0%) | 3,421 (23.0%) |
Housing Structures by Number of Rooms in Gurabo Municipio
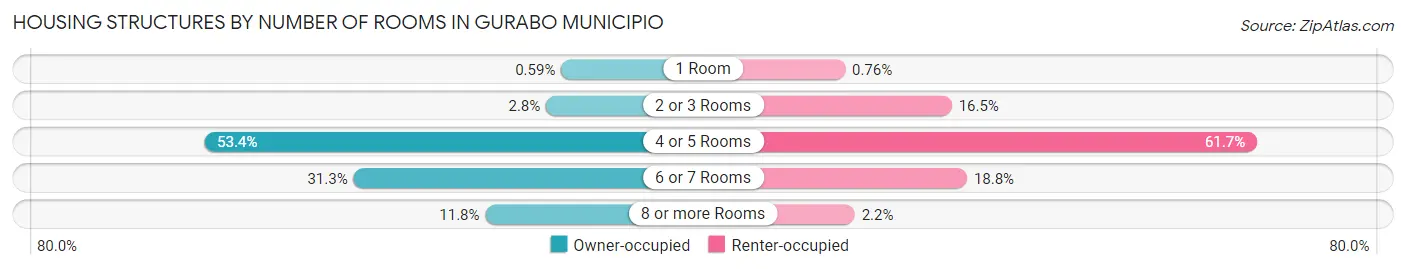
| Number of Rooms | Owner-occupied | Renter-occupied |
| 1 Room | 67 (0.6%) | 26 (0.8%) |
| 2 or 3 Rooms | 323 (2.8%) | 566 (16.5%) |
| 4 or 5 Rooms | 6,107 (53.4%) | 2,111 (61.7%) |
| 6 or 7 Rooms | 3,581 (31.3%) | 643 (18.8%) |
| 8 or more Rooms | 1,351 (11.8%) | 75 (2.2%) |
| Total | 11,429 (100.0%) | 3,421 (100.0%) |
Housing Structure by Heating Type in Gurabo Municipio
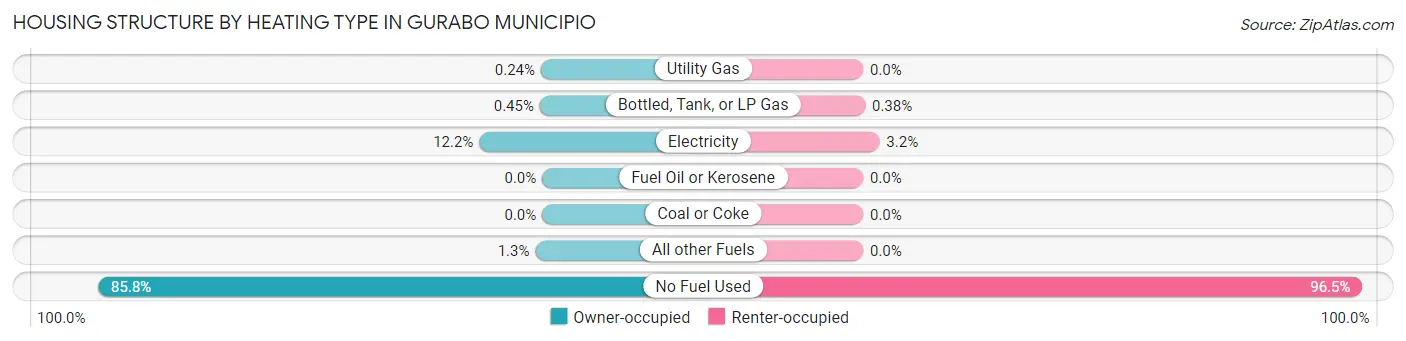
| Heating Type | Owner-occupied | Renter-occupied |
| Utility Gas | 27 (0.2%) | 0 (0.0%) |
| Bottled, Tank, or LP Gas | 52 (0.4%) | 13 (0.4%) |
| Electricity | 1,390 (12.2%) | 108 (3.2%) |
| Fuel Oil or Kerosene | 0 (0.0%) | 0 (0.0%) |
| Coal or Coke | 0 (0.0%) | 0 (0.0%) |
| All other Fuels | 151 (1.3%) | 0 (0.0%) |
| No Fuel Used | 9,809 (85.8%) | 3,300 (96.5%) |
| Total | 11,429 (100.0%) | 3,421 (100.0%) |
Household Vehicle Usage in Gurabo Municipio
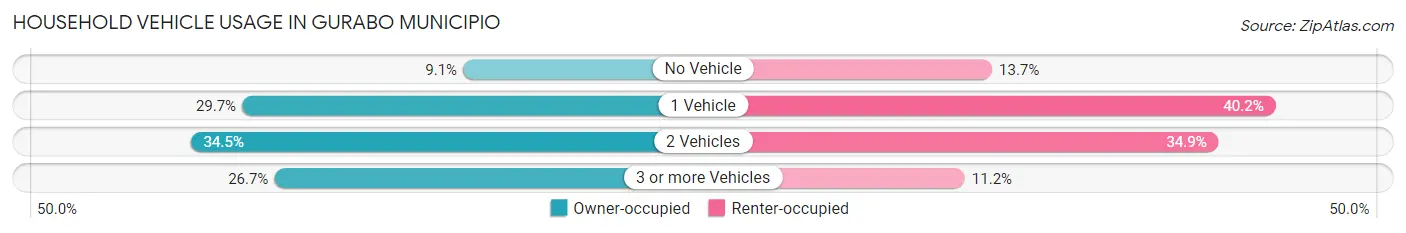
| Vehicles per Household | Owner-occupied | Renter-occupied |
| No Vehicle | 1,038 (9.1%) | 470 (13.7%) |
| 1 Vehicle | 3,396 (29.7%) | 1,375 (40.2%) |
| 2 Vehicles | 3,944 (34.5%) | 1,193 (34.9%) |
| 3 or more Vehicles | 3,051 (26.7%) | 383 (11.2%) |
| Total | 11,429 (100.0%) | 3,421 (100.0%) |
Real Estate & Mortgages in Gurabo Municipio
Real Estate and Mortgage Overview in Gurabo Municipio
| Characteristic | Without Mortgage | With Mortgage |
| Housing Units | 5,527 | 5,902 |
| Median Property Value | $136,500 | $185,500 |
| Median Household Income | $30,792 | $696 |
| Monthly Housing Costs | $213 | $242 |
| Real Estate Taxes | $1,450 | $4,160 |
Property Value by Mortgage Status in Gurabo Municipio
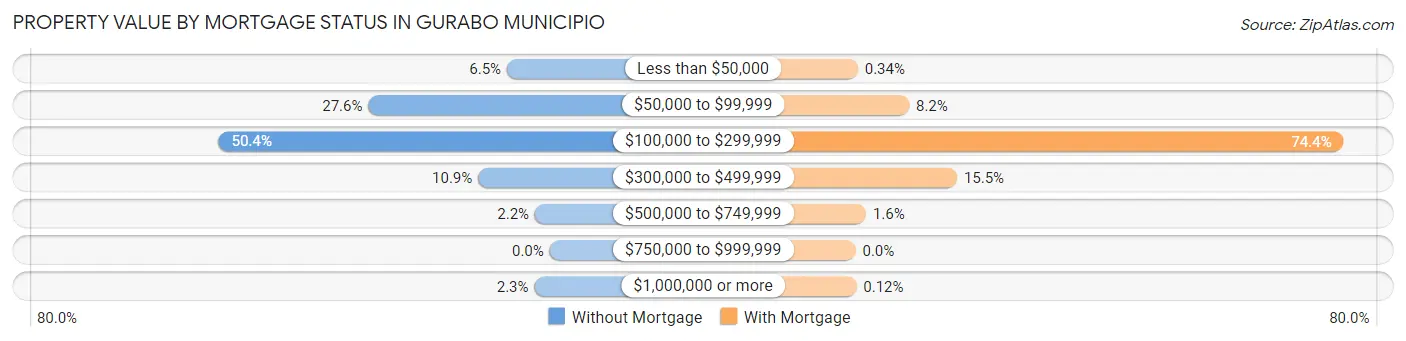
| Property Value | Without Mortgage | With Mortgage |
| Less than $50,000 | 359 (6.5%) | 20 (0.3%) |
| $50,000 to $99,999 | 1,527 (27.6%) | 481 (8.2%) |
| $100,000 to $299,999 | 2,788 (50.4%) | 4,388 (74.4%) |
| $300,000 to $499,999 | 602 (10.9%) | 912 (15.4%) |
| $500,000 to $749,999 | 123 (2.2%) | 94 (1.6%) |
| $750,000 to $999,999 | 0 (0.0%) | 0 (0.0%) |
| $1,000,000 or more | 128 (2.3%) | 7 (0.1%) |
| Total | 5,527 (100.0%) | 5,902 (100.0%) |
Household Income by Mortgage Status in Gurabo Municipio
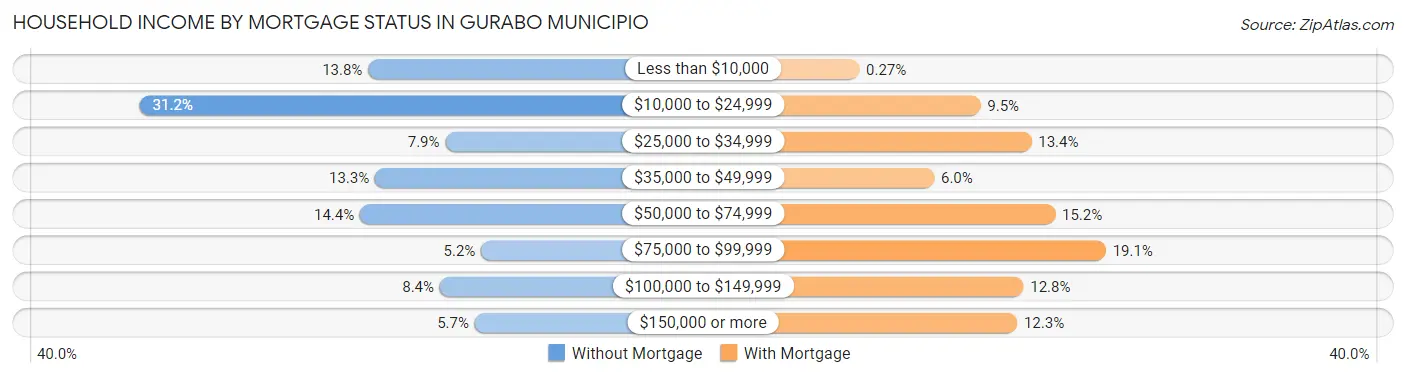
| Household Income | Without Mortgage | With Mortgage |
| Less than $10,000 | 764 (13.8%) | 16 (0.3%) |
| $10,000 to $24,999 | 1,726 (31.2%) | 561 (9.5%) |
| $25,000 to $34,999 | 439 (7.9%) | 790 (13.4%) |
| $35,000 to $49,999 | 735 (13.3%) | 353 (6.0%) |
| $50,000 to $74,999 | 798 (14.4%) | 897 (15.2%) |
| $75,000 to $99,999 | 288 (5.2%) | 1,125 (19.1%) |
| $100,000 to $149,999 | 462 (8.4%) | 754 (12.8%) |
| $150,000 or more | 315 (5.7%) | 726 (12.3%) |
| Total | 5,527 (100.0%) | 5,902 (100.0%) |
Property Value to Household Income Ratio in Gurabo Municipio
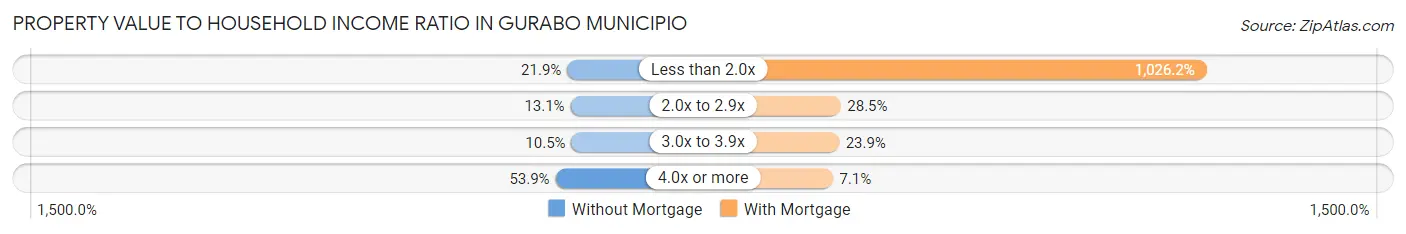
| Value-to-Income Ratio | Without Mortgage | With Mortgage |
| Less than 2.0x | 1,212 (21.9%) | 60,565 (1,026.2%) |
| 2.0x to 2.9x | 723 (13.1%) | 1,679 (28.4%) |
| 3.0x to 3.9x | 578 (10.5%) | 1,413 (23.9%) |
| 4.0x or more | 2,980 (53.9%) | 421 (7.1%) |
| Total | 5,527 (100.0%) | 5,902 (100.0%) |
Real Estate Taxes by Mortgage Status in Gurabo Municipio
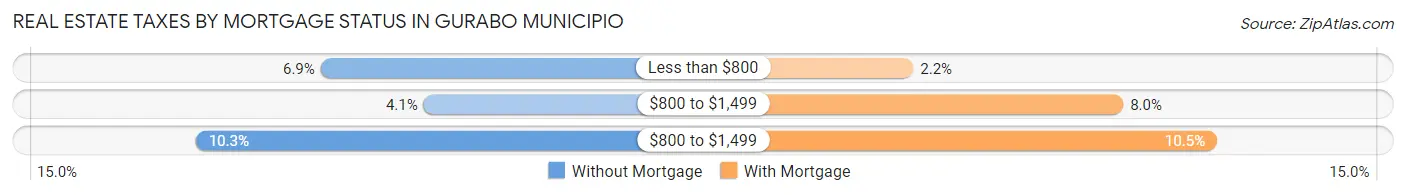
| Property Taxes | Without Mortgage | With Mortgage |
| Less than $800 | 381 (6.9%) | 130 (2.2%) |
| $800 to $1,499 | 225 (4.1%) | 469 (8.0%) |
| $800 to $1,499 | 570 (10.3%) | 621 (10.5%) |
| Total | 5,527 (100.0%) | 5,902 (100.0%) |
Health & Disability in Gurabo Municipio
Health Insurance Coverage by Age in Gurabo Municipio
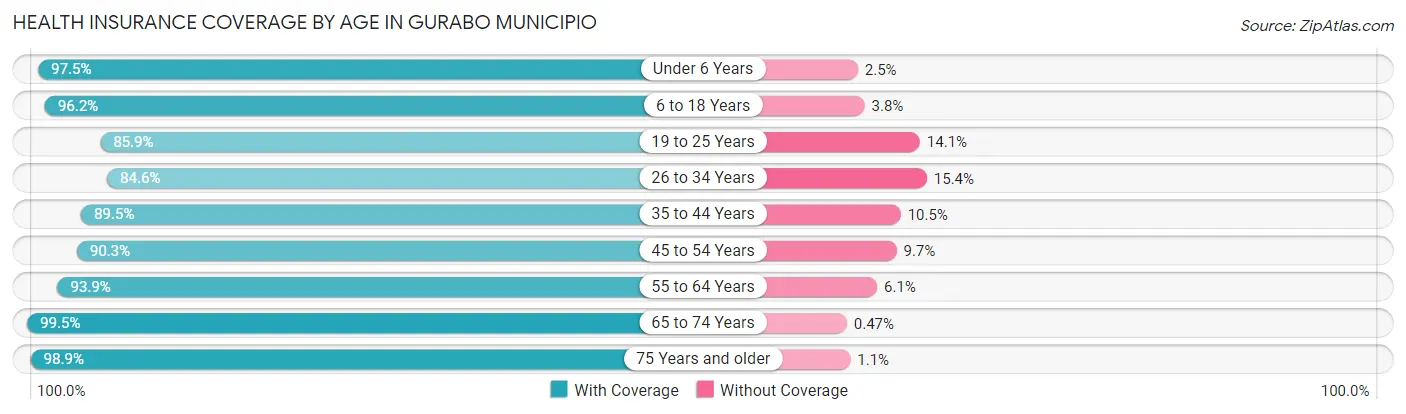
| Age Bracket | With Coverage | Without Coverage |
| Under 6 Years | 1,733 (97.5%) | 45 (2.5%) |
| 6 to 18 Years | 5,689 (96.2%) | 224 (3.8%) |
| 19 to 25 Years | 3,289 (85.9%) | 540 (14.1%) |
| 26 to 34 Years | 4,429 (84.6%) | 806 (15.4%) |
| 35 to 44 Years | 5,029 (89.5%) | 591 (10.5%) |
| 45 to 54 Years | 5,410 (90.3%) | 584 (9.7%) |
| 55 to 64 Years | 4,816 (93.9%) | 314 (6.1%) |
| 65 to 74 Years | 3,782 (99.5%) | 18 (0.5%) |
| 75 Years and older | 2,878 (98.9%) | 33 (1.1%) |
| Total | 37,055 (92.1%) | 3,155 (7.9%) |
Health Insurance Coverage by Citizenship Status in Gurabo Municipio
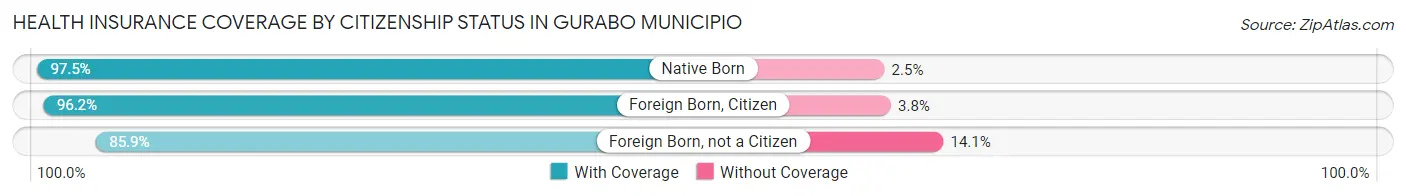
| Citizenship Status | With Coverage | Without Coverage |
| Native Born | 1,733 (97.5%) | 45 (2.5%) |
| Foreign Born, Citizen | 5,689 (96.2%) | 224 (3.8%) |
| Foreign Born, not a Citizen | 3,289 (85.9%) | 540 (14.1%) |
Health Insurance Coverage by Household Income in Gurabo Municipio
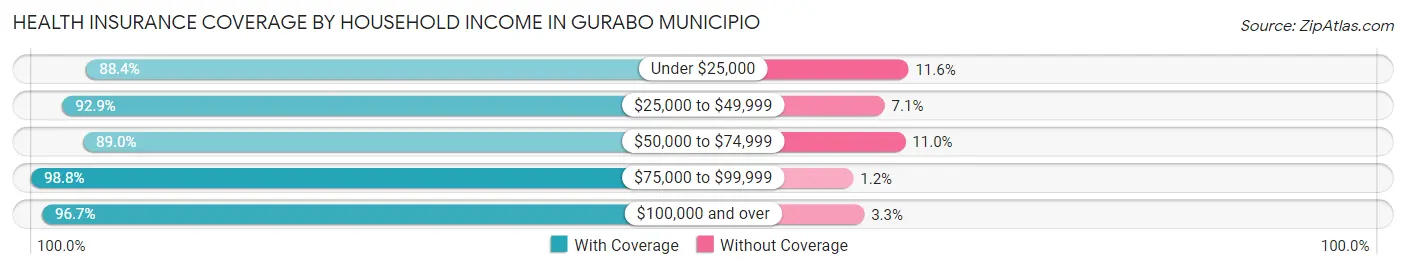
| Household Income | With Coverage | Without Coverage |
| Under $25,000 | 10,631 (88.4%) | 1,390 (11.6%) |
| $25,000 to $49,999 | 8,922 (92.9%) | 681 (7.1%) |
| $50,000 to $74,999 | 6,422 (89.0%) | 792 (11.0%) |
| $75,000 to $99,999 | 3,770 (98.8%) | 47 (1.2%) |
| $100,000 and over | 7,153 (96.7%) | 242 (3.3%) |
Public vs Private Health Insurance Coverage by Age in Gurabo Municipio
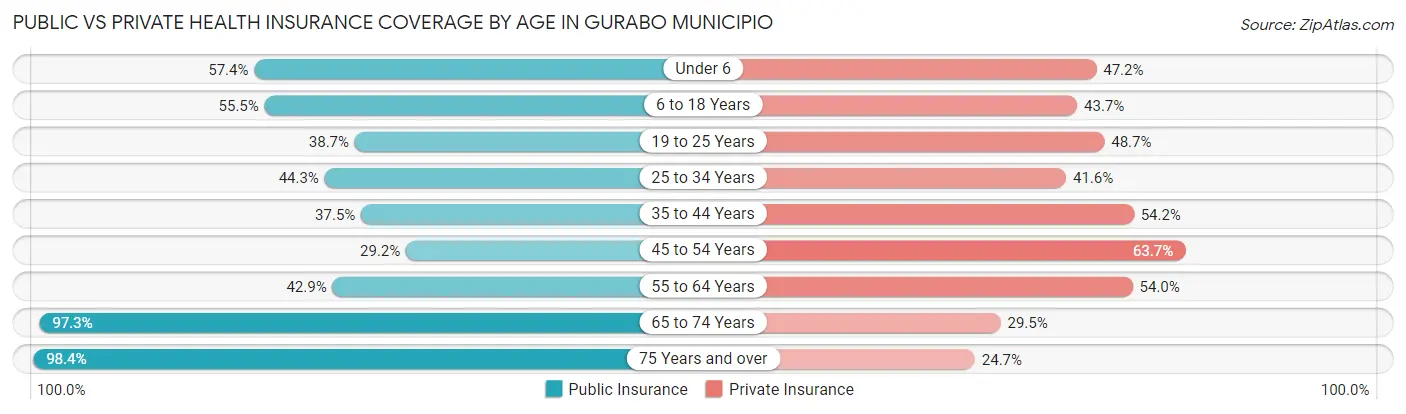
| Age Bracket | Public Insurance | Private Insurance |
| Under 6 | 1,020 (57.4%) | 840 (47.2%) |
| 6 to 18 Years | 3,279 (55.4%) | 2,583 (43.7%) |
| 19 to 25 Years | 1,482 (38.7%) | 1,866 (48.7%) |
| 25 to 34 Years | 2,319 (44.3%) | 2,179 (41.6%) |
| 35 to 44 Years | 2,109 (37.5%) | 3,045 (54.2%) |
| 45 to 54 Years | 1,749 (29.2%) | 3,819 (63.7%) |
| 55 to 64 Years | 2,198 (42.8%) | 2,769 (54.0%) |
| 65 to 74 Years | 3,696 (97.3%) | 1,120 (29.5%) |
| 75 Years and over | 2,864 (98.4%) | 719 (24.7%) |
| Total | 20,716 (51.5%) | 18,940 (47.1%) |
Disability Status by Sex by Age in Gurabo Municipio
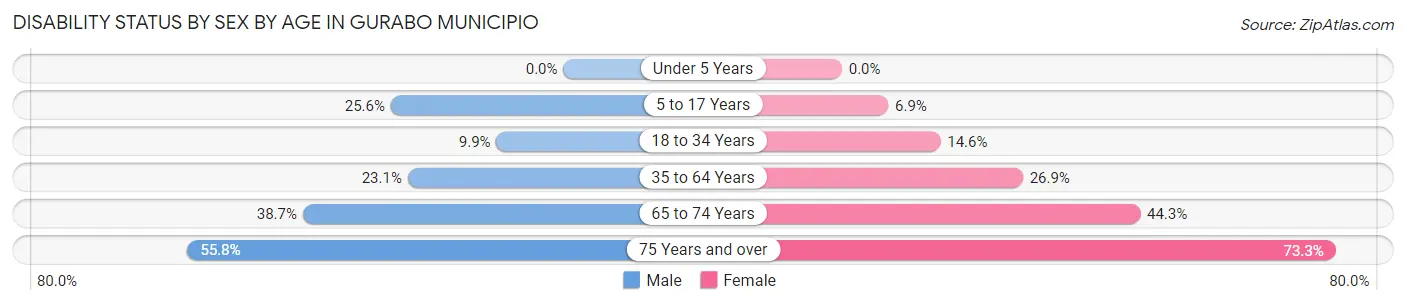
| Age Bracket | Male | Female |
| Under 5 Years | 0 (0.0%) | 0 (0.0%) |
| 5 to 17 Years | 769 (25.6%) | 205 (6.9%) |
| 18 to 34 Years | 446 (9.9%) | 728 (14.6%) |
| 35 to 64 Years | 1,799 (23.1%) | 2,407 (26.9%) |
| 65 to 74 Years | 664 (38.7%) | 923 (44.3%) |
| 75 Years and over | 698 (55.8%) | 1,218 (73.3%) |
Disability Class by Sex by Age in Gurabo Municipio
Disability Class: Hearing Difficulty
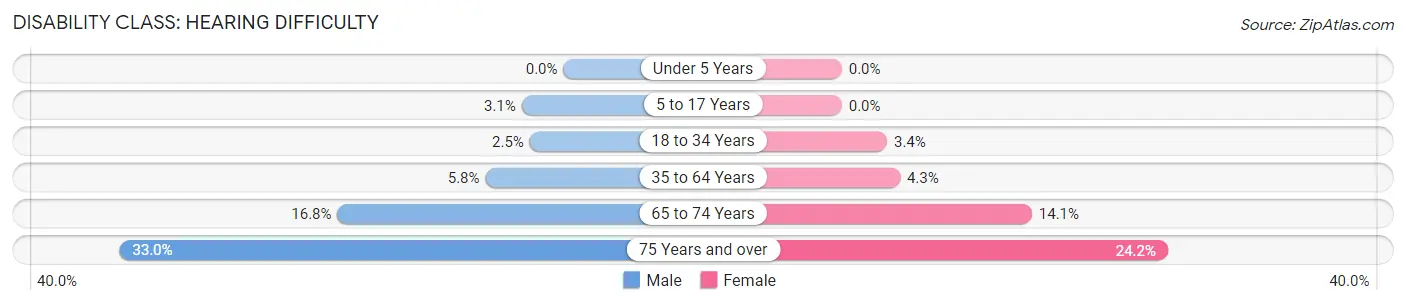
| Age Bracket | Male | Female |
| Under 5 Years | 0 (0.0%) | 0 (0.0%) |
| 5 to 17 Years | 93 (3.1%) | 0 (0.0%) |
| 18 to 34 Years | 112 (2.5%) | 167 (3.4%) |
| 35 to 64 Years | 451 (5.8%) | 387 (4.3%) |
| 65 to 74 Years | 288 (16.8%) | 294 (14.1%) |
| 75 Years and over | 412 (33.0%) | 402 (24.2%) |
Disability Class: Vision Difficulty
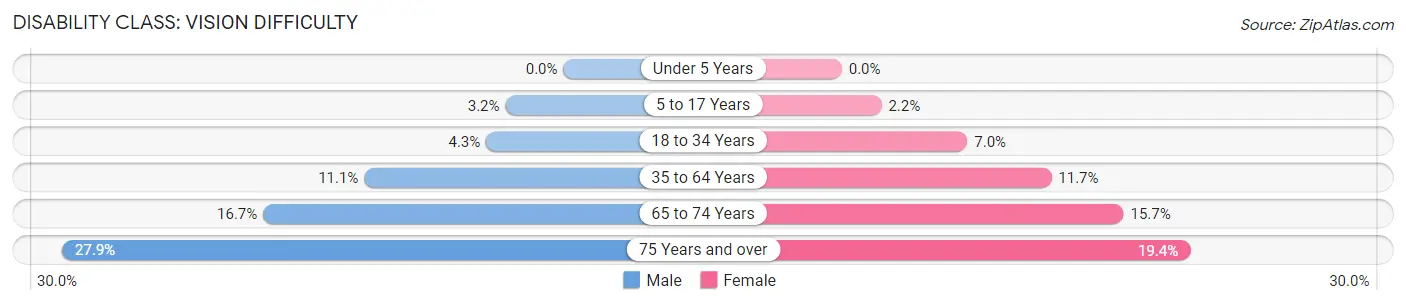
| Age Bracket | Male | Female |
| Under 5 Years | 0 (0.0%) | 0 (0.0%) |
| 5 to 17 Years | 97 (3.2%) | 66 (2.2%) |
| 18 to 34 Years | 193 (4.3%) | 348 (7.0%) |
| 35 to 64 Years | 863 (11.1%) | 1,046 (11.7%) |
| 65 to 74 Years | 287 (16.7%) | 327 (15.7%) |
| 75 Years and over | 349 (27.9%) | 322 (19.4%) |
Disability Class: Cognitive Difficulty
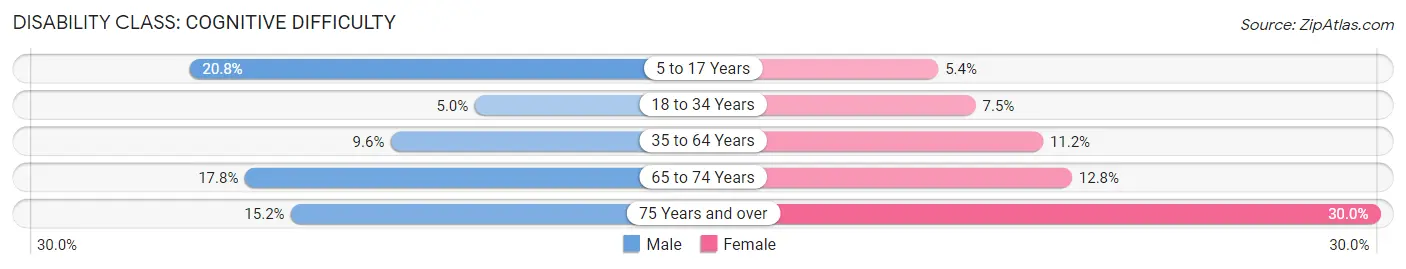
| Age Bracket | Male | Female |
| 5 to 17 Years | 625 (20.8%) | 160 (5.4%) |
| 18 to 34 Years | 223 (5.0%) | 371 (7.4%) |
| 35 to 64 Years | 750 (9.6%) | 1,004 (11.2%) |
| 65 to 74 Years | 305 (17.8%) | 267 (12.8%) |
| 75 Years and over | 190 (15.2%) | 498 (30.0%) |
Disability Class: Ambulatory Difficulty
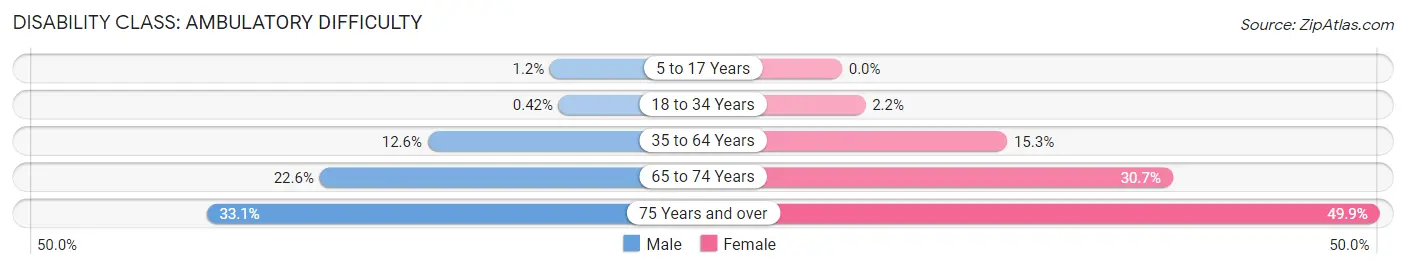
| Age Bracket | Male | Female |
| 5 to 17 Years | 37 (1.2%) | 0 (0.0%) |
| 18 to 34 Years | 19 (0.4%) | 108 (2.2%) |
| 35 to 64 Years | 979 (12.6%) | 1,374 (15.3%) |
| 65 to 74 Years | 388 (22.6%) | 640 (30.7%) |
| 75 Years and over | 414 (33.1%) | 829 (49.9%) |
Disability Class: Self-Care Difficulty
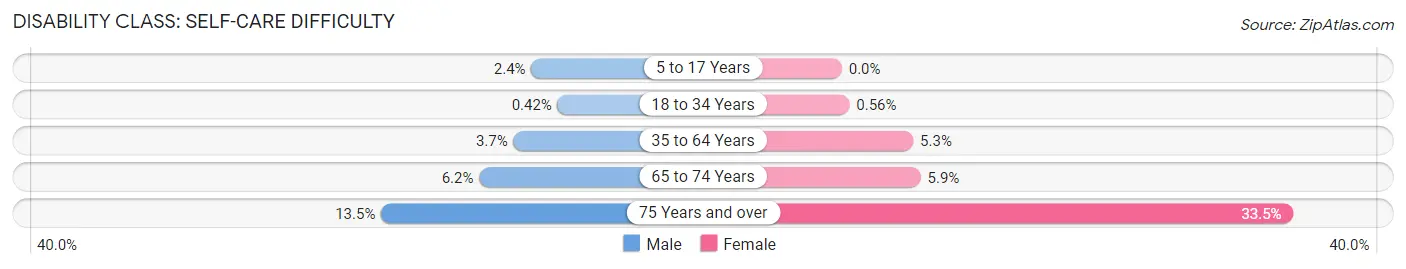
| Age Bracket | Male | Female |
| 5 to 17 Years | 71 (2.4%) | 0 (0.0%) |
| 18 to 34 Years | 19 (0.4%) | 28 (0.6%) |
| 35 to 64 Years | 288 (3.7%) | 475 (5.3%) |
| 65 to 74 Years | 107 (6.2%) | 122 (5.9%) |
| 75 Years and over | 169 (13.5%) | 557 (33.5%) |
Technology Access in Gurabo Municipio
Computing Device Access in Gurabo Municipio
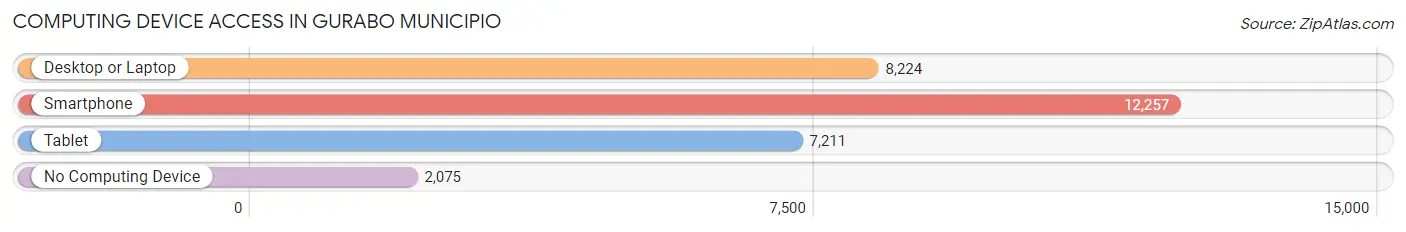
| Device Type | # Households | % Households |
| Desktop or Laptop | 8,224 | 55.4% |
| Smartphone | 12,257 | 82.5% |
| Tablet | 7,211 | 48.6% |
| No Computing Device | 2,075 | 14.0% |
| Total | 14,850 | 100.0% |
Internet Access in Gurabo Municipio
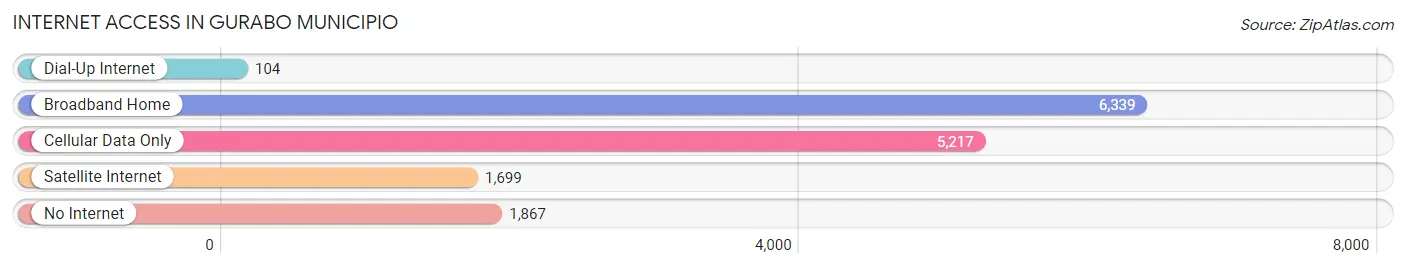
| Internet Type | # Households | % Households |
| Dial-Up Internet | 104 | 0.7% |
| Broadband Home | 6,339 | 42.7% |
| Cellular Data Only | 5,217 | 35.1% |
| Satellite Internet | 1,699 | 11.4% |
| No Internet | 1,867 | 12.6% |
| Total | 14,850 | 100.0% |
Gurabo Municipio Summary
Gurabo Municipio is located in the central region of Puerto Rico, in the northeast corner of the island. It is bordered by the municipalities of San Lorenzo, Caguas, and Juncos. The municipality is part of the San Juan-Caguas-Guaynabo Metropolitan Statistical Area. As of the 2010 census, the population of Gurabo was 28,565.
Geography
Gurabo Municipio is located in the central region of Puerto Rico, in the northeast corner of the island. It is bordered by the municipalities of San Lorenzo, Caguas, and Juncos. The municipality is part of the San Juan-Caguas-Guaynabo Metropolitan Statistical Area. The terrain of Gurabo is mostly mountainous, with some flat areas in the lower elevations. The highest point in the municipality is Cerro La Punta, which rises to 1,845 feet (562 meters) above sea level. The municipality covers an area of approximately 33 square miles (85 square kilometers).
History
Gurabo was founded in 1776 by Don Juan de la Cruz, who named it after his hometown of Gurabo, Spain. The town was originally part of the municipality of San Lorenzo, but was established as an independent municipality in 1815. During the 19th century, Gurabo was an important agricultural center, producing coffee, tobacco, and sugar cane. In the early 20th century, the economy shifted to manufacturing, with the establishment of several factories in the area.
Economy
Gurabo’s economy is largely based on manufacturing and services. The municipality is home to several factories, including a pharmaceutical plant, a plastics factory, and a food processing plant. The municipality also has a growing tourism industry, with several hotels and resorts located in the area.
Demographics
As of the 2010 census, the population of Gurabo was 28,565. The population is predominantly of Puerto Rican descent, with a small minority of African and European descent. The median household income in Gurabo is $20,845, and the median age is 38. The unemployment rate in Gurabo is 11.2%, slightly higher than the national average.
Common Questions
What is Per Capita Income in Gurabo Municipio?
Per Capita income in Gurabo Municipio is $25,112.
What is the Median Family Income in Gurabo Municipio?
Median Family Income in Gurabo Municipio is $45,609.
What is the Median Household income in Gurabo Municipio?
Median Household Income in Gurabo Municipio is $39,533.
What is Income or Wage Gap in Gurabo Municipio?
Income or Wage Gap in Gurabo Municipio is 8.8%.
Women in Gurabo Municipio earn 91.2 cents for every dollar earned by a man.
What is Family Income Deficit in Gurabo Municipio?
Family Income Deficit in Gurabo Municipio is $10,917.
Families that are below poverty line in Gurabo Municipio earn $10,917 less on average than the poverty threshold level.
What is Inequality or Gini Index in Gurabo Municipio?
Inequality or Gini Index in Gurabo Municipio is 0.59.
What is the Total Population of Gurabo Municipio?
Total Population of Gurabo Municipio is 40,517.
What is the Total Male Population of Gurabo Municipio?
Total Male Population of Gurabo Municipio is 19,038.
What is the Total Female Population of Gurabo Municipio?
Total Female Population of Gurabo Municipio is 21,479.
What is the Ratio of Males per 100 Females in Gurabo Municipio?
There are 88.64 Males per 100 Females in Gurabo Municipio.
What is the Ratio of Females per 100 Males in Gurabo Municipio?
There are 112.82 Females per 100 Males in Gurabo Municipio.
What is the Median Population Age in Gurabo Municipio?
Median Population Age in Gurabo Municipio is 41.2 Years.
What is the Average Family Size in Gurabo Municipio
Average Family Size in Gurabo Municipio is 3.3 People.
What is the Average Household Size in Gurabo Municipio
Average Household Size in Gurabo Municipio is 2.7 People.
How Large is the Labor Force in Gurabo Municipio?
There are 19,714 People in the Labor Forcein in Gurabo Municipio.
What is the Percentage of People in the Labor Force in Gurabo Municipio?
57.7% of People are in the Labor Force in Gurabo Municipio.
What is the Unemployment Rate in Gurabo Municipio?
Unemployment Rate in Gurabo Municipio is 14.7%.