Guayama Municipio, PR Map & Demographics
Guayama Municipio Map
Guayama Municipio Overview
$12,626
PER CAPITA INCOME
$23,633
AVG FAMILY INCOME
$19,165
AVG HOUSEHOLD INCOME
19.4%
WAGE / INCOME GAP [ % ]
80.6¢/ $1
WAGE / INCOME GAP [ $ ]
$12,931
FAMILY INCOME DEFICIT
0.53
INEQUALITY / GINI INDEX
36,365
TOTAL POPULATION
18,036
MALE POPULATION
18,329
FEMALE POPULATION
98.40
MALES / 100 FEMALES
101.62
FEMALES / 100 MALES
40.7
MEDIAN AGE
3.0
AVG FAMILY SIZE
2.4
AVG HOUSEHOLD SIZE
10,090
LABOR FORCE [ PEOPLE ]
32.9%
PERCENT IN LABOR FORCE
6.8%
UNEMPLOYMENT RATE
Income in Guayama Municipio
Income Overview in Guayama Municipio
Per Capita Income in Guayama Municipio is $12,626, while median incomes of families and households are $23,633 and $19,165 respectively.
| Characteristic | Number | Measure |
| Per Capita Income | 36,365 | $12,626 |
| Median Family Income | 9,162 | $23,633 |
| Mean Family Income | 9,162 | $34,431 |
| Median Household Income | 14,427 | $19,165 |
| Mean Household Income | 14,427 | $29,299 |
| Income Deficit | 9,162 | $12,931 |
| Wage / Income Gap (%) | 36,365 | 19.44% |
| Wage / Income Gap ($) | 36,365 | 80.56¢ per $1 |
| Gini / Inequality Index | 36,365 | 0.53 |
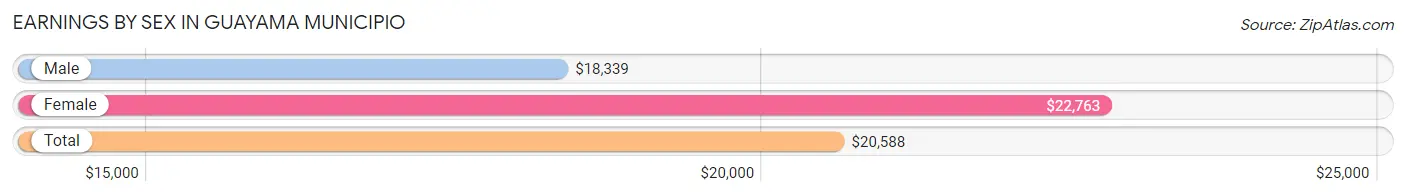
Earnings by Sex in Guayama Municipio
Average Earnings in Guayama Municipio are $20,588, $18,339 for men and $22,763 for women, a difference of 19.4%.
| Sex | Number | Average Earnings |
| Male | 5,881 (53.5%) | $18,339 |
| Female | 5,113 (46.5%) | $22,763 |
| Total | 10,994 (100.0%) | $20,588 |
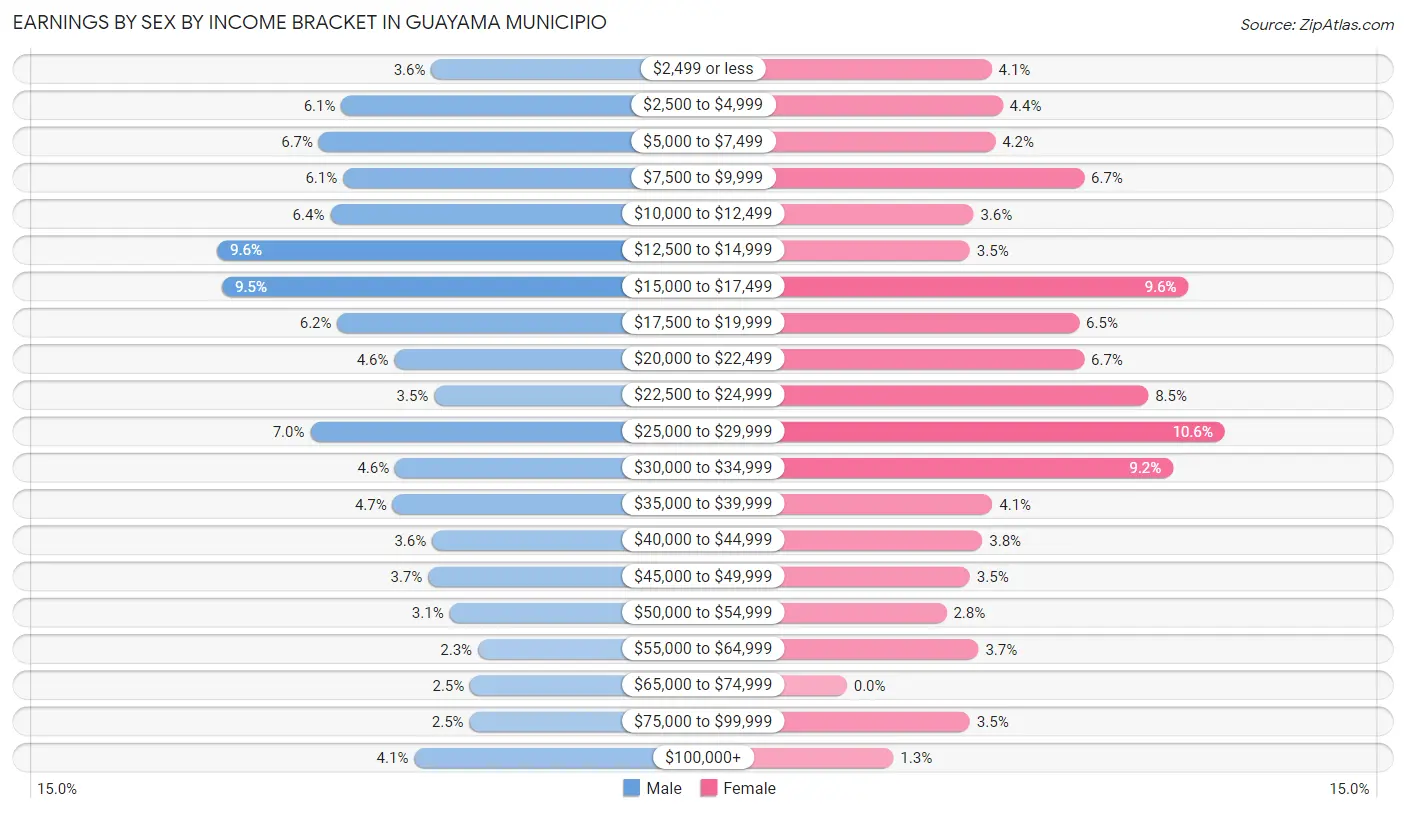
Earnings by Sex by Income Bracket in Guayama Municipio
The most common earnings brackets in Guayama Municipio are $12,500 to $14,999 for men (564 | 9.6%) and $25,000 to $29,999 for women (543 | 10.6%).
| Income | Male | Female |
| $2,499 or less | 210 (3.6%) | 208 (4.1%) |
| $2,500 to $4,999 | 359 (6.1%) | 224 (4.4%) |
| $5,000 to $7,499 | 396 (6.7%) | 213 (4.2%) |
| $7,500 to $9,999 | 356 (6.0%) | 341 (6.7%) |
| $10,000 to $12,499 | 377 (6.4%) | 182 (3.6%) |
| $12,500 to $14,999 | 564 (9.6%) | 177 (3.5%) |
| $15,000 to $17,499 | 556 (9.5%) | 491 (9.6%) |
| $17,500 to $19,999 | 365 (6.2%) | 334 (6.5%) |
| $20,000 to $22,499 | 271 (4.6%) | 341 (6.7%) |
| $22,500 to $24,999 | 205 (3.5%) | 433 (8.5%) |
| $25,000 to $29,999 | 410 (7.0%) | 543 (10.6%) |
| $30,000 to $34,999 | 270 (4.6%) | 469 (9.2%) |
| $35,000 to $39,999 | 274 (4.7%) | 209 (4.1%) |
| $40,000 to $44,999 | 209 (3.5%) | 195 (3.8%) |
| $45,000 to $49,999 | 215 (3.7%) | 177 (3.5%) |
| $50,000 to $54,999 | 180 (3.1%) | 143 (2.8%) |
| $55,000 to $64,999 | 133 (2.3%) | 189 (3.7%) |
| $65,000 to $74,999 | 146 (2.5%) | 0 (0.0%) |
| $75,000 to $99,999 | 147 (2.5%) | 177 (3.5%) |
| $100,000+ | 238 (4.1%) | 67 (1.3%) |
| Total | 5,881 (100.0%) | 5,113 (100.0%) |
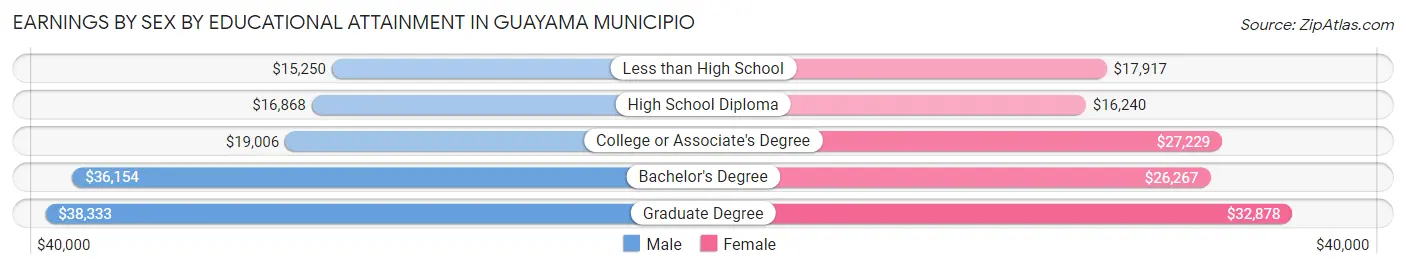
Earnings by Sex by Educational Attainment in Guayama Municipio
Average earnings in Guayama Municipio are $19,801 for men and $24,088 for women, a difference of 17.8%. Men with an educational attainment of graduate degree enjoy the highest average annual earnings of $38,333, while those with less than high school education earn the least with $15,250. Women with an educational attainment of graduate degree earn the most with the average annual earnings of $32,878, while those with high school diploma education have the smallest earnings of $16,240.
| Educational Attainment | Male Income | Female Income |
| Less than High School | $15,250 | $17,917 |
| High School Diploma | $16,868 | $16,240 |
| College or Associate's Degree | $19,006 | $27,229 |
| Bachelor's Degree | $36,154 | $26,267 |
| Graduate Degree | $38,333 | $32,878 |
| Total | $19,801 | $24,088 |
Family Income in Guayama Municipio
Family Income Brackets in Guayama Municipio
According to the Guayama Municipio family income data, there are 2,345 families falling into the less than $10,000 income range, which is the most common income bracket and makes up 25.6% of all families. Conversely, the $200,000+ income bracket is the least frequent group with only 46 families (0.5%) belonging to this category.
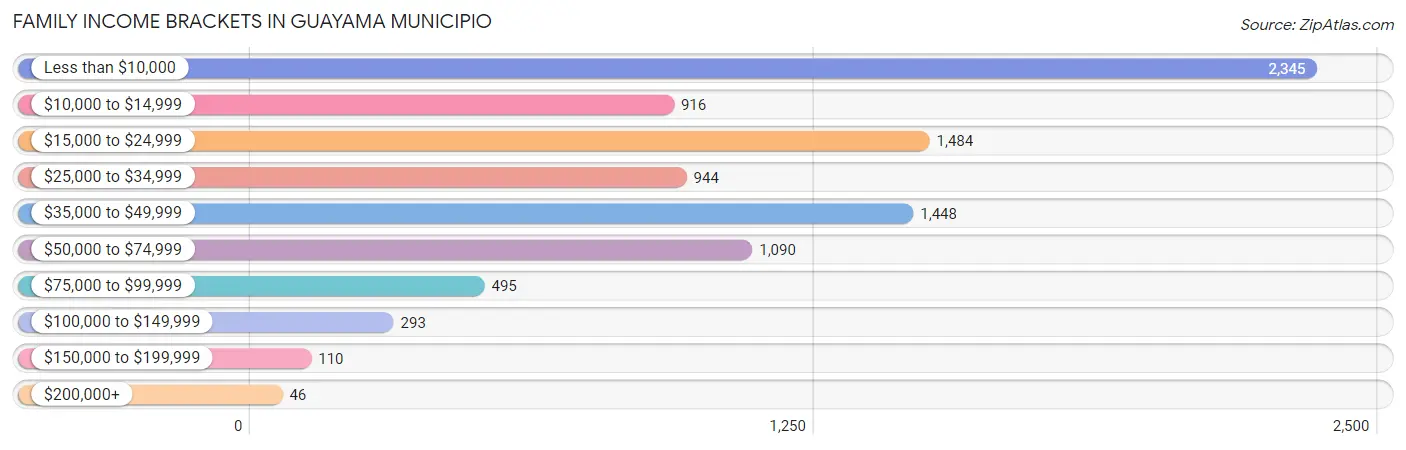
| Income Bracket | # Families | % Families |
| Less than $10,000 | 2,345 | 25.6% |
| $10,000 to $14,999 | 916 | 10.0% |
| $15,000 to $24,999 | 1,484 | 16.2% |
| $25,000 to $34,999 | 944 | 10.3% |
| $35,000 to $49,999 | 1,448 | 15.8% |
| $50,000 to $74,999 | 1,090 | 11.9% |
| $75,000 to $99,999 | 495 | 5.4% |
| $100,000 to $149,999 | 293 | 3.2% |
| $150,000 to $199,999 | 110 | 1.2% |
| $200,000+ | 46 | 0.5% |
Family Income by Famaliy Size in Guayama Municipio
5-person families (535 | 5.8%) account for the highest median family income in Guayama Municipio with $43,822 per family, while 2-person families (4,610 | 50.3%) have the highest median income of $10,608 per family member.
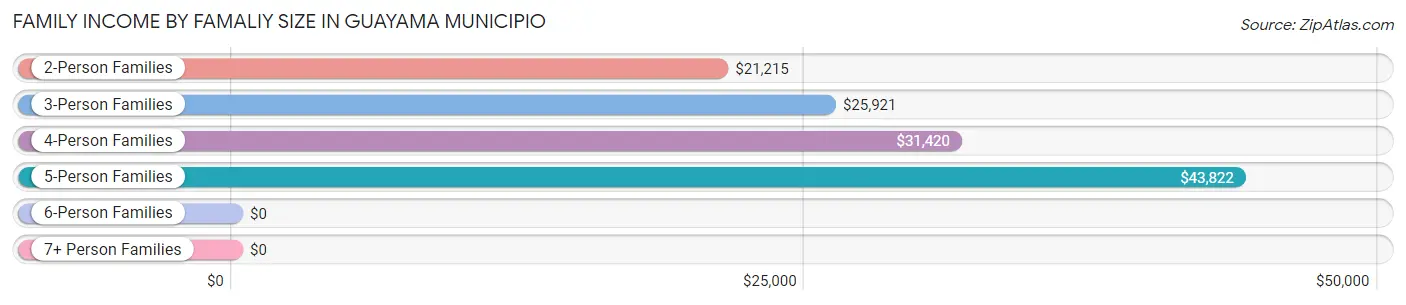
| Income Bracket | # Families | Median Income |
| 2-Person Families | 4,610 (50.3%) | $21,215 |
| 3-Person Families | 2,314 (25.3%) | $25,921 |
| 4-Person Families | 1,549 (16.9%) | $31,420 |
| 5-Person Families | 535 (5.8%) | $43,822 |
| 6-Person Families | 51 (0.6%) | $0 |
| 7+ Person Families | 103 (1.1%) | $0 |
| Total | 9,162 (100.0%) | $23,633 |
Family Income by Number of Earners in Guayama Municipio
The median family income in Guayama Municipio is $23,633, with families comprising 3+ earners (369) having the highest median family income of $73,563, while families with no earners (4,189) have the lowest median family income of $11,567, accounting for 4.0% and 45.7% of families, respectively.
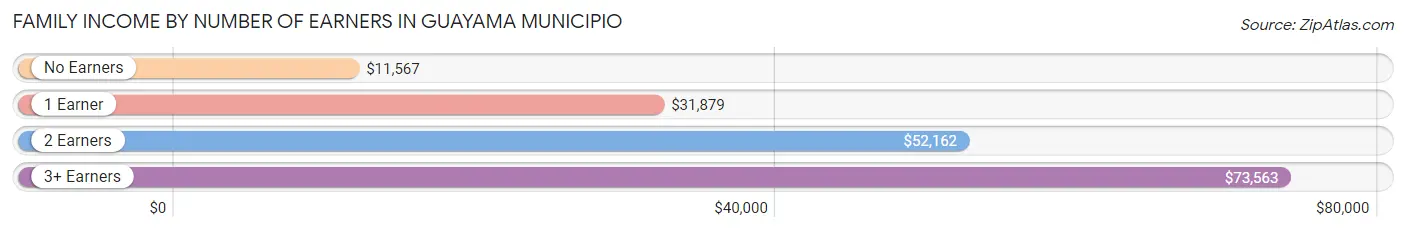
| Number of Earners | # Families | Median Income |
| No Earners | 4,189 (45.7%) | $11,567 |
| 1 Earner | 3,135 (34.2%) | $31,879 |
| 2 Earners | 1,469 (16.0%) | $52,162 |
| 3+ Earners | 369 (4.0%) | $73,563 |
| Total | 9,162 (100.0%) | $23,633 |
Household Income in Guayama Municipio
Household Income Brackets in Guayama Municipio
With 4,126 households falling in the category, the less than $10,000 income range is the most frequent in Guayama Municipio, accounting for 28.6% of all households. In contrast, only 43 households (0.3%) fall into the $200,000+ income bracket, making it the least populous group.
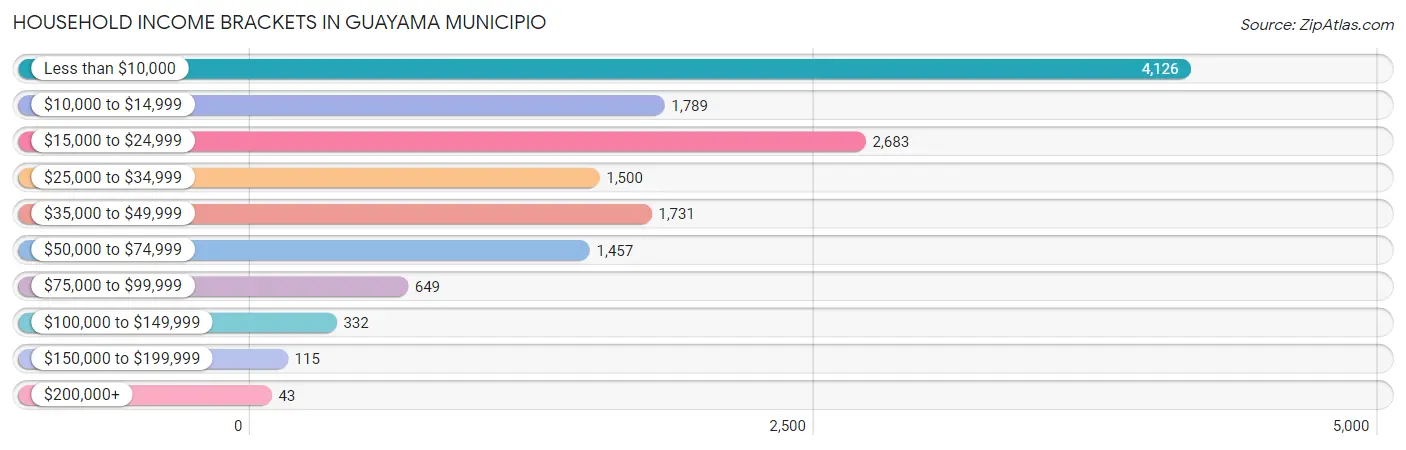
| Income Bracket | # Households | % Households |
| Less than $10,000 | 4,126 | 28.6% |
| $10,000 to $14,999 | 1,789 | 12.4% |
| $15,000 to $24,999 | 2,683 | 18.6% |
| $25,000 to $34,999 | 1,500 | 10.4% |
| $35,000 to $49,999 | 1,731 | 12.0% |
| $50,000 to $74,999 | 1,457 | 10.1% |
| $75,000 to $99,999 | 649 | 4.5% |
| $100,000 to $149,999 | 332 | 2.3% |
| $150,000 to $199,999 | 115 | 0.8% |
| $200,000+ | 43 | 0.3% |
Household Income by Householder Age in Guayama Municipio
The median household income in Guayama Municipio is $19,165, with the highest median household income of $22,300 found in the 25 to 44 years age bracket for the primary householder. A total of 3,664 households (25.4%) fall into this category. Meanwhile, the 15 to 24 years age bracket for the primary householder has the lowest median household income of $15,672, with 526 households (3.6%) in this group.
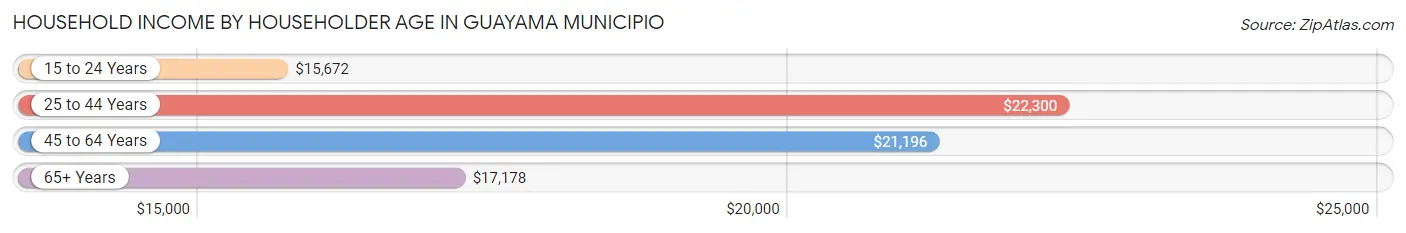
| Income Bracket | # Households | Median Income |
| 15 to 24 Years | 526 (3.6%) | $15,672 |
| 25 to 44 Years | 3,664 (25.4%) | $22,300 |
| 45 to 64 Years | 5,241 (36.3%) | $21,196 |
| 65+ Years | 4,996 (34.6%) | $17,178 |
| Total | 14,427 (100.0%) | $19,165 |
Poverty in Guayama Municipio
Income Below Poverty by Sex and Age in Guayama Municipio
With 45.9% poverty level for males and 49.9% for females among the residents of Guayama Municipio, 5 year old males and 16 and 17 year old females are the most vulnerable to poverty, with 127 males (71.8%) and 340 females (79.6%) in their respective age groups living below the poverty level.
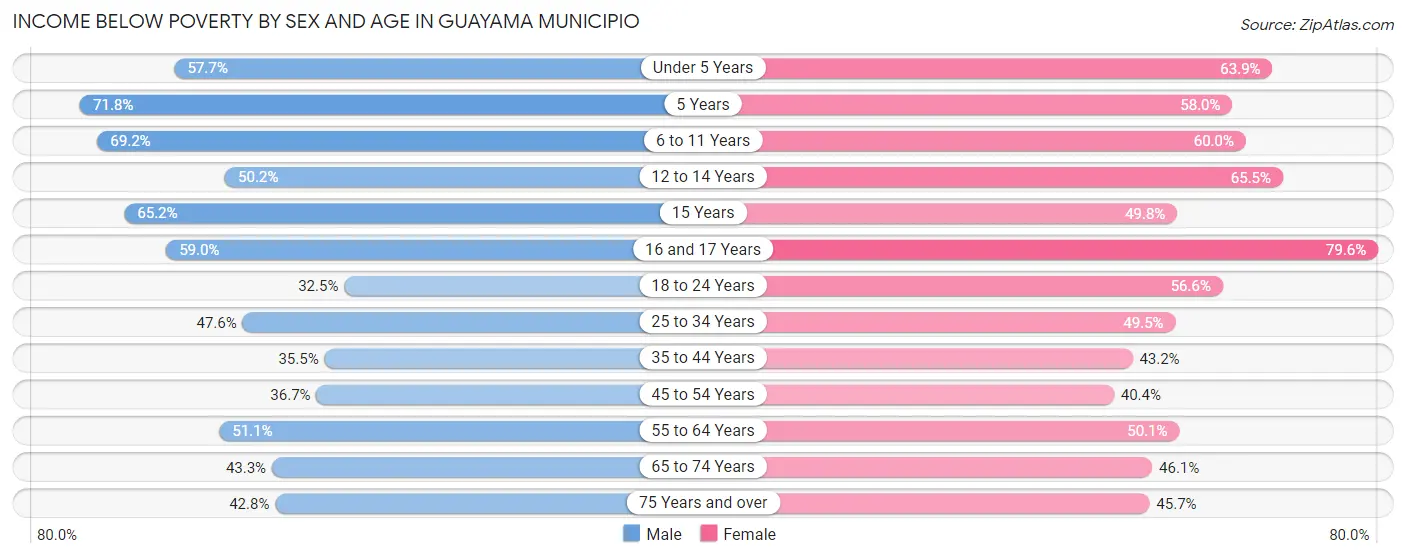
| Age Bracket | Male | Female |
| Under 5 Years | 332 (57.7%) | 399 (63.9%) |
| 5 Years | 127 (71.8%) | 167 (58.0%) |
| 6 to 11 Years | 772 (69.2%) | 571 (60.0%) |
| 12 to 14 Years | 336 (50.2%) | 427 (65.5%) |
| 15 Years | 204 (65.2%) | 126 (49.8%) |
| 16 and 17 Years | 240 (59.0%) | 340 (79.6%) |
| 18 to 24 Years | 631 (32.5%) | 918 (56.6%) |
| 25 to 34 Years | 988 (47.6%) | 1,141 (49.5%) |
| 35 to 44 Years | 487 (35.5%) | 1,007 (43.2%) |
| 45 to 54 Years | 689 (36.7%) | 969 (40.4%) |
| 55 to 64 Years | 1,038 (51.1%) | 1,239 (50.1%) |
| 65 to 74 Years | 762 (43.3%) | 1,005 (46.1%) |
| 75 Years and over | 575 (42.8%) | 814 (45.7%) |
| Total | 7,181 (45.9%) | 9,123 (49.9%) |
Income Above Poverty by Sex and Age in Guayama Municipio
According to the poverty statistics in Guayama Municipio, males aged 18 to 24 years and females aged 45 to 54 years are the age groups that are most secure financially, with 67.5% of males and 59.6% of females in these age groups living above the poverty line.
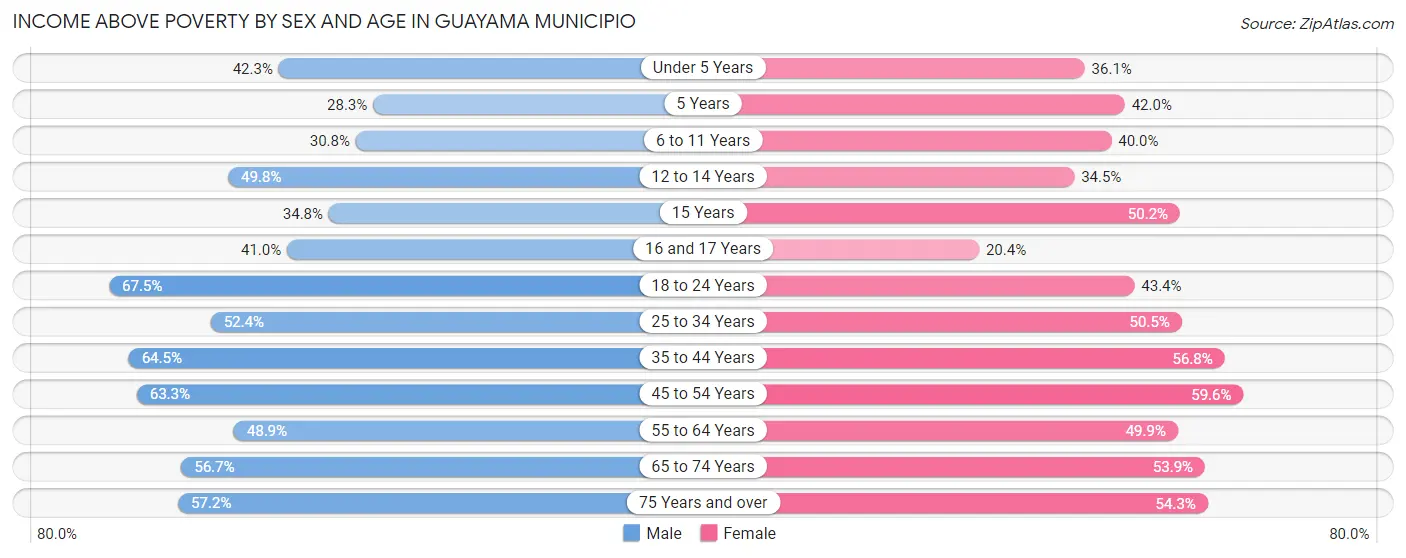
| Age Bracket | Male | Female |
| Under 5 Years | 243 (42.3%) | 225 (36.1%) |
| 5 Years | 50 (28.2%) | 121 (42.0%) |
| 6 to 11 Years | 344 (30.8%) | 381 (40.0%) |
| 12 to 14 Years | 333 (49.8%) | 225 (34.5%) |
| 15 Years | 109 (34.8%) | 127 (50.2%) |
| 16 and 17 Years | 167 (41.0%) | 87 (20.4%) |
| 18 to 24 Years | 1,308 (67.5%) | 705 (43.4%) |
| 25 to 34 Years | 1,086 (52.4%) | 1,162 (50.5%) |
| 35 to 44 Years | 886 (64.5%) | 1,326 (56.8%) |
| 45 to 54 Years | 1,190 (63.3%) | 1,430 (59.6%) |
| 55 to 64 Years | 994 (48.9%) | 1,233 (49.9%) |
| 65 to 74 Years | 999 (56.7%) | 1,176 (53.9%) |
| 75 Years and over | 769 (57.2%) | 968 (54.3%) |
| Total | 8,478 (54.1%) | 9,166 (50.1%) |
Income Below Poverty Among Married-Couple Families in Guayama Municipio
The poverty statistics for married-couple families in Guayama Municipio show that 34.7% or 1,713 of the total 4,933 families live below the poverty line. Families with 3 or 4 children have the highest poverty rate of 77.4%, comprising of 106 families. On the other hand, families with 1 or 2 children have the lowest poverty rate of 28.3%, which includes 339 families.
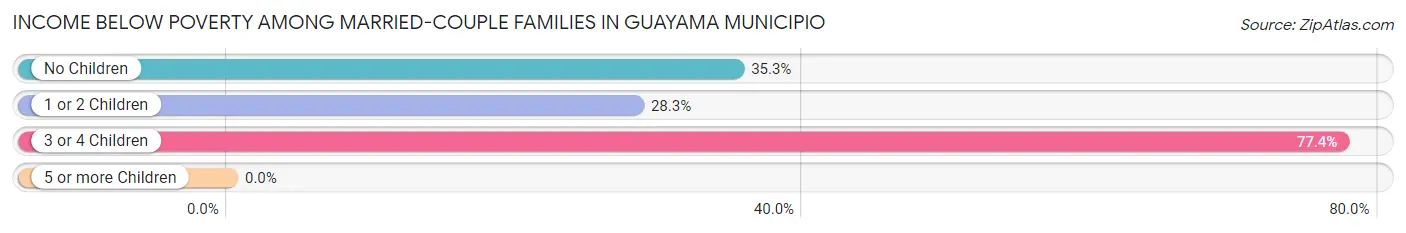
| Children | Above Poverty | Below Poverty |
| No Children | 2,329 (64.7%) | 1,268 (35.2%) |
| 1 or 2 Children | 860 (71.7%) | 339 (28.3%) |
| 3 or 4 Children | 31 (22.6%) | 106 (77.4%) |
| 5 or more Children | 0 (0.0%) | 0 (0.0%) |
| Total | 3,220 (65.3%) | 1,713 (34.7%) |
Income Below Poverty Among Single-Parent Households in Guayama Municipio
According to the poverty data in Guayama Municipio, 57.4% or 448 single-father households and 61.3% or 2,115 single-mother households are living below the poverty line. Among single-father households, those with 1 or 2 children have the highest poverty rate, with 275 households (68.6%) experiencing poverty. Likewise, among single-mother households, those with 5 or more children have the highest poverty rate, with 77 households (100.0%) falling below the poverty line.
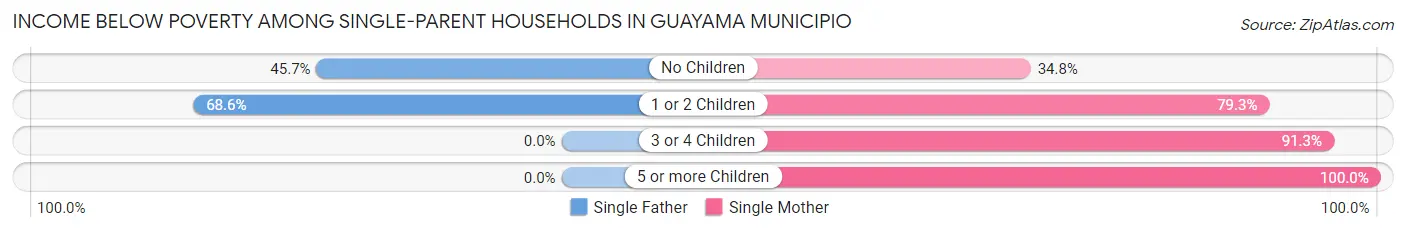
| Children | Single Father | Single Mother |
| No Children | 173 (45.7%) | 538 (34.8%) |
| 1 or 2 Children | 275 (68.6%) | 1,112 (79.3%) |
| 3 or 4 Children | 0 (0.0%) | 388 (91.3%) |
| 5 or more Children | 0 (0.0%) | 77 (100.0%) |
| Total | 448 (57.4%) | 2,115 (61.3%) |
Income Below Poverty Among Married-Couple vs Single-Parent Households in Guayama Municipio
The poverty data for Guayama Municipio shows that 1,713 of the married-couple family households (34.7%) and 2,563 of the single-parent households (60.6%) are living below the poverty level. Within the married-couple family households, those with 3 or 4 children have the highest poverty rate, with 106 households (77.4%) falling below the poverty line. Among the single-parent households, those with 5 or more children have the highest poverty rate, with 77 household (100.0%) living below poverty.
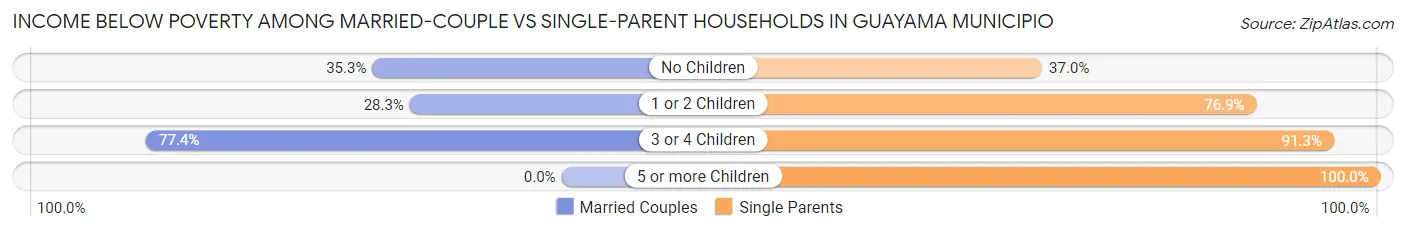
| Children | Married-Couple Families | Single-Parent Households |
| No Children | 1,268 (35.2%) | 711 (37.0%) |
| 1 or 2 Children | 339 (28.3%) | 1,387 (76.9%) |
| 3 or 4 Children | 106 (77.4%) | 388 (91.3%) |
| 5 or more Children | 0 (0.0%) | 77 (100.0%) |
| Total | 1,713 (34.7%) | 2,563 (60.6%) |
Race in Guayama Municipio
The most populous races in Guayama Municipio are Hispanic or Latino (36,161 | 99.4%), White / Caucasian (20,655 | 56.8%), and Two or more Races (7,795 | 21.4%).
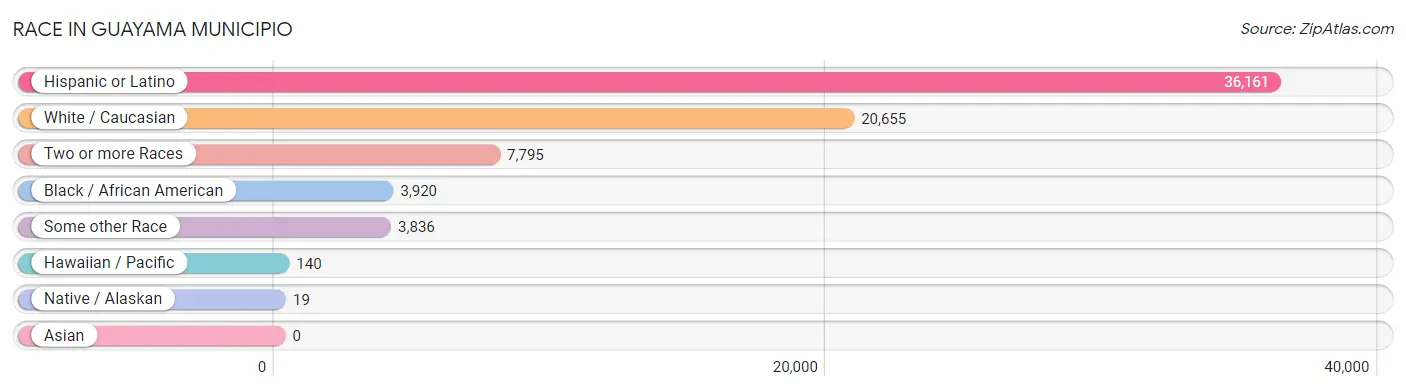
| Race | # Population | % Population |
| Asian | 0 | 0.0% |
| Black / African American | 3,920 | 10.8% |
| Hawaiian / Pacific | 140 | 0.4% |
| Hispanic or Latino | 36,161 | 99.4% |
| Native / Alaskan | 19 | 0.1% |
| White / Caucasian | 20,655 | 56.8% |
| Two or more Races | 7,795 | 21.4% |
| Some other Race | 3,836 | 10.5% |
| Total | 36,365 | 100.0% |
Ancestry in Guayama Municipio
The most populous ancestries reported in Guayama Municipio are Puerto Rican (35,575 | 97.8%), Dominican (186 | 0.5%), Mexican (179 | 0.5%), American (152 | 0.4%), and Spaniard (113 | 0.3%), together accounting for 99.6% of all Guayama Municipio residents.
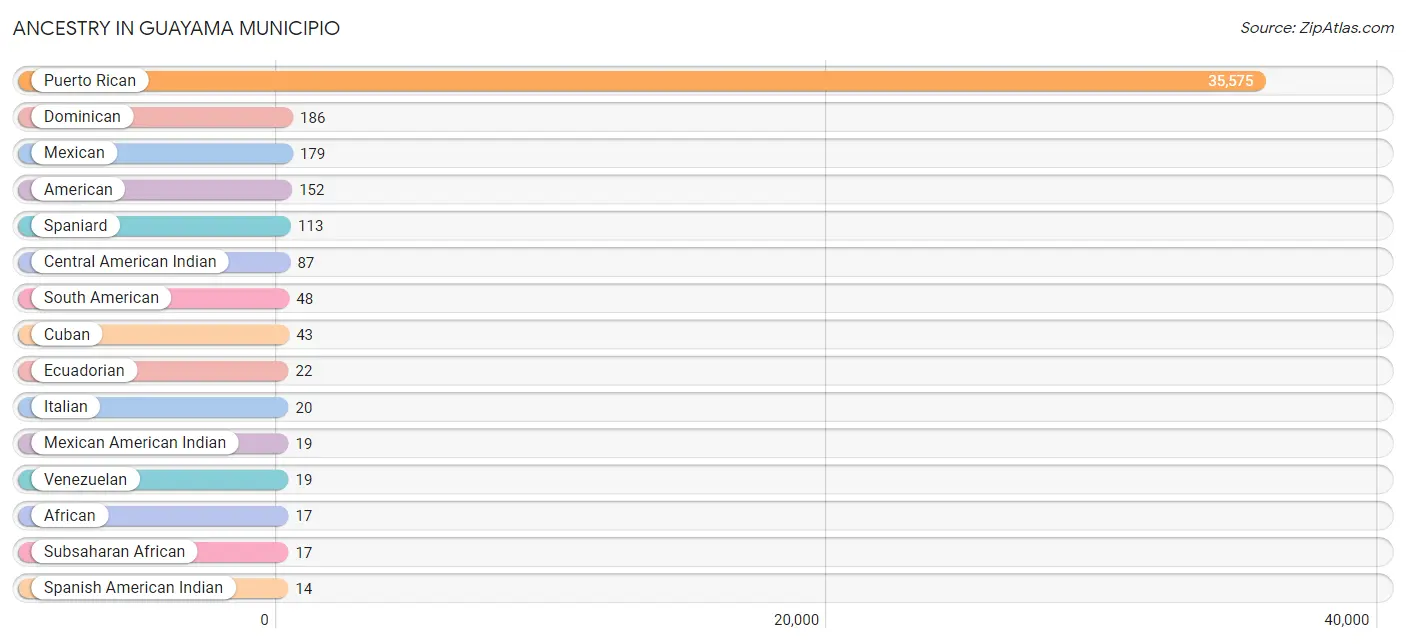
| Ancestry | # Population | % Population |
| African | 17 | 0.1% |
| American | 152 | 0.4% |
| Argentinean | 7 | 0.0% |
| Burmese | 8 | 0.0% |
| Central American Indian | 87 | 0.2% |
| Cuban | 43 | 0.1% |
| Dominican | 186 | 0.5% |
| Ecuadorian | 22 | 0.1% |
| English | 4 | 0.0% |
| Italian | 20 | 0.1% |
| Mexican | 179 | 0.5% |
| Mexican American Indian | 19 | 0.1% |
| Puerto Rican | 35,575 | 97.8% |
| South American | 48 | 0.1% |
| Spaniard | 113 | 0.3% |
| Spanish American Indian | 14 | 0.0% |
| Subsaharan African | 17 | 0.1% |
| Venezuelan | 19 | 0.1% |
| West Indian | 2 | 0.0% | View All 19 Rows |
Immigrants in Guayama Municipio

| Immigration Origin | # Population | % Population | View All 0 Rows |
Sex and Age in Guayama Municipio
Sex and Age in Guayama Municipio
The most populous age groups in Guayama Municipio are 25 to 29 Years (1,770 | 9.8%) for men and 60 to 64 Years (1,301 | 7.1%) for women.
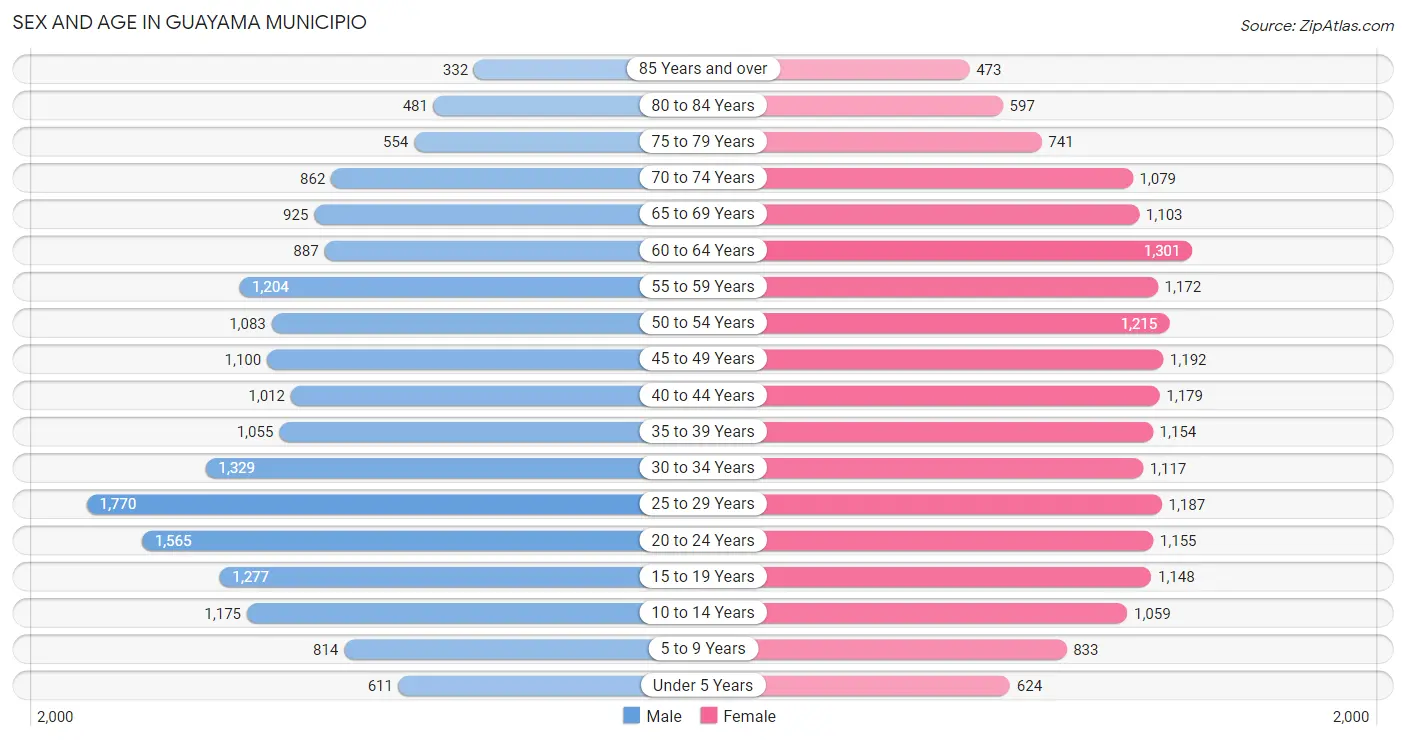
| Age Bracket | Male | Female |
| Under 5 Years | 611 (3.4%) | 624 (3.4%) |
| 5 to 9 Years | 814 (4.5%) | 833 (4.5%) |
| 10 to 14 Years | 1,175 (6.5%) | 1,059 (5.8%) |
| 15 to 19 Years | 1,277 (7.1%) | 1,148 (6.3%) |
| 20 to 24 Years | 1,565 (8.7%) | 1,155 (6.3%) |
| 25 to 29 Years | 1,770 (9.8%) | 1,187 (6.5%) |
| 30 to 34 Years | 1,329 (7.4%) | 1,117 (6.1%) |
| 35 to 39 Years | 1,055 (5.9%) | 1,154 (6.3%) |
| 40 to 44 Years | 1,012 (5.6%) | 1,179 (6.4%) |
| 45 to 49 Years | 1,100 (6.1%) | 1,192 (6.5%) |
| 50 to 54 Years | 1,083 (6.0%) | 1,215 (6.6%) |
| 55 to 59 Years | 1,204 (6.7%) | 1,172 (6.4%) |
| 60 to 64 Years | 887 (4.9%) | 1,301 (7.1%) |
| 65 to 69 Years | 925 (5.1%) | 1,103 (6.0%) |
| 70 to 74 Years | 862 (4.8%) | 1,079 (5.9%) |
| 75 to 79 Years | 554 (3.1%) | 741 (4.0%) |
| 80 to 84 Years | 481 (2.7%) | 597 (3.3%) |
| 85 Years and over | 332 (1.8%) | 473 (2.6%) |
| Total | 18,036 (100.0%) | 18,329 (100.0%) |
Families and Households in Guayama Municipio
Median Family Size in Guayama Municipio
The median family size in Guayama Municipio is 2.97 persons per family, with married-couple families (4,933 | 53.8%) accounting for the largest median family size of 3.15 persons per family. On the other hand, single male/father families (780 | 8.5%) represent the smallest median family size with 2.27 persons per family.
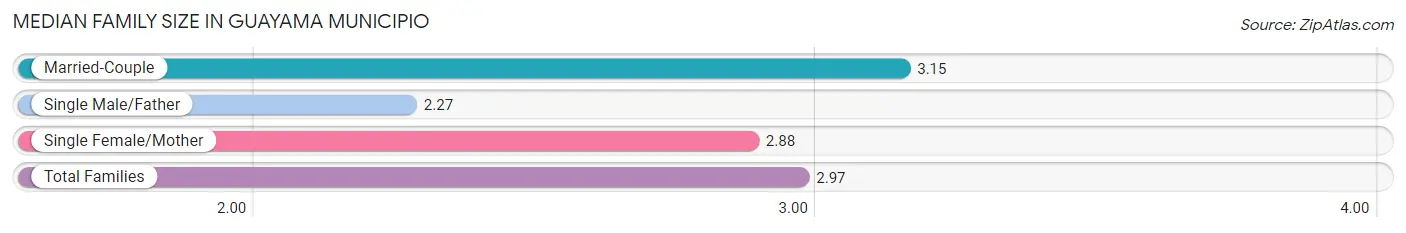
| Family Type | # Families | Family Size |
| Married-Couple | 4,933 (53.8%) | 3.15 |
| Single Male/Father | 780 (8.5%) | 2.27 |
| Single Female/Mother | 3,449 (37.6%) | 2.88 |
| Total Families | 9,162 (100.0%) | 2.97 |
Median Household Size in Guayama Municipio
The median household size in Guayama Municipio is 2.35 persons per household, with married-couple households (4,933 | 34.2%) accounting for the largest median household size of 3.15 persons per household. non-family households (5,265 | 36.5%) represent the smallest median household size with 1.10 persons per household.
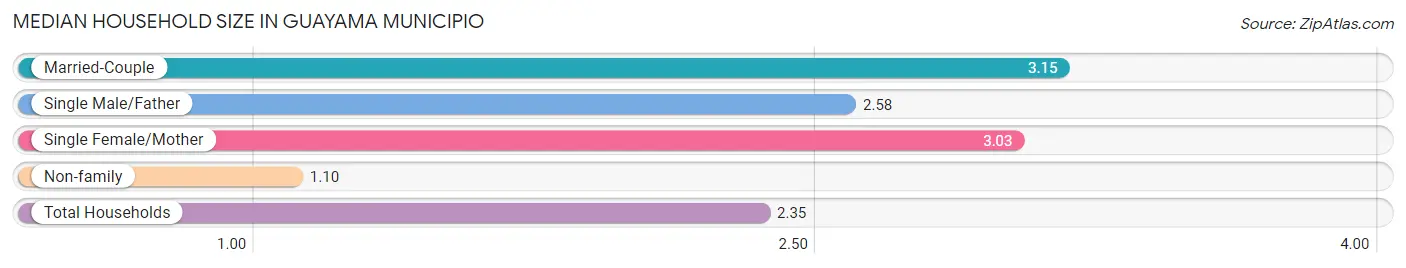
| Household Type | # Households | Household Size |
| Married-Couple | 4,933 (34.2%) | 3.15 |
| Single Male/Father | 780 (5.4%) | 2.58 |
| Single Female/Mother | 3,449 (23.9%) | 3.03 |
| Non-family | 5,265 (36.5%) | 1.10 |
| Total Households | 14,427 (100.0%) | 2.35 |
Household Size by Marriage Status in Guayama Municipio
Out of a total of 14,427 households in Guayama Municipio, 9,162 (63.5%) are family households, while 5,265 (36.5%) are nonfamily households. The most numerous type of family households are 2-person households, comprising 4,166, and the most common type of nonfamily households are 1-person households, comprising 4,682.
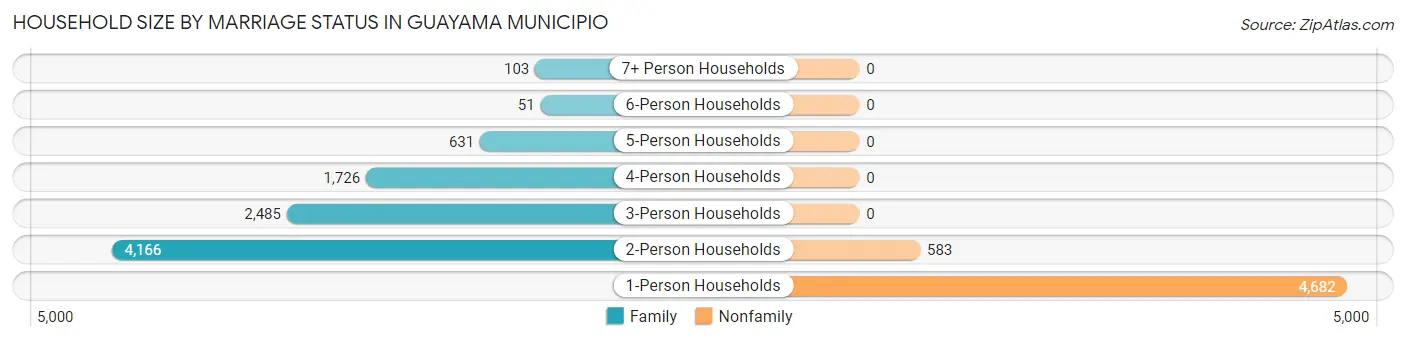
| Household Size | Family Households | Nonfamily Households |
| 1-Person Households | - | 4,682 (32.5%) |
| 2-Person Households | 4,166 (28.9%) | 583 (4.0%) |
| 3-Person Households | 2,485 (17.2%) | 0 (0.0%) |
| 4-Person Households | 1,726 (12.0%) | 0 (0.0%) |
| 5-Person Households | 631 (4.4%) | 0 (0.0%) |
| 6-Person Households | 51 (0.4%) | 0 (0.0%) |
| 7+ Person Households | 103 (0.7%) | 0 (0.0%) |
| Total | 9,162 (63.5%) | 5,265 (36.5%) |
Female Fertility in Guayama Municipio
Fertility by Age in Guayama Municipio
Average fertility rate in Guayama Municipio is 35.0 births per 1,000 women. Women in the age bracket of 35 to 50 years have the highest fertility rate with 54.0 births per 1,000 women. Women in the age bracket of 35 to 50 years acount for 68.7% of all women with births.
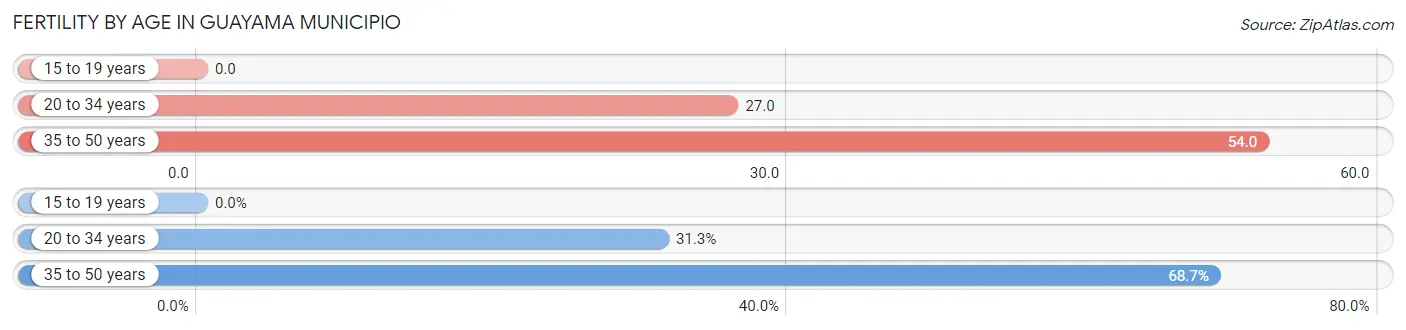
| Age Bracket | Women with Births | Births / 1,000 Women |
| 15 to 19 years | 0 (0.0%) | 0.0 |
| 20 to 34 years | 92 (31.3%) | 27.0 |
| 35 to 50 years | 202 (68.7%) | 54.0 |
| Total | 294 (100.0%) | 35.0 |
Fertility by Age by Marriage Status in Guayama Municipio
44.9% of women with births (294) in Guayama Municipio are married. The highest percentage of unmarried women with births falls into 20 to 34 years age bracket with 59.8% of them unmarried at the time of birth, while the lowest percentage of unmarried women with births belong to 35 to 50 years age bracket with 53.0% of them unmarried.
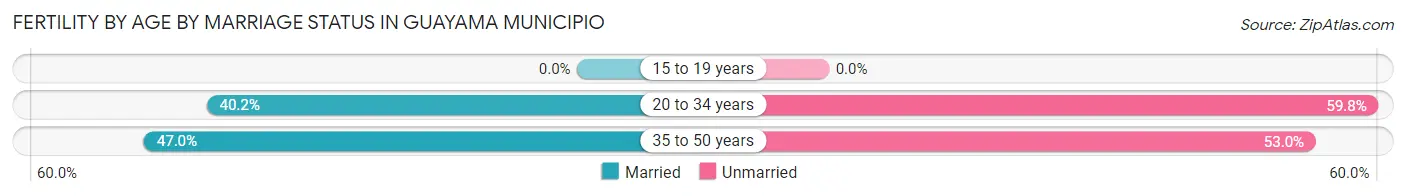
| Age Bracket | Married | Unmarried |
| 15 to 19 years | 0 (0.0%) | 0 (0.0%) |
| 20 to 34 years | 37 (40.2%) | 55 (59.8%) |
| 35 to 50 years | 95 (47.0%) | 107 (53.0%) |
| Total | 132 (44.9%) | 162 (55.1%) |
Fertility by Education in Guayama Municipio
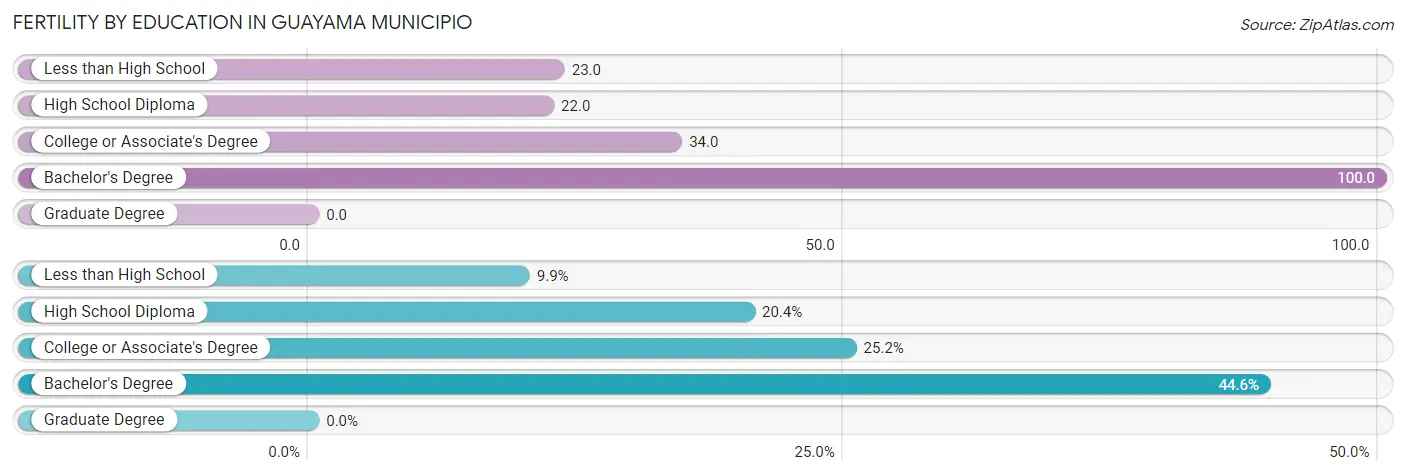
| Educational Attainment | Women with Births | Births / 1,000 Women |
| Less than High School | 29 (9.9%) | 23.0 |
| High School Diploma | 60 (20.4%) | 22.0 |
| College or Associate's Degree | 74 (25.2%) | 34.0 |
| Bachelor's Degree | 131 (44.6%) | 100.0 |
| Graduate Degree | 0 (0.0%) | 0.0 |
| Total | 294 (100.0%) | 35.0 |
Fertility by Education by Marriage Status in Guayama Municipio
55.1% of women with births in Guayama Municipio are unmarried. Women with the educational attainment of high school diploma are most likely to be married with 61.7% of them married at childbirth, while women with the educational attainment of less than high school are least likely to be married with 100.0% of them unmarried at childbirth.
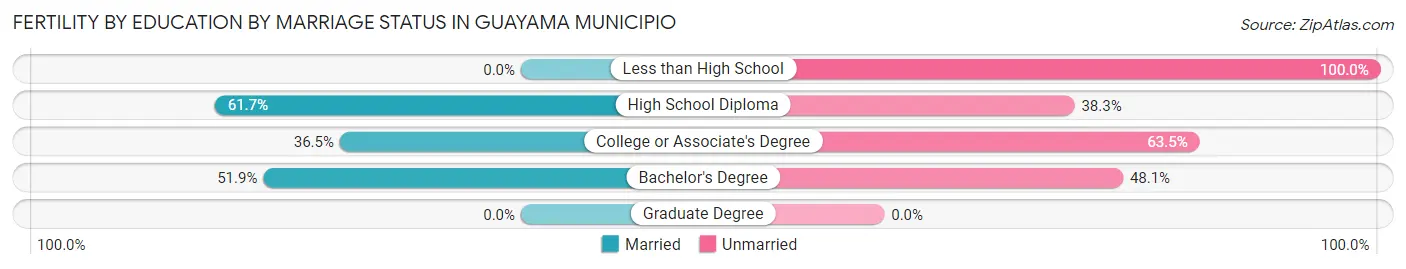
| Educational Attainment | Married | Unmarried |
| Less than High School | 0 (0.0%) | 29 (100.0%) |
| High School Diploma | 37 (61.7%) | 23 (38.3%) |
| College or Associate's Degree | 27 (36.5%) | 47 (63.5%) |
| Bachelor's Degree | 68 (51.9%) | 63 (48.1%) |
| Graduate Degree | 0 (0.0%) | 0 (0.0%) |
| Total | 132 (44.9%) | 162 (55.1%) |
Employment Characteristics in Guayama Municipio
Employment by Class of Employer in Guayama Municipio
Among the 9,166 employed individuals in Guayama Municipio, private company employees (6,297 | 68.7%), state government employees (1,084 | 11.8%), and self-employed (not incorporated) (646 | 7.0%) make up the most common classes of employment.
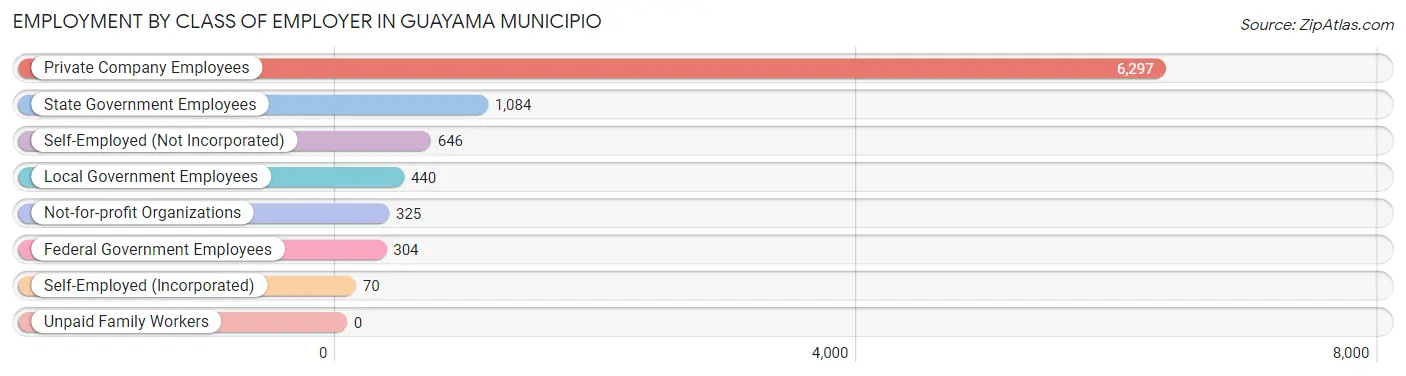
| Employer Class | # Employees | % Employees |
| Private Company Employees | 6,297 | 68.7% |
| Self-Employed (Incorporated) | 70 | 0.8% |
| Self-Employed (Not Incorporated) | 646 | 7.0% |
| Not-for-profit Organizations | 325 | 3.5% |
| Local Government Employees | 440 | 4.8% |
| State Government Employees | 1,084 | 11.8% |
| Federal Government Employees | 304 | 3.3% |
| Unpaid Family Workers | 0 | 0.0% |
| Total | 9,166 | 100.0% |
Employment Status by Age in Guayama Municipio
According to the labor force statistics for Guayama Municipio, out of the total population over 16 years of age (30,670), 32.9% or 10,090 individuals are in the labor force, with 6.8% or 686 of them unemployed. The age group with the highest labor force participation rate is 35 to 44 years, with 57.1% or 2,512 individuals in the labor force. Within the labor force, the 16 to 19 years age range has the highest percentage of unemployed individuals, with 16.7% or 31 of them being unemployed.
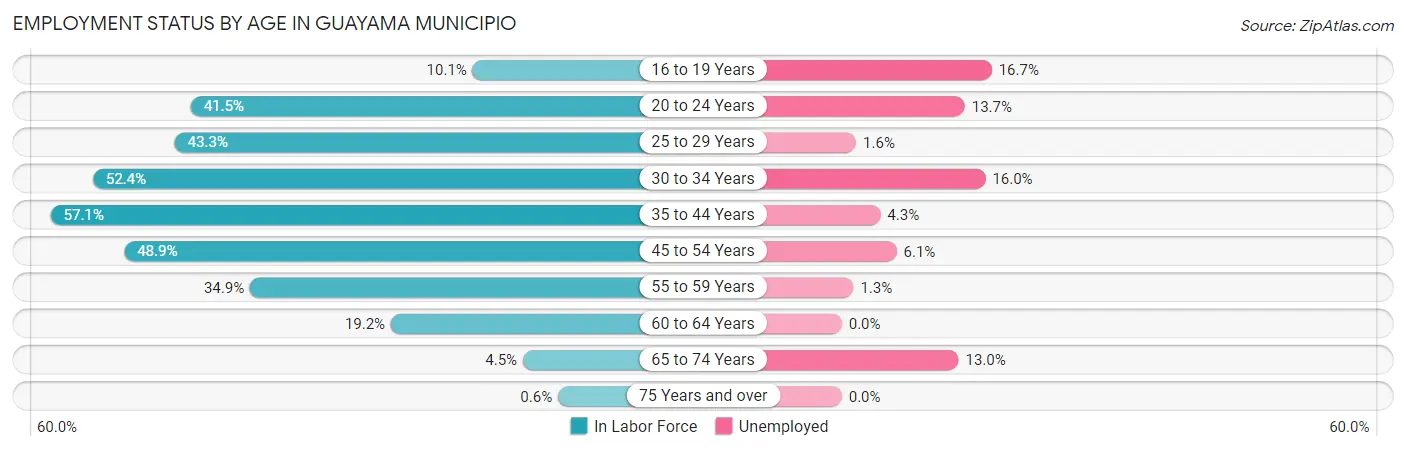
| Age Bracket | In Labor Force | Unemployed |
| 16 to 19 Years | 186 (10.1%) | 31 (16.7%) |
| 20 to 24 Years | 1,129 (41.5%) | 155 (13.7%) |
| 25 to 29 Years | 1,280 (43.3%) | 20 (1.6%) |
| 30 to 34 Years | 1,282 (52.4%) | 205 (16.0%) |
| 35 to 44 Years | 2,512 (57.1%) | 108 (4.3%) |
| 45 to 54 Years | 2,245 (48.9%) | 137 (6.1%) |
| 55 to 59 Years | 829 (34.9%) | 11 (1.3%) |
| 60 to 64 Years | 420 (19.2%) | 0 (0.0%) |
| 65 to 74 Years | 179 (4.5%) | 23 (13.0%) |
| 75 Years and over | 19 (0.6%) | 0 (0.0%) |
| Total | 10,090 (32.9%) | 686 (6.8%) |
Employment Status by Educational Attainment in Guayama Municipio
According to labor force statistics for Guayama Municipio, 45.2% of individuals (8,569) out of the total population between 25 and 64 years of age (18,957) are in the labor force, with 5.6% or 480 of them being unemployed. The group with the highest labor force participation rate are those with the educational attainment of bachelor's degree or higher, with 75.4% or 3,356 individuals in the labor force. Within the labor force, individuals with less than high school education have the highest percentage of unemployment, with 19.9% or 116 of them being unemployed.
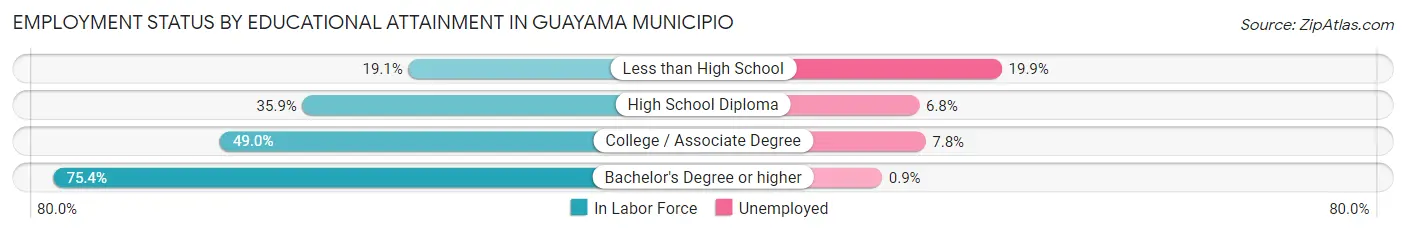
| Educational Attainment | In Labor Force | Unemployed |
| Less than High School | 584 (19.1%) | 608 (19.9%) |
| High School Diploma | 2,696 (35.9%) | 511 (6.8%) |
| College / Associate Degree | 1,931 (49.0%) | 307 (7.8%) |
| Bachelor's Degree or higher | 3,356 (75.4%) | 40 (0.9%) |
| Total | 8,569 (45.2%) | 1,062 (5.6%) |
Employment Occupations by Sex in Guayama Municipio
Management, Business, Science and Arts Occupations
The most common Management, Business, Science and Arts occupations in Guayama Municipio are Community & Social Service (1,071 | 11.4%), Education Instruction & Library (677 | 7.2%), Health Diagnosing & Treating (660 | 7.0%), Management (587 | 6.2%), and Business & Financial (535 | 5.7%).
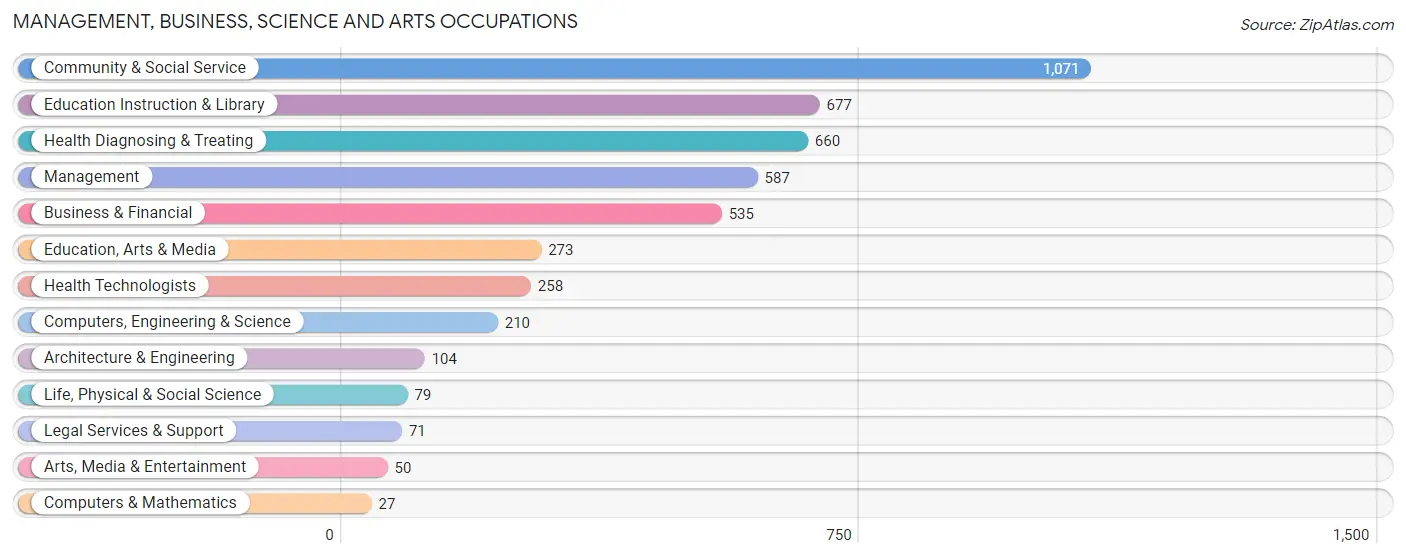
Management, Business, Science and Arts Occupations by Sex
Within the Management, Business, Science and Arts occupations in Guayama Municipio, the most male-oriented occupations are Computers & Mathematics (100.0%), Arts, Media & Entertainment (84.0%), and Architecture & Engineering (66.3%), while the most female-oriented occupations are Health Technologists (94.6%), Education Instruction & Library (85.7%), and Business & Financial (80.9%).
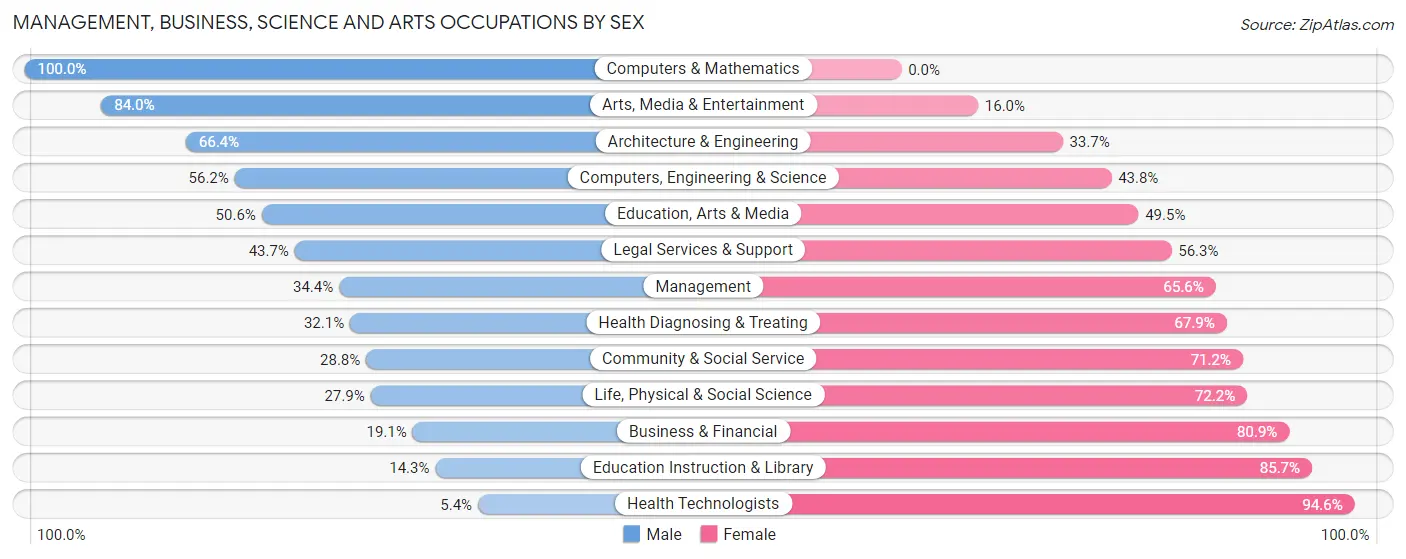
| Occupation | Male | Female |
| Management | 202 (34.4%) | 385 (65.6%) |
| Business & Financial | 102 (19.1%) | 433 (80.9%) |
| Computers, Engineering & Science | 118 (56.2%) | 92 (43.8%) |
| Computers & Mathematics | 27 (100.0%) | 0 (0.0%) |
| Architecture & Engineering | 69 (66.3%) | 35 (33.7%) |
| Life, Physical & Social Science | 22 (27.9%) | 57 (72.2%) |
| Community & Social Service | 308 (28.8%) | 763 (71.2%) |
| Education, Arts & Media | 138 (50.5%) | 135 (49.4%) |
| Legal Services & Support | 31 (43.7%) | 40 (56.3%) |
| Education Instruction & Library | 97 (14.3%) | 580 (85.7%) |
| Arts, Media & Entertainment | 42 (84.0%) | 8 (16.0%) |
| Health Diagnosing & Treating | 212 (32.1%) | 448 (67.9%) |
| Health Technologists | 14 (5.4%) | 244 (94.6%) |
| Total (Category) | 942 (30.7%) | 2,121 (69.3%) |
| Total (Overall) | 4,550 (48.5%) | 4,836 (51.5%) |
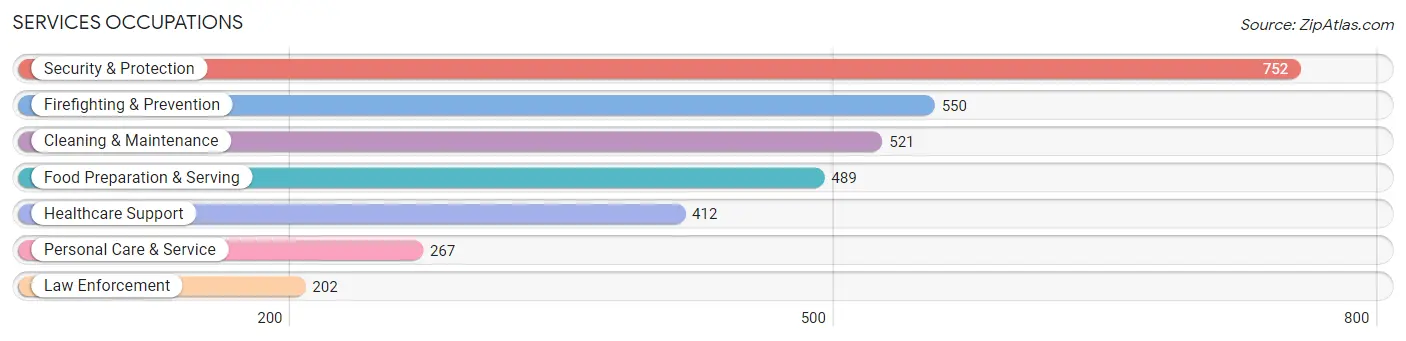
Services Occupations
The most common Services occupations in Guayama Municipio are Security & Protection (752 | 8.0%), Firefighting & Prevention (550 | 5.9%), Cleaning & Maintenance (521 | 5.6%), Food Preparation & Serving (489 | 5.2%), and Healthcare Support (412 | 4.4%).
Services Occupations by Sex
Within the Services occupations in Guayama Municipio, the most male-oriented occupations are Cleaning & Maintenance (67.2%), Firefighting & Prevention (61.1%), and Security & Protection (60.9%), while the most female-oriented occupations are Healthcare Support (100.0%), Food Preparation & Serving (53.4%), and Personal Care & Service (45.3%).
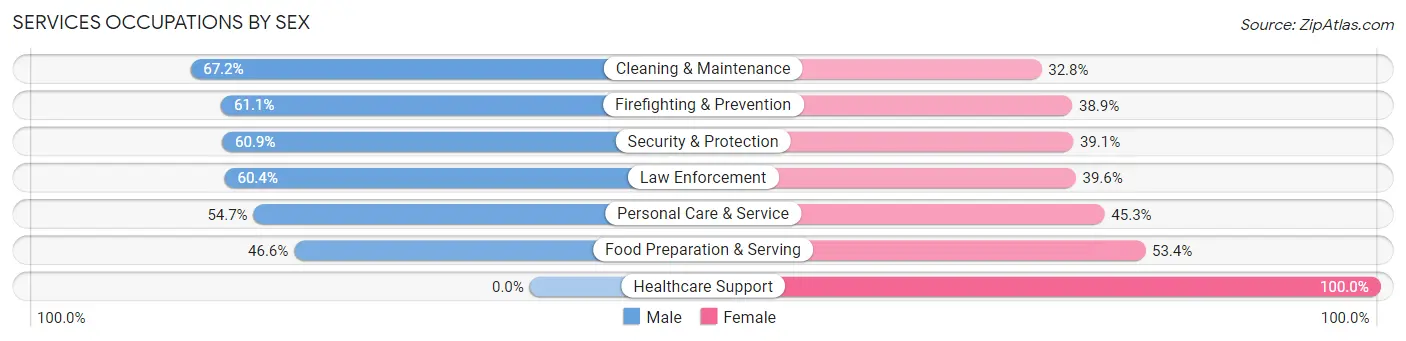
| Occupation | Male | Female |
| Healthcare Support | 0 (0.0%) | 412 (100.0%) |
| Security & Protection | 458 (60.9%) | 294 (39.1%) |
| Firefighting & Prevention | 336 (61.1%) | 214 (38.9%) |
| Law Enforcement | 122 (60.4%) | 80 (39.6%) |
| Food Preparation & Serving | 228 (46.6%) | 261 (53.4%) |
| Cleaning & Maintenance | 350 (67.2%) | 171 (32.8%) |
| Personal Care & Service | 146 (54.7%) | 121 (45.3%) |
| Total (Category) | 1,182 (48.4%) | 1,259 (51.6%) |
| Total (Overall) | 4,550 (48.5%) | 4,836 (51.5%) |
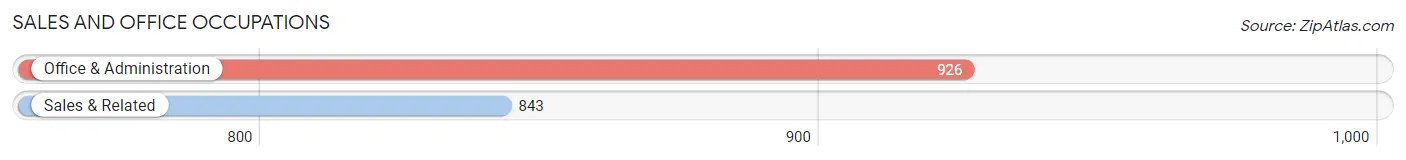
Sales and Office Occupations
The most common Sales and Office occupations in Guayama Municipio are Office & Administration (926 | 9.9%), and Sales & Related (843 | 9.0%).
Sales and Office Occupations by Sex
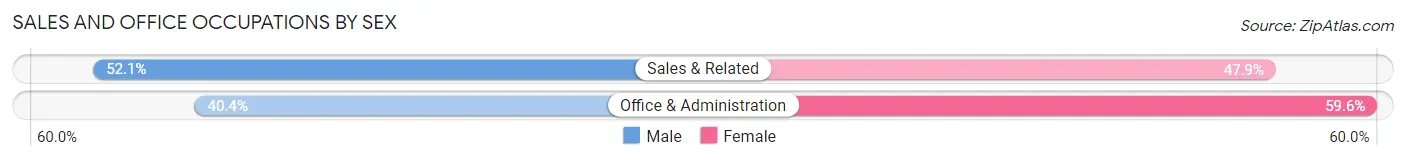
| Occupation | Male | Female |
| Sales & Related | 439 (52.1%) | 404 (47.9%) |
| Office & Administration | 374 (40.4%) | 552 (59.6%) |
| Total (Category) | 813 (46.0%) | 956 (54.0%) |
| Total (Overall) | 4,550 (48.5%) | 4,836 (51.5%) |
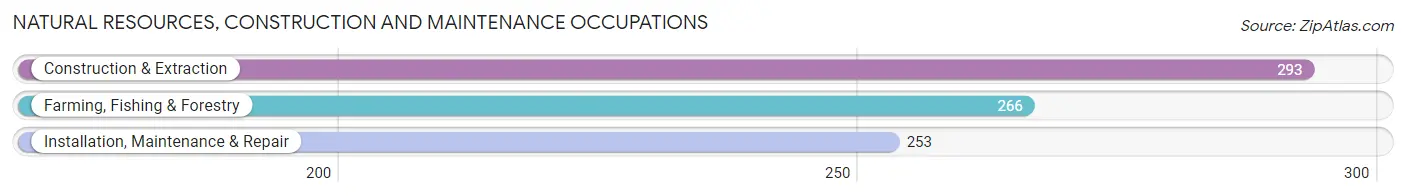
Natural Resources, Construction and Maintenance Occupations
The most common Natural Resources, Construction and Maintenance occupations in Guayama Municipio are Construction & Extraction (293 | 3.1%), Farming, Fishing & Forestry (266 | 2.8%), and Installation, Maintenance & Repair (253 | 2.7%).
Natural Resources, Construction and Maintenance Occupations by Sex
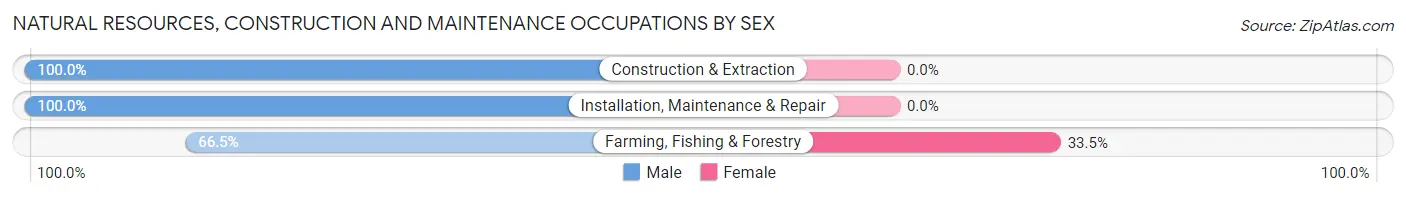
| Occupation | Male | Female |
| Farming, Fishing & Forestry | 177 (66.5%) | 89 (33.5%) |
| Construction & Extraction | 293 (100.0%) | 0 (0.0%) |
| Installation, Maintenance & Repair | 253 (100.0%) | 0 (0.0%) |
| Total (Category) | 723 (89.0%) | 89 (11.0%) |
| Total (Overall) | 4,550 (48.5%) | 4,836 (51.5%) |
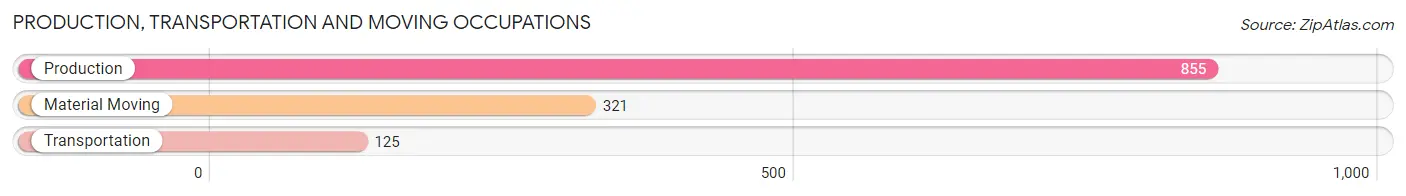
Production, Transportation and Moving Occupations
The most common Production, Transportation and Moving occupations in Guayama Municipio are Production (855 | 9.1%), Material Moving (321 | 3.4%), and Transportation (125 | 1.3%).
Production, Transportation and Moving Occupations by Sex
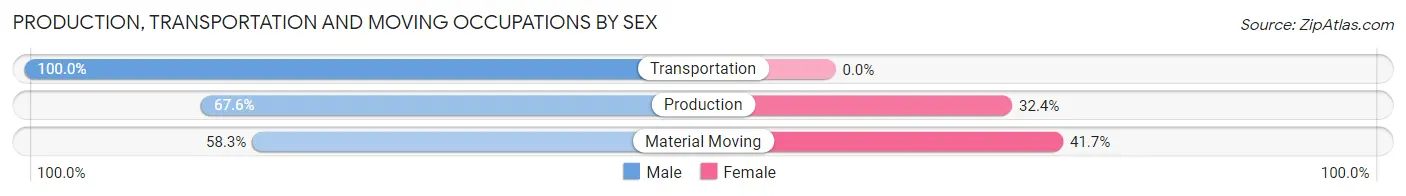
| Occupation | Male | Female |
| Production | 578 (67.6%) | 277 (32.4%) |
| Transportation | 125 (100.0%) | 0 (0.0%) |
| Material Moving | 187 (58.3%) | 134 (41.7%) |
| Total (Category) | 890 (68.4%) | 411 (31.6%) |
| Total (Overall) | 4,550 (48.5%) | 4,836 (51.5%) |
Employment Industries by Sex in Guayama Municipio
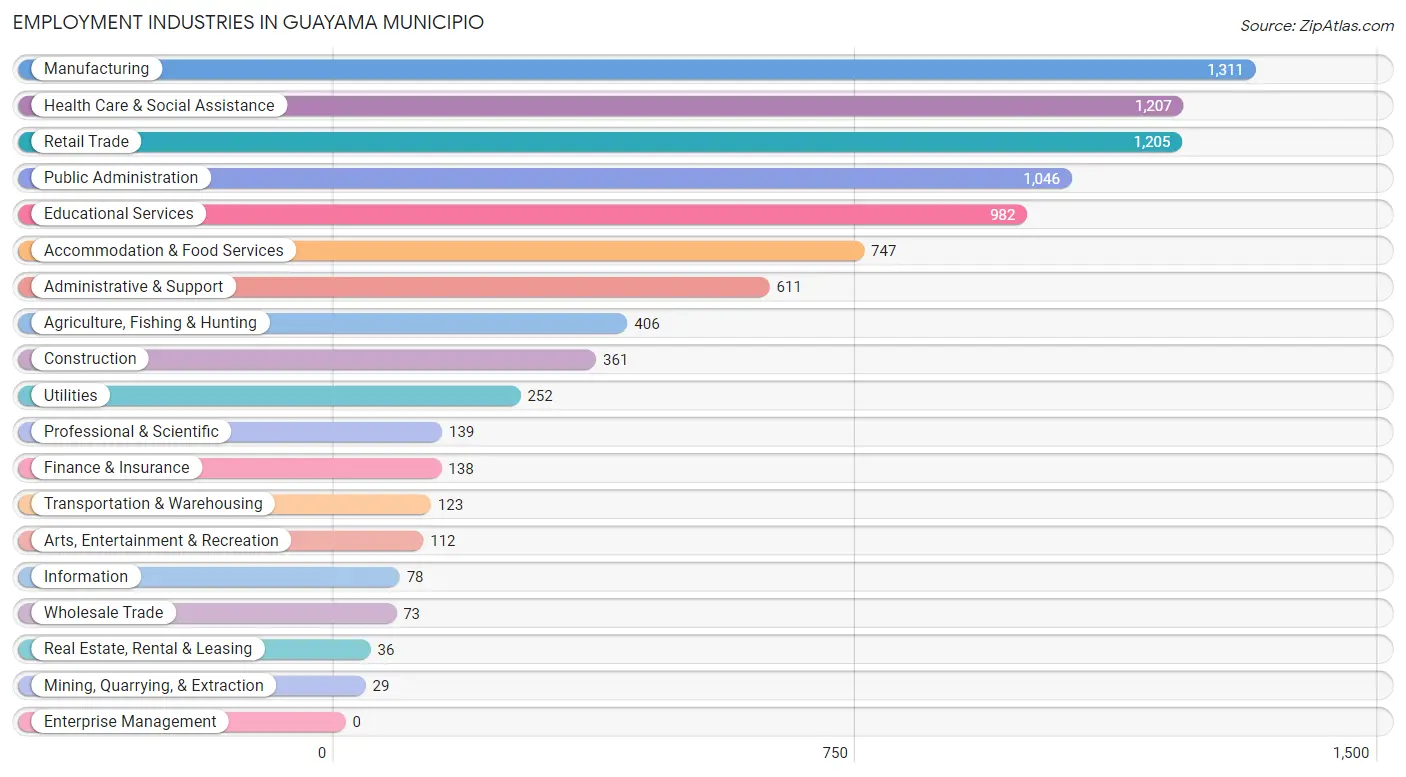
Employment Industries in Guayama Municipio
The major employment industries in Guayama Municipio include Manufacturing (1,311 | 14.0%), Health Care & Social Assistance (1,207 | 12.9%), Retail Trade (1,205 | 12.8%), Public Administration (1,046 | 11.1%), and Educational Services (982 | 10.5%).
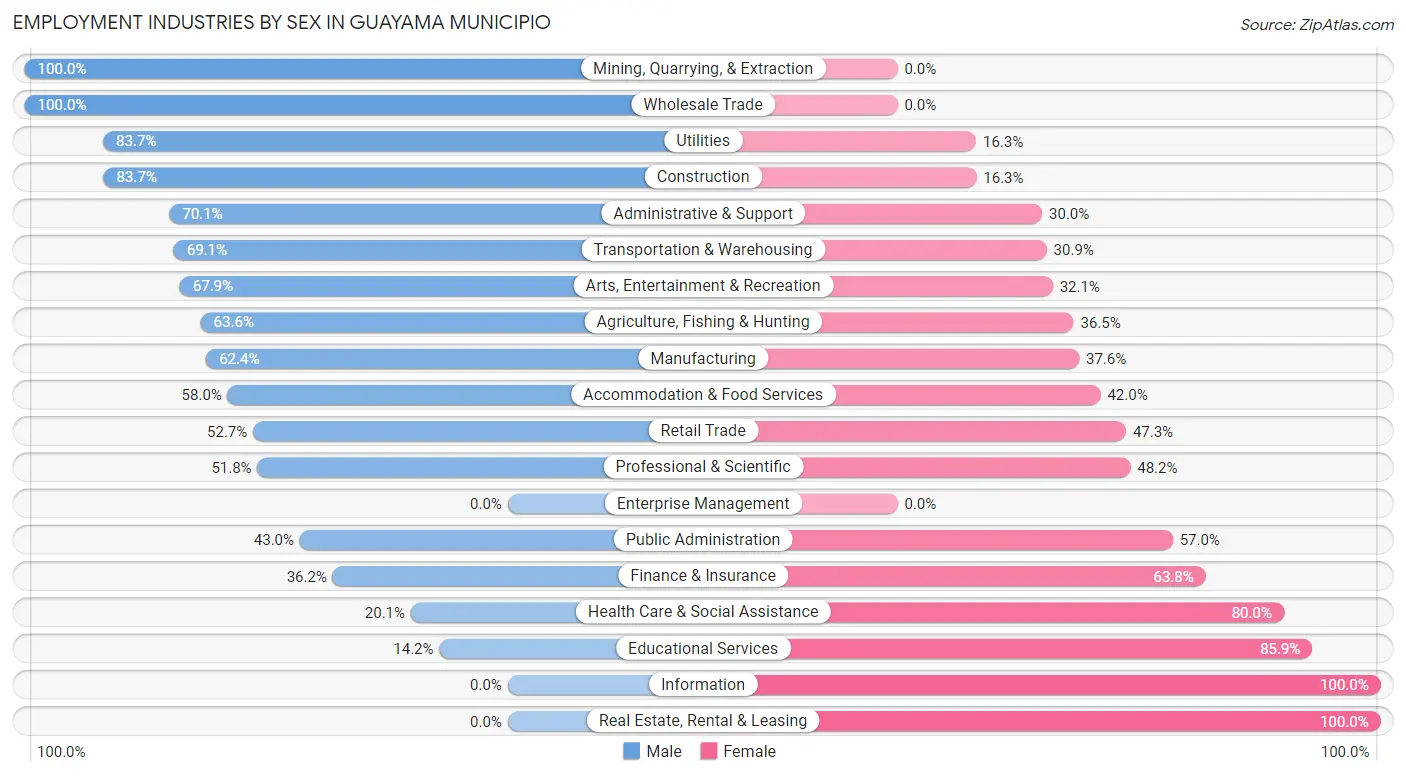
Employment Industries by Sex in Guayama Municipio
The Guayama Municipio industries that see more men than women are Mining, Quarrying, & Extraction (100.0%), Wholesale Trade (100.0%), and Utilities (83.7%), whereas the industries that tend to have a higher number of women are Information (100.0%), Real Estate, Rental & Leasing (100.0%), and Educational Services (85.9%).
| Industry | Male | Female |
| Agriculture, Fishing & Hunting | 258 (63.5%) | 148 (36.4%) |
| Mining, Quarrying, & Extraction | 29 (100.0%) | 0 (0.0%) |
| Construction | 302 (83.7%) | 59 (16.3%) |
| Manufacturing | 818 (62.4%) | 493 (37.6%) |
| Wholesale Trade | 73 (100.0%) | 0 (0.0%) |
| Retail Trade | 635 (52.7%) | 570 (47.3%) |
| Transportation & Warehousing | 85 (69.1%) | 38 (30.9%) |
| Utilities | 211 (83.7%) | 41 (16.3%) |
| Information | 0 (0.0%) | 78 (100.0%) |
| Finance & Insurance | 50 (36.2%) | 88 (63.8%) |
| Real Estate, Rental & Leasing | 0 (0.0%) | 36 (100.0%) |
| Professional & Scientific | 72 (51.8%) | 67 (48.2%) |
| Enterprise Management | 0 (0.0%) | 0 (0.0%) |
| Administrative & Support | 428 (70.1%) | 183 (29.9%) |
| Educational Services | 139 (14.1%) | 843 (85.9%) |
| Health Care & Social Assistance | 242 (20.1%) | 965 (79.9%) |
| Arts, Entertainment & Recreation | 76 (67.9%) | 36 (32.1%) |
| Accommodation & Food Services | 433 (58.0%) | 314 (42.0%) |
| Public Administration | 450 (43.0%) | 596 (57.0%) |
| Total | 4,550 (48.5%) | 4,836 (51.5%) |
Education in Guayama Municipio
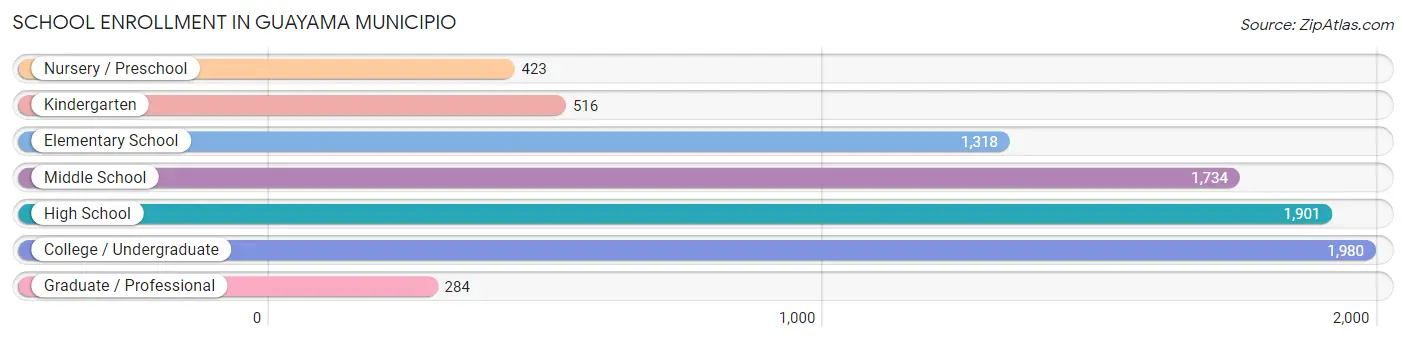
School Enrollment in Guayama Municipio
The most common levels of schooling among the 8,156 students in Guayama Municipio are college / undergraduate (1,980 | 24.3%), high school (1,901 | 23.3%), and middle school (1,734 | 21.3%).
| School Level | # Students | % Students |
| Nursery / Preschool | 423 | 5.2% |
| Kindergarten | 516 | 6.3% |
| Elementary School | 1,318 | 16.2% |
| Middle School | 1,734 | 21.3% |
| High School | 1,901 | 23.3% |
| College / Undergraduate | 1,980 | 24.3% |
| Graduate / Professional | 284 | 3.5% |
| Total | 8,156 | 100.0% |
School Enrollment by Age by Funding Source in Guayama Municipio
Out of a total of 8,156 students who are enrolled in schools in Guayama Municipio, 530 (6.5%) attend a private institution, while the remaining 7,626 (93.5%) are enrolled in public schools. The age group of 35 years and over has the highest likelihood of being enrolled in private schools, with 89 (39.4% in the age bracket) enrolled. Conversely, the age group of 3 to 4 year olds has the lowest likelihood of being enrolled in a private school, with 423 (100.0% in the age bracket) attending a public institution.
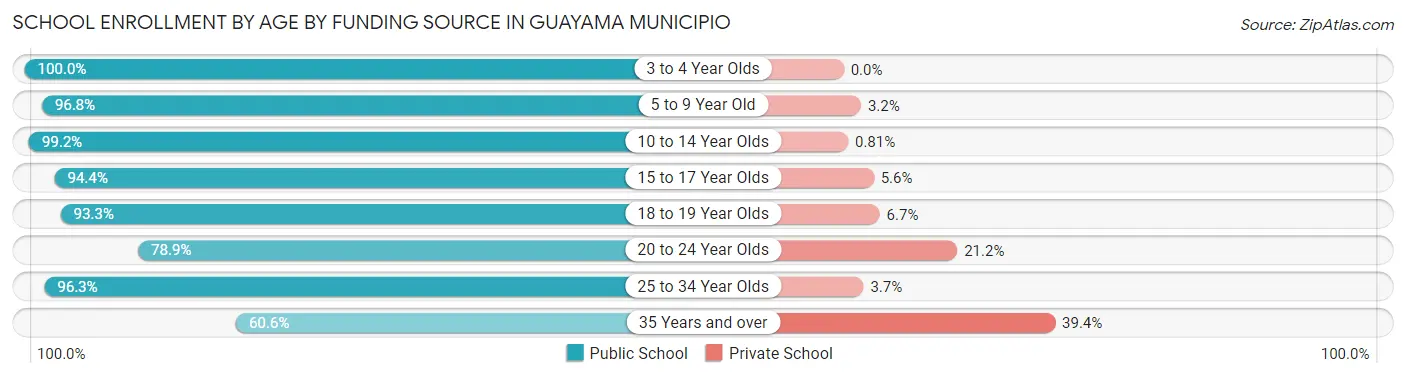
| Age Bracket | Public School | Private School |
| 3 to 4 Year Olds | 423 (100.0%) | 0 (0.0%) |
| 5 to 9 Year Old | 1,594 (96.8%) | 53 (3.2%) |
| 10 to 14 Year Olds | 2,216 (99.2%) | 18 (0.8%) |
| 15 to 17 Year Olds | 1,333 (94.4%) | 79 (5.6%) |
| 18 to 19 Year Olds | 655 (93.3%) | 47 (6.7%) |
| 20 to 24 Year Olds | 850 (78.8%) | 228 (21.1%) |
| 25 to 34 Year Olds | 418 (96.3%) | 16 (3.7%) |
| 35 Years and over | 137 (60.6%) | 89 (39.4%) |
| Total | 7,626 (93.5%) | 530 (6.5%) |
Educational Attainment by Field of Study in Guayama Municipio
Business (1,606 | 26.8%), education (1,570 | 26.2%), science & technology (750 | 12.5%), arts & humanities (484 | 8.1%), and physical & health sciences (335 | 5.6%) are the most common fields of study among 6,004 individuals in Guayama Municipio who have obtained a bachelor's degree or higher.
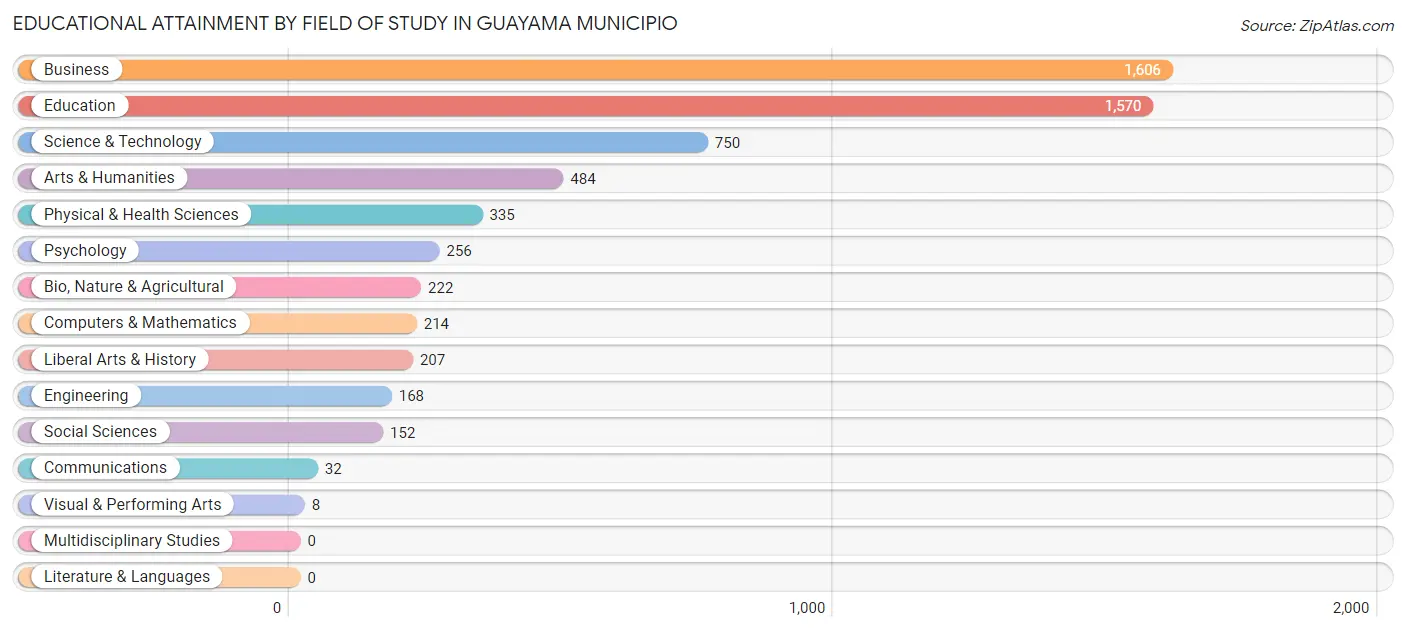
| Field of Study | # Graduates | % Graduates |
| Computers & Mathematics | 214 | 3.6% |
| Bio, Nature & Agricultural | 222 | 3.7% |
| Physical & Health Sciences | 335 | 5.6% |
| Psychology | 256 | 4.3% |
| Social Sciences | 152 | 2.5% |
| Engineering | 168 | 2.8% |
| Multidisciplinary Studies | 0 | 0.0% |
| Science & Technology | 750 | 12.5% |
| Business | 1,606 | 26.8% |
| Education | 1,570 | 26.2% |
| Literature & Languages | 0 | 0.0% |
| Liberal Arts & History | 207 | 3.5% |
| Visual & Performing Arts | 8 | 0.1% |
| Communications | 32 | 0.5% |
| Arts & Humanities | 484 | 8.1% |
| Total | 6,004 | 100.0% |
Transportation & Commute in Guayama Municipio
Vehicle Availability by Sex in Guayama Municipio
The most prevalent vehicle ownership categories in Guayama Municipio are males with 2 vehicles (2,356, accounting for 53.6%) and females with 2 vehicles (2,383, making up 49.6%).
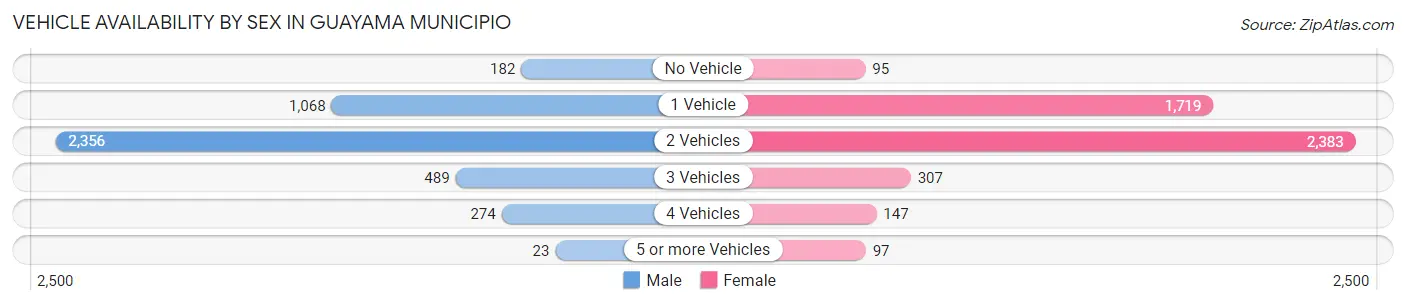
| Vehicles Available | Male | Female |
| No Vehicle | 182 (4.1%) | 95 (2.0%) |
| 1 Vehicle | 1,068 (24.3%) | 1,719 (36.2%) |
| 2 Vehicles | 2,356 (53.6%) | 2,383 (50.2%) |
| 3 Vehicles | 489 (11.1%) | 307 (6.5%) |
| 4 Vehicles | 274 (6.2%) | 147 (3.1%) |
| 5 or more Vehicles | 23 (0.5%) | 97 (2.0%) |
| Total | 4,392 (100.0%) | 4,748 (100.0%) |
Commute Time in Guayama Municipio
The most frequently occuring commute durations in Guayama Municipio are 20 to 24 minutes (2,336 commuters, 26.3%), 10 to 14 minutes (1,394 commuters, 15.7%), and 15 to 19 minutes (1,318 commuters, 14.9%).
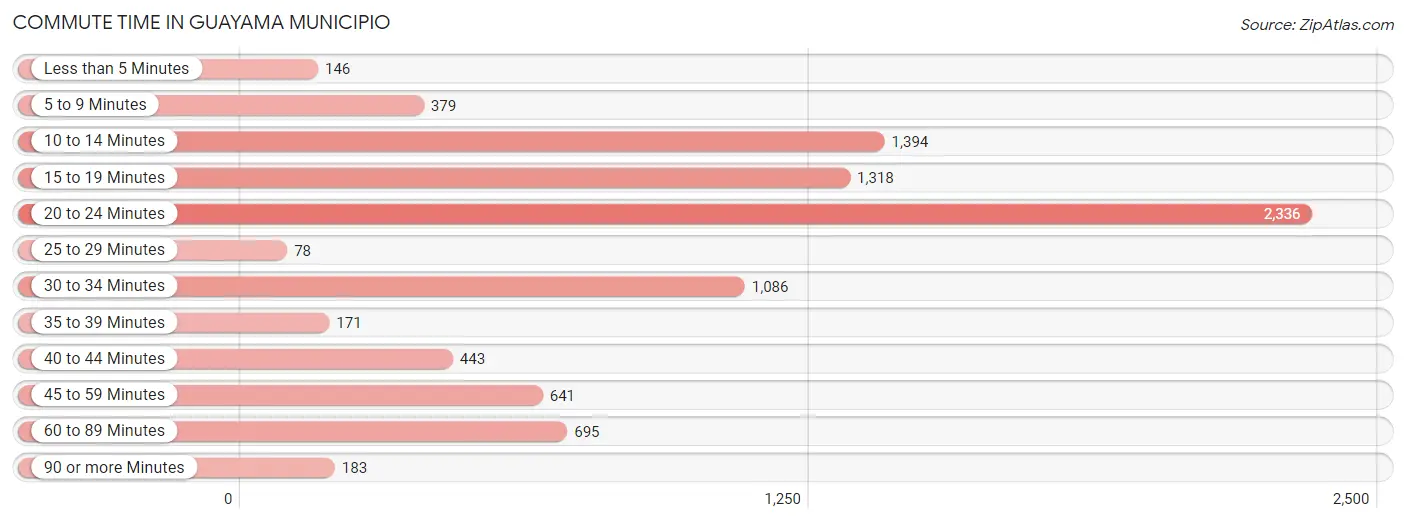
| Commute Time | # Commuters | % Commuters |
| Less than 5 Minutes | 146 | 1.7% |
| 5 to 9 Minutes | 379 | 4.3% |
| 10 to 14 Minutes | 1,394 | 15.7% |
| 15 to 19 Minutes | 1,318 | 14.9% |
| 20 to 24 Minutes | 2,336 | 26.3% |
| 25 to 29 Minutes | 78 | 0.9% |
| 30 to 34 Minutes | 1,086 | 12.2% |
| 35 to 39 Minutes | 171 | 1.9% |
| 40 to 44 Minutes | 443 | 5.0% |
| 45 to 59 Minutes | 641 | 7.2% |
| 60 to 89 Minutes | 695 | 7.8% |
| 90 or more Minutes | 183 | 2.1% |
Commute Time by Sex in Guayama Municipio
The most common commute times in Guayama Municipio are 20 to 24 minutes (1,136 commuters, 26.8%) for males and 20 to 24 minutes (1,200 commuters, 26.0%) for females.
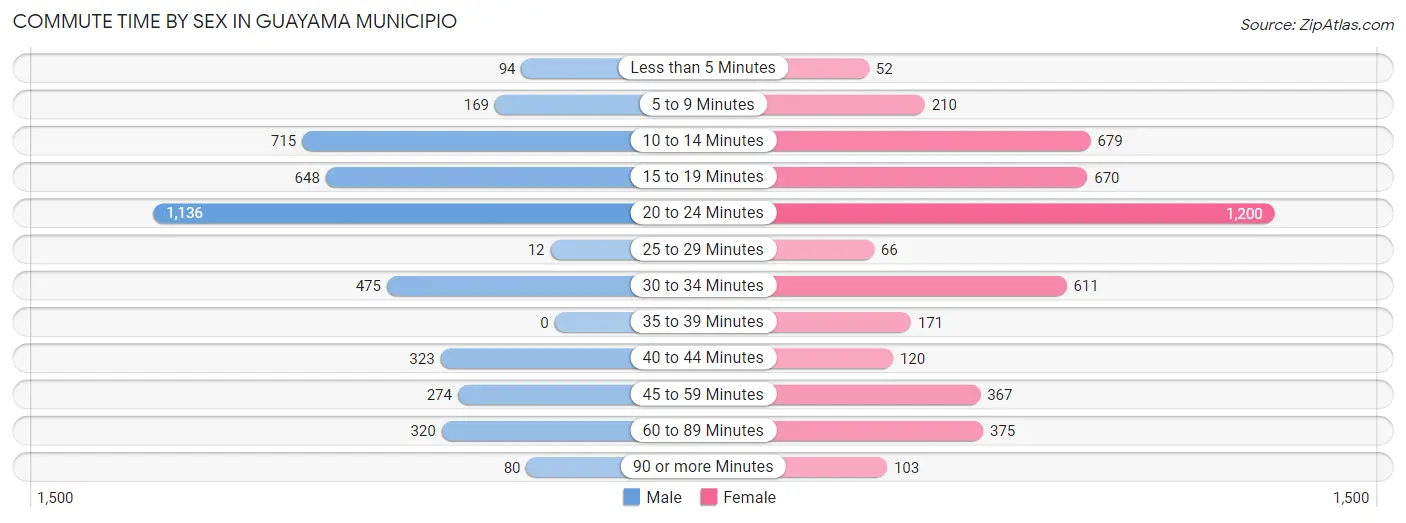
| Commute Time | Male | Female |
| Less than 5 Minutes | 94 (2.2%) | 52 (1.1%) |
| 5 to 9 Minutes | 169 (4.0%) | 210 (4.5%) |
| 10 to 14 Minutes | 715 (16.8%) | 679 (14.7%) |
| 15 to 19 Minutes | 648 (15.3%) | 670 (14.5%) |
| 20 to 24 Minutes | 1,136 (26.8%) | 1,200 (26.0%) |
| 25 to 29 Minutes | 12 (0.3%) | 66 (1.4%) |
| 30 to 34 Minutes | 475 (11.2%) | 611 (13.2%) |
| 35 to 39 Minutes | 0 (0.0%) | 171 (3.7%) |
| 40 to 44 Minutes | 323 (7.6%) | 120 (2.6%) |
| 45 to 59 Minutes | 274 (6.5%) | 367 (7.9%) |
| 60 to 89 Minutes | 320 (7.5%) | 375 (8.1%) |
| 90 or more Minutes | 80 (1.9%) | 103 (2.2%) |
Time of Departure to Work by Sex in Guayama Municipio
The most frequent times of departure to work in Guayama Municipio are 6:00 AM to 6:29 AM (605, 14.2%) for males and 7:00 AM to 7:29 AM (915, 19.8%) for females.
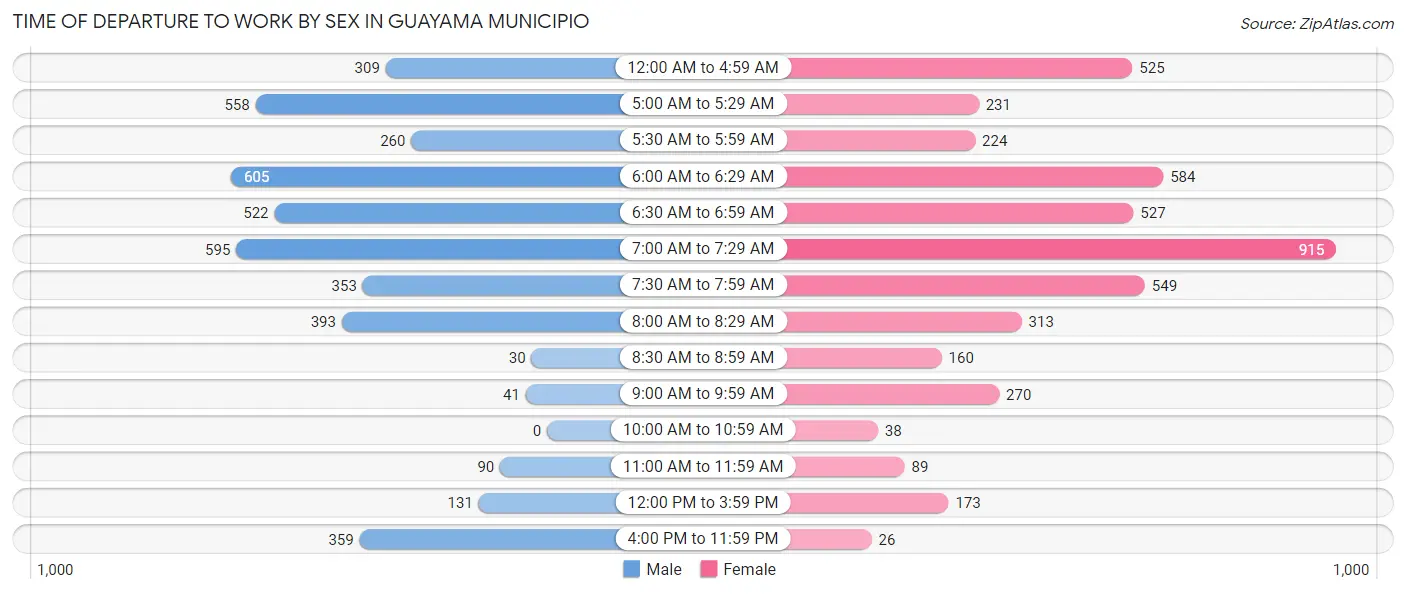
| Time of Departure | Male | Female |
| 12:00 AM to 4:59 AM | 309 (7.3%) | 525 (11.4%) |
| 5:00 AM to 5:29 AM | 558 (13.1%) | 231 (5.0%) |
| 5:30 AM to 5:59 AM | 260 (6.1%) | 224 (4.8%) |
| 6:00 AM to 6:29 AM | 605 (14.2%) | 584 (12.6%) |
| 6:30 AM to 6:59 AM | 522 (12.3%) | 527 (11.4%) |
| 7:00 AM to 7:29 AM | 595 (14.0%) | 915 (19.8%) |
| 7:30 AM to 7:59 AM | 353 (8.3%) | 549 (11.9%) |
| 8:00 AM to 8:29 AM | 393 (9.3%) | 313 (6.8%) |
| 8:30 AM to 8:59 AM | 30 (0.7%) | 160 (3.5%) |
| 9:00 AM to 9:59 AM | 41 (1.0%) | 270 (5.8%) |
| 10:00 AM to 10:59 AM | 0 (0.0%) | 38 (0.8%) |
| 11:00 AM to 11:59 AM | 90 (2.1%) | 89 (1.9%) |
| 12:00 PM to 3:59 PM | 131 (3.1%) | 173 (3.7%) |
| 4:00 PM to 11:59 PM | 359 (8.5%) | 26 (0.6%) |
| Total | 4,246 (100.0%) | 4,624 (100.0%) |
Housing Occupancy in Guayama Municipio
Occupancy by Ownership in Guayama Municipio
Of the total 14,427 dwellings in Guayama Municipio, owner-occupied units account for 10,217 (70.8%), while renter-occupied units make up 4,210 (29.2%).
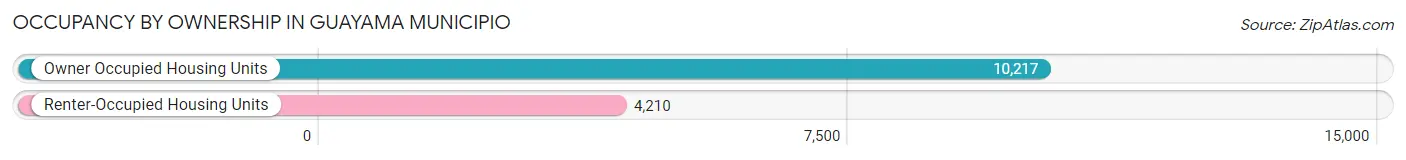
| Occupancy | # Housing Units | % Housing Units |
| Owner Occupied Housing Units | 10,217 | 70.8% |
| Renter-Occupied Housing Units | 4,210 | 29.2% |
| Total Occupied Housing Units | 14,427 | 100.0% |
Occupancy by Household Size in Guayama Municipio
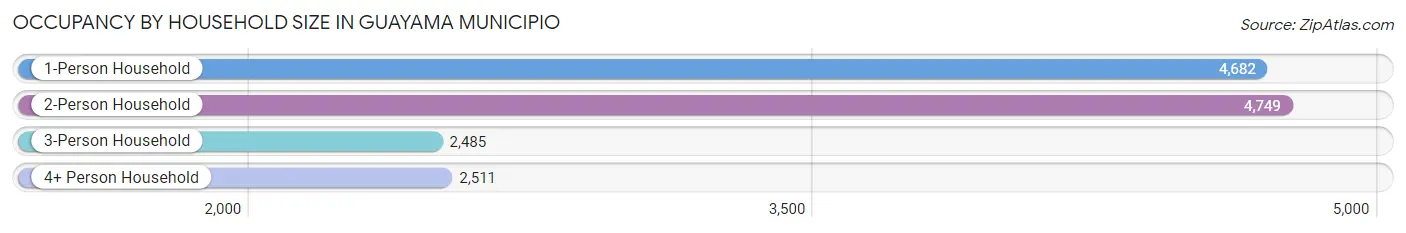
| Household Size | # Housing Units | % Housing Units |
| 1-Person Household | 4,682 | 32.5% |
| 2-Person Household | 4,749 | 32.9% |
| 3-Person Household | 2,485 | 17.2% |
| 4+ Person Household | 2,511 | 17.4% |
| Total Housing Units | 14,427 | 100.0% |
Occupancy by Ownership by Household Size in Guayama Municipio
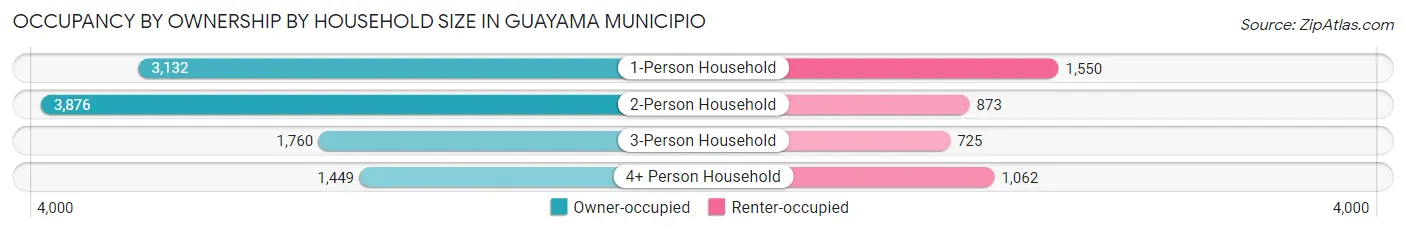
| Household Size | Owner-occupied | Renter-occupied |
| 1-Person Household | 3,132 (66.9%) | 1,550 (33.1%) |
| 2-Person Household | 3,876 (81.6%) | 873 (18.4%) |
| 3-Person Household | 1,760 (70.8%) | 725 (29.2%) |
| 4+ Person Household | 1,449 (57.7%) | 1,062 (42.3%) |
| Total Housing Units | 10,217 (70.8%) | 4,210 (29.2%) |
Occupancy by Educational Attainment in Guayama Municipio
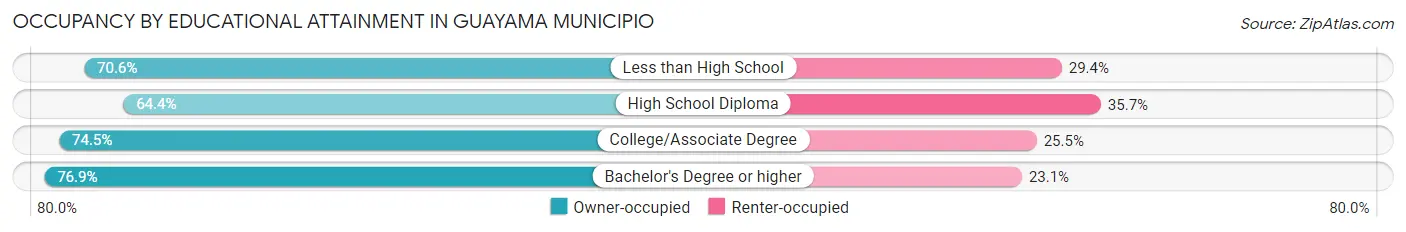
| Household Size | Owner-occupied | Renter-occupied |
| Less than High School | 2,042 (70.6%) | 852 (29.4%) |
| High School Diploma | 3,218 (64.3%) | 1,783 (35.6%) |
| College/Associate Degree | 2,054 (74.5%) | 702 (25.5%) |
| Bachelor's Degree or higher | 2,903 (76.9%) | 873 (23.1%) |
Occupancy by Age of Householder in Guayama Municipio
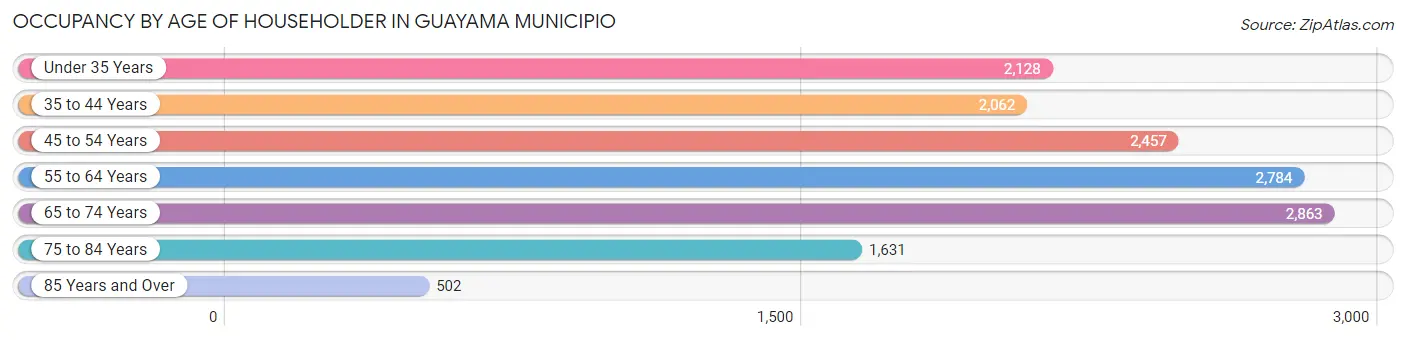
| Age Bracket | # Households | % Households |
| Under 35 Years | 2,128 | 14.7% |
| 35 to 44 Years | 2,062 | 14.3% |
| 45 to 54 Years | 2,457 | 17.0% |
| 55 to 64 Years | 2,784 | 19.3% |
| 65 to 74 Years | 2,863 | 19.8% |
| 75 to 84 Years | 1,631 | 11.3% |
| 85 Years and Over | 502 | 3.5% |
| Total | 14,427 | 100.0% |
Housing Finances in Guayama Municipio
Median Income by Occupancy in Guayama Municipio
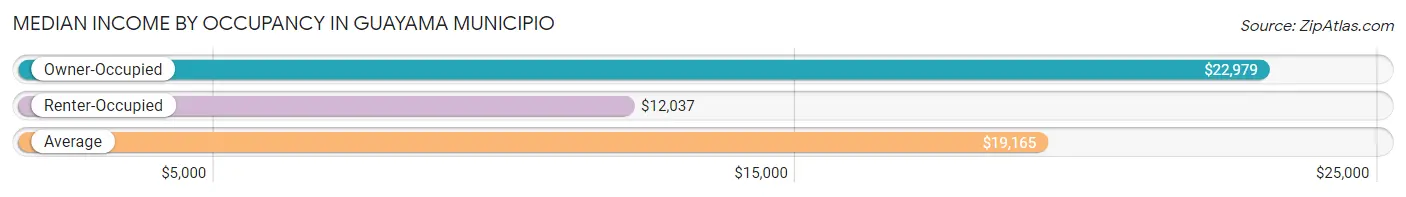
| Occupancy Type | # Households | Median Income |
| Owner-Occupied | 10,217 (70.8%) | $22,979 |
| Renter-Occupied | 4,210 (29.2%) | $12,037 |
| Average | 14,427 (100.0%) | $19,165 |
Occupancy by Householder Income Bracket in Guayama Municipio
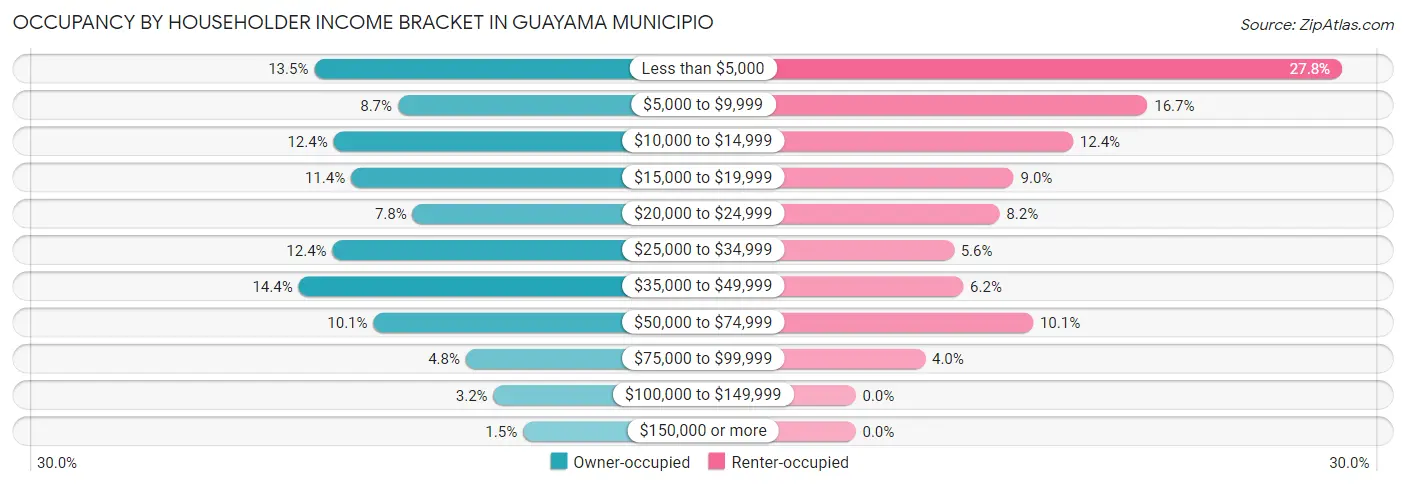
| Income Bracket | Owner-occupied | Renter-occupied |
| Less than $5,000 | 1,374 (13.5%) | 1,170 (27.8%) |
| $5,000 to $9,999 | 886 (8.7%) | 702 (16.7%) |
| $10,000 to $14,999 | 1,262 (12.3%) | 523 (12.4%) |
| $15,000 to $19,999 | 1,160 (11.4%) | 380 (9.0%) |
| $20,000 to $24,999 | 800 (7.8%) | 346 (8.2%) |
| $25,000 to $34,999 | 1,268 (12.4%) | 236 (5.6%) |
| $35,000 to $49,999 | 1,466 (14.3%) | 259 (6.1%) |
| $50,000 to $74,999 | 1,029 (10.1%) | 427 (10.1%) |
| $75,000 to $99,999 | 489 (4.8%) | 167 (4.0%) |
| $100,000 to $149,999 | 328 (3.2%) | 0 (0.0%) |
| $150,000 or more | 155 (1.5%) | 0 (0.0%) |
| Total | 10,217 (100.0%) | 4,210 (100.0%) |
Monthly Housing Cost Tiers in Guayama Municipio
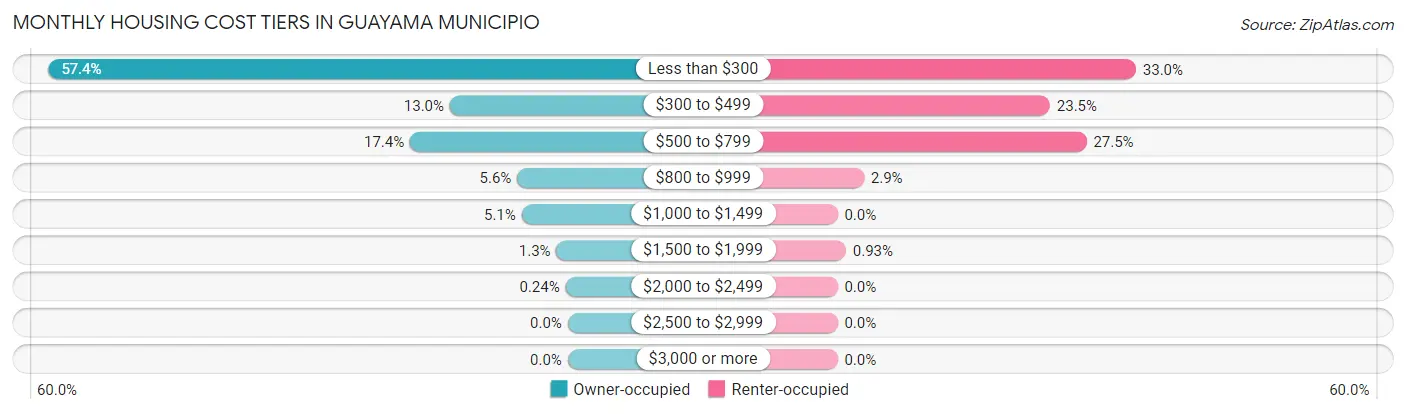
| Monthly Cost | Owner-occupied | Renter-occupied |
| Less than $300 | 5,864 (57.4%) | 1,388 (33.0%) |
| $300 to $499 | 1,330 (13.0%) | 988 (23.5%) |
| $500 to $799 | 1,780 (17.4%) | 1,158 (27.5%) |
| $800 to $999 | 570 (5.6%) | 123 (2.9%) |
| $1,000 to $1,499 | 520 (5.1%) | 0 (0.0%) |
| $1,500 to $1,999 | 128 (1.3%) | 39 (0.9%) |
| $2,000 to $2,499 | 25 (0.2%) | 0 (0.0%) |
| $2,500 to $2,999 | 0 (0.0%) | 0 (0.0%) |
| $3,000 or more | 0 (0.0%) | 0 (0.0%) |
| Total | 10,217 (100.0%) | 4,210 (100.0%) |
Physical Housing Characteristics in Guayama Municipio
Housing Structures in Guayama Municipio
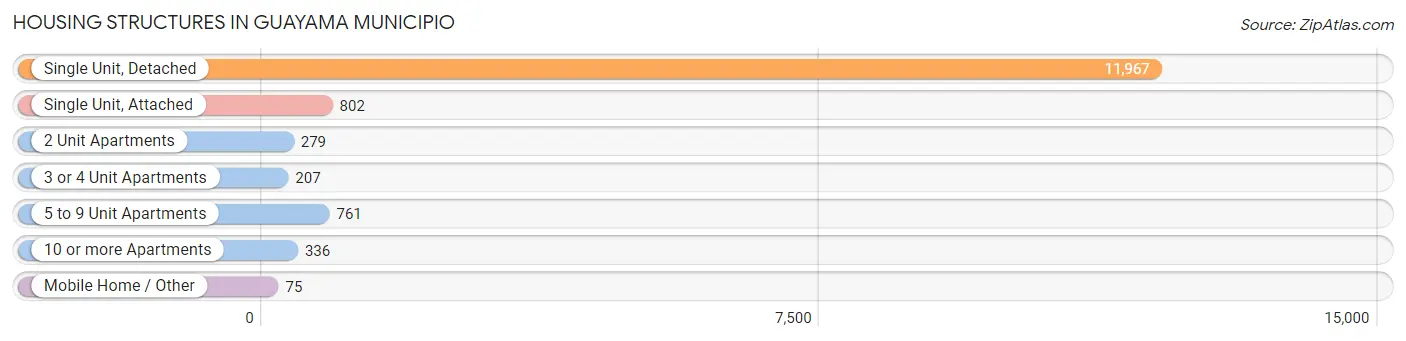
| Structure Type | # Housing Units | % Housing Units |
| Single Unit, Detached | 11,967 | 83.0% |
| Single Unit, Attached | 802 | 5.6% |
| 2 Unit Apartments | 279 | 1.9% |
| 3 or 4 Unit Apartments | 207 | 1.4% |
| 5 to 9 Unit Apartments | 761 | 5.3% |
| 10 or more Apartments | 336 | 2.3% |
| Mobile Home / Other | 75 | 0.5% |
| Total | 14,427 | 100.0% |
Housing Structures by Occupancy in Guayama Municipio
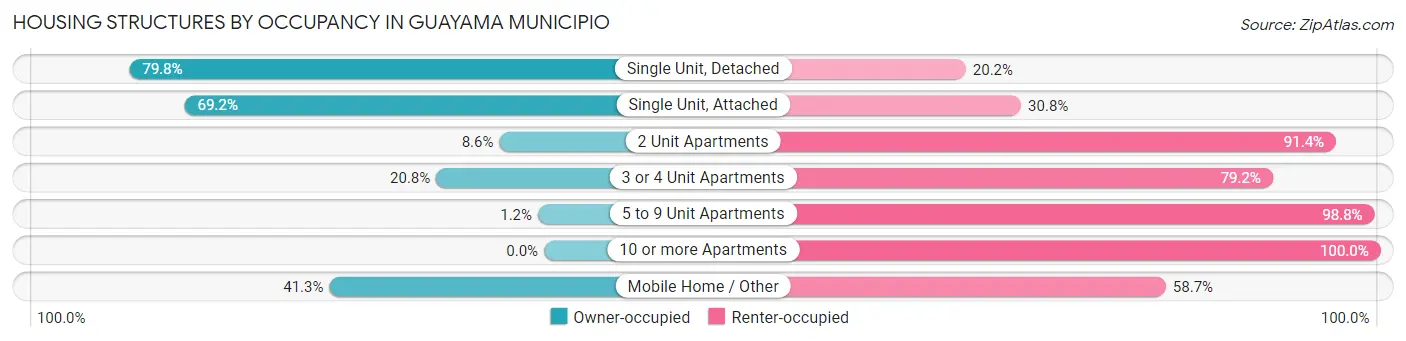
| Structure Type | Owner-occupied | Renter-occupied |
| Single Unit, Detached | 9,555 (79.8%) | 2,412 (20.2%) |
| Single Unit, Attached | 555 (69.2%) | 247 (30.8%) |
| 2 Unit Apartments | 24 (8.6%) | 255 (91.4%) |
| 3 or 4 Unit Apartments | 43 (20.8%) | 164 (79.2%) |
| 5 to 9 Unit Apartments | 9 (1.2%) | 752 (98.8%) |
| 10 or more Apartments | 0 (0.0%) | 336 (100.0%) |
| Mobile Home / Other | 31 (41.3%) | 44 (58.7%) |
| Total | 10,217 (70.8%) | 4,210 (29.2%) |
Housing Structures by Number of Rooms in Guayama Municipio
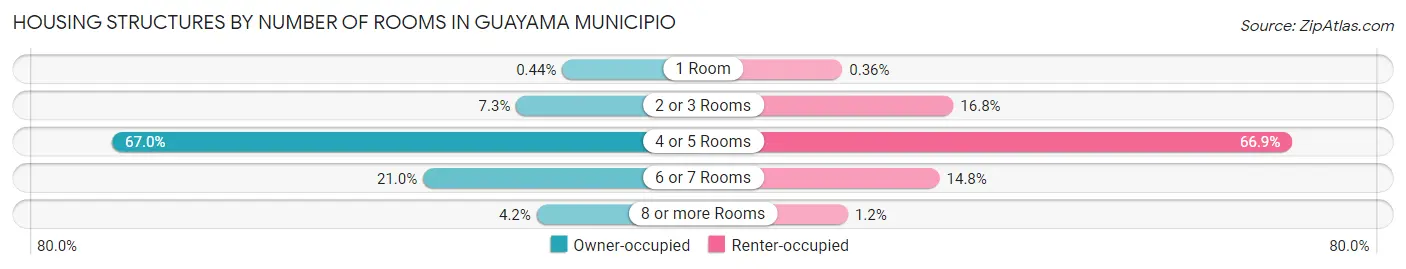
| Number of Rooms | Owner-occupied | Renter-occupied |
| 1 Room | 45 (0.4%) | 15 (0.4%) |
| 2 or 3 Rooms | 741 (7.2%) | 707 (16.8%) |
| 4 or 5 Rooms | 6,849 (67.0%) | 2,817 (66.9%) |
| 6 or 7 Rooms | 2,150 (21.0%) | 621 (14.7%) |
| 8 or more Rooms | 432 (4.2%) | 50 (1.2%) |
| Total | 10,217 (100.0%) | 4,210 (100.0%) |
Housing Structure by Heating Type in Guayama Municipio
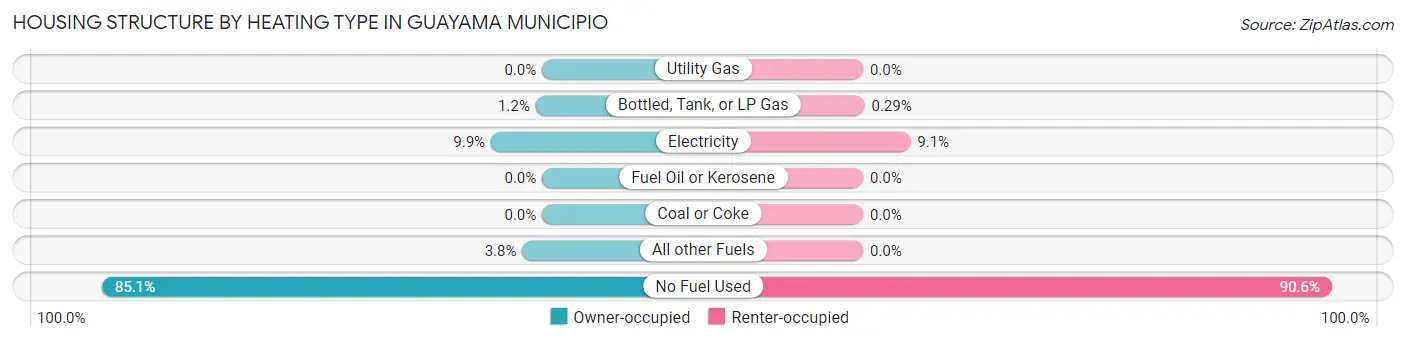
| Heating Type | Owner-occupied | Renter-occupied |
| Utility Gas | 0 (0.0%) | 0 (0.0%) |
| Bottled, Tank, or LP Gas | 126 (1.2%) | 12 (0.3%) |
| Electricity | 1,010 (9.9%) | 385 (9.1%) |
| Fuel Oil or Kerosene | 0 (0.0%) | 0 (0.0%) |
| Coal or Coke | 0 (0.0%) | 0 (0.0%) |
| All other Fuels | 390 (3.8%) | 0 (0.0%) |
| No Fuel Used | 8,691 (85.1%) | 3,813 (90.6%) |
| Total | 10,217 (100.0%) | 4,210 (100.0%) |
Household Vehicle Usage in Guayama Municipio
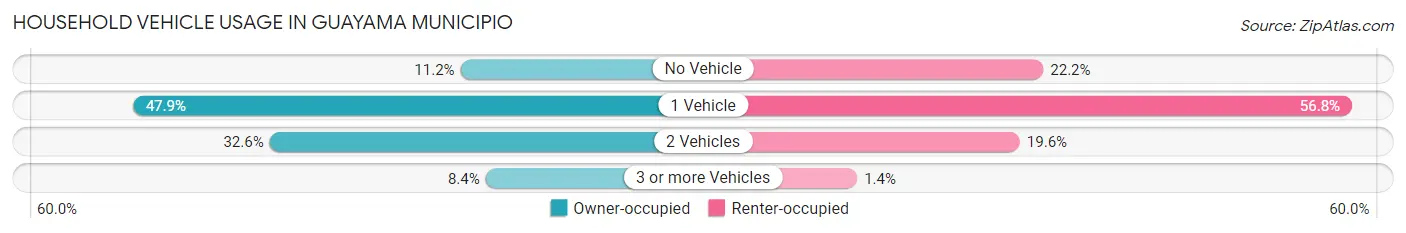
| Vehicles per Household | Owner-occupied | Renter-occupied |
| No Vehicle | 1,142 (11.2%) | 936 (22.2%) |
| 1 Vehicle | 4,893 (47.9%) | 2,391 (56.8%) |
| 2 Vehicles | 3,328 (32.6%) | 825 (19.6%) |
| 3 or more Vehicles | 854 (8.4%) | 58 (1.4%) |
| Total | 10,217 (100.0%) | 4,210 (100.0%) |
Real Estate & Mortgages in Guayama Municipio
Real Estate and Mortgage Overview in Guayama Municipio
| Characteristic | Without Mortgage | With Mortgage |
| Housing Units | 6,946 | 3,271 |
| Median Property Value | $92,700 | $117,000 |
| Median Household Income | $17,059 | $80 |
| Monthly Housing Costs | $182 | $0 |
| Real Estate Taxes | $382 | $3,105 |
Property Value by Mortgage Status in Guayama Municipio
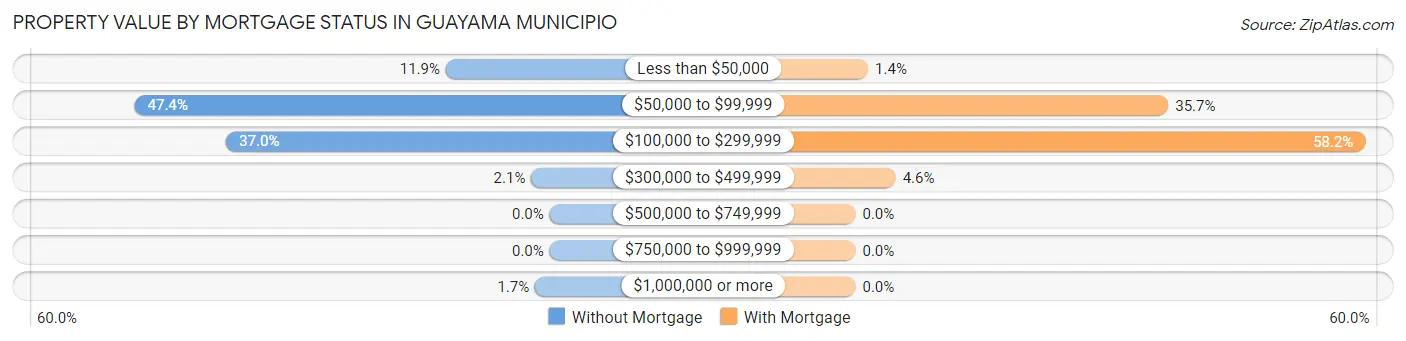
| Property Value | Without Mortgage | With Mortgage |
| Less than $50,000 | 824 (11.9%) | 47 (1.4%) |
| $50,000 to $99,999 | 3,294 (47.4%) | 1,169 (35.7%) |
| $100,000 to $299,999 | 2,567 (37.0%) | 1,905 (58.2%) |
| $300,000 to $499,999 | 146 (2.1%) | 150 (4.6%) |
| $500,000 to $749,999 | 0 (0.0%) | 0 (0.0%) |
| $750,000 to $999,999 | 0 (0.0%) | 0 (0.0%) |
| $1,000,000 or more | 115 (1.7%) | 0 (0.0%) |
| Total | 6,946 (100.0%) | 3,271 (100.0%) |
Household Income by Mortgage Status in Guayama Municipio
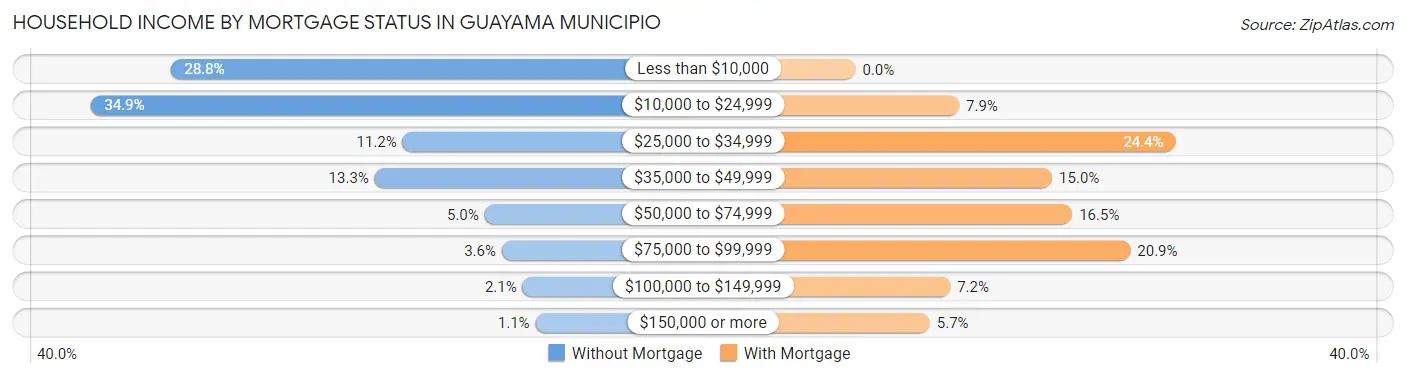
| Household Income | Without Mortgage | With Mortgage |
| Less than $10,000 | 2,002 (28.8%) | 0 (0.0%) |
| $10,000 to $24,999 | 2,425 (34.9%) | 258 (7.9%) |
| $25,000 to $34,999 | 778 (11.2%) | 797 (24.4%) |
| $35,000 to $49,999 | 926 (13.3%) | 490 (15.0%) |
| $50,000 to $74,999 | 344 (5.0%) | 540 (16.5%) |
| $75,000 to $99,999 | 253 (3.6%) | 685 (20.9%) |
| $100,000 to $149,999 | 143 (2.1%) | 236 (7.2%) |
| $150,000 or more | 75 (1.1%) | 185 (5.7%) |
| Total | 6,946 (100.0%) | 3,271 (100.0%) |
Property Value to Household Income Ratio in Guayama Municipio
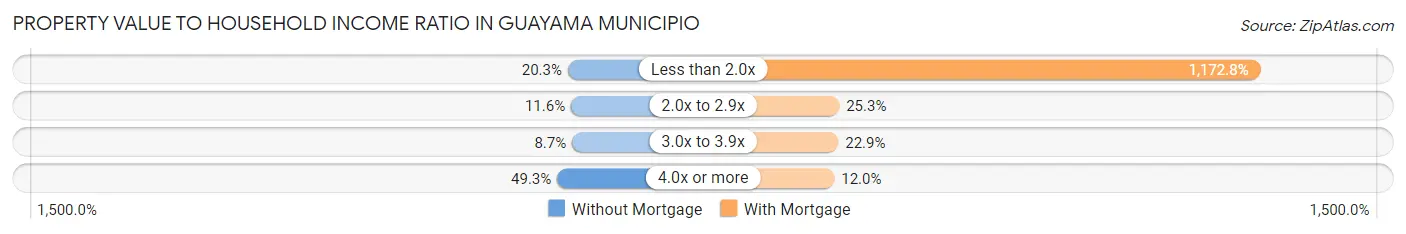
| Value-to-Income Ratio | Without Mortgage | With Mortgage |
| Less than 2.0x | 1,411 (20.3%) | 38,363 (1,172.8%) |
| 2.0x to 2.9x | 802 (11.6%) | 829 (25.3%) |
| 3.0x to 3.9x | 606 (8.7%) | 748 (22.9%) |
| 4.0x or more | 3,424 (49.3%) | 393 (12.0%) |
| Total | 6,946 (100.0%) | 3,271 (100.0%) |
Real Estate Taxes by Mortgage Status in Guayama Municipio

| Property Taxes | Without Mortgage | With Mortgage |
| Less than $800 | 147 (2.1%) | 83 (2.5%) |
| $800 to $1,499 | 31 (0.4%) | 52 (1.6%) |
| $800 to $1,499 | 14 (0.2%) | 114 (3.5%) |
| Total | 6,946 (100.0%) | 3,271 (100.0%) |
Health & Disability in Guayama Municipio
Health Insurance Coverage by Age in Guayama Municipio
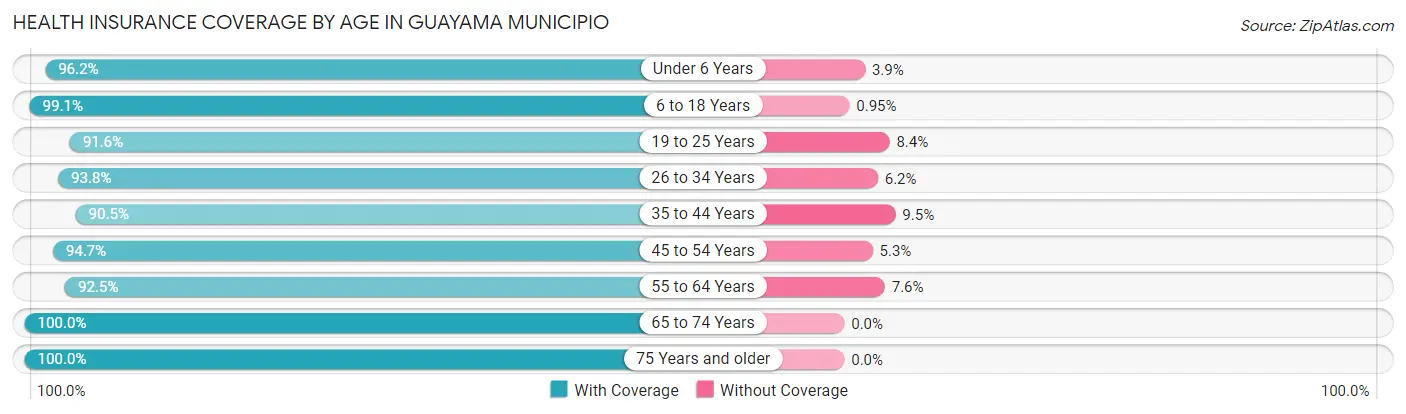
| Age Bracket | With Coverage | Without Coverage |
| Under 6 Years | 1,600 (96.2%) | 64 (3.8%) |
| 6 to 18 Years | 5,317 (99.1%) | 51 (0.9%) |
| 19 to 25 Years | 3,367 (91.6%) | 310 (8.4%) |
| 26 to 34 Years | 3,453 (93.8%) | 230 (6.2%) |
| 35 to 44 Years | 3,353 (90.5%) | 353 (9.5%) |
| 45 to 54 Years | 4,052 (94.7%) | 226 (5.3%) |
| 55 to 64 Years | 4,164 (92.4%) | 340 (7.5%) |
| 65 to 74 Years | 3,942 (100.0%) | 0 (0.0%) |
| 75 Years and older | 3,126 (100.0%) | 0 (0.0%) |
| Total | 32,374 (95.4%) | 1,574 (4.6%) |
Health Insurance Coverage by Citizenship Status in Guayama Municipio
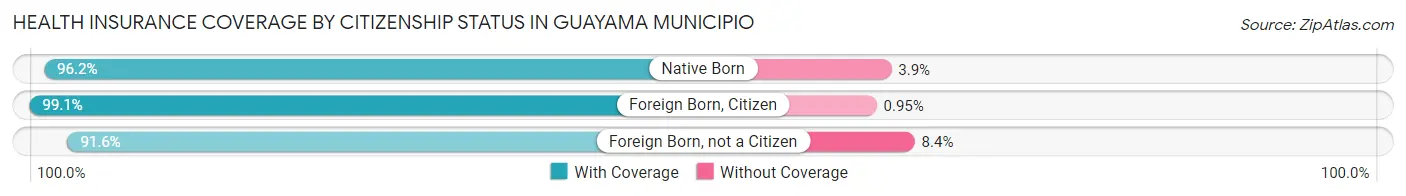
| Citizenship Status | With Coverage | Without Coverage |
| Native Born | 1,600 (96.2%) | 64 (3.8%) |
| Foreign Born, Citizen | 5,317 (99.1%) | 51 (0.9%) |
| Foreign Born, not a Citizen | 3,367 (91.6%) | 310 (8.4%) |
Health Insurance Coverage by Household Income in Guayama Municipio
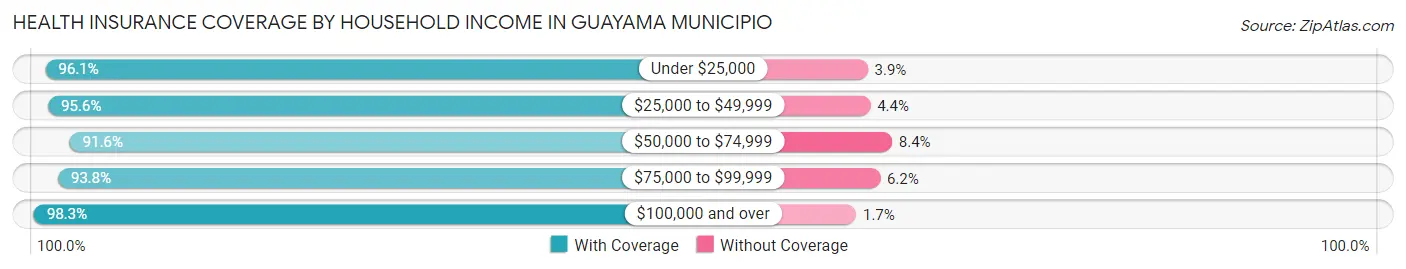
| Household Income | With Coverage | Without Coverage |
| Under $25,000 | 16,573 (96.1%) | 671 (3.9%) |
| $25,000 to $49,999 | 7,817 (95.6%) | 359 (4.4%) |
| $50,000 to $74,999 | 4,081 (91.6%) | 376 (8.4%) |
| $75,000 to $99,999 | 1,975 (93.8%) | 131 (6.2%) |
| $100,000 and over | 1,818 (98.3%) | 32 (1.7%) |
Public vs Private Health Insurance Coverage by Age in Guayama Municipio
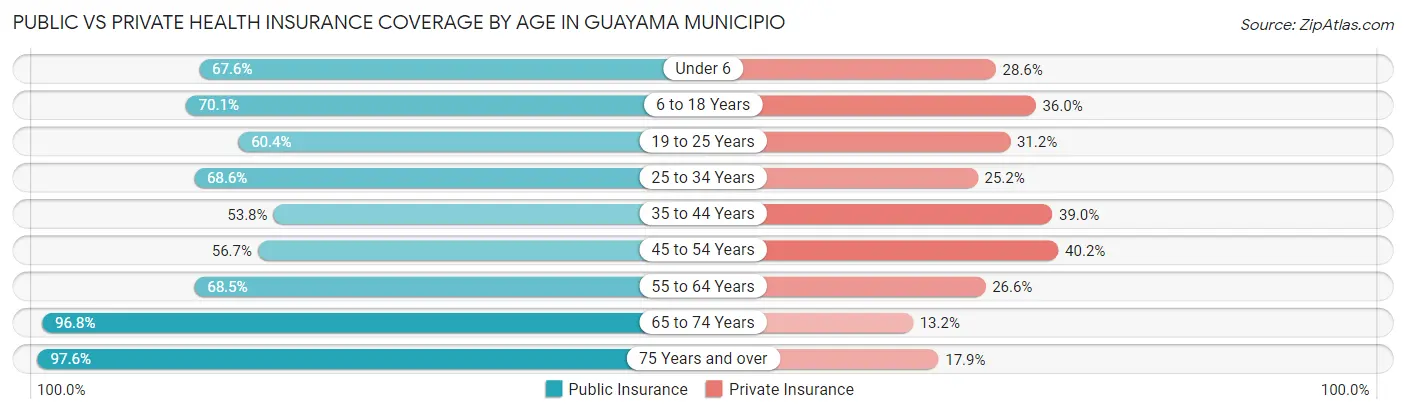
| Age Bracket | Public Insurance | Private Insurance |
| Under 6 | 1,125 (67.6%) | 475 (28.5%) |
| 6 to 18 Years | 3,763 (70.1%) | 1,930 (35.9%) |
| 19 to 25 Years | 2,219 (60.4%) | 1,148 (31.2%) |
| 25 to 34 Years | 2,525 (68.6%) | 928 (25.2%) |
| 35 to 44 Years | 1,995 (53.8%) | 1,446 (39.0%) |
| 45 to 54 Years | 2,426 (56.7%) | 1,718 (40.2%) |
| 55 to 64 Years | 3,085 (68.5%) | 1,199 (26.6%) |
| 65 to 74 Years | 3,814 (96.8%) | 519 (13.2%) |
| 75 Years and over | 3,050 (97.6%) | 560 (17.9%) |
| Total | 24,002 (70.7%) | 9,923 (29.2%) |
Disability Status by Sex by Age in Guayama Municipio
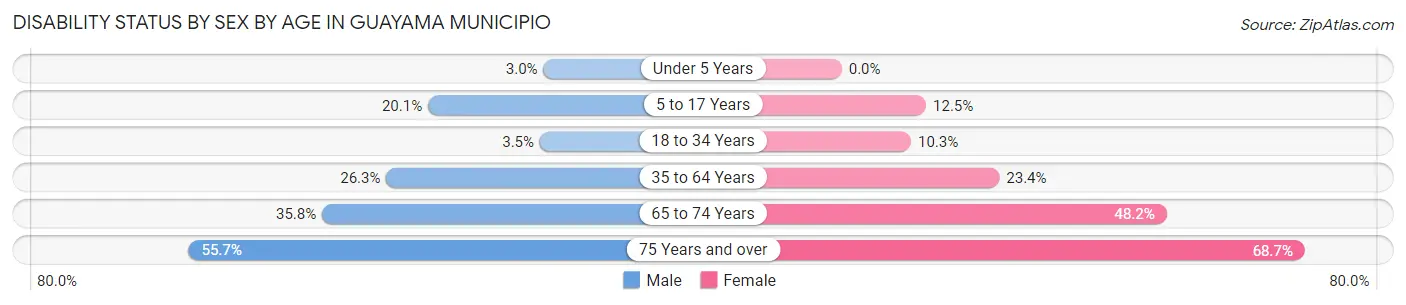
| Age Bracket | Male | Female |
| Under 5 Years | 17 (3.0%) | 0 (0.0%) |
| 5 to 17 Years | 539 (20.1%) | 322 (12.5%) |
| 18 to 34 Years | 140 (3.5%) | 404 (10.3%) |
| 35 to 64 Years | 1,389 (26.3%) | 1,686 (23.4%) |
| 65 to 74 Years | 631 (35.8%) | 1,052 (48.2%) |
| 75 Years and over | 748 (55.6%) | 1,225 (68.7%) |
Disability Class by Sex by Age in Guayama Municipio
Disability Class: Hearing Difficulty
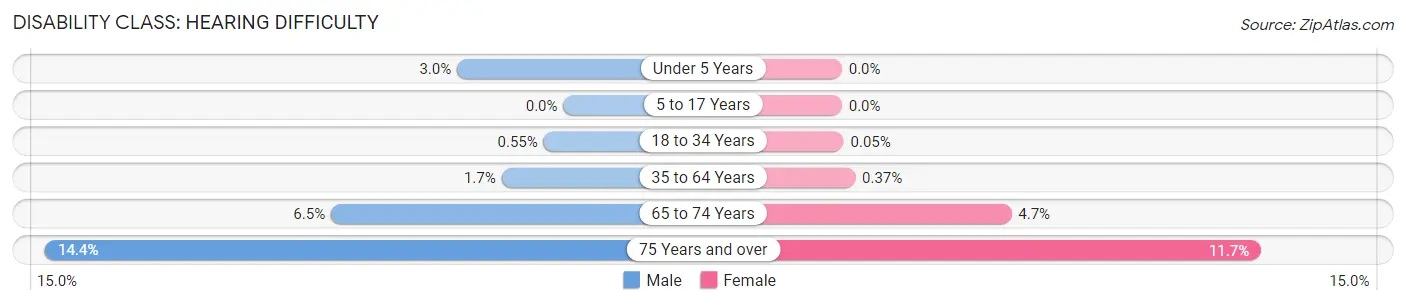
| Age Bracket | Male | Female |
| Under 5 Years | 17 (3.0%) | 0 (0.0%) |
| 5 to 17 Years | 0 (0.0%) | 0 (0.0%) |
| 18 to 34 Years | 22 (0.5%) | 2 (0.1%) |
| 35 to 64 Years | 91 (1.7%) | 27 (0.4%) |
| 65 to 74 Years | 114 (6.5%) | 103 (4.7%) |
| 75 Years and over | 194 (14.4%) | 208 (11.7%) |
Disability Class: Vision Difficulty
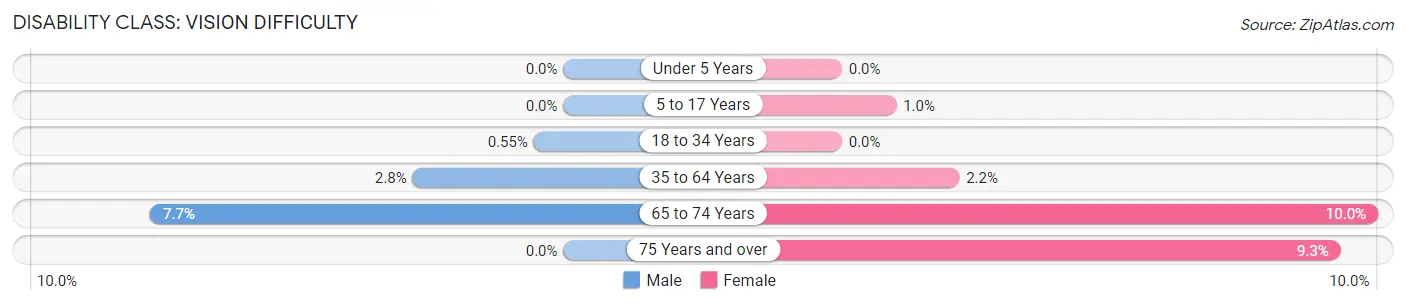
| Age Bracket | Male | Female |
| Under 5 Years | 0 (0.0%) | 0 (0.0%) |
| 5 to 17 Years | 0 (0.0%) | 26 (1.0%) |
| 18 to 34 Years | 22 (0.5%) | 0 (0.0%) |
| 35 to 64 Years | 148 (2.8%) | 157 (2.2%) |
| 65 to 74 Years | 135 (7.7%) | 217 (10.0%) |
| 75 Years and over | 0 (0.0%) | 165 (9.3%) |
Disability Class: Cognitive Difficulty
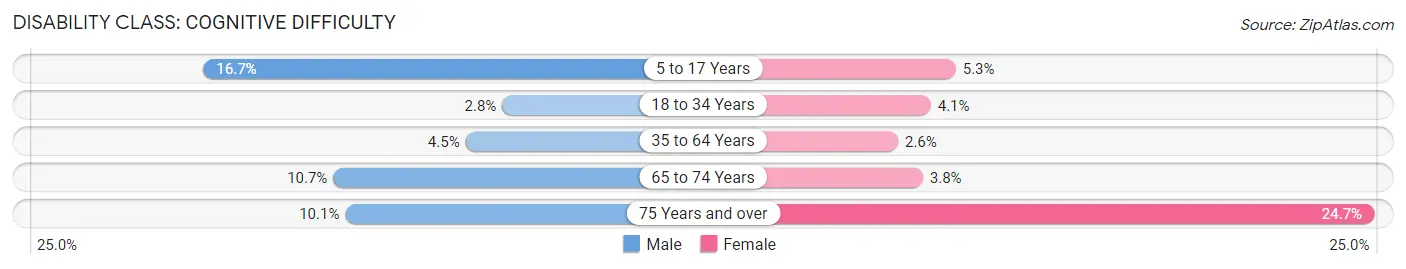
| Age Bracket | Male | Female |
| 5 to 17 Years | 448 (16.7%) | 136 (5.3%) |
| 18 to 34 Years | 114 (2.8%) | 162 (4.1%) |
| 35 to 64 Years | 240 (4.5%) | 188 (2.6%) |
| 65 to 74 Years | 188 (10.7%) | 82 (3.8%) |
| 75 Years and over | 136 (10.1%) | 440 (24.7%) |
Disability Class: Ambulatory Difficulty
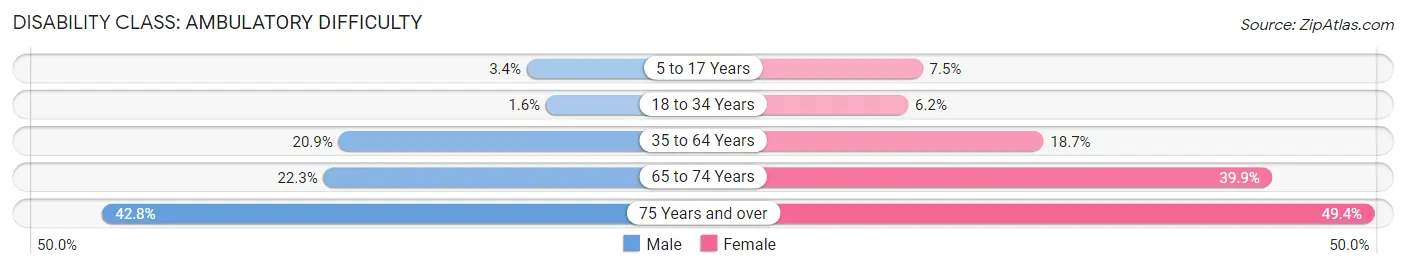
| Age Bracket | Male | Female |
| 5 to 17 Years | 91 (3.4%) | 193 (7.5%) |
| 18 to 34 Years | 65 (1.6%) | 242 (6.2%) |
| 35 to 64 Years | 1,102 (20.9%) | 1,348 (18.7%) |
| 65 to 74 Years | 392 (22.3%) | 870 (39.9%) |
| 75 Years and over | 575 (42.8%) | 880 (49.4%) |
Disability Class: Self-Care Difficulty
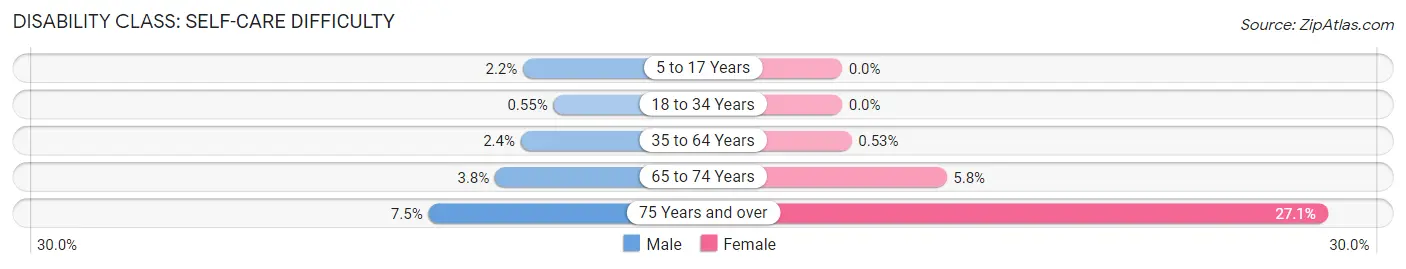
| Age Bracket | Male | Female |
| 5 to 17 Years | 60 (2.2%) | 0 (0.0%) |
| 18 to 34 Years | 22 (0.5%) | 0 (0.0%) |
| 35 to 64 Years | 125 (2.4%) | 38 (0.5%) |
| 65 to 74 Years | 67 (3.8%) | 127 (5.8%) |
| 75 Years and over | 101 (7.5%) | 482 (27.1%) |
Technology Access in Guayama Municipio
Computing Device Access in Guayama Municipio
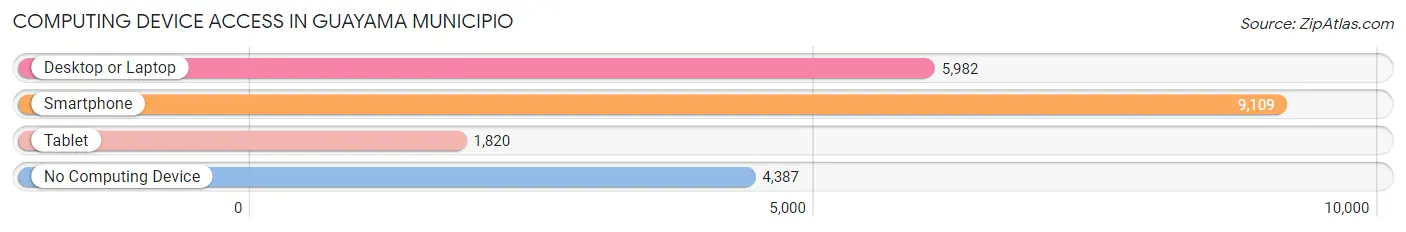
| Device Type | # Households | % Households |
| Desktop or Laptop | 5,982 | 41.5% |
| Smartphone | 9,109 | 63.1% |
| Tablet | 1,820 | 12.6% |
| No Computing Device | 4,387 | 30.4% |
| Total | 14,427 | 100.0% |
Internet Access in Guayama Municipio
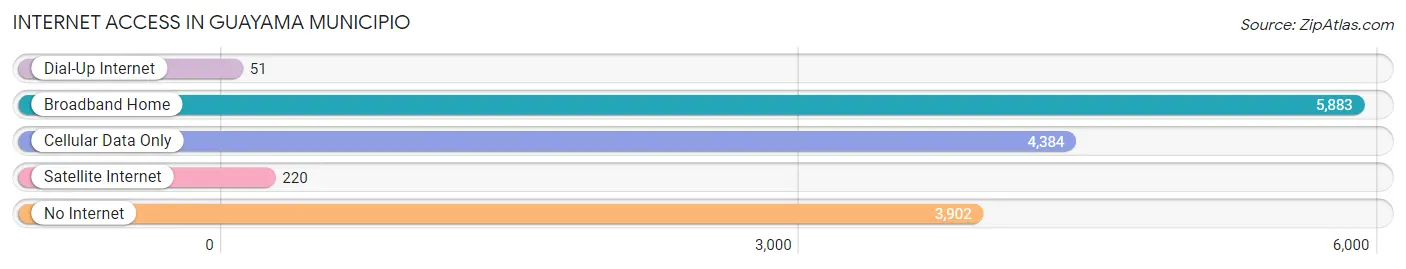
| Internet Type | # Households | % Households |
| Dial-Up Internet | 51 | 0.4% |
| Broadband Home | 5,883 | 40.8% |
| Cellular Data Only | 4,384 | 30.4% |
| Satellite Internet | 220 | 1.5% |
| No Internet | 3,902 | 27.1% |
| Total | 14,427 | 100.0% |
Guayama Municipio Summary
Guayama Municipio is located in the southeastern region of Puerto Rico, and is part of the San Juan-Caguas-Guaynabo Metropolitan Statistical Area. It is bordered by the municipalities of Patillas, Arroyo, Salinas, and Santa Isabel. The municipality covers an area of approximately 97 square miles and has a population of approximately 70,000 people.
History
The area that is now Guayama Municipio was originally inhabited by the Taíno people, who called the area “Guayama”, which means “land of waters”. The area was later colonized by the Spanish in the 16th century, and the town of Guayama was officially founded in 1736. During the 19th century, the town became an important center for the production of sugar cane and coffee. In 1898, the town was occupied by the United States during the Spanish-American War, and in 1902, it was officially incorporated as a municipality.
Geography
Guayama Municipio is located in the southeastern region of Puerto Rico, and is bordered by the municipalities of Patillas, Arroyo, Salinas, and Santa Isabel. The municipality covers an area of approximately 97 square miles and is divided into 11 barrios. The terrain is mostly flat, with some hills in the northern part of the municipality. The climate is tropical, with temperatures ranging from the mid-70s to the mid-80s.
Economy
The economy of Guayama Municipio is largely based on agriculture, with sugar cane and coffee being the main crops. Other crops grown in the area include bananas, plantains, and yams. The municipality is also home to several manufacturing plants, including a pharmaceutical plant and a paper mill. Tourism is also an important part of the economy, with several beaches and historical sites in the area.
Demographics
As of the 2010 census, the population of Guayama Municipio was approximately 70,000 people. The majority of the population is of Hispanic or Latino descent, with smaller percentages of African, Asian, and European descent. The median household income is approximately $20,000, and the unemployment rate is around 10%. The majority of the population is Roman Catholic, with smaller percentages of other religious denominations.
Guayama Municipio is a vibrant and diverse municipality with a rich history and culture. It is home to a variety of industries, from agriculture to manufacturing, and is a popular tourist destination. The municipality is also home to a diverse population, with a variety of ethnic and religious backgrounds. With its beautiful beaches, historical sites, and vibrant culture, Guayama Municipio is an ideal place to live and visit.
Common Questions
What is Per Capita Income in Guayama Municipio?
Per Capita income in Guayama Municipio is $12,626.
What is the Median Family Income in Guayama Municipio?
Median Family Income in Guayama Municipio is $23,633.
What is the Median Household income in Guayama Municipio?
Median Household Income in Guayama Municipio is $19,165.
What is Income or Wage Gap in Guayama Municipio?
Income or Wage Gap in Guayama Municipio is 19.4%.
Women in Guayama Municipio earn 80.6 cents for every dollar earned by a man.
What is Family Income Deficit in Guayama Municipio?
Family Income Deficit in Guayama Municipio is $12,931.
Families that are below poverty line in Guayama Municipio earn $12,931 less on average than the poverty threshold level.
What is Inequality or Gini Index in Guayama Municipio?
Inequality or Gini Index in Guayama Municipio is 0.53.
What is the Total Population of Guayama Municipio?
Total Population of Guayama Municipio is 36,365.
What is the Total Male Population of Guayama Municipio?
Total Male Population of Guayama Municipio is 18,036.
What is the Total Female Population of Guayama Municipio?
Total Female Population of Guayama Municipio is 18,329.
What is the Ratio of Males per 100 Females in Guayama Municipio?
There are 98.40 Males per 100 Females in Guayama Municipio.
What is the Ratio of Females per 100 Males in Guayama Municipio?
There are 101.62 Females per 100 Males in Guayama Municipio.
What is the Median Population Age in Guayama Municipio?
Median Population Age in Guayama Municipio is 40.7 Years.
What is the Average Family Size in Guayama Municipio
Average Family Size in Guayama Municipio is 3.0 People.
What is the Average Household Size in Guayama Municipio
Average Household Size in Guayama Municipio is 2.4 People.
How Large is the Labor Force in Guayama Municipio?
There are 10,090 People in the Labor Forcein in Guayama Municipio.
What is the Percentage of People in the Labor Force in Guayama Municipio?
32.9% of People are in the Labor Force in Guayama Municipio.
What is the Unemployment Rate in Guayama Municipio?
Unemployment Rate in Guayama Municipio is 6.8%.