Cidra Municipio, PR Map & Demographics
Cidra Municipio Map
Cidra Municipio Overview
$14,451
PER CAPITA INCOME
$29,577
AVG FAMILY INCOME
$25,580
AVG HOUSEHOLD INCOME
9.9%
WAGE / INCOME GAP [ % ]
90.1¢/ $1
WAGE / INCOME GAP [ $ ]
$11,083
FAMILY INCOME DEFICIT
0.49
INEQUALITY / GINI INDEX
39,831
TOTAL POPULATION
19,204
MALE POPULATION
20,627
FEMALE POPULATION
93.10
MALES / 100 FEMALES
107.41
FEMALES / 100 MALES
42.9
MEDIAN AGE
3.4
AVG FAMILY SIZE
2.8
AVG HOUSEHOLD SIZE
13,803
LABOR FORCE [ PEOPLE ]
41.1%
PERCENT IN LABOR FORCE
6.3%
UNEMPLOYMENT RATE
Cidra Municipio Area Codes
Income in Cidra Municipio
Income Overview in Cidra Municipio
Per Capita Income in Cidra Municipio is $14,451, while median incomes of families and households are $29,577 and $25,580 respectively.
| Characteristic | Number | Measure |
| Per Capita Income | 39,831 | $14,451 |
| Median Family Income | 10,072 | $29,577 |
| Mean Family Income | 10,072 | $41,149 |
| Median Household Income | 14,207 | $25,580 |
| Mean Household Income | 14,207 | $36,659 |
| Income Deficit | 10,072 | $11,083 |
| Wage / Income Gap (%) | 39,831 | 9.89% |
| Wage / Income Gap ($) | 39,831 | 90.11¢ per $1 |
| Gini / Inequality Index | 39,831 | 0.49 |
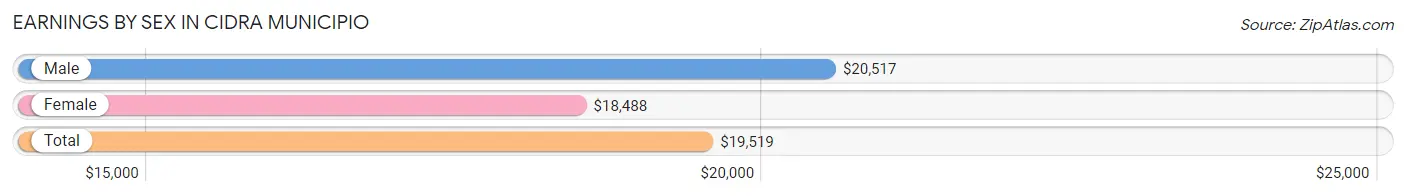
Earnings by Sex in Cidra Municipio
Average Earnings in Cidra Municipio are $19,519, $20,517 for men and $18,488 for women, a difference of 9.9%.
| Sex | Number | Average Earnings |
| Male | 7,667 (54.6%) | $20,517 |
| Female | 6,384 (45.4%) | $18,488 |
| Total | 14,051 (100.0%) | $19,519 |
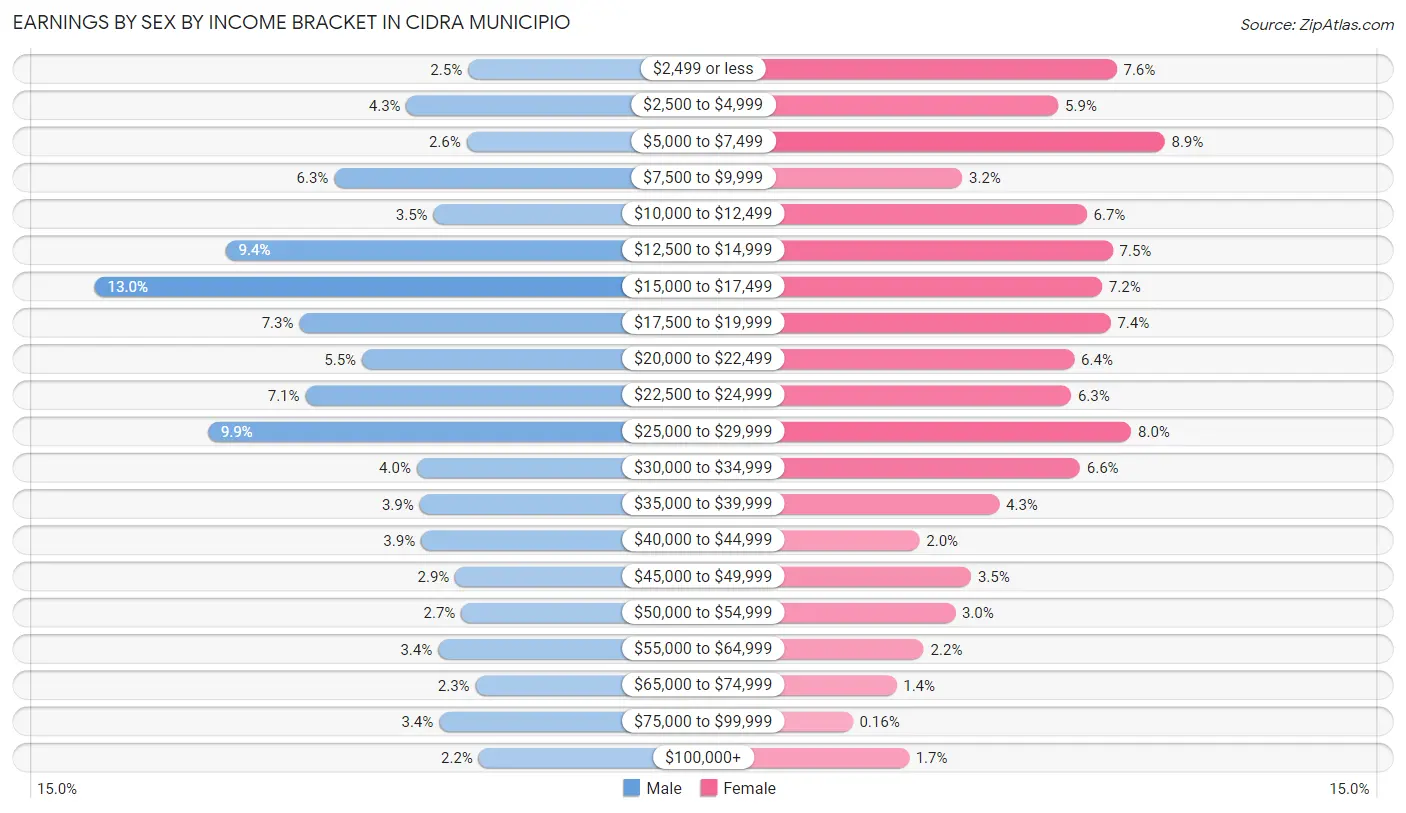
Earnings by Sex by Income Bracket in Cidra Municipio
The most common earnings brackets in Cidra Municipio are $15,000 to $17,499 for men (999 | 13.0%) and $5,000 to $7,499 for women (570 | 8.9%).
| Income | Male | Female |
| $2,499 or less | 195 (2.5%) | 484 (7.6%) |
| $2,500 to $4,999 | 327 (4.3%) | 379 (5.9%) |
| $5,000 to $7,499 | 198 (2.6%) | 570 (8.9%) |
| $7,500 to $9,999 | 483 (6.3%) | 207 (3.2%) |
| $10,000 to $12,499 | 269 (3.5%) | 430 (6.7%) |
| $12,500 to $14,999 | 717 (9.3%) | 477 (7.5%) |
| $15,000 to $17,499 | 999 (13.0%) | 458 (7.2%) |
| $17,500 to $19,999 | 558 (7.3%) | 473 (7.4%) |
| $20,000 to $22,499 | 423 (5.5%) | 408 (6.4%) |
| $22,500 to $24,999 | 545 (7.1%) | 402 (6.3%) |
| $25,000 to $29,999 | 755 (9.9%) | 510 (8.0%) |
| $30,000 to $34,999 | 305 (4.0%) | 418 (6.6%) |
| $35,000 to $39,999 | 299 (3.9%) | 273 (4.3%) |
| $40,000 to $44,999 | 296 (3.9%) | 130 (2.0%) |
| $45,000 to $49,999 | 222 (2.9%) | 223 (3.5%) |
| $50,000 to $54,999 | 209 (2.7%) | 194 (3.0%) |
| $55,000 to $64,999 | 259 (3.4%) | 138 (2.2%) |
| $65,000 to $74,999 | 179 (2.3%) | 89 (1.4%) |
| $75,000 to $99,999 | 257 (3.4%) | 10 (0.2%) |
| $100,000+ | 172 (2.2%) | 111 (1.7%) |
| Total | 7,667 (100.0%) | 6,384 (100.0%) |
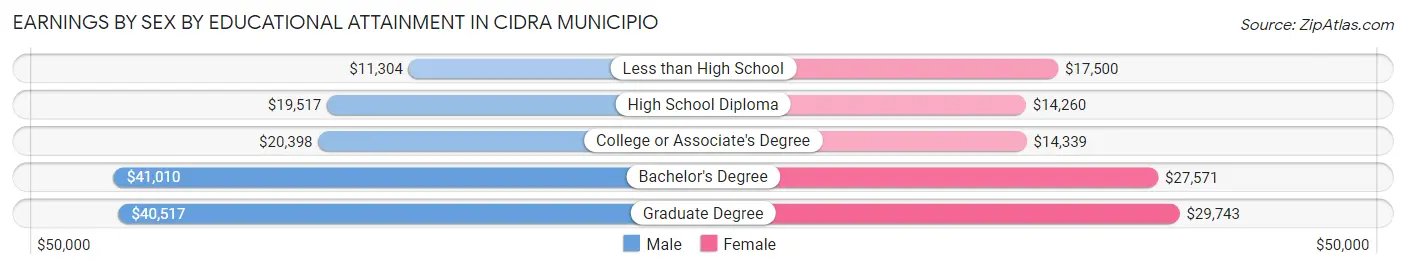
Earnings by Sex by Educational Attainment in Cidra Municipio
Average earnings in Cidra Municipio are $22,410 for men and $20,512 for women, a difference of 8.5%. Men with an educational attainment of bachelor's degree enjoy the highest average annual earnings of $41,010, while those with less than high school education earn the least with $11,304. Women with an educational attainment of graduate degree earn the most with the average annual earnings of $29,743, while those with high school diploma education have the smallest earnings of $14,260.
| Educational Attainment | Male Income | Female Income |
| Less than High School | $11,304 | $17,500 |
| High School Diploma | $19,517 | $14,260 |
| College or Associate's Degree | $20,398 | $14,339 |
| Bachelor's Degree | $41,010 | $27,571 |
| Graduate Degree | $40,517 | $29,743 |
| Total | $22,410 | $20,512 |
Family Income in Cidra Municipio
Family Income Brackets in Cidra Municipio
According to the Cidra Municipio family income data, there are 2,035 families falling into the $15,000 to $24,999 income range, which is the most common income bracket and makes up 20.2% of all families. Conversely, the $200,000+ income bracket is the least frequent group with only 50 families (0.5%) belonging to this category.
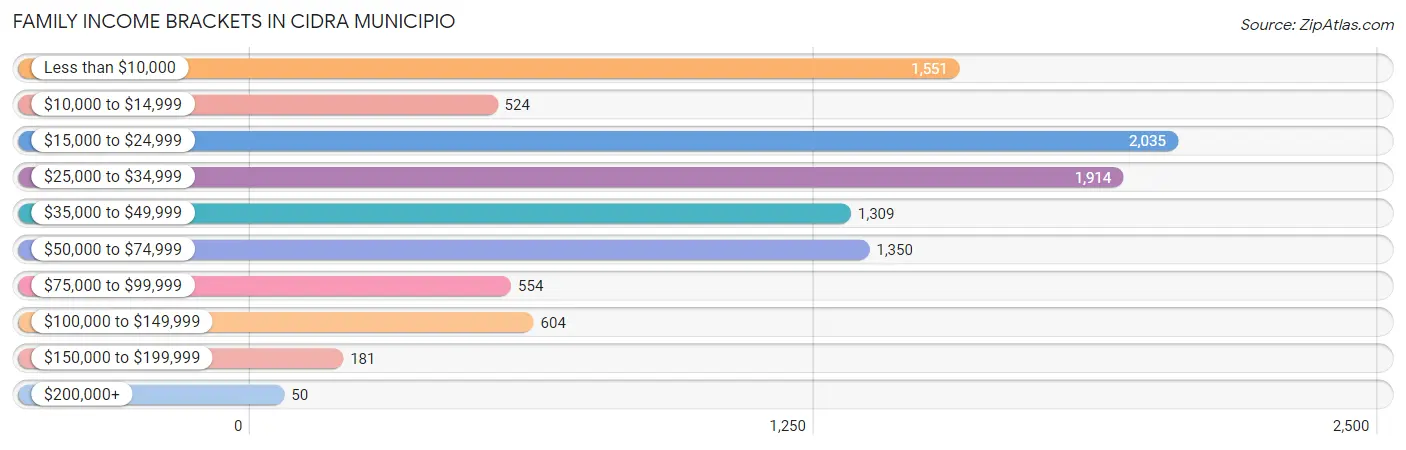
| Income Bracket | # Families | % Families |
| Less than $10,000 | 1,551 | 15.4% |
| $10,000 to $14,999 | 524 | 5.2% |
| $15,000 to $24,999 | 2,035 | 20.2% |
| $25,000 to $34,999 | 1,914 | 19.0% |
| $35,000 to $49,999 | 1,309 | 13.0% |
| $50,000 to $74,999 | 1,350 | 13.4% |
| $75,000 to $99,999 | 554 | 5.5% |
| $100,000 to $149,999 | 604 | 6.0% |
| $150,000 to $199,999 | 181 | 1.8% |
| $200,000+ | 50 | 0.5% |
Family Income by Famaliy Size in Cidra Municipio
5-person families (540 | 5.4%) account for the highest median family income in Cidra Municipio with $44,198 per family, while 2-person families (4,650 | 46.2%) have the highest median income of $12,616 per family member.
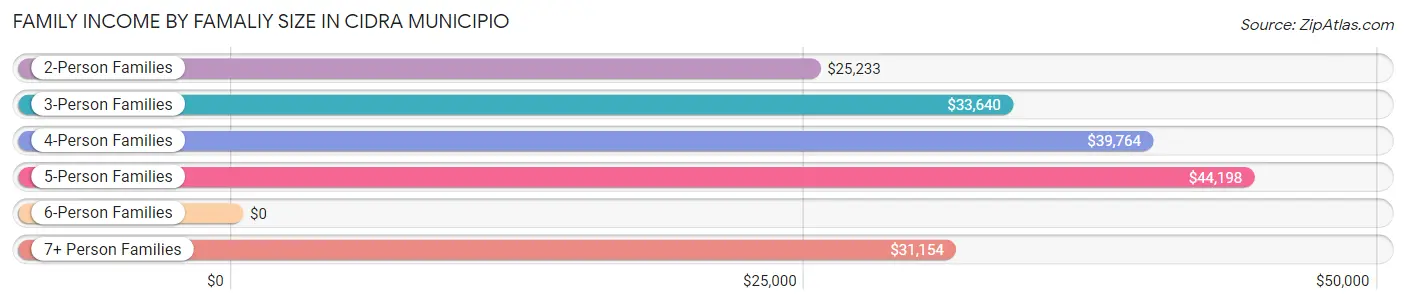
| Income Bracket | # Families | Median Income |
| 2-Person Families | 4,650 (46.2%) | $25,233 |
| 3-Person Families | 3,359 (33.4%) | $33,640 |
| 4-Person Families | 1,410 (14.0%) | $39,764 |
| 5-Person Families | 540 (5.4%) | $44,198 |
| 6-Person Families | 81 (0.8%) | $0 |
| 7+ Person Families | 32 (0.3%) | $31,154 |
| Total | 10,072 (100.0%) | $29,577 |
Family Income by Number of Earners in Cidra Municipio
The median family income in Cidra Municipio is $29,577, with families comprising 3+ earners (574) having the highest median family income of $68,333, while families with no earners (3,829) have the lowest median family income of $18,976, accounting for 5.7% and 38.0% of families, respectively.
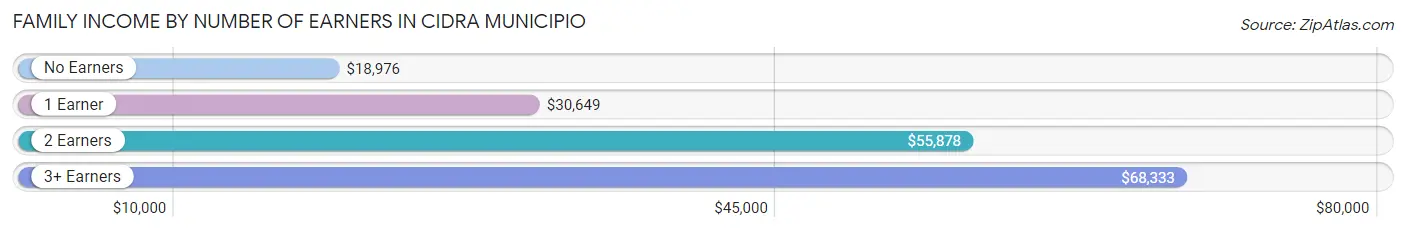
| Number of Earners | # Families | Median Income |
| No Earners | 3,829 (38.0%) | $18,976 |
| 1 Earner | 3,515 (34.9%) | $30,649 |
| 2 Earners | 2,154 (21.4%) | $55,878 |
| 3+ Earners | 574 (5.7%) | $68,333 |
| Total | 10,072 (100.0%) | $29,577 |
Household Income in Cidra Municipio
Household Income Brackets in Cidra Municipio
With 3,083 households falling in the category, the $15,000 to $24,999 income range is the most frequent in Cidra Municipio, accounting for 21.7% of all households. In contrast, only 71 households (0.5%) fall into the $200,000+ income bracket, making it the least populous group.
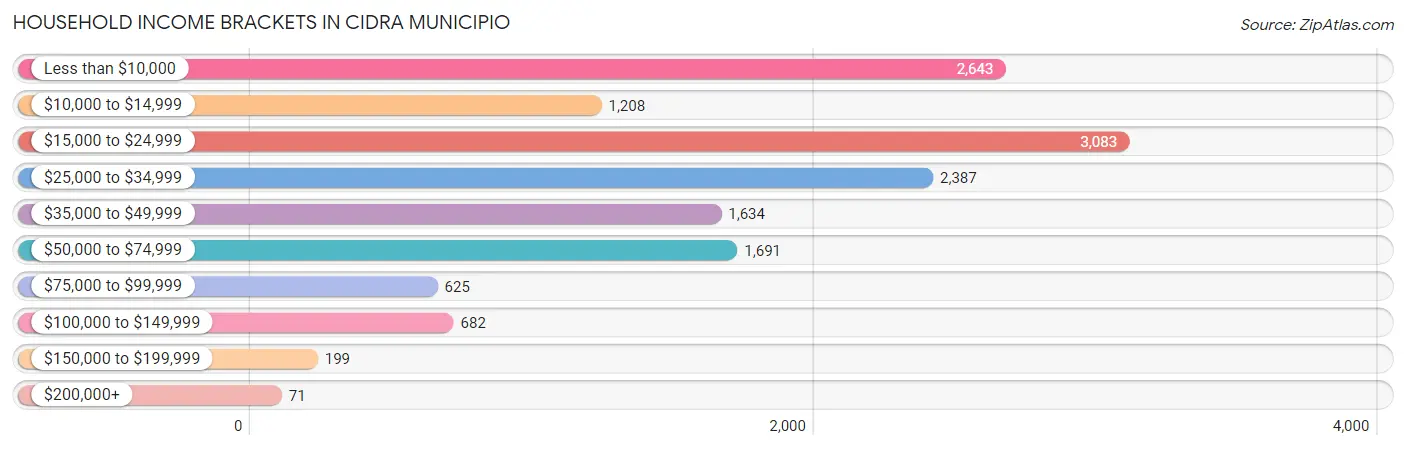
| Income Bracket | # Households | % Households |
| Less than $10,000 | 2,643 | 18.6% |
| $10,000 to $14,999 | 1,208 | 8.5% |
| $15,000 to $24,999 | 3,083 | 21.7% |
| $25,000 to $34,999 | 2,387 | 16.8% |
| $35,000 to $49,999 | 1,634 | 11.5% |
| $50,000 to $74,999 | 1,691 | 11.9% |
| $75,000 to $99,999 | 625 | 4.4% |
| $100,000 to $149,999 | 682 | 4.8% |
| $150,000 to $199,999 | 199 | 1.4% |
| $200,000+ | 71 | 0.5% |
Household Income by Householder Age in Cidra Municipio
The median household income in Cidra Municipio is $25,580, with the highest median household income of $33,036 found in the 15 to 24 years age bracket for the primary householder. A total of 180 households (1.3%) fall into this category. Meanwhile, the 65+ years age bracket for the primary householder has the lowest median household income of $21,467, with 4,969 households (35.0%) in this group.
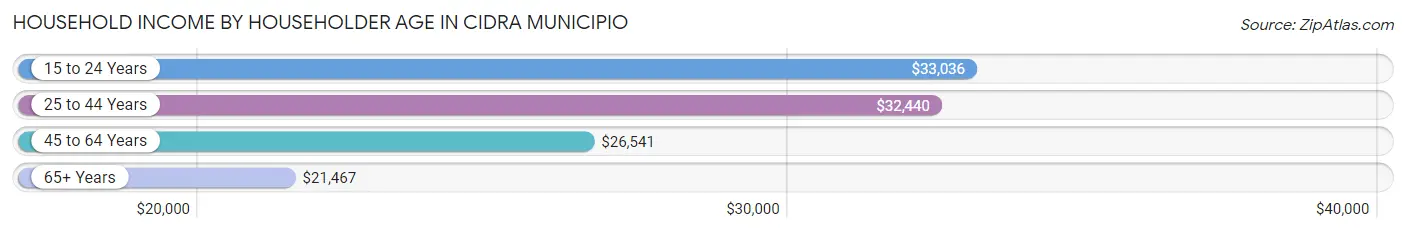
| Income Bracket | # Households | Median Income |
| 15 to 24 Years | 180 (1.3%) | $33,036 |
| 25 to 44 Years | 3,215 (22.6%) | $32,440 |
| 45 to 64 Years | 5,843 (41.1%) | $26,541 |
| 65+ Years | 4,969 (35.0%) | $21,467 |
| Total | 14,207 (100.0%) | $25,580 |
Poverty in Cidra Municipio
Income Below Poverty by Sex and Age in Cidra Municipio
With 34.4% poverty level for males and 43.3% for females among the residents of Cidra Municipio, 5 year old males and 18 to 24 year old females are the most vulnerable to poverty, with 84 males (100.0%) and 992 females (55.7%) in their respective age groups living below the poverty level.
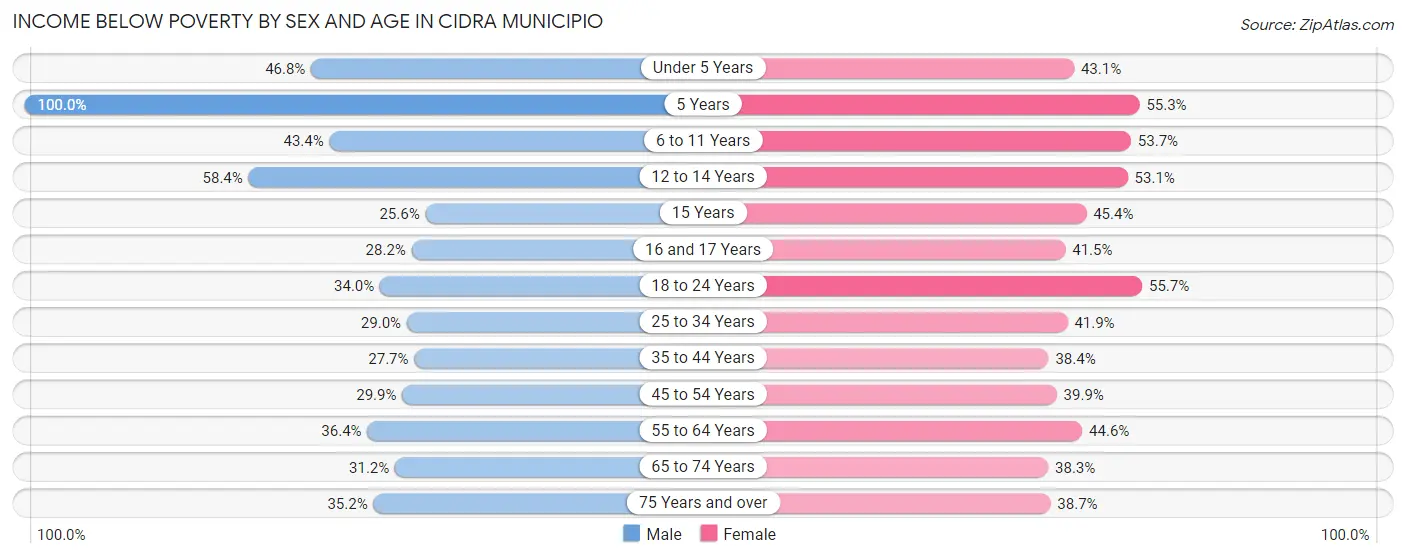
| Age Bracket | Male | Female |
| Under 5 Years | 351 (46.8%) | 300 (43.1%) |
| 5 Years | 84 (100.0%) | 121 (55.2%) |
| 6 to 11 Years | 490 (43.4%) | 623 (53.7%) |
| 12 to 14 Years | 555 (58.4%) | 373 (53.1%) |
| 15 Years | 76 (25.6%) | 93 (45.4%) |
| 16 and 17 Years | 127 (28.2%) | 217 (41.5%) |
| 18 to 24 Years | 620 (34.0%) | 992 (55.7%) |
| 25 to 34 Years | 741 (29.0%) | 1,081 (41.9%) |
| 35 to 44 Years | 648 (27.7%) | 1,014 (38.4%) |
| 45 to 54 Years | 748 (29.9%) | 1,111 (39.9%) |
| 55 to 64 Years | 1,002 (36.4%) | 1,361 (44.6%) |
| 65 to 74 Years | 679 (31.2%) | 907 (38.3%) |
| 75 Years and over | 475 (35.2%) | 707 (38.7%) |
| Total | 6,596 (34.4%) | 8,900 (43.3%) |
Income Above Poverty by Sex and Age in Cidra Municipio
According to the poverty statistics in Cidra Municipio, males aged 15 years and females aged 65 to 74 years are the age groups that are most secure financially, with 74.4% of males and 61.7% of females in these age groups living above the poverty line.
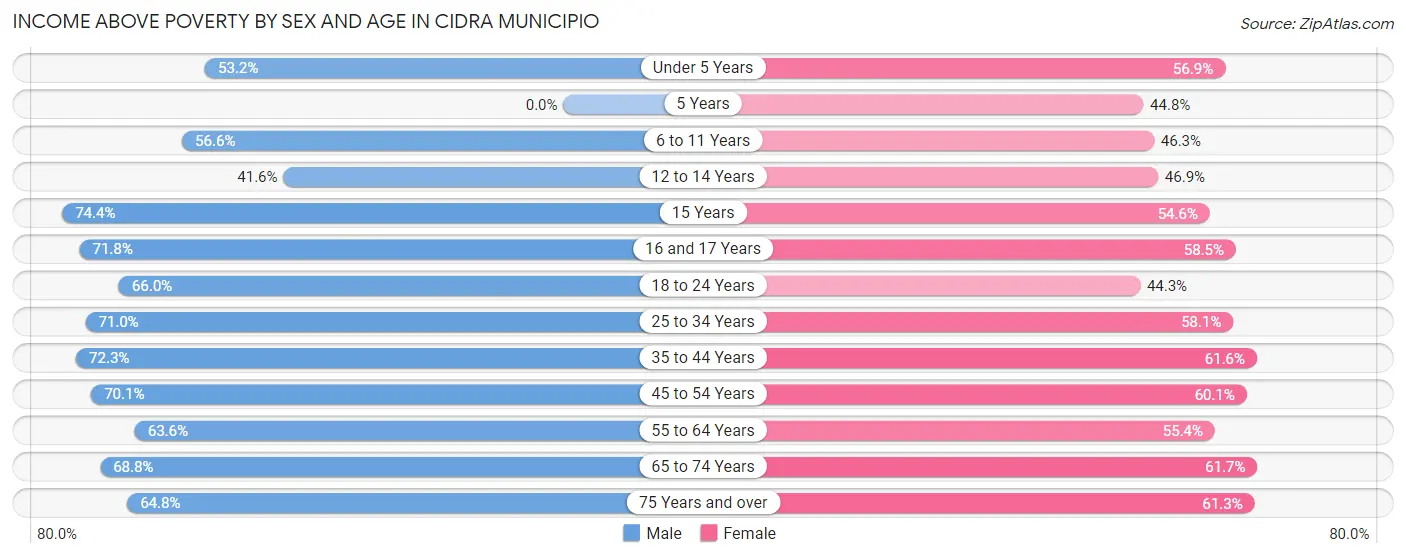
| Age Bracket | Male | Female |
| Under 5 Years | 399 (53.2%) | 396 (56.9%) |
| 5 Years | 0 (0.0%) | 98 (44.8%) |
| 6 to 11 Years | 639 (56.6%) | 538 (46.3%) |
| 12 to 14 Years | 395 (41.6%) | 330 (46.9%) |
| 15 Years | 221 (74.4%) | 112 (54.6%) |
| 16 and 17 Years | 324 (71.8%) | 306 (58.5%) |
| 18 to 24 Years | 1,203 (66.0%) | 788 (44.3%) |
| 25 to 34 Years | 1,811 (71.0%) | 1,500 (58.1%) |
| 35 to 44 Years | 1,695 (72.3%) | 1,629 (61.6%) |
| 45 to 54 Years | 1,754 (70.1%) | 1,675 (60.1%) |
| 55 to 64 Years | 1,753 (63.6%) | 1,690 (55.4%) |
| 65 to 74 Years | 1,495 (68.8%) | 1,461 (61.7%) |
| 75 Years and over | 873 (64.8%) | 1,119 (61.3%) |
| Total | 12,562 (65.6%) | 11,642 (56.7%) |
Income Below Poverty Among Married-Couple Families in Cidra Municipio
The poverty statistics for married-couple families in Cidra Municipio show that 24.0% or 1,443 of the total 6,020 families live below the poverty line. Families with 3 or 4 children have the highest poverty rate of 41.1%, comprising of 51 families. On the other hand, families with 1 or 2 children have the lowest poverty rate of 21.4%, which includes 312 families.
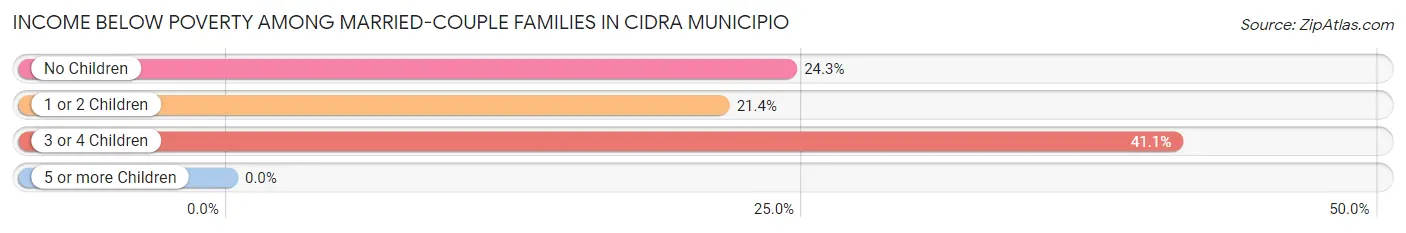
| Children | Above Poverty | Below Poverty |
| No Children | 3,358 (75.7%) | 1,080 (24.3%) |
| 1 or 2 Children | 1,146 (78.6%) | 312 (21.4%) |
| 3 or 4 Children | 73 (58.9%) | 51 (41.1%) |
| 5 or more Children | 0 (0.0%) | 0 (0.0%) |
| Total | 4,577 (76.0%) | 1,443 (24.0%) |
Income Below Poverty Among Single-Parent Households in Cidra Municipio
According to the poverty data in Cidra Municipio, 40.7% or 341 single-father households and 50.7% or 1,630 single-mother households are living below the poverty line. Among single-father households, those with 3 or 4 children have the highest poverty rate, with 64 households (100.0%) experiencing poverty. Likewise, among single-mother households, those with 3 or 4 children have the highest poverty rate, with 109 households (100.0%) falling below the poverty line.
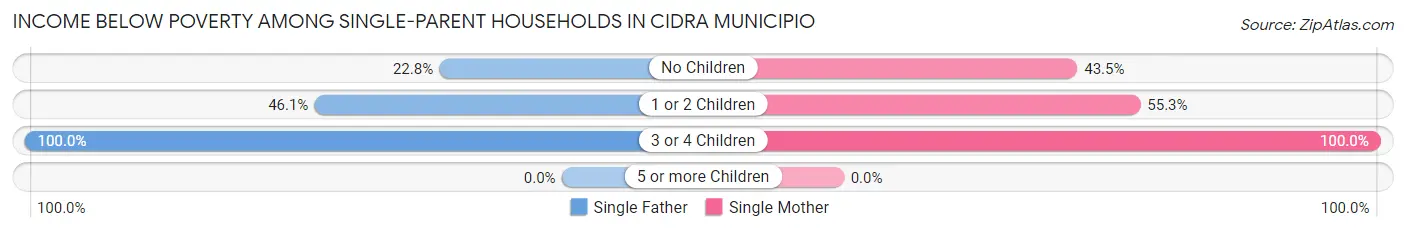
| Children | Single Father | Single Mother |
| No Children | 78 (22.8%) | 722 (43.5%) |
| 1 or 2 Children | 199 (46.1%) | 799 (55.3%) |
| 3 or 4 Children | 64 (100.0%) | 109 (100.0%) |
| 5 or more Children | 0 (0.0%) | 0 (0.0%) |
| Total | 341 (40.7%) | 1,630 (50.7%) |
Income Below Poverty Among Married-Couple vs Single-Parent Households in Cidra Municipio
The poverty data for Cidra Municipio shows that 1,443 of the married-couple family households (24.0%) and 1,971 of the single-parent households (48.6%) are living below the poverty level. Within the married-couple family households, those with 3 or 4 children have the highest poverty rate, with 51 households (41.1%) falling below the poverty line. Among the single-parent households, those with 3 or 4 children have the highest poverty rate, with 173 household (100.0%) living below poverty.
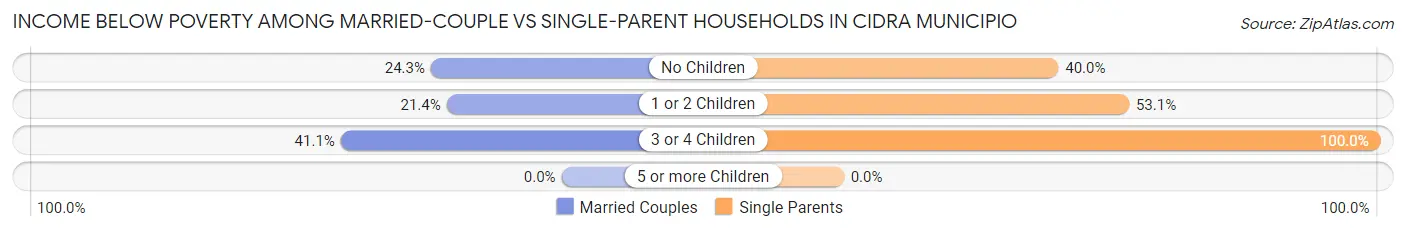
| Children | Married-Couple Families | Single-Parent Households |
| No Children | 1,080 (24.3%) | 800 (40.0%) |
| 1 or 2 Children | 312 (21.4%) | 998 (53.1%) |
| 3 or 4 Children | 51 (41.1%) | 173 (100.0%) |
| 5 or more Children | 0 (0.0%) | 0 (0.0%) |
| Total | 1,443 (24.0%) | 1,971 (48.6%) |
Race in Cidra Municipio
The most populous races in Cidra Municipio are Hispanic or Latino (39,639 | 99.5%), White / Caucasian (15,644 | 39.3%), and Two or more Races (9,743 | 24.5%).
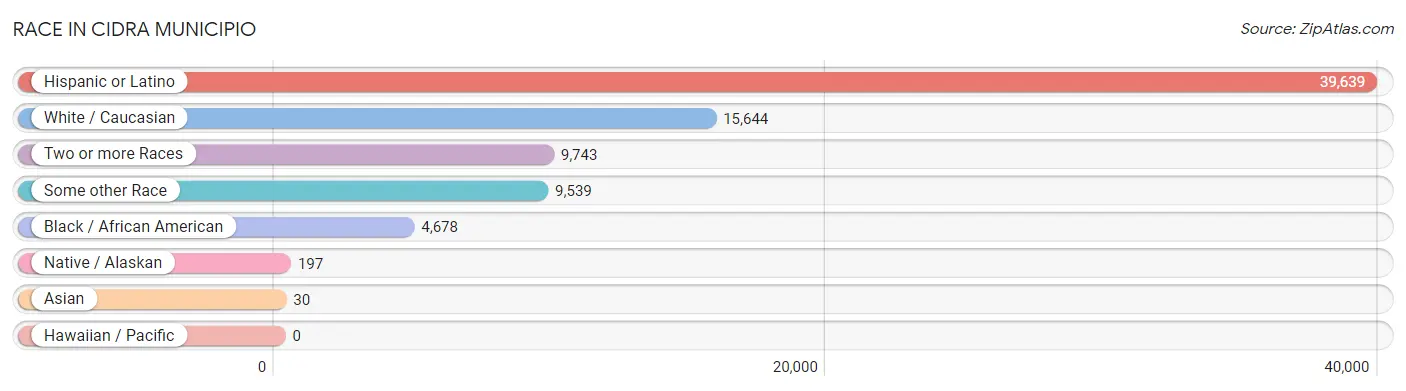
| Race | # Population | % Population |
| Asian | 30 | 0.1% |
| Black / African American | 4,678 | 11.7% |
| Hawaiian / Pacific | 0 | 0.0% |
| Hispanic or Latino | 39,639 | 99.5% |
| Native / Alaskan | 197 | 0.5% |
| White / Caucasian | 15,644 | 39.3% |
| Two or more Races | 9,743 | 24.5% |
| Some other Race | 9,539 | 23.9% |
| Total | 39,831 | 100.0% |
Ancestry in Cidra Municipio
The most populous ancestries reported in Cidra Municipio are Puerto Rican (39,424 | 99.0%), American (221 | 0.5%), Central American Indian (144 | 0.4%), Thai (107 | 0.3%), and Dominican (79 | 0.2%), together accounting for 100.4% of all Cidra Municipio residents.
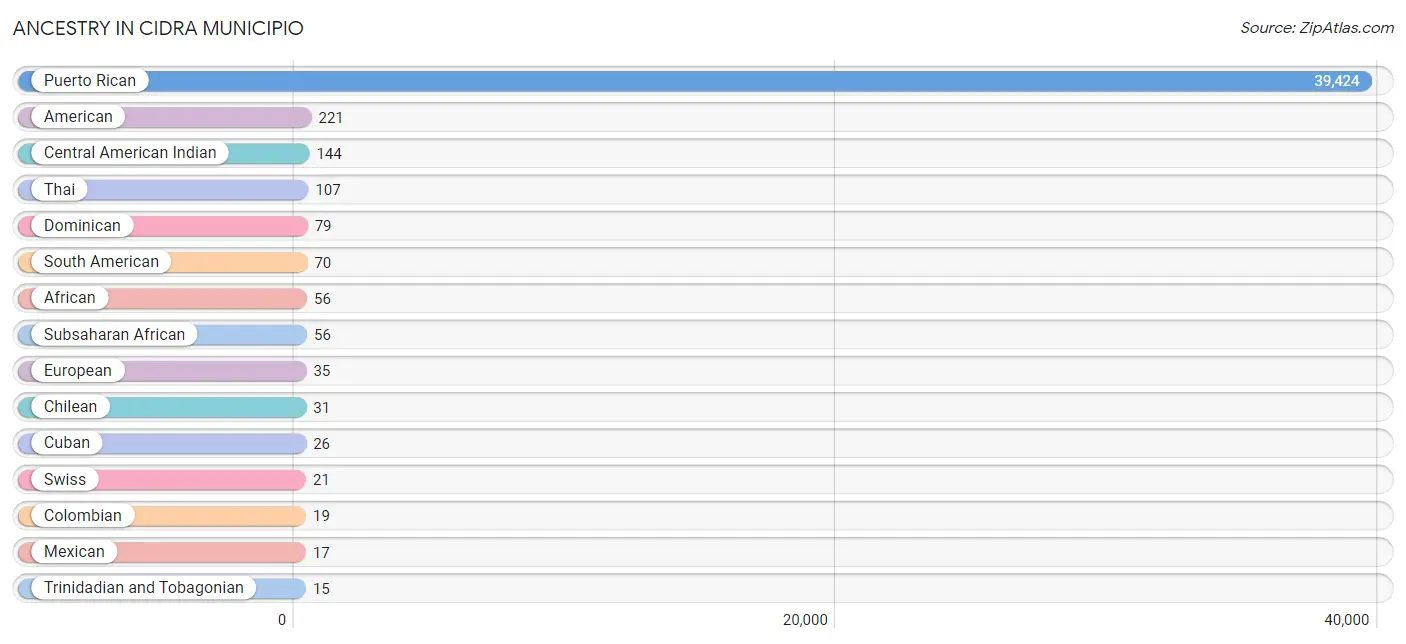
| Ancestry | # Population | % Population |
| African | 56 | 0.1% |
| American | 221 | 0.5% |
| Central American Indian | 144 | 0.4% |
| Chilean | 31 | 0.1% |
| Colombian | 19 | 0.1% |
| Cuban | 26 | 0.1% |
| Dominican | 79 | 0.2% |
| European | 35 | 0.1% |
| Mexican | 17 | 0.0% |
| Peruvian | 11 | 0.0% |
| Puerto Rican | 39,424 | 99.0% |
| South American | 70 | 0.2% |
| Spaniard | 6 | 0.0% |
| Subsaharan African | 56 | 0.1% |
| Swiss | 21 | 0.1% |
| Thai | 107 | 0.3% |
| Trinidadian and Tobagonian | 15 | 0.0% |
| Venezuelan | 9 | 0.0% | View All 18 Rows |
Immigrants in Cidra Municipio

| Immigration Origin | # Population | % Population | View All 0 Rows |
Sex and Age in Cidra Municipio
Sex and Age in Cidra Municipio
The most populous age groups in Cidra Municipio are 60 to 64 Years (1,581 | 8.2%) for men and 55 to 59 Years (1,549 | 7.5%) for women.
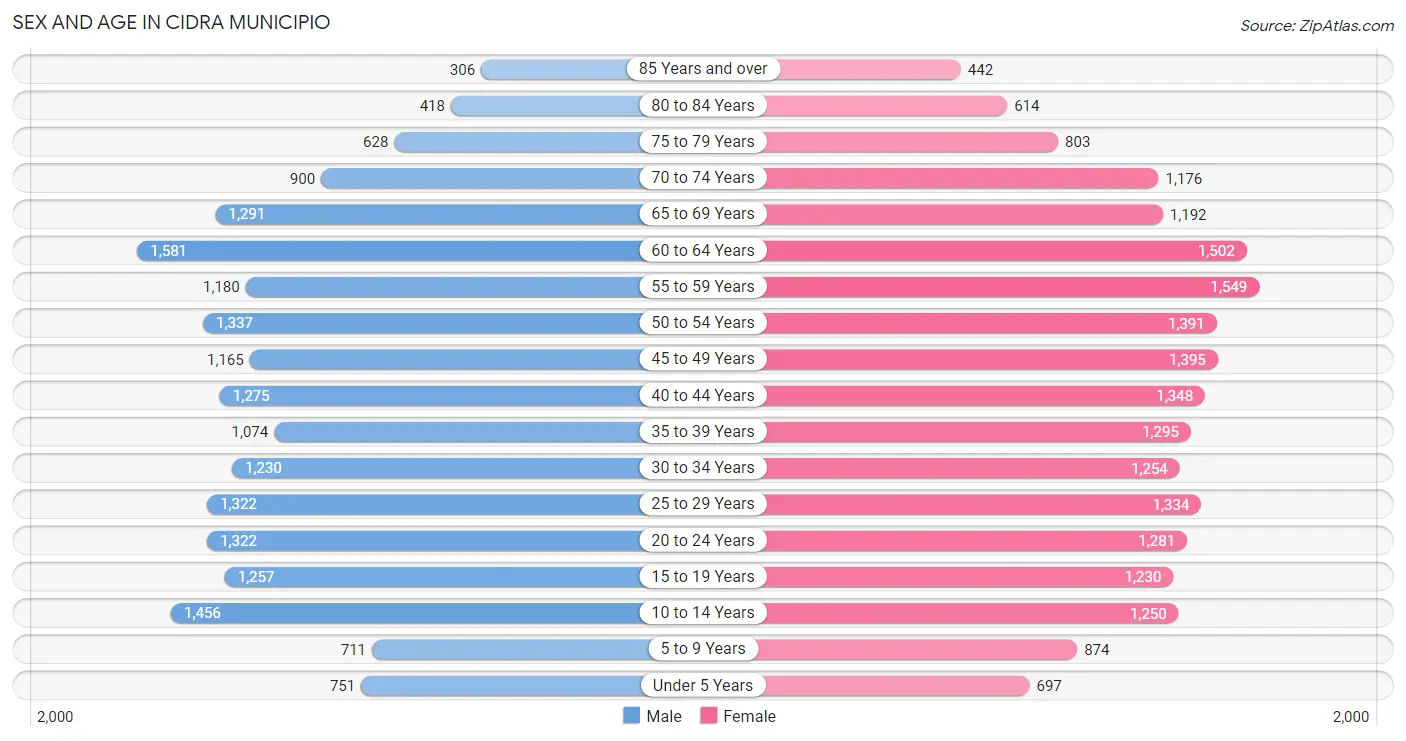
| Age Bracket | Male | Female |
| Under 5 Years | 751 (3.9%) | 697 (3.4%) |
| 5 to 9 Years | 711 (3.7%) | 874 (4.2%) |
| 10 to 14 Years | 1,456 (7.6%) | 1,250 (6.1%) |
| 15 to 19 Years | 1,257 (6.6%) | 1,230 (6.0%) |
| 20 to 24 Years | 1,322 (6.9%) | 1,281 (6.2%) |
| 25 to 29 Years | 1,322 (6.9%) | 1,334 (6.5%) |
| 30 to 34 Years | 1,230 (6.4%) | 1,254 (6.1%) |
| 35 to 39 Years | 1,074 (5.6%) | 1,295 (6.3%) |
| 40 to 44 Years | 1,275 (6.6%) | 1,348 (6.5%) |
| 45 to 49 Years | 1,165 (6.1%) | 1,395 (6.8%) |
| 50 to 54 Years | 1,337 (7.0%) | 1,391 (6.7%) |
| 55 to 59 Years | 1,180 (6.1%) | 1,549 (7.5%) |
| 60 to 64 Years | 1,581 (8.2%) | 1,502 (7.3%) |
| 65 to 69 Years | 1,291 (6.7%) | 1,192 (5.8%) |
| 70 to 74 Years | 900 (4.7%) | 1,176 (5.7%) |
| 75 to 79 Years | 628 (3.3%) | 803 (3.9%) |
| 80 to 84 Years | 418 (2.2%) | 614 (3.0%) |
| 85 Years and over | 306 (1.6%) | 442 (2.1%) |
| Total | 19,204 (100.0%) | 20,627 (100.0%) |
Families and Households in Cidra Municipio
Median Family Size in Cidra Municipio
The median family size in Cidra Municipio is 3.36 persons per family, with single male/father families (838 | 8.3%) accounting for the largest median family size of 3.85 persons per family. On the other hand, married-couple families (6,020 | 59.8%) represent the smallest median family size with 3.26 persons per family.
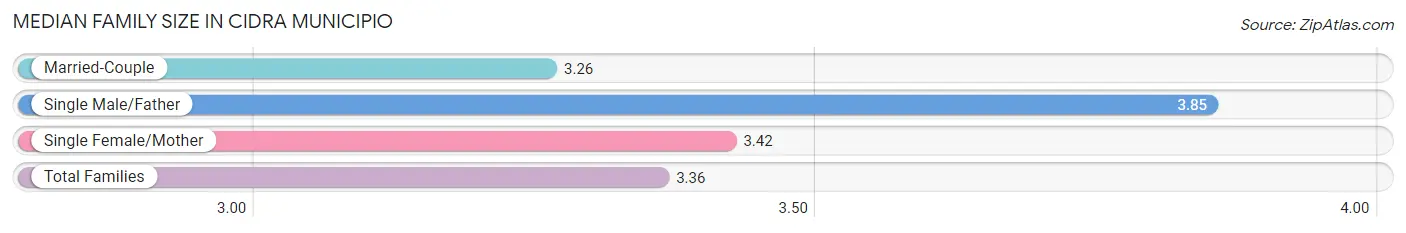
| Family Type | # Families | Family Size |
| Married-Couple | 6,020 (59.8%) | 3.26 |
| Single Male/Father | 838 (8.3%) | 3.85 |
| Single Female/Mother | 3,214 (31.9%) | 3.42 |
| Total Families | 10,072 (100.0%) | 3.36 |
Median Household Size in Cidra Municipio
The median household size in Cidra Municipio is 2.79 persons per household, with single male/father households (838 | 5.9%) accounting for the largest median household size of 4.41 persons per household. non-family households (4,135 | 29.1%) represent the smallest median household size with 1.14 persons per household.
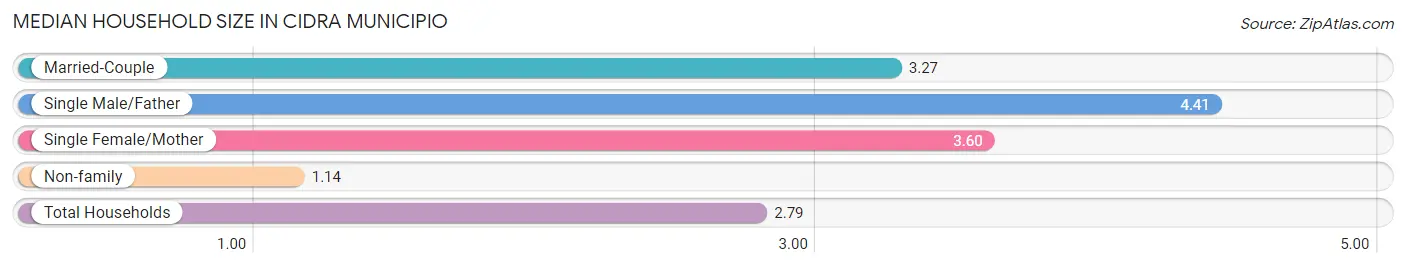
| Household Type | # Households | Household Size |
| Married-Couple | 6,020 (42.4%) | 3.27 |
| Single Male/Father | 838 (5.9%) | 4.41 |
| Single Female/Mother | 3,214 (22.6%) | 3.60 |
| Non-family | 4,135 (29.1%) | 1.14 |
| Total Households | 14,207 (100.0%) | 2.79 |
Household Size by Marriage Status in Cidra Municipio
Out of a total of 14,207 households in Cidra Municipio, 10,072 (70.9%) are family households, while 4,135 (29.1%) are nonfamily households. The most numerous type of family households are 2-person households, comprising 4,121, and the most common type of nonfamily households are 1-person households, comprising 3,617.
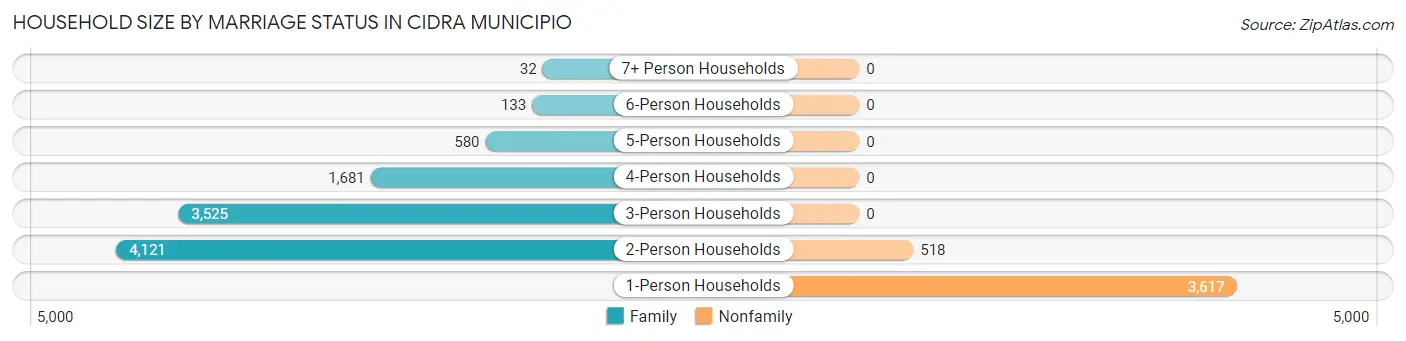
| Household Size | Family Households | Nonfamily Households |
| 1-Person Households | - | 3,617 (25.5%) |
| 2-Person Households | 4,121 (29.0%) | 518 (3.6%) |
| 3-Person Households | 3,525 (24.8%) | 0 (0.0%) |
| 4-Person Households | 1,681 (11.8%) | 0 (0.0%) |
| 5-Person Households | 580 (4.1%) | 0 (0.0%) |
| 6-Person Households | 133 (0.9%) | 0 (0.0%) |
| 7+ Person Households | 32 (0.2%) | 0 (0.0%) |
| Total | 10,072 (70.9%) | 4,135 (29.1%) |
Female Fertility in Cidra Municipio
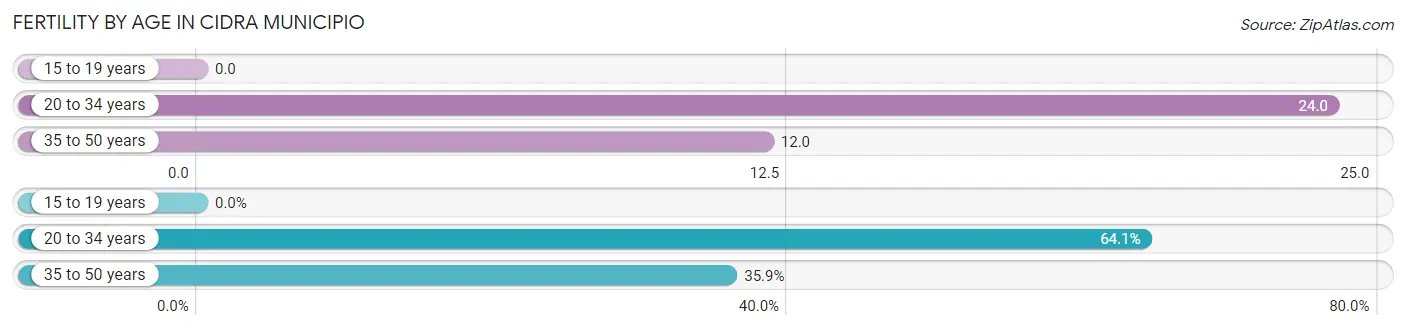
Fertility by Age in Cidra Municipio
Average fertility rate in Cidra Municipio is 15.0 births per 1,000 women. Women in the age bracket of 20 to 34 years have the highest fertility rate with 24.0 births per 1,000 women. Women in the age bracket of 20 to 34 years acount for 64.1% of all women with births.
| Age Bracket | Women with Births | Births / 1,000 Women |
| 15 to 19 years | 0 (0.0%) | 0.0 |
| 20 to 34 years | 91 (64.1%) | 24.0 |
| 35 to 50 years | 51 (35.9%) | 12.0 |
| Total | 142 (100.0%) | 15.0 |
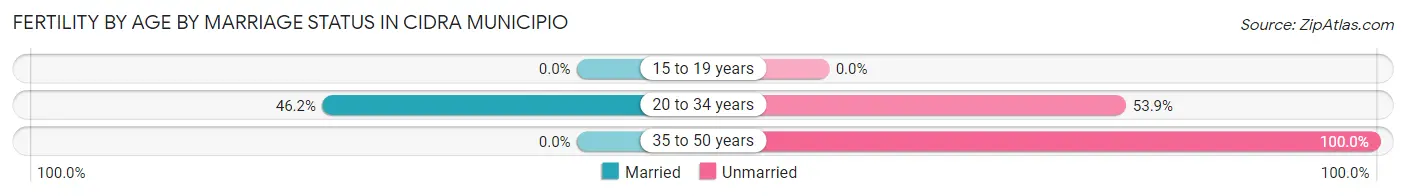
Fertility by Age by Marriage Status in Cidra Municipio
29.6% of women with births (142) in Cidra Municipio are married. The highest percentage of unmarried women with births falls into 35 to 50 years age bracket with 100.0% of them unmarried at the time of birth, while the lowest percentage of unmarried women with births belong to 20 to 34 years age bracket with 53.8% of them unmarried.
| Age Bracket | Married | Unmarried |
| 15 to 19 years | 0 (0.0%) | 0 (0.0%) |
| 20 to 34 years | 42 (46.2%) | 49 (53.8%) |
| 35 to 50 years | 0 (0.0%) | 51 (100.0%) |
| Total | 42 (29.6%) | 100 (70.4%) |
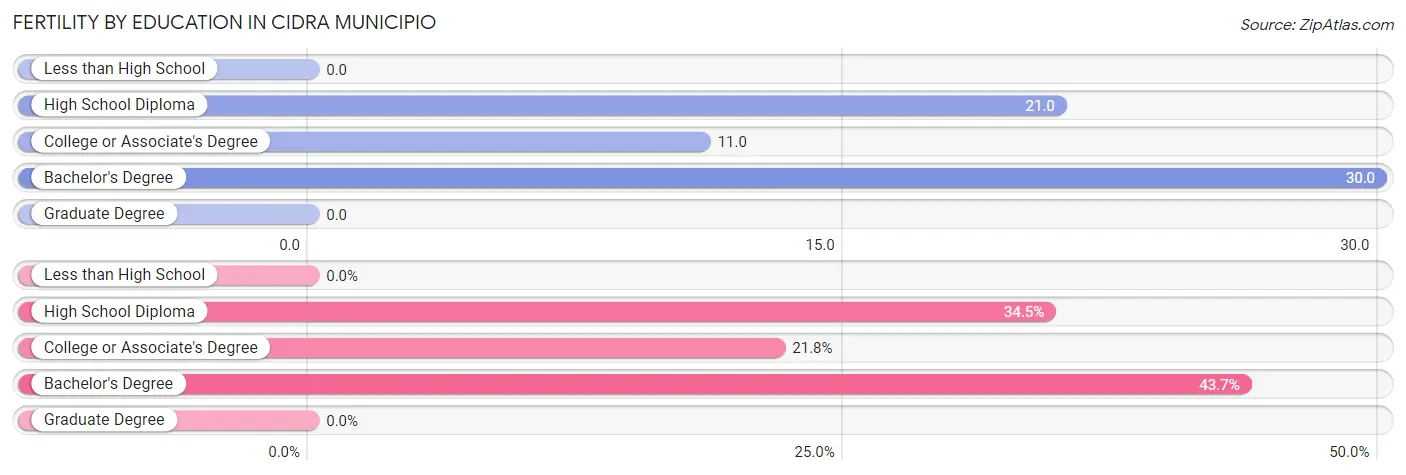
Fertility by Education in Cidra Municipio
| Educational Attainment | Women with Births | Births / 1,000 Women |
| Less than High School | 0 (0.0%) | 0.0 |
| High School Diploma | 49 (34.5%) | 21.0 |
| College or Associate's Degree | 31 (21.8%) | 11.0 |
| Bachelor's Degree | 62 (43.7%) | 30.0 |
| Graduate Degree | 0 (0.0%) | 0.0 |
| Total | 142 (100.0%) | 15.0 |
Fertility by Education by Marriage Status in Cidra Municipio
70.4% of women with births in Cidra Municipio are unmarried. Women with the educational attainment of bachelor's degree are most likely to be married with 67.7% of them married at childbirth, while women with the educational attainment of high school diploma are least likely to be married with 100.0% of them unmarried at childbirth.
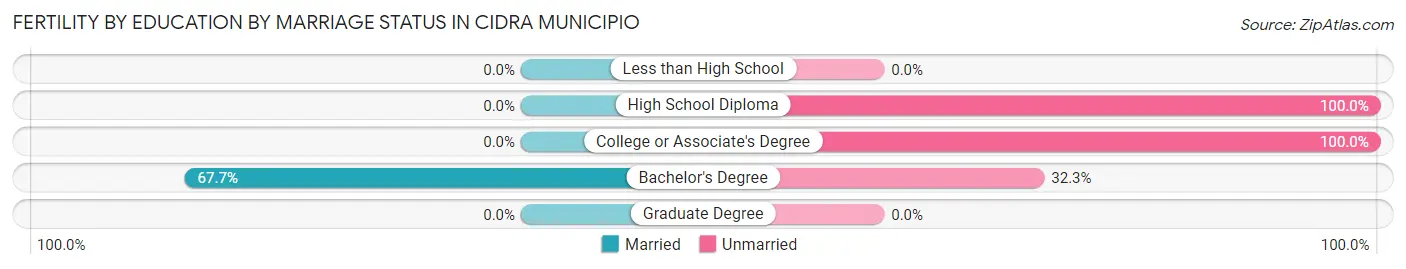
| Educational Attainment | Married | Unmarried |
| Less than High School | 0 (0.0%) | 0 (0.0%) |
| High School Diploma | 0 (0.0%) | 49 (100.0%) |
| College or Associate's Degree | 0 (0.0%) | 31 (100.0%) |
| Bachelor's Degree | 42 (67.7%) | 20 (32.3%) |
| Graduate Degree | 0 (0.0%) | 0 (0.0%) |
| Total | 42 (29.6%) | 100 (70.4%) |
Employment Characteristics in Cidra Municipio
Employment by Class of Employer in Cidra Municipio
Among the 12,820 employed individuals in Cidra Municipio, private company employees (8,305 | 64.8%), self-employed (not incorporated) (2,007 | 15.7%), and state government employees (1,321 | 10.3%) make up the most common classes of employment.
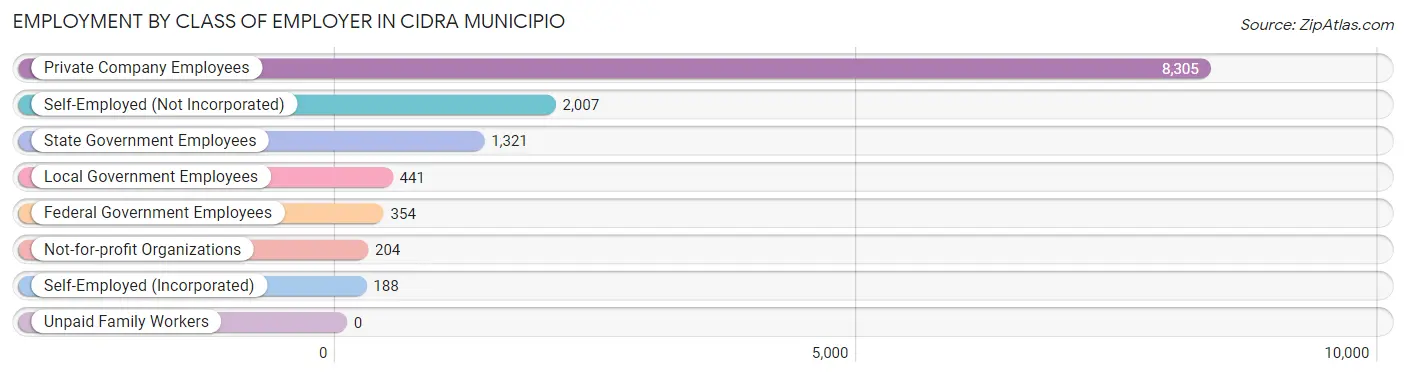
| Employer Class | # Employees | % Employees |
| Private Company Employees | 8,305 | 64.8% |
| Self-Employed (Incorporated) | 188 | 1.5% |
| Self-Employed (Not Incorporated) | 2,007 | 15.7% |
| Not-for-profit Organizations | 204 | 1.6% |
| Local Government Employees | 441 | 3.4% |
| State Government Employees | 1,321 | 10.3% |
| Federal Government Employees | 354 | 2.8% |
| Unpaid Family Workers | 0 | 0.0% |
| Total | 12,820 | 100.0% |
Employment Status by Age in Cidra Municipio
According to the labor force statistics for Cidra Municipio, out of the total population over 16 years of age (33,585), 41.1% or 13,803 individuals are in the labor force, with 6.3% or 870 of them unemployed. The age group with the highest labor force participation rate is 25 to 29 years, with 77.1% or 2,048 individuals in the labor force. Within the labor force, the 65 to 74 years age range has the highest percentage of unemployed individuals, with 20.1% or 37 of them being unemployed.
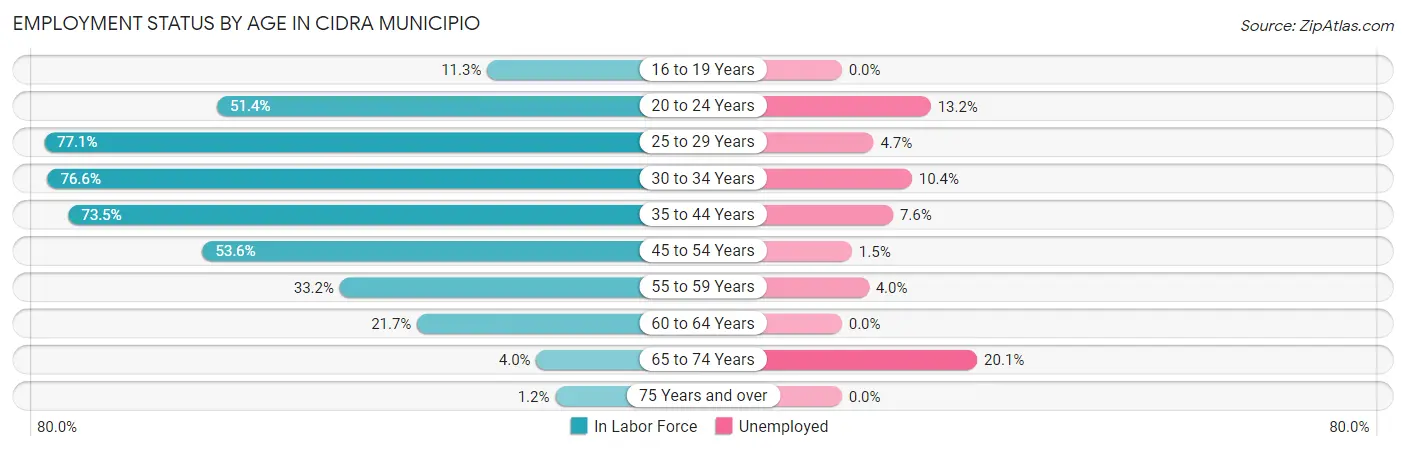
| Age Bracket | In Labor Force | Unemployed |
| 16 to 19 Years | 224 (11.3%) | 0 (0.0%) |
| 20 to 24 Years | 1,338 (51.4%) | 177 (13.2%) |
| 25 to 29 Years | 2,048 (77.1%) | 96 (4.7%) |
| 30 to 34 Years | 1,903 (76.6%) | 198 (10.4%) |
| 35 to 44 Years | 3,669 (73.5%) | 279 (7.6%) |
| 45 to 54 Years | 2,834 (53.6%) | 43 (1.5%) |
| 55 to 59 Years | 906 (33.2%) | 36 (4.0%) |
| 60 to 64 Years | 669 (21.7%) | 0 (0.0%) |
| 65 to 74 Years | 182 (4.0%) | 37 (20.1%) |
| 75 Years and over | 39 (1.2%) | 0 (0.0%) |
| Total | 13,803 (41.1%) | 870 (6.3%) |
Employment Status by Educational Attainment in Cidra Municipio
According to labor force statistics for Cidra Municipio, 56.7% of individuals (12,039) out of the total population between 25 and 64 years of age (21,232) are in the labor force, with 5.4% or 650 of them being unemployed. The group with the highest labor force participation rate are those with the educational attainment of bachelor's degree or higher, with 76.5% or 4,847 individuals in the labor force. Within the labor force, individuals with high school diploma education have the highest percentage of unemployment, with 7.4% or 246 of them being unemployed.
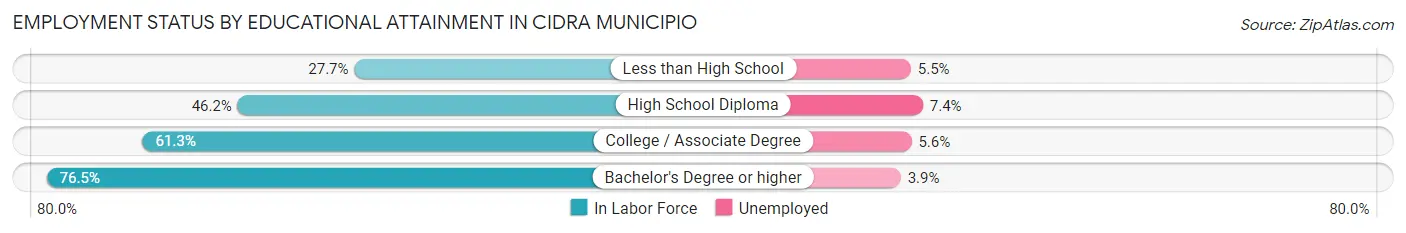
| Educational Attainment | In Labor Force | Unemployed |
| Less than High School | 709 (27.7%) | 141 (5.5%) |
| High School Diploma | 3,319 (46.2%) | 532 (7.4%) |
| College / Associate Degree | 3,157 (61.3%) | 288 (5.6%) |
| Bachelor's Degree or higher | 4,847 (76.5%) | 247 (3.9%) |
| Total | 12,039 (56.7%) | 1,147 (5.4%) |
Employment Occupations by Sex in Cidra Municipio
Management, Business, Science and Arts Occupations
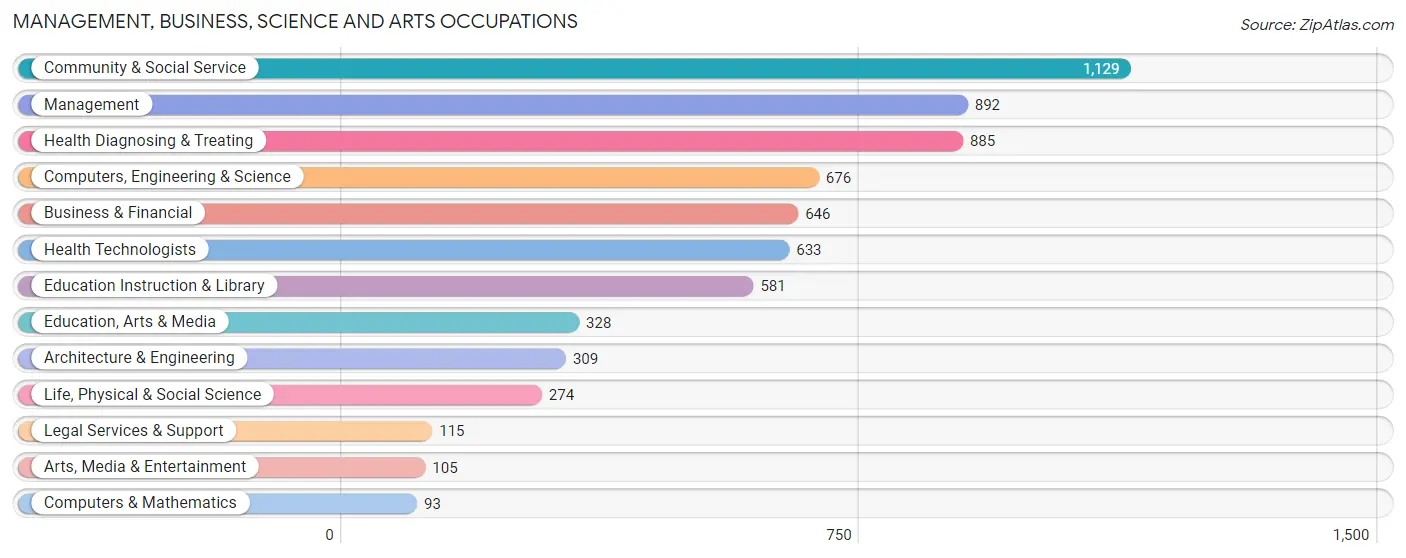
The most common Management, Business, Science and Arts occupations in Cidra Municipio are Community & Social Service (1,129 | 8.8%), Management (892 | 6.9%), Health Diagnosing & Treating (885 | 6.9%), Computers, Engineering & Science (676 | 5.3%), and Business & Financial (646 | 5.0%).
Management, Business, Science and Arts Occupations by Sex
Within the Management, Business, Science and Arts occupations in Cidra Municipio, the most male-oriented occupations are Computers & Mathematics (82.8%), Management (70.7%), and Architecture & Engineering (63.7%), while the most female-oriented occupations are Life, Physical & Social Science (87.2%), Health Technologists (85.6%), and Education Instruction & Library (81.4%).
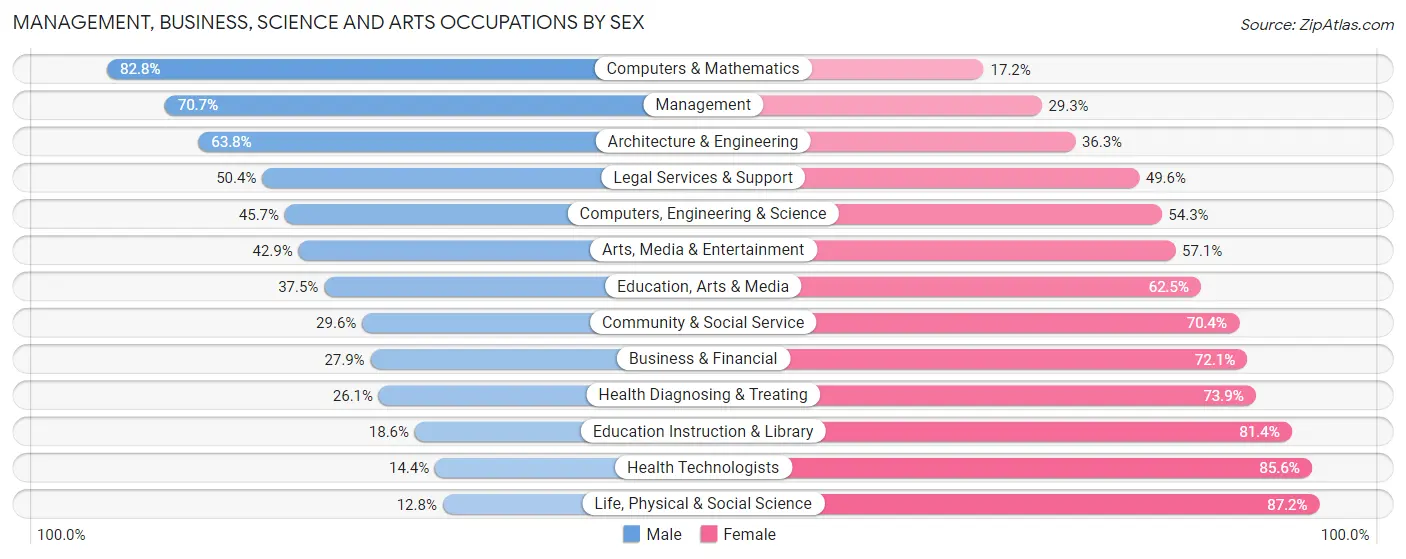
| Occupation | Male | Female |
| Management | 631 (70.7%) | 261 (29.3%) |
| Business & Financial | 180 (27.9%) | 466 (72.1%) |
| Computers, Engineering & Science | 309 (45.7%) | 367 (54.3%) |
| Computers & Mathematics | 77 (82.8%) | 16 (17.2%) |
| Architecture & Engineering | 197 (63.7%) | 112 (36.2%) |
| Life, Physical & Social Science | 35 (12.8%) | 239 (87.2%) |
| Community & Social Service | 334 (29.6%) | 795 (70.4%) |
| Education, Arts & Media | 123 (37.5%) | 205 (62.5%) |
| Legal Services & Support | 58 (50.4%) | 57 (49.6%) |
| Education Instruction & Library | 108 (18.6%) | 473 (81.4%) |
| Arts, Media & Entertainment | 45 (42.9%) | 60 (57.1%) |
| Health Diagnosing & Treating | 231 (26.1%) | 654 (73.9%) |
| Health Technologists | 91 (14.4%) | 542 (85.6%) |
| Total (Category) | 1,685 (39.9%) | 2,543 (60.2%) |
| Total (Overall) | 7,059 (54.9%) | 5,788 (45.1%) |
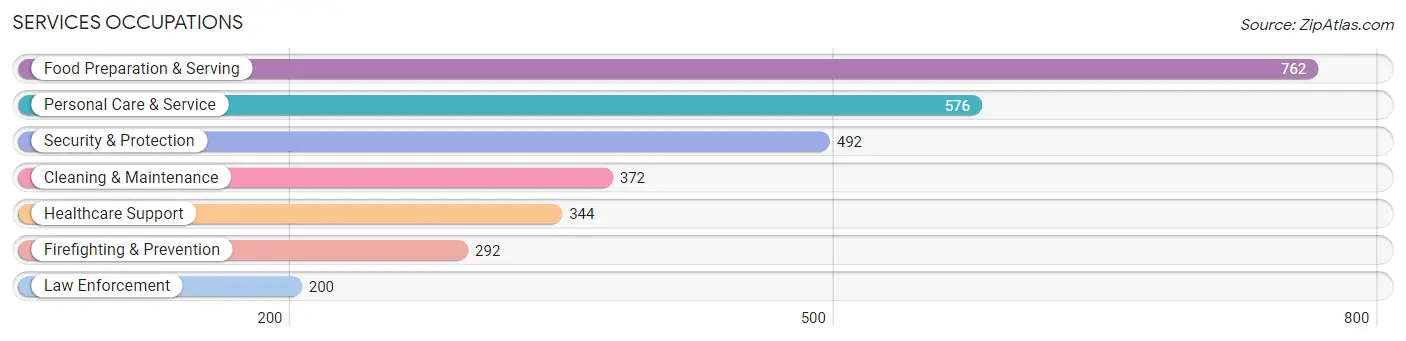
Services Occupations
The most common Services occupations in Cidra Municipio are Food Preparation & Serving (762 | 5.9%), Personal Care & Service (576 | 4.5%), Security & Protection (492 | 3.8%), Cleaning & Maintenance (372 | 2.9%), and Healthcare Support (344 | 2.7%).
Services Occupations by Sex
Within the Services occupations in Cidra Municipio, the most male-oriented occupations are Firefighting & Prevention (83.9%), Security & Protection (79.3%), and Law Enforcement (72.5%), while the most female-oriented occupations are Healthcare Support (69.8%), Food Preparation & Serving (57.1%), and Personal Care & Service (50.0%).
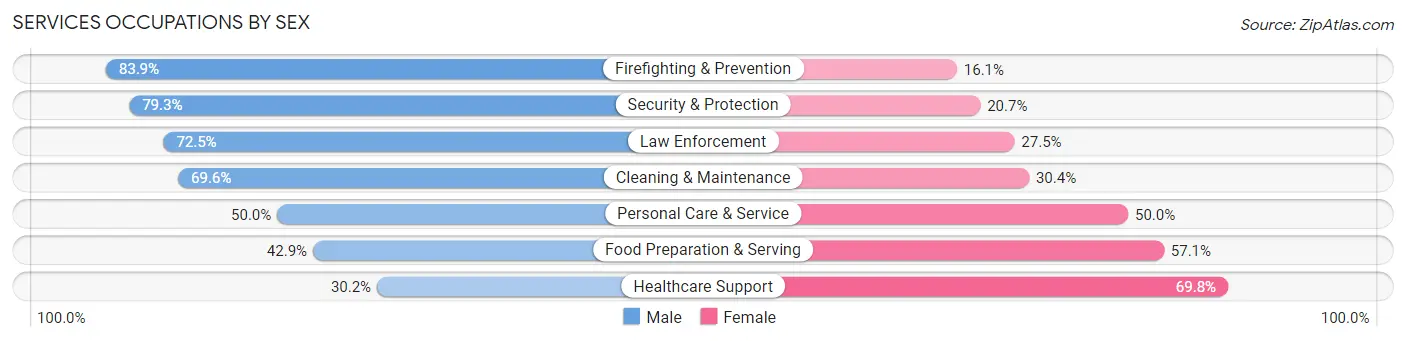
| Occupation | Male | Female |
| Healthcare Support | 104 (30.2%) | 240 (69.8%) |
| Security & Protection | 390 (79.3%) | 102 (20.7%) |
| Firefighting & Prevention | 245 (83.9%) | 47 (16.1%) |
| Law Enforcement | 145 (72.5%) | 55 (27.5%) |
| Food Preparation & Serving | 327 (42.9%) | 435 (57.1%) |
| Cleaning & Maintenance | 259 (69.6%) | 113 (30.4%) |
| Personal Care & Service | 288 (50.0%) | 288 (50.0%) |
| Total (Category) | 1,368 (53.7%) | 1,178 (46.3%) |
| Total (Overall) | 7,059 (54.9%) | 5,788 (45.1%) |
Sales and Office Occupations
The most common Sales and Office occupations in Cidra Municipio are Office & Administration (1,647 | 12.8%), and Sales & Related (1,492 | 11.6%).

Sales and Office Occupations by Sex

| Occupation | Male | Female |
| Sales & Related | 860 (57.6%) | 632 (42.4%) |
| Office & Administration | 530 (32.2%) | 1,117 (67.8%) |
| Total (Category) | 1,390 (44.3%) | 1,749 (55.7%) |
| Total (Overall) | 7,059 (54.9%) | 5,788 (45.1%) |
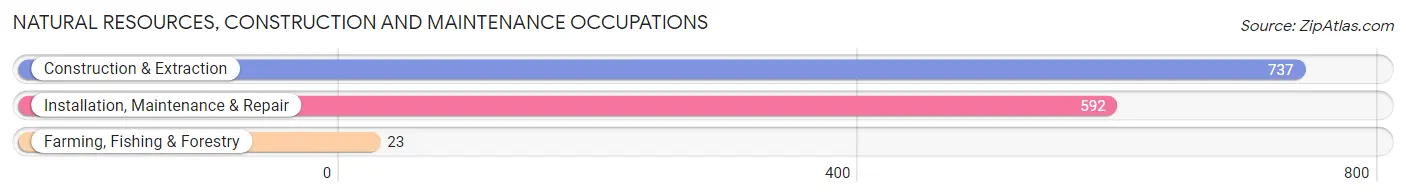
Natural Resources, Construction and Maintenance Occupations
The most common Natural Resources, Construction and Maintenance occupations in Cidra Municipio are Construction & Extraction (737 | 5.7%), Installation, Maintenance & Repair (592 | 4.6%), and Farming, Fishing & Forestry (23 | 0.2%).
Natural Resources, Construction and Maintenance Occupations by Sex

| Occupation | Male | Female |
| Farming, Fishing & Forestry | 23 (100.0%) | 0 (0.0%) |
| Construction & Extraction | 737 (100.0%) | 0 (0.0%) |
| Installation, Maintenance & Repair | 560 (94.6%) | 32 (5.4%) |
| Total (Category) | 1,320 (97.6%) | 32 (2.4%) |
| Total (Overall) | 7,059 (54.9%) | 5,788 (45.1%) |
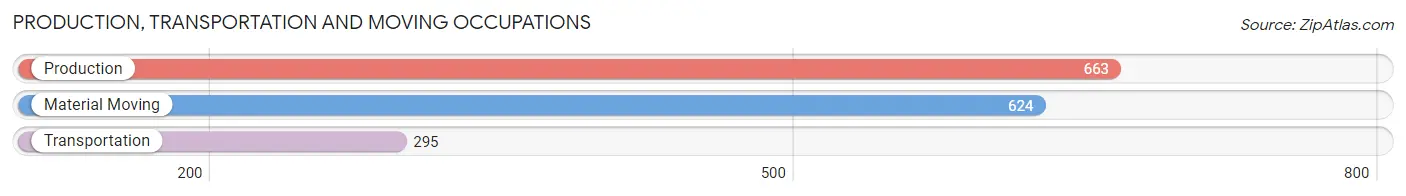
Production, Transportation and Moving Occupations
The most common Production, Transportation and Moving occupations in Cidra Municipio are Production (663 | 5.2%), Material Moving (624 | 4.9%), and Transportation (295 | 2.3%).
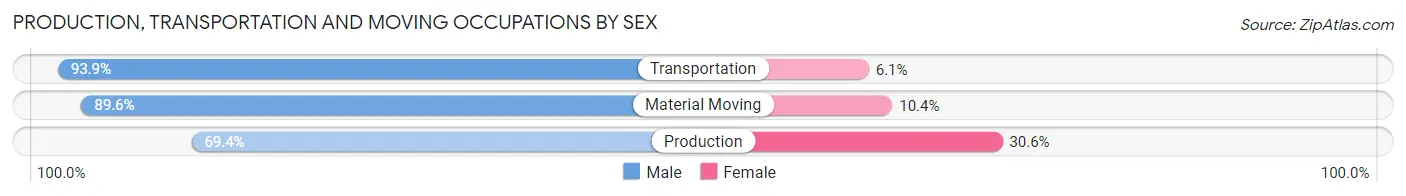
Production, Transportation and Moving Occupations by Sex
| Occupation | Male | Female |
| Production | 460 (69.4%) | 203 (30.6%) |
| Transportation | 277 (93.9%) | 18 (6.1%) |
| Material Moving | 559 (89.6%) | 65 (10.4%) |
| Total (Category) | 1,296 (81.9%) | 286 (18.1%) |
| Total (Overall) | 7,059 (54.9%) | 5,788 (45.1%) |
Employment Industries by Sex in Cidra Municipio
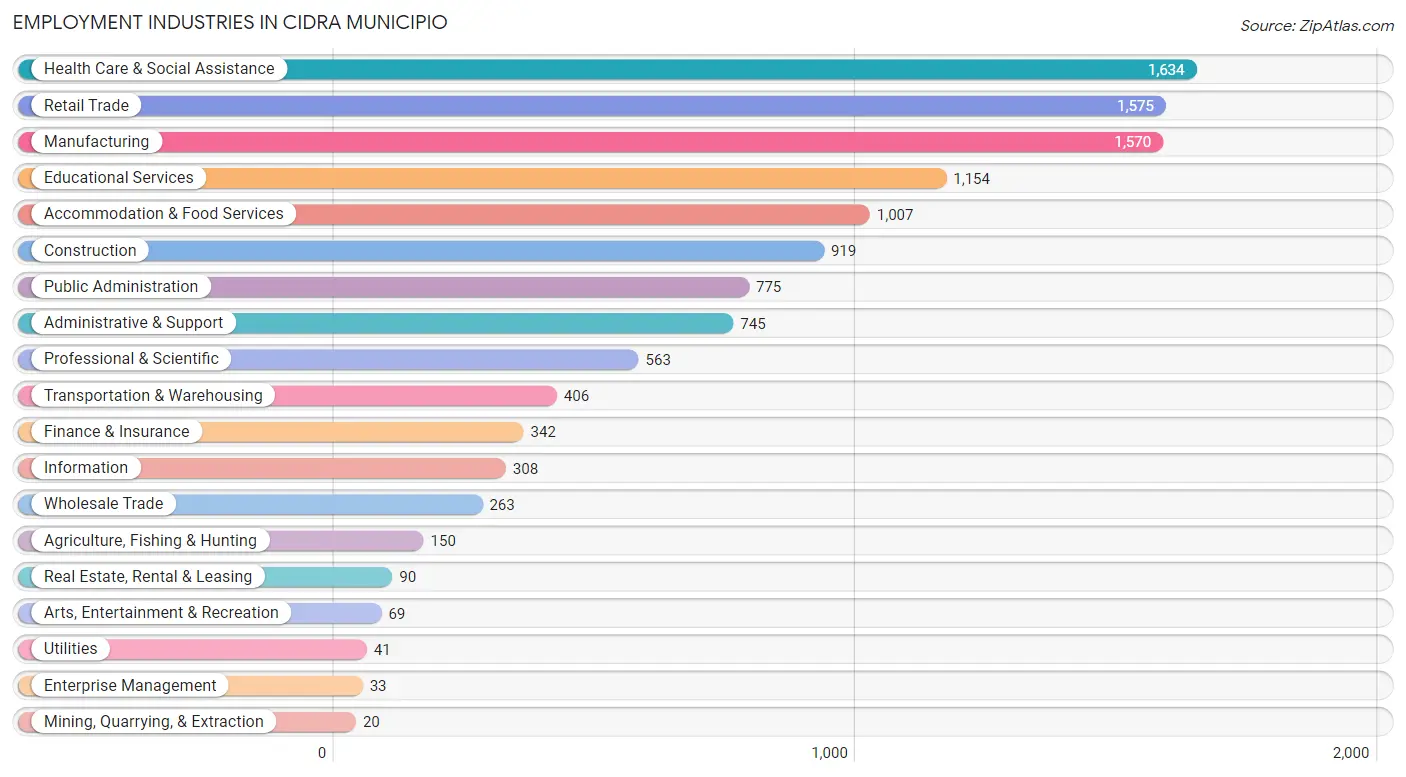
Employment Industries in Cidra Municipio
The major employment industries in Cidra Municipio include Health Care & Social Assistance (1,634 | 12.7%), Retail Trade (1,575 | 12.3%), Manufacturing (1,570 | 12.2%), Educational Services (1,154 | 9.0%), and Accommodation & Food Services (1,007 | 7.8%).
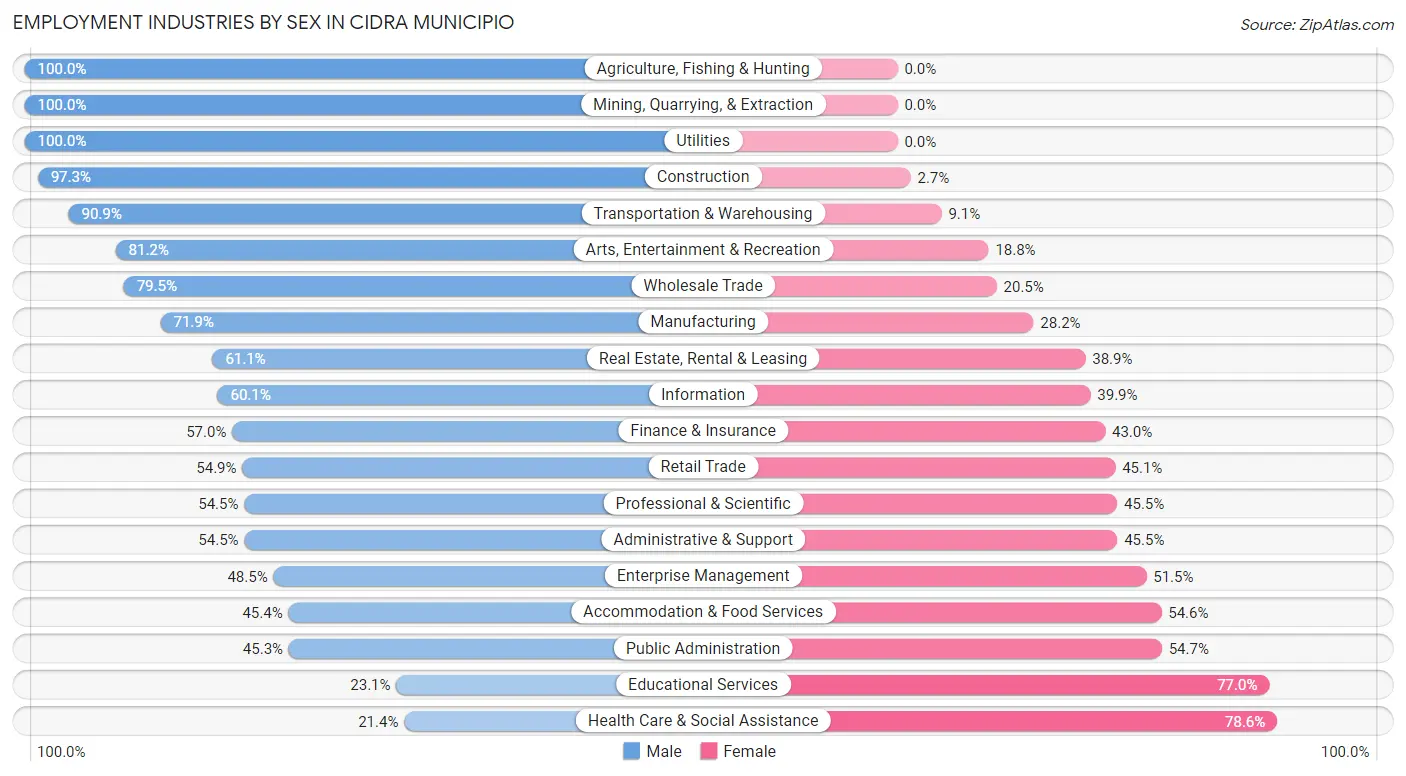
Employment Industries by Sex in Cidra Municipio
The Cidra Municipio industries that see more men than women are Agriculture, Fishing & Hunting (100.0%), Mining, Quarrying, & Extraction (100.0%), and Utilities (100.0%), whereas the industries that tend to have a higher number of women are Health Care & Social Assistance (78.6%), Educational Services (76.9%), and Public Administration (54.7%).
| Industry | Male | Female |
| Agriculture, Fishing & Hunting | 150 (100.0%) | 0 (0.0%) |
| Mining, Quarrying, & Extraction | 20 (100.0%) | 0 (0.0%) |
| Construction | 894 (97.3%) | 25 (2.7%) |
| Manufacturing | 1,128 (71.9%) | 442 (28.1%) |
| Wholesale Trade | 209 (79.5%) | 54 (20.5%) |
| Retail Trade | 865 (54.9%) | 710 (45.1%) |
| Transportation & Warehousing | 369 (90.9%) | 37 (9.1%) |
| Utilities | 41 (100.0%) | 0 (0.0%) |
| Information | 185 (60.1%) | 123 (39.9%) |
| Finance & Insurance | 195 (57.0%) | 147 (43.0%) |
| Real Estate, Rental & Leasing | 55 (61.1%) | 35 (38.9%) |
| Professional & Scientific | 307 (54.5%) | 256 (45.5%) |
| Enterprise Management | 16 (48.5%) | 17 (51.5%) |
| Administrative & Support | 406 (54.5%) | 339 (45.5%) |
| Educational Services | 266 (23.1%) | 888 (76.9%) |
| Health Care & Social Assistance | 350 (21.4%) | 1,284 (78.6%) |
| Arts, Entertainment & Recreation | 56 (81.2%) | 13 (18.8%) |
| Accommodation & Food Services | 457 (45.4%) | 550 (54.6%) |
| Public Administration | 351 (45.3%) | 424 (54.7%) |
| Total | 7,059 (54.9%) | 5,788 (45.1%) |
Education in Cidra Municipio
School Enrollment in Cidra Municipio
The most common levels of schooling among the 8,561 students in Cidra Municipio are college / undergraduate (2,374 | 27.7%), high school (2,059 | 24.0%), and middle school (2,008 | 23.5%).
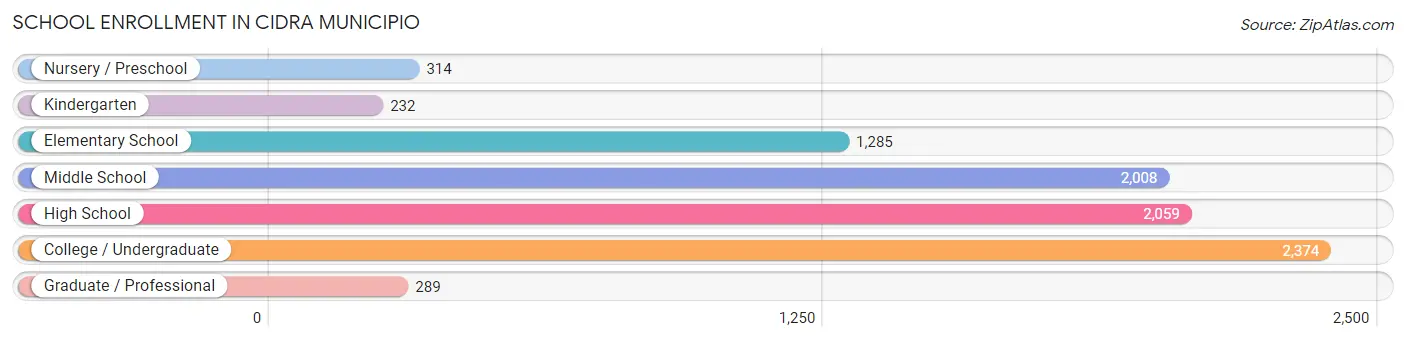
| School Level | # Students | % Students |
| Nursery / Preschool | 314 | 3.7% |
| Kindergarten | 232 | 2.7% |
| Elementary School | 1,285 | 15.0% |
| Middle School | 2,008 | 23.5% |
| High School | 2,059 | 24.0% |
| College / Undergraduate | 2,374 | 27.7% |
| Graduate / Professional | 289 | 3.4% |
| Total | 8,561 | 100.0% |
School Enrollment by Age by Funding Source in Cidra Municipio
Out of a total of 8,561 students who are enrolled in schools in Cidra Municipio, 2,731 (31.9%) attend a private institution, while the remaining 5,830 (68.1%) are enrolled in public schools. The age group of 25 to 34 year olds has the highest likelihood of being enrolled in private schools, with 376 (84.9% in the age bracket) enrolled. Conversely, the age group of 15 to 17 year olds has the lowest likelihood of being enrolled in a private school, with 1,324 (89.2% in the age bracket) attending a public institution.
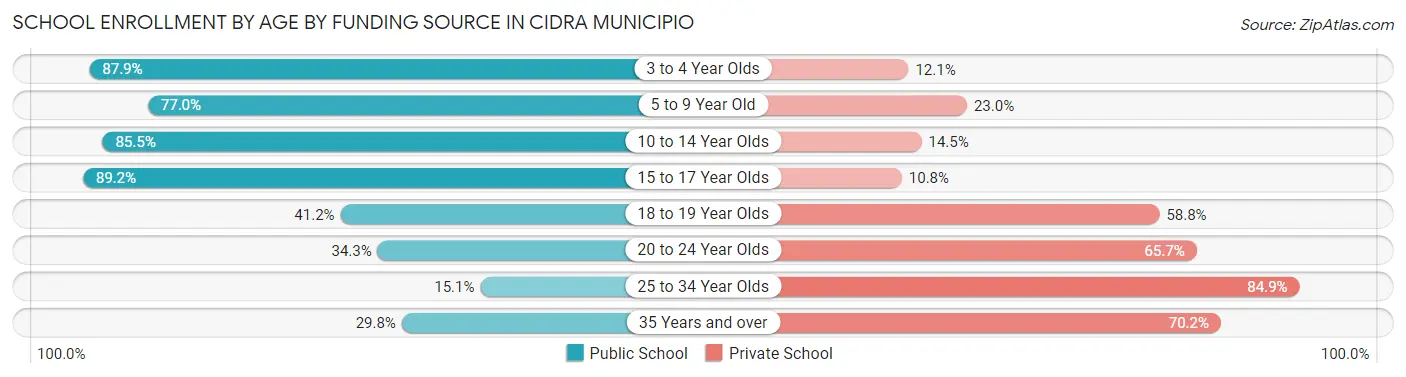
| Age Bracket | Public School | Private School |
| 3 to 4 Year Olds | 204 (87.9%) | 28 (12.1%) |
| 5 to 9 Year Old | 1,160 (77.0%) | 346 (23.0%) |
| 10 to 14 Year Olds | 2,238 (85.5%) | 380 (14.5%) |
| 15 to 17 Year Olds | 1,324 (89.2%) | 161 (10.8%) |
| 18 to 19 Year Olds | 355 (41.2%) | 507 (58.8%) |
| 20 to 24 Year Olds | 456 (34.3%) | 875 (65.7%) |
| 25 to 34 Year Olds | 67 (15.1%) | 376 (84.9%) |
| 35 Years and over | 25 (29.8%) | 59 (70.2%) |
| Total | 5,830 (68.1%) | 2,731 (31.9%) |
Educational Attainment by Field of Study in Cidra Municipio
Business (2,198 | 28.9%), education (1,152 | 15.1%), science & technology (918 | 12.1%), social sciences (687 | 9.0%), and bio, nature & agricultural (449 | 5.9%) are the most common fields of study among 7,614 individuals in Cidra Municipio who have obtained a bachelor's degree or higher.
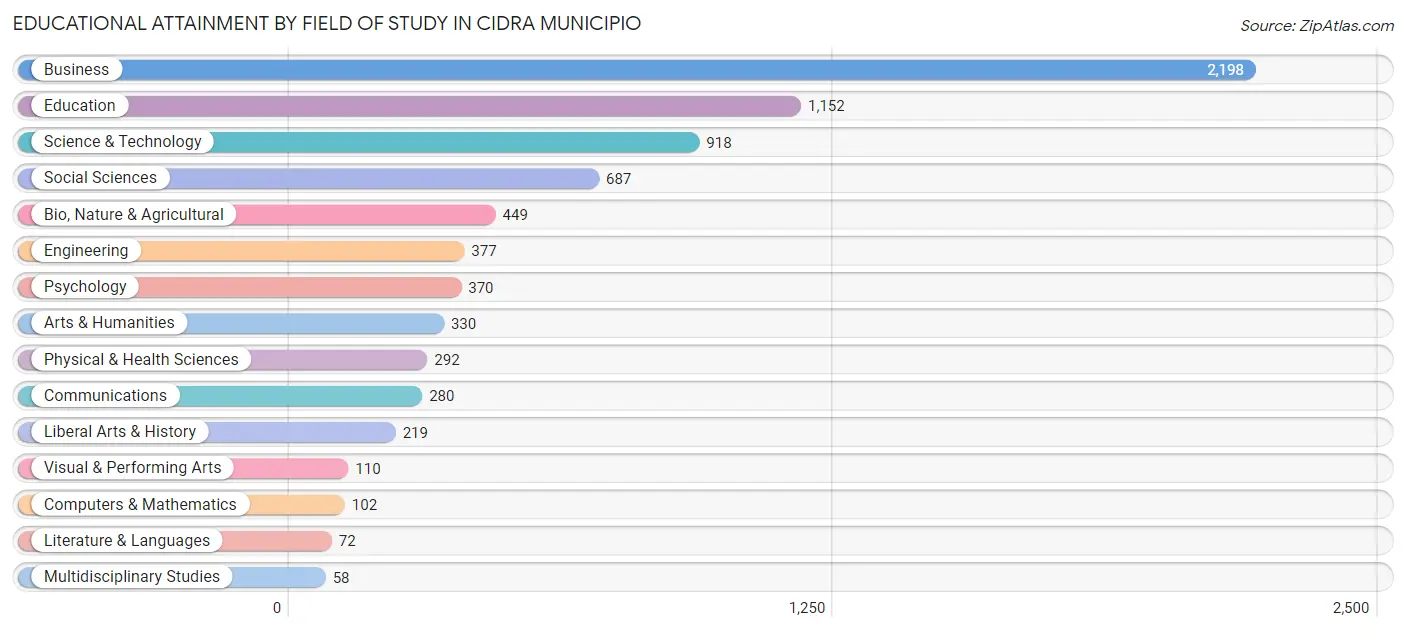
| Field of Study | # Graduates | % Graduates |
| Computers & Mathematics | 102 | 1.3% |
| Bio, Nature & Agricultural | 449 | 5.9% |
| Physical & Health Sciences | 292 | 3.8% |
| Psychology | 370 | 4.9% |
| Social Sciences | 687 | 9.0% |
| Engineering | 377 | 5.0% |
| Multidisciplinary Studies | 58 | 0.8% |
| Science & Technology | 918 | 12.1% |
| Business | 2,198 | 28.9% |
| Education | 1,152 | 15.1% |
| Literature & Languages | 72 | 0.9% |
| Liberal Arts & History | 219 | 2.9% |
| Visual & Performing Arts | 110 | 1.4% |
| Communications | 280 | 3.7% |
| Arts & Humanities | 330 | 4.3% |
| Total | 7,614 | 100.0% |
Transportation & Commute in Cidra Municipio
Vehicle Availability by Sex in Cidra Municipio
The most prevalent vehicle ownership categories in Cidra Municipio are males with 2 vehicles (2,927, accounting for 41.1%) and females with 2 vehicles (2,282, making up 51.4%).
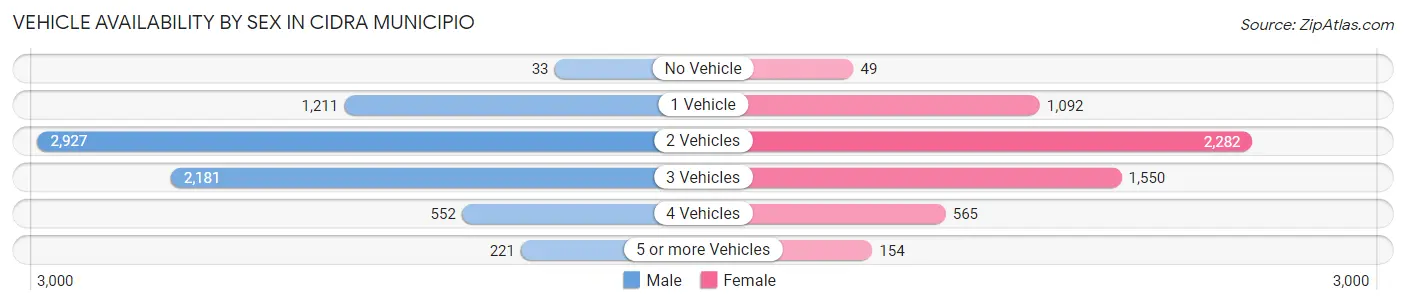
| Vehicles Available | Male | Female |
| No Vehicle | 33 (0.5%) | 49 (0.9%) |
| 1 Vehicle | 1,211 (17.0%) | 1,092 (19.2%) |
| 2 Vehicles | 2,927 (41.1%) | 2,282 (40.1%) |
| 3 Vehicles | 2,181 (30.6%) | 1,550 (27.2%) |
| 4 Vehicles | 552 (7.7%) | 565 (9.9%) |
| 5 or more Vehicles | 221 (3.1%) | 154 (2.7%) |
| Total | 7,125 (100.0%) | 5,692 (100.0%) |
Commute Time in Cidra Municipio
The most frequently occuring commute durations in Cidra Municipio are 20 to 24 minutes (1,981 commuters, 15.7%), 15 to 19 minutes (1,641 commuters, 13.0%), and 10 to 14 minutes (1,553 commuters, 12.3%).
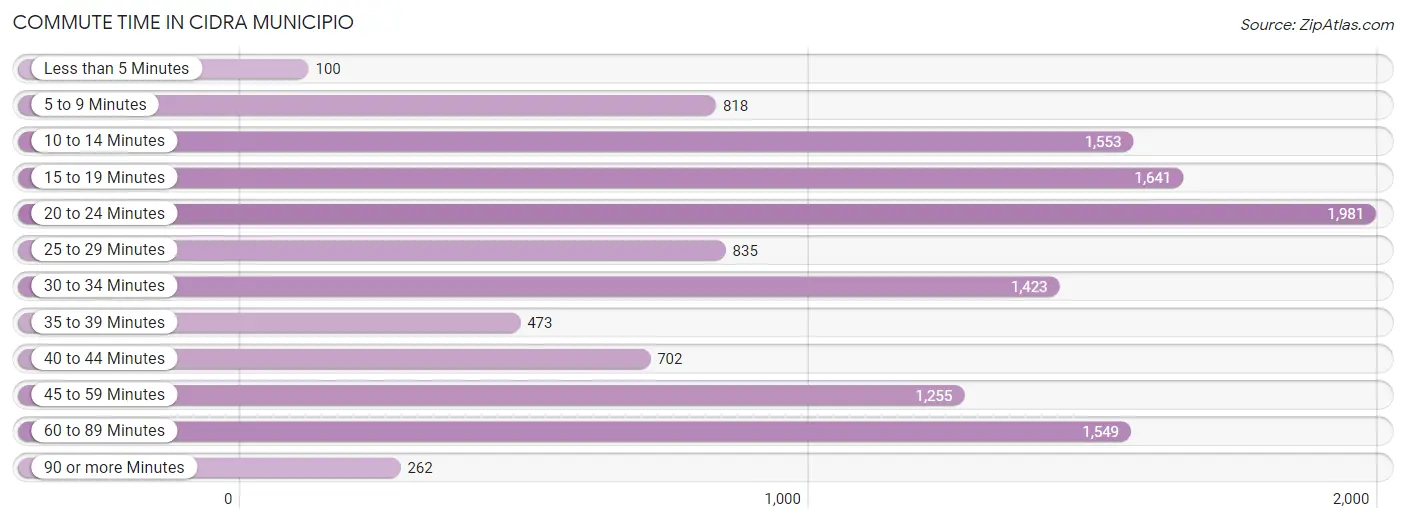
| Commute Time | # Commuters | % Commuters |
| Less than 5 Minutes | 100 | 0.8% |
| 5 to 9 Minutes | 818 | 6.5% |
| 10 to 14 Minutes | 1,553 | 12.3% |
| 15 to 19 Minutes | 1,641 | 13.0% |
| 20 to 24 Minutes | 1,981 | 15.7% |
| 25 to 29 Minutes | 835 | 6.6% |
| 30 to 34 Minutes | 1,423 | 11.3% |
| 35 to 39 Minutes | 473 | 3.8% |
| 40 to 44 Minutes | 702 | 5.6% |
| 45 to 59 Minutes | 1,255 | 10.0% |
| 60 to 89 Minutes | 1,549 | 12.3% |
| 90 or more Minutes | 262 | 2.1% |
Commute Time by Sex in Cidra Municipio
The most common commute times in Cidra Municipio are 20 to 24 minutes (925 commuters, 13.3%) for males and 20 to 24 minutes (1,056 commuters, 18.8%) for females.
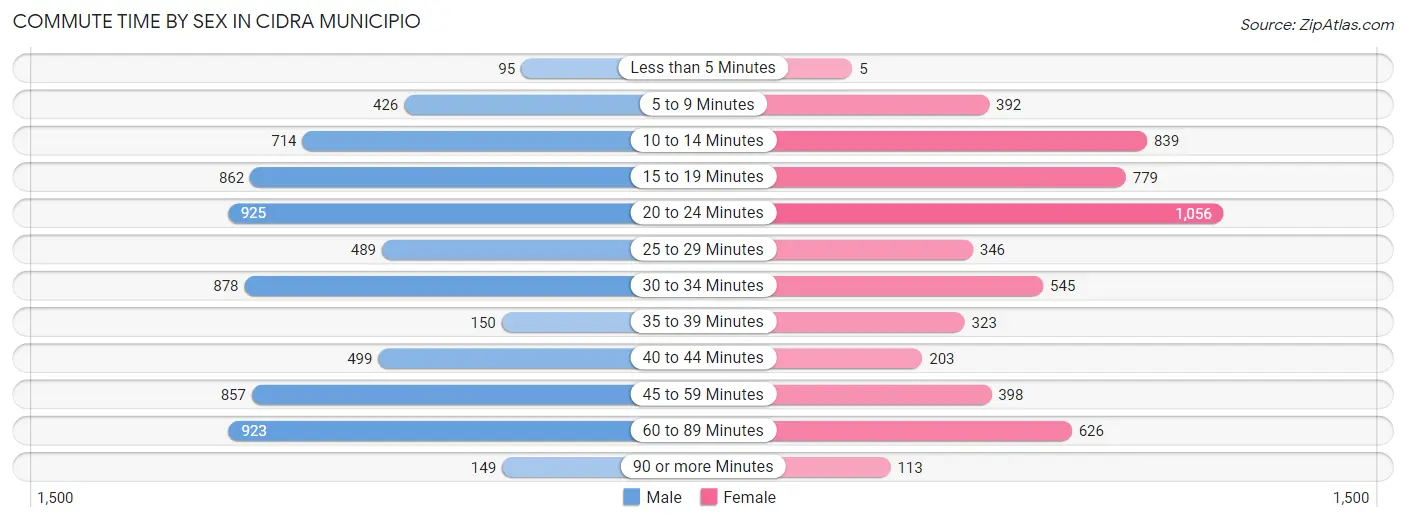
| Commute Time | Male | Female |
| Less than 5 Minutes | 95 (1.4%) | 5 (0.1%) |
| 5 to 9 Minutes | 426 (6.1%) | 392 (7.0%) |
| 10 to 14 Minutes | 714 (10.2%) | 839 (14.9%) |
| 15 to 19 Minutes | 862 (12.4%) | 779 (13.9%) |
| 20 to 24 Minutes | 925 (13.3%) | 1,056 (18.8%) |
| 25 to 29 Minutes | 489 (7.0%) | 346 (6.1%) |
| 30 to 34 Minutes | 878 (12.6%) | 545 (9.7%) |
| 35 to 39 Minutes | 150 (2.1%) | 323 (5.7%) |
| 40 to 44 Minutes | 499 (7.2%) | 203 (3.6%) |
| 45 to 59 Minutes | 857 (12.3%) | 398 (7.1%) |
| 60 to 89 Minutes | 923 (13.3%) | 626 (11.1%) |
| 90 or more Minutes | 149 (2.1%) | 113 (2.0%) |
Time of Departure to Work by Sex in Cidra Municipio
The most frequent times of departure to work in Cidra Municipio are 6:00 AM to 6:29 AM (1,252, 18.0%) for males and 6:30 AM to 6:59 AM (1,085, 19.3%) for females.
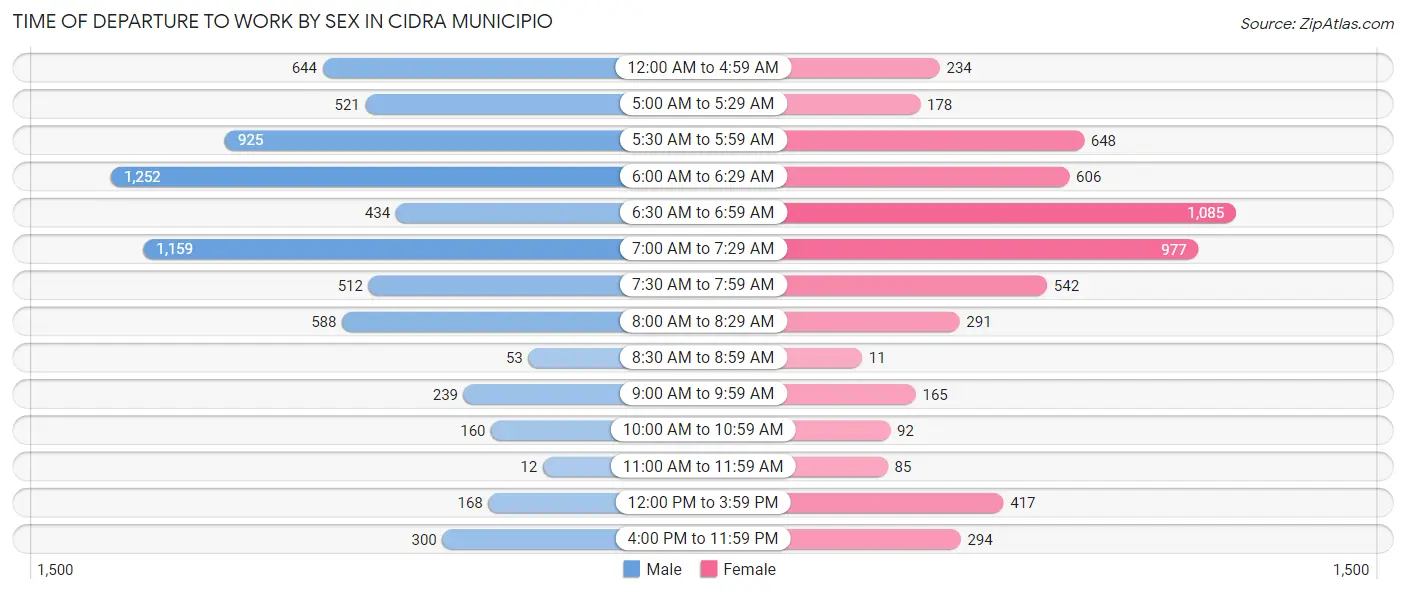
| Time of Departure | Male | Female |
| 12:00 AM to 4:59 AM | 644 (9.2%) | 234 (4.2%) |
| 5:00 AM to 5:29 AM | 521 (7.5%) | 178 (3.2%) |
| 5:30 AM to 5:59 AM | 925 (13.3%) | 648 (11.5%) |
| 6:00 AM to 6:29 AM | 1,252 (18.0%) | 606 (10.8%) |
| 6:30 AM to 6:59 AM | 434 (6.2%) | 1,085 (19.3%) |
| 7:00 AM to 7:29 AM | 1,159 (16.6%) | 977 (17.4%) |
| 7:30 AM to 7:59 AM | 512 (7.3%) | 542 (9.6%) |
| 8:00 AM to 8:29 AM | 588 (8.4%) | 291 (5.2%) |
| 8:30 AM to 8:59 AM | 53 (0.8%) | 11 (0.2%) |
| 9:00 AM to 9:59 AM | 239 (3.4%) | 165 (2.9%) |
| 10:00 AM to 10:59 AM | 160 (2.3%) | 92 (1.6%) |
| 11:00 AM to 11:59 AM | 12 (0.2%) | 85 (1.5%) |
| 12:00 PM to 3:59 PM | 168 (2.4%) | 417 (7.4%) |
| 4:00 PM to 11:59 PM | 300 (4.3%) | 294 (5.2%) |
| Total | 6,967 (100.0%) | 5,625 (100.0%) |
Housing Occupancy in Cidra Municipio
Occupancy by Ownership in Cidra Municipio
Of the total 14,207 dwellings in Cidra Municipio, owner-occupied units account for 9,530 (67.1%), while renter-occupied units make up 4,677 (32.9%).
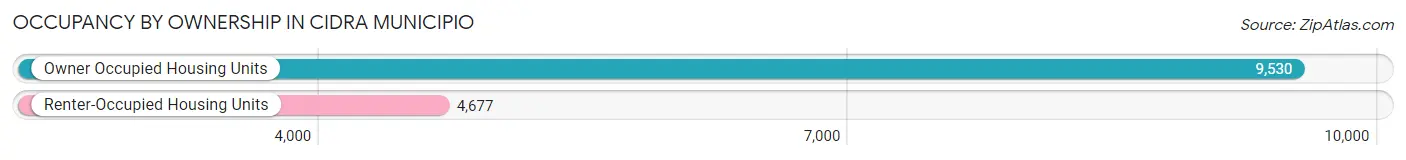
| Occupancy | # Housing Units | % Housing Units |
| Owner Occupied Housing Units | 9,530 | 67.1% |
| Renter-Occupied Housing Units | 4,677 | 32.9% |
| Total Occupied Housing Units | 14,207 | 100.0% |
Occupancy by Household Size in Cidra Municipio
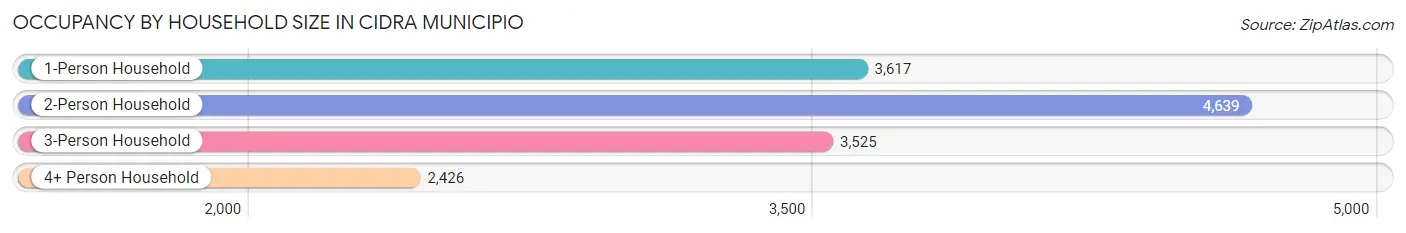
| Household Size | # Housing Units | % Housing Units |
| 1-Person Household | 3,617 | 25.5% |
| 2-Person Household | 4,639 | 32.7% |
| 3-Person Household | 3,525 | 24.8% |
| 4+ Person Household | 2,426 | 17.1% |
| Total Housing Units | 14,207 | 100.0% |
Occupancy by Ownership by Household Size in Cidra Municipio
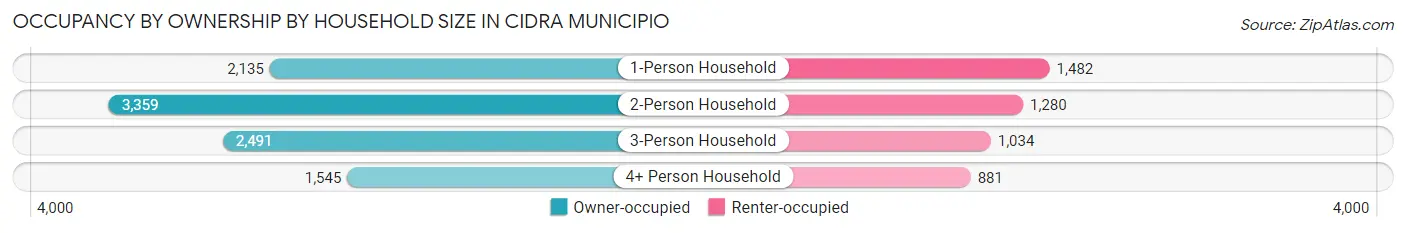
| Household Size | Owner-occupied | Renter-occupied |
| 1-Person Household | 2,135 (59.0%) | 1,482 (41.0%) |
| 2-Person Household | 3,359 (72.4%) | 1,280 (27.6%) |
| 3-Person Household | 2,491 (70.7%) | 1,034 (29.3%) |
| 4+ Person Household | 1,545 (63.7%) | 881 (36.3%) |
| Total Housing Units | 9,530 (67.1%) | 4,677 (32.9%) |
Occupancy by Educational Attainment in Cidra Municipio
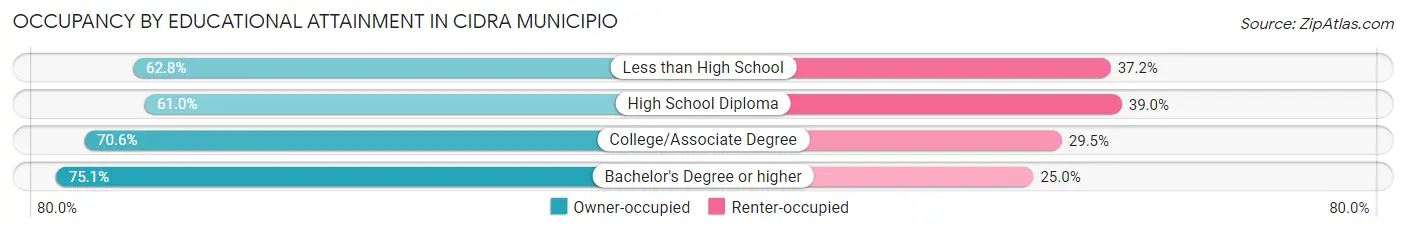
| Household Size | Owner-occupied | Renter-occupied |
| Less than High School | 2,021 (62.8%) | 1,197 (37.2%) |
| High School Diploma | 2,642 (61.0%) | 1,686 (39.0%) |
| College/Associate Degree | 2,072 (70.6%) | 865 (29.4%) |
| Bachelor's Degree or higher | 2,795 (75.0%) | 929 (24.9%) |
Occupancy by Age of Householder in Cidra Municipio
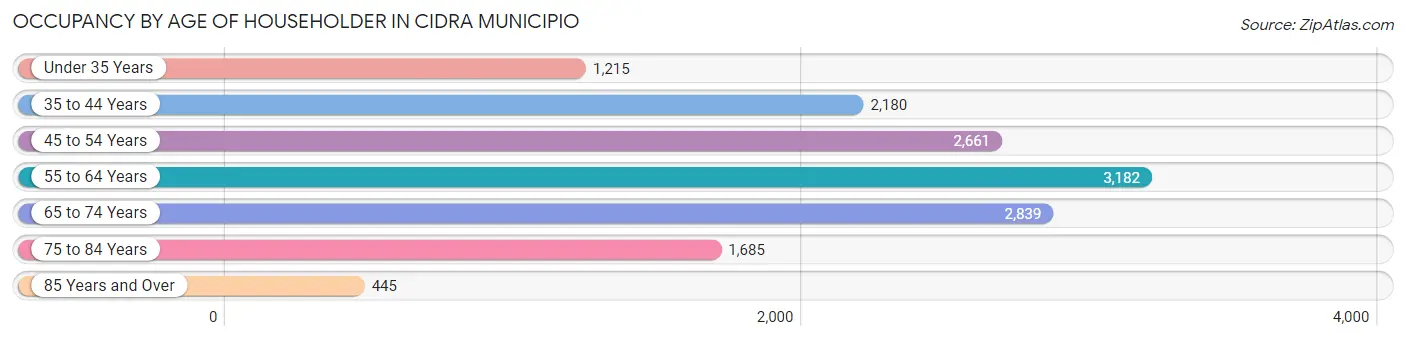
| Age Bracket | # Households | % Households |
| Under 35 Years | 1,215 | 8.6% |
| 35 to 44 Years | 2,180 | 15.3% |
| 45 to 54 Years | 2,661 | 18.7% |
| 55 to 64 Years | 3,182 | 22.4% |
| 65 to 74 Years | 2,839 | 20.0% |
| 75 to 84 Years | 1,685 | 11.9% |
| 85 Years and Over | 445 | 3.1% |
| Total | 14,207 | 100.0% |
Housing Finances in Cidra Municipio
Median Income by Occupancy in Cidra Municipio
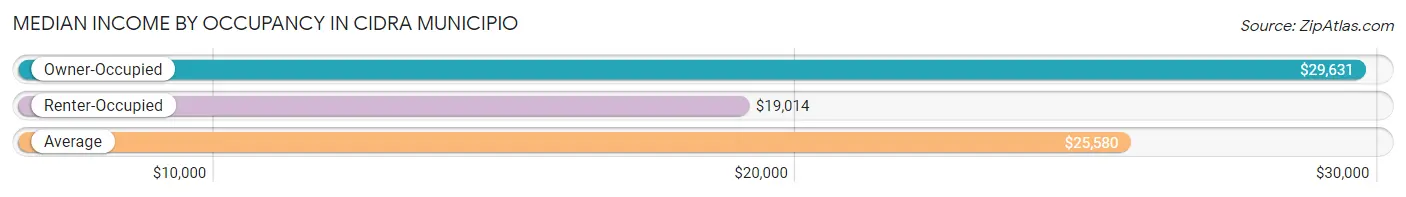
| Occupancy Type | # Households | Median Income |
| Owner-Occupied | 9,530 (67.1%) | $29,631 |
| Renter-Occupied | 4,677 (32.9%) | $19,014 |
| Average | 14,207 (100.0%) | $25,580 |
Occupancy by Householder Income Bracket in Cidra Municipio
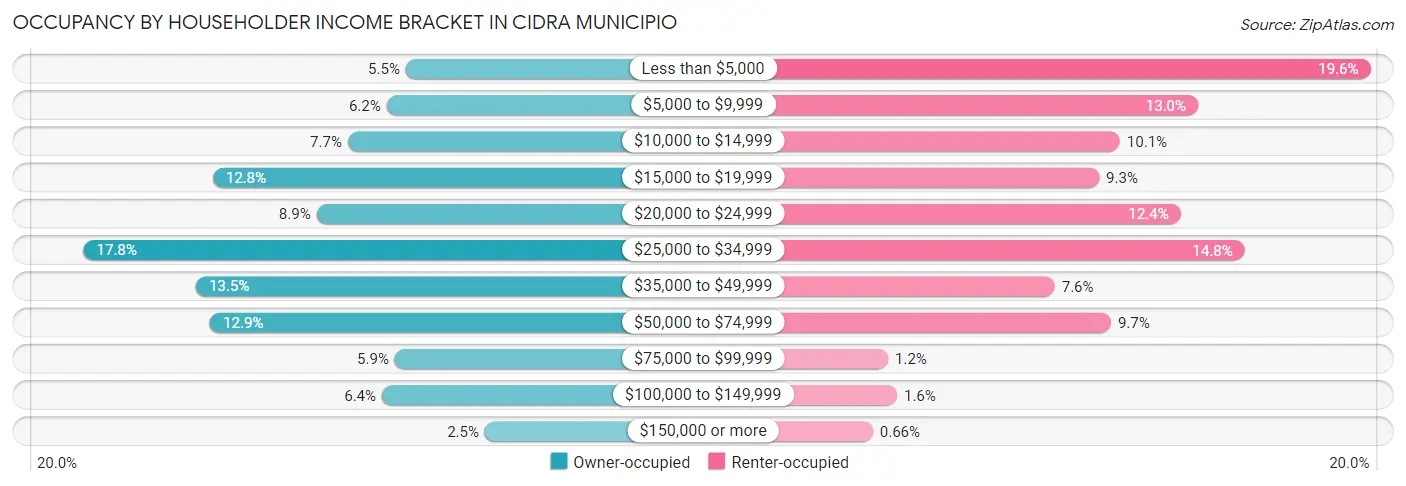
| Income Bracket | Owner-occupied | Renter-occupied |
| Less than $5,000 | 522 (5.5%) | 917 (19.6%) |
| $5,000 to $9,999 | 592 (6.2%) | 610 (13.0%) |
| $10,000 to $14,999 | 733 (7.7%) | 471 (10.1%) |
| $15,000 to $19,999 | 1,223 (12.8%) | 434 (9.3%) |
| $20,000 to $24,999 | 846 (8.9%) | 579 (12.4%) |
| $25,000 to $34,999 | 1,692 (17.7%) | 693 (14.8%) |
| $35,000 to $49,999 | 1,284 (13.5%) | 355 (7.6%) |
| $50,000 to $74,999 | 1,232 (12.9%) | 455 (9.7%) |
| $75,000 to $99,999 | 562 (5.9%) | 58 (1.2%) |
| $100,000 to $149,999 | 609 (6.4%) | 74 (1.6%) |
| $150,000 or more | 235 (2.5%) | 31 (0.7%) |
| Total | 9,530 (100.0%) | 4,677 (100.0%) |
Monthly Housing Cost Tiers in Cidra Municipio
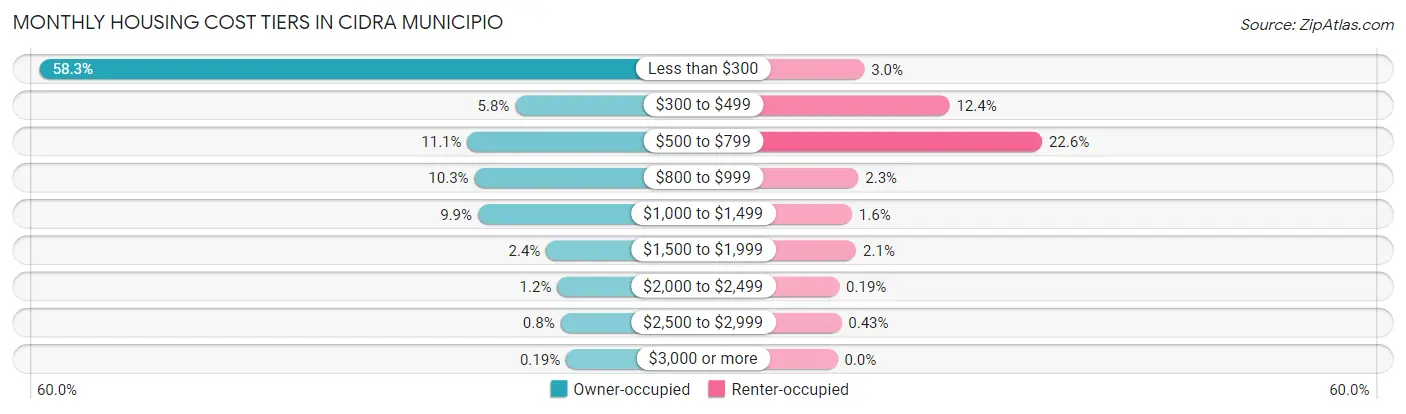
| Monthly Cost | Owner-occupied | Renter-occupied |
| Less than $300 | 5,559 (58.3%) | 139 (3.0%) |
| $300 to $499 | 553 (5.8%) | 579 (12.4%) |
| $500 to $799 | 1,057 (11.1%) | 1,057 (22.6%) |
| $800 to $999 | 983 (10.3%) | 108 (2.3%) |
| $1,000 to $1,499 | 946 (9.9%) | 75 (1.6%) |
| $1,500 to $1,999 | 227 (2.4%) | 97 (2.1%) |
| $2,000 to $2,499 | 111 (1.2%) | 9 (0.2%) |
| $2,500 to $2,999 | 76 (0.8%) | 20 (0.4%) |
| $3,000 or more | 18 (0.2%) | 0 (0.0%) |
| Total | 9,530 (100.0%) | 4,677 (100.0%) |
Physical Housing Characteristics in Cidra Municipio
Housing Structures in Cidra Municipio
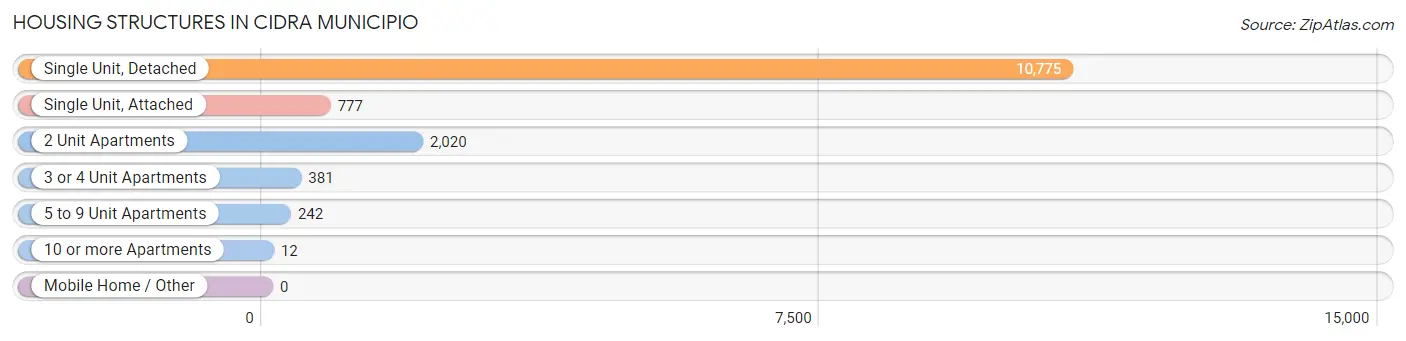
| Structure Type | # Housing Units | % Housing Units |
| Single Unit, Detached | 10,775 | 75.8% |
| Single Unit, Attached | 777 | 5.5% |
| 2 Unit Apartments | 2,020 | 14.2% |
| 3 or 4 Unit Apartments | 381 | 2.7% |
| 5 to 9 Unit Apartments | 242 | 1.7% |
| 10 or more Apartments | 12 | 0.1% |
| Mobile Home / Other | 0 | 0.0% |
| Total | 14,207 | 100.0% |
Housing Structures by Occupancy in Cidra Municipio
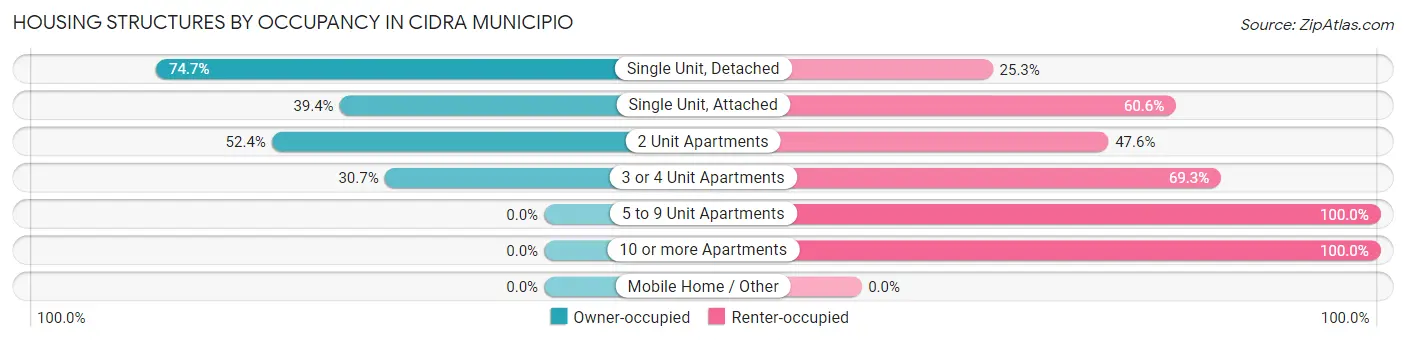
| Structure Type | Owner-occupied | Renter-occupied |
| Single Unit, Detached | 8,048 (74.7%) | 2,727 (25.3%) |
| Single Unit, Attached | 306 (39.4%) | 471 (60.6%) |
| 2 Unit Apartments | 1,059 (52.4%) | 961 (47.6%) |
| 3 or 4 Unit Apartments | 117 (30.7%) | 264 (69.3%) |
| 5 to 9 Unit Apartments | 0 (0.0%) | 242 (100.0%) |
| 10 or more Apartments | 0 (0.0%) | 12 (100.0%) |
| Mobile Home / Other | 0 (0.0%) | 0 (0.0%) |
| Total | 9,530 (67.1%) | 4,677 (32.9%) |
Housing Structures by Number of Rooms in Cidra Municipio
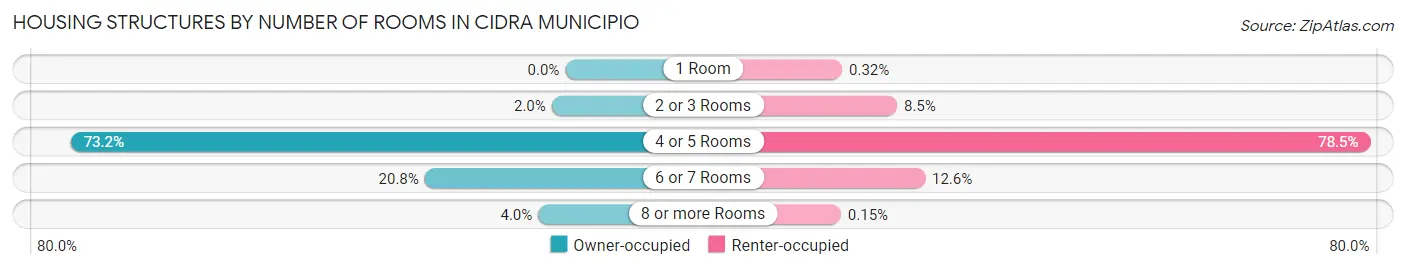
| Number of Rooms | Owner-occupied | Renter-occupied |
| 1 Room | 0 (0.0%) | 15 (0.3%) |
| 2 or 3 Rooms | 192 (2.0%) | 395 (8.5%) |
| 4 or 5 Rooms | 6,973 (73.2%) | 3,671 (78.5%) |
| 6 or 7 Rooms | 1,983 (20.8%) | 589 (12.6%) |
| 8 or more Rooms | 382 (4.0%) | 7 (0.2%) |
| Total | 9,530 (100.0%) | 4,677 (100.0%) |
Housing Structure by Heating Type in Cidra Municipio
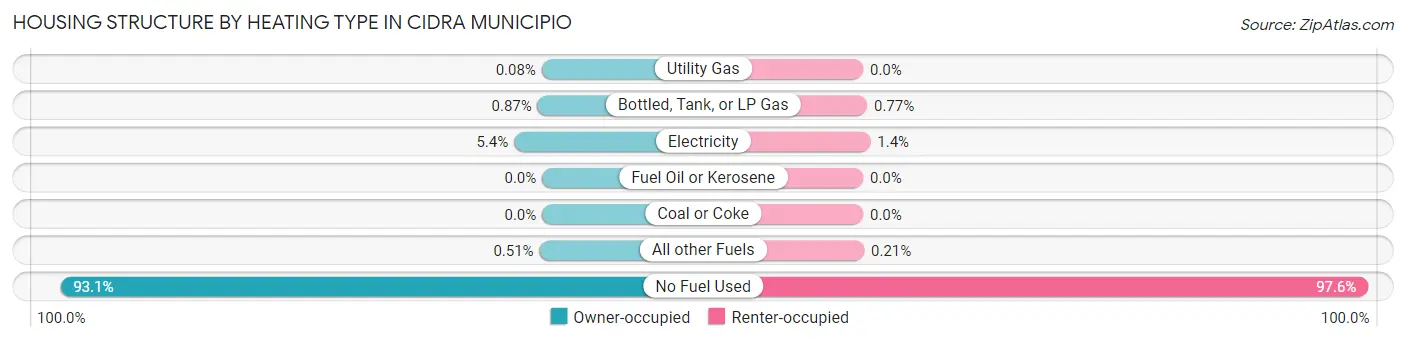
| Heating Type | Owner-occupied | Renter-occupied |
| Utility Gas | 8 (0.1%) | 0 (0.0%) |
| Bottled, Tank, or LP Gas | 83 (0.9%) | 36 (0.8%) |
| Electricity | 517 (5.4%) | 66 (1.4%) |
| Fuel Oil or Kerosene | 0 (0.0%) | 0 (0.0%) |
| Coal or Coke | 0 (0.0%) | 0 (0.0%) |
| All other Fuels | 49 (0.5%) | 10 (0.2%) |
| No Fuel Used | 8,873 (93.1%) | 4,565 (97.6%) |
| Total | 9,530 (100.0%) | 4,677 (100.0%) |
Household Vehicle Usage in Cidra Municipio
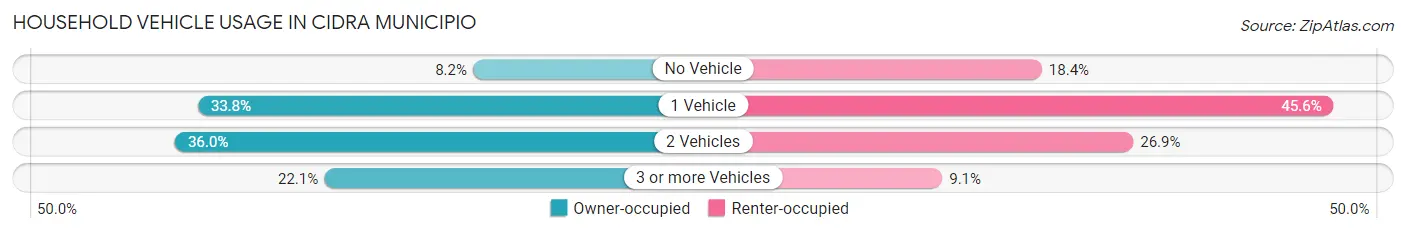
| Vehicles per Household | Owner-occupied | Renter-occupied |
| No Vehicle | 778 (8.2%) | 860 (18.4%) |
| 1 Vehicle | 3,224 (33.8%) | 2,133 (45.6%) |
| 2 Vehicles | 3,427 (36.0%) | 1,259 (26.9%) |
| 3 or more Vehicles | 2,101 (22.1%) | 425 (9.1%) |
| Total | 9,530 (100.0%) | 4,677 (100.0%) |
Real Estate & Mortgages in Cidra Municipio
Real Estate and Mortgage Overview in Cidra Municipio
| Characteristic | Without Mortgage | With Mortgage |
| Housing Units | 6,024 | 3,506 |
| Median Property Value | $121,600 | $151,500 |
| Median Household Income | $25,331 | $151 |
| Monthly Housing Costs | $148 | $18 |
| Real Estate Taxes | - | - |
Property Value by Mortgage Status in Cidra Municipio
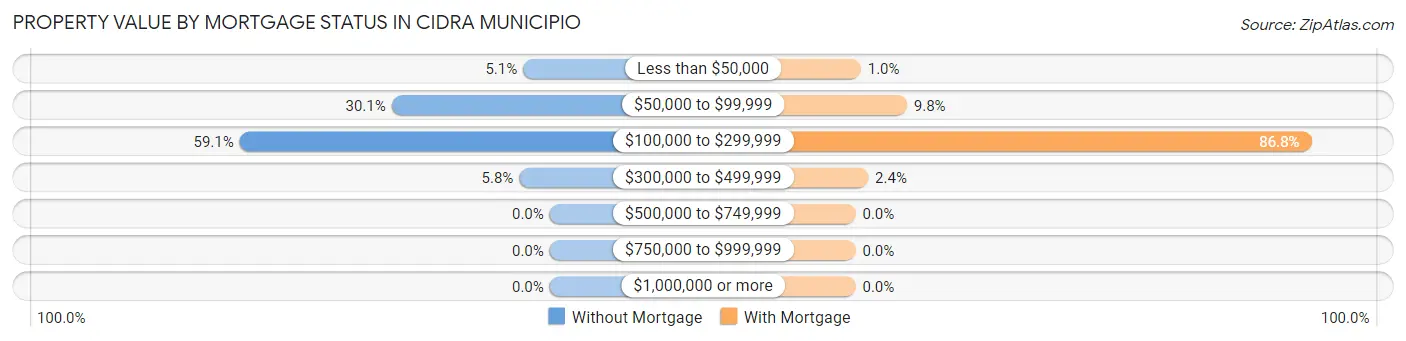
| Property Value | Without Mortgage | With Mortgage |
| Less than $50,000 | 304 (5.1%) | 35 (1.0%) |
| $50,000 to $99,999 | 1,813 (30.1%) | 343 (9.8%) |
| $100,000 to $299,999 | 3,558 (59.1%) | 3,044 (86.8%) |
| $300,000 to $499,999 | 349 (5.8%) | 84 (2.4%) |
| $500,000 to $749,999 | 0 (0.0%) | 0 (0.0%) |
| $750,000 to $999,999 | 0 (0.0%) | 0 (0.0%) |
| $1,000,000 or more | 0 (0.0%) | 0 (0.0%) |
| Total | 6,024 (100.0%) | 3,506 (100.0%) |
Household Income by Mortgage Status in Cidra Municipio
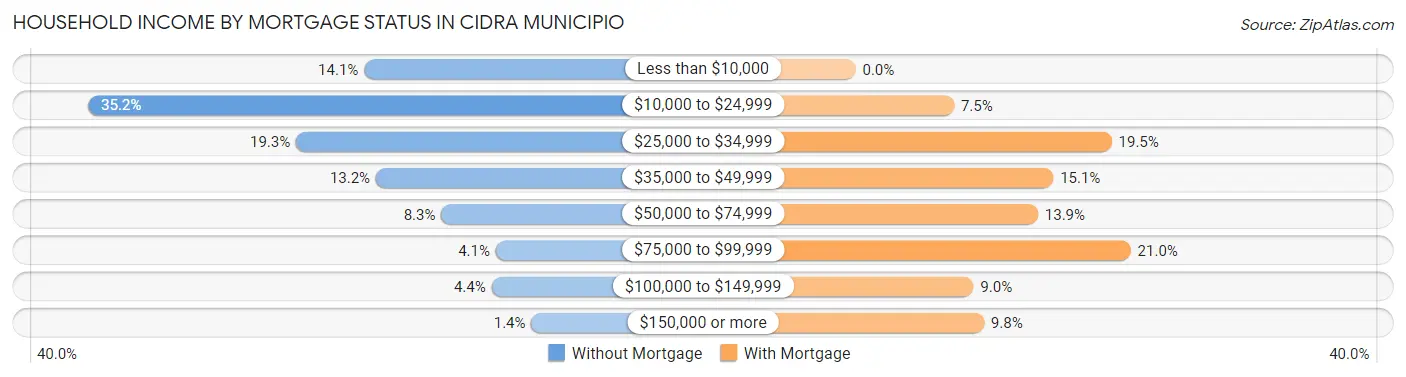
| Household Income | Without Mortgage | With Mortgage |
| Less than $10,000 | 851 (14.1%) | 0 (0.0%) |
| $10,000 to $24,999 | 2,118 (35.2%) | 263 (7.5%) |
| $25,000 to $34,999 | 1,164 (19.3%) | 684 (19.5%) |
| $35,000 to $49,999 | 797 (13.2%) | 528 (15.1%) |
| $50,000 to $74,999 | 497 (8.3%) | 487 (13.9%) |
| $75,000 to $99,999 | 247 (4.1%) | 735 (21.0%) |
| $100,000 to $149,999 | 266 (4.4%) | 315 (9.0%) |
| $150,000 or more | 84 (1.4%) | 343 (9.8%) |
| Total | 6,024 (100.0%) | 3,506 (100.0%) |
Property Value to Household Income Ratio in Cidra Municipio
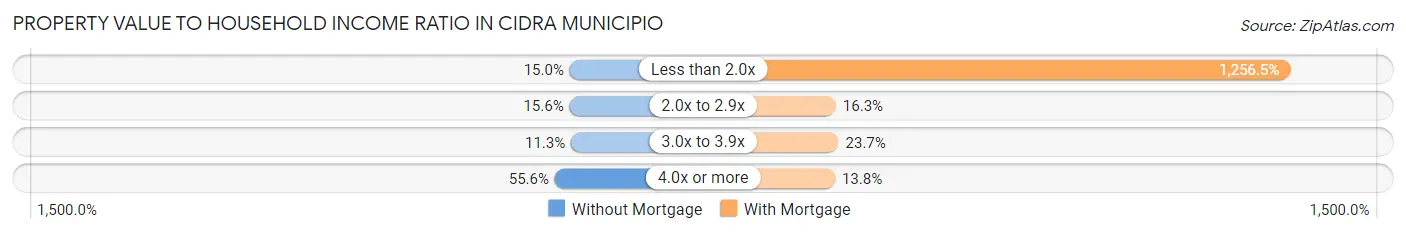
| Value-to-Income Ratio | Without Mortgage | With Mortgage |
| Less than 2.0x | 901 (15.0%) | 44,053 (1,256.5%) |
| 2.0x to 2.9x | 939 (15.6%) | 570 (16.3%) |
| 3.0x to 3.9x | 681 (11.3%) | 830 (23.7%) |
| 4.0x or more | 3,349 (55.6%) | 482 (13.8%) |
| Total | 6,024 (100.0%) | 3,506 (100.0%) |
Real Estate Taxes by Mortgage Status in Cidra Municipio
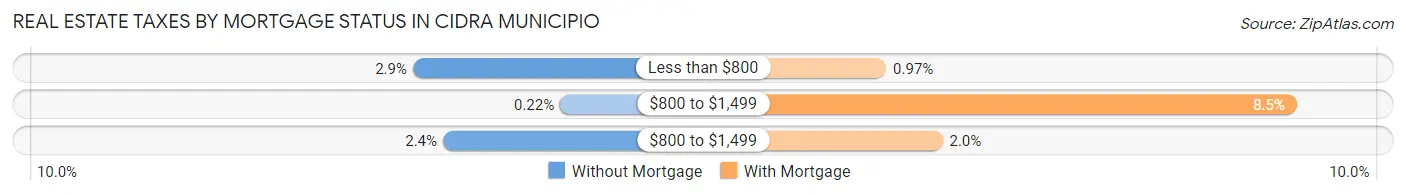
| Property Taxes | Without Mortgage | With Mortgage |
| Less than $800 | 175 (2.9%) | 34 (1.0%) |
| $800 to $1,499 | 13 (0.2%) | 297 (8.5%) |
| $800 to $1,499 | 142 (2.4%) | 70 (2.0%) |
| Total | 6,024 (100.0%) | 3,506 (100.0%) |
Health & Disability in Cidra Municipio
Health Insurance Coverage by Age in Cidra Municipio
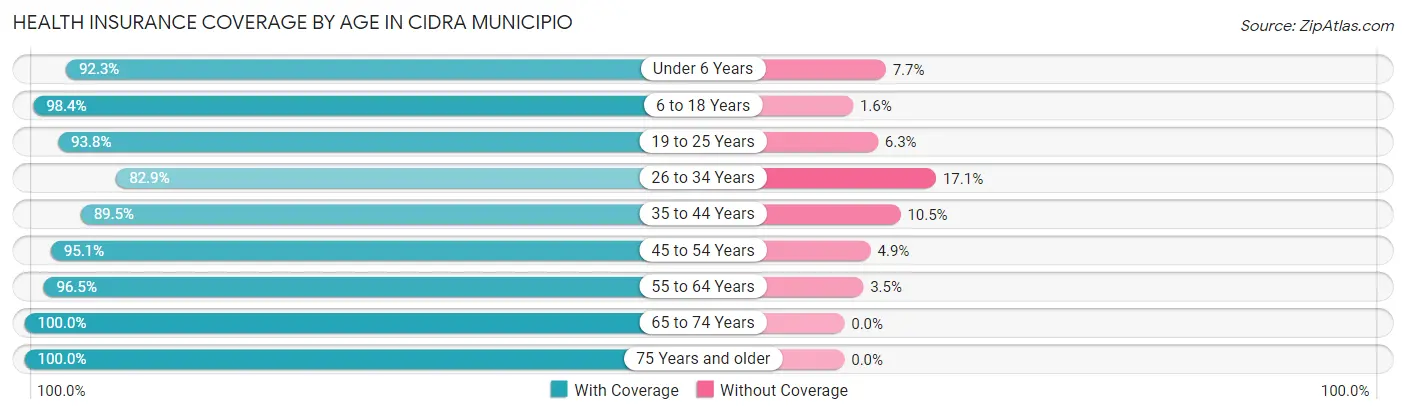
| Age Bracket | With Coverage | Without Coverage |
| Under 6 Years | 1,614 (92.3%) | 135 (7.7%) |
| 6 to 18 Years | 5,882 (98.4%) | 97 (1.6%) |
| 19 to 25 Years | 3,540 (93.8%) | 236 (6.2%) |
| 26 to 34 Years | 3,635 (82.9%) | 750 (17.1%) |
| 35 to 44 Years | 4,455 (89.5%) | 521 (10.5%) |
| 45 to 54 Years | 4,989 (95.1%) | 257 (4.9%) |
| 55 to 64 Years | 5,601 (96.5%) | 205 (3.5%) |
| 65 to 74 Years | 4,542 (100.0%) | 0 (0.0%) |
| 75 Years and older | 3,174 (100.0%) | 0 (0.0%) |
| Total | 37,432 (94.5%) | 2,201 (5.6%) |
Health Insurance Coverage by Citizenship Status in Cidra Municipio
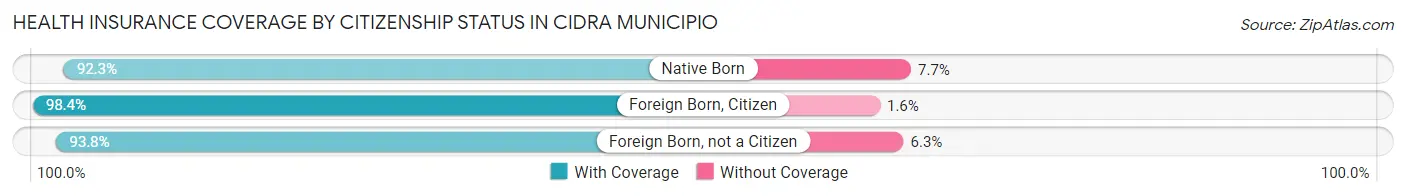
| Citizenship Status | With Coverage | Without Coverage |
| Native Born | 1,614 (92.3%) | 135 (7.7%) |
| Foreign Born, Citizen | 5,882 (98.4%) | 97 (1.6%) |
| Foreign Born, not a Citizen | 3,540 (93.8%) | 236 (6.2%) |
Health Insurance Coverage by Household Income in Cidra Municipio
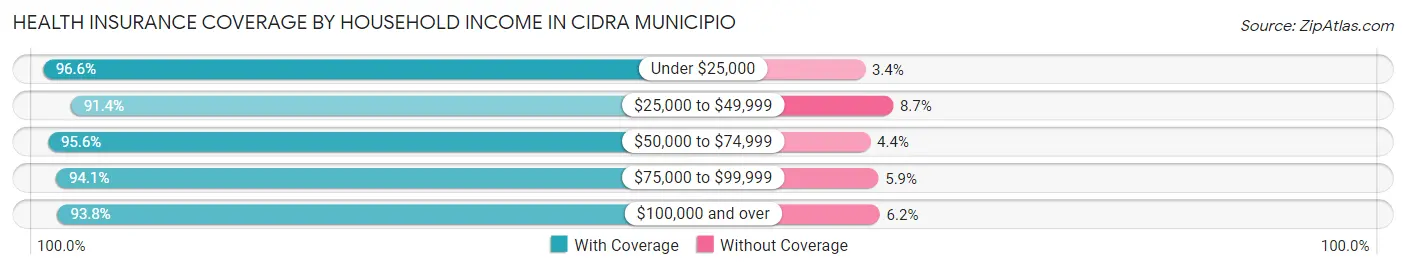
| Household Income | With Coverage | Without Coverage |
| Under $25,000 | 15,133 (96.6%) | 533 (3.4%) |
| $25,000 to $49,999 | 11,232 (91.3%) | 1,063 (8.6%) |
| $50,000 to $74,999 | 5,528 (95.6%) | 253 (4.4%) |
| $75,000 to $99,999 | 2,123 (94.1%) | 133 (5.9%) |
| $100,000 and over | 3,335 (93.8%) | 219 (6.2%) |
Public vs Private Health Insurance Coverage by Age in Cidra Municipio
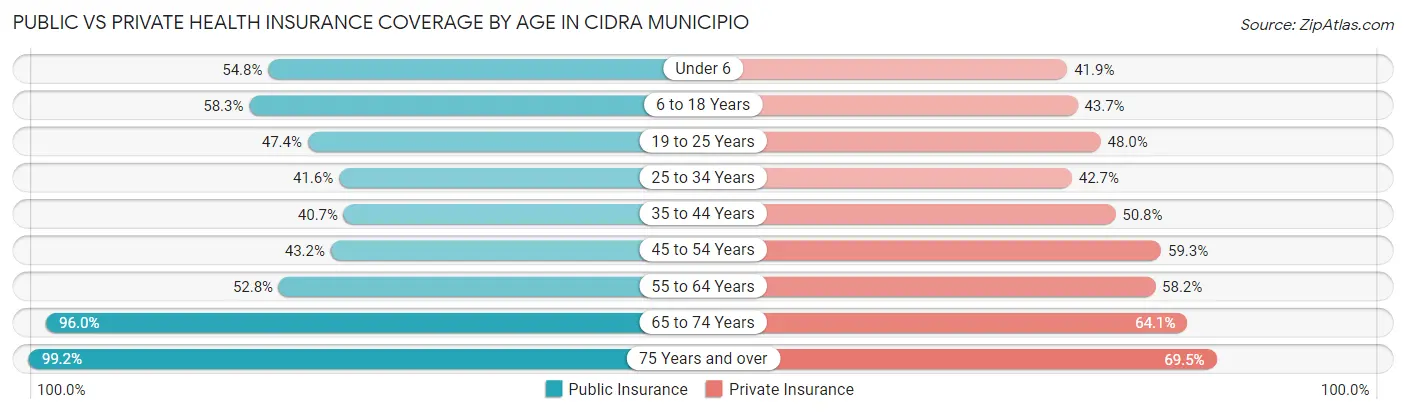
| Age Bracket | Public Insurance | Private Insurance |
| Under 6 | 958 (54.8%) | 732 (41.8%) |
| 6 to 18 Years | 3,486 (58.3%) | 2,615 (43.7%) |
| 19 to 25 Years | 1,791 (47.4%) | 1,814 (48.0%) |
| 25 to 34 Years | 1,826 (41.6%) | 1,872 (42.7%) |
| 35 to 44 Years | 2,027 (40.7%) | 2,527 (50.8%) |
| 45 to 54 Years | 2,264 (43.2%) | 3,109 (59.3%) |
| 55 to 64 Years | 3,065 (52.8%) | 3,376 (58.2%) |
| 65 to 74 Years | 4,360 (96.0%) | 2,913 (64.1%) |
| 75 Years and over | 3,149 (99.2%) | 2,207 (69.5%) |
| Total | 22,926 (57.9%) | 21,165 (53.4%) |
Disability Status by Sex by Age in Cidra Municipio
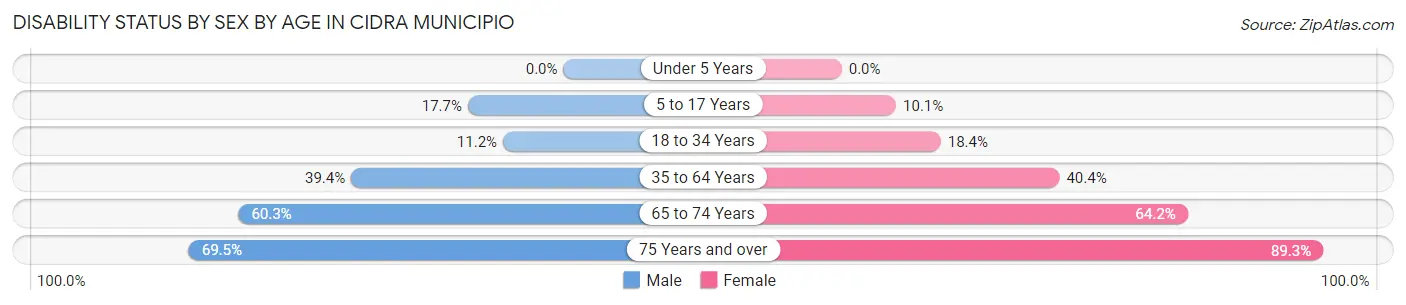
| Age Bracket | Male | Female |
| Under 5 Years | 0 (0.0%) | 0 (0.0%) |
| 5 to 17 Years | 516 (17.7%) | 287 (10.1%) |
| 18 to 34 Years | 485 (11.2%) | 801 (18.4%) |
| 35 to 64 Years | 2,975 (39.4%) | 3,427 (40.4%) |
| 65 to 74 Years | 1,311 (60.3%) | 1,520 (64.2%) |
| 75 Years and over | 937 (69.5%) | 1,631 (89.3%) |
Disability Class by Sex by Age in Cidra Municipio
Disability Class: Hearing Difficulty
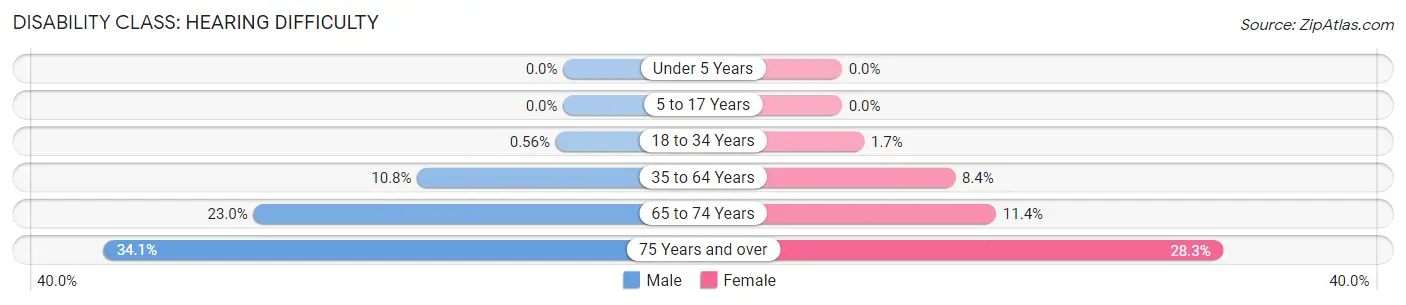
| Age Bracket | Male | Female |
| Under 5 Years | 0 (0.0%) | 0 (0.0%) |
| 5 to 17 Years | 0 (0.0%) | 0 (0.0%) |
| 18 to 34 Years | 24 (0.6%) | 72 (1.7%) |
| 35 to 64 Years | 818 (10.8%) | 712 (8.4%) |
| 65 to 74 Years | 500 (23.0%) | 271 (11.4%) |
| 75 Years and over | 460 (34.1%) | 516 (28.3%) |
Disability Class: Vision Difficulty
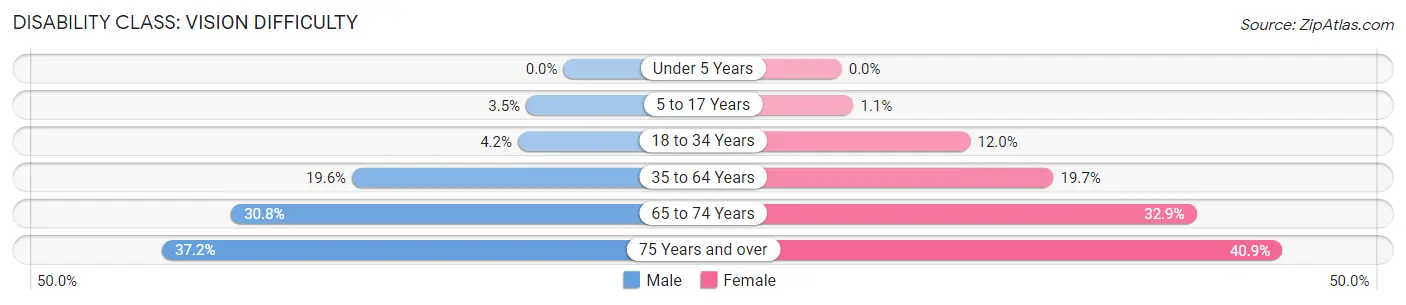
| Age Bracket | Male | Female |
| Under 5 Years | 0 (0.0%) | 0 (0.0%) |
| 5 to 17 Years | 101 (3.5%) | 31 (1.1%) |
| 18 to 34 Years | 183 (4.2%) | 521 (11.9%) |
| 35 to 64 Years | 1,481 (19.6%) | 1,667 (19.7%) |
| 65 to 74 Years | 670 (30.8%) | 779 (32.9%) |
| 75 Years and over | 502 (37.2%) | 746 (40.8%) |
Disability Class: Cognitive Difficulty
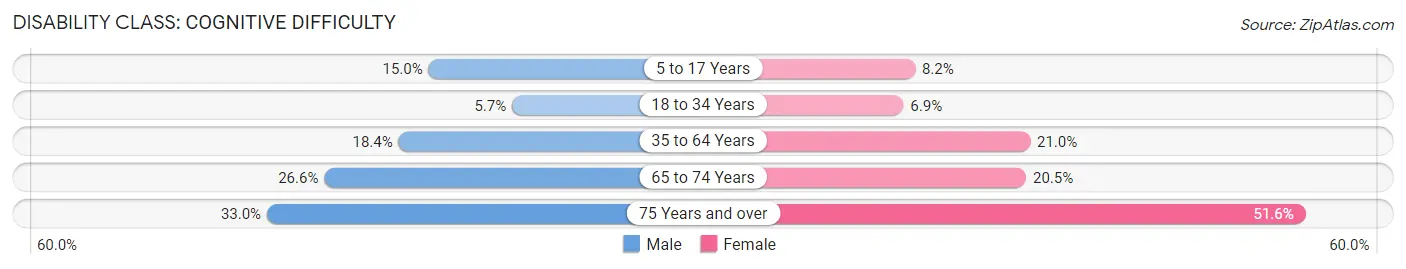
| Age Bracket | Male | Female |
| 5 to 17 Years | 437 (15.0%) | 232 (8.2%) |
| 18 to 34 Years | 247 (5.7%) | 299 (6.9%) |
| 35 to 64 Years | 1,385 (18.3%) | 1,777 (21.0%) |
| 65 to 74 Years | 579 (26.6%) | 486 (20.5%) |
| 75 Years and over | 445 (33.0%) | 943 (51.6%) |
Disability Class: Ambulatory Difficulty
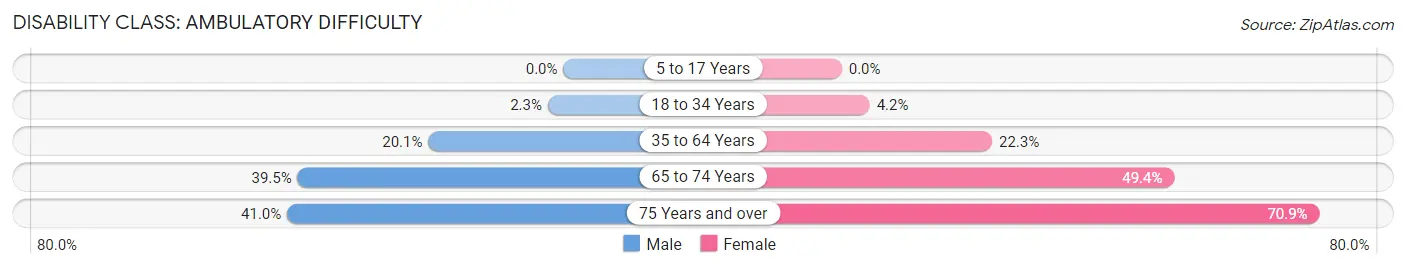
| Age Bracket | Male | Female |
| 5 to 17 Years | 0 (0.0%) | 0 (0.0%) |
| 18 to 34 Years | 100 (2.3%) | 181 (4.2%) |
| 35 to 64 Years | 1,513 (20.1%) | 1,892 (22.3%) |
| 65 to 74 Years | 858 (39.5%) | 1,169 (49.4%) |
| 75 Years and over | 553 (41.0%) | 1,295 (70.9%) |
Disability Class: Self-Care Difficulty
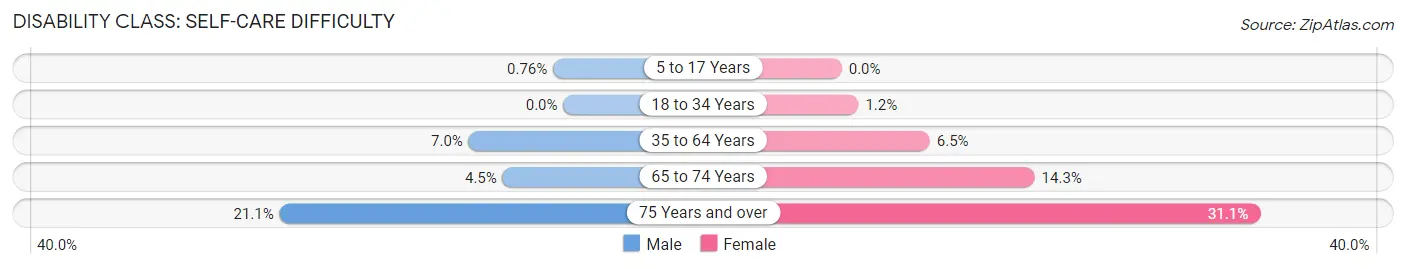
| Age Bracket | Male | Female |
| 5 to 17 Years | 22 (0.8%) | 0 (0.0%) |
| 18 to 34 Years | 0 (0.0%) | 54 (1.2%) |
| 35 to 64 Years | 531 (7.0%) | 555 (6.5%) |
| 65 to 74 Years | 98 (4.5%) | 339 (14.3%) |
| 75 Years and over | 284 (21.1%) | 567 (31.0%) |
Technology Access in Cidra Municipio
Computing Device Access in Cidra Municipio
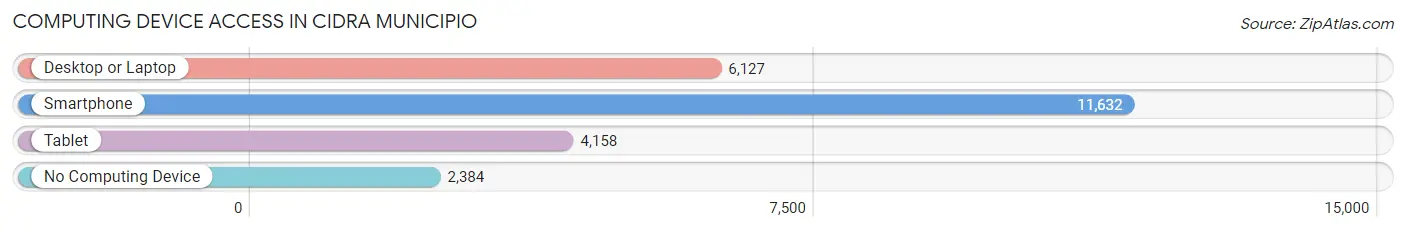
| Device Type | # Households | % Households |
| Desktop or Laptop | 6,127 | 43.1% |
| Smartphone | 11,632 | 81.9% |
| Tablet | 4,158 | 29.3% |
| No Computing Device | 2,384 | 16.8% |
| Total | 14,207 | 100.0% |
Internet Access in Cidra Municipio
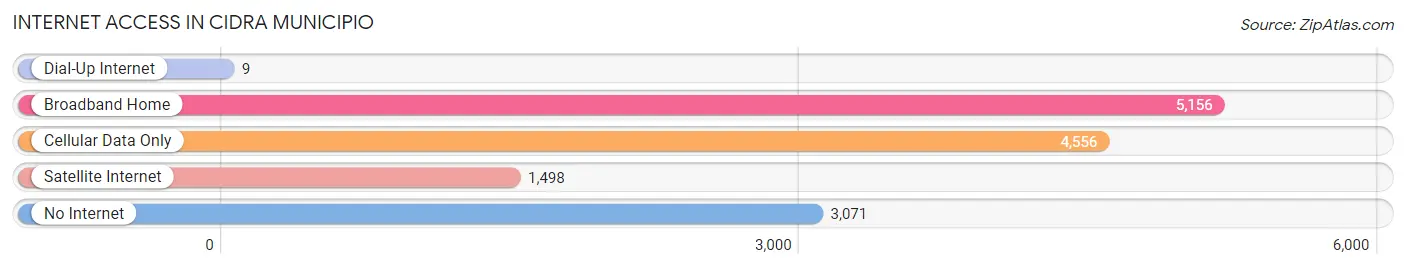
| Internet Type | # Households | % Households |
| Dial-Up Internet | 9 | 0.1% |
| Broadband Home | 5,156 | 36.3% |
| Cellular Data Only | 4,556 | 32.1% |
| Satellite Internet | 1,498 | 10.5% |
| No Internet | 3,071 | 21.6% |
| Total | 14,207 | 100.0% |
Cidra Municipio Summary
Cidra Municipio is a municipality located in the central region of Puerto Rico. It is part of the San Juan-Caguas-Guaynabo Metropolitan Statistical Area. The municipality is located in the northern part of the island, and is bordered by the municipalities of Aguas Buenas, Comerío, Cayey, and Caguas. As of the 2010 census, the population of Cidra was 33,069.
Geography
Cidra Municipio is located in the central region of Puerto Rico, in the northern part of the island. It is bordered by the municipalities of Aguas Buenas, Comerío, Cayey, and Caguas. The municipality covers an area of approximately 39.7 square miles, and is located at an elevation of 1,000 feet above sea level. The terrain is mostly hilly, with some flat areas in the lower elevations. The climate is tropical, with temperatures ranging from the mid-70s to the mid-80s.
History
The area that is now Cidra Municipio was originally inhabited by the Taíno people. The first Spanish settlers arrived in the area in the early 16th century, and the town of Cidra was founded in 1795. The town was named after the cidra tree, which is native to the area.
In the 19th century, the town became an important agricultural center, producing coffee, sugar cane, and tobacco. The town was also known for its production of leather goods, and for its pottery.
In the early 20th century, the town experienced a period of economic growth, as the local economy shifted from agriculture to manufacturing. The town was home to several factories, including a sugar mill, a textile mill, and a shoe factory.
Economy
Cidra Municipio has a diversified economy, with a mix of agriculture, manufacturing, and services. The agricultural sector is the largest employer in the municipality, with the production of coffee, sugar cane, and tobacco being the main sources of income. The manufacturing sector is also important, with the production of leather goods, pottery, and textiles being the main sources of income. The service sector is also important, with tourism, retail, and banking being the main sources of income.
Demographics
As of the 2010 census, the population of Cidra Municipio was 33,069. The population is predominantly of Hispanic origin, with the majority of the population being of Puerto Rican descent. The median age of the population is 38.7 years, and the median household income is $20,845. The unemployment rate is 11.2%, and the poverty rate is 28.3%.
Conclusion
Cidra Municipio is a municipality located in the central region of Puerto Rico. It is bordered by the municipalities of Aguas Buenas, Comerío, Cayey, and Caguas. The municipality has a diversified economy, with a mix of agriculture, manufacturing, and services. The population of Cidra Municipio is predominantly of Hispanic origin, with the majority of the population being of Puerto Rican descent. The median age of the population is 38.7 years, and the median household income is $20,845. The unemployment rate is 11.2%, and the poverty rate is 28.3%.
Common Questions
What is Per Capita Income in Cidra Municipio?
Per Capita income in Cidra Municipio is $14,451.
What is the Median Family Income in Cidra Municipio?
Median Family Income in Cidra Municipio is $29,577.
What is the Median Household income in Cidra Municipio?
Median Household Income in Cidra Municipio is $25,580.
What is Income or Wage Gap in Cidra Municipio?
Income or Wage Gap in Cidra Municipio is 9.9%.
Women in Cidra Municipio earn 90.1 cents for every dollar earned by a man.
What is Family Income Deficit in Cidra Municipio?
Family Income Deficit in Cidra Municipio is $11,083.
Families that are below poverty line in Cidra Municipio earn $11,083 less on average than the poverty threshold level.
What is Inequality or Gini Index in Cidra Municipio?
Inequality or Gini Index in Cidra Municipio is 0.49.
What is the Total Population of Cidra Municipio?
Total Population of Cidra Municipio is 39,831.
What is the Total Male Population of Cidra Municipio?
Total Male Population of Cidra Municipio is 19,204.
What is the Total Female Population of Cidra Municipio?
Total Female Population of Cidra Municipio is 20,627.
What is the Ratio of Males per 100 Females in Cidra Municipio?
There are 93.10 Males per 100 Females in Cidra Municipio.
What is the Ratio of Females per 100 Males in Cidra Municipio?
There are 107.41 Females per 100 Males in Cidra Municipio.
What is the Median Population Age in Cidra Municipio?
Median Population Age in Cidra Municipio is 42.9 Years.
What is the Average Family Size in Cidra Municipio
Average Family Size in Cidra Municipio is 3.4 People.
What is the Average Household Size in Cidra Municipio
Average Household Size in Cidra Municipio is 2.8 People.
How Large is the Labor Force in Cidra Municipio?
There are 13,803 People in the Labor Forcein in Cidra Municipio.
What is the Percentage of People in the Labor Force in Cidra Municipio?
41.1% of People are in the Labor Force in Cidra Municipio.
What is the Unemployment Rate in Cidra Municipio?
Unemployment Rate in Cidra Municipio is 6.3%.