Ceiba Municipio, PR Map & Demographics
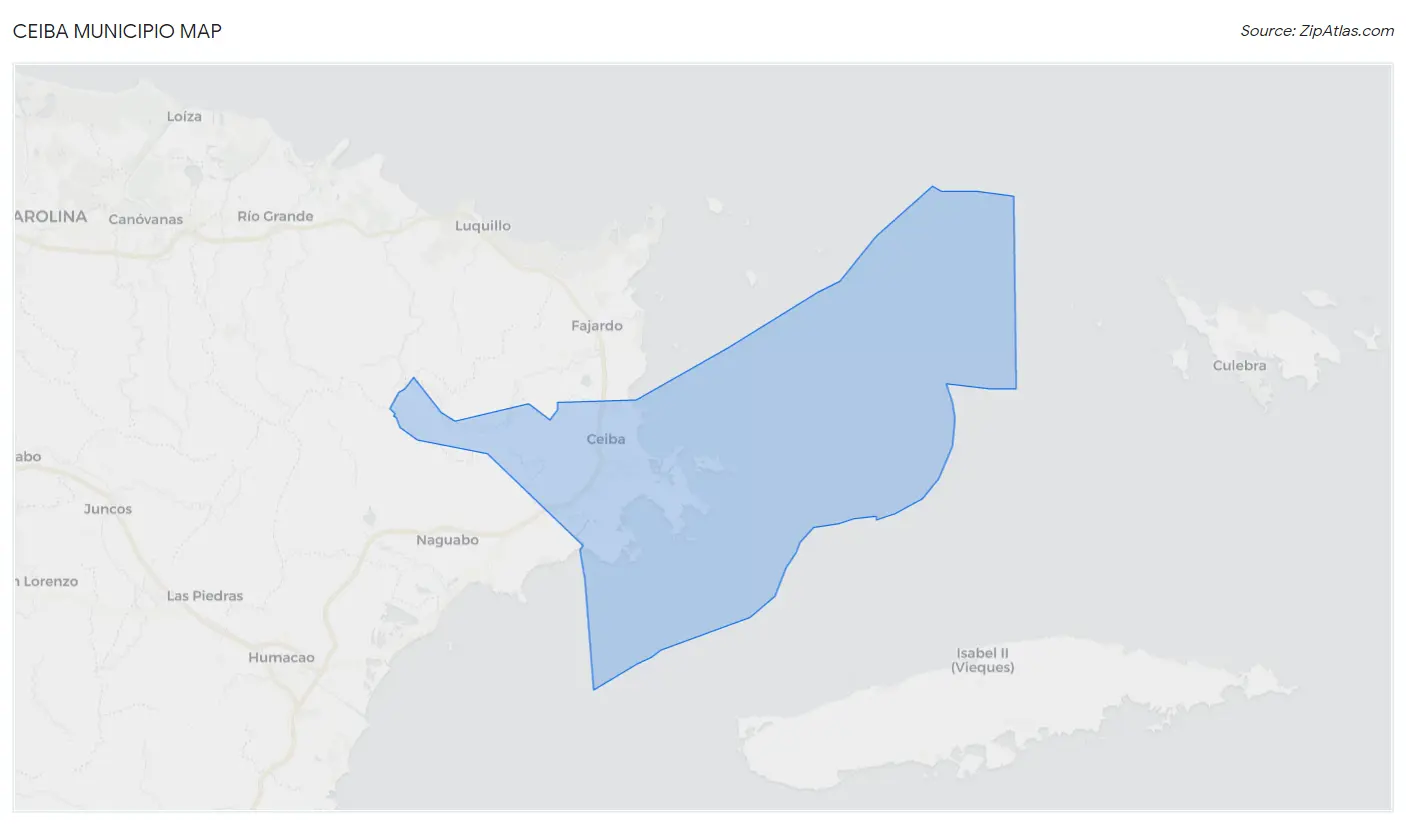
Ceiba Municipio Map
Ceiba Municipio Overview
$14,198
PER CAPITA INCOME
$28,013
AVG FAMILY INCOME
$22,945
AVG HOUSEHOLD INCOME
7.4%
WAGE / INCOME GAP [ % ]
92.6¢/ $1
WAGE / INCOME GAP [ $ ]
$8,879
FAMILY INCOME DEFICIT
0.45
INEQUALITY / GINI INDEX
11,256
TOTAL POPULATION
5,336
MALE POPULATION
5,920
FEMALE POPULATION
90.14
MALES / 100 FEMALES
110.94
FEMALES / 100 MALES
45.6
MEDIAN AGE
3.2
AVG FAMILY SIZE
2.6
AVG HOUSEHOLD SIZE
4,137
LABOR FORCE [ PEOPLE ]
43.1%
PERCENT IN LABOR FORCE
11.2%
UNEMPLOYMENT RATE
Ceiba Municipio Area Codes
Income in Ceiba Municipio
Income Overview in Ceiba Municipio
Per Capita Income in Ceiba Municipio is $14,198, while median incomes of families and households are $28,013 and $22,945 respectively.
| Characteristic | Number | Measure |
| Per Capita Income | 11,256 | $14,198 |
| Median Family Income | 2,830 | $28,013 |
| Mean Family Income | 2,830 | $38,395 |
| Median Household Income | 4,238 | $22,945 |
| Mean Household Income | 4,238 | $33,516 |
| Income Deficit | 2,830 | $8,879 |
| Wage / Income Gap (%) | 11,256 | 7.44% |
| Wage / Income Gap ($) | 11,256 | 92.56¢ per $1 |
| Gini / Inequality Index | 11,256 | 0.45 |
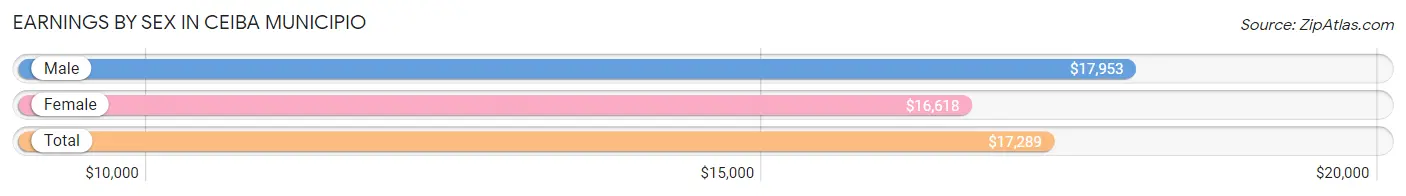
Earnings by Sex in Ceiba Municipio
Average Earnings in Ceiba Municipio are $17,289, $17,953 for men and $16,618 for women, a difference of 7.4%.
| Sex | Number | Average Earnings |
| Male | 2,251 (55.1%) | $17,953 |
| Female | 1,833 (44.9%) | $16,618 |
| Total | 4,084 (100.0%) | $17,289 |
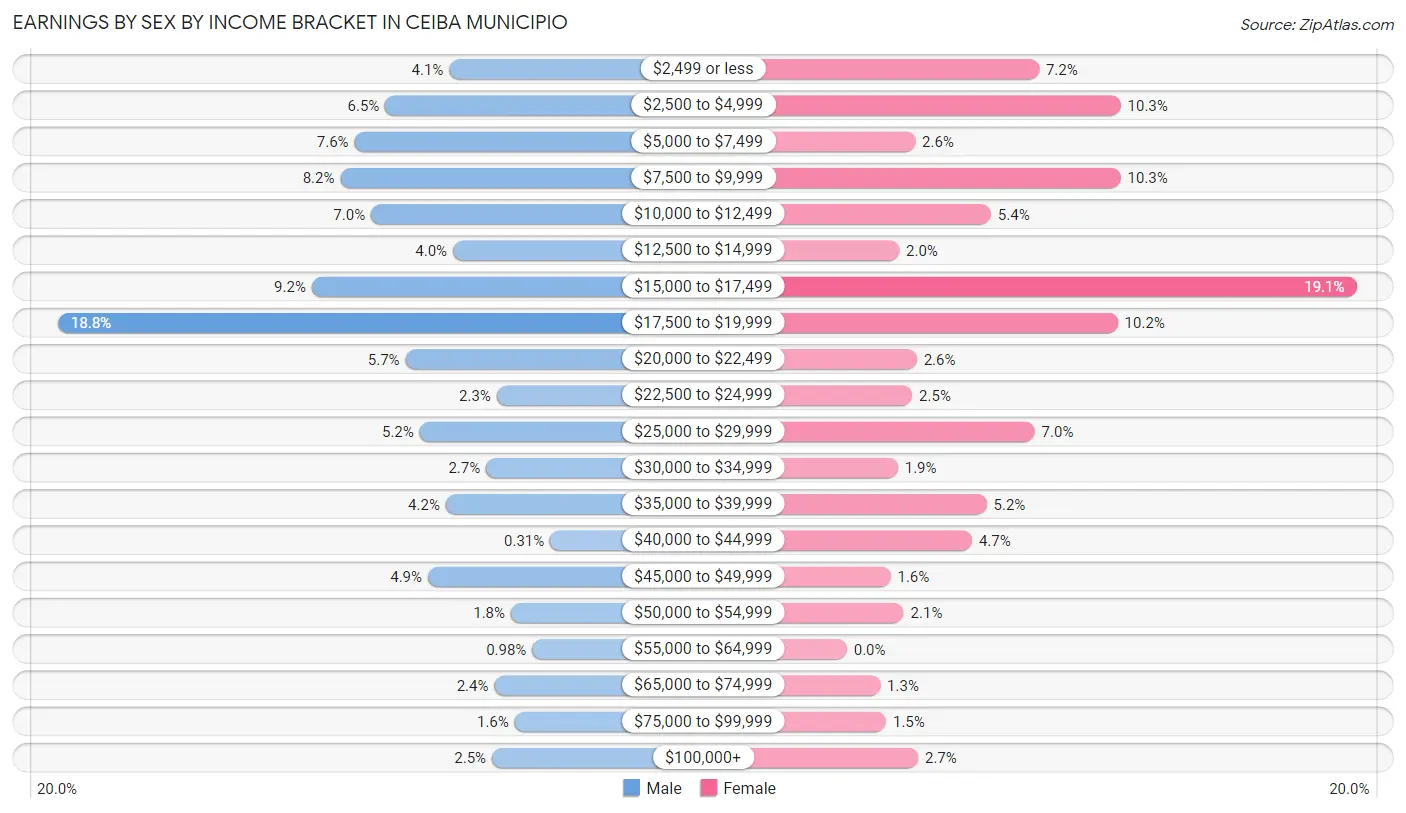
Earnings by Sex by Income Bracket in Ceiba Municipio
The most common earnings brackets in Ceiba Municipio are $17,500 to $19,999 for men (422 | 18.8%) and $15,000 to $17,499 for women (350 | 19.1%).
| Income | Male | Female |
| $2,499 or less | 92 (4.1%) | 132 (7.2%) |
| $2,500 to $4,999 | 146 (6.5%) | 188 (10.3%) |
| $5,000 to $7,499 | 172 (7.6%) | 47 (2.6%) |
| $7,500 to $9,999 | 184 (8.2%) | 188 (10.3%) |
| $10,000 to $12,499 | 158 (7.0%) | 99 (5.4%) |
| $12,500 to $14,999 | 89 (4.0%) | 36 (2.0%) |
| $15,000 to $17,499 | 208 (9.2%) | 350 (19.1%) |
| $17,500 to $19,999 | 422 (18.8%) | 186 (10.2%) |
| $20,000 to $22,499 | 129 (5.7%) | 48 (2.6%) |
| $22,500 to $24,999 | 52 (2.3%) | 45 (2.5%) |
| $25,000 to $29,999 | 117 (5.2%) | 129 (7.0%) |
| $30,000 to $34,999 | 61 (2.7%) | 35 (1.9%) |
| $35,000 to $39,999 | 95 (4.2%) | 96 (5.2%) |
| $40,000 to $44,999 | 7 (0.3%) | 86 (4.7%) |
| $45,000 to $49,999 | 110 (4.9%) | 30 (1.6%) |
| $50,000 to $54,999 | 40 (1.8%) | 39 (2.1%) |
| $55,000 to $64,999 | 22 (1.0%) | 0 (0.0%) |
| $65,000 to $74,999 | 54 (2.4%) | 23 (1.3%) |
| $75,000 to $99,999 | 37 (1.6%) | 27 (1.5%) |
| $100,000+ | 56 (2.5%) | 49 (2.7%) |
| Total | 2,251 (100.0%) | 1,833 (100.0%) |
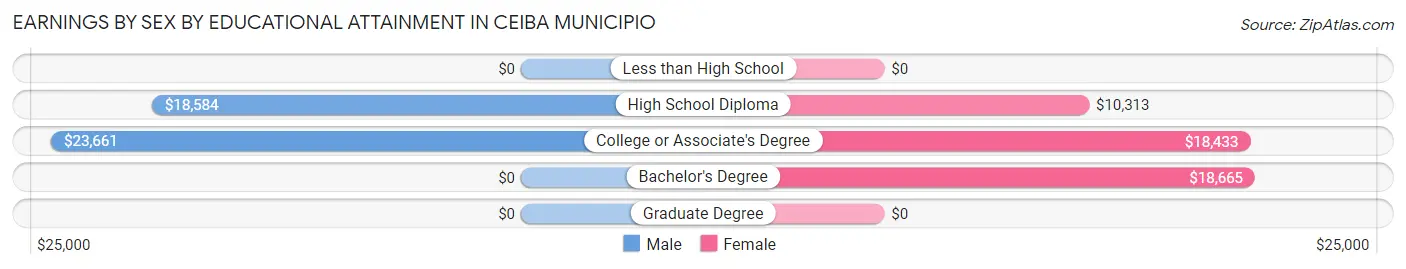
Earnings by Sex by Educational Attainment in Ceiba Municipio
Average earnings in Ceiba Municipio are $18,568 for men and $16,929 for women, a difference of 8.8%. Men with an educational attainment of college or associate's degree enjoy the highest average annual earnings of $23,661, while those with high school diploma education earn the least with $18,584. Women with an educational attainment of bachelor's degree earn the most with the average annual earnings of $18,665, while those with high school diploma education have the smallest earnings of $10,313.
| Educational Attainment | Male Income | Female Income |
| Less than High School | - | - |
| High School Diploma | $18,584 | $10,313 |
| College or Associate's Degree | $23,661 | $18,433 |
| Bachelor's Degree | - | - |
| Graduate Degree | - | - |
| Total | $18,568 | $16,929 |
Family Income in Ceiba Municipio
Family Income Brackets in Ceiba Municipio
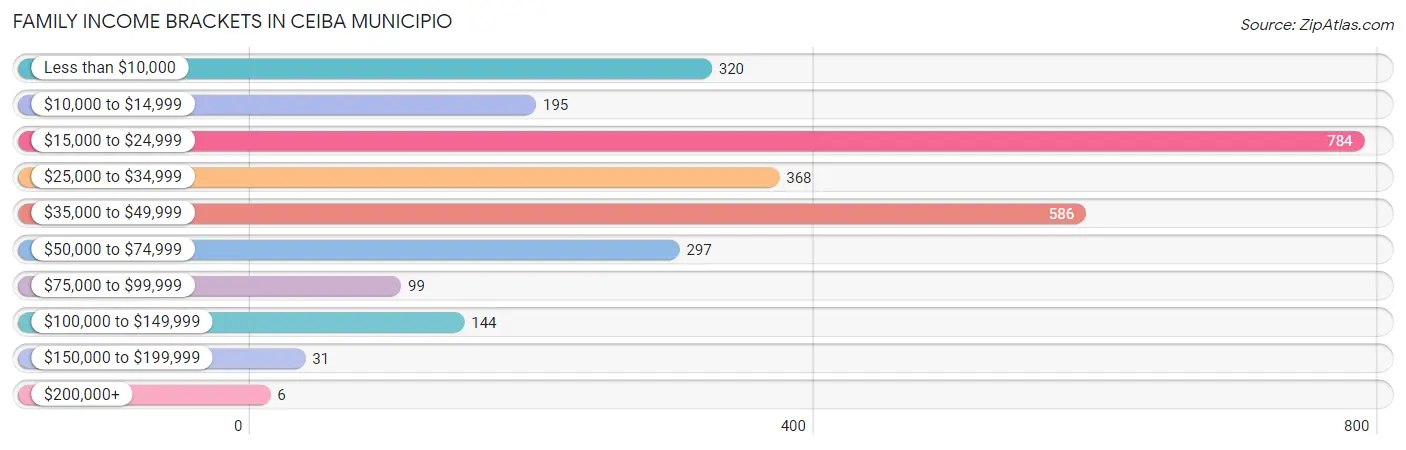
According to the Ceiba Municipio family income data, there are 784 families falling into the $15,000 to $24,999 income range, which is the most common income bracket and makes up 27.7% of all families. Conversely, the $200,000+ income bracket is the least frequent group with only 6 families (0.2%) belonging to this category.
| Income Bracket | # Families | % Families |
| Less than $10,000 | 320 | 11.3% |
| $10,000 to $14,999 | 195 | 6.9% |
| $15,000 to $24,999 | 784 | 27.7% |
| $25,000 to $34,999 | 368 | 13.0% |
| $35,000 to $49,999 | 586 | 20.7% |
| $50,000 to $74,999 | 297 | 10.5% |
| $75,000 to $99,999 | 99 | 3.5% |
| $100,000 to $149,999 | 144 | 5.1% |
| $150,000 to $199,999 | 31 | 1.1% |
| $200,000+ | 6 | 0.2% |
Family Income by Famaliy Size in Ceiba Municipio
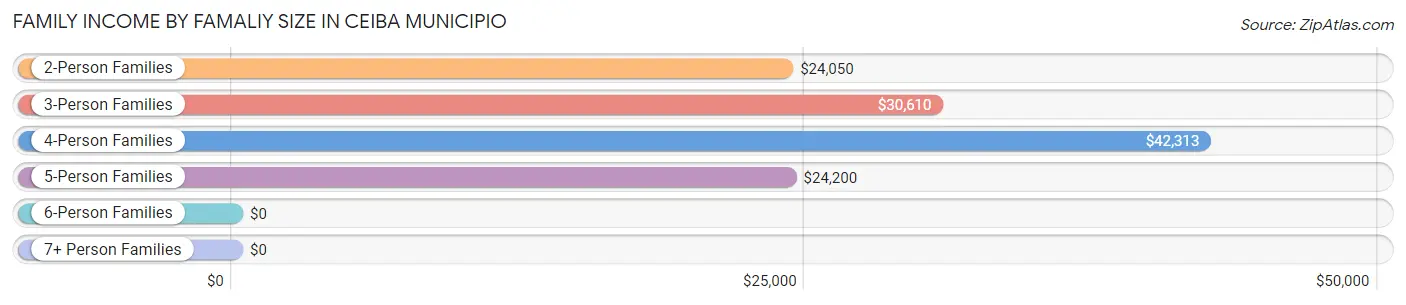
4-person families (445 | 15.7%) account for the highest median family income in Ceiba Municipio with $42,313 per family, while 2-person families (1,290 | 45.6%) have the highest median income of $12,025 per family member.
| Income Bracket | # Families | Median Income |
| 2-Person Families | 1,290 (45.6%) | $24,050 |
| 3-Person Families | 987 (34.9%) | $30,610 |
| 4-Person Families | 445 (15.7%) | $42,313 |
| 5-Person Families | 108 (3.8%) | $24,200 |
| 6-Person Families | 0 (0.0%) | $0 |
| 7+ Person Families | 0 (0.0%) | $0 |
| Total | 2,830 (100.0%) | $28,013 |
Family Income by Number of Earners in Ceiba Municipio
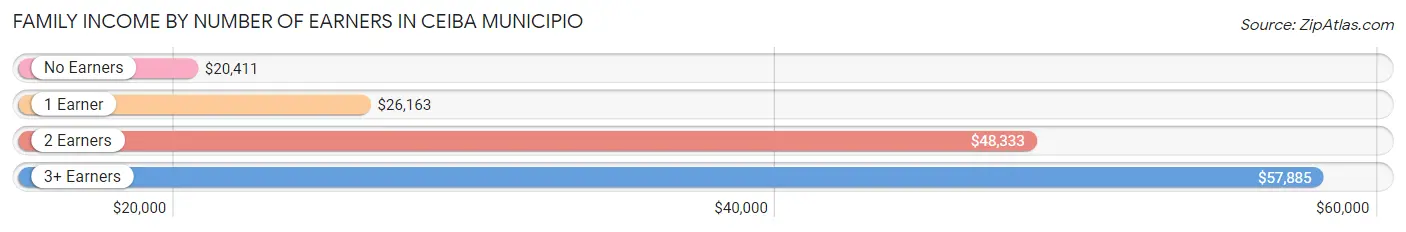
The median family income in Ceiba Municipio is $28,013, with families comprising 3+ earners (104) having the highest median family income of $57,885, while families with no earners (906) have the lowest median family income of $20,411, accounting for 3.7% and 32.0% of families, respectively.
| Number of Earners | # Families | Median Income |
| No Earners | 906 (32.0%) | $20,411 |
| 1 Earner | 1,262 (44.6%) | $26,163 |
| 2 Earners | 558 (19.7%) | $48,333 |
| 3+ Earners | 104 (3.7%) | $57,885 |
| Total | 2,830 (100.0%) | $28,013 |
Household Income in Ceiba Municipio
Household Income Brackets in Ceiba Municipio
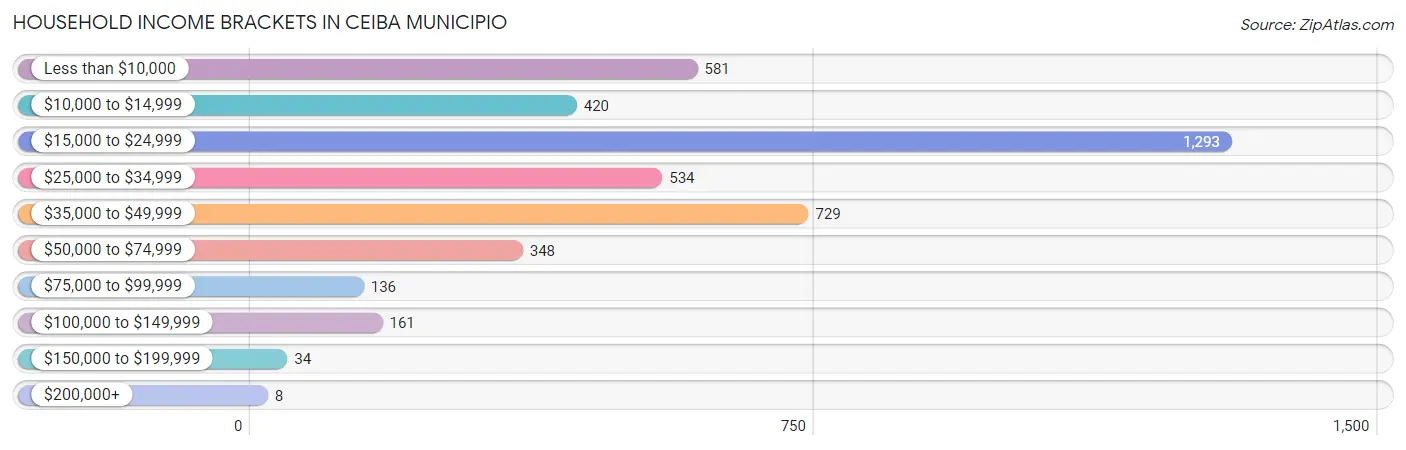
With 1,293 households falling in the category, the $15,000 to $24,999 income range is the most frequent in Ceiba Municipio, accounting for 30.5% of all households. In contrast, only 8 households (0.2%) fall into the $200,000+ income bracket, making it the least populous group.
| Income Bracket | # Households | % Households |
| Less than $10,000 | 581 | 13.7% |
| $10,000 to $14,999 | 420 | 9.9% |
| $15,000 to $24,999 | 1,293 | 30.5% |
| $25,000 to $34,999 | 534 | 12.6% |
| $35,000 to $49,999 | 729 | 17.2% |
| $50,000 to $74,999 | 348 | 8.2% |
| $75,000 to $99,999 | 136 | 3.2% |
| $100,000 to $149,999 | 161 | 3.8% |
| $150,000 to $199,999 | 34 | 0.8% |
| $200,000+ | 8 | 0.2% |
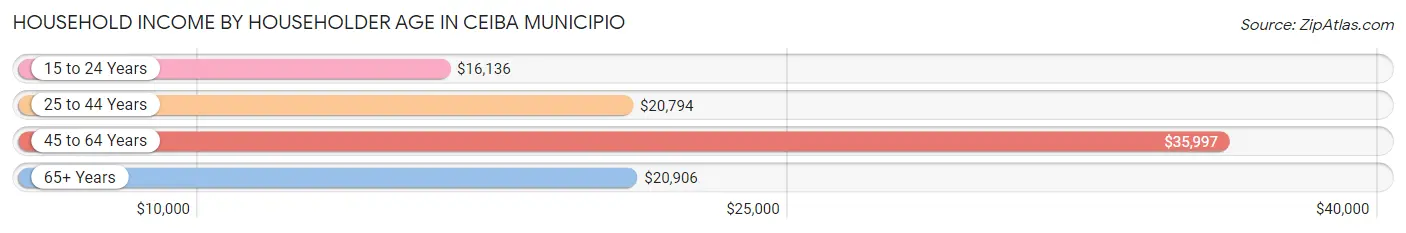
Household Income by Householder Age in Ceiba Municipio
The median household income in Ceiba Municipio is $22,945, with the highest median household income of $35,997 found in the 45 to 64 years age bracket for the primary householder. A total of 1,361 households (32.1%) fall into this category. Meanwhile, the 15 to 24 years age bracket for the primary householder has the lowest median household income of $16,136, with 30 households (0.7%) in this group.
| Income Bracket | # Households | Median Income |
| 15 to 24 Years | 30 (0.7%) | $16,136 |
| 25 to 44 Years | 999 (23.6%) | $20,794 |
| 45 to 64 Years | 1,361 (32.1%) | $35,997 |
| 65+ Years | 1,848 (43.6%) | $20,906 |
| Total | 4,238 (100.0%) | $22,945 |
Poverty in Ceiba Municipio
Income Below Poverty by Sex and Age in Ceiba Municipio
With 41.1% poverty level for males and 42.4% for females among the residents of Ceiba Municipio, 5 year old males and 5 year old females are the most vulnerable to poverty, with 81 males (100.0%) and 32 females (100.0%) in their respective age groups living below the poverty level.
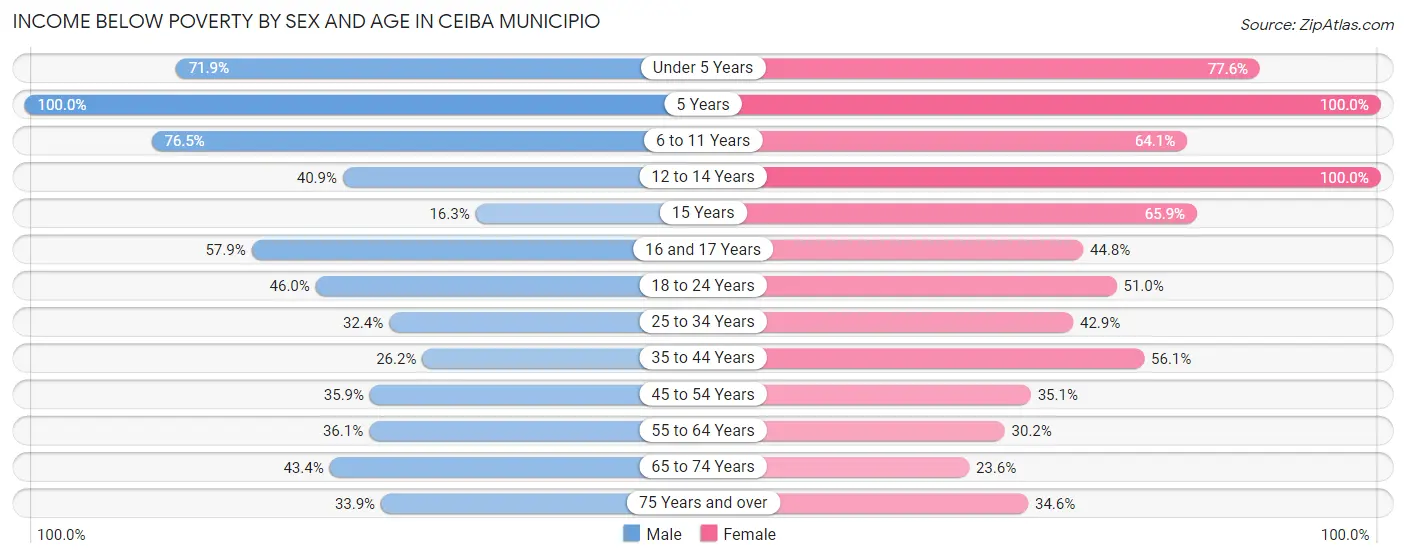
| Age Bracket | Male | Female |
| Under 5 Years | 182 (71.9%) | 52 (77.6%) |
| 5 Years | 81 (100.0%) | 32 (100.0%) |
| 6 to 11 Years | 263 (76.4%) | 223 (64.1%) |
| 12 to 14 Years | 52 (40.9%) | 116 (100.0%) |
| 15 Years | 23 (16.3%) | 58 (65.9%) |
| 16 and 17 Years | 33 (57.9%) | 43 (44.8%) |
| 18 to 24 Years | 246 (46.0%) | 254 (51.0%) |
| 25 to 34 Years | 231 (32.4%) | 273 (42.9%) |
| 35 to 44 Years | 149 (26.2%) | 441 (56.1%) |
| 45 to 54 Years | 242 (35.9%) | 289 (35.1%) |
| 55 to 64 Years | 228 (36.1%) | 233 (30.2%) |
| 65 to 74 Years | 247 (43.4%) | 183 (23.6%) |
| 75 Years and over | 216 (33.9%) | 280 (34.6%) |
| Total | 2,193 (41.1%) | 2,477 (42.4%) |
Income Above Poverty by Sex and Age in Ceiba Municipio
According to the poverty statistics in Ceiba Municipio, males aged 15 years and females aged 65 to 74 years are the age groups that are most secure financially, with 83.7% of males and 76.4% of females in these age groups living above the poverty line.
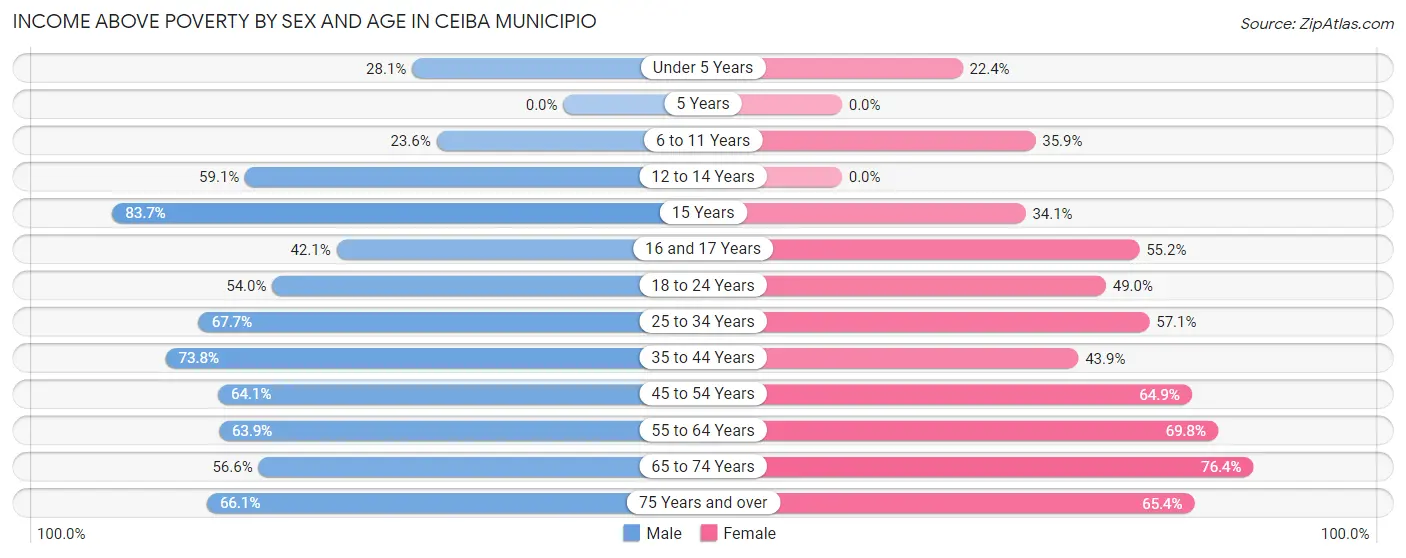
| Age Bracket | Male | Female |
| Under 5 Years | 71 (28.1%) | 15 (22.4%) |
| 5 Years | 0 (0.0%) | 0 (0.0%) |
| 6 to 11 Years | 81 (23.5%) | 125 (35.9%) |
| 12 to 14 Years | 75 (59.1%) | 0 (0.0%) |
| 15 Years | 118 (83.7%) | 30 (34.1%) |
| 16 and 17 Years | 24 (42.1%) | 53 (55.2%) |
| 18 to 24 Years | 289 (54.0%) | 244 (49.0%) |
| 25 to 34 Years | 483 (67.6%) | 363 (57.1%) |
| 35 to 44 Years | 420 (73.8%) | 345 (43.9%) |
| 45 to 54 Years | 432 (64.1%) | 535 (64.9%) |
| 55 to 64 Years | 404 (63.9%) | 538 (69.8%) |
| 65 to 74 Years | 322 (56.6%) | 592 (76.4%) |
| 75 Years and over | 422 (66.1%) | 530 (65.4%) |
| Total | 3,141 (58.9%) | 3,370 (57.6%) |
Income Below Poverty Among Married-Couple Families in Ceiba Municipio
The poverty statistics for married-couple families in Ceiba Municipio show that 25.0% or 398 of the total 1,594 families live below the poverty line. Families with 3 or 4 children have the highest poverty rate of 100.0%, comprising of 18 families. On the other hand, families with no children have the lowest poverty rate of 19.9%, which includes 208 families.
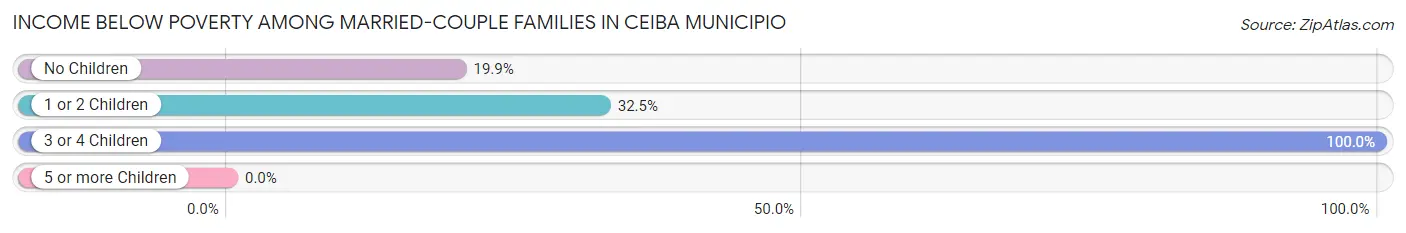
| Children | Above Poverty | Below Poverty |
| No Children | 838 (80.1%) | 208 (19.9%) |
| 1 or 2 Children | 358 (67.5%) | 172 (32.5%) |
| 3 or 4 Children | 0 (0.0%) | 18 (100.0%) |
| 5 or more Children | 0 (0.0%) | 0 (0.0%) |
| Total | 1,196 (75.0%) | 398 (25.0%) |
Income Below Poverty Among Single-Parent Households in Ceiba Municipio
According to the poverty data in Ceiba Municipio, 60.4% or 201 single-father households and 57.1% or 516 single-mother households are living below the poverty line. Among single-father households, those with 3 or 4 children have the highest poverty rate, with 10 households (100.0%) experiencing poverty. Likewise, among single-mother households, those with 3 or 4 children have the highest poverty rate, with 45 households (100.0%) falling below the poverty line.
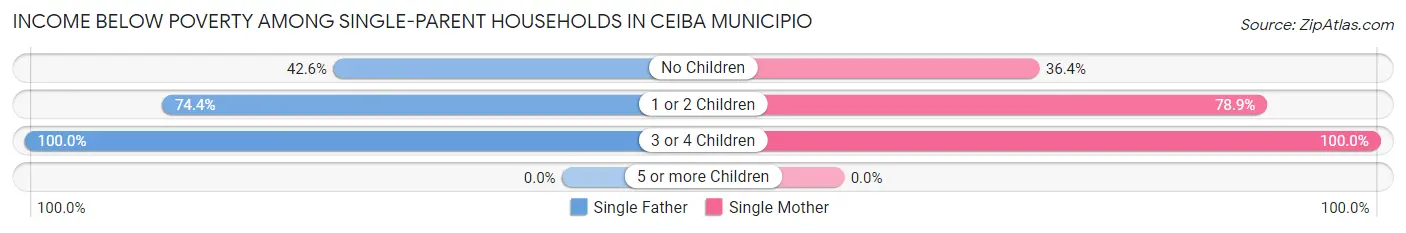
| Children | Single Father | Single Mother |
| No Children | 66 (42.6%) | 176 (36.4%) |
| 1 or 2 Children | 125 (74.4%) | 295 (78.9%) |
| 3 or 4 Children | 10 (100.0%) | 45 (100.0%) |
| 5 or more Children | 0 (0.0%) | 0 (0.0%) |
| Total | 201 (60.4%) | 516 (57.1%) |
Income Below Poverty Among Married-Couple vs Single-Parent Households in Ceiba Municipio
The poverty data for Ceiba Municipio shows that 398 of the married-couple family households (25.0%) and 717 of the single-parent households (58.0%) are living below the poverty level. Within the married-couple family households, those with 3 or 4 children have the highest poverty rate, with 18 households (100.0%) falling below the poverty line. Among the single-parent households, those with 3 or 4 children have the highest poverty rate, with 55 household (100.0%) living below poverty.
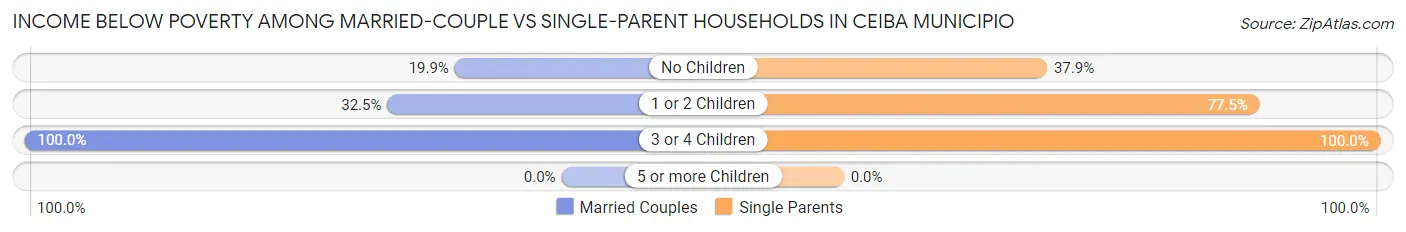
| Children | Married-Couple Families | Single-Parent Households |
| No Children | 208 (19.9%) | 242 (37.9%) |
| 1 or 2 Children | 172 (32.5%) | 420 (77.5%) |
| 3 or 4 Children | 18 (100.0%) | 55 (100.0%) |
| 5 or more Children | 0 (0.0%) | 0 (0.0%) |
| Total | 398 (25.0%) | 717 (58.0%) |
Race in Ceiba Municipio
The most populous races in Ceiba Municipio are Hispanic or Latino (11,066 | 98.3%), Some other Race (5,931 | 52.7%), and White / Caucasian (3,112 | 27.7%).
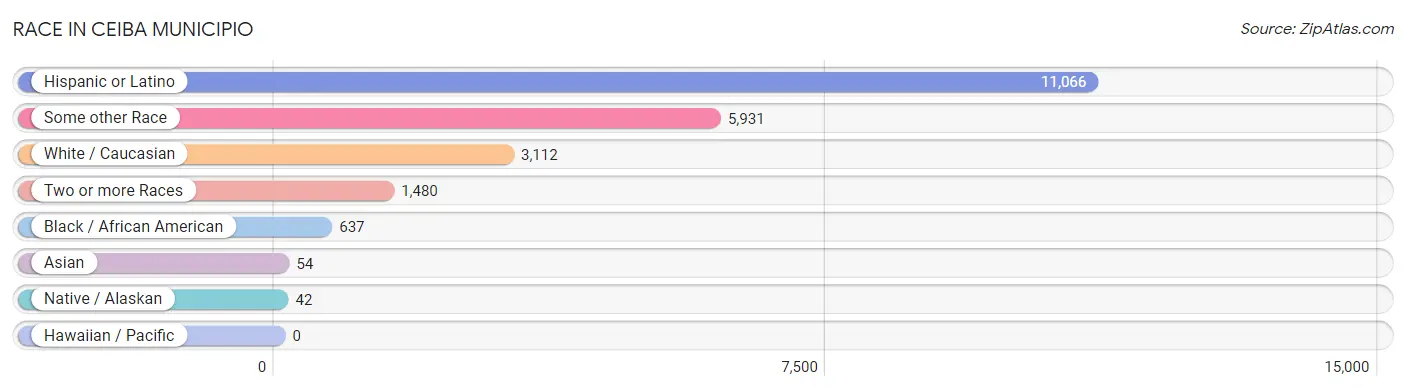
| Race | # Population | % Population |
| Asian | 54 | 0.5% |
| Black / African American | 637 | 5.7% |
| Hawaiian / Pacific | 0 | 0.0% |
| Hispanic or Latino | 11,066 | 98.3% |
| Native / Alaskan | 42 | 0.4% |
| White / Caucasian | 3,112 | 27.7% |
| Two or more Races | 1,480 | 13.2% |
| Some other Race | 5,931 | 52.7% |
| Total | 11,256 | 100.0% |
Ancestry in Ceiba Municipio
The most populous ancestries reported in Ceiba Municipio are Puerto Rican (10,873 | 96.6%), Dominican (123 | 1.1%), American (120 | 1.1%), Central American Indian (92 | 0.8%), and Indian (Asian) (54 | 0.5%), together accounting for 100.1% of all Ceiba Municipio residents.
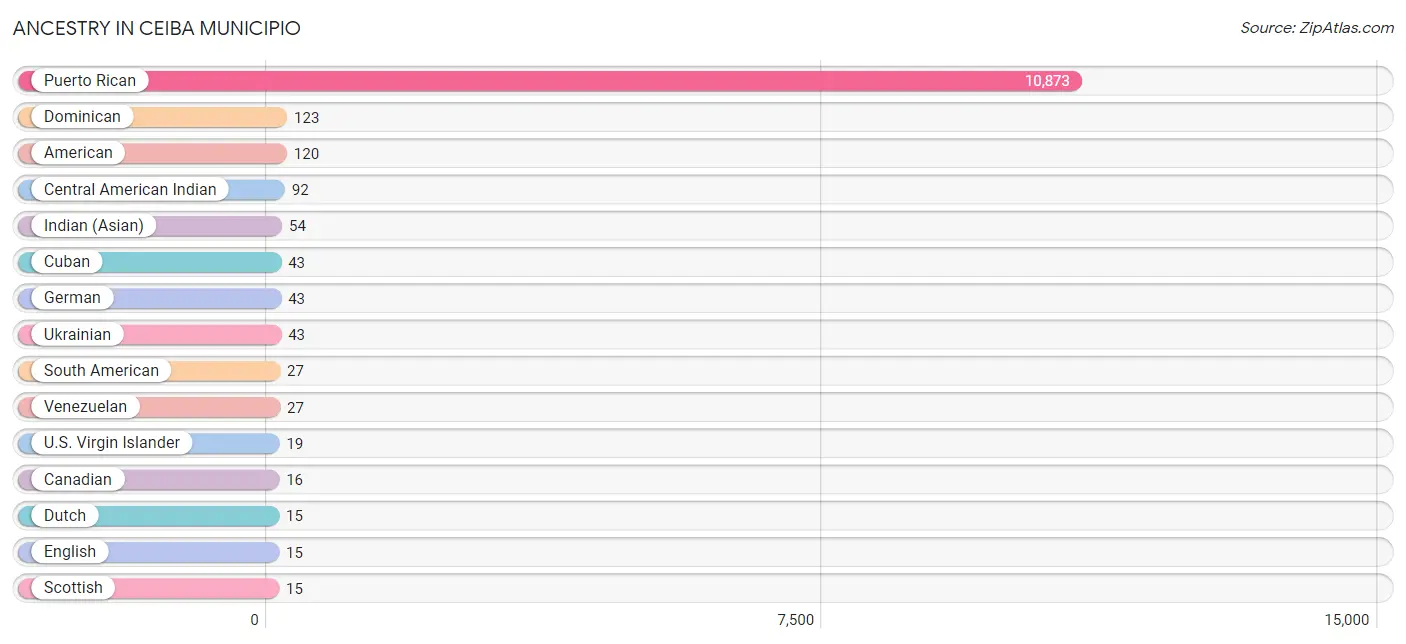
| Ancestry | # Population | % Population |
| American | 120 | 1.1% |
| Arab | 13 | 0.1% |
| Canadian | 16 | 0.1% |
| Central American Indian | 92 | 0.8% |
| Cuban | 43 | 0.4% |
| Dominican | 123 | 1.1% |
| Dutch | 15 | 0.1% |
| English | 15 | 0.1% |
| German | 43 | 0.4% |
| Indian (Asian) | 54 | 0.5% |
| Lebanese | 13 | 0.1% |
| Northern European | 14 | 0.1% |
| Puerto Rican | 10,873 | 96.6% |
| Scottish | 15 | 0.1% |
| South American | 27 | 0.2% |
| Thai | 10 | 0.1% |
| U.S. Virgin Islander | 19 | 0.2% |
| Ukrainian | 43 | 0.4% |
| Venezuelan | 27 | 0.2% | View All 19 Rows |
Immigrants in Ceiba Municipio

| Immigration Origin | # Population | % Population | View All 0 Rows |
Sex and Age in Ceiba Municipio
Sex and Age in Ceiba Municipio
The most populous age groups in Ceiba Municipio are 40 to 44 Years (409 | 7.7%) for men and 55 to 59 Years (463 | 7.8%) for women.
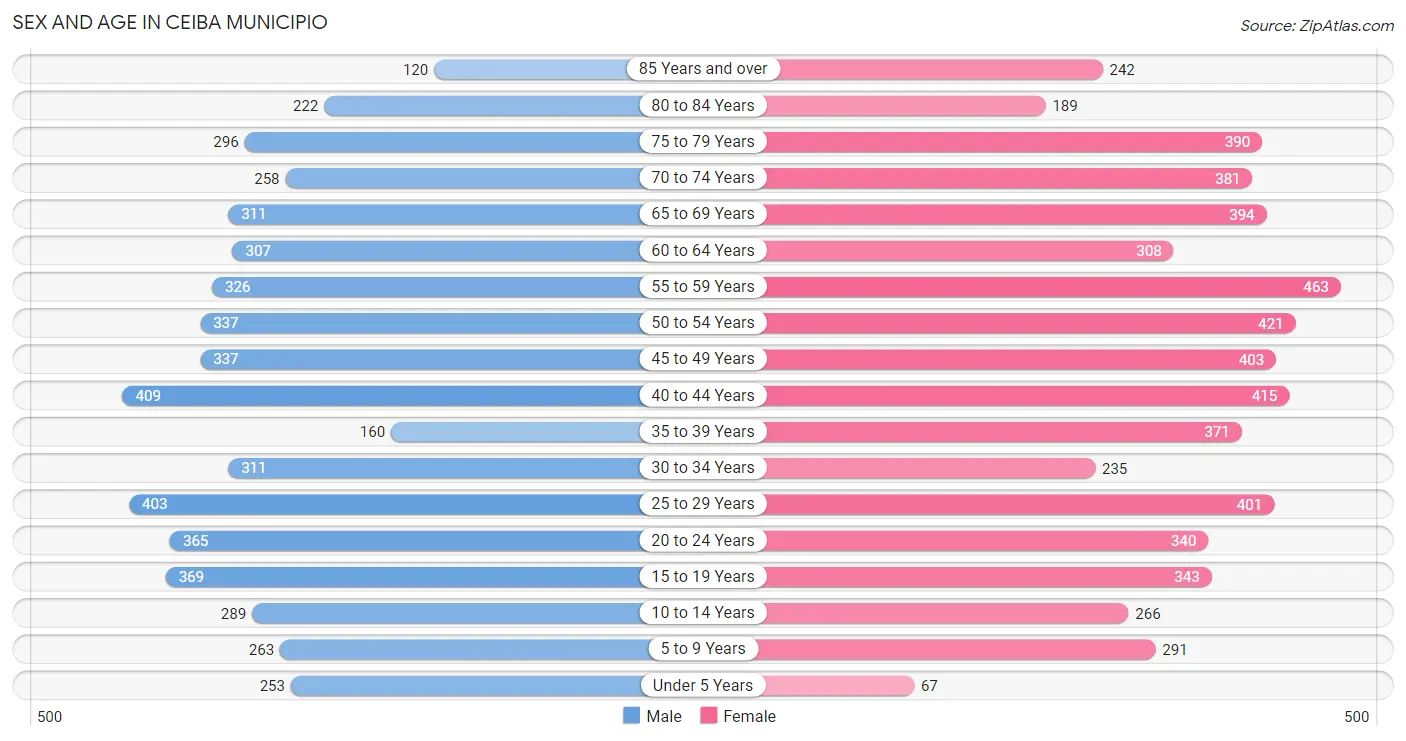
| Age Bracket | Male | Female |
| Under 5 Years | 253 (4.7%) | 67 (1.1%) |
| 5 to 9 Years | 263 (4.9%) | 291 (4.9%) |
| 10 to 14 Years | 289 (5.4%) | 266 (4.5%) |
| 15 to 19 Years | 369 (6.9%) | 343 (5.8%) |
| 20 to 24 Years | 365 (6.8%) | 340 (5.7%) |
| 25 to 29 Years | 403 (7.5%) | 401 (6.8%) |
| 30 to 34 Years | 311 (5.8%) | 235 (4.0%) |
| 35 to 39 Years | 160 (3.0%) | 371 (6.3%) |
| 40 to 44 Years | 409 (7.7%) | 415 (7.0%) |
| 45 to 49 Years | 337 (6.3%) | 403 (6.8%) |
| 50 to 54 Years | 337 (6.3%) | 421 (7.1%) |
| 55 to 59 Years | 326 (6.1%) | 463 (7.8%) |
| 60 to 64 Years | 307 (5.8%) | 308 (5.2%) |
| 65 to 69 Years | 311 (5.8%) | 394 (6.7%) |
| 70 to 74 Years | 258 (4.8%) | 381 (6.4%) |
| 75 to 79 Years | 296 (5.6%) | 390 (6.6%) |
| 80 to 84 Years | 222 (4.2%) | 189 (3.2%) |
| 85 Years and over | 120 (2.2%) | 242 (4.1%) |
| Total | 5,336 (100.0%) | 5,920 (100.0%) |
Families and Households in Ceiba Municipio
Median Family Size in Ceiba Municipio
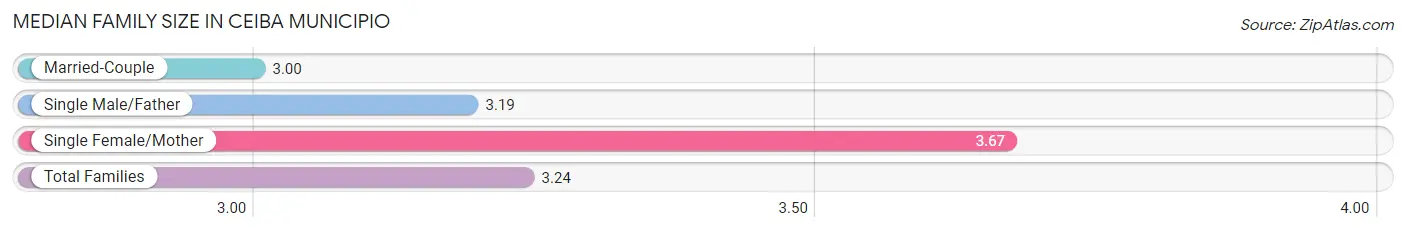
The median family size in Ceiba Municipio is 3.24 persons per family, with single female/mother families (903 | 31.9%) accounting for the largest median family size of 3.67 persons per family. On the other hand, married-couple families (1,594 | 56.3%) represent the smallest median family size with 3.00 persons per family.
| Family Type | # Families | Family Size |
| Married-Couple | 1,594 (56.3%) | 3.00 |
| Single Male/Father | 333 (11.8%) | 3.19 |
| Single Female/Mother | 903 (31.9%) | 3.67 |
| Total Families | 2,830 (100.0%) | 3.24 |
Median Household Size in Ceiba Municipio
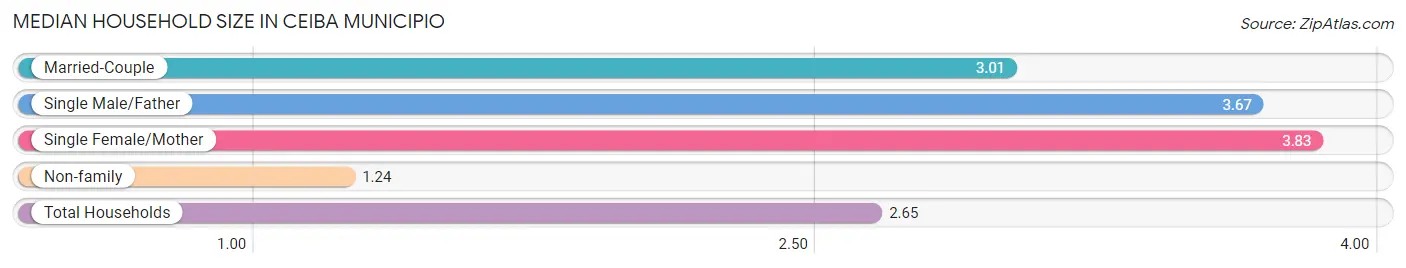
The median household size in Ceiba Municipio is 2.65 persons per household, with single female/mother households (903 | 21.3%) accounting for the largest median household size of 3.83 persons per household. non-family households (1,408 | 33.2%) represent the smallest median household size with 1.24 persons per household.
| Household Type | # Households | Household Size |
| Married-Couple | 1,594 (37.6%) | 3.01 |
| Single Male/Father | 333 (7.9%) | 3.67 |
| Single Female/Mother | 903 (21.3%) | 3.83 |
| Non-family | 1,408 (33.2%) | 1.24 |
| Total Households | 4,238 (100.0%) | 2.65 |
Household Size by Marriage Status in Ceiba Municipio
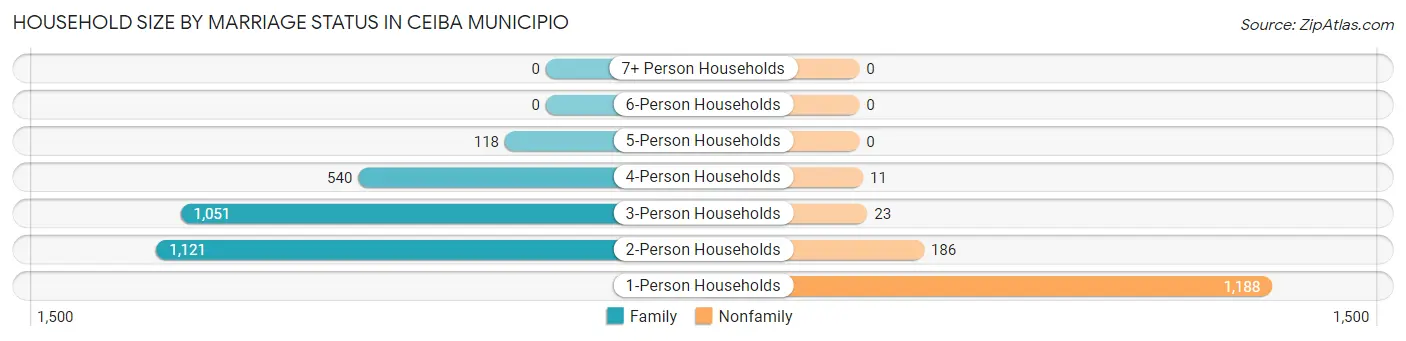
Out of a total of 4,238 households in Ceiba Municipio, 2,830 (66.8%) are family households, while 1,408 (33.2%) are nonfamily households. The most numerous type of family households are 2-person households, comprising 1,121, and the most common type of nonfamily households are 1-person households, comprising 1,188.
| Household Size | Family Households | Nonfamily Households |
| 1-Person Households | - | 1,188 (28.0%) |
| 2-Person Households | 1,121 (26.5%) | 186 (4.4%) |
| 3-Person Households | 1,051 (24.8%) | 23 (0.5%) |
| 4-Person Households | 540 (12.7%) | 11 (0.3%) |
| 5-Person Households | 118 (2.8%) | 0 (0.0%) |
| 6-Person Households | 0 (0.0%) | 0 (0.0%) |
| 7+ Person Households | 0 (0.0%) | 0 (0.0%) |
| Total | 2,830 (66.8%) | 1,408 (33.2%) |
Female Fertility in Ceiba Municipio
Fertility by Age in Ceiba Municipio
Average fertility rate in Ceiba Municipio is 58.0 births per 1,000 women. Women in the age bracket of 15 to 19 years have the highest fertility rate with 93.0 births per 1,000 women. Women in the age bracket of 20 to 34 years acount for 52.0% of all women with births.
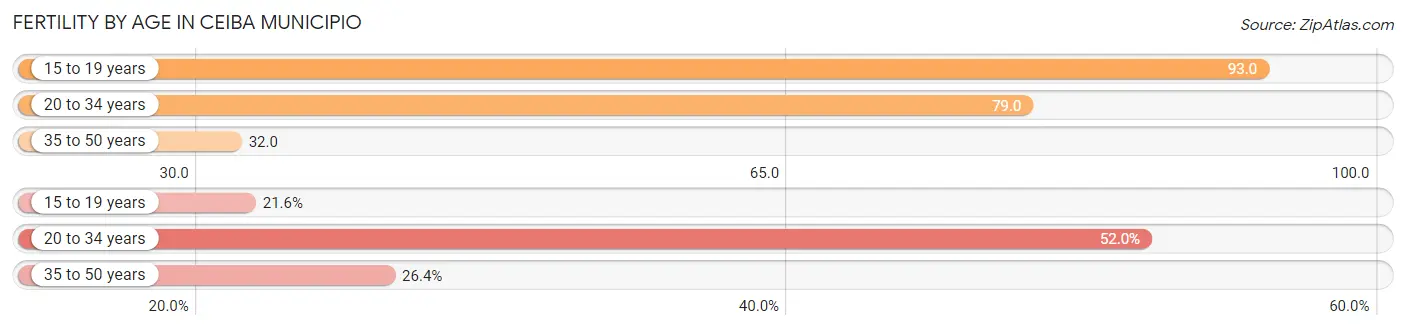
| Age Bracket | Women with Births | Births / 1,000 Women |
| 15 to 19 years | 32 (21.6%) | 93.0 |
| 20 to 34 years | 77 (52.0%) | 79.0 |
| 35 to 50 years | 39 (26.4%) | 32.0 |
| Total | 148 (100.0%) | 58.0 |
Fertility by Age by Marriage Status in Ceiba Municipio
22.3% of women with births (148) in Ceiba Municipio are married. The highest percentage of unmarried women with births falls into 15 to 19 years age bracket with 100.0% of them unmarried at the time of birth, while the lowest percentage of unmarried women with births belong to 20 to 34 years age bracket with 57.1% of them unmarried.
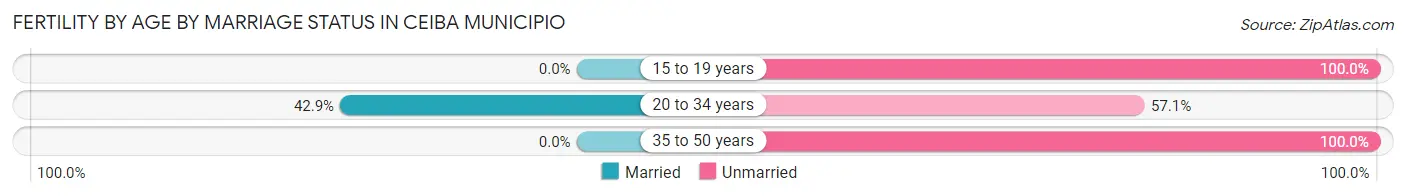
| Age Bracket | Married | Unmarried |
| 15 to 19 years | 0 (0.0%) | 32 (100.0%) |
| 20 to 34 years | 33 (42.9%) | 44 (57.1%) |
| 35 to 50 years | 0 (0.0%) | 39 (100.0%) |
| Total | 33 (22.3%) | 115 (77.7%) |
Fertility by Education in Ceiba Municipio
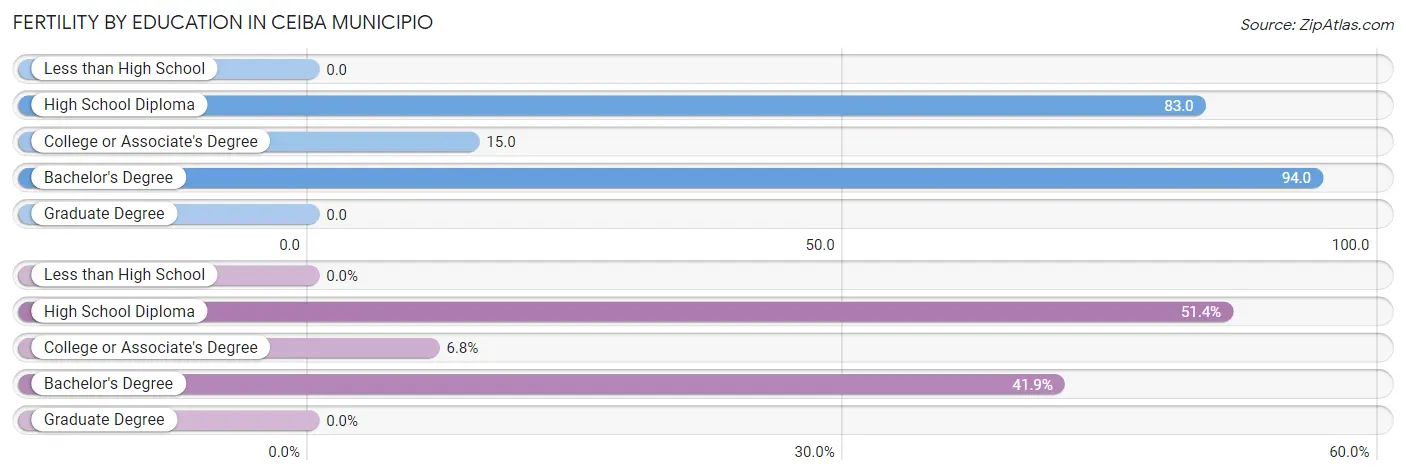
| Educational Attainment | Women with Births | Births / 1,000 Women |
| Less than High School | 0 (0.0%) | 0.0 |
| High School Diploma | 76 (51.3%) | 83.0 |
| College or Associate's Degree | 10 (6.8%) | 15.0 |
| Bachelor's Degree | 62 (41.9%) | 94.0 |
| Graduate Degree | 0 (0.0%) | 0.0 |
| Total | 148 (100.0%) | 58.0 |
Fertility by Education by Marriage Status in Ceiba Municipio
77.7% of women with births in Ceiba Municipio are unmarried. Women with the educational attainment of college or associate's degree are most likely to be married with 100.0% of them married at childbirth, while women with the educational attainment of high school diploma are least likely to be married with 100.0% of them unmarried at childbirth.
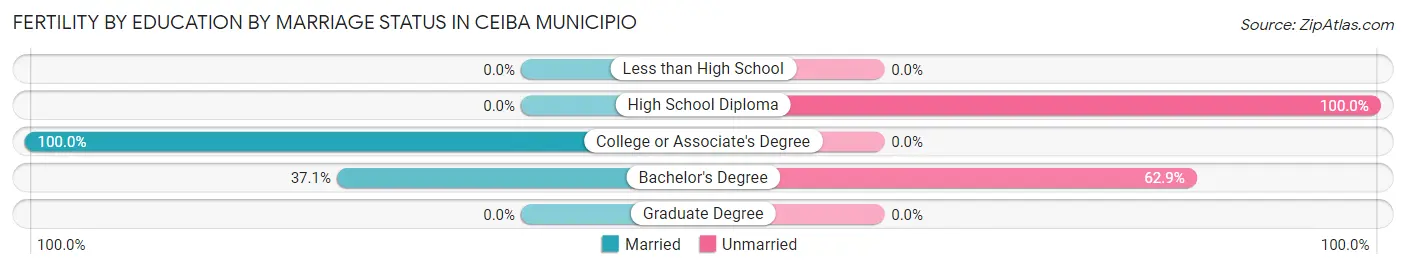
| Educational Attainment | Married | Unmarried |
| Less than High School | 0 (0.0%) | 0 (0.0%) |
| High School Diploma | 0 (0.0%) | 76 (100.0%) |
| College or Associate's Degree | 10 (100.0%) | 0 (0.0%) |
| Bachelor's Degree | 23 (37.1%) | 39 (62.9%) |
| Graduate Degree | 0 (0.0%) | 0 (0.0%) |
| Total | 33 (22.3%) | 115 (77.7%) |
Employment Characteristics in Ceiba Municipio
Employment by Class of Employer in Ceiba Municipio
Among the 3,655 employed individuals in Ceiba Municipio, private company employees (2,240 | 61.3%), self-employed (not incorporated) (664 | 18.2%), and local government employees (295 | 8.1%) make up the most common classes of employment.
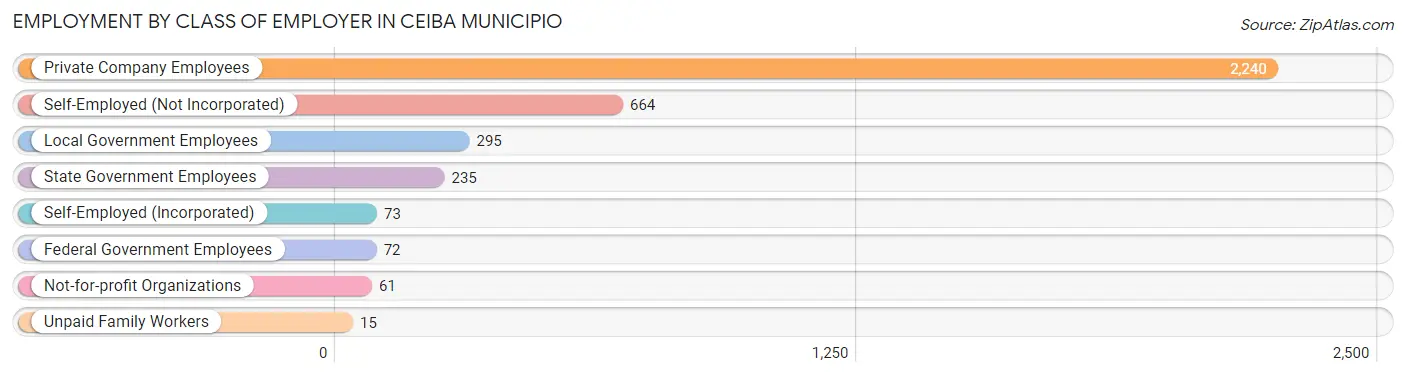
| Employer Class | # Employees | % Employees |
| Private Company Employees | 2,240 | 61.3% |
| Self-Employed (Incorporated) | 73 | 2.0% |
| Self-Employed (Not Incorporated) | 664 | 18.2% |
| Not-for-profit Organizations | 61 | 1.7% |
| Local Government Employees | 295 | 8.1% |
| State Government Employees | 235 | 6.4% |
| Federal Government Employees | 72 | 2.0% |
| Unpaid Family Workers | 15 | 0.4% |
| Total | 3,655 | 100.0% |
Employment Status by Age in Ceiba Municipio
According to the labor force statistics for Ceiba Municipio, out of the total population over 16 years of age (9,598), 43.1% or 4,137 individuals are in the labor force, with 11.2% or 463 of them unemployed. The age group with the highest labor force participation rate is 30 to 34 years, with 86.1% or 470 individuals in the labor force. Within the labor force, the 35 to 44 years age range has the highest percentage of unemployed individuals, with 22.4% or 219 of them being unemployed.
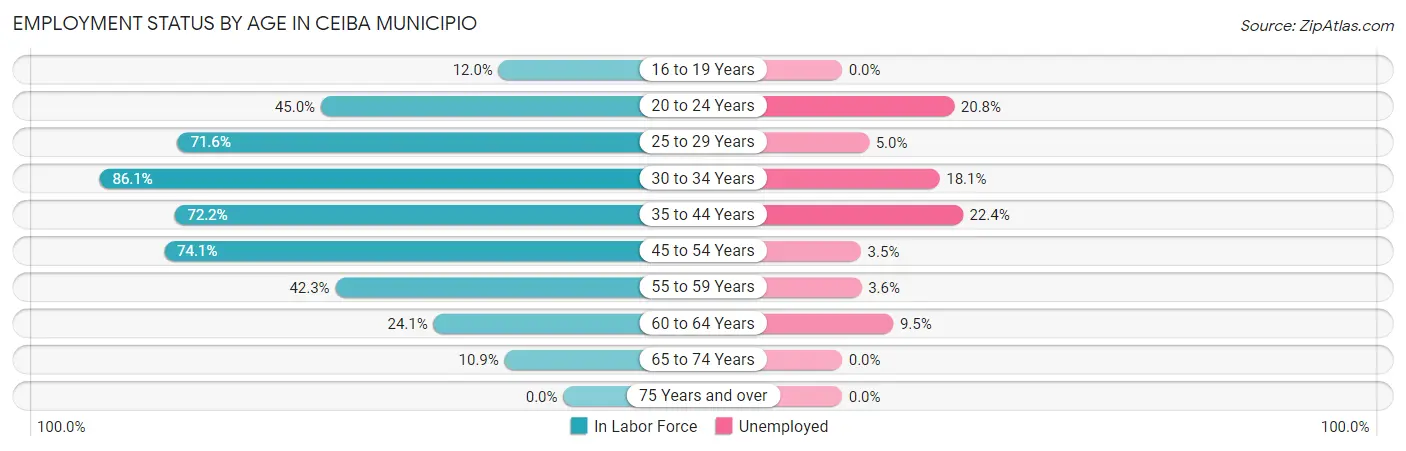
| Age Bracket | In Labor Force | Unemployed |
| 16 to 19 Years | 58 (12.0%) | 0 (0.0%) |
| 20 to 24 Years | 317 (45.0%) | 66 (20.8%) |
| 25 to 29 Years | 576 (71.6%) | 29 (5.0%) |
| 30 to 34 Years | 470 (86.1%) | 85 (18.1%) |
| 35 to 44 Years | 978 (72.2%) | 219 (22.4%) |
| 45 to 54 Years | 1,110 (74.1%) | 39 (3.5%) |
| 55 to 59 Years | 334 (42.3%) | 12 (3.6%) |
| 60 to 64 Years | 148 (24.1%) | 14 (9.5%) |
| 65 to 74 Years | 146 (10.9%) | 0 (0.0%) |
| 75 Years and over | 0 (0.0%) | 0 (0.0%) |
| Total | 4,137 (43.1%) | 463 (11.2%) |
Employment Status by Educational Attainment in Ceiba Municipio
According to labor force statistics for Ceiba Municipio, 64.5% of individuals (3,617) out of the total population between 25 and 64 years of age (5,607) are in the labor force, with 11.0% or 398 of them being unemployed. The group with the highest labor force participation rate are those with the educational attainment of bachelor's degree or higher, with 77.3% or 1,163 individuals in the labor force. Within the labor force, individuals with bachelor's degree or higher education have the highest percentage of unemployment, with 17.0% or 198 of them being unemployed.
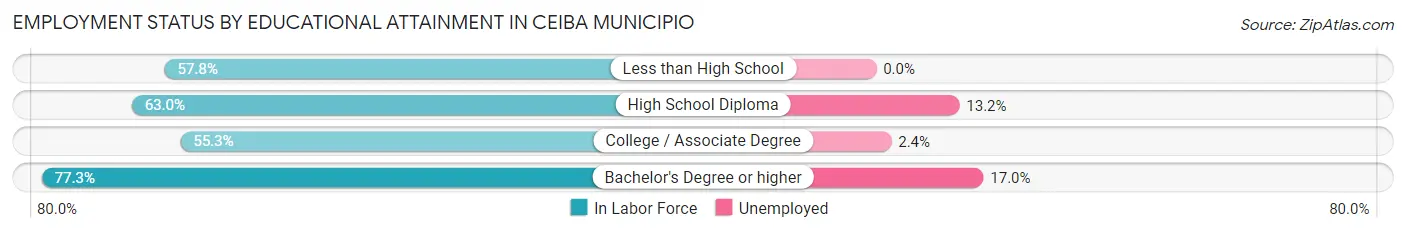
| Educational Attainment | In Labor Force | Unemployed |
| Less than High School | 332 (57.8%) | 0 (0.0%) |
| High School Diploma | 1,381 (63.0%) | 289 (13.2%) |
| College / Associate Degree | 739 (55.3%) | 32 (2.4%) |
| Bachelor's Degree or higher | 1,163 (77.3%) | 256 (17.0%) |
| Total | 3,617 (64.5%) | 617 (11.0%) |
Employment Occupations by Sex in Ceiba Municipio
Management, Business, Science and Arts Occupations
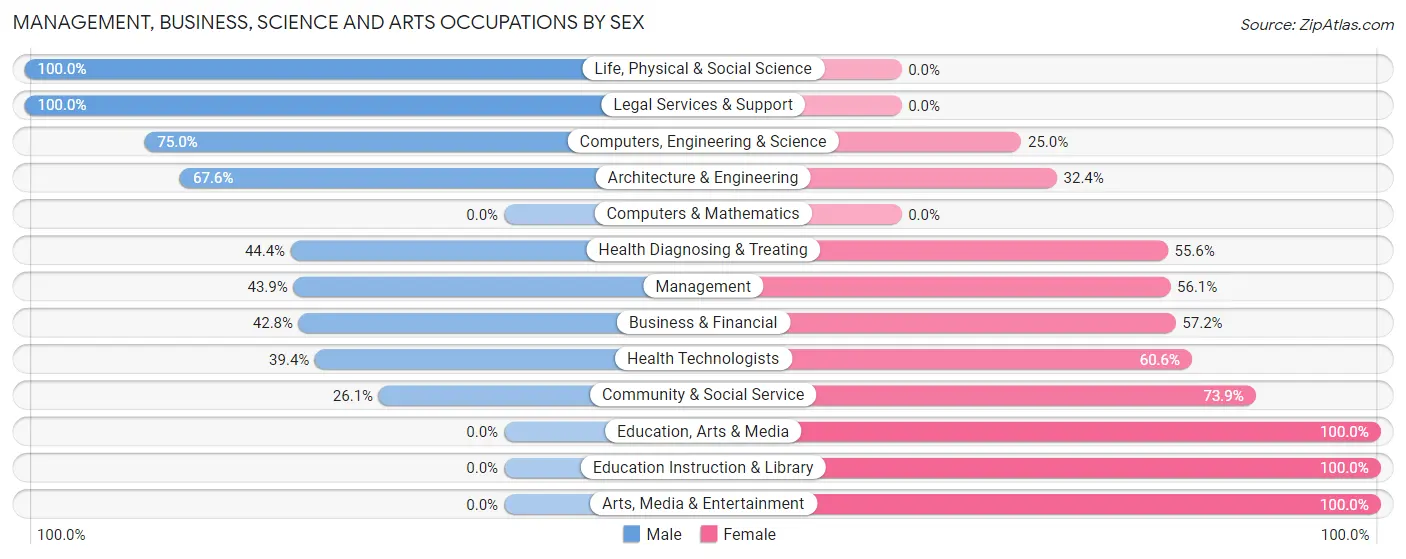
The most common Management, Business, Science and Arts occupations in Ceiba Municipio are Business & Financial (222 | 6.0%), Health Diagnosing & Treating (207 | 5.6%), Health Technologists (165 | 4.5%), Community & Social Service (138 | 3.8%), and Management (123 | 3.4%).
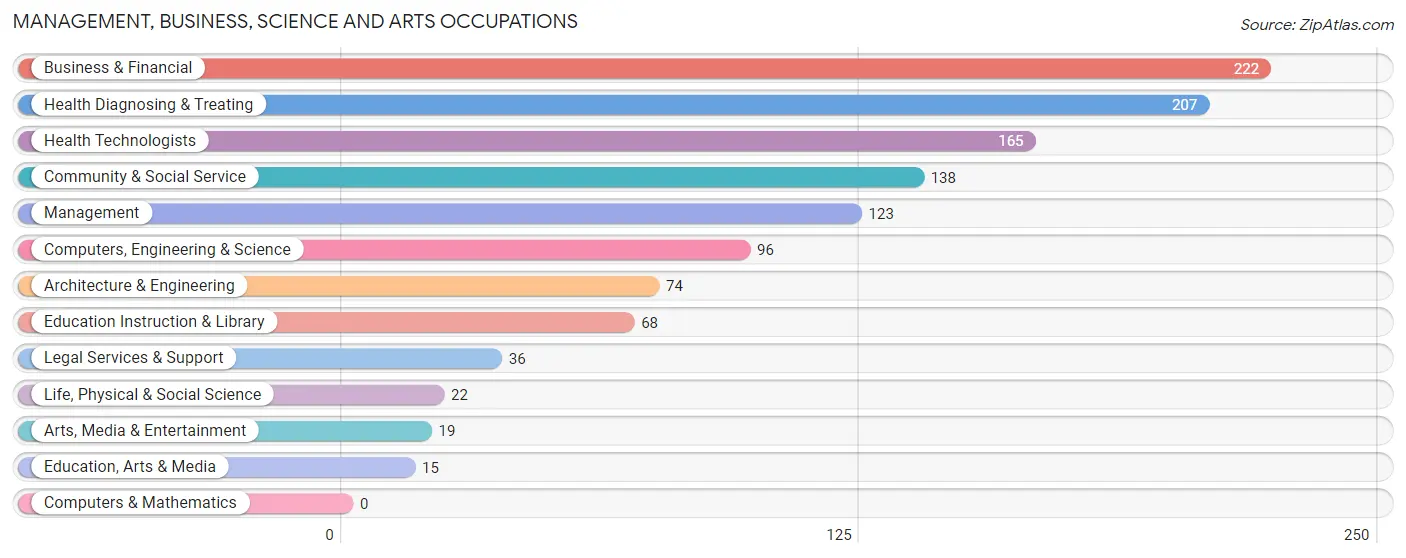
Management, Business, Science and Arts Occupations by Sex
Within the Management, Business, Science and Arts occupations in Ceiba Municipio, the most male-oriented occupations are Life, Physical & Social Science (100.0%), Legal Services & Support (100.0%), and Computers, Engineering & Science (75.0%), while the most female-oriented occupations are Education, Arts & Media (100.0%), Education Instruction & Library (100.0%), and Arts, Media & Entertainment (100.0%).
| Occupation | Male | Female |
| Management | 54 (43.9%) | 69 (56.1%) |
| Business & Financial | 95 (42.8%) | 127 (57.2%) |
| Computers, Engineering & Science | 72 (75.0%) | 24 (25.0%) |
| Computers & Mathematics | 0 (0.0%) | 0 (0.0%) |
| Architecture & Engineering | 50 (67.6%) | 24 (32.4%) |
| Life, Physical & Social Science | 22 (100.0%) | 0 (0.0%) |
| Community & Social Service | 36 (26.1%) | 102 (73.9%) |
| Education, Arts & Media | 0 (0.0%) | 15 (100.0%) |
| Legal Services & Support | 36 (100.0%) | 0 (0.0%) |
| Education Instruction & Library | 0 (0.0%) | 68 (100.0%) |
| Arts, Media & Entertainment | 0 (0.0%) | 19 (100.0%) |
| Health Diagnosing & Treating | 92 (44.4%) | 115 (55.6%) |
| Health Technologists | 65 (39.4%) | 100 (60.6%) |
| Total (Category) | 349 (44.4%) | 437 (55.6%) |
| Total (Overall) | 2,038 (55.5%) | 1,635 (44.5%) |
Services Occupations
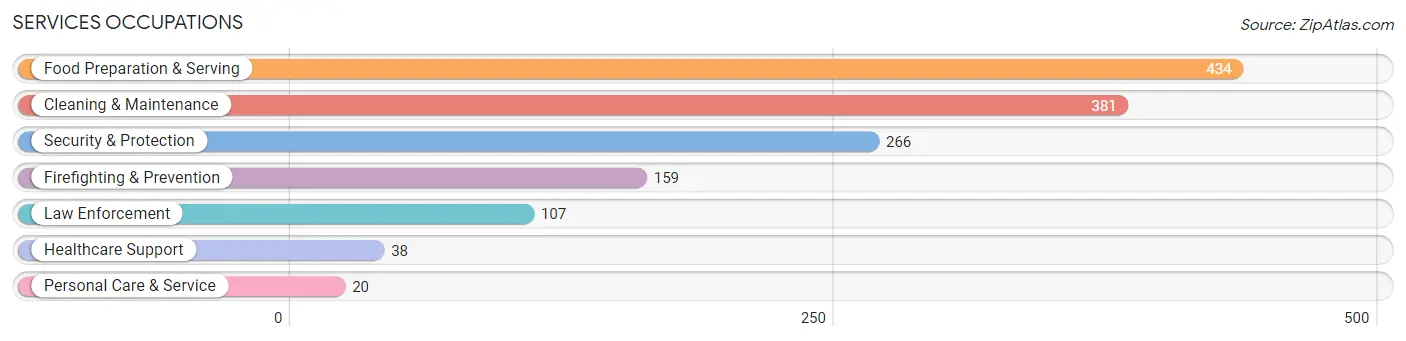
The most common Services occupations in Ceiba Municipio are Food Preparation & Serving (434 | 11.8%), Cleaning & Maintenance (381 | 10.4%), Security & Protection (266 | 7.2%), Firefighting & Prevention (159 | 4.3%), and Law Enforcement (107 | 2.9%).
Services Occupations by Sex
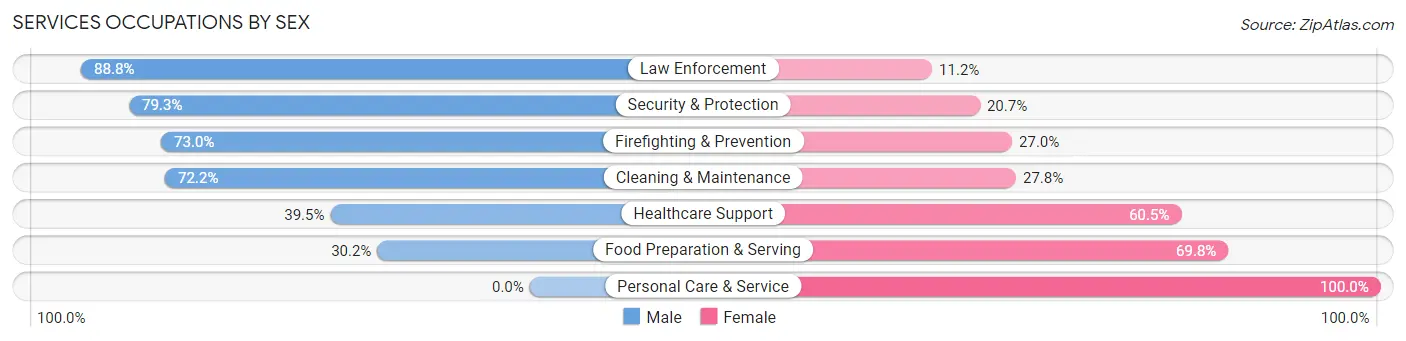
Within the Services occupations in Ceiba Municipio, the most male-oriented occupations are Law Enforcement (88.8%), Security & Protection (79.3%), and Firefighting & Prevention (73.0%), while the most female-oriented occupations are Personal Care & Service (100.0%), Food Preparation & Serving (69.8%), and Healthcare Support (60.5%).
| Occupation | Male | Female |
| Healthcare Support | 15 (39.5%) | 23 (60.5%) |
| Security & Protection | 211 (79.3%) | 55 (20.7%) |
| Firefighting & Prevention | 116 (73.0%) | 43 (27.0%) |
| Law Enforcement | 95 (88.8%) | 12 (11.2%) |
| Food Preparation & Serving | 131 (30.2%) | 303 (69.8%) |
| Cleaning & Maintenance | 275 (72.2%) | 106 (27.8%) |
| Personal Care & Service | 0 (0.0%) | 20 (100.0%) |
| Total (Category) | 632 (55.5%) | 507 (44.5%) |
| Total (Overall) | 2,038 (55.5%) | 1,635 (44.5%) |
Sales and Office Occupations
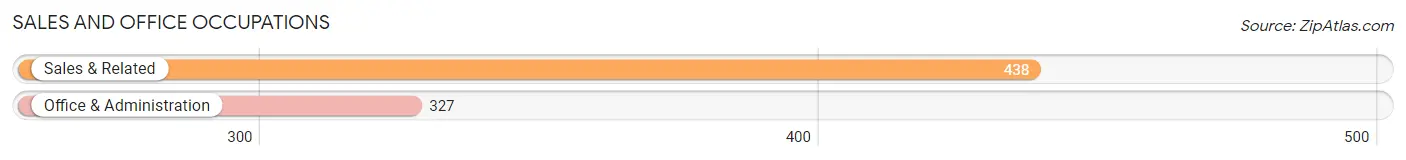
The most common Sales and Office occupations in Ceiba Municipio are Sales & Related (438 | 11.9%), and Office & Administration (327 | 8.9%).
Sales and Office Occupations by Sex
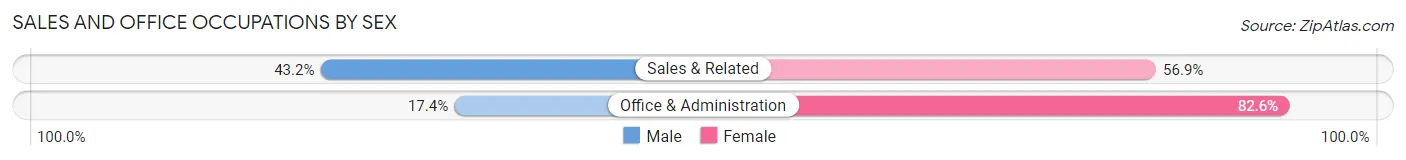
| Occupation | Male | Female |
| Sales & Related | 189 (43.1%) | 249 (56.9%) |
| Office & Administration | 57 (17.4%) | 270 (82.6%) |
| Total (Category) | 246 (32.2%) | 519 (67.8%) |
| Total (Overall) | 2,038 (55.5%) | 1,635 (44.5%) |
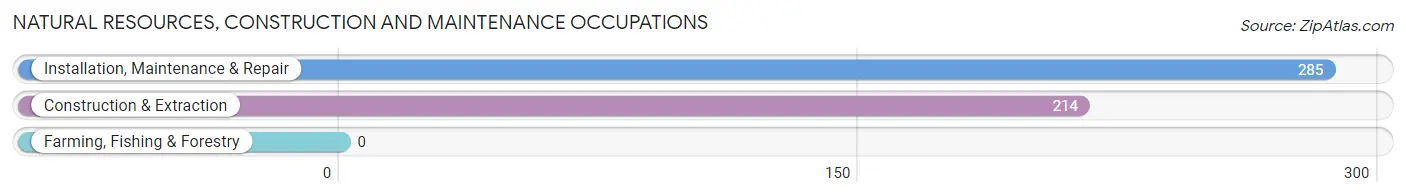
Natural Resources, Construction and Maintenance Occupations
The most common Natural Resources, Construction and Maintenance occupations in Ceiba Municipio are Installation, Maintenance & Repair (285 | 7.8%), and Construction & Extraction (214 | 5.8%).
Natural Resources, Construction and Maintenance Occupations by Sex
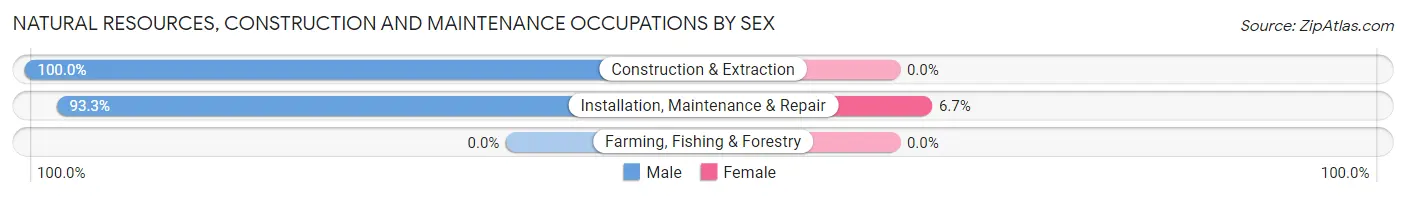
| Occupation | Male | Female |
| Farming, Fishing & Forestry | 0 (0.0%) | 0 (0.0%) |
| Construction & Extraction | 214 (100.0%) | 0 (0.0%) |
| Installation, Maintenance & Repair | 266 (93.3%) | 19 (6.7%) |
| Total (Category) | 480 (96.2%) | 19 (3.8%) |
| Total (Overall) | 2,038 (55.5%) | 1,635 (44.5%) |
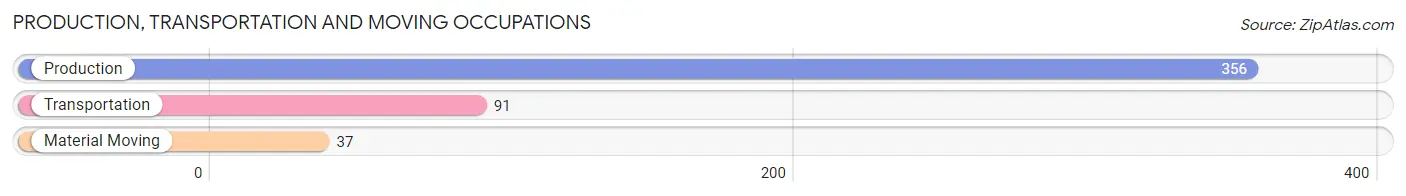
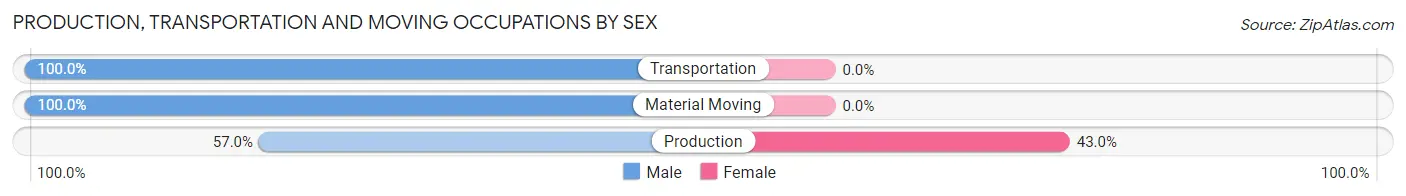
Production, Transportation and Moving Occupations
The most common Production, Transportation and Moving occupations in Ceiba Municipio are Production (356 | 9.7%), Transportation (91 | 2.5%), and Material Moving (37 | 1.0%).
Production, Transportation and Moving Occupations by Sex
| Occupation | Male | Female |
| Production | 203 (57.0%) | 153 (43.0%) |
| Transportation | 91 (100.0%) | 0 (0.0%) |
| Material Moving | 37 (100.0%) | 0 (0.0%) |
| Total (Category) | 331 (68.4%) | 153 (31.6%) |
| Total (Overall) | 2,038 (55.5%) | 1,635 (44.5%) |
Employment Industries by Sex in Ceiba Municipio
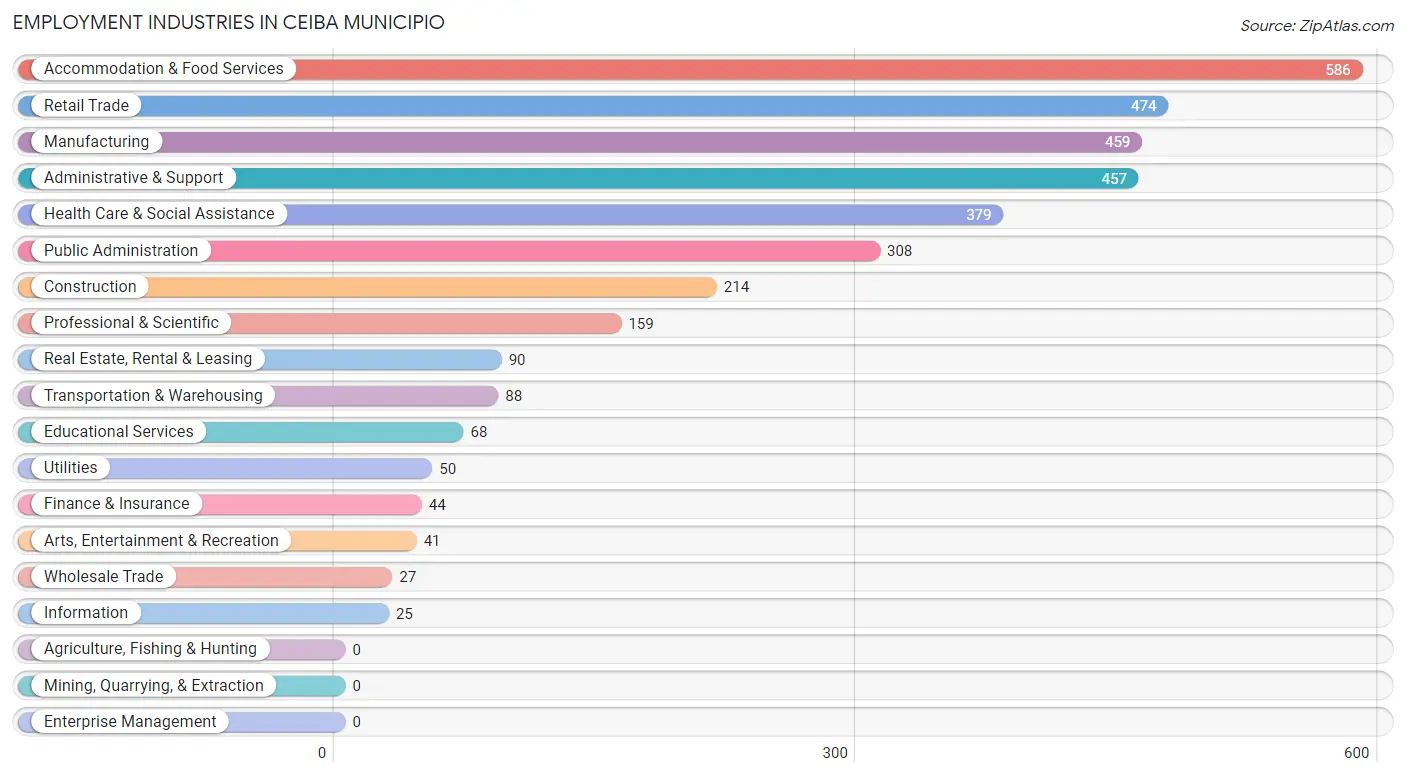
Employment Industries in Ceiba Municipio
The major employment industries in Ceiba Municipio include Accommodation & Food Services (586 | 16.0%), Retail Trade (474 | 12.9%), Manufacturing (459 | 12.5%), Administrative & Support (457 | 12.4%), and Health Care & Social Assistance (379 | 10.3%).
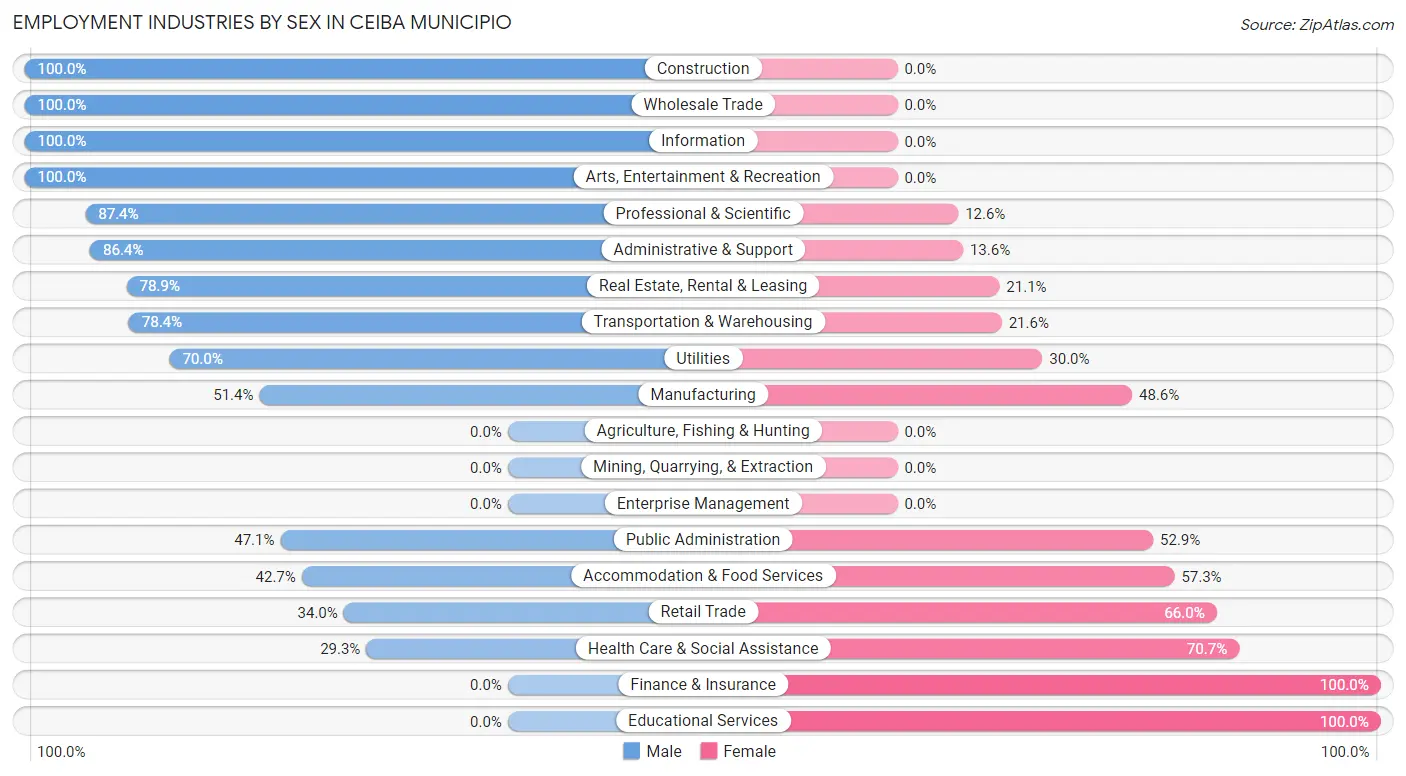
Employment Industries by Sex in Ceiba Municipio
The Ceiba Municipio industries that see more men than women are Construction (100.0%), Wholesale Trade (100.0%), and Information (100.0%), whereas the industries that tend to have a higher number of women are Finance & Insurance (100.0%), Educational Services (100.0%), and Health Care & Social Assistance (70.7%).
| Industry | Male | Female |
| Agriculture, Fishing & Hunting | 0 (0.0%) | 0 (0.0%) |
| Mining, Quarrying, & Extraction | 0 (0.0%) | 0 (0.0%) |
| Construction | 214 (100.0%) | 0 (0.0%) |
| Manufacturing | 236 (51.4%) | 223 (48.6%) |
| Wholesale Trade | 27 (100.0%) | 0 (0.0%) |
| Retail Trade | 161 (34.0%) | 313 (66.0%) |
| Transportation & Warehousing | 69 (78.4%) | 19 (21.6%) |
| Utilities | 35 (70.0%) | 15 (30.0%) |
| Information | 25 (100.0%) | 0 (0.0%) |
| Finance & Insurance | 0 (0.0%) | 44 (100.0%) |
| Real Estate, Rental & Leasing | 71 (78.9%) | 19 (21.1%) |
| Professional & Scientific | 139 (87.4%) | 20 (12.6%) |
| Enterprise Management | 0 (0.0%) | 0 (0.0%) |
| Administrative & Support | 395 (86.4%) | 62 (13.6%) |
| Educational Services | 0 (0.0%) | 68 (100.0%) |
| Health Care & Social Assistance | 111 (29.3%) | 268 (70.7%) |
| Arts, Entertainment & Recreation | 41 (100.0%) | 0 (0.0%) |
| Accommodation & Food Services | 250 (42.7%) | 336 (57.3%) |
| Public Administration | 145 (47.1%) | 163 (52.9%) |
| Total | 2,038 (55.5%) | 1,635 (44.5%) |
Education in Ceiba Municipio
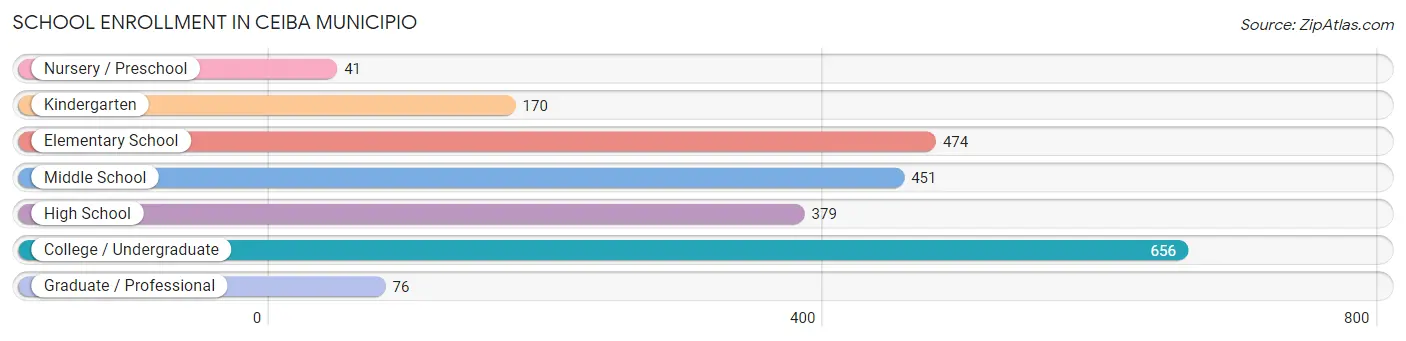
School Enrollment in Ceiba Municipio
The most common levels of schooling among the 2,247 students in Ceiba Municipio are college / undergraduate (656 | 29.2%), elementary school (474 | 21.1%), and middle school (451 | 20.1%).
| School Level | # Students | % Students |
| Nursery / Preschool | 41 | 1.8% |
| Kindergarten | 170 | 7.6% |
| Elementary School | 474 | 21.1% |
| Middle School | 451 | 20.1% |
| High School | 379 | 16.9% |
| College / Undergraduate | 656 | 29.2% |
| Graduate / Professional | 76 | 3.4% |
| Total | 2,247 | 100.0% |
School Enrollment by Age by Funding Source in Ceiba Municipio
Out of a total of 2,247 students who are enrolled in schools in Ceiba Municipio, 845 (37.6%) attend a private institution, while the remaining 1,402 (62.4%) are enrolled in public schools. The age group of 25 to 34 year olds has the highest likelihood of being enrolled in private schools, with 70 (100.0% in the age bracket) enrolled. Conversely, the age group of 5 to 9 year old has the lowest likelihood of being enrolled in a private school, with 452 (81.6% in the age bracket) attending a public institution.
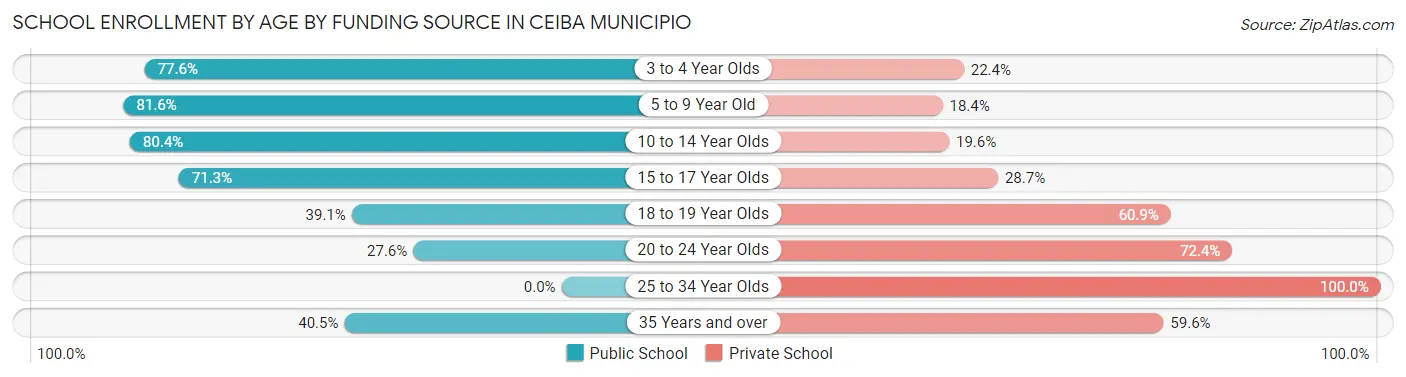
| Age Bracket | Public School | Private School |
| 3 to 4 Year Olds | 59 (77.6%) | 17 (22.4%) |
| 5 to 9 Year Old | 452 (81.6%) | 102 (18.4%) |
| 10 to 14 Year Olds | 426 (80.4%) | 104 (19.6%) |
| 15 to 17 Year Olds | 238 (71.3%) | 96 (28.7%) |
| 18 to 19 Year Olds | 95 (39.1%) | 148 (60.9%) |
| 20 to 24 Year Olds | 97 (27.6%) | 254 (72.4%) |
| 25 to 34 Year Olds | 0 (0.0%) | 70 (100.0%) |
| 35 Years and over | 36 (40.5%) | 53 (59.6%) |
| Total | 1,402 (62.4%) | 845 (37.6%) |
Educational Attainment by Field of Study in Ceiba Municipio
Business (682 | 36.0%), science & technology (398 | 21.0%), education (345 | 18.2%), arts & humanities (90 | 4.8%), and physical & health sciences (75 | 4.0%) are the most common fields of study among 1,896 individuals in Ceiba Municipio who have obtained a bachelor's degree or higher.
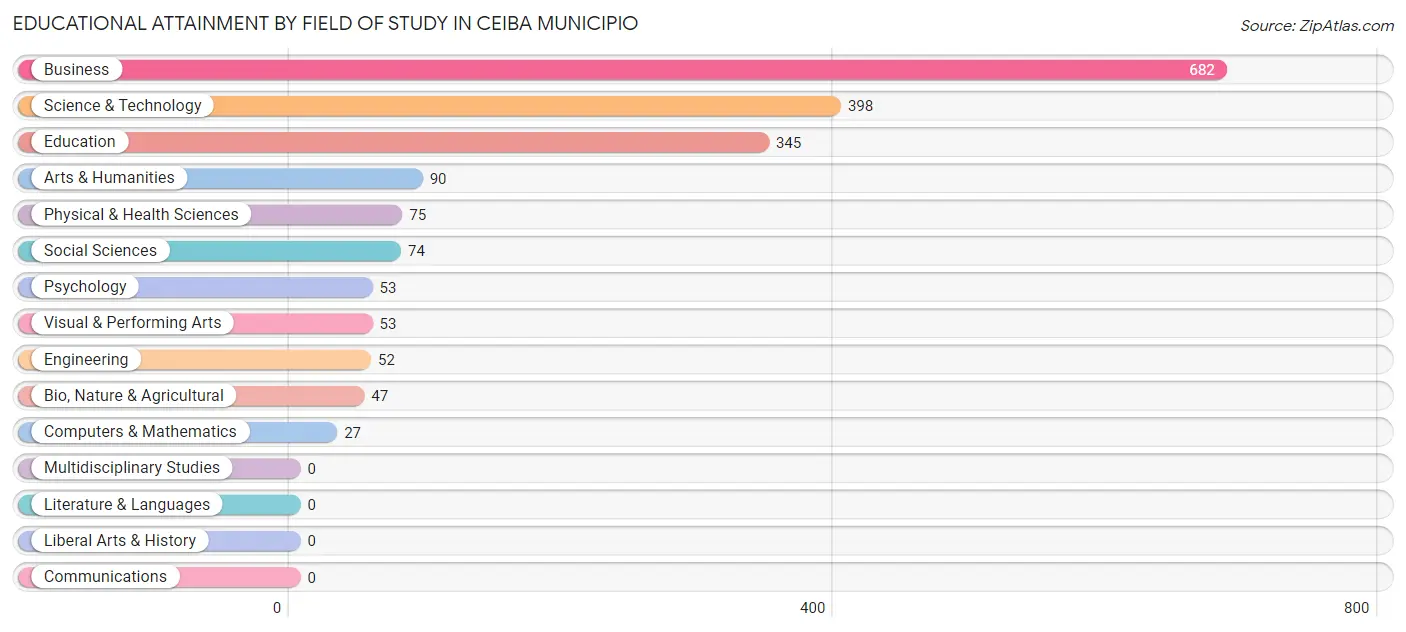
| Field of Study | # Graduates | % Graduates |
| Computers & Mathematics | 27 | 1.4% |
| Bio, Nature & Agricultural | 47 | 2.5% |
| Physical & Health Sciences | 75 | 4.0% |
| Psychology | 53 | 2.8% |
| Social Sciences | 74 | 3.9% |
| Engineering | 52 | 2.7% |
| Multidisciplinary Studies | 0 | 0.0% |
| Science & Technology | 398 | 21.0% |
| Business | 682 | 36.0% |
| Education | 345 | 18.2% |
| Literature & Languages | 0 | 0.0% |
| Liberal Arts & History | 0 | 0.0% |
| Visual & Performing Arts | 53 | 2.8% |
| Communications | 0 | 0.0% |
| Arts & Humanities | 90 | 4.8% |
| Total | 1,896 | 100.0% |
Transportation & Commute in Ceiba Municipio
Vehicle Availability by Sex in Ceiba Municipio
The most prevalent vehicle ownership categories in Ceiba Municipio are males with 2 vehicles (794, accounting for 39.3%) and females with 2 vehicles (699, making up 48.6%).
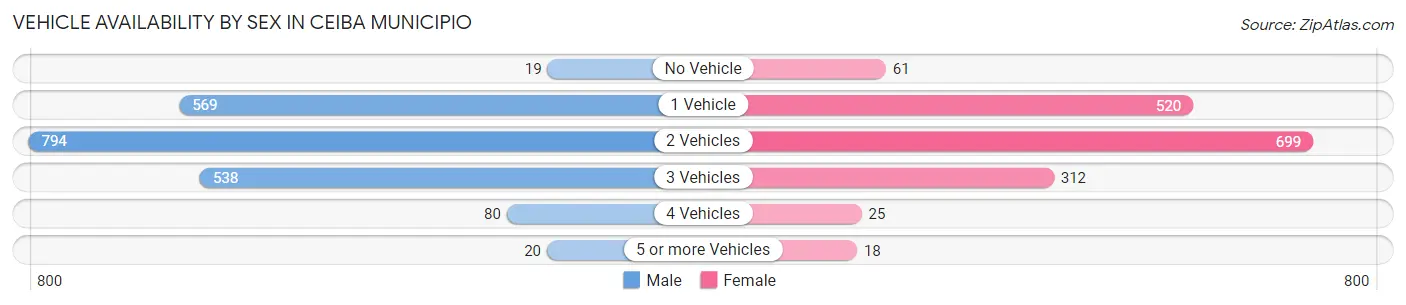
| Vehicles Available | Male | Female |
| No Vehicle | 19 (0.9%) | 61 (3.7%) |
| 1 Vehicle | 569 (28.2%) | 520 (31.8%) |
| 2 Vehicles | 794 (39.3%) | 699 (42.7%) |
| 3 Vehicles | 538 (26.6%) | 312 (19.1%) |
| 4 Vehicles | 80 (4.0%) | 25 (1.5%) |
| 5 or more Vehicles | 20 (1.0%) | 18 (1.1%) |
| Total | 2,020 (100.0%) | 1,635 (100.0%) |
Commute Time in Ceiba Municipio
The most frequently occuring commute durations in Ceiba Municipio are 15 to 19 minutes (868 commuters, 24.6%), 20 to 24 minutes (683 commuters, 19.4%), and 10 to 14 minutes (492 commuters, 14.0%).
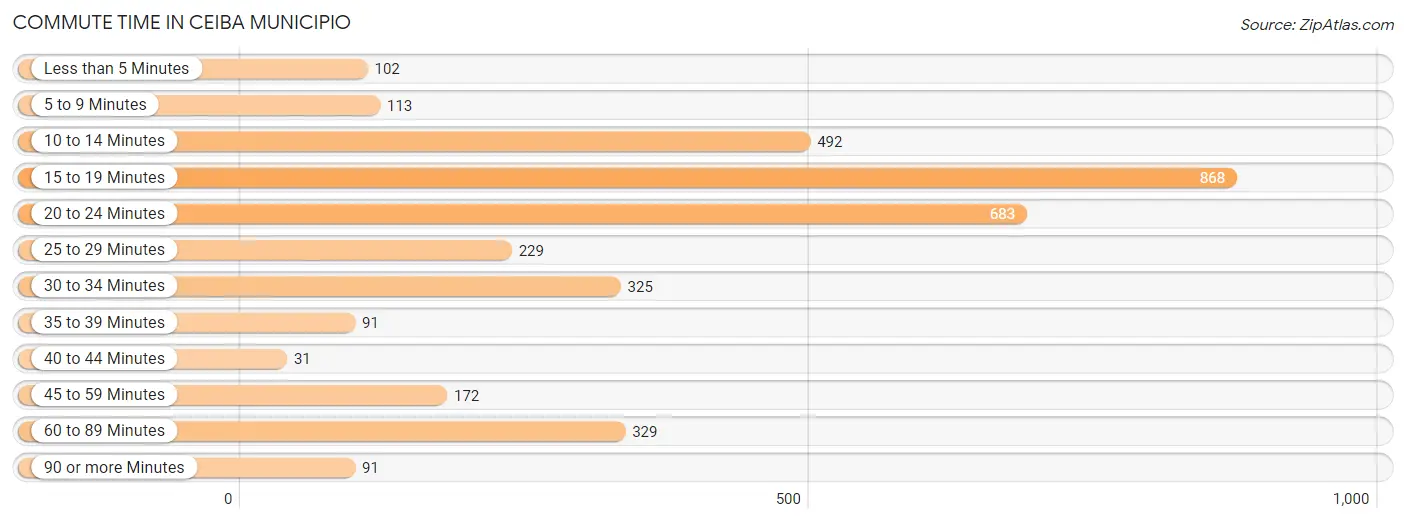
| Commute Time | # Commuters | % Commuters |
| Less than 5 Minutes | 102 | 2.9% |
| 5 to 9 Minutes | 113 | 3.2% |
| 10 to 14 Minutes | 492 | 14.0% |
| 15 to 19 Minutes | 868 | 24.6% |
| 20 to 24 Minutes | 683 | 19.4% |
| 25 to 29 Minutes | 229 | 6.5% |
| 30 to 34 Minutes | 325 | 9.2% |
| 35 to 39 Minutes | 91 | 2.6% |
| 40 to 44 Minutes | 31 | 0.9% |
| 45 to 59 Minutes | 172 | 4.9% |
| 60 to 89 Minutes | 329 | 9.3% |
| 90 or more Minutes | 91 | 2.6% |
Commute Time by Sex in Ceiba Municipio
The most common commute times in Ceiba Municipio are 15 to 19 minutes (494 commuters, 25.9%) for males and 20 to 24 minutes (410 commuters, 25.4%) for females.
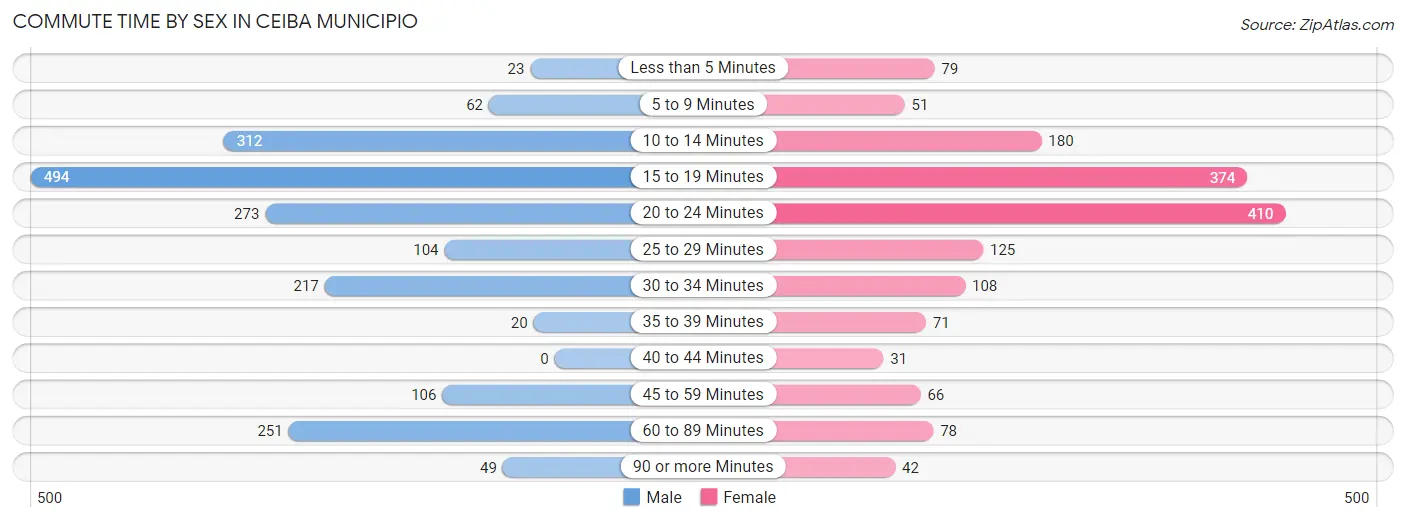
| Commute Time | Male | Female |
| Less than 5 Minutes | 23 (1.2%) | 79 (4.9%) |
| 5 to 9 Minutes | 62 (3.2%) | 51 (3.2%) |
| 10 to 14 Minutes | 312 (16.3%) | 180 (11.2%) |
| 15 to 19 Minutes | 494 (25.9%) | 374 (23.2%) |
| 20 to 24 Minutes | 273 (14.3%) | 410 (25.4%) |
| 25 to 29 Minutes | 104 (5.4%) | 125 (7.7%) |
| 30 to 34 Minutes | 217 (11.4%) | 108 (6.7%) |
| 35 to 39 Minutes | 20 (1.1%) | 71 (4.4%) |
| 40 to 44 Minutes | 0 (0.0%) | 31 (1.9%) |
| 45 to 59 Minutes | 106 (5.6%) | 66 (4.1%) |
| 60 to 89 Minutes | 251 (13.1%) | 78 (4.8%) |
| 90 or more Minutes | 49 (2.6%) | 42 (2.6%) |
Time of Departure to Work by Sex in Ceiba Municipio
The most frequent times of departure to work in Ceiba Municipio are 8:00 AM to 8:29 AM (266, 13.9%) for males and 7:00 AM to 7:29 AM (377, 23.3%) for females.
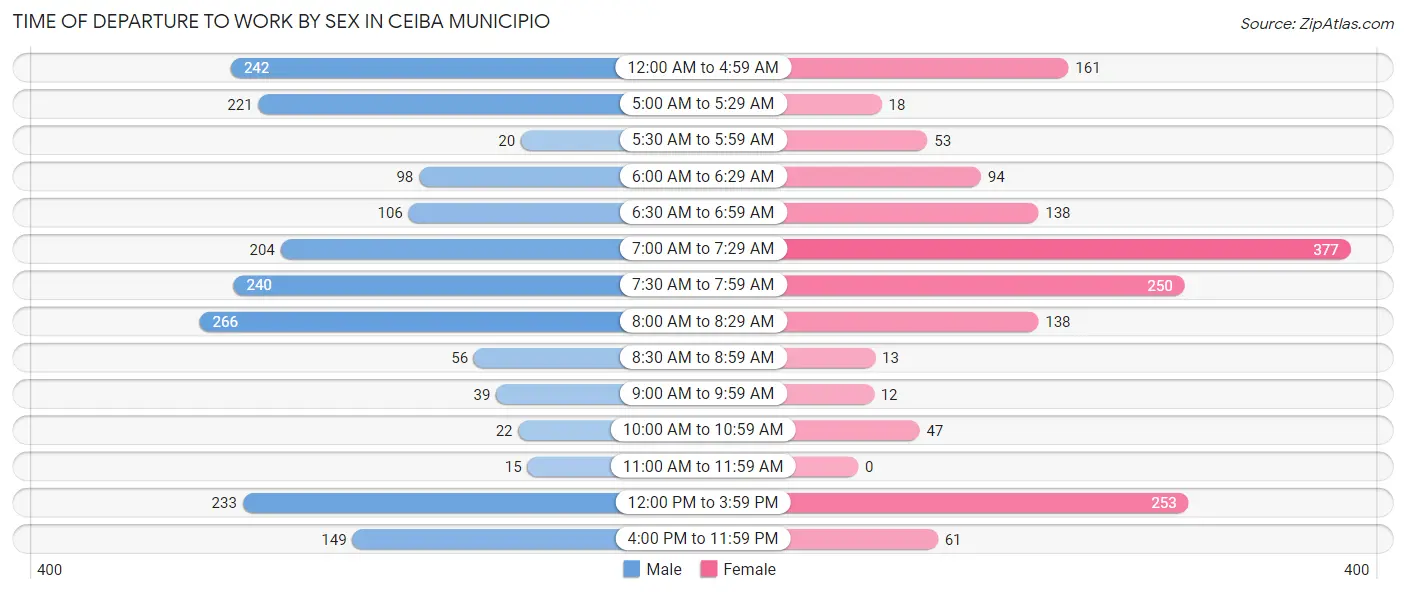
| Time of Departure | Male | Female |
| 12:00 AM to 4:59 AM | 242 (12.7%) | 161 (10.0%) |
| 5:00 AM to 5:29 AM | 221 (11.6%) | 18 (1.1%) |
| 5:30 AM to 5:59 AM | 20 (1.1%) | 53 (3.3%) |
| 6:00 AM to 6:29 AM | 98 (5.1%) | 94 (5.8%) |
| 6:30 AM to 6:59 AM | 106 (5.6%) | 138 (8.5%) |
| 7:00 AM to 7:29 AM | 204 (10.7%) | 377 (23.3%) |
| 7:30 AM to 7:59 AM | 240 (12.6%) | 250 (15.5%) |
| 8:00 AM to 8:29 AM | 266 (13.9%) | 138 (8.5%) |
| 8:30 AM to 8:59 AM | 56 (2.9%) | 13 (0.8%) |
| 9:00 AM to 9:59 AM | 39 (2.0%) | 12 (0.7%) |
| 10:00 AM to 10:59 AM | 22 (1.1%) | 47 (2.9%) |
| 11:00 AM to 11:59 AM | 15 (0.8%) | 0 (0.0%) |
| 12:00 PM to 3:59 PM | 233 (12.2%) | 253 (15.7%) |
| 4:00 PM to 11:59 PM | 149 (7.8%) | 61 (3.8%) |
| Total | 1,911 (100.0%) | 1,615 (100.0%) |
Housing Occupancy in Ceiba Municipio
Occupancy by Ownership in Ceiba Municipio
Of the total 4,238 dwellings in Ceiba Municipio, owner-occupied units account for 3,134 (74.0%), while renter-occupied units make up 1,104 (26.1%).
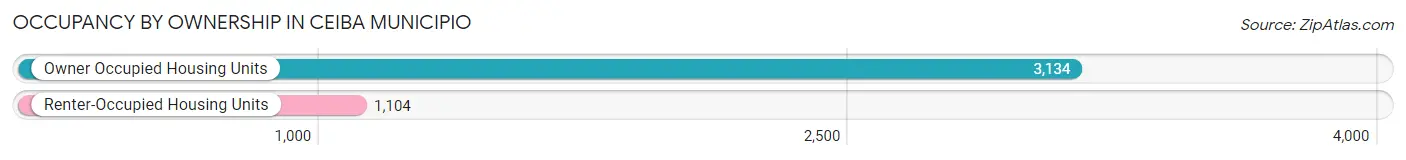
| Occupancy | # Housing Units | % Housing Units |
| Owner Occupied Housing Units | 3,134 | 74.0% |
| Renter-Occupied Housing Units | 1,104 | 26.1% |
| Total Occupied Housing Units | 4,238 | 100.0% |
Occupancy by Household Size in Ceiba Municipio
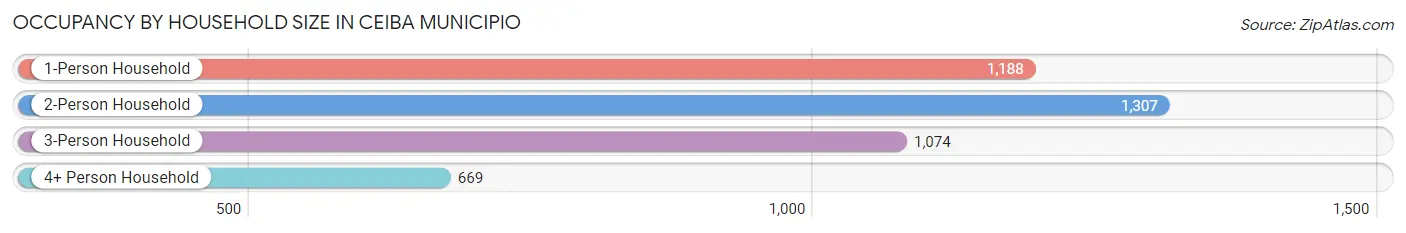
| Household Size | # Housing Units | % Housing Units |
| 1-Person Household | 1,188 | 28.0% |
| 2-Person Household | 1,307 | 30.8% |
| 3-Person Household | 1,074 | 25.3% |
| 4+ Person Household | 669 | 15.8% |
| Total Housing Units | 4,238 | 100.0% |
Occupancy by Ownership by Household Size in Ceiba Municipio
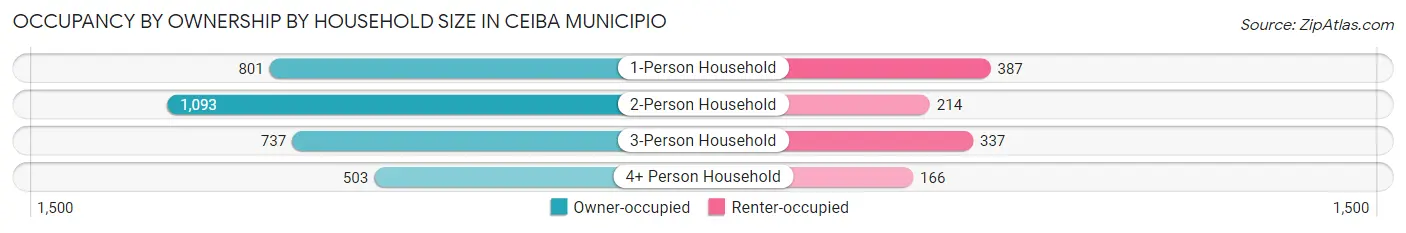
| Household Size | Owner-occupied | Renter-occupied |
| 1-Person Household | 801 (67.4%) | 387 (32.6%) |
| 2-Person Household | 1,093 (83.6%) | 214 (16.4%) |
| 3-Person Household | 737 (68.6%) | 337 (31.4%) |
| 4+ Person Household | 503 (75.2%) | 166 (24.8%) |
| Total Housing Units | 3,134 (74.0%) | 1,104 (26.1%) |
Occupancy by Educational Attainment in Ceiba Municipio
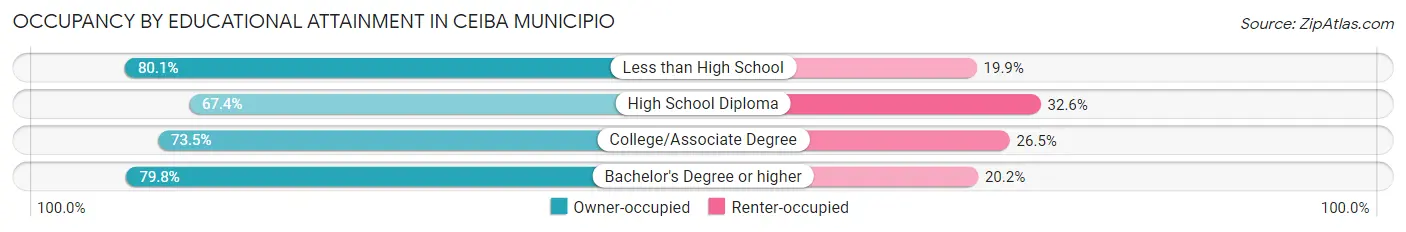
| Household Size | Owner-occupied | Renter-occupied |
| Less than High School | 720 (80.1%) | 179 (19.9%) |
| High School Diploma | 1,044 (67.4%) | 505 (32.6%) |
| College/Associate Degree | 686 (73.5%) | 247 (26.5%) |
| Bachelor's Degree or higher | 684 (79.8%) | 173 (20.2%) |
Occupancy by Age of Householder in Ceiba Municipio
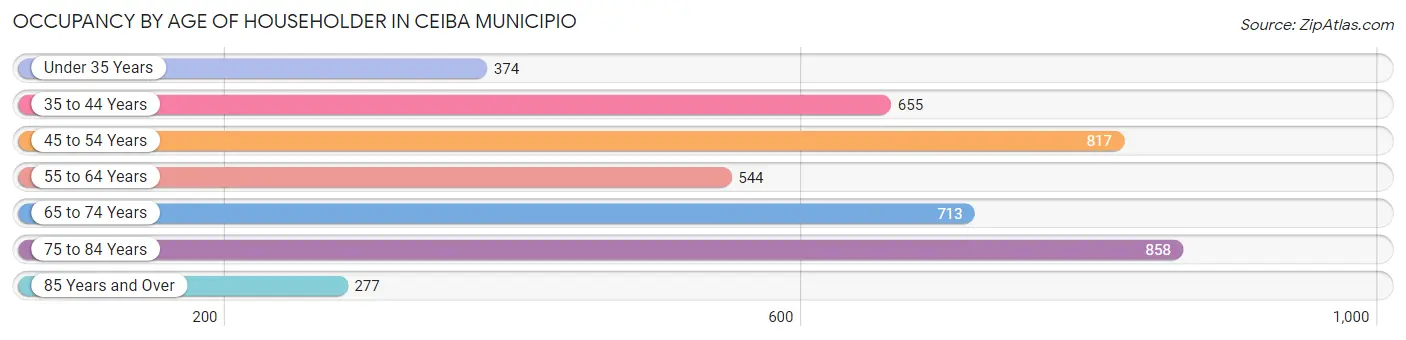
| Age Bracket | # Households | % Households |
| Under 35 Years | 374 | 8.8% |
| 35 to 44 Years | 655 | 15.5% |
| 45 to 54 Years | 817 | 19.3% |
| 55 to 64 Years | 544 | 12.8% |
| 65 to 74 Years | 713 | 16.8% |
| 75 to 84 Years | 858 | 20.3% |
| 85 Years and Over | 277 | 6.5% |
| Total | 4,238 | 100.0% |
Housing Finances in Ceiba Municipio
Median Income by Occupancy in Ceiba Municipio
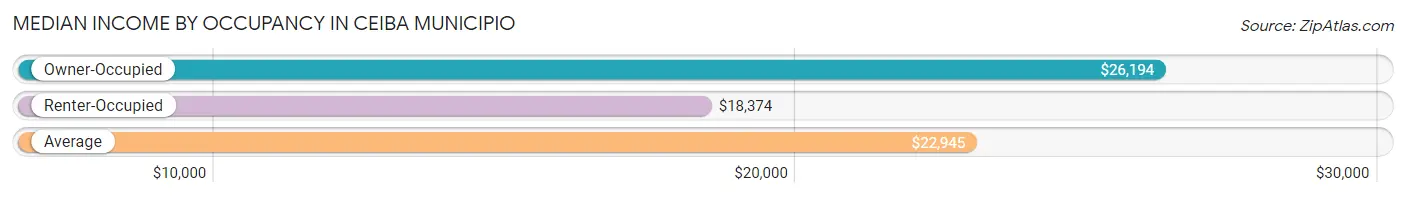
| Occupancy Type | # Households | Median Income |
| Owner-Occupied | 3,134 (74.0%) | $26,194 |
| Renter-Occupied | 1,104 (26.1%) | $18,374 |
| Average | 4,238 (100.0%) | $22,945 |
Occupancy by Householder Income Bracket in Ceiba Municipio
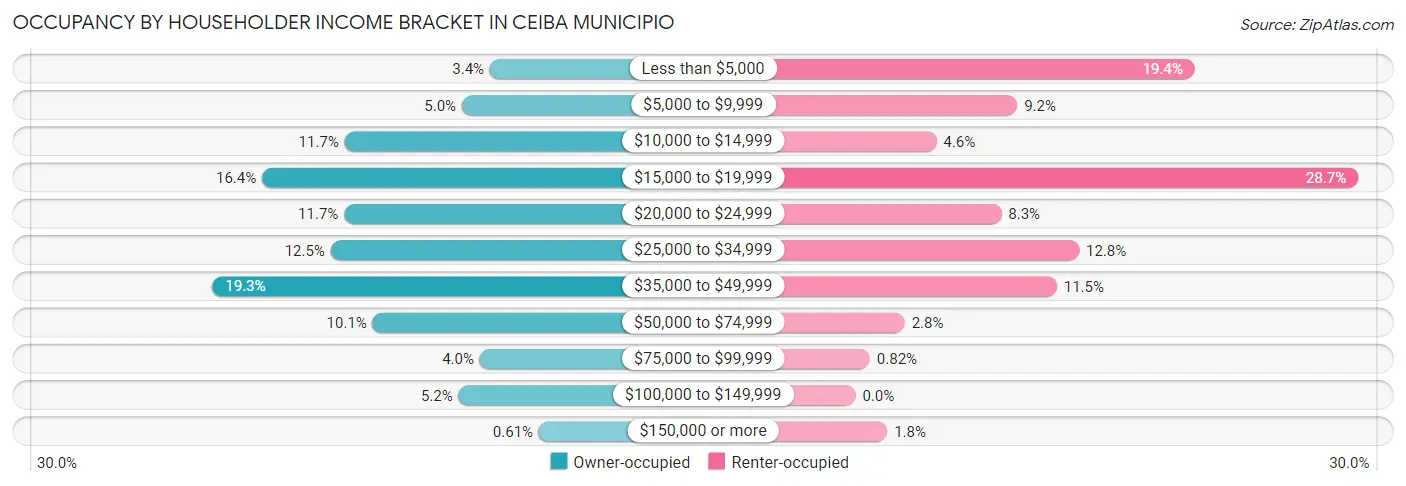
| Income Bracket | Owner-occupied | Renter-occupied |
| Less than $5,000 | 107 (3.4%) | 214 (19.4%) |
| $5,000 to $9,999 | 157 (5.0%) | 102 (9.2%) |
| $10,000 to $14,999 | 367 (11.7%) | 51 (4.6%) |
| $15,000 to $19,999 | 515 (16.4%) | 317 (28.7%) |
| $20,000 to $24,999 | 368 (11.7%) | 92 (8.3%) |
| $25,000 to $34,999 | 392 (12.5%) | 141 (12.8%) |
| $35,000 to $49,999 | 604 (19.3%) | 127 (11.5%) |
| $50,000 to $74,999 | 317 (10.1%) | 31 (2.8%) |
| $75,000 to $99,999 | 125 (4.0%) | 9 (0.8%) |
| $100,000 to $149,999 | 163 (5.2%) | 0 (0.0%) |
| $150,000 or more | 19 (0.6%) | 20 (1.8%) |
| Total | 3,134 (100.0%) | 1,104 (100.0%) |
Monthly Housing Cost Tiers in Ceiba Municipio
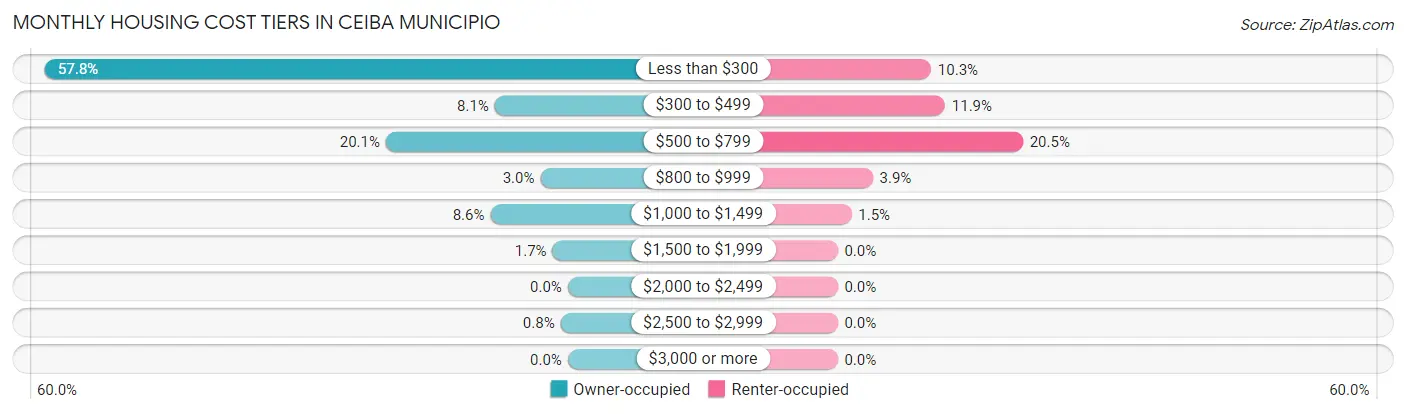
| Monthly Cost | Owner-occupied | Renter-occupied |
| Less than $300 | 1,810 (57.8%) | 114 (10.3%) |
| $300 to $499 | 253 (8.1%) | 131 (11.9%) |
| $500 to $799 | 630 (20.1%) | 226 (20.5%) |
| $800 to $999 | 95 (3.0%) | 43 (3.9%) |
| $1,000 to $1,499 | 268 (8.6%) | 17 (1.5%) |
| $1,500 to $1,999 | 53 (1.7%) | 0 (0.0%) |
| $2,000 to $2,499 | 0 (0.0%) | 0 (0.0%) |
| $2,500 to $2,999 | 25 (0.8%) | 0 (0.0%) |
| $3,000 or more | 0 (0.0%) | 0 (0.0%) |
| Total | 3,134 (100.0%) | 1,104 (100.0%) |
Physical Housing Characteristics in Ceiba Municipio
Housing Structures in Ceiba Municipio
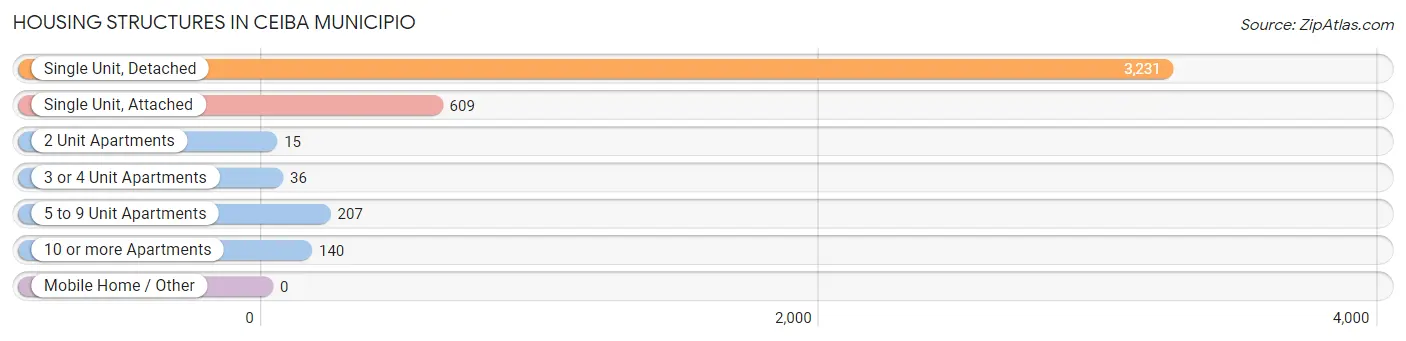
| Structure Type | # Housing Units | % Housing Units |
| Single Unit, Detached | 3,231 | 76.2% |
| Single Unit, Attached | 609 | 14.4% |
| 2 Unit Apartments | 15 | 0.4% |
| 3 or 4 Unit Apartments | 36 | 0.9% |
| 5 to 9 Unit Apartments | 207 | 4.9% |
| 10 or more Apartments | 140 | 3.3% |
| Mobile Home / Other | 0 | 0.0% |
| Total | 4,238 | 100.0% |
Housing Structures by Occupancy in Ceiba Municipio
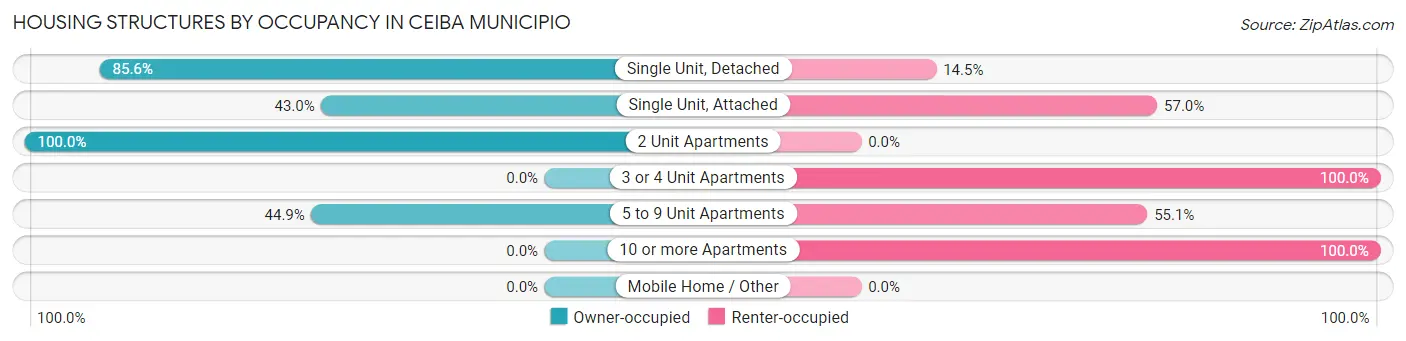
| Structure Type | Owner-occupied | Renter-occupied |
| Single Unit, Detached | 2,764 (85.6%) | 467 (14.4%) |
| Single Unit, Attached | 262 (43.0%) | 347 (57.0%) |
| 2 Unit Apartments | 15 (100.0%) | 0 (0.0%) |
| 3 or 4 Unit Apartments | 0 (0.0%) | 36 (100.0%) |
| 5 to 9 Unit Apartments | 93 (44.9%) | 114 (55.1%) |
| 10 or more Apartments | 0 (0.0%) | 140 (100.0%) |
| Mobile Home / Other | 0 (0.0%) | 0 (0.0%) |
| Total | 3,134 (74.0%) | 1,104 (26.1%) |
Housing Structures by Number of Rooms in Ceiba Municipio
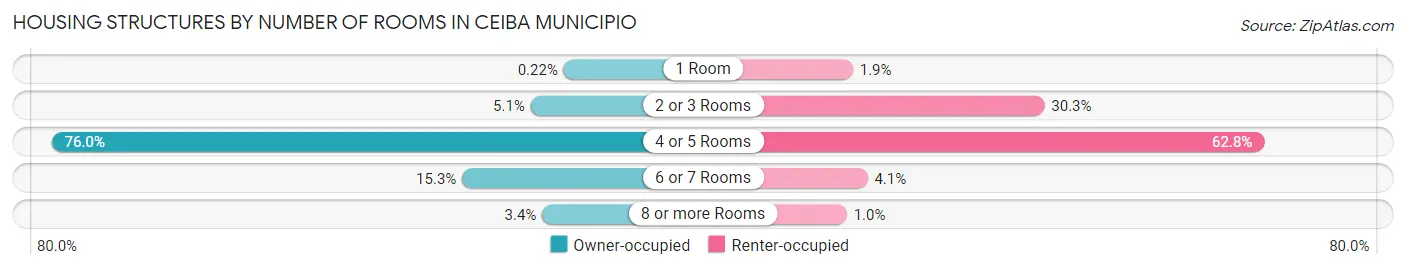
| Number of Rooms | Owner-occupied | Renter-occupied |
| 1 Room | 7 (0.2%) | 21 (1.9%) |
| 2 or 3 Rooms | 160 (5.1%) | 334 (30.2%) |
| 4 or 5 Rooms | 2,382 (76.0%) | 693 (62.8%) |
| 6 or 7 Rooms | 478 (15.2%) | 45 (4.1%) |
| 8 or more Rooms | 107 (3.4%) | 11 (1.0%) |
| Total | 3,134 (100.0%) | 1,104 (100.0%) |
Housing Structure by Heating Type in Ceiba Municipio
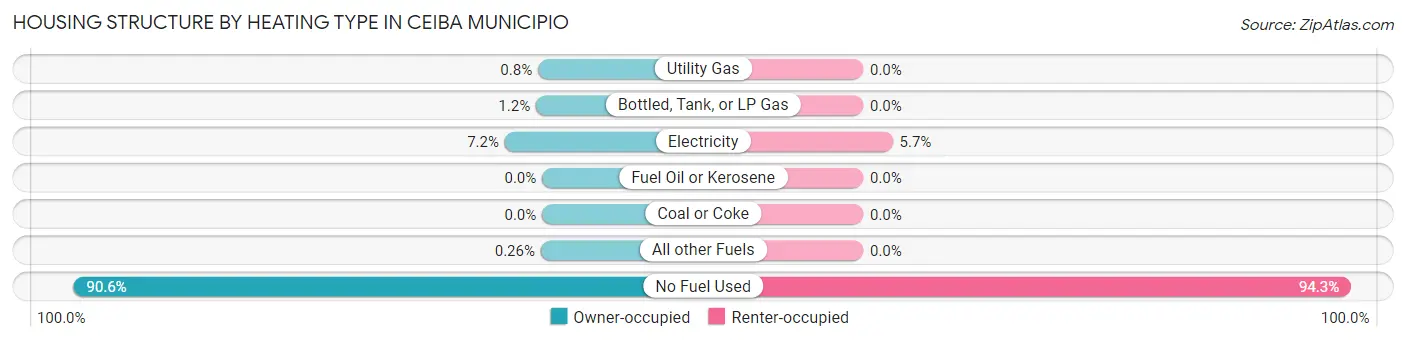
| Heating Type | Owner-occupied | Renter-occupied |
| Utility Gas | 25 (0.8%) | 0 (0.0%) |
| Bottled, Tank, or LP Gas | 37 (1.2%) | 0 (0.0%) |
| Electricity | 226 (7.2%) | 63 (5.7%) |
| Fuel Oil or Kerosene | 0 (0.0%) | 0 (0.0%) |
| Coal or Coke | 0 (0.0%) | 0 (0.0%) |
| All other Fuels | 8 (0.3%) | 0 (0.0%) |
| No Fuel Used | 2,838 (90.6%) | 1,041 (94.3%) |
| Total | 3,134 (100.0%) | 1,104 (100.0%) |
Household Vehicle Usage in Ceiba Municipio
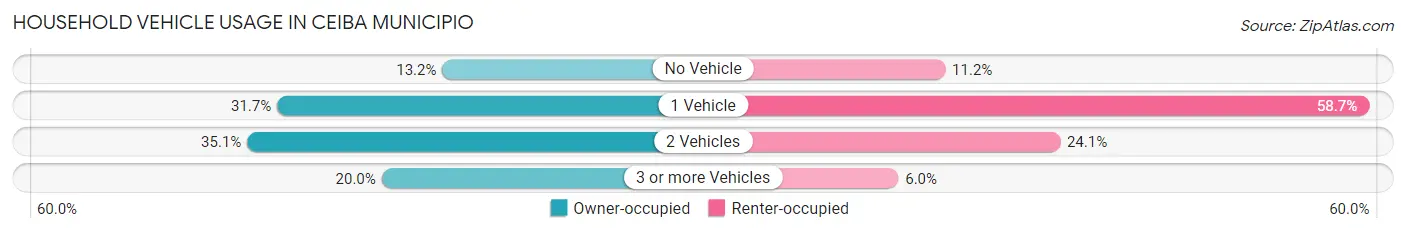
| Vehicles per Household | Owner-occupied | Renter-occupied |
| No Vehicle | 414 (13.2%) | 124 (11.2%) |
| 1 Vehicle | 994 (31.7%) | 648 (58.7%) |
| 2 Vehicles | 1,099 (35.1%) | 266 (24.1%) |
| 3 or more Vehicles | 627 (20.0%) | 66 (6.0%) |
| Total | 3,134 (100.0%) | 1,104 (100.0%) |
Real Estate & Mortgages in Ceiba Municipio
Real Estate and Mortgage Overview in Ceiba Municipio
| Characteristic | Without Mortgage | With Mortgage |
| Housing Units | 1,914 | 1,220 |
| Median Property Value | $104,900 | $105,100 |
| Median Household Income | $22,140 | $7 |
| Monthly Housing Costs | $156 | $0 |
| Real Estate Taxes | - | - |
Property Value by Mortgage Status in Ceiba Municipio
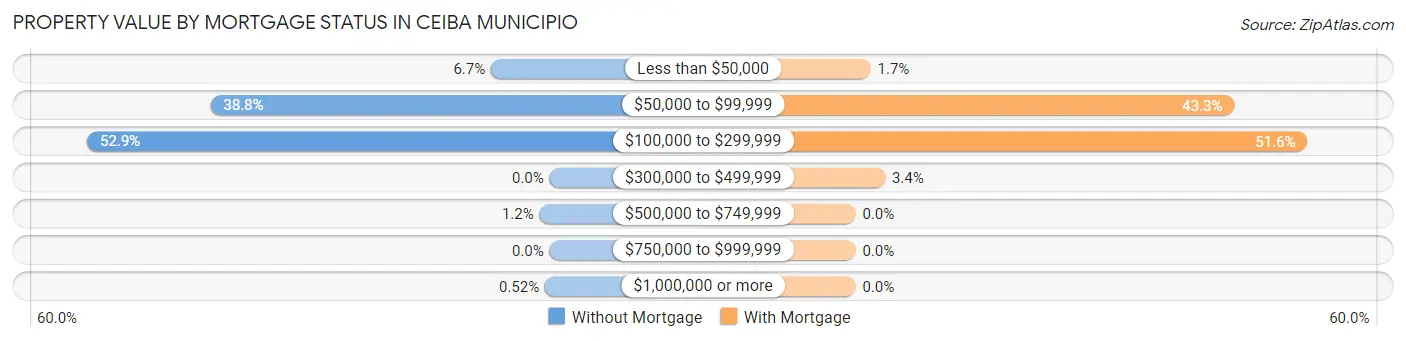
| Property Value | Without Mortgage | With Mortgage |
| Less than $50,000 | 128 (6.7%) | 21 (1.7%) |
| $50,000 to $99,999 | 742 (38.8%) | 528 (43.3%) |
| $100,000 to $299,999 | 1,012 (52.9%) | 630 (51.6%) |
| $300,000 to $499,999 | 0 (0.0%) | 41 (3.4%) |
| $500,000 to $749,999 | 22 (1.1%) | 0 (0.0%) |
| $750,000 to $999,999 | 0 (0.0%) | 0 (0.0%) |
| $1,000,000 or more | 10 (0.5%) | 0 (0.0%) |
| Total | 1,914 (100.0%) | 1,220 (100.0%) |
Household Income by Mortgage Status in Ceiba Municipio
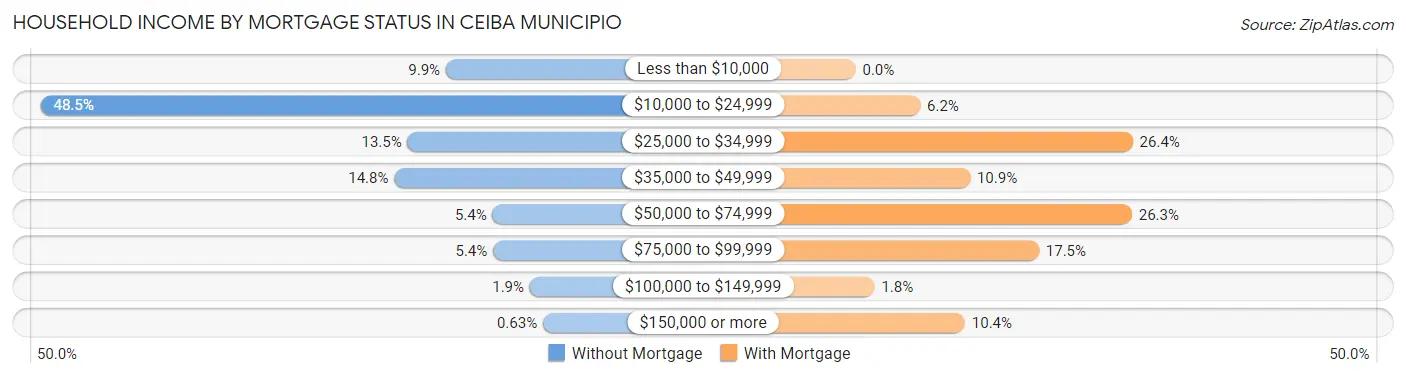
| Household Income | Without Mortgage | With Mortgage |
| Less than $10,000 | 189 (9.9%) | 0 (0.0%) |
| $10,000 to $24,999 | 928 (48.5%) | 75 (6.1%) |
| $25,000 to $34,999 | 259 (13.5%) | 322 (26.4%) |
| $35,000 to $49,999 | 283 (14.8%) | 133 (10.9%) |
| $50,000 to $74,999 | 104 (5.4%) | 321 (26.3%) |
| $75,000 to $99,999 | 103 (5.4%) | 213 (17.5%) |
| $100,000 to $149,999 | 36 (1.9%) | 22 (1.8%) |
| $150,000 or more | 12 (0.6%) | 127 (10.4%) |
| Total | 1,914 (100.0%) | 1,220 (100.0%) |
Property Value to Household Income Ratio in Ceiba Municipio
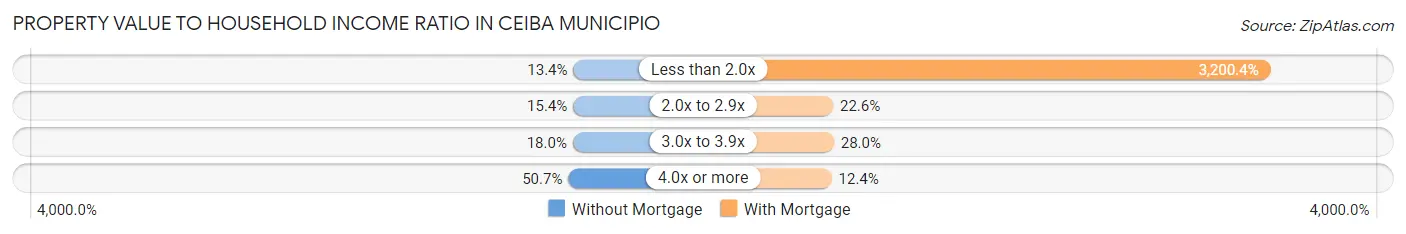
| Value-to-Income Ratio | Without Mortgage | With Mortgage |
| Less than 2.0x | 257 (13.4%) | 39,045 (3,200.4%) |
| 2.0x to 2.9x | 294 (15.4%) | 276 (22.6%) |
| 3.0x to 3.9x | 345 (18.0%) | 341 (28.0%) |
| 4.0x or more | 971 (50.7%) | 151 (12.4%) |
| Total | 1,914 (100.0%) | 1,220 (100.0%) |
Real Estate Taxes by Mortgage Status in Ceiba Municipio
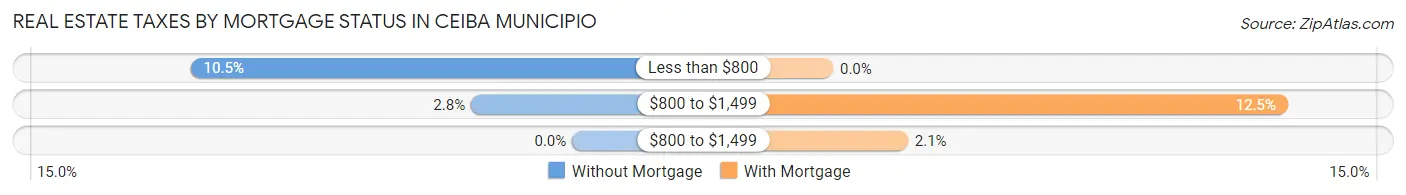
| Property Taxes | Without Mortgage | With Mortgage |
| Less than $800 | 200 (10.4%) | 0 (0.0%) |
| $800 to $1,499 | 53 (2.8%) | 152 (12.5%) |
| $800 to $1,499 | 0 (0.0%) | 25 (2.1%) |
| Total | 1,914 (100.0%) | 1,220 (100.0%) |
Health & Disability in Ceiba Municipio
Health Insurance Coverage by Age in Ceiba Municipio
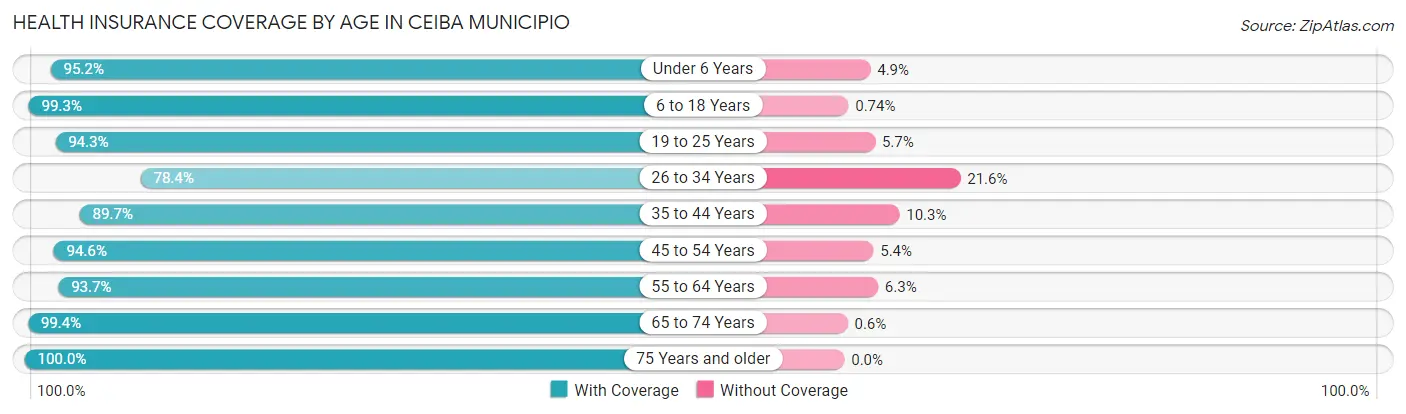
| Age Bracket | With Coverage | Without Coverage |
| Under 6 Years | 412 (95.2%) | 21 (4.9%) |
| 6 to 18 Years | 1,618 (99.3%) | 12 (0.7%) |
| 19 to 25 Years | 989 (94.3%) | 60 (5.7%) |
| 26 to 34 Years | 848 (78.4%) | 234 (21.6%) |
| 35 to 44 Years | 1,216 (89.7%) | 139 (10.3%) |
| 45 to 54 Years | 1,417 (94.6%) | 81 (5.4%) |
| 55 to 64 Years | 1,315 (93.7%) | 88 (6.3%) |
| 65 to 74 Years | 1,336 (99.4%) | 8 (0.6%) |
| 75 Years and older | 1,448 (100.0%) | 0 (0.0%) |
| Total | 10,599 (94.3%) | 643 (5.7%) |
Health Insurance Coverage by Citizenship Status in Ceiba Municipio
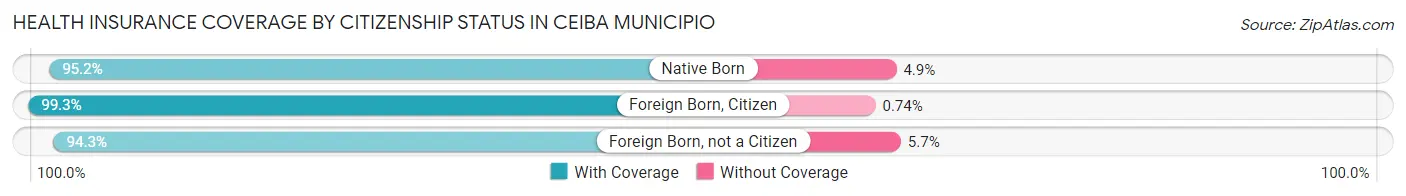
| Citizenship Status | With Coverage | Without Coverage |
| Native Born | 412 (95.2%) | 21 (4.9%) |
| Foreign Born, Citizen | 1,618 (99.3%) | 12 (0.7%) |
| Foreign Born, not a Citizen | 989 (94.3%) | 60 (5.7%) |
Health Insurance Coverage by Household Income in Ceiba Municipio
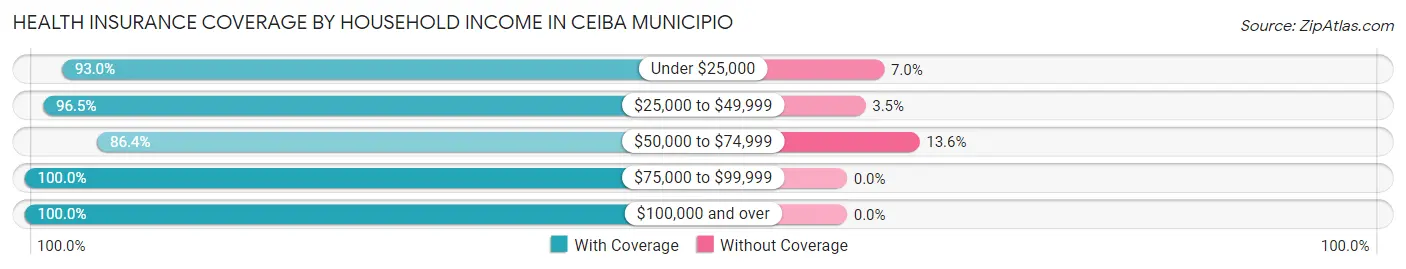
| Household Income | With Coverage | Without Coverage |
| Under $25,000 | 4,781 (93.0%) | 358 (7.0%) |
| $25,000 to $49,999 | 3,686 (96.5%) | 132 (3.5%) |
| $50,000 to $74,999 | 973 (86.4%) | 153 (13.6%) |
| $75,000 to $99,999 | 369 (100.0%) | 0 (0.0%) |
| $100,000 and over | 770 (100.0%) | 0 (0.0%) |
Public vs Private Health Insurance Coverage by Age in Ceiba Municipio
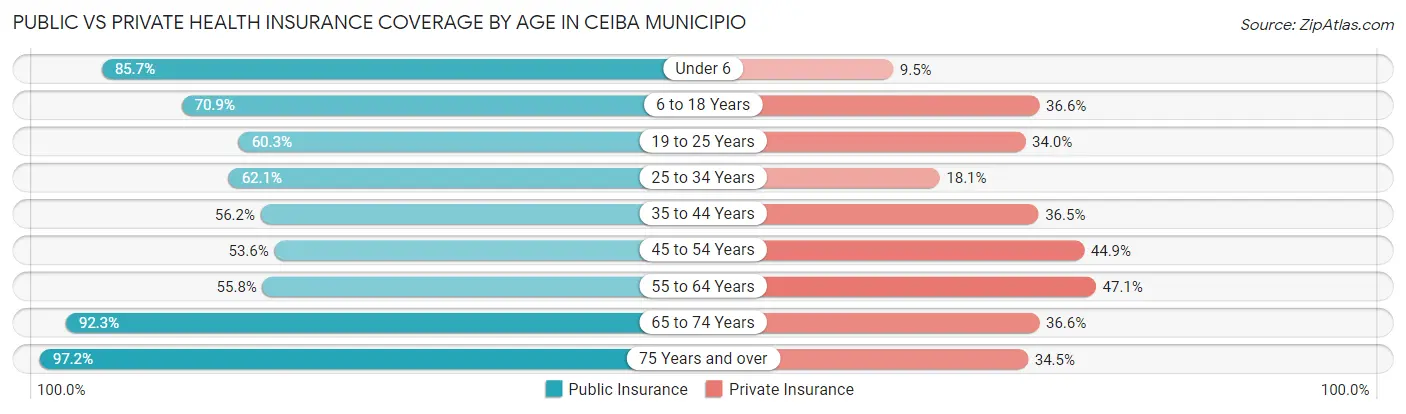
| Age Bracket | Public Insurance | Private Insurance |
| Under 6 | 371 (85.7%) | 41 (9.5%) |
| 6 to 18 Years | 1,155 (70.9%) | 597 (36.6%) |
| 19 to 25 Years | 632 (60.3%) | 357 (34.0%) |
| 25 to 34 Years | 672 (62.1%) | 196 (18.1%) |
| 35 to 44 Years | 761 (56.2%) | 494 (36.5%) |
| 45 to 54 Years | 803 (53.6%) | 673 (44.9%) |
| 55 to 64 Years | 783 (55.8%) | 661 (47.1%) |
| 65 to 74 Years | 1,241 (92.3%) | 492 (36.6%) |
| 75 Years and over | 1,407 (97.2%) | 500 (34.5%) |
| Total | 7,825 (69.6%) | 4,011 (35.7%) |
Disability Status by Sex by Age in Ceiba Municipio
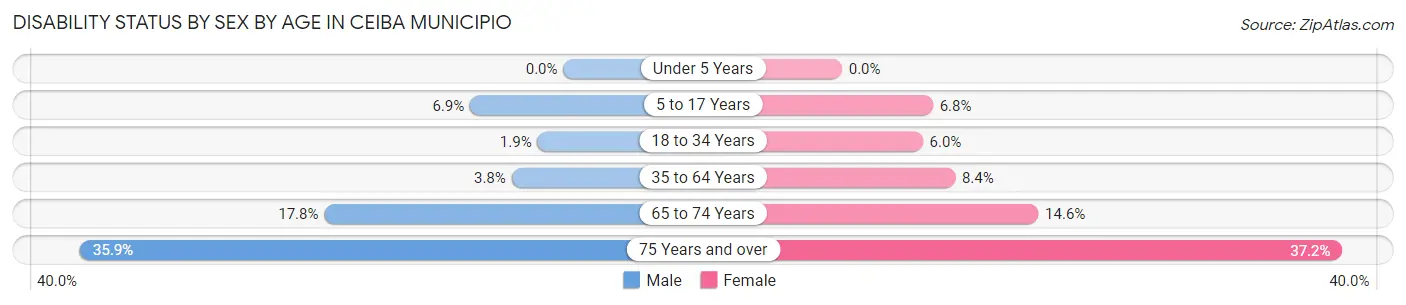
| Age Bracket | Male | Female |
| Under 5 Years | 0 (0.0%) | 0 (0.0%) |
| 5 to 17 Years | 52 (6.9%) | 50 (6.8%) |
| 18 to 34 Years | 24 (1.9%) | 68 (6.0%) |
| 35 to 64 Years | 72 (3.8%) | 200 (8.4%) |
| 65 to 74 Years | 101 (17.7%) | 113 (14.6%) |
| 75 Years and over | 229 (35.9%) | 301 (37.2%) |
Disability Class by Sex by Age in Ceiba Municipio
Disability Class: Hearing Difficulty
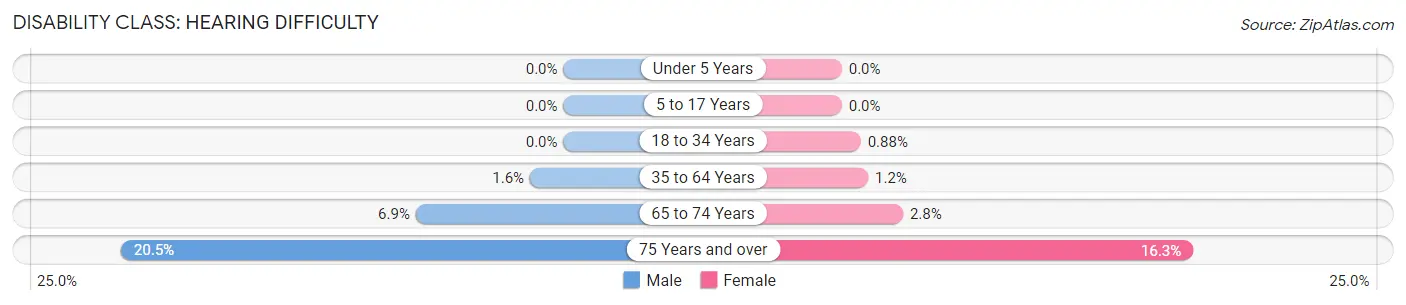
| Age Bracket | Male | Female |
| Under 5 Years | 0 (0.0%) | 0 (0.0%) |
| 5 to 17 Years | 0 (0.0%) | 0 (0.0%) |
| 18 to 34 Years | 0 (0.0%) | 10 (0.9%) |
| 35 to 64 Years | 29 (1.5%) | 29 (1.2%) |
| 65 to 74 Years | 39 (6.9%) | 22 (2.8%) |
| 75 Years and over | 131 (20.5%) | 132 (16.3%) |
Disability Class: Vision Difficulty
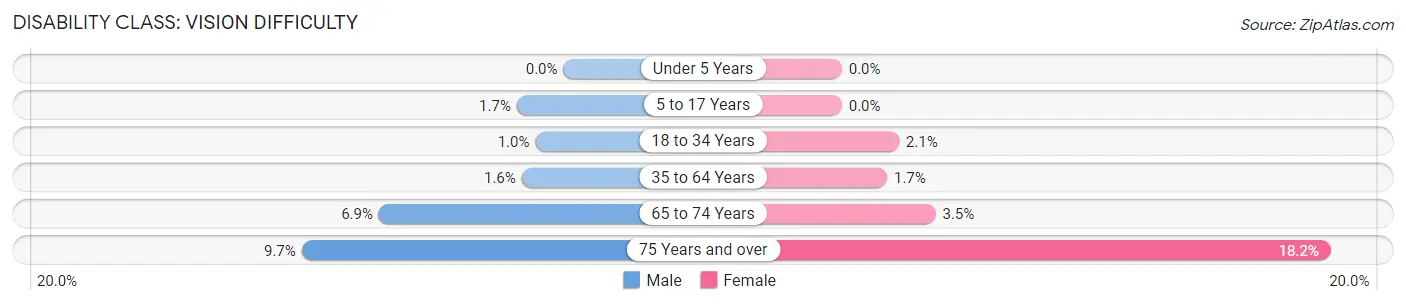
| Age Bracket | Male | Female |
| Under 5 Years | 0 (0.0%) | 0 (0.0%) |
| 5 to 17 Years | 13 (1.7%) | 0 (0.0%) |
| 18 to 34 Years | 13 (1.0%) | 24 (2.1%) |
| 35 to 64 Years | 29 (1.5%) | 40 (1.7%) |
| 65 to 74 Years | 39 (6.9%) | 27 (3.5%) |
| 75 Years and over | 62 (9.7%) | 147 (18.1%) |
Disability Class: Cognitive Difficulty
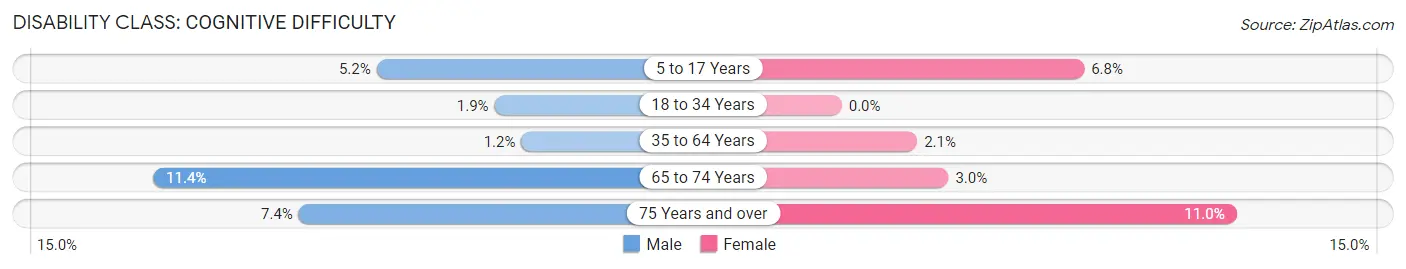
| Age Bracket | Male | Female |
| 5 to 17 Years | 39 (5.2%) | 50 (6.8%) |
| 18 to 34 Years | 24 (1.9%) | 0 (0.0%) |
| 35 to 64 Years | 22 (1.2%) | 50 (2.1%) |
| 65 to 74 Years | 65 (11.4%) | 23 (3.0%) |
| 75 Years and over | 47 (7.4%) | 89 (11.0%) |
Disability Class: Ambulatory Difficulty
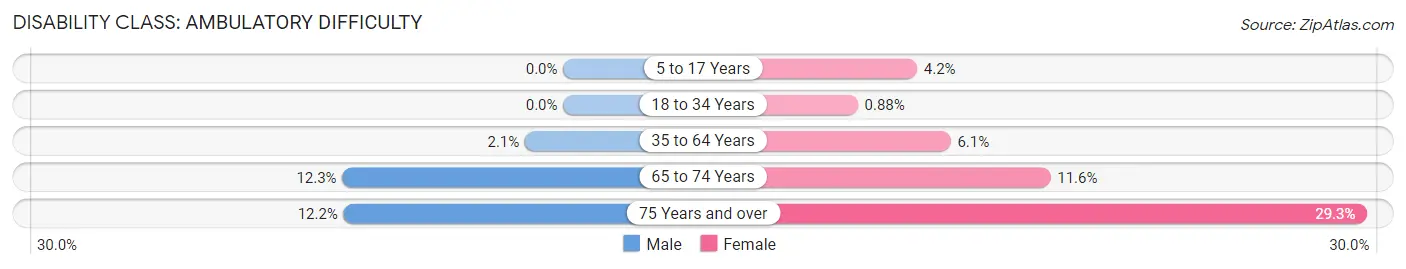
| Age Bracket | Male | Female |
| 5 to 17 Years | 0 (0.0%) | 31 (4.2%) |
| 18 to 34 Years | 0 (0.0%) | 10 (0.9%) |
| 35 to 64 Years | 40 (2.1%) | 144 (6.0%) |
| 65 to 74 Years | 70 (12.3%) | 90 (11.6%) |
| 75 Years and over | 78 (12.2%) | 237 (29.3%) |
Disability Class: Self-Care Difficulty
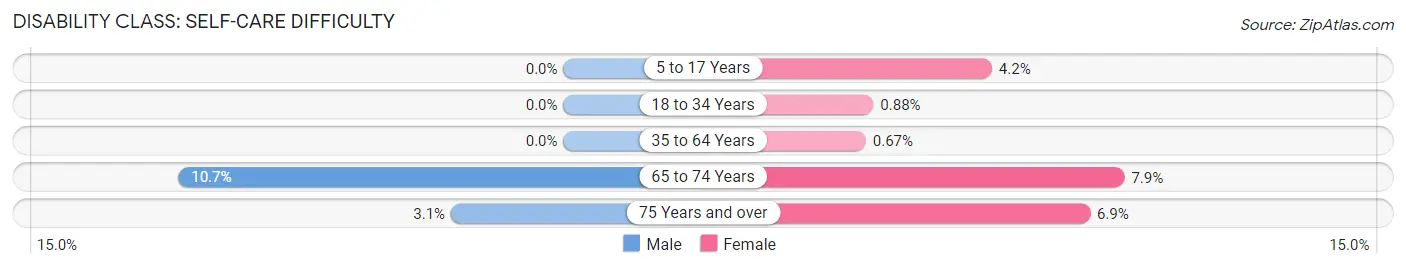
| Age Bracket | Male | Female |
| 5 to 17 Years | 0 (0.0%) | 31 (4.2%) |
| 18 to 34 Years | 0 (0.0%) | 10 (0.9%) |
| 35 to 64 Years | 0 (0.0%) | 16 (0.7%) |
| 65 to 74 Years | 61 (10.7%) | 61 (7.9%) |
| 75 Years and over | 20 (3.1%) | 56 (6.9%) |
Technology Access in Ceiba Municipio
Computing Device Access in Ceiba Municipio
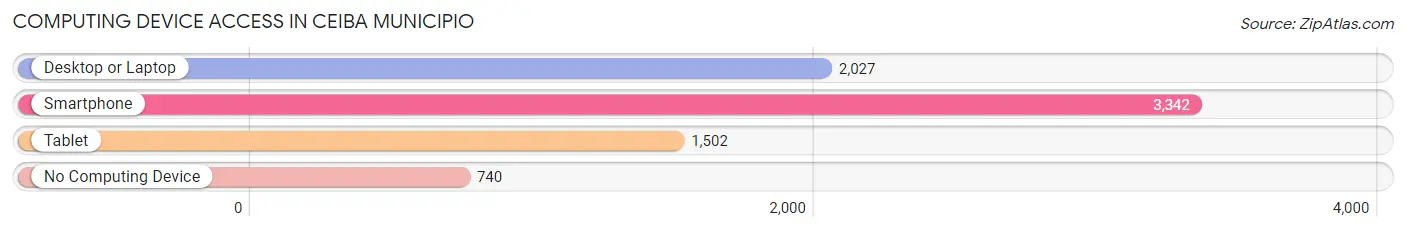
| Device Type | # Households | % Households |
| Desktop or Laptop | 2,027 | 47.8% |
| Smartphone | 3,342 | 78.9% |
| Tablet | 1,502 | 35.4% |
| No Computing Device | 740 | 17.5% |
| Total | 4,238 | 100.0% |
Internet Access in Ceiba Municipio
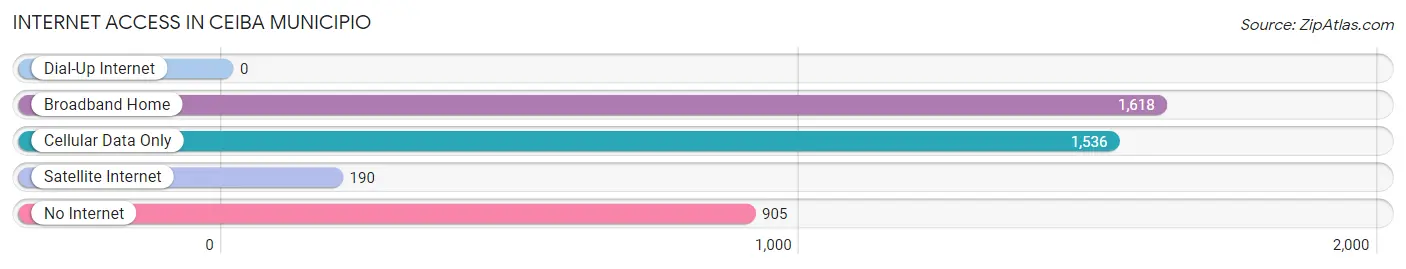
| Internet Type | # Households | % Households |
| Dial-Up Internet | 0 | 0.0% |
| Broadband Home | 1,618 | 38.2% |
| Cellular Data Only | 1,536 | 36.2% |
| Satellite Internet | 190 | 4.5% |
| No Internet | 905 | 21.3% |
| Total | 4,238 | 100.0% |
Ceiba Municipio Summary
Ceiba Municipio is a municipality located in the eastern part of Puerto Rico. It is part of the Fajardo Metropolitan Statistical Area. The municipality is located on the eastern coast of the island, bordered by the Atlantic Ocean to the north, the municipality of Naguabo to the south, the municipality of Fajardo to the west, and the municipality of Vieques to the east. As of the 2010 census, the population of Ceiba was 13,841.
Geography
Ceiba Municipio is located in the eastern part of Puerto Rico, on the eastern coast of the island. It is bordered by the Atlantic Ocean to the north, the municipality of Naguabo to the south, the municipality of Fajardo to the west, and the municipality of Vieques to the east. The municipality covers an area of approximately 33.5 square miles (86.7 km2). The terrain is mostly flat, with some hills in the northern part of the municipality. The highest point in the municipality is Cerro La Santa, which has an elevation of 1,067 feet (325 m).
The climate in Ceiba Municipio is tropical, with temperatures ranging from an average low of 73°F (23°C) in the winter to an average high of 88°F (31°C) in the summer. The average annual precipitation is approximately 64 inches (1,620 mm).
Economy
The economy of Ceiba Municipio is largely based on tourism and agriculture. The municipality is home to several resorts and hotels, as well as a number of restaurants and other tourist attractions. Agriculture is also an important part of the economy, with the main crops being bananas, plantains, and coconuts. Fishing is also an important part of the economy, with the main catches being snapper, grouper, and mackerel.
Demographics
As of the 2010 census, the population of Ceiba Municipio was 13,841. The population is predominantly of Hispanic or Latino origin, with approximately 95% of the population identifying as such. The remaining 5% of the population is made up of other ethnicities, including African, Asian, and Native American. The median age of the population is 38.5 years, with approximately 50% of the population under the age of 18.
The median household income in Ceiba Municipio is $20,845, which is significantly lower than the median household income for Puerto Rico as a whole ($21,624). The unemployment rate in the municipality is also higher than the national average, at 11.2% compared to 8.7%.
Conclusion
Ceiba Municipio is a municipality located in the eastern part of Puerto Rico. It is part of the Fajardo Metropolitan Statistical Area and is bordered by the Atlantic Ocean to the north, the municipality of Naguabo to the south, the municipality of Fajardo to the west, and the municipality of Vieques to the east. The population of Ceiba Municipio is predominantly of Hispanic or Latino origin, with the median age of the population being 38.5 years. The economy of the municipality is largely based on tourism and agriculture, with fishing also being an important part of the economy. The median household income in Ceiba Municipio is significantly lower than the median household income for Puerto Rico as a whole, and the unemployment rate is also higher than the national average.
Common Questions
What is Per Capita Income in Ceiba Municipio?
Per Capita income in Ceiba Municipio is $14,198.
What is the Median Family Income in Ceiba Municipio?
Median Family Income in Ceiba Municipio is $28,013.
What is the Median Household income in Ceiba Municipio?
Median Household Income in Ceiba Municipio is $22,945.
What is Income or Wage Gap in Ceiba Municipio?
Income or Wage Gap in Ceiba Municipio is 7.4%.
Women in Ceiba Municipio earn 92.6 cents for every dollar earned by a man.
What is Family Income Deficit in Ceiba Municipio?
Family Income Deficit in Ceiba Municipio is $8,879.
Families that are below poverty line in Ceiba Municipio earn $8,879 less on average than the poverty threshold level.
What is Inequality or Gini Index in Ceiba Municipio?
Inequality or Gini Index in Ceiba Municipio is 0.45.
What is the Total Population of Ceiba Municipio?
Total Population of Ceiba Municipio is 11,256.
What is the Total Male Population of Ceiba Municipio?
Total Male Population of Ceiba Municipio is 5,336.
What is the Total Female Population of Ceiba Municipio?
Total Female Population of Ceiba Municipio is 5,920.
What is the Ratio of Males per 100 Females in Ceiba Municipio?
There are 90.14 Males per 100 Females in Ceiba Municipio.
What is the Ratio of Females per 100 Males in Ceiba Municipio?
There are 110.94 Females per 100 Males in Ceiba Municipio.
What is the Median Population Age in Ceiba Municipio?
Median Population Age in Ceiba Municipio is 45.6 Years.
What is the Average Family Size in Ceiba Municipio
Average Family Size in Ceiba Municipio is 3.2 People.
What is the Average Household Size in Ceiba Municipio
Average Household Size in Ceiba Municipio is 2.6 People.
How Large is the Labor Force in Ceiba Municipio?
There are 4,137 People in the Labor Forcein in Ceiba Municipio.
What is the Percentage of People in the Labor Force in Ceiba Municipio?
43.1% of People are in the Labor Force in Ceiba Municipio.
What is the Unemployment Rate in Ceiba Municipio?
Unemployment Rate in Ceiba Municipio is 11.2%.