Cayey Municipio, PR Map & Demographics
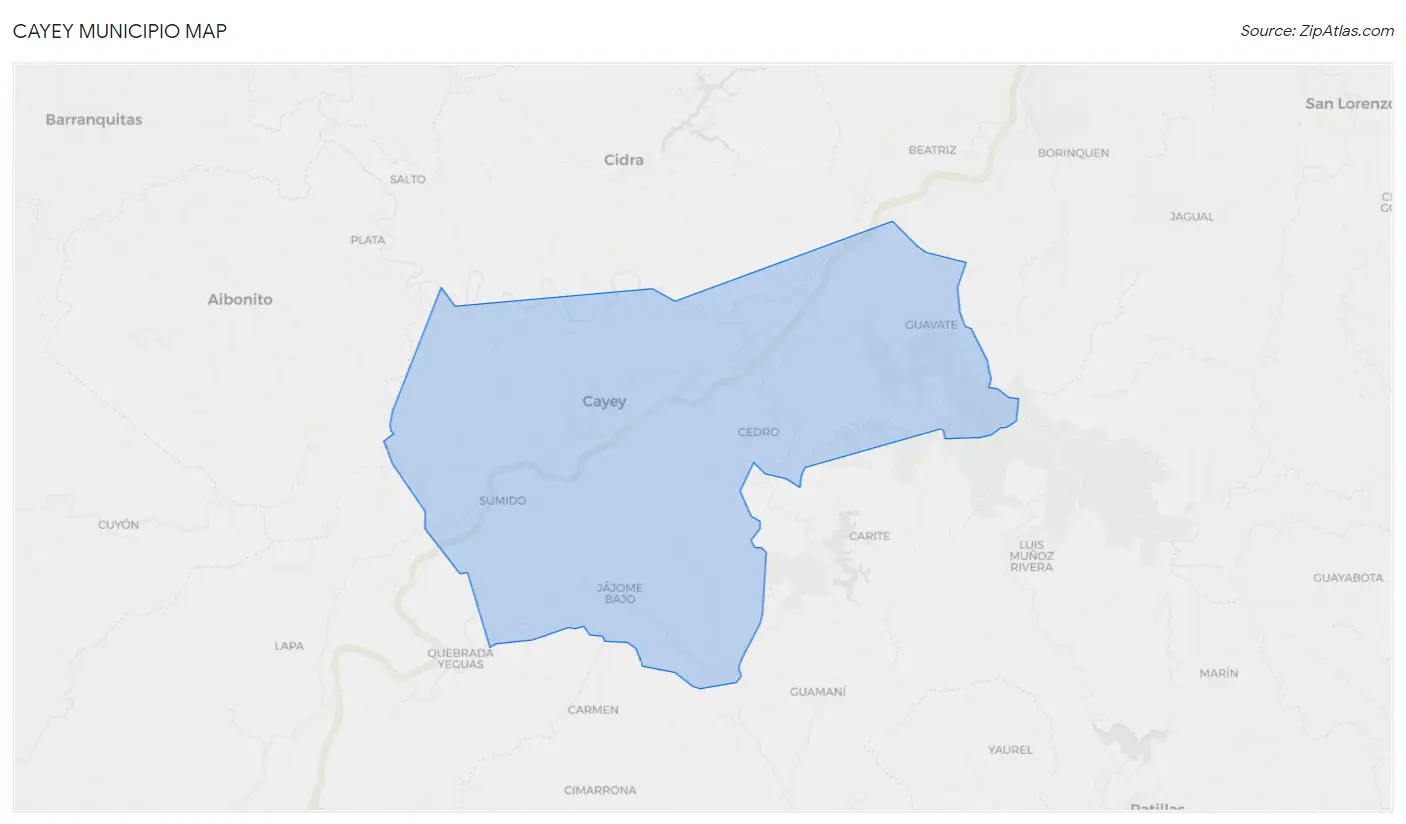
Cayey Municipio Map
Cayey Municipio Overview
$16,510
PER CAPITA INCOME
$32,299
AVG FAMILY INCOME
$26,704
AVG HOUSEHOLD INCOME
6.6%
WAGE / INCOME GAP [ % ]
93.4¢/ $1
WAGE / INCOME GAP [ $ ]
$10,152
FAMILY INCOME DEFICIT
0.51
INEQUALITY / GINI INDEX
41,509
TOTAL POPULATION
19,849
MALE POPULATION
21,660
FEMALE POPULATION
91.64
MALES / 100 FEMALES
109.12
FEMALES / 100 MALES
44.6
MEDIAN AGE
3.1
AVG FAMILY SIZE
2.6
AVG HOUSEHOLD SIZE
14,894
LABOR FORCE [ PEOPLE ]
41.7%
PERCENT IN LABOR FORCE
6.7%
UNEMPLOYMENT RATE
Income in Cayey Municipio
Income Overview in Cayey Municipio
Per Capita Income in Cayey Municipio is $16,510, while median incomes of families and households are $32,299 and $26,704 respectively.
| Characteristic | Number | Measure |
| Per Capita Income | 41,509 | $16,510 |
| Median Family Income | 10,612 | $32,299 |
| Mean Family Income | 10,612 | $45,618 |
| Median Household Income | 16,151 | $26,704 |
| Mean Household Income | 16,151 | $39,051 |
| Income Deficit | 10,612 | $10,152 |
| Wage / Income Gap (%) | 41,509 | 6.58% |
| Wage / Income Gap ($) | 41,509 | 93.42¢ per $1 |
| Gini / Inequality Index | 41,509 | 0.51 |
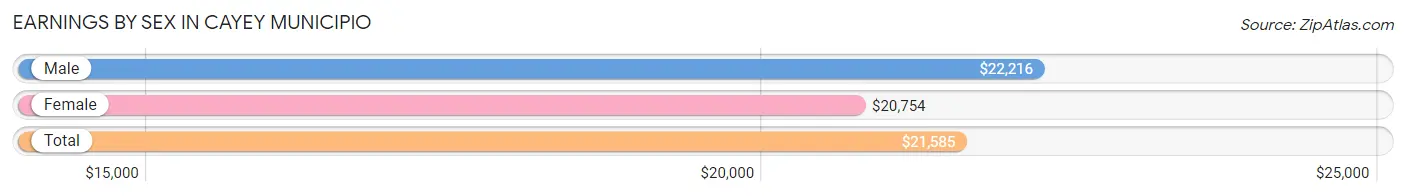
Earnings by Sex in Cayey Municipio
Average Earnings in Cayey Municipio are $21,585, $22,216 for men and $20,754 for women, a difference of 6.6%.
| Sex | Number | Average Earnings |
| Male | 7,692 (49.7%) | $22,216 |
| Female | 7,778 (50.3%) | $20,754 |
| Total | 15,470 (100.0%) | $21,585 |
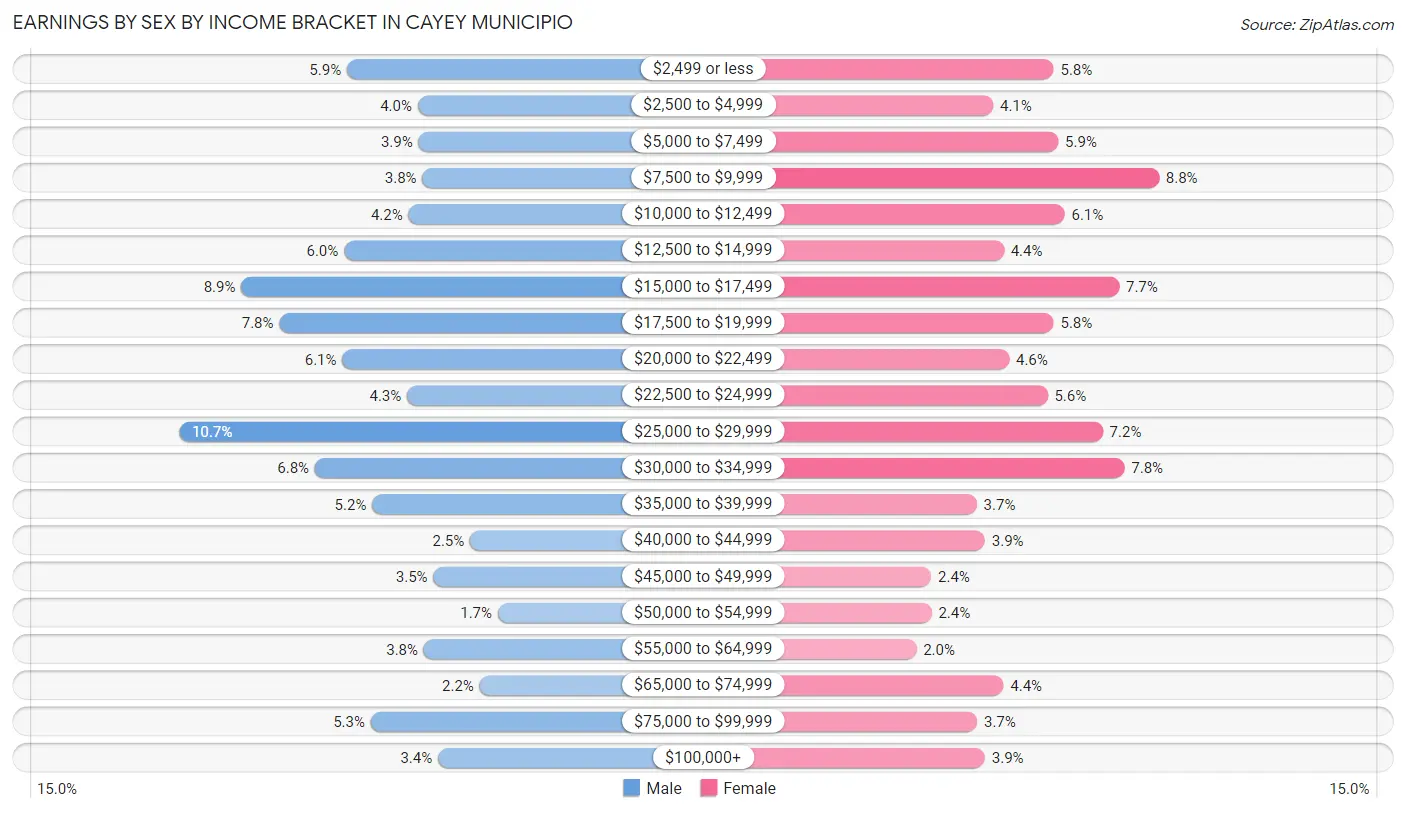
Earnings by Sex by Income Bracket in Cayey Municipio
The most common earnings brackets in Cayey Municipio are $25,000 to $29,999 for men (820 | 10.7%) and $7,500 to $9,999 for women (682 | 8.8%).
| Income | Male | Female |
| $2,499 or less | 457 (5.9%) | 452 (5.8%) |
| $2,500 to $4,999 | 304 (4.0%) | 320 (4.1%) |
| $5,000 to $7,499 | 302 (3.9%) | 462 (5.9%) |
| $7,500 to $9,999 | 294 (3.8%) | 682 (8.8%) |
| $10,000 to $12,499 | 324 (4.2%) | 476 (6.1%) |
| $12,500 to $14,999 | 463 (6.0%) | 343 (4.4%) |
| $15,000 to $17,499 | 685 (8.9%) | 595 (7.6%) |
| $17,500 to $19,999 | 603 (7.8%) | 452 (5.8%) |
| $20,000 to $22,499 | 467 (6.1%) | 355 (4.6%) |
| $22,500 to $24,999 | 327 (4.3%) | 439 (5.6%) |
| $25,000 to $29,999 | 820 (10.7%) | 559 (7.2%) |
| $30,000 to $34,999 | 526 (6.8%) | 607 (7.8%) |
| $35,000 to $39,999 | 402 (5.2%) | 284 (3.6%) |
| $40,000 to $44,999 | 191 (2.5%) | 302 (3.9%) |
| $45,000 to $49,999 | 270 (3.5%) | 184 (2.4%) |
| $50,000 to $54,999 | 131 (1.7%) | 185 (2.4%) |
| $55,000 to $64,999 | 291 (3.8%) | 152 (1.9%) |
| $65,000 to $74,999 | 170 (2.2%) | 342 (4.4%) |
| $75,000 to $99,999 | 405 (5.3%) | 285 (3.7%) |
| $100,000+ | 260 (3.4%) | 302 (3.9%) |
| Total | 7,692 (100.0%) | 7,778 (100.0%) |
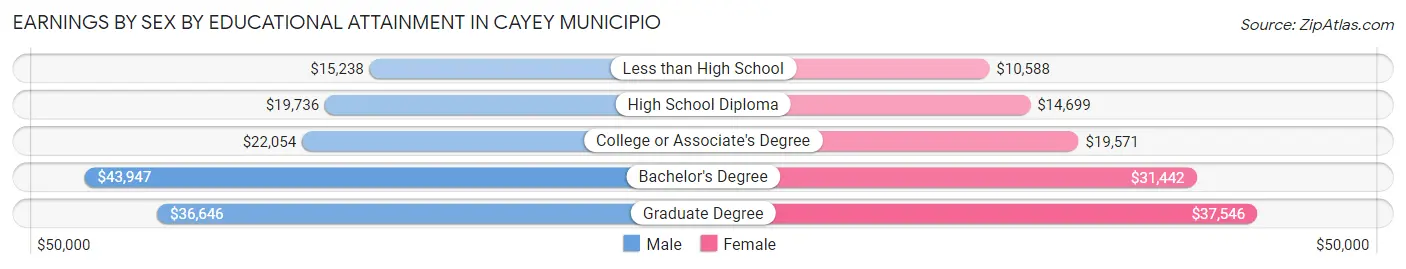
Earnings by Sex by Educational Attainment in Cayey Municipio
Average earnings in Cayey Municipio are $24,350 for men and $23,121 for women, a difference of 5.1%. Men with an educational attainment of bachelor's degree enjoy the highest average annual earnings of $43,947, while those with less than high school education earn the least with $15,238. Women with an educational attainment of graduate degree earn the most with the average annual earnings of $37,546, while those with less than high school education have the smallest earnings of $10,588.
| Educational Attainment | Male Income | Female Income |
| Less than High School | $15,238 | $10,588 |
| High School Diploma | $19,736 | $14,699 |
| College or Associate's Degree | $22,054 | $19,571 |
| Bachelor's Degree | $43,947 | $31,442 |
| Graduate Degree | $36,646 | $37,546 |
| Total | $24,350 | $23,121 |
Family Income in Cayey Municipio
Family Income Brackets in Cayey Municipio
According to the Cayey Municipio family income data, there are 1,868 families falling into the $25,000 to $34,999 income range, which is the most common income bracket and makes up 17.6% of all families. Conversely, the $150,000 to $199,999 income bracket is the least frequent group with only 170 families (1.6%) belonging to this category.
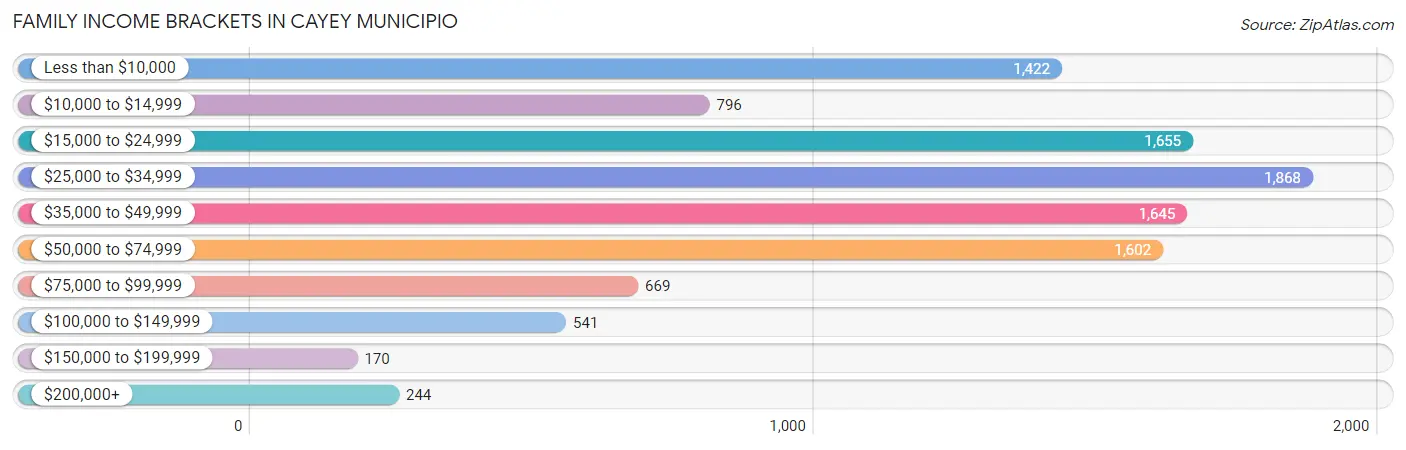
| Income Bracket | # Families | % Families |
| Less than $10,000 | 1,422 | 13.4% |
| $10,000 to $14,999 | 796 | 7.5% |
| $15,000 to $24,999 | 1,655 | 15.6% |
| $25,000 to $34,999 | 1,868 | 17.6% |
| $35,000 to $49,999 | 1,645 | 15.5% |
| $50,000 to $74,999 | 1,602 | 15.1% |
| $75,000 to $99,999 | 669 | 6.3% |
| $100,000 to $149,999 | 541 | 5.1% |
| $150,000 to $199,999 | 170 | 1.6% |
| $200,000+ | 244 | 2.3% |
Family Income by Famaliy Size in Cayey Municipio
4-person families (1,691 | 15.9%) account for the highest median family income in Cayey Municipio with $39,263 per family, while 2-person families (5,352 | 50.4%) have the highest median income of $14,896 per family member.
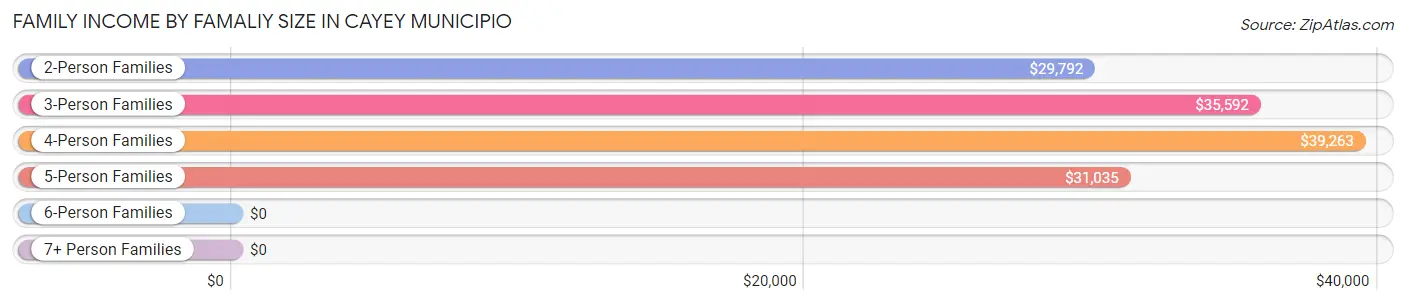
| Income Bracket | # Families | Median Income |
| 2-Person Families | 5,352 (50.4%) | $29,792 |
| 3-Person Families | 3,069 (28.9%) | $35,592 |
| 4-Person Families | 1,691 (15.9%) | $39,263 |
| 5-Person Families | 413 (3.9%) | $31,035 |
| 6-Person Families | 77 (0.7%) | $0 |
| 7+ Person Families | 10 (0.1%) | $0 |
| Total | 10,612 (100.0%) | $32,299 |
Family Income by Number of Earners in Cayey Municipio
The median family income in Cayey Municipio is $32,299, with families comprising 3+ earners (349) having the highest median family income of $61,513, while families with no earners (3,379) have the lowest median family income of $20,560, accounting for 3.3% and 31.8% of families, respectively.
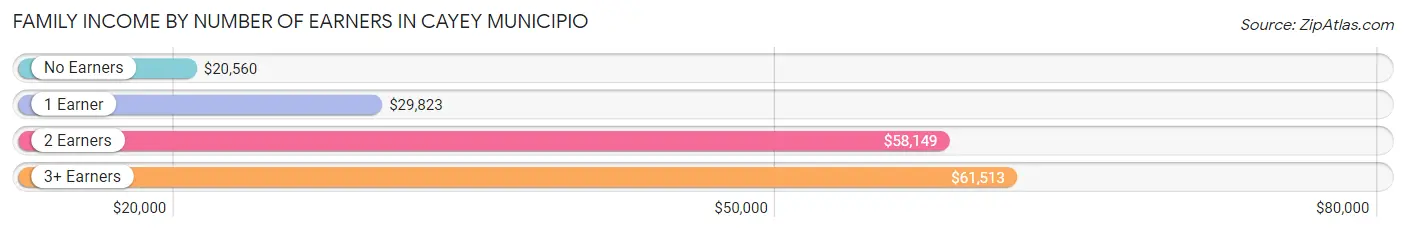
| Number of Earners | # Families | Median Income |
| No Earners | 3,379 (31.8%) | $20,560 |
| 1 Earner | 4,483 (42.2%) | $29,823 |
| 2 Earners | 2,401 (22.6%) | $58,149 |
| 3+ Earners | 349 (3.3%) | $61,513 |
| Total | 10,612 (100.0%) | $32,299 |
Household Income in Cayey Municipio
Household Income Brackets in Cayey Municipio
With 3,295 households falling in the category, the less than $10,000 income range is the most frequent in Cayey Municipio, accounting for 20.4% of all households. In contrast, only 178 households (1.1%) fall into the $150,000 to $199,999 income bracket, making it the least populous group.
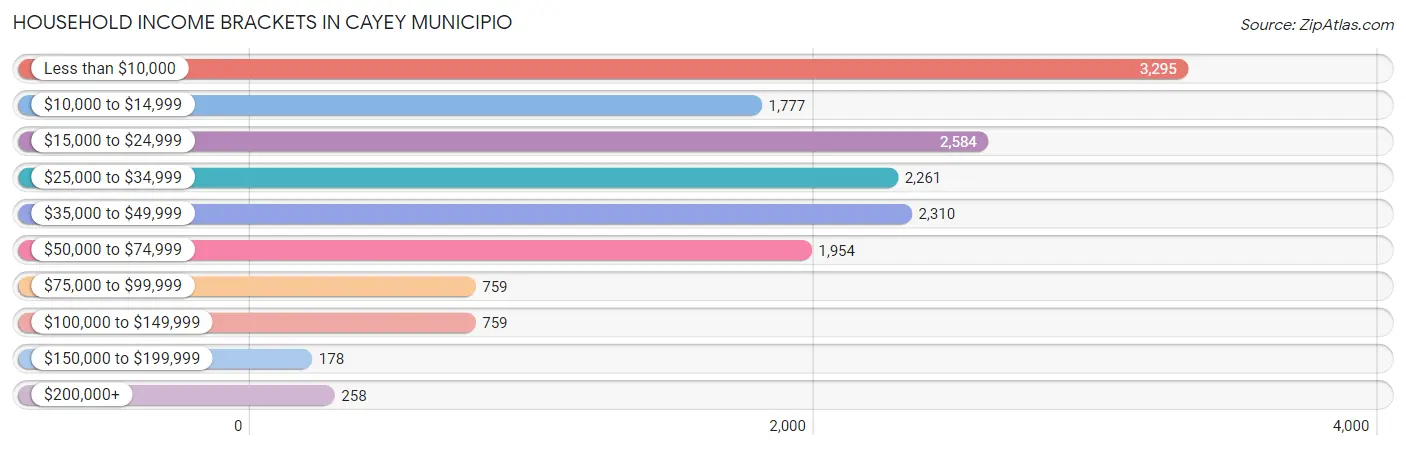
| Income Bracket | # Households | % Households |
| Less than $10,000 | 3,295 | 20.4% |
| $10,000 to $14,999 | 1,777 | 11.0% |
| $15,000 to $24,999 | 2,584 | 16.0% |
| $25,000 to $34,999 | 2,261 | 14.0% |
| $35,000 to $49,999 | 2,310 | 14.3% |
| $50,000 to $74,999 | 1,954 | 12.1% |
| $75,000 to $99,999 | 759 | 4.7% |
| $100,000 to $149,999 | 759 | 4.7% |
| $150,000 to $199,999 | 178 | 1.1% |
| $200,000+ | 258 | 1.6% |
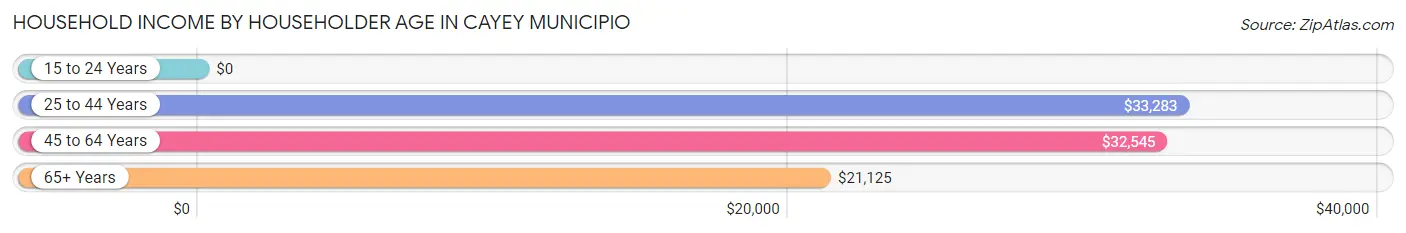
Household Income by Householder Age in Cayey Municipio
The median household income in Cayey Municipio is $26,704, with the highest median household income of $33,283 found in the 25 to 44 years age bracket for the primary householder. A total of 3,914 households (24.2%) fall into this category. Meanwhile, the 15 to 24 years age bracket for the primary householder has the lowest median household income of $0, with 225 households (1.4%) in this group.
| Income Bracket | # Households | Median Income |
| 15 to 24 Years | 225 (1.4%) | $0 |
| 25 to 44 Years | 3,914 (24.2%) | $33,283 |
| 45 to 64 Years | 6,005 (37.2%) | $32,545 |
| 65+ Years | 6,007 (37.2%) | $21,125 |
| Total | 16,151 (100.0%) | $26,704 |
Poverty in Cayey Municipio
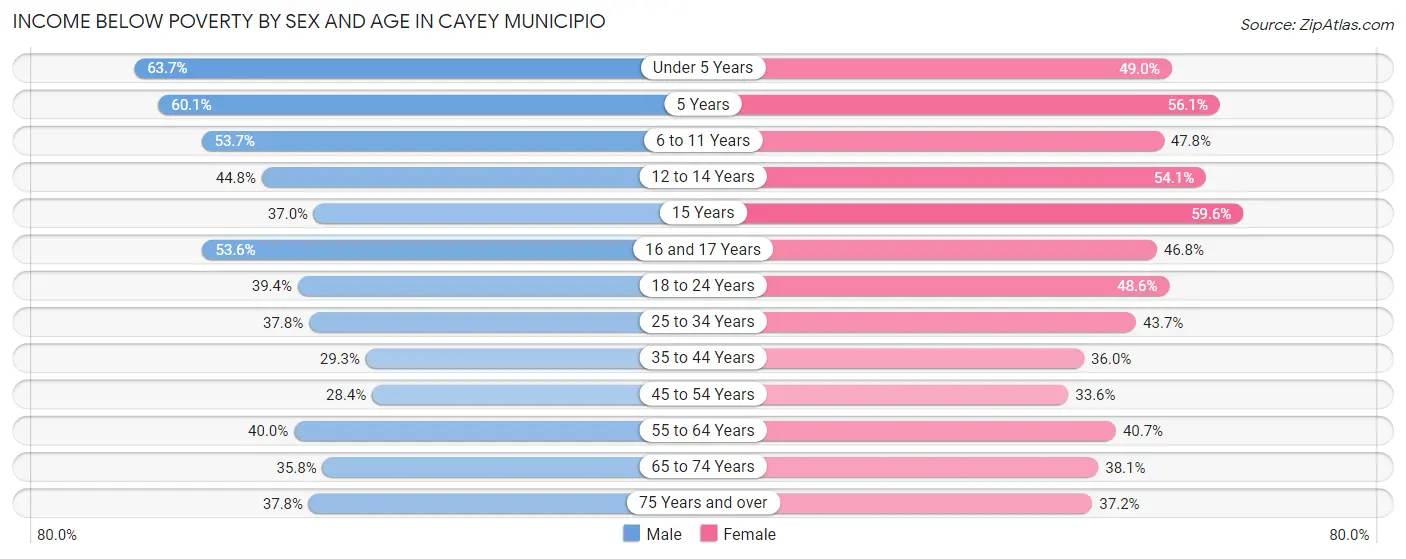
Income Below Poverty by Sex and Age in Cayey Municipio
With 38.3% poverty level for males and 41.1% for females among the residents of Cayey Municipio, under 5 year old males and 15 year old females are the most vulnerable to poverty, with 439 males (63.7%) and 90 females (59.6%) in their respective age groups living below the poverty level.
| Age Bracket | Male | Female |
| Under 5 Years | 439 (63.7%) | 351 (48.9%) |
| 5 Years | 83 (60.1%) | 87 (56.1%) |
| 6 to 11 Years | 505 (53.7%) | 589 (47.8%) |
| 12 to 14 Years | 395 (44.8%) | 364 (54.1%) |
| 15 Years | 80 (37.0%) | 90 (59.6%) |
| 16 and 17 Years | 290 (53.6%) | 269 (46.8%) |
| 18 to 24 Years | 755 (39.4%) | 917 (48.6%) |
| 25 to 34 Years | 956 (37.8%) | 1,191 (43.7%) |
| 35 to 44 Years | 674 (29.3%) | 948 (36.0%) |
| 45 to 54 Years | 743 (28.4%) | 955 (33.6%) |
| 55 to 64 Years | 1,121 (40.0%) | 1,243 (40.7%) |
| 65 to 74 Years | 856 (35.8%) | 1,014 (38.1%) |
| 75 Years and over | 712 (37.8%) | 867 (37.2%) |
| Total | 7,609 (38.3%) | 8,885 (41.1%) |
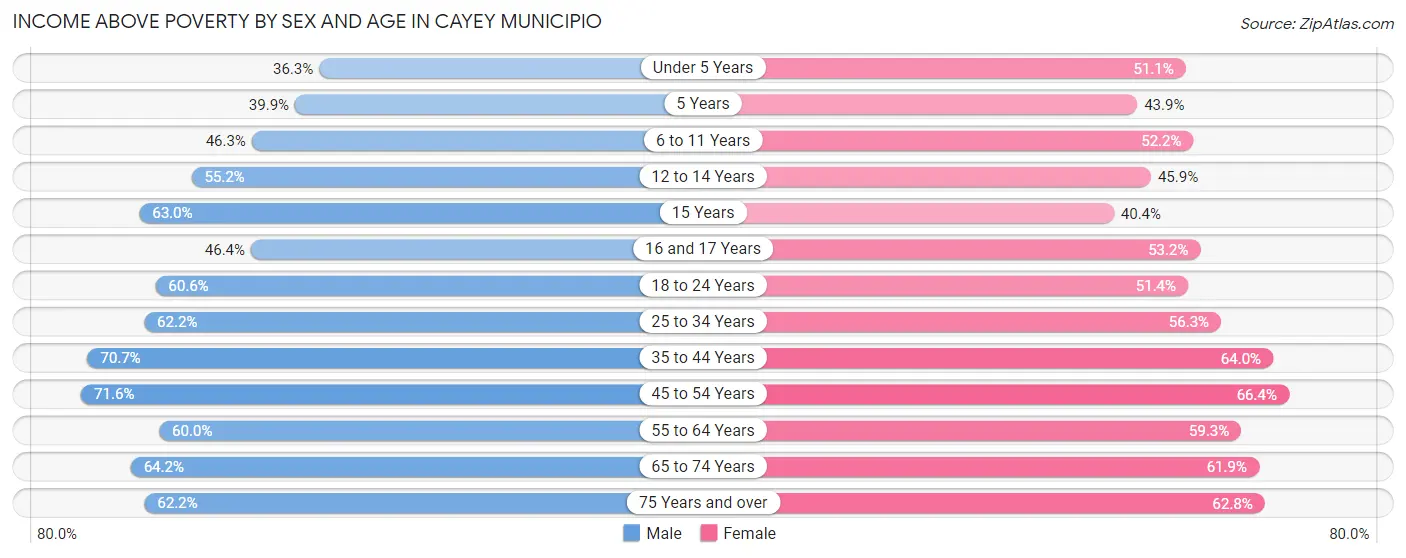
Income Above Poverty by Sex and Age in Cayey Municipio
According to the poverty statistics in Cayey Municipio, males aged 45 to 54 years and females aged 45 to 54 years are the age groups that are most secure financially, with 71.6% of males and 66.4% of females in these age groups living above the poverty line.
| Age Bracket | Male | Female |
| Under 5 Years | 250 (36.3%) | 366 (51.0%) |
| 5 Years | 55 (39.9%) | 68 (43.9%) |
| 6 to 11 Years | 435 (46.3%) | 643 (52.2%) |
| 12 to 14 Years | 487 (55.2%) | 309 (45.9%) |
| 15 Years | 136 (63.0%) | 61 (40.4%) |
| 16 and 17 Years | 251 (46.4%) | 306 (53.2%) |
| 18 to 24 Years | 1,160 (60.6%) | 969 (51.4%) |
| 25 to 34 Years | 1,576 (62.2%) | 1,534 (56.3%) |
| 35 to 44 Years | 1,624 (70.7%) | 1,686 (64.0%) |
| 45 to 54 Years | 1,873 (71.6%) | 1,884 (66.4%) |
| 55 to 64 Years | 1,683 (60.0%) | 1,810 (59.3%) |
| 65 to 74 Years | 1,538 (64.2%) | 1,648 (61.9%) |
| 75 Years and over | 1,172 (62.2%) | 1,463 (62.8%) |
| Total | 12,240 (61.7%) | 12,747 (58.9%) |
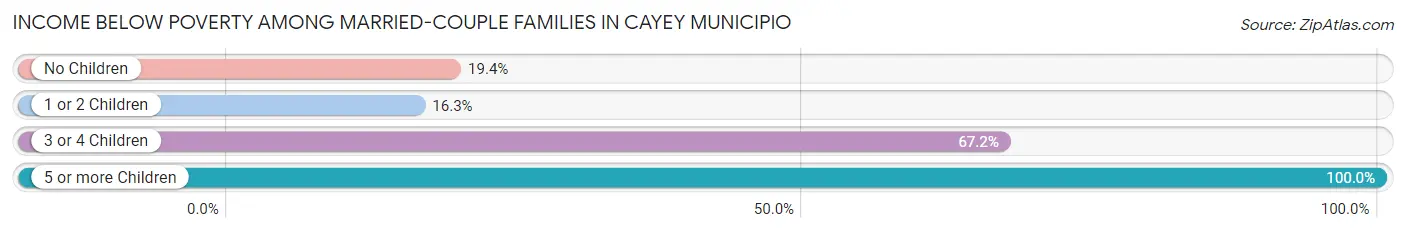
Income Below Poverty Among Married-Couple Families in Cayey Municipio
The poverty statistics for married-couple families in Cayey Municipio show that 19.2% or 1,060 of the total 5,510 families live below the poverty line. Families with 5 or more children have the highest poverty rate of 100.0%, comprising of 10 families. On the other hand, families with 1 or 2 children have the lowest poverty rate of 16.3%, which includes 241 families.
| Children | Above Poverty | Below Poverty |
| No Children | 3,194 (80.6%) | 770 (19.4%) |
| 1 or 2 Children | 1,237 (83.7%) | 241 (16.3%) |
| 3 or 4 Children | 19 (32.8%) | 39 (67.2%) |
| 5 or more Children | 0 (0.0%) | 10 (100.0%) |
| Total | 4,450 (80.8%) | 1,060 (19.2%) |
Income Below Poverty Among Single-Parent Households in Cayey Municipio
According to the poverty data in Cayey Municipio, 39.9% or 504 single-father households and 52.5% or 2,014 single-mother households are living below the poverty line. Among single-father households, those with 3 or 4 children have the highest poverty rate, with 43 households (51.8%) experiencing poverty. Likewise, among single-mother households, those with 3 or 4 children have the highest poverty rate, with 127 households (83.6%) falling below the poverty line.
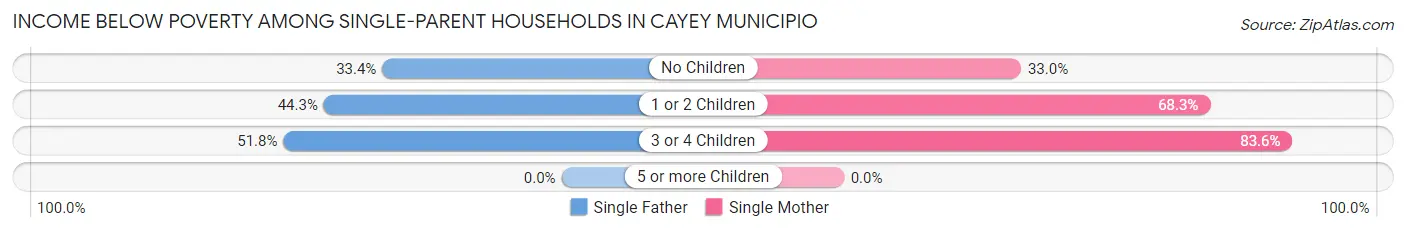
| Children | Single Father | Single Mother |
| No Children | 190 (33.4%) | 590 (33.0%) |
| 1 or 2 Children | 271 (44.3%) | 1,297 (68.3%) |
| 3 or 4 Children | 43 (51.8%) | 127 (83.6%) |
| 5 or more Children | 0 (0.0%) | 0 (0.0%) |
| Total | 504 (39.9%) | 2,014 (52.5%) |
Income Below Poverty Among Married-Couple vs Single-Parent Households in Cayey Municipio
The poverty data for Cayey Municipio shows that 1,060 of the married-couple family households (19.2%) and 2,518 of the single-parent households (49.3%) are living below the poverty level. Within the married-couple family households, those with 5 or more children have the highest poverty rate, with 10 households (100.0%) falling below the poverty line. Among the single-parent households, those with 3 or 4 children have the highest poverty rate, with 170 household (72.3%) living below poverty.
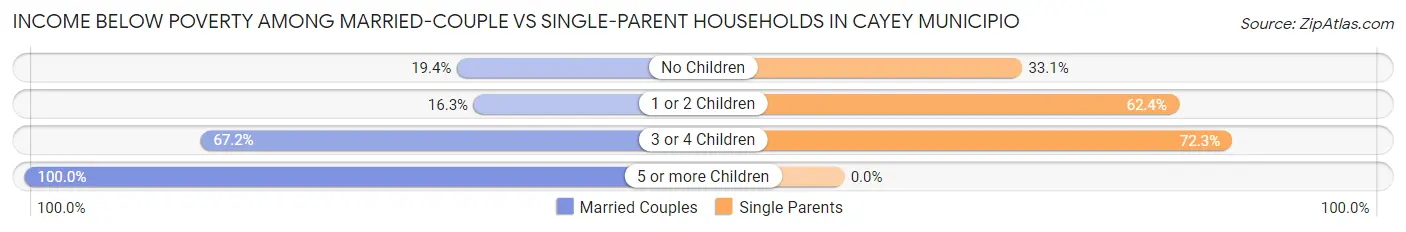
| Children | Married-Couple Families | Single-Parent Households |
| No Children | 770 (19.4%) | 780 (33.1%) |
| 1 or 2 Children | 241 (16.3%) | 1,568 (62.4%) |
| 3 or 4 Children | 39 (67.2%) | 170 (72.3%) |
| 5 or more Children | 10 (100.0%) | 0 (0.0%) |
| Total | 1,060 (19.2%) | 2,518 (49.3%) |
Race in Cayey Municipio
The most populous races in Cayey Municipio are Hispanic or Latino (41,365 | 99.7%), White / Caucasian (16,357 | 39.4%), and Two or more Races (12,666 | 30.5%).
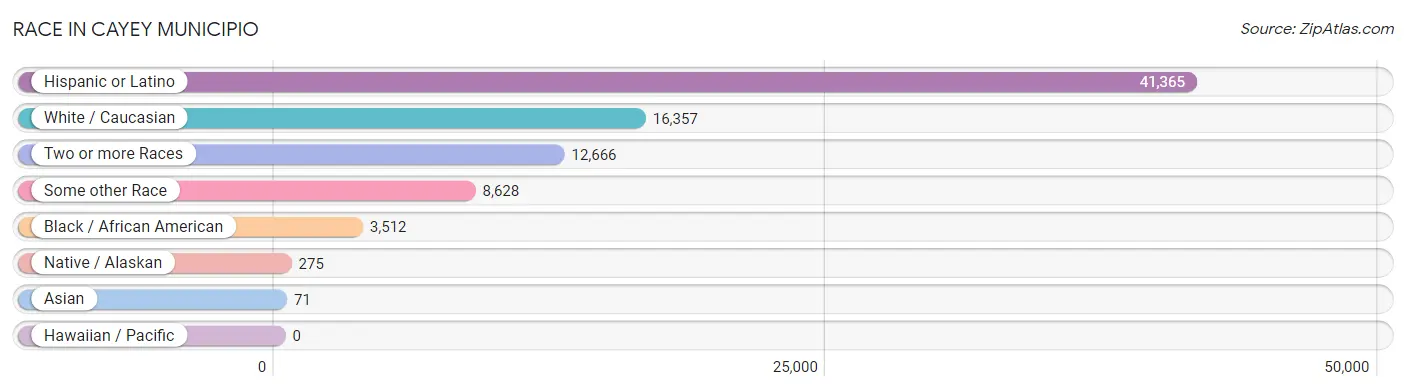
| Race | # Population | % Population |
| Asian | 71 | 0.2% |
| Black / African American | 3,512 | 8.5% |
| Hawaiian / Pacific | 0 | 0.0% |
| Hispanic or Latino | 41,365 | 99.7% |
| Native / Alaskan | 275 | 0.7% |
| White / Caucasian | 16,357 | 39.4% |
| Two or more Races | 12,666 | 30.5% |
| Some other Race | 8,628 | 20.8% |
| Total | 41,509 | 100.0% |
Ancestry in Cayey Municipio
The most populous ancestries reported in Cayey Municipio are Puerto Rican (41,017 | 98.8%), Central American Indian (207 | 0.5%), American (198 | 0.5%), South American (133 | 0.3%), and Colombian (104 | 0.3%), together accounting for 100.4% of all Cayey Municipio residents.
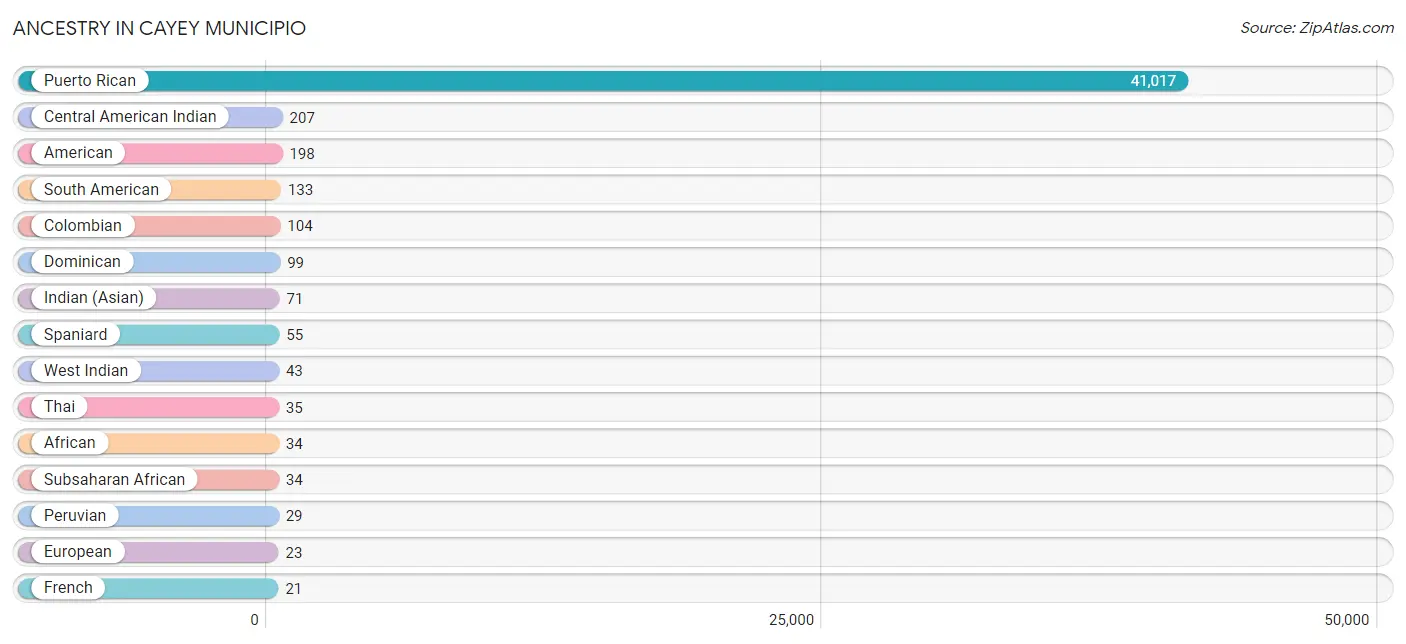
| Ancestry | # Population | % Population |
| African | 34 | 0.1% |
| American | 198 | 0.5% |
| Central American | 17 | 0.0% |
| Central American Indian | 207 | 0.5% |
| Colombian | 104 | 0.3% |
| Dominican | 99 | 0.2% |
| European | 23 | 0.1% |
| French | 21 | 0.1% |
| Indian (Asian) | 71 | 0.2% |
| Italian | 8 | 0.0% |
| Jamaican | 1 | 0.0% |
| Mexican | 9 | 0.0% |
| Panamanian | 17 | 0.0% |
| Peruvian | 29 | 0.1% |
| Puerto Rican | 41,017 | 98.8% |
| South American | 133 | 0.3% |
| Spaniard | 55 | 0.1% |
| Subsaharan African | 34 | 0.1% |
| Thai | 35 | 0.1% |
| West Indian | 43 | 0.1% | View All 20 Rows |
Immigrants in Cayey Municipio

| Immigration Origin | # Population | % Population | View All 0 Rows |
Sex and Age in Cayey Municipio
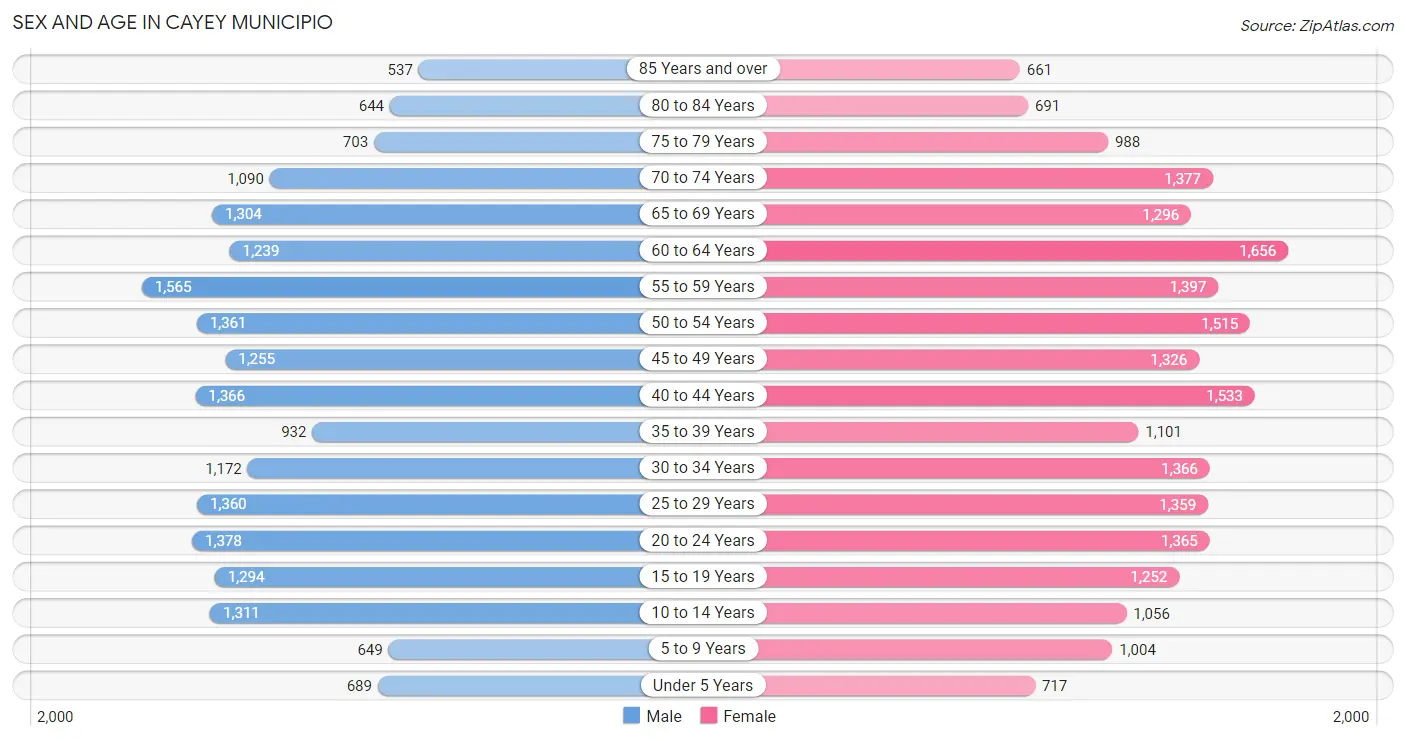
Sex and Age in Cayey Municipio
The most populous age groups in Cayey Municipio are 55 to 59 Years (1,565 | 7.9%) for men and 60 to 64 Years (1,656 | 7.6%) for women.
| Age Bracket | Male | Female |
| Under 5 Years | 689 (3.5%) | 717 (3.3%) |
| 5 to 9 Years | 649 (3.3%) | 1,004 (4.6%) |
| 10 to 14 Years | 1,311 (6.6%) | 1,056 (4.9%) |
| 15 to 19 Years | 1,294 (6.5%) | 1,252 (5.8%) |
| 20 to 24 Years | 1,378 (6.9%) | 1,365 (6.3%) |
| 25 to 29 Years | 1,360 (6.9%) | 1,359 (6.3%) |
| 30 to 34 Years | 1,172 (5.9%) | 1,366 (6.3%) |
| 35 to 39 Years | 932 (4.7%) | 1,101 (5.1%) |
| 40 to 44 Years | 1,366 (6.9%) | 1,533 (7.1%) |
| 45 to 49 Years | 1,255 (6.3%) | 1,326 (6.1%) |
| 50 to 54 Years | 1,361 (6.9%) | 1,515 (7.0%) |
| 55 to 59 Years | 1,565 (7.9%) | 1,397 (6.5%) |
| 60 to 64 Years | 1,239 (6.2%) | 1,656 (7.6%) |
| 65 to 69 Years | 1,304 (6.6%) | 1,296 (6.0%) |
| 70 to 74 Years | 1,090 (5.5%) | 1,377 (6.4%) |
| 75 to 79 Years | 703 (3.5%) | 988 (4.6%) |
| 80 to 84 Years | 644 (3.2%) | 691 (3.2%) |
| 85 Years and over | 537 (2.7%) | 661 (3.0%) |
| Total | 19,849 (100.0%) | 21,660 (100.0%) |
Families and Households in Cayey Municipio
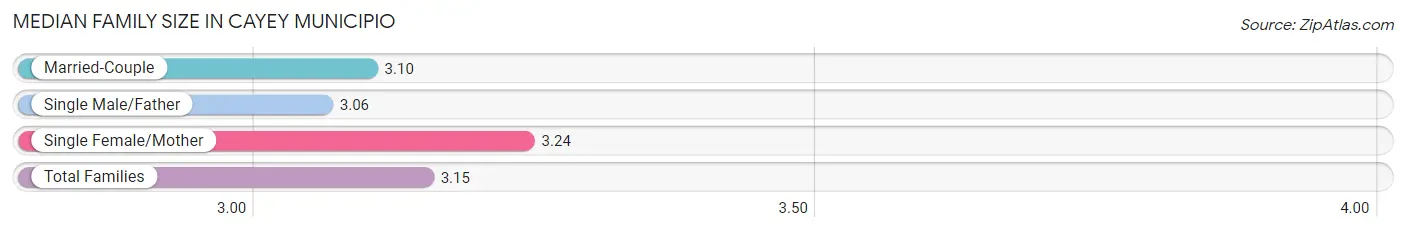
Median Family Size in Cayey Municipio
The median family size in Cayey Municipio is 3.15 persons per family, with single female/mother families (3,838 | 36.2%) accounting for the largest median family size of 3.24 persons per family. On the other hand, single male/father families (1,264 | 11.9%) represent the smallest median family size with 3.06 persons per family.
| Family Type | # Families | Family Size |
| Married-Couple | 5,510 (51.9%) | 3.10 |
| Single Male/Father | 1,264 (11.9%) | 3.06 |
| Single Female/Mother | 3,838 (36.2%) | 3.24 |
| Total Families | 10,612 (100.0%) | 3.15 |
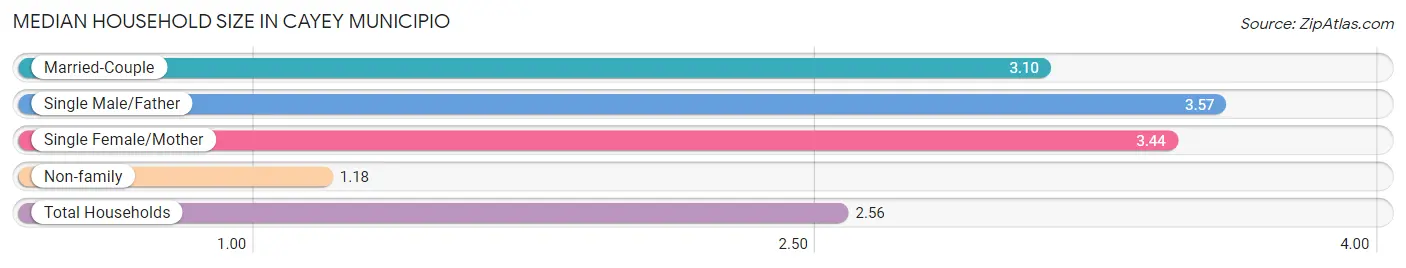
Median Household Size in Cayey Municipio
The median household size in Cayey Municipio is 2.56 persons per household, with single male/father households (1,264 | 7.8%) accounting for the largest median household size of 3.57 persons per household. non-family households (5,539 | 34.3%) represent the smallest median household size with 1.18 persons per household.
| Household Type | # Households | Household Size |
| Married-Couple | 5,510 (34.1%) | 3.10 |
| Single Male/Father | 1,264 (7.8%) | 3.57 |
| Single Female/Mother | 3,838 (23.8%) | 3.44 |
| Non-family | 5,539 (34.3%) | 1.18 |
| Total Households | 16,151 (100.0%) | 2.56 |
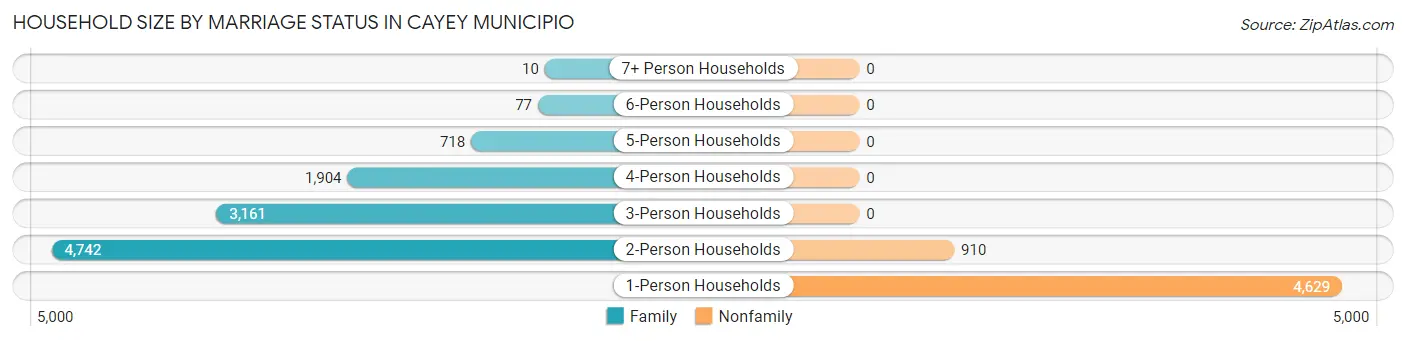
Household Size by Marriage Status in Cayey Municipio
Out of a total of 16,151 households in Cayey Municipio, 10,612 (65.7%) are family households, while 5,539 (34.3%) are nonfamily households. The most numerous type of family households are 2-person households, comprising 4,742, and the most common type of nonfamily households are 1-person households, comprising 4,629.
| Household Size | Family Households | Nonfamily Households |
| 1-Person Households | - | 4,629 (28.7%) |
| 2-Person Households | 4,742 (29.4%) | 910 (5.6%) |
| 3-Person Households | 3,161 (19.6%) | 0 (0.0%) |
| 4-Person Households | 1,904 (11.8%) | 0 (0.0%) |
| 5-Person Households | 718 (4.4%) | 0 (0.0%) |
| 6-Person Households | 77 (0.5%) | 0 (0.0%) |
| 7+ Person Households | 10 (0.1%) | 0 (0.0%) |
| Total | 10,612 (65.7%) | 5,539 (34.3%) |
Female Fertility in Cayey Municipio
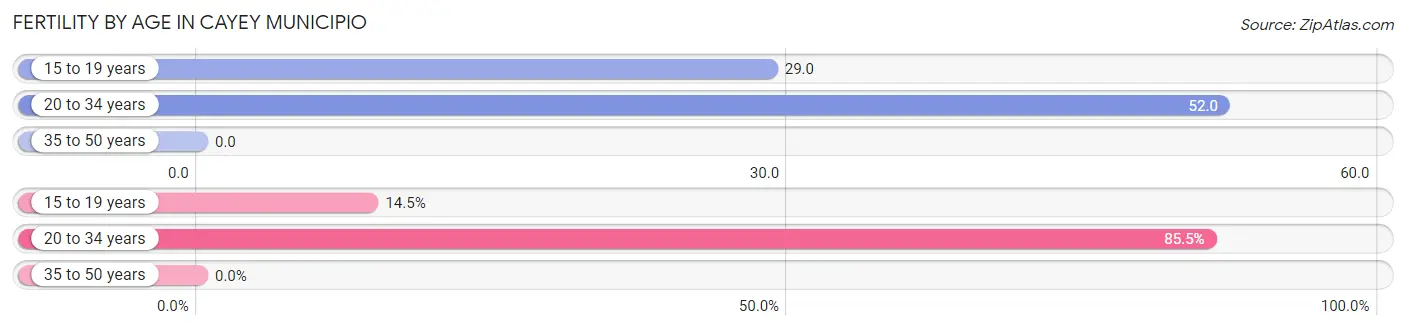
Fertility by Age in Cayey Municipio
Average fertility rate in Cayey Municipio is 26.0 births per 1,000 women. Women in the age bracket of 20 to 34 years have the highest fertility rate with 52.0 births per 1,000 women. Women in the age bracket of 20 to 34 years acount for 85.5% of all women with births.
| Age Bracket | Women with Births | Births / 1,000 Women |
| 15 to 19 years | 36 (14.5%) | 29.0 |
| 20 to 34 years | 213 (85.5%) | 52.0 |
| 35 to 50 years | 0 (0.0%) | 0.0 |
| Total | 249 (100.0%) | 26.0 |
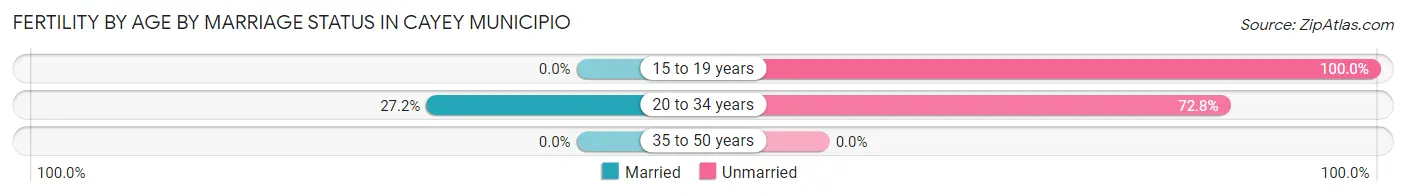
Fertility by Age by Marriage Status in Cayey Municipio
23.3% of women with births (249) in Cayey Municipio are married. The highest percentage of unmarried women with births falls into 15 to 19 years age bracket with 100.0% of them unmarried at the time of birth, while the lowest percentage of unmarried women with births belong to 20 to 34 years age bracket with 72.8% of them unmarried.
| Age Bracket | Married | Unmarried |
| 15 to 19 years | 0 (0.0%) | 36 (100.0%) |
| 20 to 34 years | 58 (27.2%) | 155 (72.8%) |
| 35 to 50 years | 0 (0.0%) | 0 (0.0%) |
| Total | 58 (23.3%) | 191 (76.7%) |
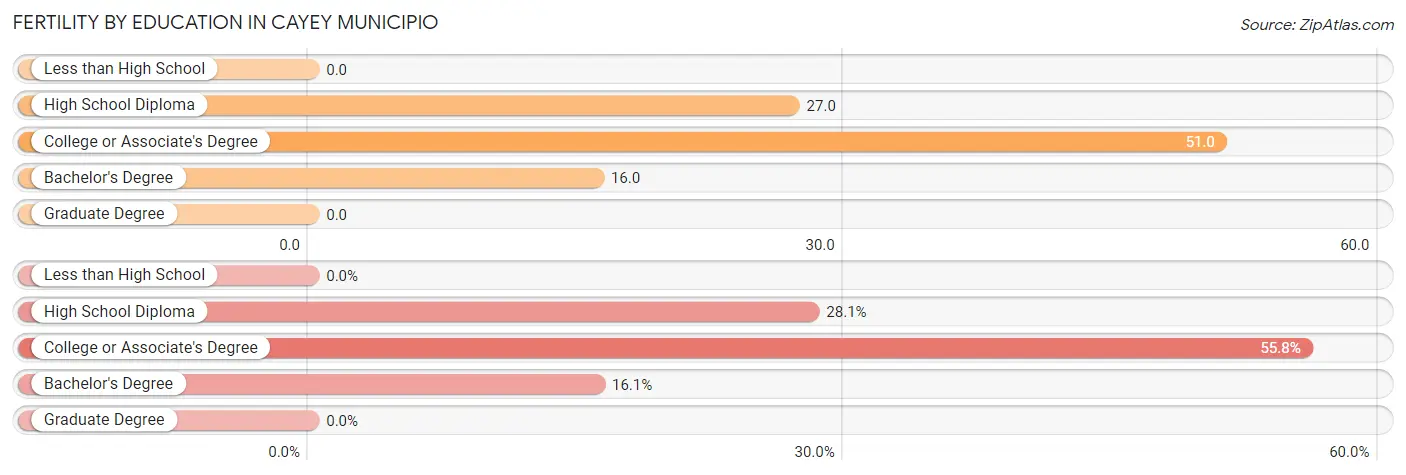
Fertility by Education in Cayey Municipio
| Educational Attainment | Women with Births | Births / 1,000 Women |
| Less than High School | 0 (0.0%) | 0.0 |
| High School Diploma | 70 (28.1%) | 27.0 |
| College or Associate's Degree | 139 (55.8%) | 51.0 |
| Bachelor's Degree | 40 (16.1%) | 16.0 |
| Graduate Degree | 0 (0.0%) | 0.0 |
| Total | 249 (100.0%) | 26.0 |
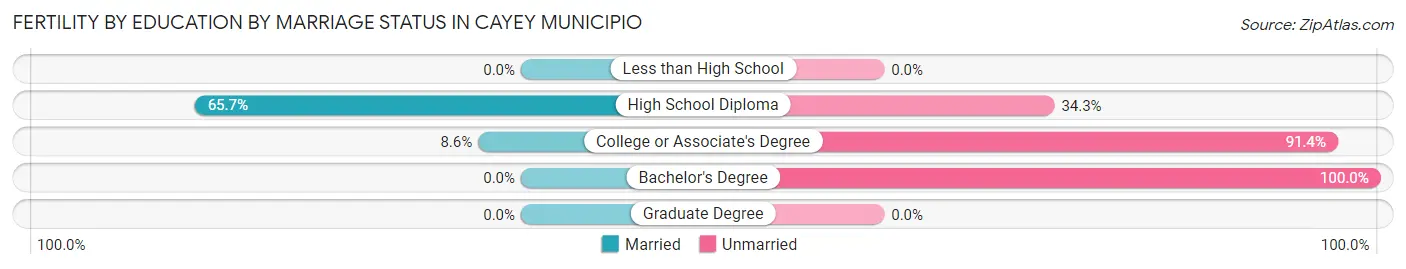
Fertility by Education by Marriage Status in Cayey Municipio
76.7% of women with births in Cayey Municipio are unmarried. Women with the educational attainment of high school diploma are most likely to be married with 65.7% of them married at childbirth, while women with the educational attainment of bachelor's degree are least likely to be married with 100.0% of them unmarried at childbirth.
| Educational Attainment | Married | Unmarried |
| Less than High School | 0 (0.0%) | 0 (0.0%) |
| High School Diploma | 46 (65.7%) | 24 (34.3%) |
| College or Associate's Degree | 12 (8.6%) | 127 (91.4%) |
| Bachelor's Degree | 0 (0.0%) | 40 (100.0%) |
| Graduate Degree | 0 (0.0%) | 0 (0.0%) |
| Total | 58 (23.3%) | 191 (76.7%) |
Employment Characteristics in Cayey Municipio
Employment by Class of Employer in Cayey Municipio
Among the 13,811 employed individuals in Cayey Municipio, private company employees (8,399 | 60.8%), state government employees (1,890 | 13.7%), and self-employed (not incorporated) (1,636 | 11.8%) make up the most common classes of employment.
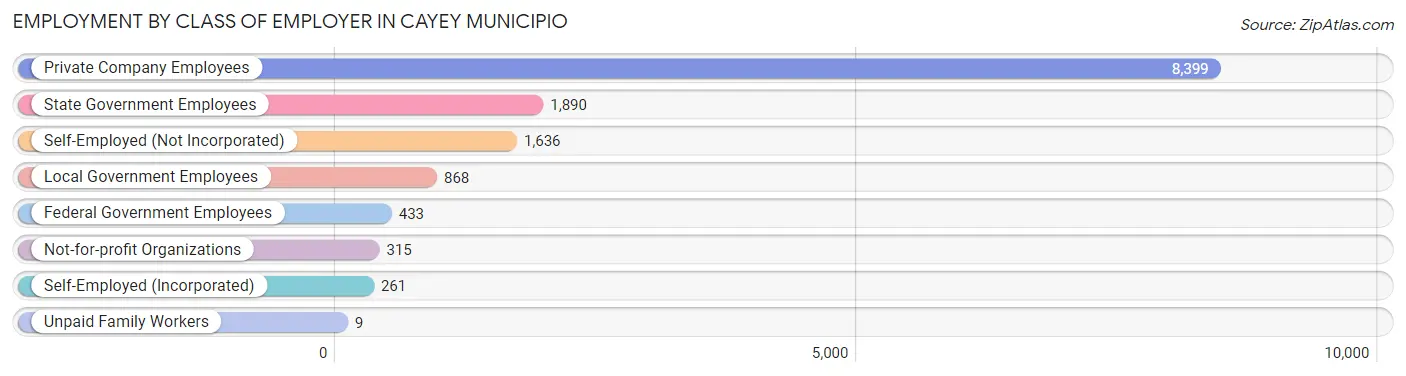
| Employer Class | # Employees | % Employees |
| Private Company Employees | 8,399 | 60.8% |
| Self-Employed (Incorporated) | 261 | 1.9% |
| Self-Employed (Not Incorporated) | 1,636 | 11.8% |
| Not-for-profit Organizations | 315 | 2.3% |
| Local Government Employees | 868 | 6.3% |
| State Government Employees | 1,890 | 13.7% |
| Federal Government Employees | 433 | 3.1% |
| Unpaid Family Workers | 9 | 0.1% |
| Total | 13,811 | 100.0% |
Employment Status by Age in Cayey Municipio
According to the labor force statistics for Cayey Municipio, out of the total population over 16 years of age (35,716), 41.7% or 14,894 individuals are in the labor force, with 6.7% or 998 of them unemployed. The age group with the highest labor force participation rate is 30 to 34 years, with 74.1% or 1,881 individuals in the labor force. Within the labor force, the 16 to 19 years age range has the highest percentage of unemployed individuals, with 17.4% or 44 of them being unemployed.
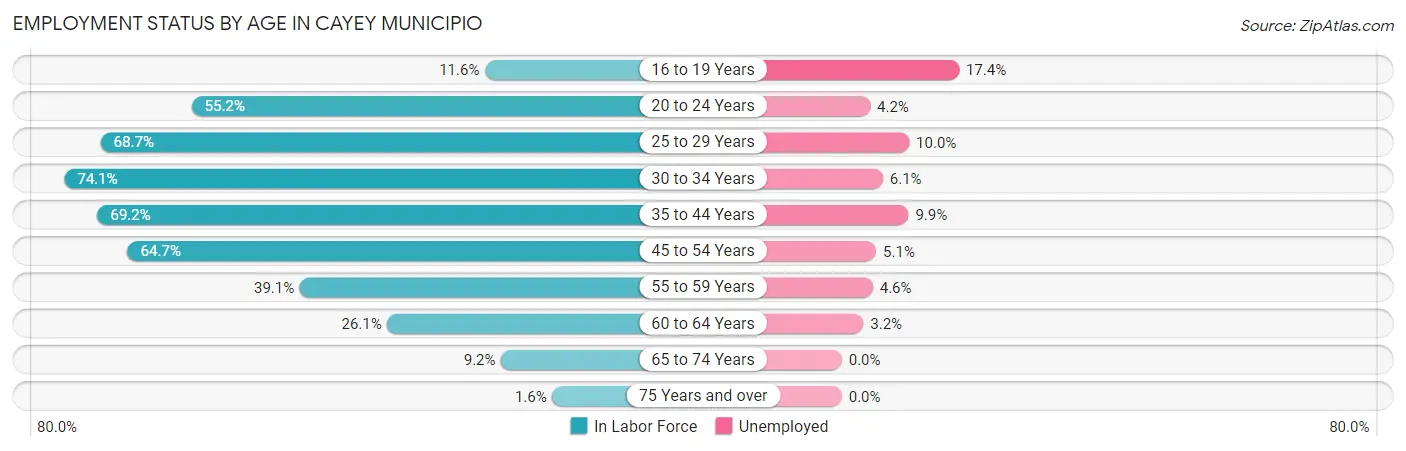
| Age Bracket | In Labor Force | Unemployed |
| 16 to 19 Years | 253 (11.6%) | 44 (17.4%) |
| 20 to 24 Years | 1,514 (55.2%) | 64 (4.2%) |
| 25 to 29 Years | 1,868 (68.7%) | 187 (10.0%) |
| 30 to 34 Years | 1,881 (74.1%) | 115 (6.1%) |
| 35 to 44 Years | 3,413 (69.2%) | 338 (9.9%) |
| 45 to 54 Years | 3,531 (64.7%) | 180 (5.1%) |
| 55 to 59 Years | 1,158 (39.1%) | 53 (4.6%) |
| 60 to 64 Years | 756 (26.1%) | 24 (3.2%) |
| 65 to 74 Years | 466 (9.2%) | 0 (0.0%) |
| 75 Years and over | 68 (1.6%) | 0 (0.0%) |
| Total | 14,894 (41.7%) | 998 (6.7%) |
Employment Status by Educational Attainment in Cayey Municipio
According to labor force statistics for Cayey Municipio, 58.6% of individuals (12,601) out of the total population between 25 and 64 years of age (21,503) are in the labor force, with 7.1% or 895 of them being unemployed. The group with the highest labor force participation rate are those with the educational attainment of bachelor's degree or higher, with 75.2% or 5,411 individuals in the labor force. Within the labor force, individuals with less than high school education have the highest percentage of unemployment, with 14.3% or 111 of them being unemployed.
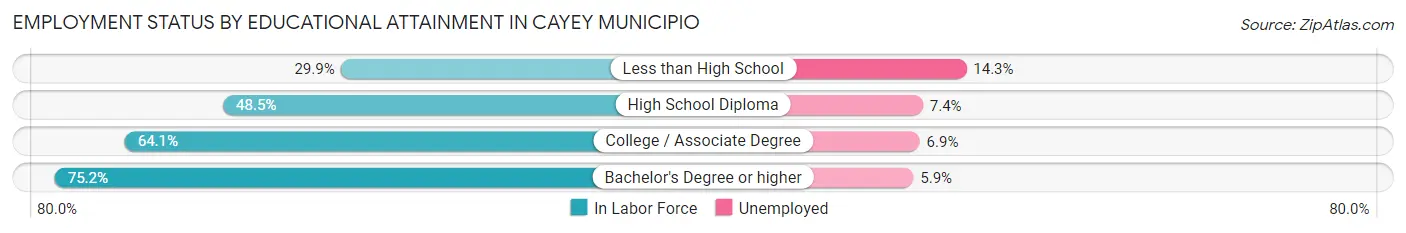
| Educational Attainment | In Labor Force | Unemployed |
| Less than High School | 777 (29.9%) | 372 (14.3%) |
| High School Diploma | 3,389 (48.5%) | 517 (7.4%) |
| College / Associate Degree | 3,027 (64.1%) | 326 (6.9%) |
| Bachelor's Degree or higher | 5,411 (75.2%) | 425 (5.9%) |
| Total | 12,601 (58.6%) | 1,527 (7.1%) |
Employment Occupations by Sex in Cayey Municipio
Management, Business, Science and Arts Occupations
The most common Management, Business, Science and Arts occupations in Cayey Municipio are Community & Social Service (1,578 | 11.4%), Health Diagnosing & Treating (1,173 | 8.5%), Education Instruction & Library (1,090 | 7.9%), Management (928 | 6.7%), and Computers, Engineering & Science (748 | 5.4%).
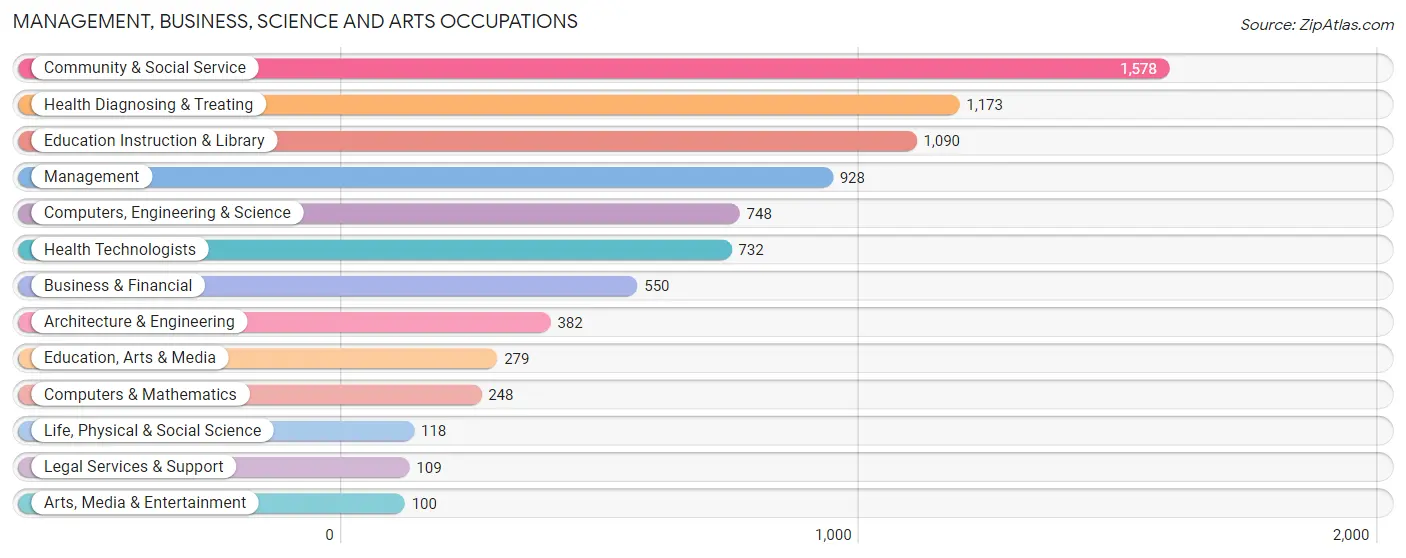
Management, Business, Science and Arts Occupations by Sex
Within the Management, Business, Science and Arts occupations in Cayey Municipio, the most male-oriented occupations are Computers & Mathematics (84.7%), Architecture & Engineering (63.9%), and Computers, Engineering & Science (60.7%), while the most female-oriented occupations are Life, Physical & Social Science (100.0%), Health Technologists (85.4%), and Education Instruction & Library (74.9%).
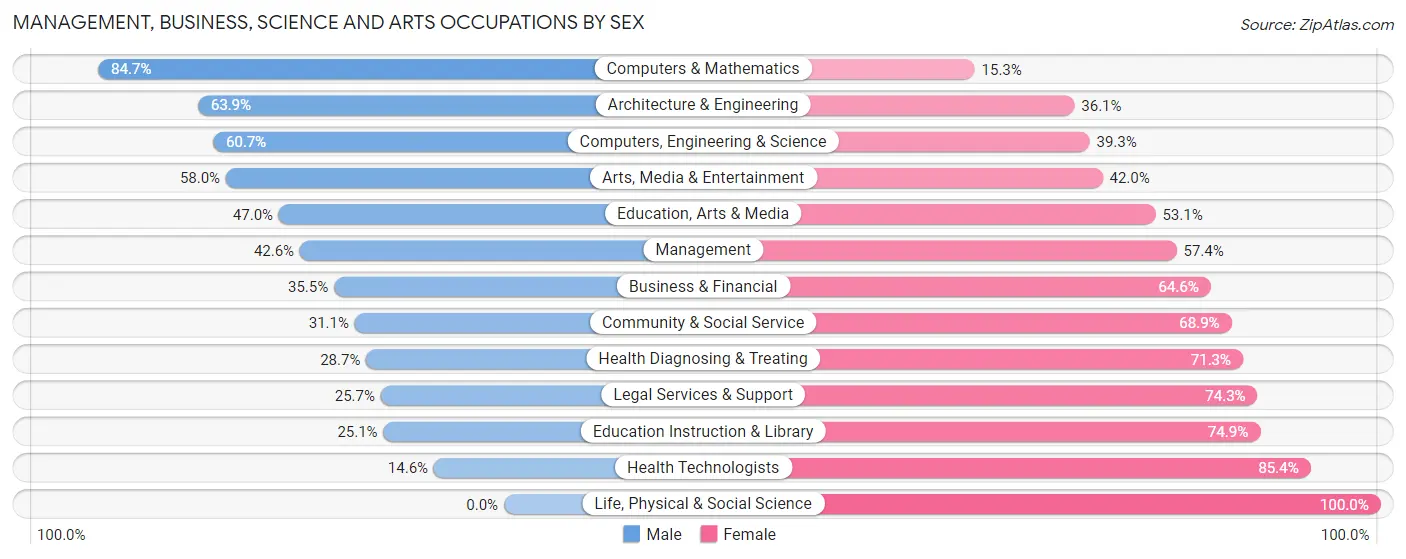
| Occupation | Male | Female |
| Management | 395 (42.6%) | 533 (57.4%) |
| Business & Financial | 195 (35.4%) | 355 (64.5%) |
| Computers, Engineering & Science | 454 (60.7%) | 294 (39.3%) |
| Computers & Mathematics | 210 (84.7%) | 38 (15.3%) |
| Architecture & Engineering | 244 (63.9%) | 138 (36.1%) |
| Life, Physical & Social Science | 0 (0.0%) | 118 (100.0%) |
| Community & Social Service | 491 (31.1%) | 1,087 (68.9%) |
| Education, Arts & Media | 131 (46.9%) | 148 (53.0%) |
| Legal Services & Support | 28 (25.7%) | 81 (74.3%) |
| Education Instruction & Library | 274 (25.1%) | 816 (74.9%) |
| Arts, Media & Entertainment | 58 (58.0%) | 42 (42.0%) |
| Health Diagnosing & Treating | 337 (28.7%) | 836 (71.3%) |
| Health Technologists | 107 (14.6%) | 625 (85.4%) |
| Total (Category) | 1,872 (37.6%) | 3,105 (62.4%) |
| Total (Overall) | 6,834 (49.4%) | 7,000 (50.6%) |
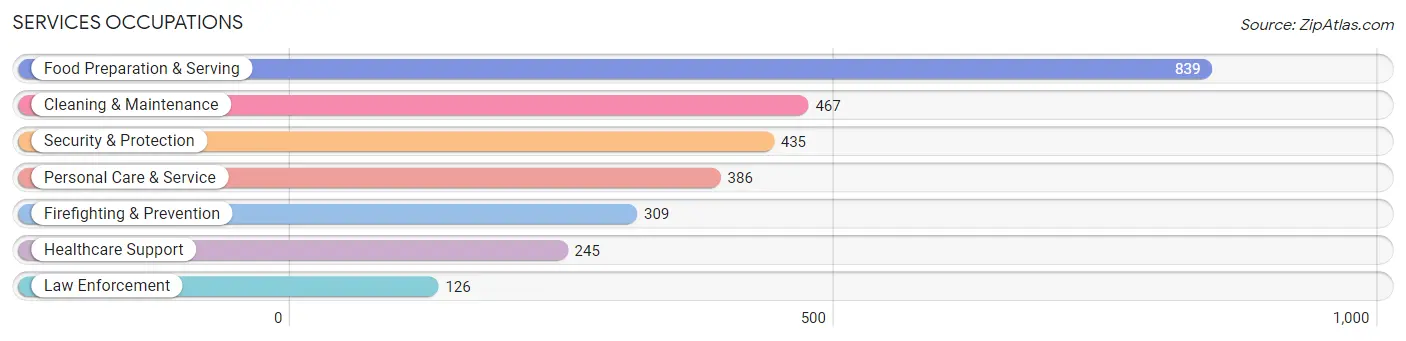
Services Occupations
The most common Services occupations in Cayey Municipio are Food Preparation & Serving (839 | 6.1%), Cleaning & Maintenance (467 | 3.4%), Security & Protection (435 | 3.1%), Personal Care & Service (386 | 2.8%), and Firefighting & Prevention (309 | 2.2%).
Services Occupations by Sex
Within the Services occupations in Cayey Municipio, the most male-oriented occupations are Law Enforcement (100.0%), Cleaning & Maintenance (78.2%), and Security & Protection (69.7%), while the most female-oriented occupations are Healthcare Support (86.5%), Food Preparation & Serving (67.3%), and Personal Care & Service (57.5%).
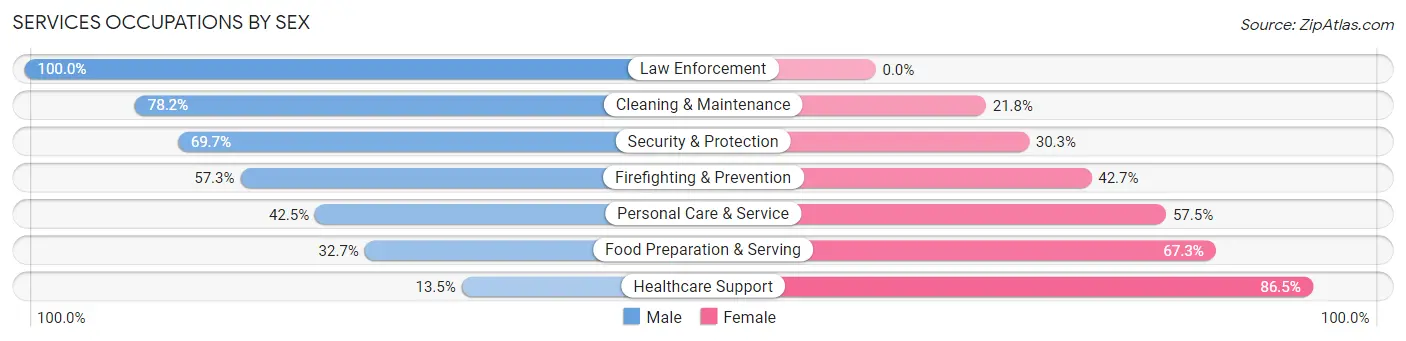
| Occupation | Male | Female |
| Healthcare Support | 33 (13.5%) | 212 (86.5%) |
| Security & Protection | 303 (69.7%) | 132 (30.3%) |
| Firefighting & Prevention | 177 (57.3%) | 132 (42.7%) |
| Law Enforcement | 126 (100.0%) | 0 (0.0%) |
| Food Preparation & Serving | 274 (32.7%) | 565 (67.3%) |
| Cleaning & Maintenance | 365 (78.2%) | 102 (21.8%) |
| Personal Care & Service | 164 (42.5%) | 222 (57.5%) |
| Total (Category) | 1,139 (48.0%) | 1,233 (52.0%) |
| Total (Overall) | 6,834 (49.4%) | 7,000 (50.6%) |
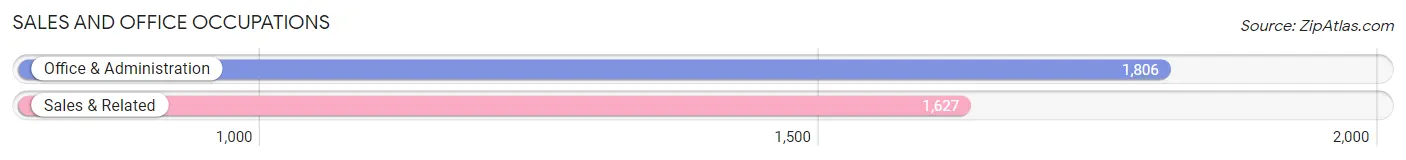
Sales and Office Occupations
The most common Sales and Office occupations in Cayey Municipio are Office & Administration (1,806 | 13.1%), and Sales & Related (1,627 | 11.8%).
Sales and Office Occupations by Sex
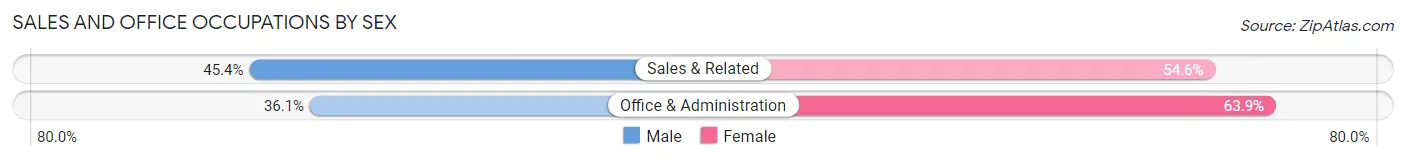
| Occupation | Male | Female |
| Sales & Related | 739 (45.4%) | 888 (54.6%) |
| Office & Administration | 652 (36.1%) | 1,154 (63.9%) |
| Total (Category) | 1,391 (40.5%) | 2,042 (59.5%) |
| Total (Overall) | 6,834 (49.4%) | 7,000 (50.6%) |
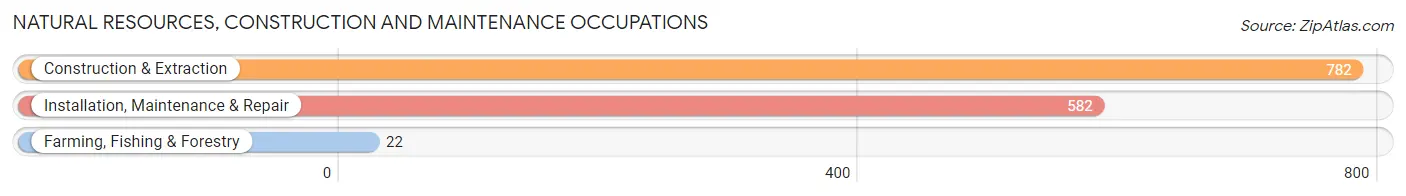
Natural Resources, Construction and Maintenance Occupations
The most common Natural Resources, Construction and Maintenance occupations in Cayey Municipio are Construction & Extraction (782 | 5.7%), Installation, Maintenance & Repair (582 | 4.2%), and Farming, Fishing & Forestry (22 | 0.2%).
Natural Resources, Construction and Maintenance Occupations by Sex
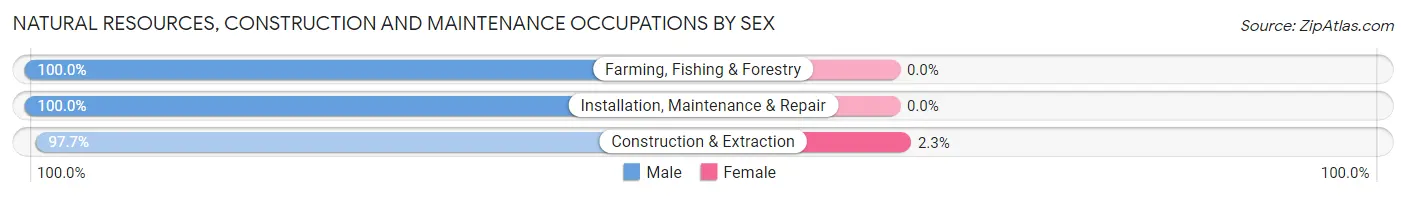
| Occupation | Male | Female |
| Farming, Fishing & Forestry | 22 (100.0%) | 0 (0.0%) |
| Construction & Extraction | 764 (97.7%) | 18 (2.3%) |
| Installation, Maintenance & Repair | 582 (100.0%) | 0 (0.0%) |
| Total (Category) | 1,368 (98.7%) | 18 (1.3%) |
| Total (Overall) | 6,834 (49.4%) | 7,000 (50.6%) |
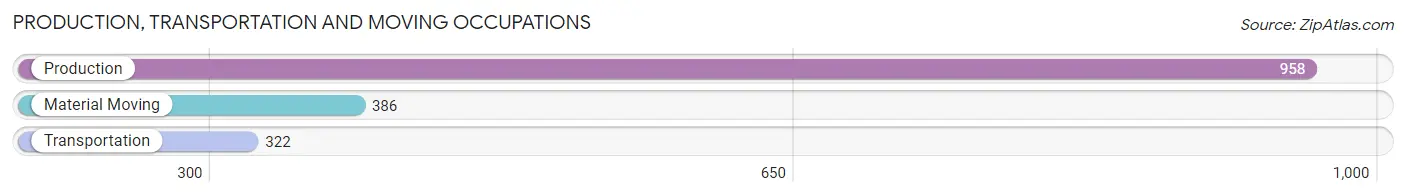
Production, Transportation and Moving Occupations
The most common Production, Transportation and Moving occupations in Cayey Municipio are Production (958 | 6.9%), Material Moving (386 | 2.8%), and Transportation (322 | 2.3%).
Production, Transportation and Moving Occupations by Sex
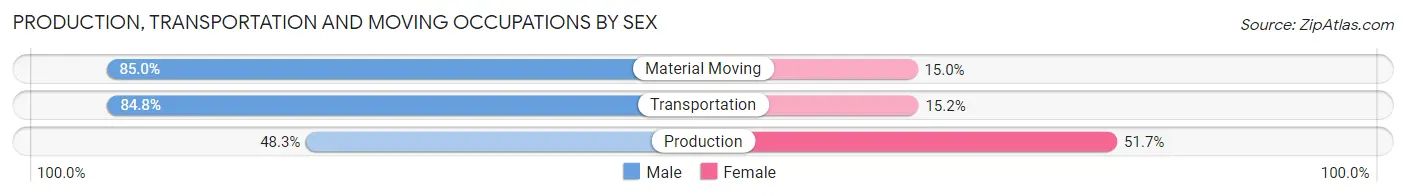
| Occupation | Male | Female |
| Production | 463 (48.3%) | 495 (51.7%) |
| Transportation | 273 (84.8%) | 49 (15.2%) |
| Material Moving | 328 (85.0%) | 58 (15.0%) |
| Total (Category) | 1,064 (63.9%) | 602 (36.1%) |
| Total (Overall) | 6,834 (49.4%) | 7,000 (50.6%) |
Employment Industries by Sex in Cayey Municipio
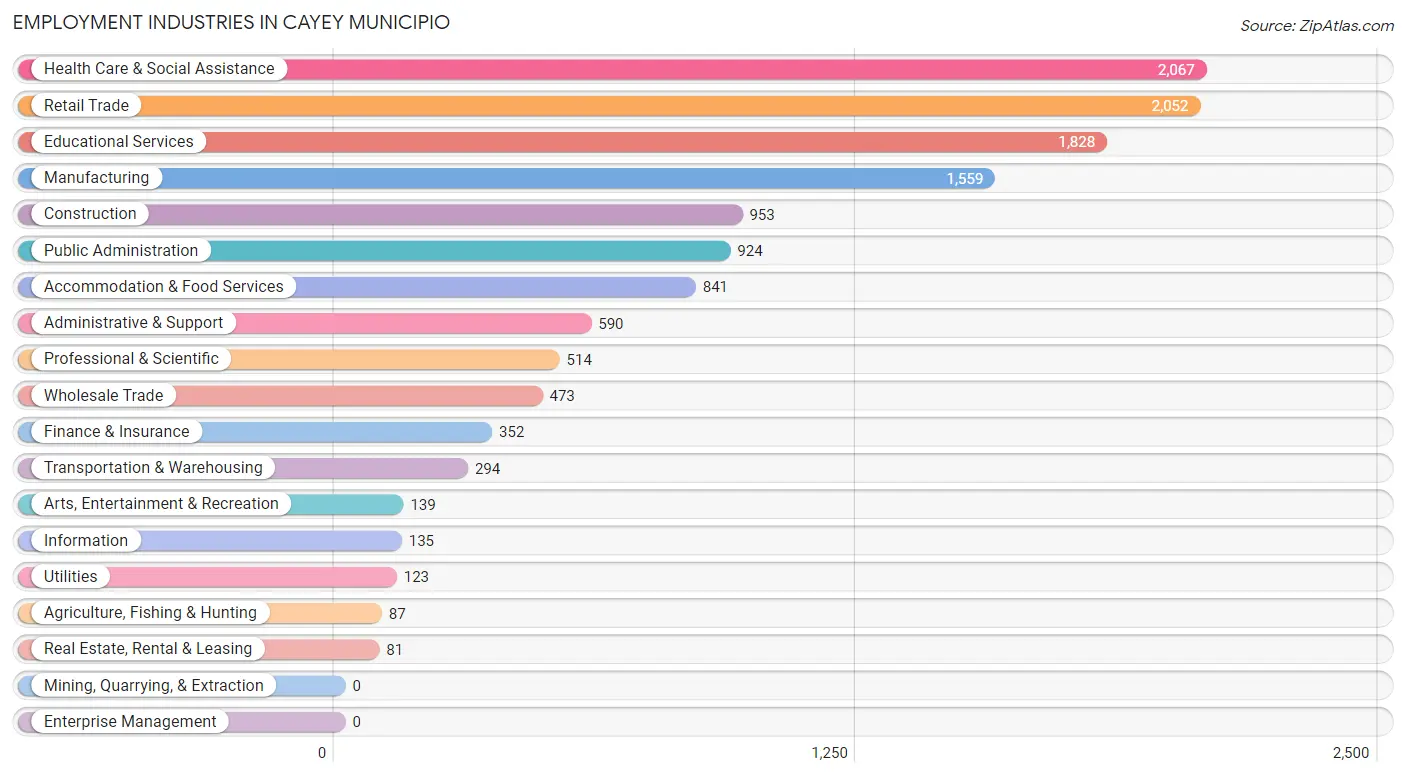
Employment Industries in Cayey Municipio
The major employment industries in Cayey Municipio include Health Care & Social Assistance (2,067 | 14.9%), Retail Trade (2,052 | 14.8%), Educational Services (1,828 | 13.2%), Manufacturing (1,559 | 11.3%), and Construction (953 | 6.9%).
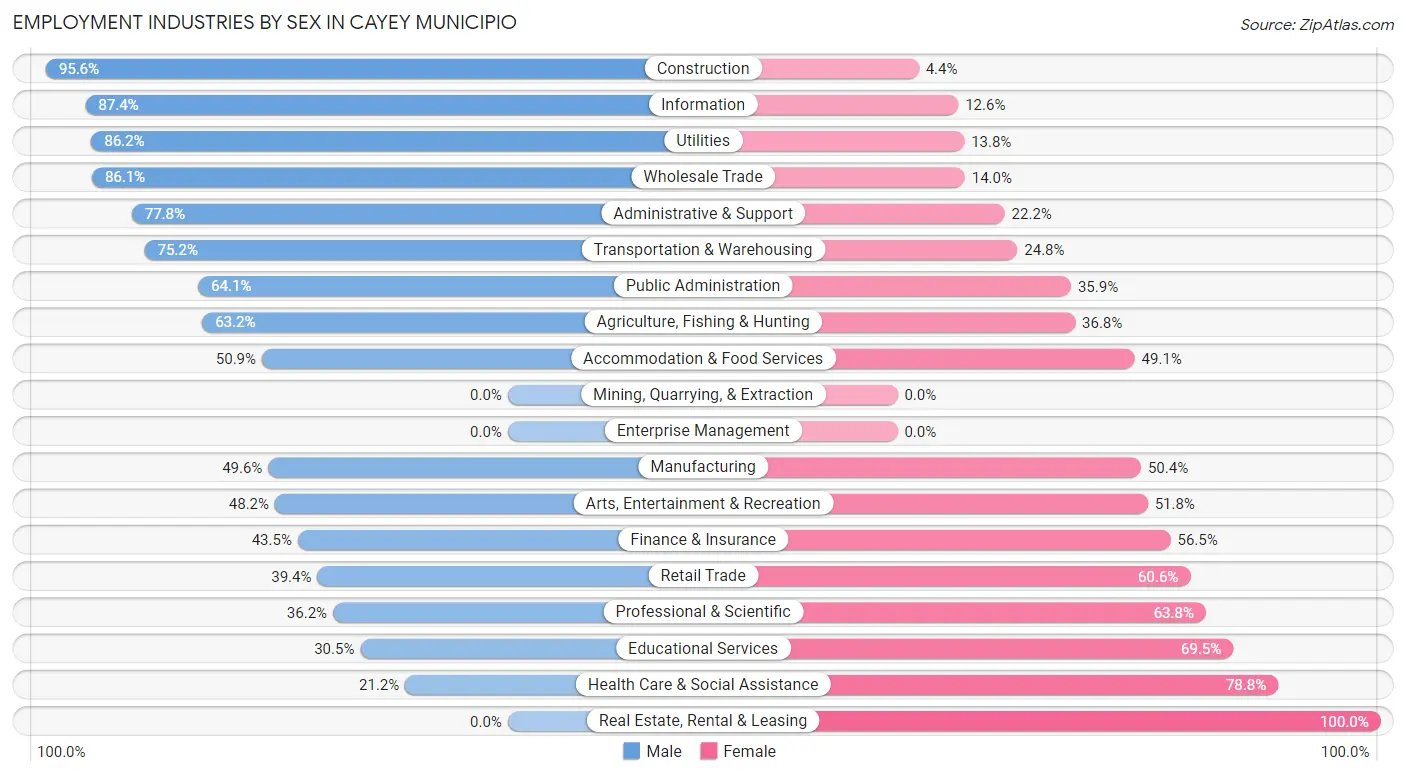
Employment Industries by Sex in Cayey Municipio
The Cayey Municipio industries that see more men than women are Construction (95.6%), Information (87.4%), and Utilities (86.2%), whereas the industries that tend to have a higher number of women are Real Estate, Rental & Leasing (100.0%), Health Care & Social Assistance (78.8%), and Educational Services (69.5%).
| Industry | Male | Female |
| Agriculture, Fishing & Hunting | 55 (63.2%) | 32 (36.8%) |
| Mining, Quarrying, & Extraction | 0 (0.0%) | 0 (0.0%) |
| Construction | 911 (95.6%) | 42 (4.4%) |
| Manufacturing | 773 (49.6%) | 786 (50.4%) |
| Wholesale Trade | 407 (86.1%) | 66 (14.0%) |
| Retail Trade | 809 (39.4%) | 1,243 (60.6%) |
| Transportation & Warehousing | 221 (75.2%) | 73 (24.8%) |
| Utilities | 106 (86.2%) | 17 (13.8%) |
| Information | 118 (87.4%) | 17 (12.6%) |
| Finance & Insurance | 153 (43.5%) | 199 (56.5%) |
| Real Estate, Rental & Leasing | 0 (0.0%) | 81 (100.0%) |
| Professional & Scientific | 186 (36.2%) | 328 (63.8%) |
| Enterprise Management | 0 (0.0%) | 0 (0.0%) |
| Administrative & Support | 459 (77.8%) | 131 (22.2%) |
| Educational Services | 558 (30.5%) | 1,270 (69.5%) |
| Health Care & Social Assistance | 439 (21.2%) | 1,628 (78.8%) |
| Arts, Entertainment & Recreation | 67 (48.2%) | 72 (51.8%) |
| Accommodation & Food Services | 428 (50.9%) | 413 (49.1%) |
| Public Administration | 592 (64.1%) | 332 (35.9%) |
| Total | 6,834 (49.4%) | 7,000 (50.6%) |
Education in Cayey Municipio
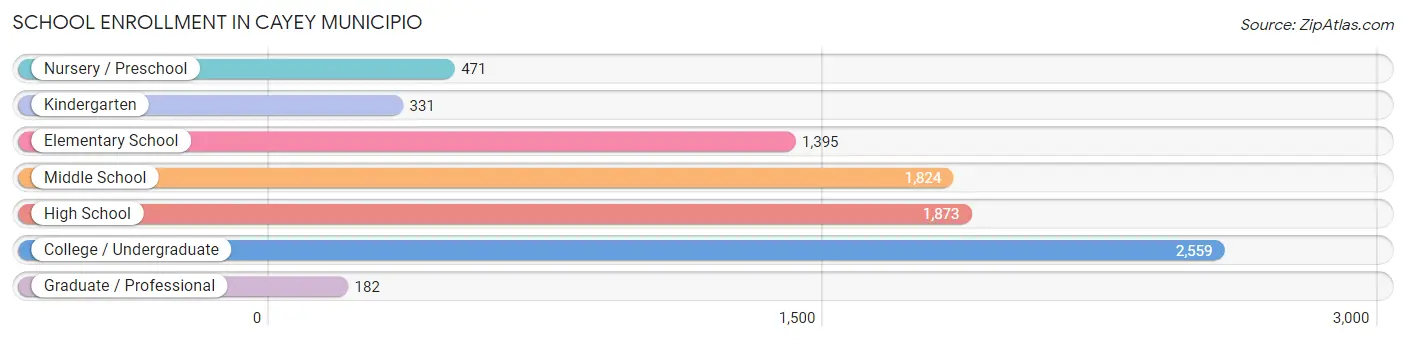
School Enrollment in Cayey Municipio
The most common levels of schooling among the 8,635 students in Cayey Municipio are college / undergraduate (2,559 | 29.6%), high school (1,873 | 21.7%), and middle school (1,824 | 21.1%).
| School Level | # Students | % Students |
| Nursery / Preschool | 471 | 5.4% |
| Kindergarten | 331 | 3.8% |
| Elementary School | 1,395 | 16.2% |
| Middle School | 1,824 | 21.1% |
| High School | 1,873 | 21.7% |
| College / Undergraduate | 2,559 | 29.6% |
| Graduate / Professional | 182 | 2.1% |
| Total | 8,635 | 100.0% |
School Enrollment by Age by Funding Source in Cayey Municipio
Out of a total of 8,635 students who are enrolled in schools in Cayey Municipio, 3,152 (36.5%) attend a private institution, while the remaining 5,483 (63.5%) are enrolled in public schools. The age group of 35 years and over has the highest likelihood of being enrolled in private schools, with 162 (83.1% in the age bracket) enrolled. Conversely, the age group of 5 to 9 year old has the lowest likelihood of being enrolled in a private school, with 1,364 (83.6% in the age bracket) attending a public institution.
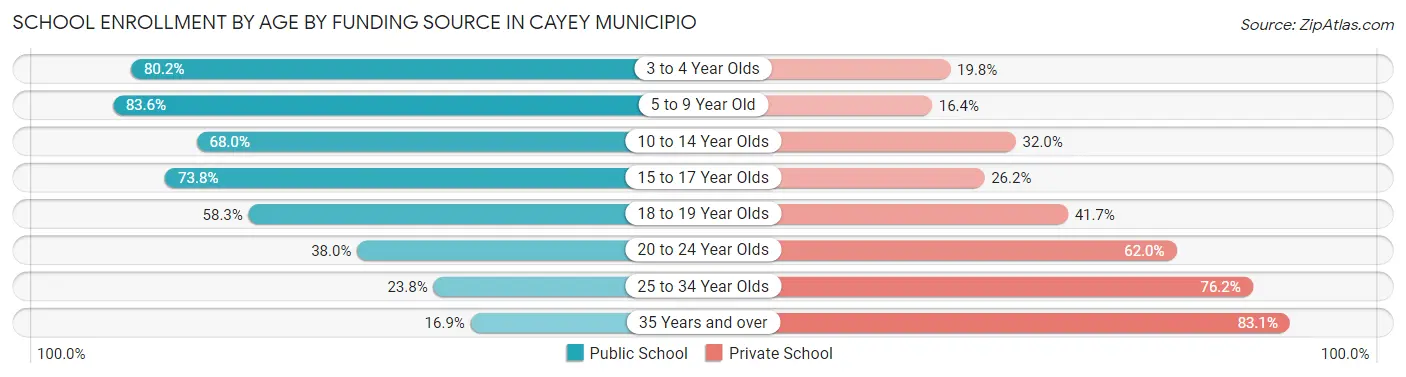
| Age Bracket | Public School | Private School |
| 3 to 4 Year Olds | 360 (80.2%) | 89 (19.8%) |
| 5 to 9 Year Old | 1,364 (83.6%) | 268 (16.4%) |
| 10 to 14 Year Olds | 1,585 (68.0%) | 747 (32.0%) |
| 15 to 17 Year Olds | 1,080 (73.8%) | 383 (26.2%) |
| 18 to 19 Year Olds | 458 (58.3%) | 328 (41.7%) |
| 20 to 24 Year Olds | 488 (38.0%) | 795 (62.0%) |
| 25 to 34 Year Olds | 118 (23.8%) | 377 (76.2%) |
| 35 Years and over | 33 (16.9%) | 162 (83.1%) |
| Total | 5,483 (63.5%) | 3,152 (36.5%) |
Educational Attainment by Field of Study in Cayey Municipio
Business (2,067 | 23.4%), education (1,648 | 18.6%), science & technology (1,187 | 13.4%), physical & health sciences (691 | 7.8%), and engineering (636 | 7.2%) are the most common fields of study among 8,852 individuals in Cayey Municipio who have obtained a bachelor's degree or higher.
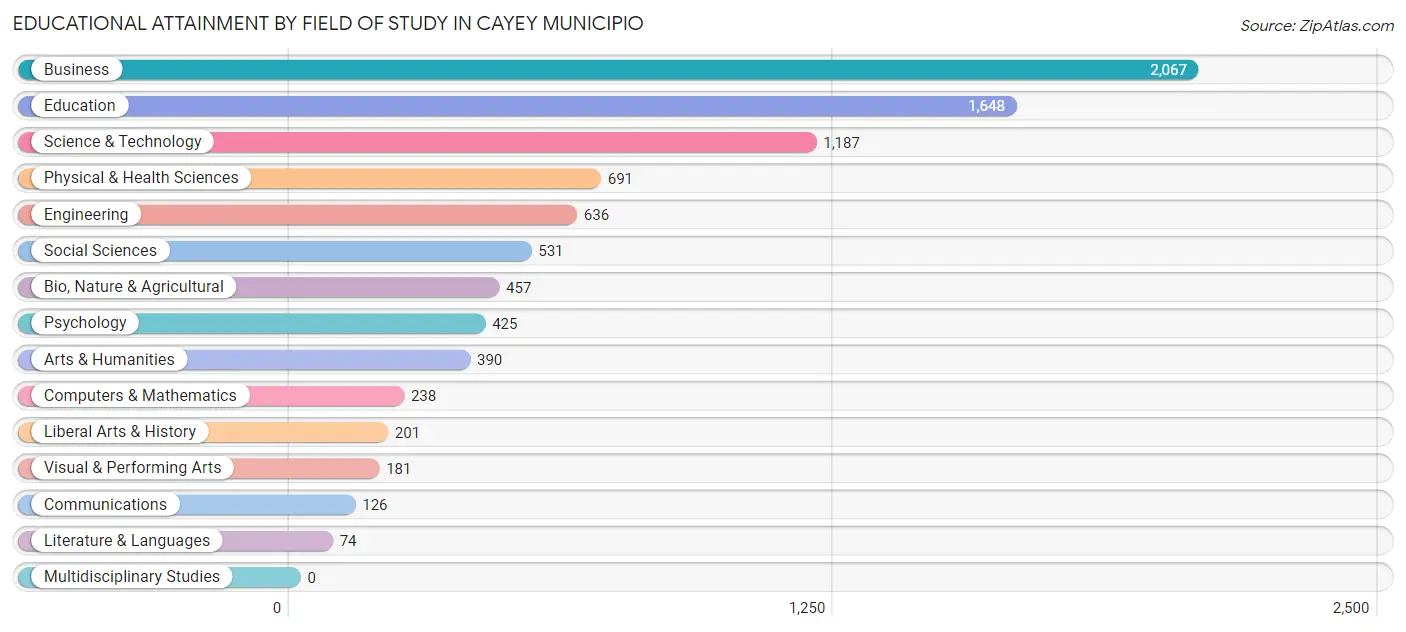
| Field of Study | # Graduates | % Graduates |
| Computers & Mathematics | 238 | 2.7% |
| Bio, Nature & Agricultural | 457 | 5.2% |
| Physical & Health Sciences | 691 | 7.8% |
| Psychology | 425 | 4.8% |
| Social Sciences | 531 | 6.0% |
| Engineering | 636 | 7.2% |
| Multidisciplinary Studies | 0 | 0.0% |
| Science & Technology | 1,187 | 13.4% |
| Business | 2,067 | 23.4% |
| Education | 1,648 | 18.6% |
| Literature & Languages | 74 | 0.8% |
| Liberal Arts & History | 201 | 2.3% |
| Visual & Performing Arts | 181 | 2.0% |
| Communications | 126 | 1.4% |
| Arts & Humanities | 390 | 4.4% |
| Total | 8,852 | 100.0% |
Transportation & Commute in Cayey Municipio
Vehicle Availability by Sex in Cayey Municipio
The most prevalent vehicle ownership categories in Cayey Municipio are males with 2 vehicles (3,354, accounting for 48.7%) and females with 2 vehicles (2,629, making up 48.5%).
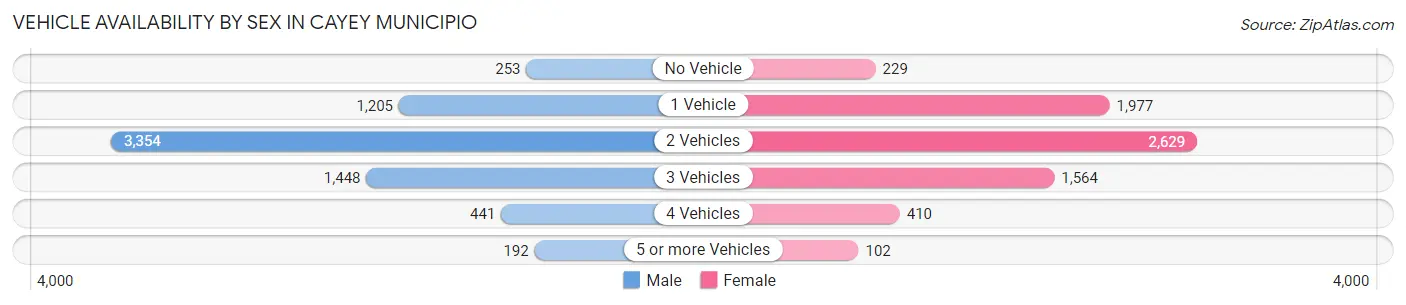
| Vehicles Available | Male | Female |
| No Vehicle | 253 (3.7%) | 229 (3.3%) |
| 1 Vehicle | 1,205 (17.5%) | 1,977 (28.6%) |
| 2 Vehicles | 3,354 (48.7%) | 2,629 (38.0%) |
| 3 Vehicles | 1,448 (21.0%) | 1,564 (22.6%) |
| 4 Vehicles | 441 (6.4%) | 410 (5.9%) |
| 5 or more Vehicles | 192 (2.8%) | 102 (1.5%) |
| Total | 6,893 (100.0%) | 6,911 (100.0%) |
Commute Time in Cayey Municipio
The most frequently occuring commute durations in Cayey Municipio are 10 to 14 minutes (2,854 commuters, 20.7%), 15 to 19 minutes (2,275 commuters, 16.5%), and 30 to 34 minutes (1,497 commuters, 10.8%).
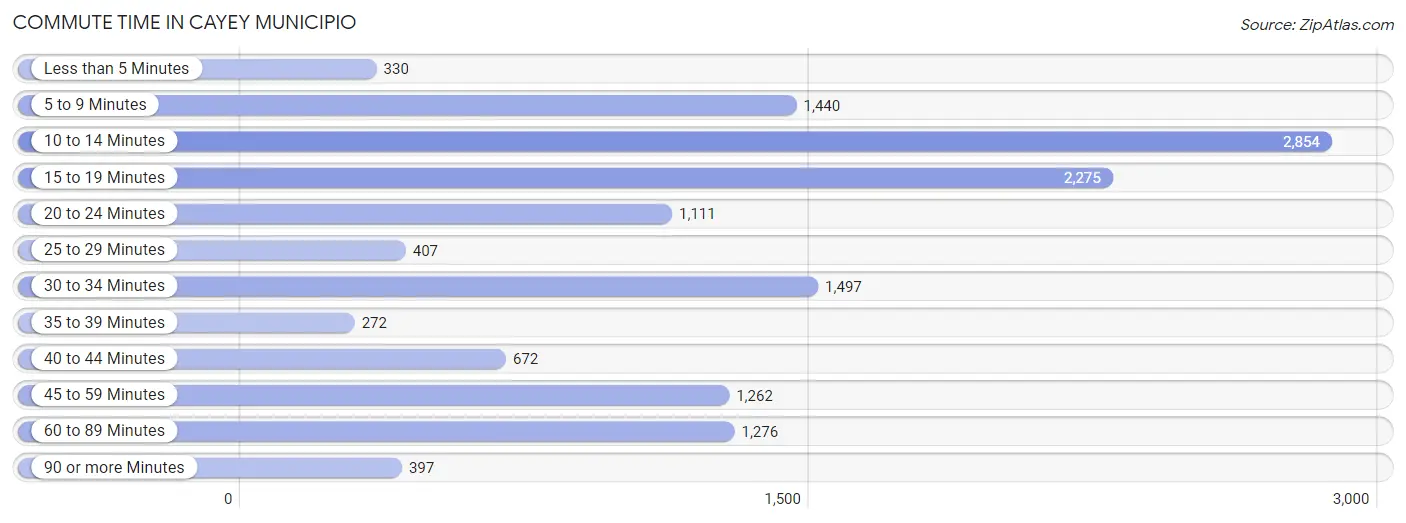
| Commute Time | # Commuters | % Commuters |
| Less than 5 Minutes | 330 | 2.4% |
| 5 to 9 Minutes | 1,440 | 10.4% |
| 10 to 14 Minutes | 2,854 | 20.7% |
| 15 to 19 Minutes | 2,275 | 16.5% |
| 20 to 24 Minutes | 1,111 | 8.1% |
| 25 to 29 Minutes | 407 | 2.9% |
| 30 to 34 Minutes | 1,497 | 10.8% |
| 35 to 39 Minutes | 272 | 2.0% |
| 40 to 44 Minutes | 672 | 4.9% |
| 45 to 59 Minutes | 1,262 | 9.1% |
| 60 to 89 Minutes | 1,276 | 9.2% |
| 90 or more Minutes | 397 | 2.9% |
Commute Time by Sex in Cayey Municipio
The most common commute times in Cayey Municipio are 10 to 14 minutes (1,477 commuters, 21.5%) for males and 15 to 19 minutes (1,413 commuters, 20.4%) for females.
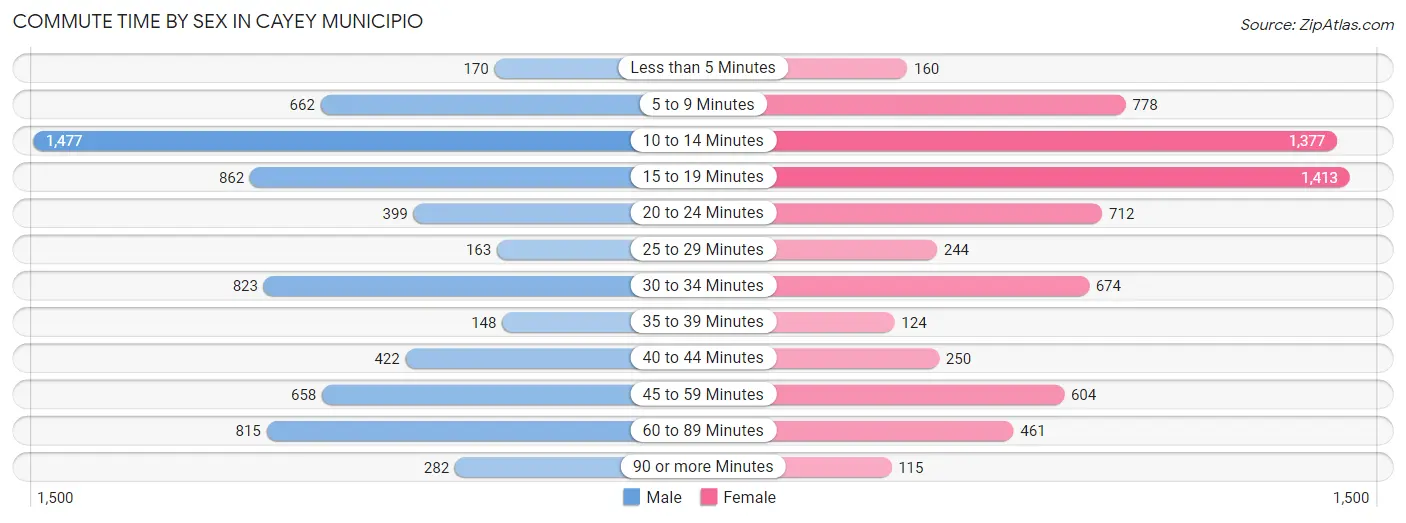
| Commute Time | Male | Female |
| Less than 5 Minutes | 170 (2.5%) | 160 (2.3%) |
| 5 to 9 Minutes | 662 (9.6%) | 778 (11.3%) |
| 10 to 14 Minutes | 1,477 (21.5%) | 1,377 (19.9%) |
| 15 to 19 Minutes | 862 (12.5%) | 1,413 (20.4%) |
| 20 to 24 Minutes | 399 (5.8%) | 712 (10.3%) |
| 25 to 29 Minutes | 163 (2.4%) | 244 (3.5%) |
| 30 to 34 Minutes | 823 (12.0%) | 674 (9.8%) |
| 35 to 39 Minutes | 148 (2.1%) | 124 (1.8%) |
| 40 to 44 Minutes | 422 (6.1%) | 250 (3.6%) |
| 45 to 59 Minutes | 658 (9.6%) | 604 (8.7%) |
| 60 to 89 Minutes | 815 (11.8%) | 461 (6.7%) |
| 90 or more Minutes | 282 (4.1%) | 115 (1.7%) |
Time of Departure to Work by Sex in Cayey Municipio
The most frequent times of departure to work in Cayey Municipio are 7:00 AM to 7:29 AM (955, 13.9%) for males and 7:00 AM to 7:29 AM (1,579, 22.8%) for females.
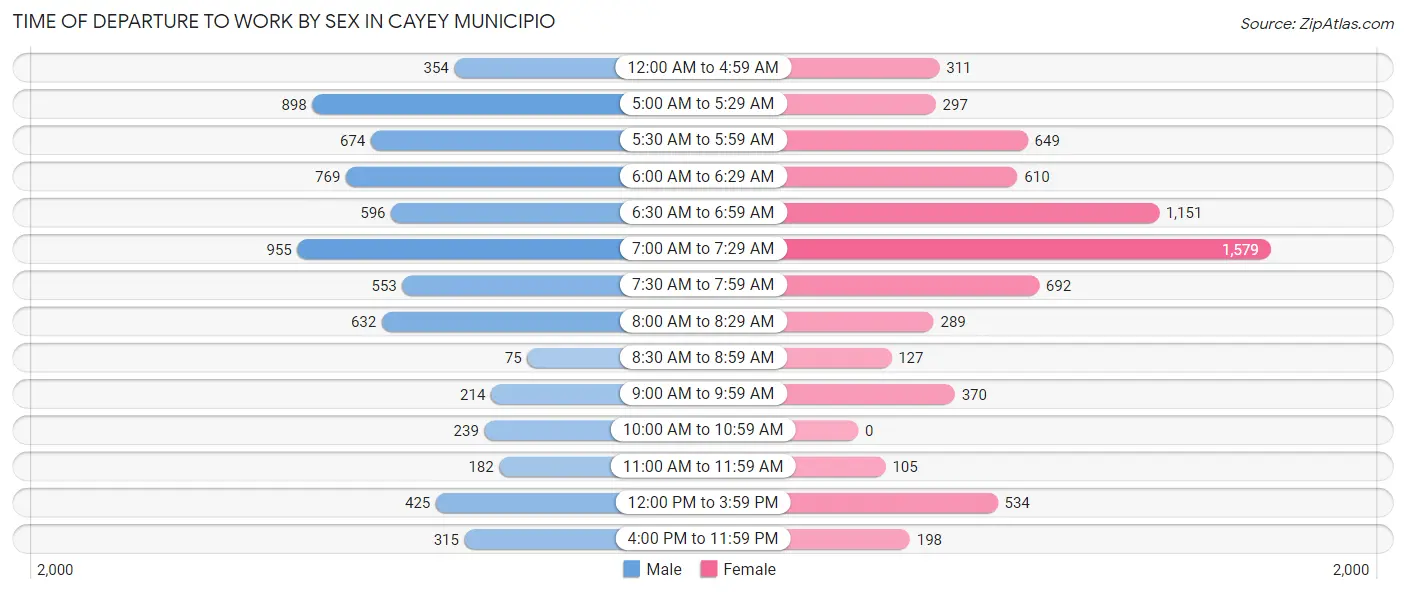
| Time of Departure | Male | Female |
| 12:00 AM to 4:59 AM | 354 (5.1%) | 311 (4.5%) |
| 5:00 AM to 5:29 AM | 898 (13.1%) | 297 (4.3%) |
| 5:30 AM to 5:59 AM | 674 (9.8%) | 649 (9.4%) |
| 6:00 AM to 6:29 AM | 769 (11.2%) | 610 (8.8%) |
| 6:30 AM to 6:59 AM | 596 (8.7%) | 1,151 (16.7%) |
| 7:00 AM to 7:29 AM | 955 (13.9%) | 1,579 (22.8%) |
| 7:30 AM to 7:59 AM | 553 (8.0%) | 692 (10.0%) |
| 8:00 AM to 8:29 AM | 632 (9.2%) | 289 (4.2%) |
| 8:30 AM to 8:59 AM | 75 (1.1%) | 127 (1.8%) |
| 9:00 AM to 9:59 AM | 214 (3.1%) | 370 (5.3%) |
| 10:00 AM to 10:59 AM | 239 (3.5%) | 0 (0.0%) |
| 11:00 AM to 11:59 AM | 182 (2.6%) | 105 (1.5%) |
| 12:00 PM to 3:59 PM | 425 (6.2%) | 534 (7.7%) |
| 4:00 PM to 11:59 PM | 315 (4.6%) | 198 (2.9%) |
| Total | 6,881 (100.0%) | 6,912 (100.0%) |
Housing Occupancy in Cayey Municipio
Occupancy by Ownership in Cayey Municipio
Of the total 16,151 dwellings in Cayey Municipio, owner-occupied units account for 10,188 (63.1%), while renter-occupied units make up 5,963 (36.9%).
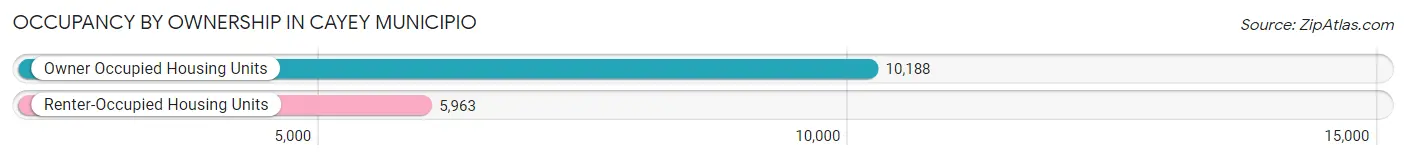
| Occupancy | # Housing Units | % Housing Units |
| Owner Occupied Housing Units | 10,188 | 63.1% |
| Renter-Occupied Housing Units | 5,963 | 36.9% |
| Total Occupied Housing Units | 16,151 | 100.0% |
Occupancy by Household Size in Cayey Municipio
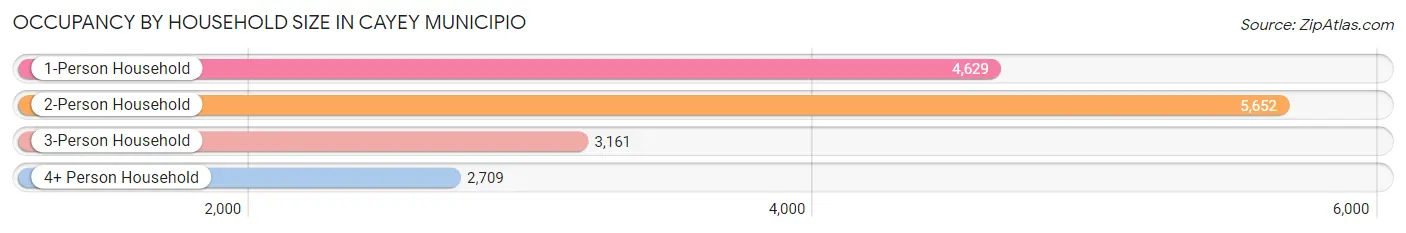
| Household Size | # Housing Units | % Housing Units |
| 1-Person Household | 4,629 | 28.7% |
| 2-Person Household | 5,652 | 35.0% |
| 3-Person Household | 3,161 | 19.6% |
| 4+ Person Household | 2,709 | 16.8% |
| Total Housing Units | 16,151 | 100.0% |
Occupancy by Ownership by Household Size in Cayey Municipio
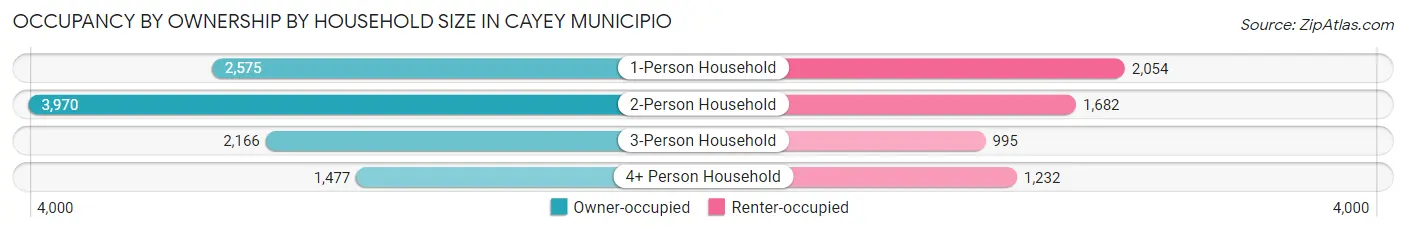
| Household Size | Owner-occupied | Renter-occupied |
| 1-Person Household | 2,575 (55.6%) | 2,054 (44.4%) |
| 2-Person Household | 3,970 (70.2%) | 1,682 (29.8%) |
| 3-Person Household | 2,166 (68.5%) | 995 (31.5%) |
| 4+ Person Household | 1,477 (54.5%) | 1,232 (45.5%) |
| Total Housing Units | 10,188 (63.1%) | 5,963 (36.9%) |
Occupancy by Educational Attainment in Cayey Municipio
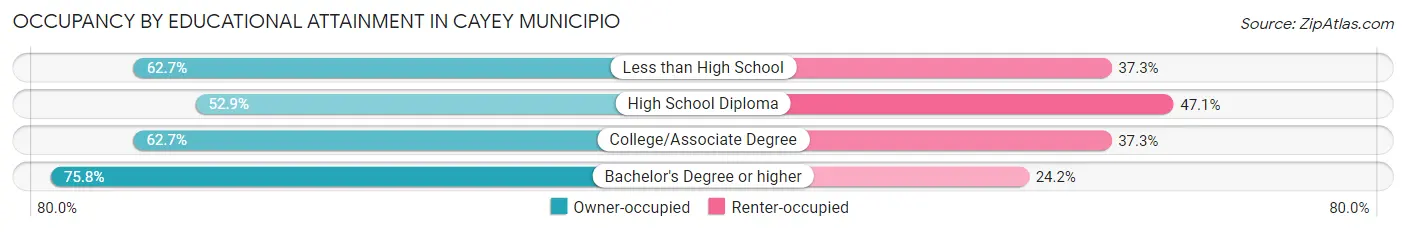
| Household Size | Owner-occupied | Renter-occupied |
| Less than High School | 2,408 (62.7%) | 1,434 (37.3%) |
| High School Diploma | 2,687 (52.9%) | 2,395 (47.1%) |
| College/Associate Degree | 1,849 (62.7%) | 1,099 (37.3%) |
| Bachelor's Degree or higher | 3,244 (75.8%) | 1,035 (24.2%) |
Occupancy by Age of Householder in Cayey Municipio
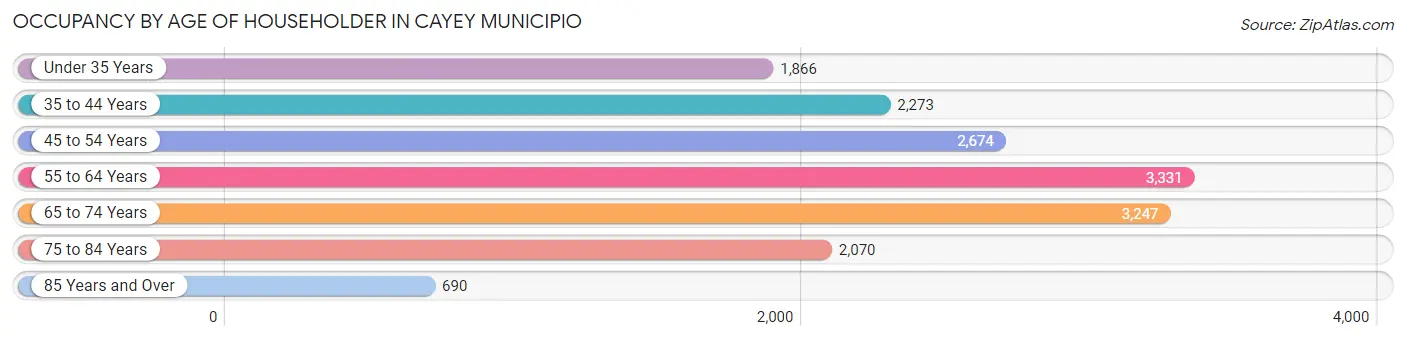
| Age Bracket | # Households | % Households |
| Under 35 Years | 1,866 | 11.6% |
| 35 to 44 Years | 2,273 | 14.1% |
| 45 to 54 Years | 2,674 | 16.6% |
| 55 to 64 Years | 3,331 | 20.6% |
| 65 to 74 Years | 3,247 | 20.1% |
| 75 to 84 Years | 2,070 | 12.8% |
| 85 Years and Over | 690 | 4.3% |
| Total | 16,151 | 100.0% |
Housing Finances in Cayey Municipio
Median Income by Occupancy in Cayey Municipio
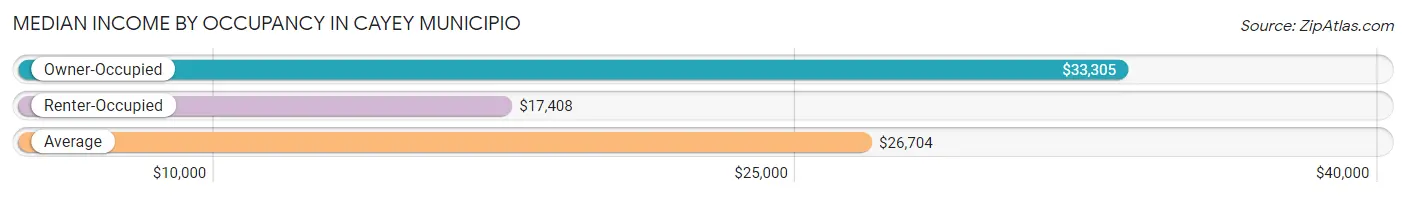
| Occupancy Type | # Households | Median Income |
| Owner-Occupied | 10,188 (63.1%) | $33,305 |
| Renter-Occupied | 5,963 (36.9%) | $17,408 |
| Average | 16,151 (100.0%) | $26,704 |
Occupancy by Householder Income Bracket in Cayey Municipio
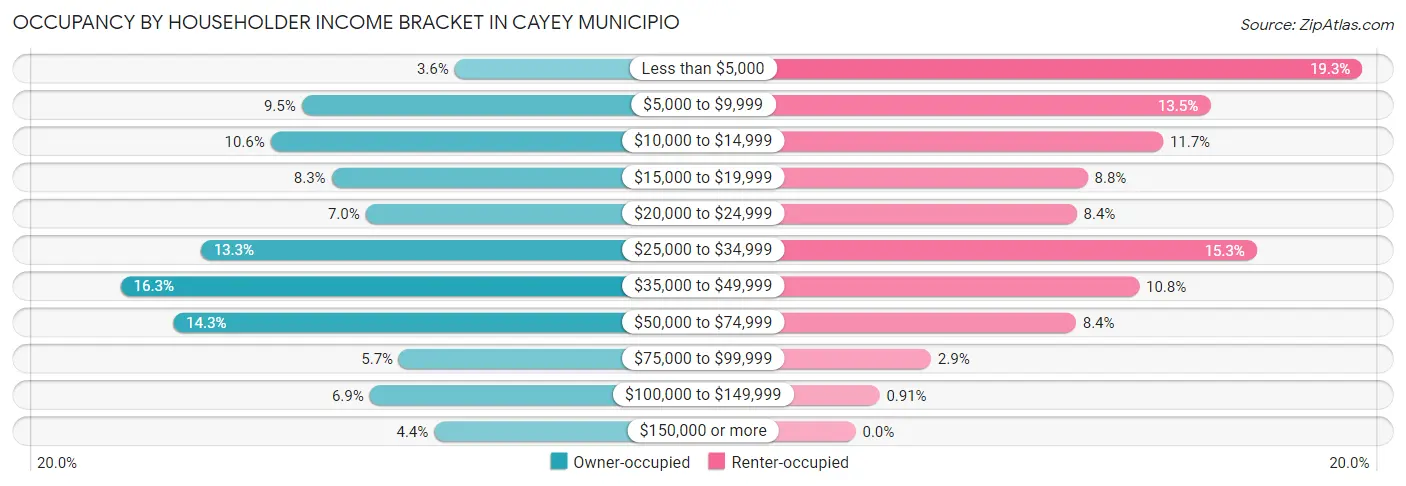
| Income Bracket | Owner-occupied | Renter-occupied |
| Less than $5,000 | 369 (3.6%) | 1,151 (19.3%) |
| $5,000 to $9,999 | 963 (9.5%) | 805 (13.5%) |
| $10,000 to $14,999 | 1,083 (10.6%) | 698 (11.7%) |
| $15,000 to $19,999 | 847 (8.3%) | 527 (8.8%) |
| $20,000 to $24,999 | 714 (7.0%) | 502 (8.4%) |
| $25,000 to $34,999 | 1,354 (13.3%) | 911 (15.3%) |
| $35,000 to $49,999 | 1,665 (16.3%) | 644 (10.8%) |
| $50,000 to $74,999 | 1,461 (14.3%) | 500 (8.4%) |
| $75,000 to $99,999 | 585 (5.7%) | 171 (2.9%) |
| $100,000 to $149,999 | 699 (6.9%) | 54 (0.9%) |
| $150,000 or more | 448 (4.4%) | 0 (0.0%) |
| Total | 10,188 (100.0%) | 5,963 (100.0%) |
Monthly Housing Cost Tiers in Cayey Municipio
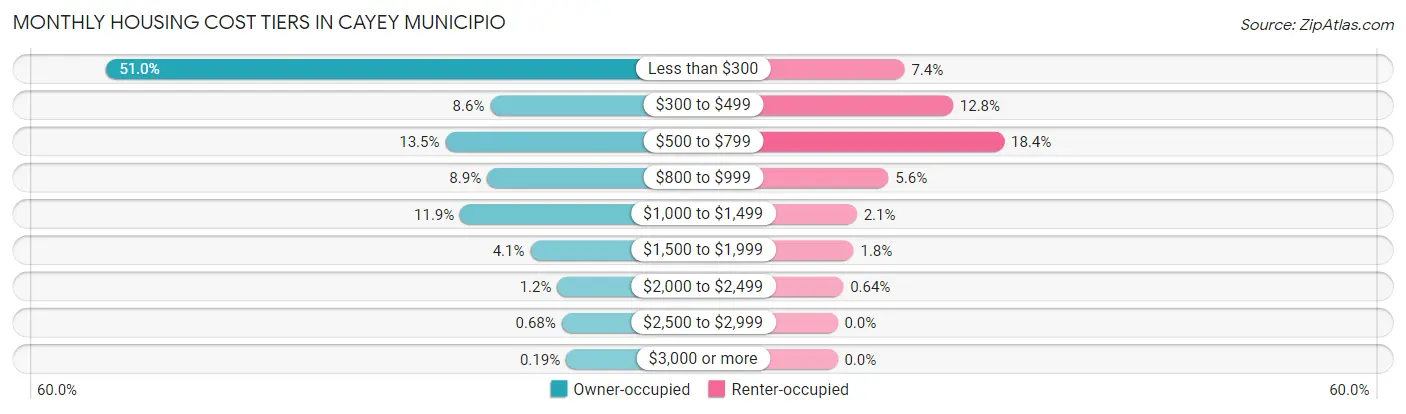
| Monthly Cost | Owner-occupied | Renter-occupied |
| Less than $300 | 5,193 (51.0%) | 442 (7.4%) |
| $300 to $499 | 872 (8.6%) | 760 (12.8%) |
| $500 to $799 | 1,377 (13.5%) | 1,098 (18.4%) |
| $800 to $999 | 909 (8.9%) | 336 (5.6%) |
| $1,000 to $1,499 | 1,211 (11.9%) | 127 (2.1%) |
| $1,500 to $1,999 | 421 (4.1%) | 106 (1.8%) |
| $2,000 to $2,499 | 117 (1.1%) | 38 (0.6%) |
| $2,500 to $2,999 | 69 (0.7%) | 0 (0.0%) |
| $3,000 or more | 19 (0.2%) | 0 (0.0%) |
| Total | 10,188 (100.0%) | 5,963 (100.0%) |
Physical Housing Characteristics in Cayey Municipio
Housing Structures in Cayey Municipio
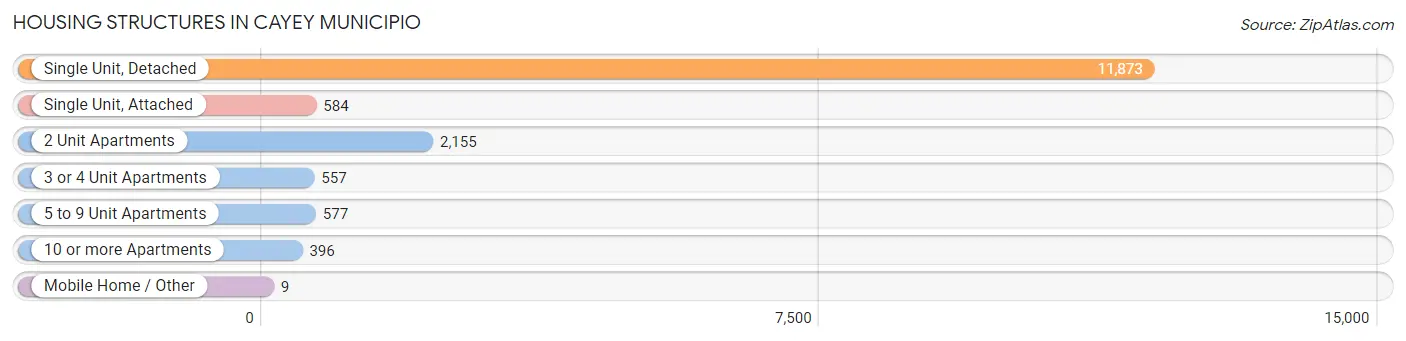
| Structure Type | # Housing Units | % Housing Units |
| Single Unit, Detached | 11,873 | 73.5% |
| Single Unit, Attached | 584 | 3.6% |
| 2 Unit Apartments | 2,155 | 13.3% |
| 3 or 4 Unit Apartments | 557 | 3.5% |
| 5 to 9 Unit Apartments | 577 | 3.6% |
| 10 or more Apartments | 396 | 2.5% |
| Mobile Home / Other | 9 | 0.1% |
| Total | 16,151 | 100.0% |
Housing Structures by Occupancy in Cayey Municipio
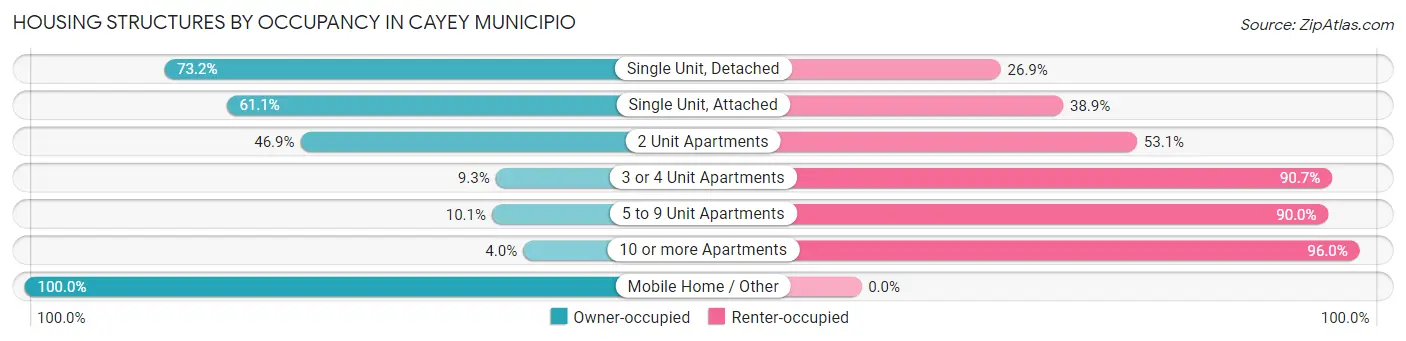
| Structure Type | Owner-occupied | Renter-occupied |
| Single Unit, Detached | 8,685 (73.2%) | 3,188 (26.9%) |
| Single Unit, Attached | 357 (61.1%) | 227 (38.9%) |
| 2 Unit Apartments | 1,011 (46.9%) | 1,144 (53.1%) |
| 3 or 4 Unit Apartments | 52 (9.3%) | 505 (90.7%) |
| 5 to 9 Unit Apartments | 58 (10.1%) | 519 (89.9%) |
| 10 or more Apartments | 16 (4.0%) | 380 (96.0%) |
| Mobile Home / Other | 9 (100.0%) | 0 (0.0%) |
| Total | 10,188 (63.1%) | 5,963 (36.9%) |
Housing Structures by Number of Rooms in Cayey Municipio
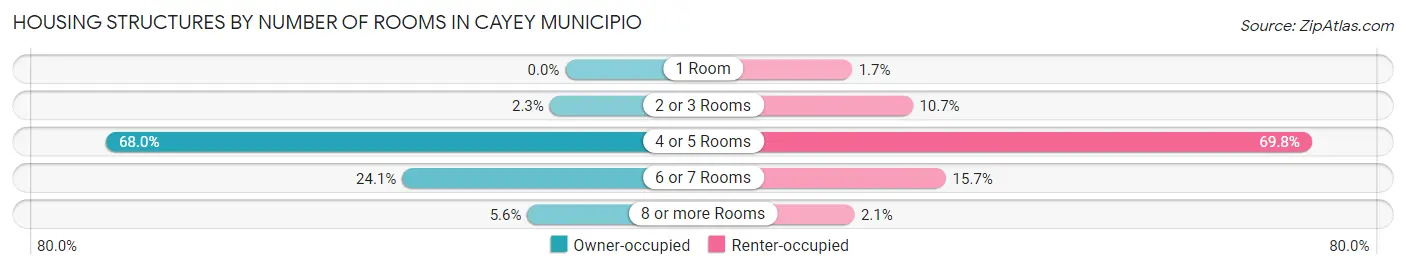
| Number of Rooms | Owner-occupied | Renter-occupied |
| 1 Room | 0 (0.0%) | 104 (1.7%) |
| 2 or 3 Rooms | 235 (2.3%) | 640 (10.7%) |
| 4 or 5 Rooms | 6,923 (67.9%) | 4,162 (69.8%) |
| 6 or 7 Rooms | 2,458 (24.1%) | 933 (15.7%) |
| 8 or more Rooms | 572 (5.6%) | 124 (2.1%) |
| Total | 10,188 (100.0%) | 5,963 (100.0%) |
Housing Structure by Heating Type in Cayey Municipio
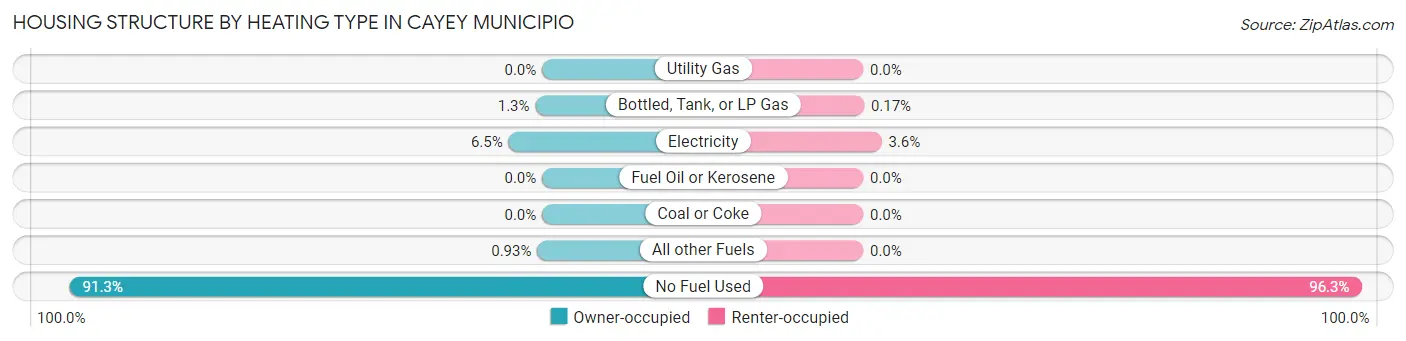
| Heating Type | Owner-occupied | Renter-occupied |
| Utility Gas | 0 (0.0%) | 0 (0.0%) |
| Bottled, Tank, or LP Gas | 132 (1.3%) | 10 (0.2%) |
| Electricity | 660 (6.5%) | 212 (3.6%) |
| Fuel Oil or Kerosene | 0 (0.0%) | 0 (0.0%) |
| Coal or Coke | 0 (0.0%) | 0 (0.0%) |
| All other Fuels | 95 (0.9%) | 0 (0.0%) |
| No Fuel Used | 9,301 (91.3%) | 5,741 (96.3%) |
| Total | 10,188 (100.0%) | 5,963 (100.0%) |
Household Vehicle Usage in Cayey Municipio
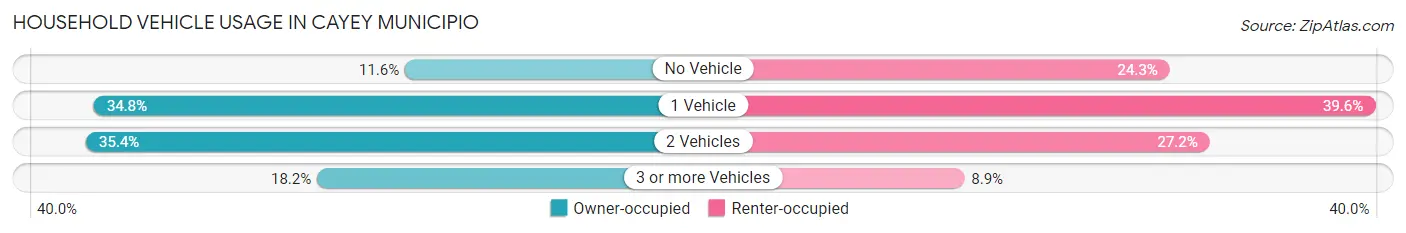
| Vehicles per Household | Owner-occupied | Renter-occupied |
| No Vehicle | 1,181 (11.6%) | 1,446 (24.2%) |
| 1 Vehicle | 3,548 (34.8%) | 2,361 (39.6%) |
| 2 Vehicles | 3,609 (35.4%) | 1,624 (27.2%) |
| 3 or more Vehicles | 1,850 (18.2%) | 532 (8.9%) |
| Total | 10,188 (100.0%) | 5,963 (100.0%) |
Real Estate & Mortgages in Cayey Municipio
Real Estate and Mortgage Overview in Cayey Municipio
| Characteristic | Without Mortgage | With Mortgage |
| Housing Units | 5,869 | 4,319 |
| Median Property Value | $119,300 | $149,800 |
| Median Household Income | $25,476 | $331 |
| Monthly Housing Costs | $142 | $19 |
| Real Estate Taxes | $459 | $3,481 |
Property Value by Mortgage Status in Cayey Municipio
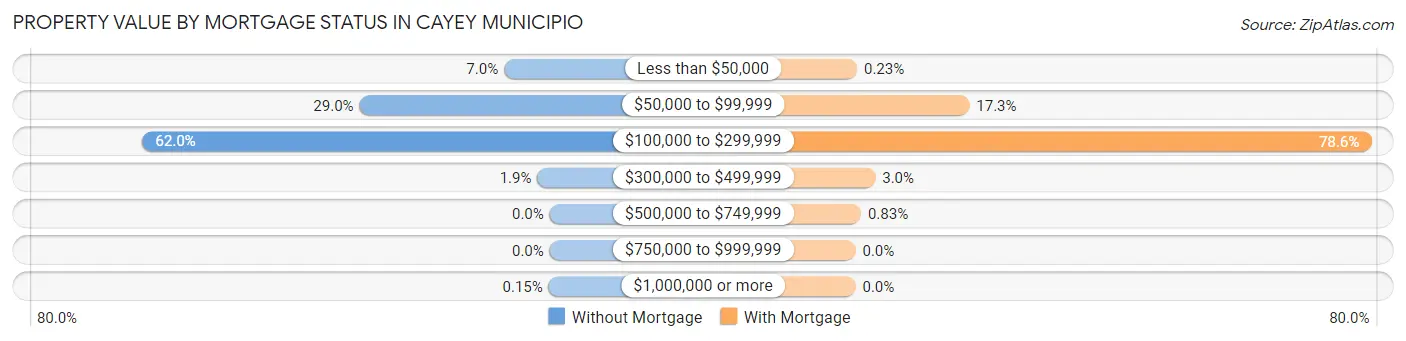
| Property Value | Without Mortgage | With Mortgage |
| Less than $50,000 | 408 (7.0%) | 10 (0.2%) |
| $50,000 to $99,999 | 1,701 (29.0%) | 749 (17.3%) |
| $100,000 to $299,999 | 3,641 (62.0%) | 3,394 (78.6%) |
| $300,000 to $499,999 | 110 (1.9%) | 130 (3.0%) |
| $500,000 to $749,999 | 0 (0.0%) | 36 (0.8%) |
| $750,000 to $999,999 | 0 (0.0%) | 0 (0.0%) |
| $1,000,000 or more | 9 (0.2%) | 0 (0.0%) |
| Total | 5,869 (100.0%) | 4,319 (100.0%) |
Household Income by Mortgage Status in Cayey Municipio
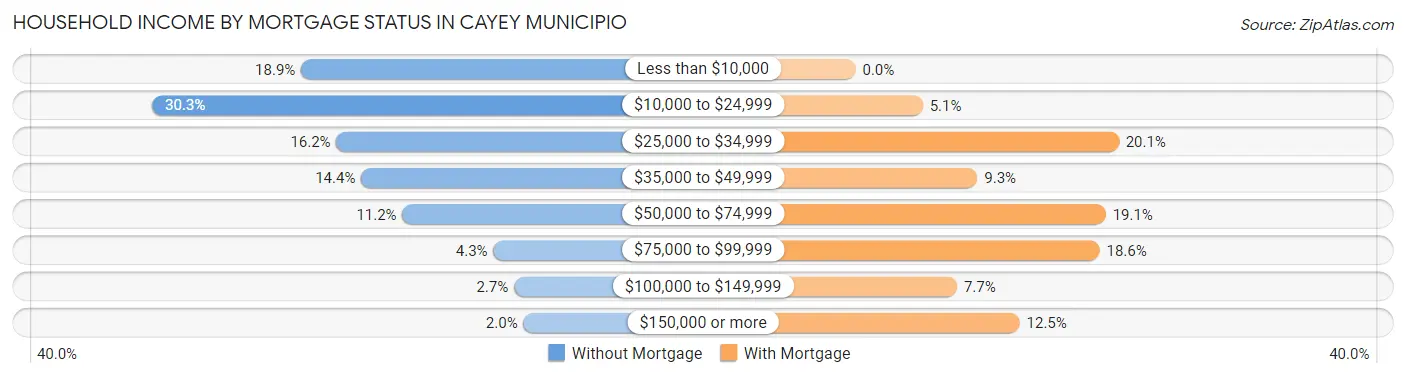
| Household Income | Without Mortgage | With Mortgage |
| Less than $10,000 | 1,111 (18.9%) | 0 (0.0%) |
| $10,000 to $24,999 | 1,778 (30.3%) | 221 (5.1%) |
| $25,000 to $34,999 | 953 (16.2%) | 866 (20.1%) |
| $35,000 to $49,999 | 842 (14.3%) | 401 (9.3%) |
| $50,000 to $74,999 | 658 (11.2%) | 823 (19.1%) |
| $75,000 to $99,999 | 251 (4.3%) | 803 (18.6%) |
| $100,000 to $149,999 | 159 (2.7%) | 334 (7.7%) |
| $150,000 or more | 117 (2.0%) | 540 (12.5%) |
| Total | 5,869 (100.0%) | 4,319 (100.0%) |
Property Value to Household Income Ratio in Cayey Municipio
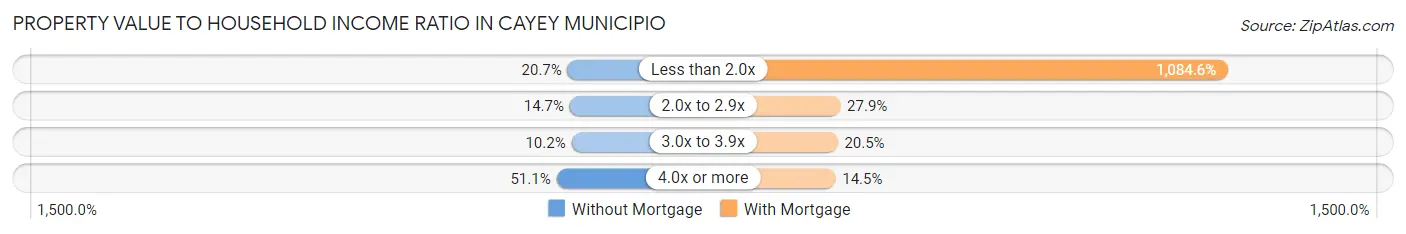
| Value-to-Income Ratio | Without Mortgage | With Mortgage |
| Less than 2.0x | 1,215 (20.7%) | 46,843 (1,084.6%) |
| 2.0x to 2.9x | 863 (14.7%) | 1,205 (27.9%) |
| 3.0x to 3.9x | 598 (10.2%) | 884 (20.5%) |
| 4.0x or more | 2,999 (51.1%) | 628 (14.5%) |
| Total | 5,869 (100.0%) | 4,319 (100.0%) |
Real Estate Taxes by Mortgage Status in Cayey Municipio
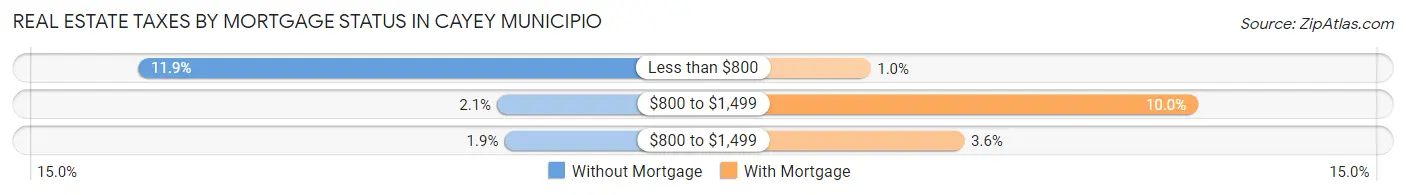
| Property Taxes | Without Mortgage | With Mortgage |
| Less than $800 | 698 (11.9%) | 44 (1.0%) |
| $800 to $1,499 | 121 (2.1%) | 432 (10.0%) |
| $800 to $1,499 | 109 (1.9%) | 155 (3.6%) |
| Total | 5,869 (100.0%) | 4,319 (100.0%) |
Health & Disability in Cayey Municipio
Health Insurance Coverage by Age in Cayey Municipio
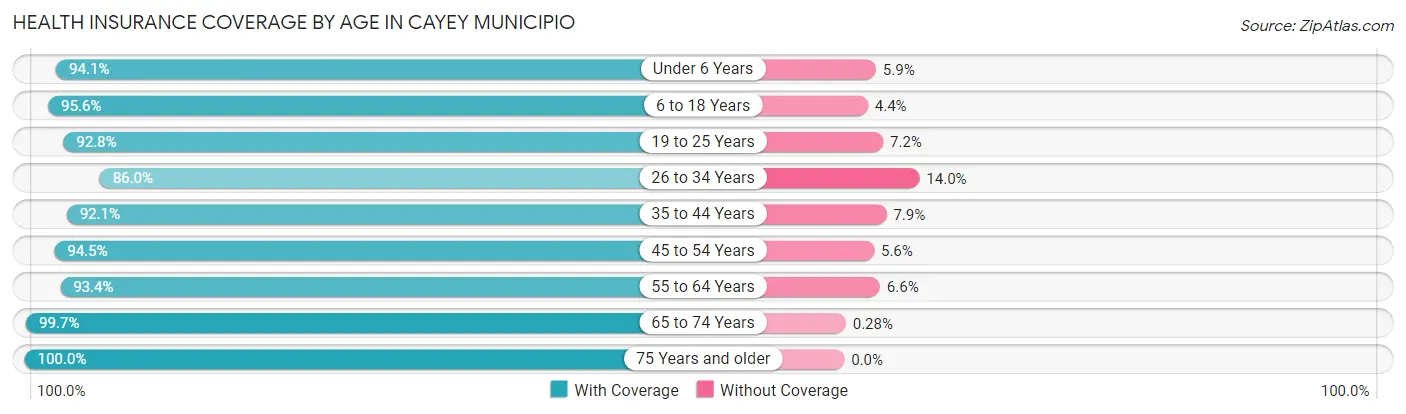
| Age Bracket | With Coverage | Without Coverage |
| Under 6 Years | 1,599 (94.1%) | 100 (5.9%) |
| 6 to 18 Years | 5,485 (95.6%) | 252 (4.4%) |
| 19 to 25 Years | 3,739 (92.8%) | 292 (7.2%) |
| 26 to 34 Years | 3,860 (86.0%) | 629 (14.0%) |
| 35 to 44 Years | 4,490 (92.1%) | 383 (7.9%) |
| 45 to 54 Years | 5,152 (94.5%) | 303 (5.6%) |
| 55 to 64 Years | 5,468 (93.4%) | 389 (6.6%) |
| 65 to 74 Years | 5,042 (99.7%) | 14 (0.3%) |
| 75 Years and older | 4,214 (100.0%) | 0 (0.0%) |
| Total | 39,049 (94.3%) | 2,362 (5.7%) |
Health Insurance Coverage by Citizenship Status in Cayey Municipio
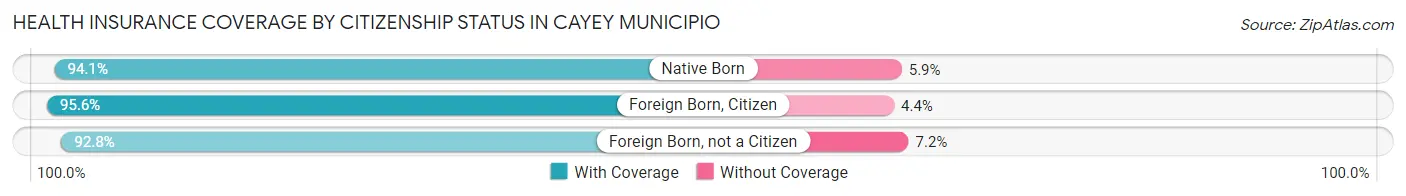
| Citizenship Status | With Coverage | Without Coverage |
| Native Born | 1,599 (94.1%) | 100 (5.9%) |
| Foreign Born, Citizen | 5,485 (95.6%) | 252 (4.4%) |
| Foreign Born, not a Citizen | 3,739 (92.8%) | 292 (7.2%) |
Health Insurance Coverage by Household Income in Cayey Municipio
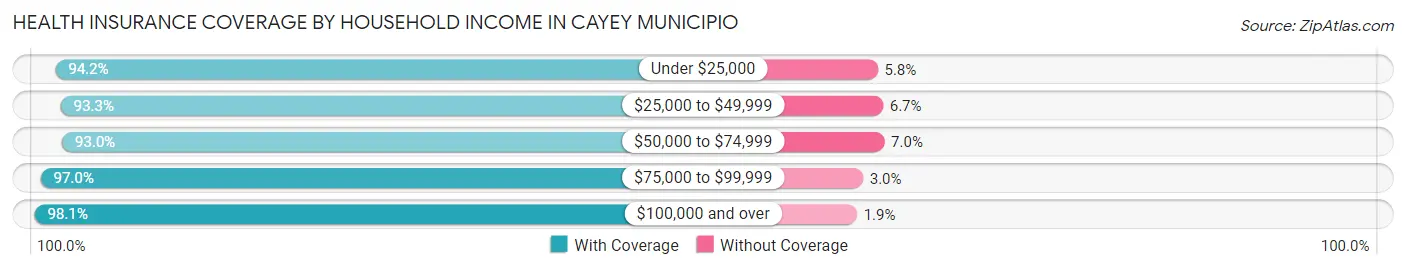
| Household Income | With Coverage | Without Coverage |
| Under $25,000 | 14,462 (94.2%) | 884 (5.8%) |
| $25,000 to $49,999 | 12,631 (93.3%) | 913 (6.7%) |
| $50,000 to $74,999 | 5,523 (93.0%) | 416 (7.0%) |
| $75,000 to $99,999 | 2,459 (97.0%) | 76 (3.0%) |
| $100,000 and over | 3,862 (98.1%) | 73 (1.9%) |
Public vs Private Health Insurance Coverage by Age in Cayey Municipio
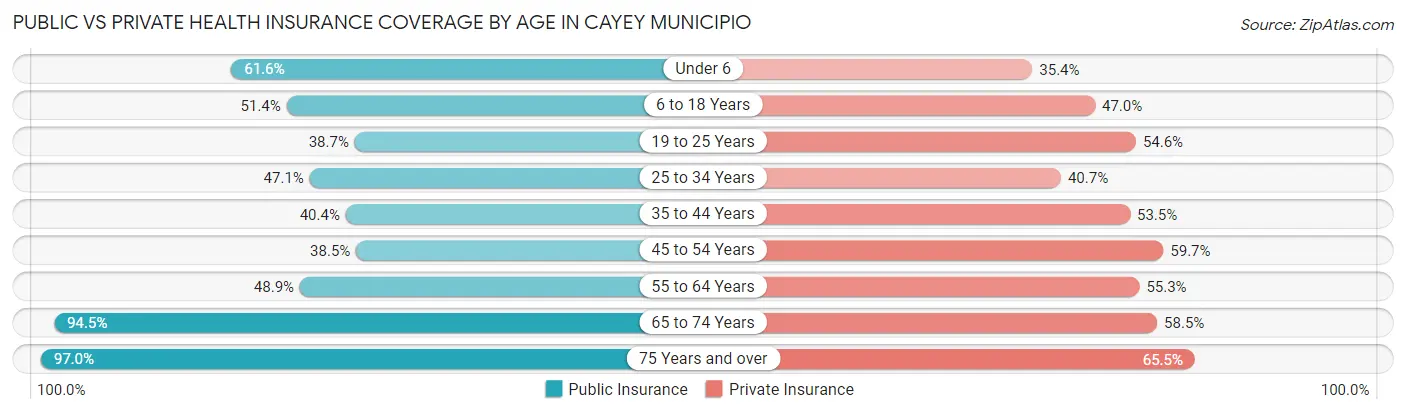
| Age Bracket | Public Insurance | Private Insurance |
| Under 6 | 1,047 (61.6%) | 601 (35.4%) |
| 6 to 18 Years | 2,947 (51.4%) | 2,697 (47.0%) |
| 19 to 25 Years | 1,561 (38.7%) | 2,201 (54.6%) |
| 25 to 34 Years | 2,114 (47.1%) | 1,826 (40.7%) |
| 35 to 44 Years | 1,968 (40.4%) | 2,607 (53.5%) |
| 45 to 54 Years | 2,098 (38.5%) | 3,256 (59.7%) |
| 55 to 64 Years | 2,864 (48.9%) | 3,236 (55.2%) |
| 65 to 74 Years | 4,780 (94.5%) | 2,960 (58.5%) |
| 75 Years and over | 4,087 (97.0%) | 2,761 (65.5%) |
| Total | 23,466 (56.7%) | 22,145 (53.5%) |
Disability Status by Sex by Age in Cayey Municipio
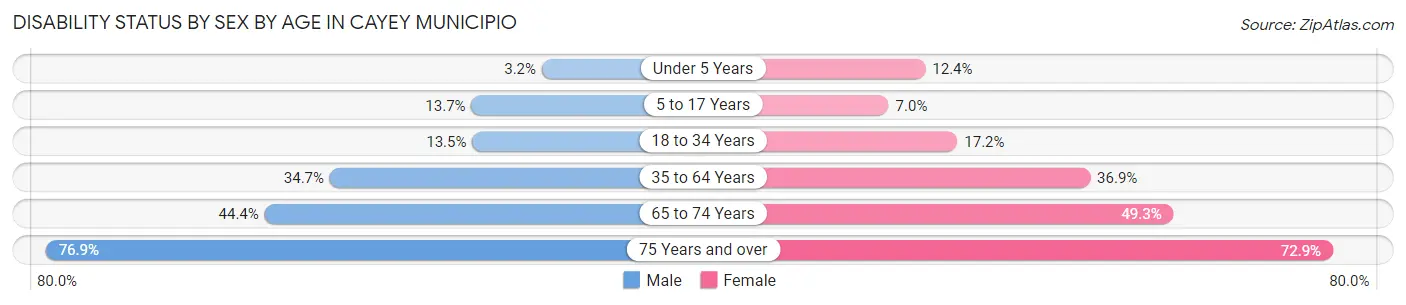
| Age Bracket | Male | Female |
| Under 5 Years | 22 (3.2%) | 89 (12.4%) |
| 5 to 17 Years | 371 (13.7%) | 194 (7.0%) |
| 18 to 34 Years | 599 (13.5%) | 792 (17.2%) |
| 35 to 64 Years | 2,655 (34.7%) | 3,144 (36.9%) |
| 65 to 74 Years | 1,062 (44.4%) | 1,311 (49.2%) |
| 75 Years and over | 1,448 (76.9%) | 1,699 (72.9%) |
Disability Class by Sex by Age in Cayey Municipio
Disability Class: Hearing Difficulty
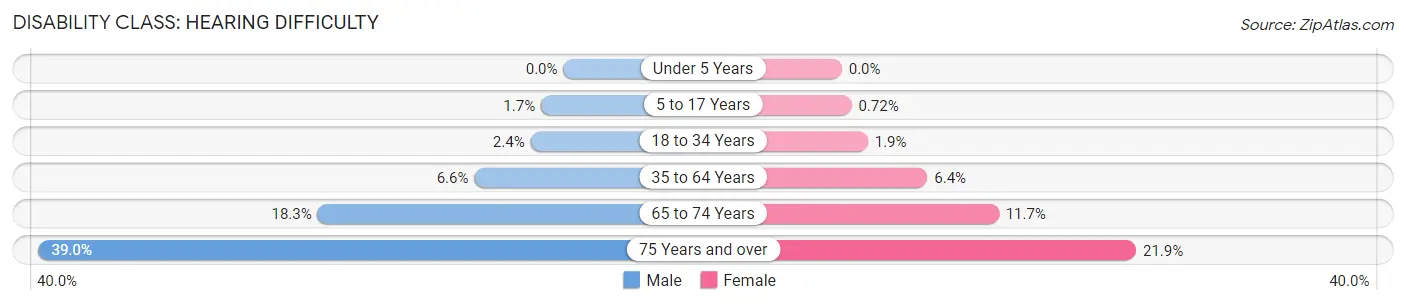
| Age Bracket | Male | Female |
| Under 5 Years | 0 (0.0%) | 0 (0.0%) |
| 5 to 17 Years | 45 (1.7%) | 20 (0.7%) |
| 18 to 34 Years | 108 (2.4%) | 89 (1.9%) |
| 35 to 64 Years | 506 (6.6%) | 541 (6.4%) |
| 65 to 74 Years | 437 (18.2%) | 310 (11.7%) |
| 75 Years and over | 734 (39.0%) | 509 (21.8%) |
Disability Class: Vision Difficulty
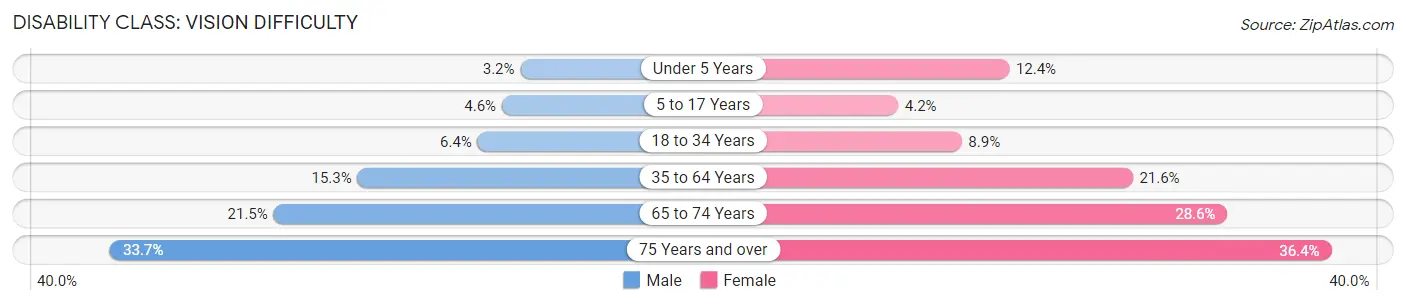
| Age Bracket | Male | Female |
| Under 5 Years | 22 (3.2%) | 89 (12.4%) |
| 5 to 17 Years | 124 (4.6%) | 116 (4.2%) |
| 18 to 34 Years | 282 (6.4%) | 410 (8.9%) |
| 35 to 64 Years | 1,170 (15.3%) | 1,840 (21.6%) |
| 65 to 74 Years | 515 (21.5%) | 762 (28.6%) |
| 75 Years and over | 634 (33.7%) | 847 (36.3%) |
Disability Class: Cognitive Difficulty
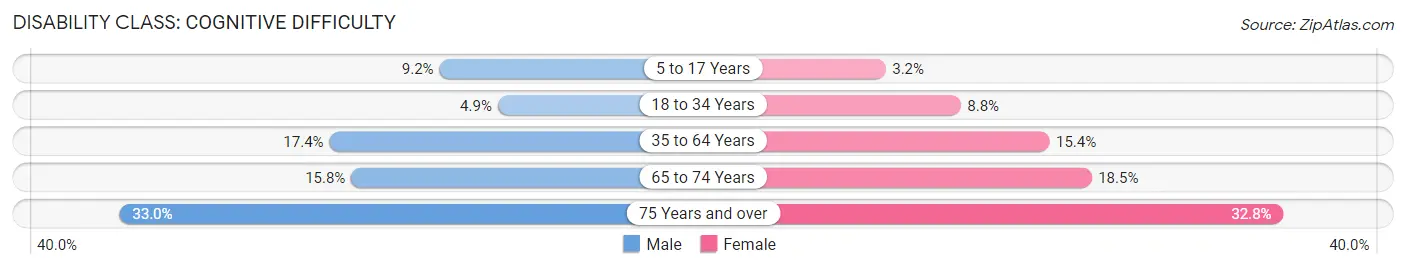
| Age Bracket | Male | Female |
| 5 to 17 Years | 250 (9.2%) | 90 (3.2%) |
| 18 to 34 Years | 216 (4.9%) | 406 (8.8%) |
| 35 to 64 Years | 1,330 (17.4%) | 1,312 (15.4%) |
| 65 to 74 Years | 377 (15.8%) | 493 (18.5%) |
| 75 Years and over | 621 (33.0%) | 764 (32.8%) |
Disability Class: Ambulatory Difficulty
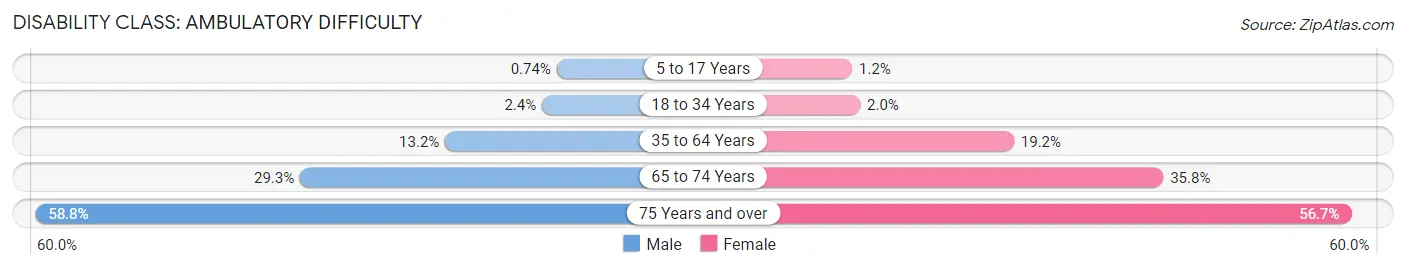
| Age Bracket | Male | Female |
| 5 to 17 Years | 20 (0.7%) | 32 (1.1%) |
| 18 to 34 Years | 105 (2.4%) | 94 (2.0%) |
| 35 to 64 Years | 1,008 (13.2%) | 1,634 (19.2%) |
| 65 to 74 Years | 702 (29.3%) | 953 (35.8%) |
| 75 Years and over | 1,108 (58.8%) | 1,322 (56.7%) |
Disability Class: Self-Care Difficulty
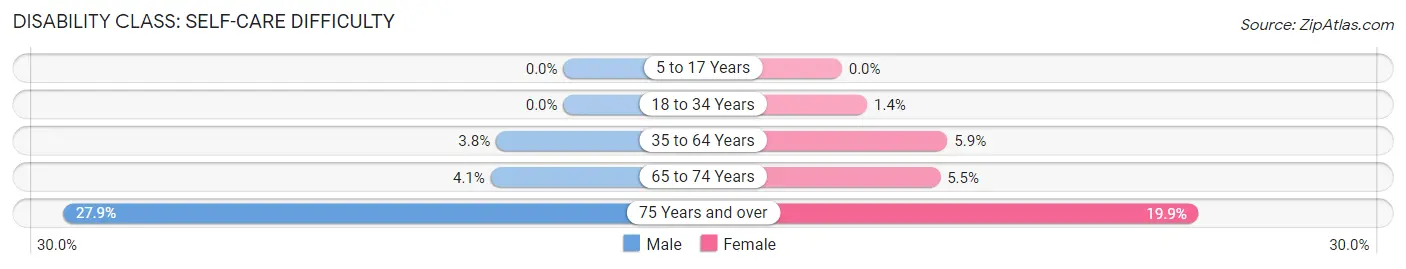
| Age Bracket | Male | Female |
| 5 to 17 Years | 0 (0.0%) | 0 (0.0%) |
| 18 to 34 Years | 0 (0.0%) | 65 (1.4%) |
| 35 to 64 Years | 287 (3.7%) | 501 (5.9%) |
| 65 to 74 Years | 97 (4.1%) | 146 (5.5%) |
| 75 Years and over | 525 (27.9%) | 463 (19.9%) |
Technology Access in Cayey Municipio
Computing Device Access in Cayey Municipio
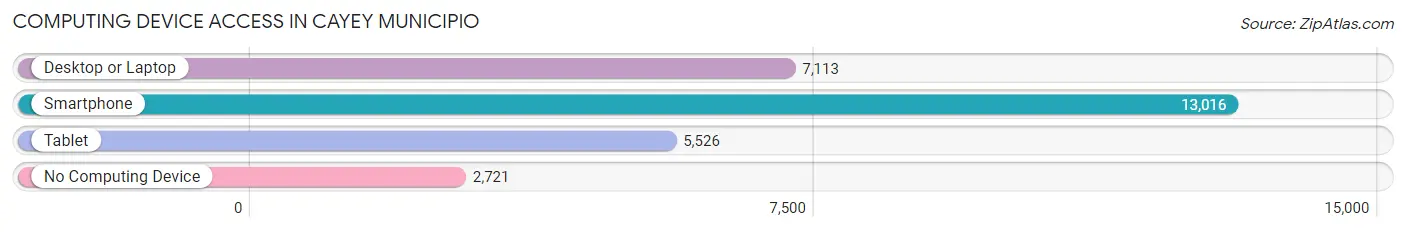
| Device Type | # Households | % Households |
| Desktop or Laptop | 7,113 | 44.0% |
| Smartphone | 13,016 | 80.6% |
| Tablet | 5,526 | 34.2% |
| No Computing Device | 2,721 | 16.9% |
| Total | 16,151 | 100.0% |
Internet Access in Cayey Municipio
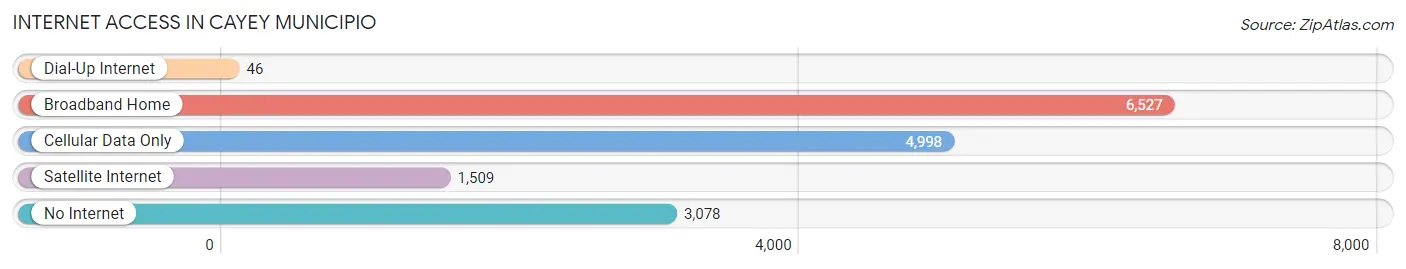
| Internet Type | # Households | % Households |
| Dial-Up Internet | 46 | 0.3% |
| Broadband Home | 6,527 | 40.4% |
| Cellular Data Only | 4,998 | 30.9% |
| Satellite Internet | 1,509 | 9.3% |
| No Internet | 3,078 | 19.1% |
| Total | 16,151 | 100.0% |
Cayey Municipio Summary
Cayey Municipio is a municipality located in the central mountain range of Puerto Rico. It is part of the San Juan-Caguas-Guaynabo Metropolitan Statistical Area. As of the 2010 census, the municipality had a population of 45,196.
History
The area of Cayey was originally inhabited by the indigenous Taíno people. The first European settlers arrived in the area in the 16th century, and the town was officially founded in 1773. The town was named after Cayey, a Taíno chief who lived in the area.
In the 19th century, the town became an important center of the coffee industry in Puerto Rico. The town was also the site of the first railroad in Puerto Rico, which was built in 1837.
Geography
Cayey is located in the central mountain range of Puerto Rico, about 25 miles (40 km) southeast of San Juan. The municipality covers an area of approximately 39 square miles (101 km2). The terrain is mostly mountainous, with elevations ranging from 1,000 to 3,000 feet (300 to 900 m).
The climate is tropical, with temperatures ranging from 70 to 90 °F (21 to 32 °C). The average annual precipitation is about 50 inches (1,270 mm).
Economy
The economy of Cayey is largely based on agriculture and manufacturing. The main agricultural products are coffee, sugarcane, and tobacco. The main industries are food processing, electronics, and textiles.
Demographics
As of the 2010 census, the population of Cayey was 45,196. The population is mostly of mixed European and African descent. The median household income is $14,845, and the poverty rate is 44.3%.
The majority of the population (90.3%) speaks Spanish as their first language. English is spoken by 8.2% of the population. The majority of the population (90.3%) is Roman Catholic.
Education
Cayey has a number of public and private schools, including the University of Puerto Rico at Cayey. The University of Puerto Rico at Cayey is a public university that offers undergraduate and graduate degrees in a variety of fields. The university also offers a number of research and outreach programs.
Common Questions
What is Per Capita Income in Cayey Municipio?
Per Capita income in Cayey Municipio is $16,510.
What is the Median Family Income in Cayey Municipio?
Median Family Income in Cayey Municipio is $32,299.
What is the Median Household income in Cayey Municipio?
Median Household Income in Cayey Municipio is $26,704.
What is Income or Wage Gap in Cayey Municipio?
Income or Wage Gap in Cayey Municipio is 6.6%.
Women in Cayey Municipio earn 93.4 cents for every dollar earned by a man.
What is Family Income Deficit in Cayey Municipio?
Family Income Deficit in Cayey Municipio is $10,152.
Families that are below poverty line in Cayey Municipio earn $10,152 less on average than the poverty threshold level.
What is Inequality or Gini Index in Cayey Municipio?
Inequality or Gini Index in Cayey Municipio is 0.51.
What is the Total Population of Cayey Municipio?
Total Population of Cayey Municipio is 41,509.
What is the Total Male Population of Cayey Municipio?
Total Male Population of Cayey Municipio is 19,849.
What is the Total Female Population of Cayey Municipio?
Total Female Population of Cayey Municipio is 21,660.
What is the Ratio of Males per 100 Females in Cayey Municipio?
There are 91.64 Males per 100 Females in Cayey Municipio.
What is the Ratio of Females per 100 Males in Cayey Municipio?
There are 109.12 Females per 100 Males in Cayey Municipio.
What is the Median Population Age in Cayey Municipio?
Median Population Age in Cayey Municipio is 44.6 Years.
What is the Average Family Size in Cayey Municipio
Average Family Size in Cayey Municipio is 3.1 People.
What is the Average Household Size in Cayey Municipio
Average Household Size in Cayey Municipio is 2.6 People.
How Large is the Labor Force in Cayey Municipio?
There are 14,894 People in the Labor Forcein in Cayey Municipio.
What is the Percentage of People in the Labor Force in Cayey Municipio?
41.7% of People are in the Labor Force in Cayey Municipio.
What is the Unemployment Rate in Cayey Municipio?
Unemployment Rate in Cayey Municipio is 6.7%.