Carolina Municipio, PR Map & Demographics
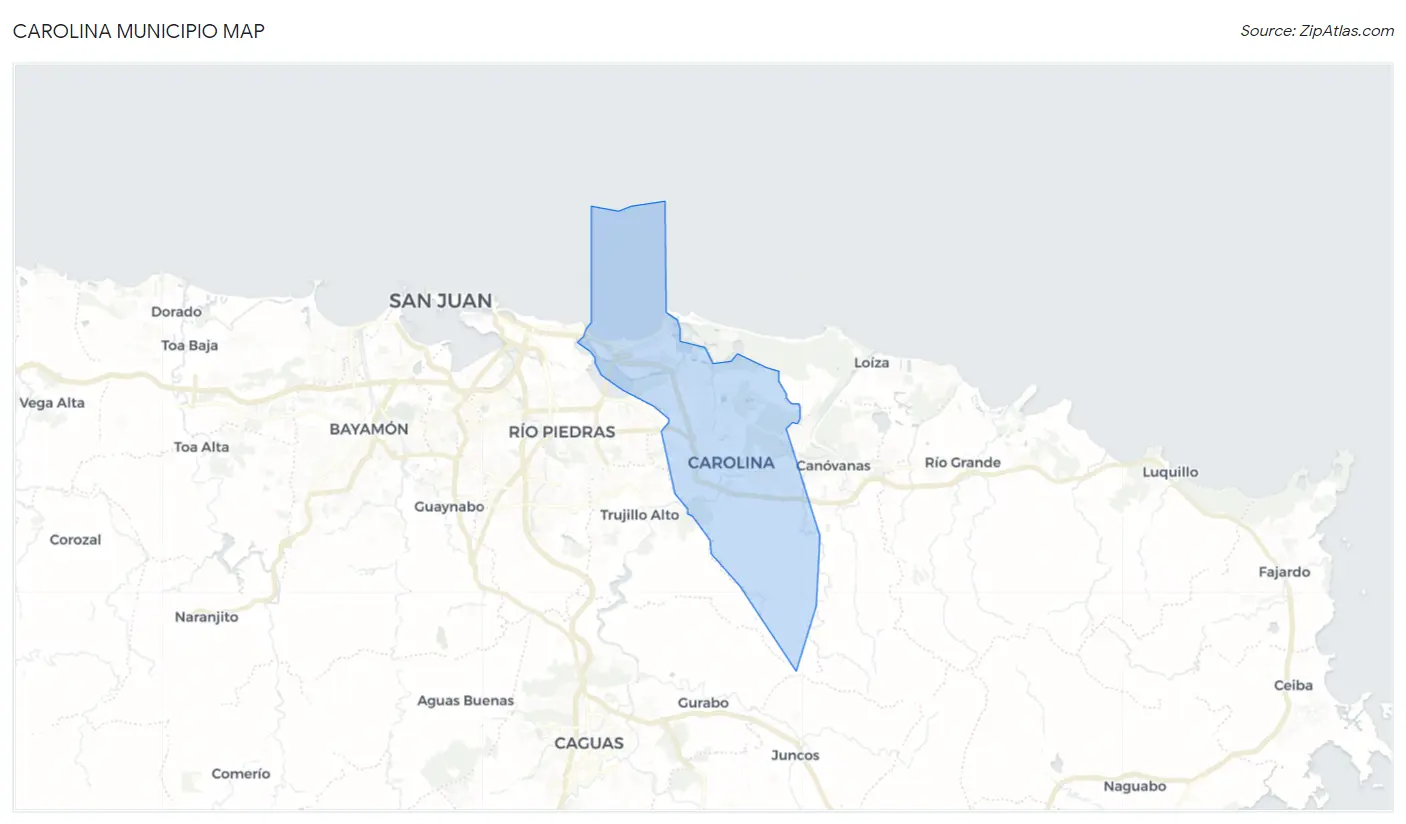
Carolina Municipio Map
Carolina Municipio Overview
$19,220
PER CAPITA INCOME
$38,406
AVG FAMILY INCOME
$32,888
AVG HOUSEHOLD INCOME
7.8%
WAGE / INCOME GAP [ % ]
92.2¢/ $1
WAGE / INCOME GAP [ $ ]
$11,488
FAMILY INCOME DEFICIT
0.49
INEQUALITY / GINI INDEX
154,126
TOTAL POPULATION
70,159
MALE POPULATION
83,967
FEMALE POPULATION
83.56
MALES / 100 FEMALES
119.68
FEMALES / 100 MALES
44.3
MEDIAN AGE
3.1
AVG FAMILY SIZE
2.5
AVG HOUSEHOLD SIZE
69,434
LABOR FORCE [ PEOPLE ]
52.5%
PERCENT IN LABOR FORCE
13.3%
UNEMPLOYMENT RATE
Income in Carolina Municipio
Income Overview in Carolina Municipio
Per Capita Income in Carolina Municipio is $19,220, while median incomes of families and households are $38,406 and $32,888 respectively.
| Characteristic | Number | Measure |
| Per Capita Income | 154,126 | $19,220 |
| Median Family Income | 39,720 | $38,406 |
| Mean Family Income | 39,720 | $51,019 |
| Median Household Income | 61,883 | $32,888 |
| Mean Household Income | 61,883 | $45,086 |
| Income Deficit | 39,720 | $11,488 |
| Wage / Income Gap (%) | 154,126 | 7.76% |
| Wage / Income Gap ($) | 154,126 | 92.24¢ per $1 |
| Gini / Inequality Index | 154,126 | 0.49 |
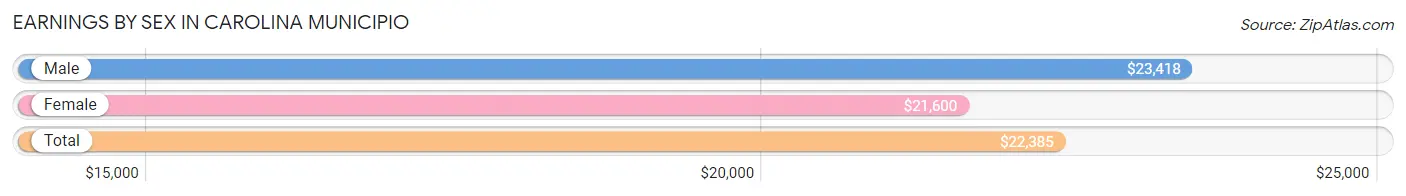
Earnings by Sex in Carolina Municipio
Average Earnings in Carolina Municipio are $22,385, $23,418 for men and $21,600 for women, a difference of 7.8%.
| Sex | Number | Average Earnings |
| Male | 32,676 (49.6%) | $23,418 |
| Female | 33,152 (50.4%) | $21,600 |
| Total | 65,828 (100.0%) | $22,385 |
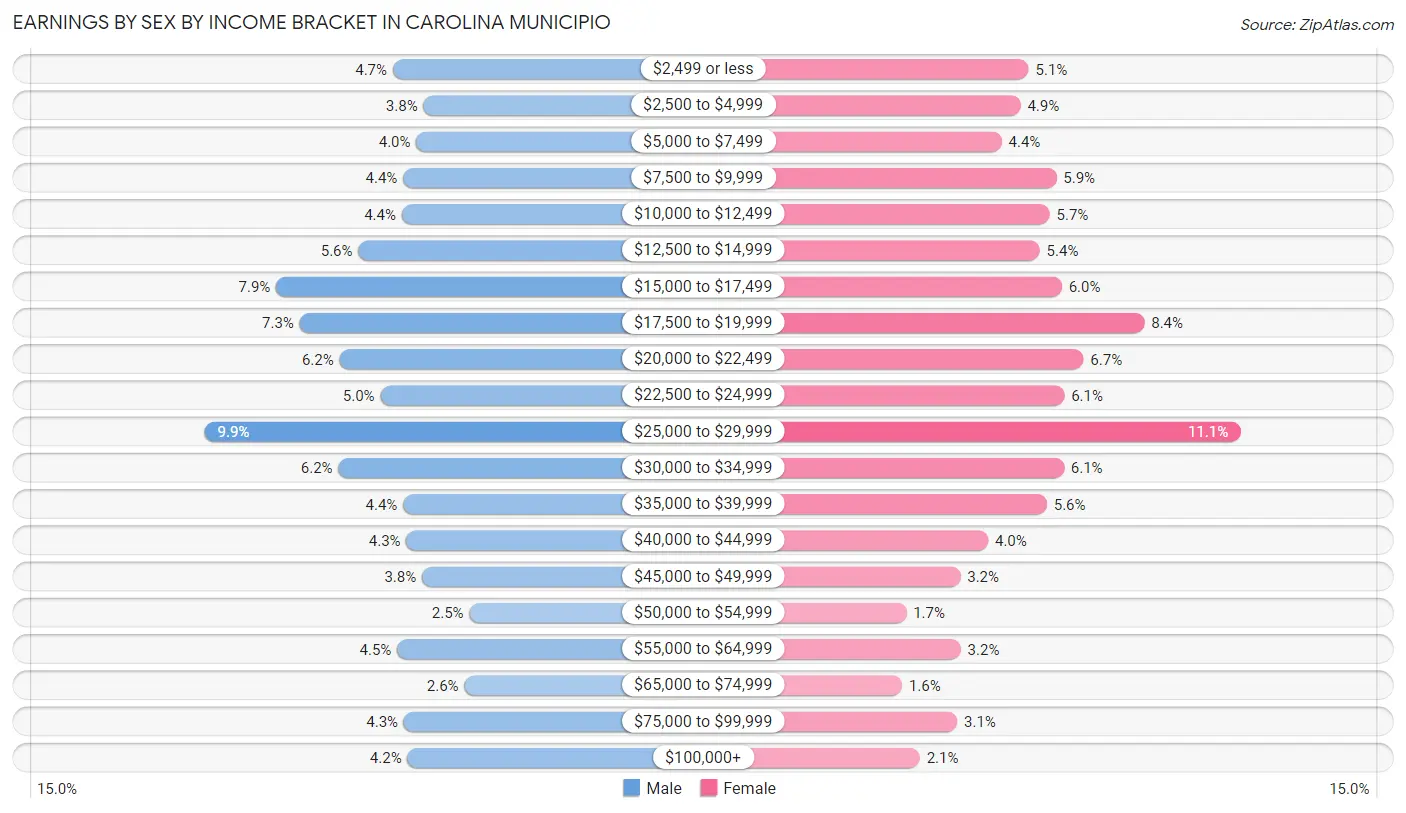
Earnings by Sex by Income Bracket in Carolina Municipio
The most common earnings brackets in Carolina Municipio are $25,000 to $29,999 for men (3,248 | 9.9%) and $25,000 to $29,999 for women (3,663 | 11.1%).
| Income | Male | Female |
| $2,499 or less | 1,518 (4.6%) | 1,693 (5.1%) |
| $2,500 to $4,999 | 1,239 (3.8%) | 1,619 (4.9%) |
| $5,000 to $7,499 | 1,303 (4.0%) | 1,442 (4.3%) |
| $7,500 to $9,999 | 1,424 (4.4%) | 1,952 (5.9%) |
| $10,000 to $12,499 | 1,439 (4.4%) | 1,890 (5.7%) |
| $12,500 to $14,999 | 1,837 (5.6%) | 1,796 (5.4%) |
| $15,000 to $17,499 | 2,590 (7.9%) | 2,001 (6.0%) |
| $17,500 to $19,999 | 2,377 (7.3%) | 2,771 (8.4%) |
| $20,000 to $22,499 | 2,011 (6.1%) | 2,206 (6.7%) |
| $22,500 to $24,999 | 1,634 (5.0%) | 2,025 (6.1%) |
| $25,000 to $29,999 | 3,248 (9.9%) | 3,663 (11.1%) |
| $30,000 to $34,999 | 2,020 (6.2%) | 2,021 (6.1%) |
| $35,000 to $39,999 | 1,426 (4.4%) | 1,863 (5.6%) |
| $40,000 to $44,999 | 1,396 (4.3%) | 1,316 (4.0%) |
| $45,000 to $49,999 | 1,252 (3.8%) | 1,059 (3.2%) |
| $50,000 to $54,999 | 818 (2.5%) | 552 (1.7%) |
| $55,000 to $64,999 | 1,479 (4.5%) | 1,062 (3.2%) |
| $65,000 to $74,999 | 864 (2.6%) | 514 (1.5%) |
| $75,000 to $99,999 | 1,417 (4.3%) | 1,027 (3.1%) |
| $100,000+ | 1,384 (4.2%) | 680 (2.1%) |
| Total | 32,676 (100.0%) | 33,152 (100.0%) |
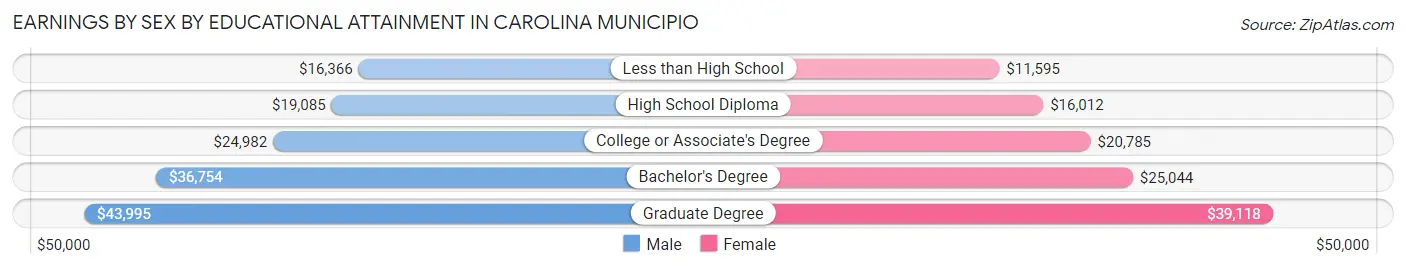
Earnings by Sex by Educational Attainment in Carolina Municipio
Average earnings in Carolina Municipio are $25,513 for men and $23,294 for women, a difference of 8.7%. Men with an educational attainment of graduate degree enjoy the highest average annual earnings of $43,995, while those with less than high school education earn the least with $16,366. Women with an educational attainment of graduate degree earn the most with the average annual earnings of $39,118, while those with less than high school education have the smallest earnings of $11,595.
| Educational Attainment | Male Income | Female Income |
| Less than High School | $16,366 | $11,595 |
| High School Diploma | $19,085 | $16,012 |
| College or Associate's Degree | $24,982 | $20,785 |
| Bachelor's Degree | $36,754 | $25,044 |
| Graduate Degree | $43,995 | $39,118 |
| Total | $25,513 | $23,294 |
Family Income in Carolina Municipio
Family Income Brackets in Carolina Municipio
According to the Carolina Municipio family income data, there are 6,991 families falling into the $35,000 to $49,999 income range, which is the most common income bracket and makes up 17.6% of all families. Conversely, the $200,000+ income bracket is the least frequent group with only 675 families (1.7%) belonging to this category.
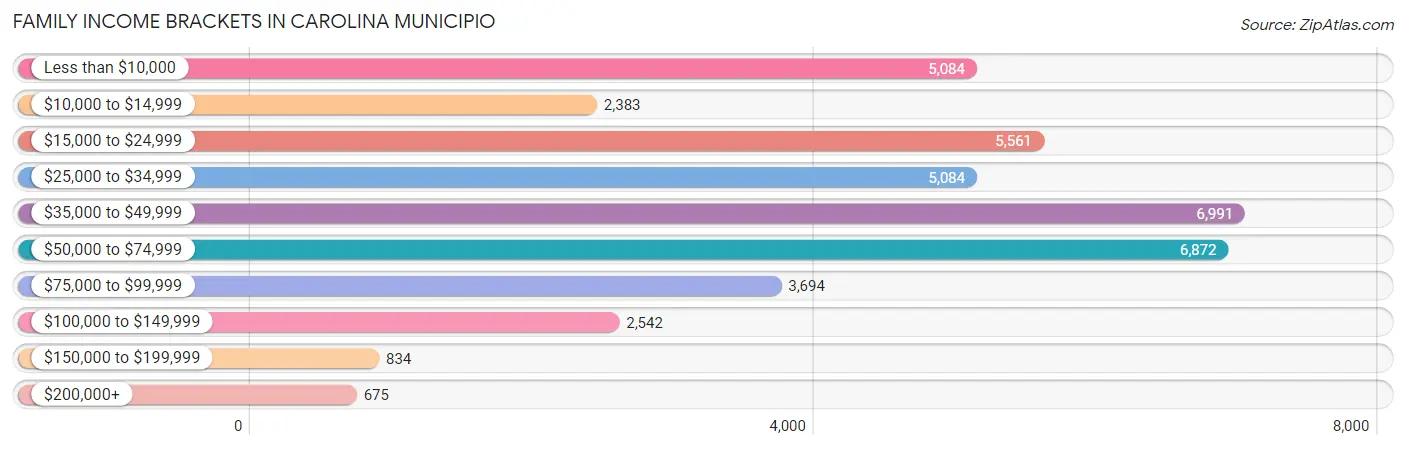
| Income Bracket | # Families | % Families |
| Less than $10,000 | 5,084 | 12.8% |
| $10,000 to $14,999 | 2,383 | 6.0% |
| $15,000 to $24,999 | 5,561 | 14.0% |
| $25,000 to $34,999 | 5,084 | 12.8% |
| $35,000 to $49,999 | 6,991 | 17.6% |
| $50,000 to $74,999 | 6,872 | 17.3% |
| $75,000 to $99,999 | 3,694 | 9.3% |
| $100,000 to $149,999 | 2,542 | 6.4% |
| $150,000 to $199,999 | 834 | 2.1% |
| $200,000+ | 675 | 1.7% |
Family Income by Famaliy Size in Carolina Municipio
4-person families (5,883 | 14.8%) account for the highest median family income in Carolina Municipio with $54,121 per family, while 2-person families (19,787 | 49.8%) have the highest median income of $16,509 per family member.
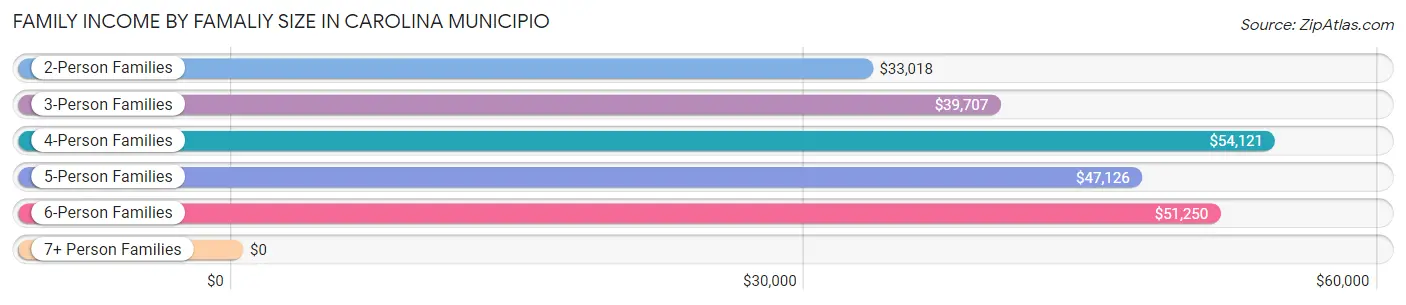
| Income Bracket | # Families | Median Income |
| 2-Person Families | 19,787 (49.8%) | $33,018 |
| 3-Person Families | 11,195 (28.2%) | $39,707 |
| 4-Person Families | 5,883 (14.8%) | $54,121 |
| 5-Person Families | 2,089 (5.3%) | $47,126 |
| 6-Person Families | 546 (1.4%) | $51,250 |
| 7+ Person Families | 220 (0.5%) | $0 |
| Total | 39,720 (100.0%) | $38,406 |
Family Income by Number of Earners in Carolina Municipio
The median family income in Carolina Municipio is $38,406, with families comprising 3+ earners (2,695) having the highest median family income of $71,995, while families with no earners (11,928) have the lowest median family income of $20,337, accounting for 6.8% and 30.0% of families, respectively.
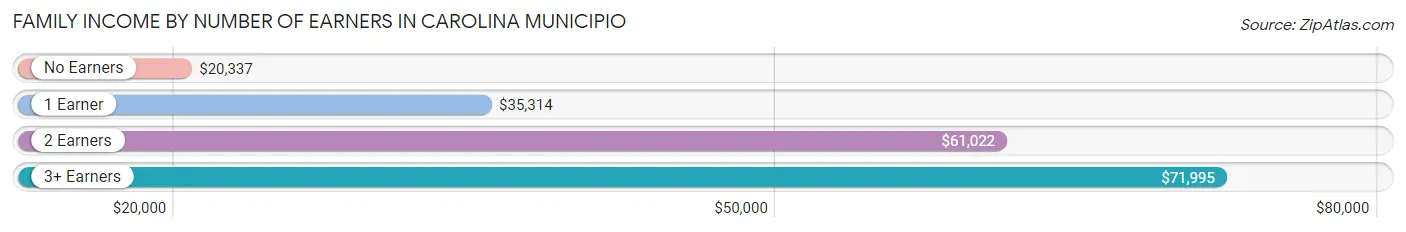
| Number of Earners | # Families | Median Income |
| No Earners | 11,928 (30.0%) | $20,337 |
| 1 Earner | 15,047 (37.9%) | $35,314 |
| 2 Earners | 10,050 (25.3%) | $61,022 |
| 3+ Earners | 2,695 (6.8%) | $71,995 |
| Total | 39,720 (100.0%) | $38,406 |
Household Income in Carolina Municipio
Household Income Brackets in Carolina Municipio
With 9,778 households falling in the category, the $35,000 to $49,999 income range is the most frequent in Carolina Municipio, accounting for 15.8% of all households. In contrast, only 866 households (1.4%) fall into the $200,000+ income bracket, making it the least populous group.
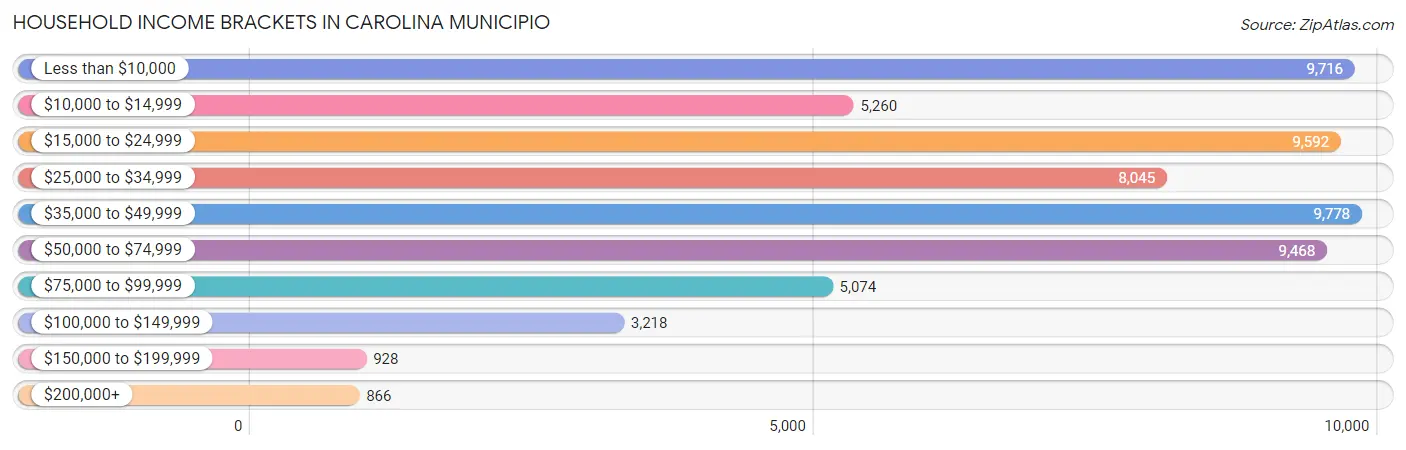
| Income Bracket | # Households | % Households |
| Less than $10,000 | 9,716 | 15.7% |
| $10,000 to $14,999 | 5,260 | 8.5% |
| $15,000 to $24,999 | 9,592 | 15.5% |
| $25,000 to $34,999 | 8,045 | 13.0% |
| $35,000 to $49,999 | 9,778 | 15.8% |
| $50,000 to $74,999 | 9,468 | 15.3% |
| $75,000 to $99,999 | 5,074 | 8.2% |
| $100,000 to $149,999 | 3,218 | 5.2% |
| $150,000 to $199,999 | 928 | 1.5% |
| $200,000+ | 866 | 1.4% |
Household Income by Householder Age in Carolina Municipio
The median household income in Carolina Municipio is $32,888, with the highest median household income of $40,899 found in the 45 to 64 years age bracket for the primary householder. A total of 22,436 households (36.3%) fall into this category. Meanwhile, the 15 to 24 years age bracket for the primary householder has the lowest median household income of $21,953, with 935 households (1.5%) in this group.
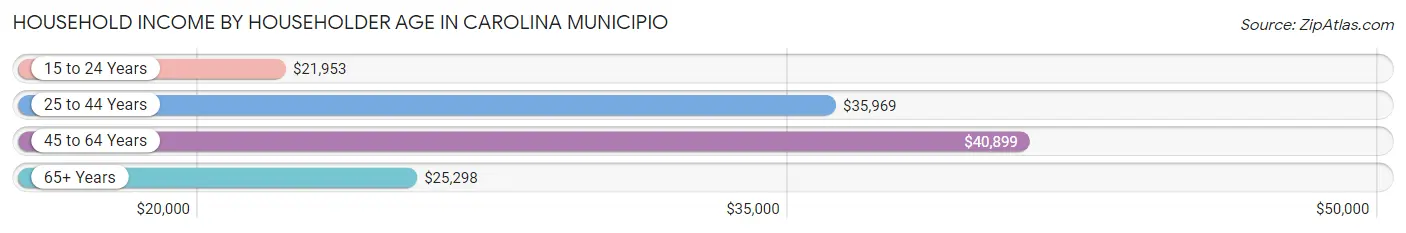
| Income Bracket | # Households | Median Income |
| 15 to 24 Years | 935 (1.5%) | $21,953 |
| 25 to 44 Years | 15,305 (24.7%) | $35,969 |
| 45 to 64 Years | 22,436 (36.3%) | $40,899 |
| 65+ Years | 23,207 (37.5%) | $25,298 |
| Total | 61,883 (100.0%) | $32,888 |
Poverty in Carolina Municipio
Income Below Poverty by Sex and Age in Carolina Municipio
With 27.5% poverty level for males and 33.8% for females among the residents of Carolina Municipio, 6 to 11 year old males and 16 and 17 year old females are the most vulnerable to poverty, with 2,130 males (48.9%) and 783 females (51.6%) in their respective age groups living below the poverty level.
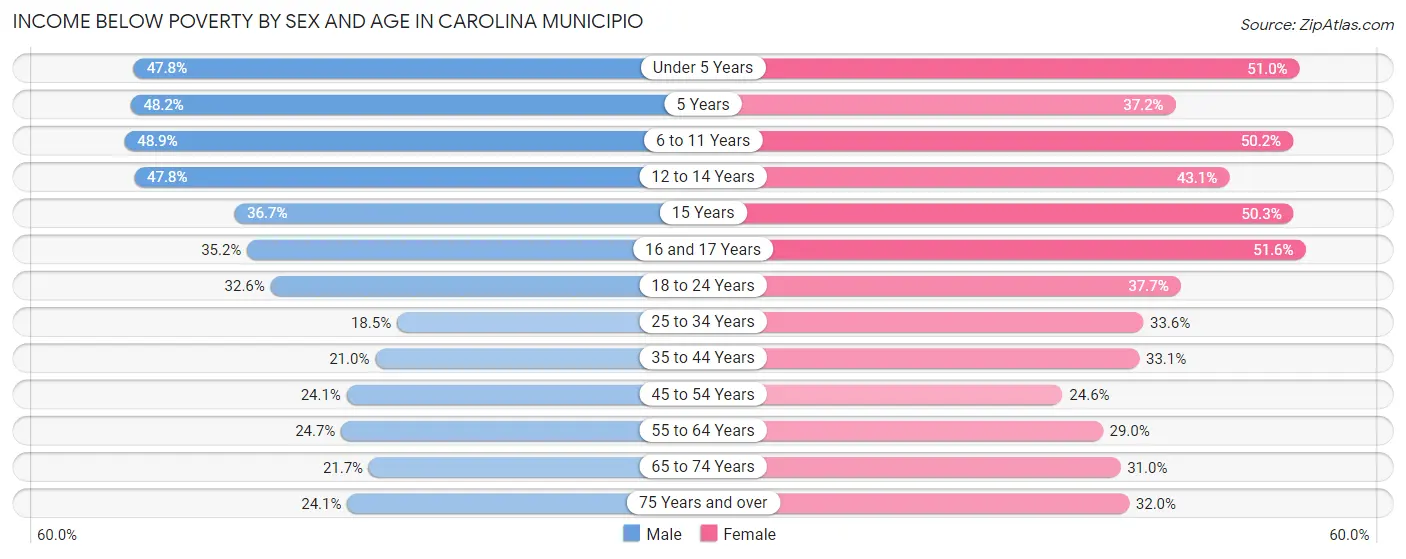
| Age Bracket | Male | Female |
| Under 5 Years | 1,253 (47.8%) | 1,298 (51.0%) |
| 5 Years | 269 (48.2%) | 214 (37.1%) |
| 6 to 11 Years | 2,130 (48.9%) | 2,219 (50.2%) |
| 12 to 14 Years | 1,158 (47.8%) | 1,041 (43.1%) |
| 15 Years | 216 (36.7%) | 569 (50.3%) |
| 16 and 17 Years | 737 (35.2%) | 783 (51.6%) |
| 18 to 24 Years | 2,298 (32.6%) | 2,696 (37.7%) |
| 25 to 34 Years | 1,813 (18.5%) | 3,505 (33.6%) |
| 35 to 44 Years | 1,780 (20.9%) | 3,225 (33.1%) |
| 45 to 54 Years | 2,202 (24.1%) | 2,687 (24.6%) |
| 55 to 64 Years | 2,110 (24.7%) | 3,180 (29.0%) |
| 65 to 74 Years | 1,530 (21.6%) | 3,210 (31.0%) |
| 75 Years and over | 1,723 (24.1%) | 3,627 (32.0%) |
| Total | 19,219 (27.5%) | 28,254 (33.8%) |
Income Above Poverty by Sex and Age in Carolina Municipio
According to the poverty statistics in Carolina Municipio, males aged 25 to 34 years and females aged 45 to 54 years are the age groups that are most secure financially, with 81.5% of males and 75.4% of females in these age groups living above the poverty line.
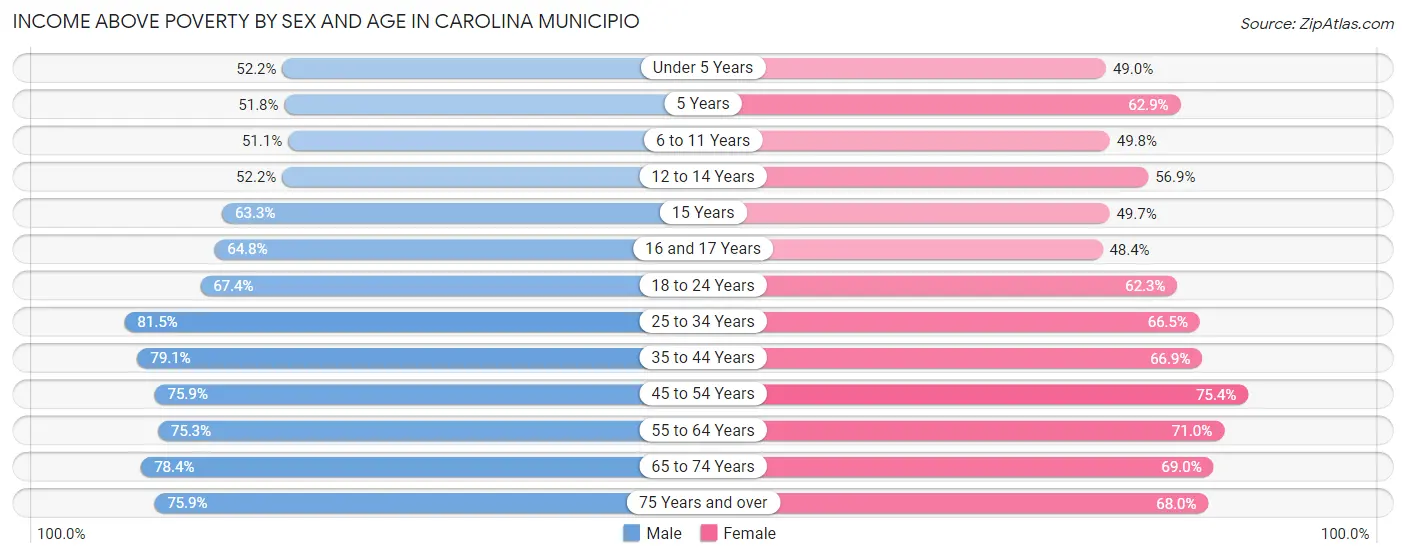
| Age Bracket | Male | Female |
| Under 5 Years | 1,366 (52.2%) | 1,249 (49.0%) |
| 5 Years | 289 (51.8%) | 362 (62.8%) |
| 6 to 11 Years | 2,227 (51.1%) | 2,198 (49.8%) |
| 12 to 14 Years | 1,264 (52.2%) | 1,373 (56.9%) |
| 15 Years | 373 (63.3%) | 562 (49.7%) |
| 16 and 17 Years | 1,356 (64.8%) | 734 (48.4%) |
| 18 to 24 Years | 4,752 (67.4%) | 4,452 (62.3%) |
| 25 to 34 Years | 7,969 (81.5%) | 6,941 (66.4%) |
| 35 to 44 Years | 6,718 (79.0%) | 6,518 (66.9%) |
| 45 to 54 Years | 6,924 (75.9%) | 8,248 (75.4%) |
| 55 to 64 Years | 6,418 (75.3%) | 7,771 (71.0%) |
| 65 to 74 Years | 5,538 (78.3%) | 7,140 (69.0%) |
| 75 Years and over | 5,438 (75.9%) | 7,718 (68.0%) |
| Total | 50,632 (72.5%) | 55,266 (66.2%) |
Income Below Poverty Among Married-Couple Families in Carolina Municipio
The poverty statistics for married-couple families in Carolina Municipio show that 15.4% or 3,077 of the total 19,927 families live below the poverty line. Families with 5 or more children have the highest poverty rate of 100.0%, comprising of 23 families. On the other hand, families with no children have the lowest poverty rate of 14.4%, which includes 2,031 families.
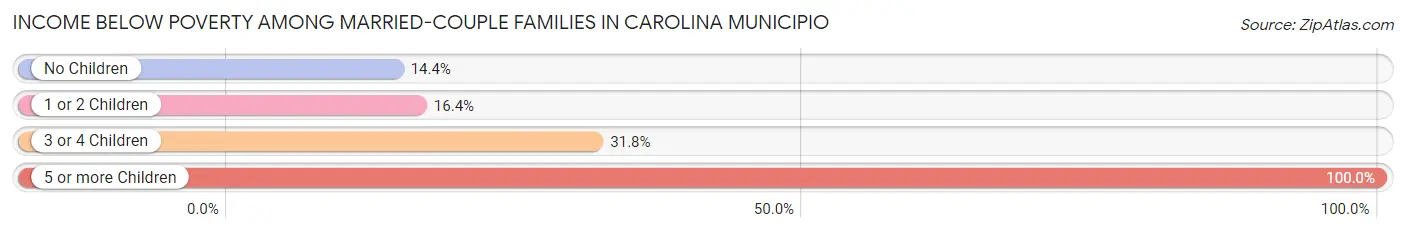
| Children | Above Poverty | Below Poverty |
| No Children | 12,056 (85.6%) | 2,031 (14.4%) |
| 1 or 2 Children | 4,498 (83.6%) | 885 (16.4%) |
| 3 or 4 Children | 296 (68.2%) | 138 (31.8%) |
| 5 or more Children | 0 (0.0%) | 23 (100.0%) |
| Total | 16,850 (84.6%) | 3,077 (15.4%) |
Income Below Poverty Among Single-Parent Households in Carolina Municipio
According to the poverty data in Carolina Municipio, 31.0% or 1,209 single-father households and 43.8% or 6,960 single-mother households are living below the poverty line. Among single-father households, those with 5 or more children have the highest poverty rate, with 20 households (100.0%) experiencing poverty. Likewise, among single-mother households, those with 5 or more children have the highest poverty rate, with 57 households (89.1%) falling below the poverty line.
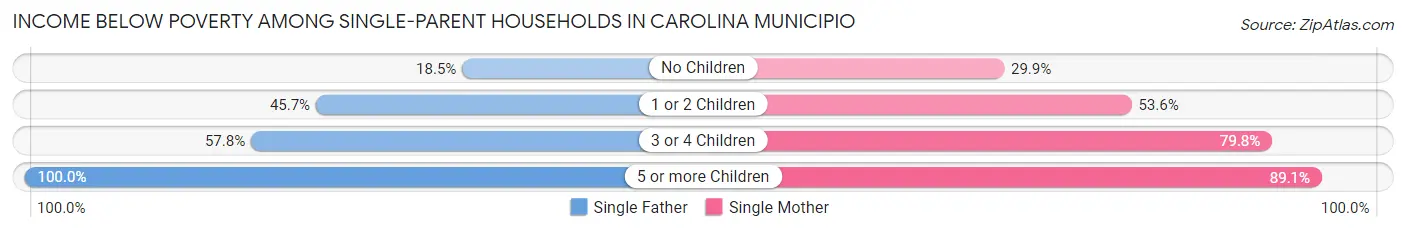
| Children | Single Father | Single Mother |
| No Children | 413 (18.5%) | 2,282 (29.9%) |
| 1 or 2 Children | 680 (45.7%) | 3,910 (53.6%) |
| 3 or 4 Children | 96 (57.8%) | 711 (79.8%) |
| 5 or more Children | 20 (100.0%) | 57 (89.1%) |
| Total | 1,209 (31.0%) | 6,960 (43.8%) |
Income Below Poverty Among Married-Couple vs Single-Parent Households in Carolina Municipio
The poverty data for Carolina Municipio shows that 3,077 of the married-couple family households (15.4%) and 8,169 of the single-parent households (41.3%) are living below the poverty level. Within the married-couple family households, those with 5 or more children have the highest poverty rate, with 23 households (100.0%) falling below the poverty line. Among the single-parent households, those with 5 or more children have the highest poverty rate, with 77 household (91.7%) living below poverty.
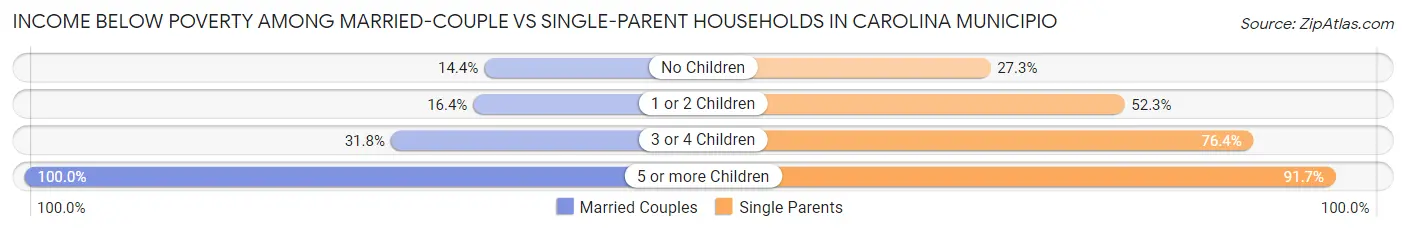
| Children | Married-Couple Families | Single-Parent Households |
| No Children | 2,031 (14.4%) | 2,695 (27.3%) |
| 1 or 2 Children | 885 (16.4%) | 4,590 (52.3%) |
| 3 or 4 Children | 138 (31.8%) | 807 (76.3%) |
| 5 or more Children | 23 (100.0%) | 77 (91.7%) |
| Total | 3,077 (15.4%) | 8,169 (41.3%) |
Race in Carolina Municipio
The most populous races in Carolina Municipio are Hispanic or Latino (152,216 | 98.8%), White / Caucasian (55,423 | 36.0%), and Some other Race (49,766 | 32.3%).
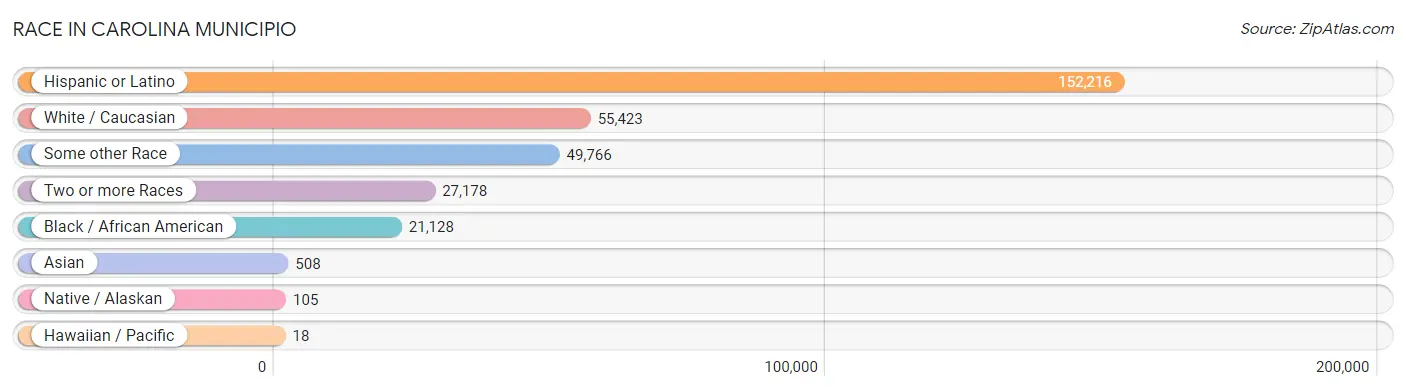
| Race | # Population | % Population |
| Asian | 508 | 0.3% |
| Black / African American | 21,128 | 13.7% |
| Hawaiian / Pacific | 18 | 0.0% |
| Hispanic or Latino | 152,216 | 98.8% |
| Native / Alaskan | 105 | 0.1% |
| White / Caucasian | 55,423 | 36.0% |
| Two or more Races | 27,178 | 17.6% |
| Some other Race | 49,766 | 32.3% |
| Total | 154,126 | 100.0% |
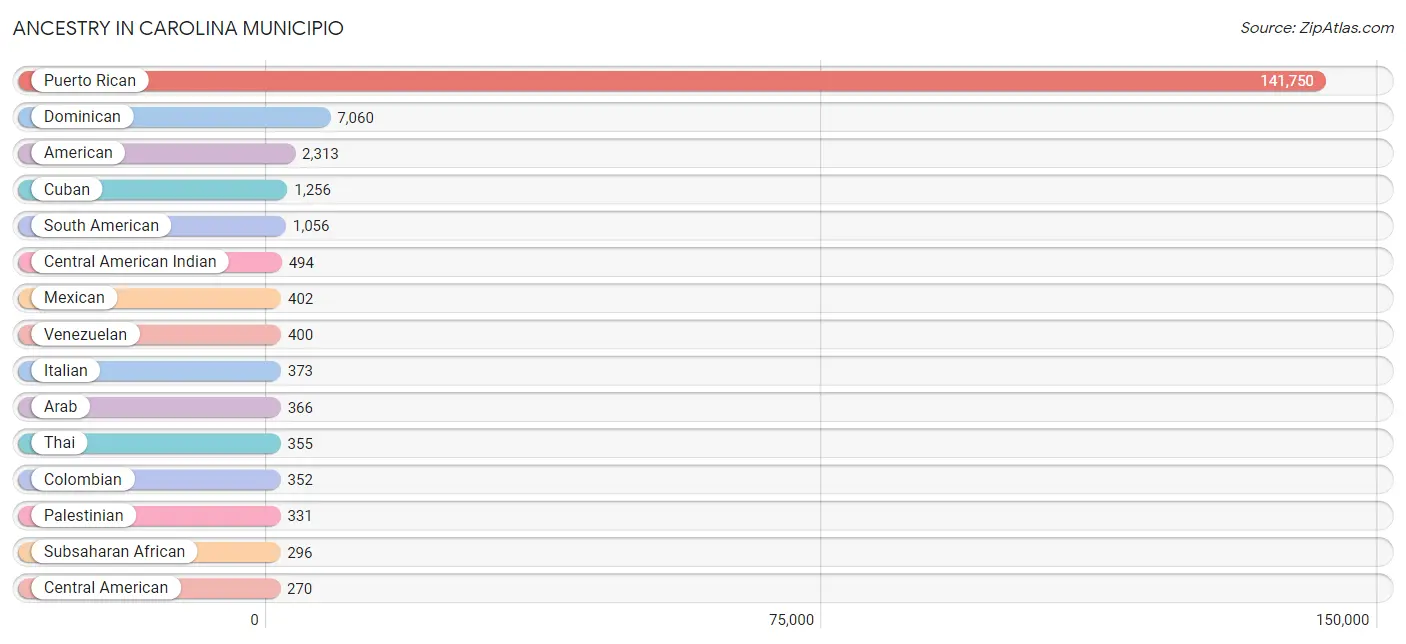
Ancestry in Carolina Municipio
The most populous ancestries reported in Carolina Municipio are Puerto Rican (141,750 | 92.0%), Dominican (7,060 | 4.6%), American (2,313 | 1.5%), Cuban (1,256 | 0.8%), and South American (1,056 | 0.7%), together accounting for 99.5% of all Carolina Municipio residents.
| Ancestry | # Population | % Population |
| African | 253 | 0.2% |
| American | 2,313 | 1.5% |
| Arab | 366 | 0.2% |
| Basque | 15 | 0.0% |
| Belgian | 16 | 0.0% |
| British | 89 | 0.1% |
| Burmese | 21 | 0.0% |
| Cape Verdean | 20 | 0.0% |
| Central American | 270 | 0.2% |
| Central American Indian | 494 | 0.3% |
| Chilean | 13 | 0.0% |
| Colombian | 352 | 0.2% |
| Costa Rican | 101 | 0.1% |
| Cuban | 1,256 | 0.8% |
| Dominican | 7,060 | 4.6% |
| Dutch West Indian | 31 | 0.0% |
| Ecuadorian | 114 | 0.1% |
| English | 142 | 0.1% |
| European | 54 | 0.0% |
| French | 29 | 0.0% |
| German | 125 | 0.1% |
| Haitian | 56 | 0.0% |
| Honduran | 67 | 0.0% |
| Indian (Asian) | 178 | 0.1% |
| Irish | 84 | 0.1% |
| Italian | 373 | 0.2% |
| Kenyan | 23 | 0.0% |
| Mexican | 402 | 0.3% |
| Native Hawaiian | 18 | 0.0% |
| Nicaraguan | 44 | 0.0% |
| Norwegian | 6 | 0.0% |
| Palestinian | 331 | 0.2% |
| Panamanian | 58 | 0.0% |
| Peruvian | 124 | 0.1% |
| Polish | 97 | 0.1% |
| Portuguese | 85 | 0.1% |
| Pueblo | 11 | 0.0% |
| Puerto Rican | 141,750 | 92.0% |
| Russian | 29 | 0.0% |
| Scottish | 29 | 0.0% |
| South American | 1,056 | 0.7% |
| South American Indian | 21 | 0.0% |
| Spaniard | 137 | 0.1% |
| Spanish American Indian | 93 | 0.1% |
| Sri Lankan | 37 | 0.0% |
| Subsaharan African | 296 | 0.2% |
| Swedish | 9 | 0.0% |
| Syrian | 13 | 0.0% |
| Thai | 355 | 0.2% |
| U.S. Virgin Islander | 21 | 0.0% |
| Uruguayan | 53 | 0.0% |
| Venezuelan | 400 | 0.3% |
| Welsh | 1 | 0.0% |
| West Indian | 235 | 0.2% | View All 54 Rows |
Immigrants in Carolina Municipio

| Immigration Origin | # Population | % Population | View All 0 Rows |
Sex and Age in Carolina Municipio
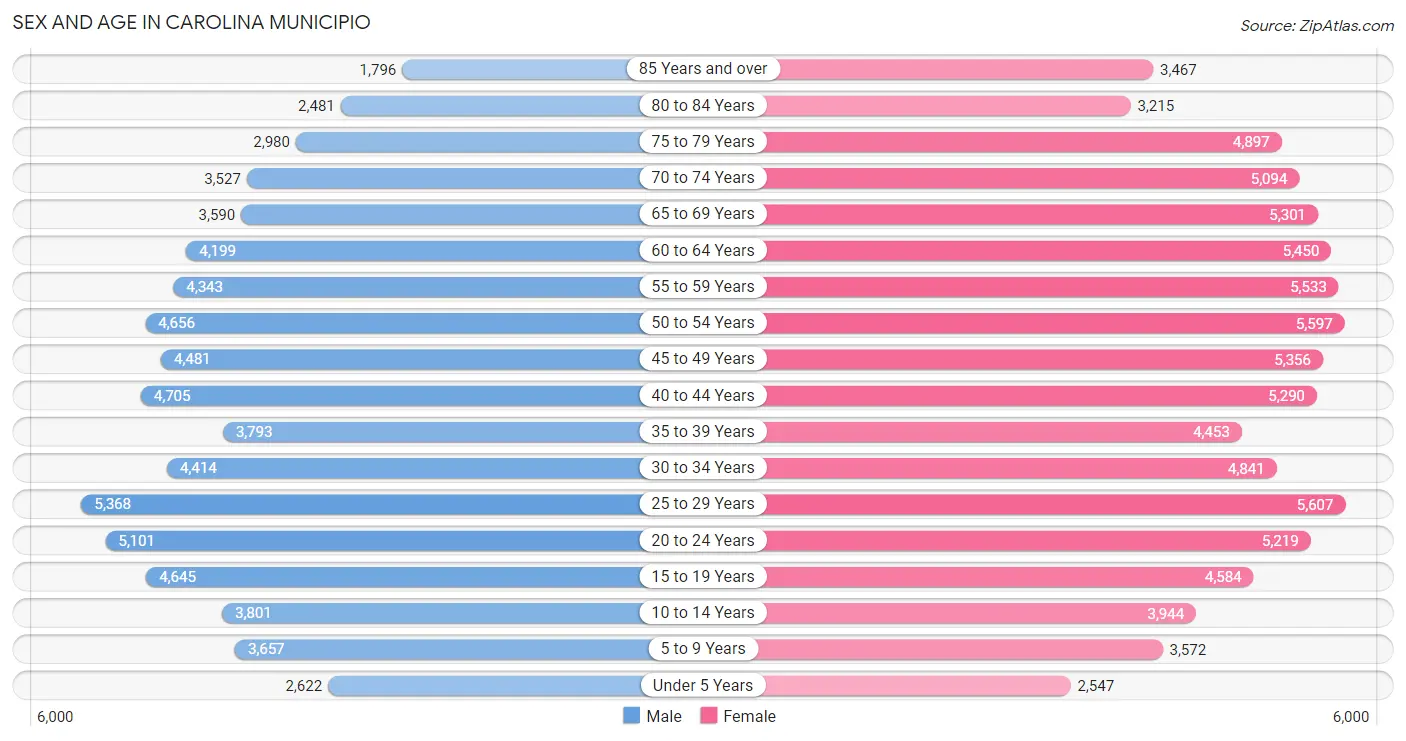
Sex and Age in Carolina Municipio
The most populous age groups in Carolina Municipio are 25 to 29 Years (5,368 | 7.6%) for men and 25 to 29 Years (5,607 | 6.7%) for women.
| Age Bracket | Male | Female |
| Under 5 Years | 2,622 (3.7%) | 2,547 (3.0%) |
| 5 to 9 Years | 3,657 (5.2%) | 3,572 (4.3%) |
| 10 to 14 Years | 3,801 (5.4%) | 3,944 (4.7%) |
| 15 to 19 Years | 4,645 (6.6%) | 4,584 (5.5%) |
| 20 to 24 Years | 5,101 (7.3%) | 5,219 (6.2%) |
| 25 to 29 Years | 5,368 (7.6%) | 5,607 (6.7%) |
| 30 to 34 Years | 4,414 (6.3%) | 4,841 (5.8%) |
| 35 to 39 Years | 3,793 (5.4%) | 4,453 (5.3%) |
| 40 to 44 Years | 4,705 (6.7%) | 5,290 (6.3%) |
| 45 to 49 Years | 4,481 (6.4%) | 5,356 (6.4%) |
| 50 to 54 Years | 4,656 (6.6%) | 5,597 (6.7%) |
| 55 to 59 Years | 4,343 (6.2%) | 5,533 (6.6%) |
| 60 to 64 Years | 4,199 (6.0%) | 5,450 (6.5%) |
| 65 to 69 Years | 3,590 (5.1%) | 5,301 (6.3%) |
| 70 to 74 Years | 3,527 (5.0%) | 5,094 (6.1%) |
| 75 to 79 Years | 2,980 (4.3%) | 4,897 (5.8%) |
| 80 to 84 Years | 2,481 (3.5%) | 3,215 (3.8%) |
| 85 Years and over | 1,796 (2.6%) | 3,467 (4.1%) |
| Total | 70,159 (100.0%) | 83,967 (100.0%) |
Families and Households in Carolina Municipio
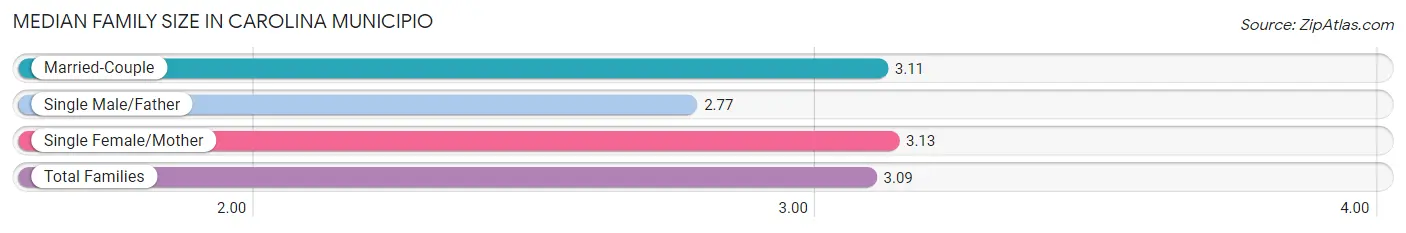
Median Family Size in Carolina Municipio
The median family size in Carolina Municipio is 3.09 persons per family, with single female/mother families (15,888 | 40.0%) accounting for the largest median family size of 3.13 persons per family. On the other hand, single male/father families (3,905 | 9.8%) represent the smallest median family size with 2.77 persons per family.
| Family Type | # Families | Family Size |
| Married-Couple | 19,927 (50.2%) | 3.11 |
| Single Male/Father | 3,905 (9.8%) | 2.77 |
| Single Female/Mother | 15,888 (40.0%) | 3.13 |
| Total Families | 39,720 (100.0%) | 3.09 |
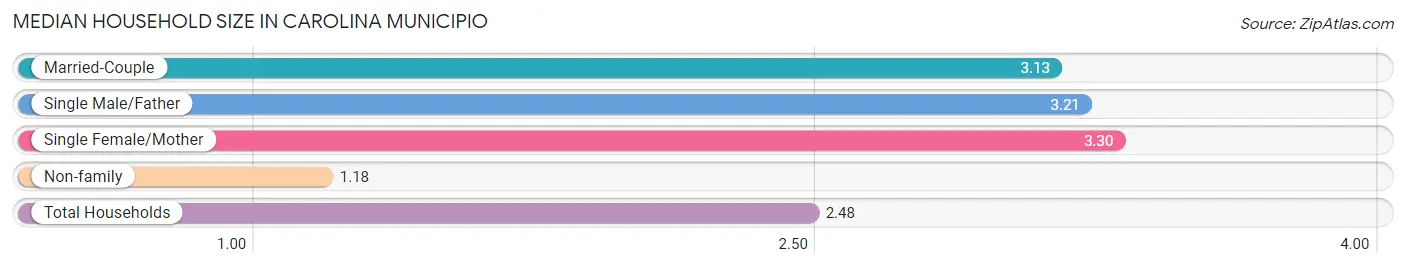
Median Household Size in Carolina Municipio
The median household size in Carolina Municipio is 2.48 persons per household, with single female/mother households (15,888 | 25.7%) accounting for the largest median household size of 3.3 persons per household. non-family households (22,163 | 35.8%) represent the smallest median household size with 1.18 persons per household.
| Household Type | # Households | Household Size |
| Married-Couple | 19,927 (32.2%) | 3.13 |
| Single Male/Father | 3,905 (6.3%) | 3.21 |
| Single Female/Mother | 15,888 (25.7%) | 3.30 |
| Non-family | 22,163 (35.8%) | 1.18 |
| Total Households | 61,883 (100.0%) | 2.48 |
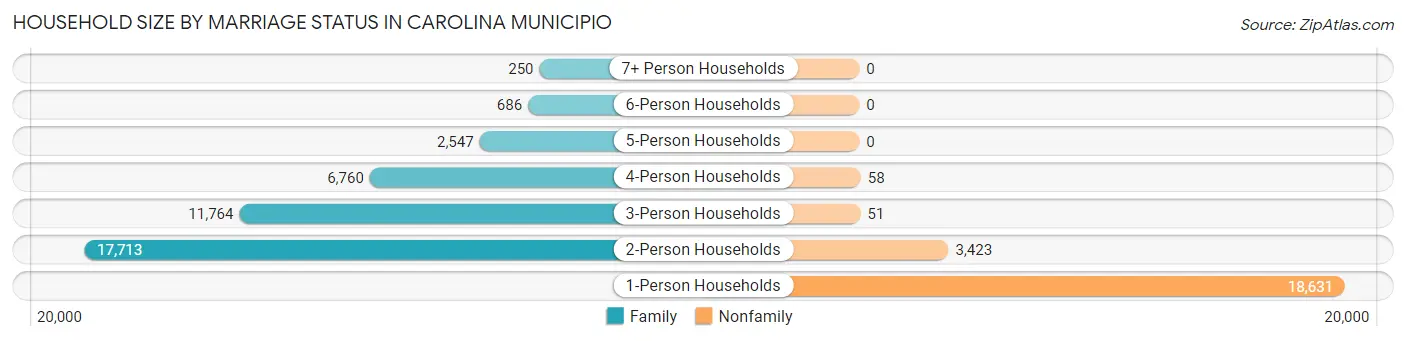
Household Size by Marriage Status in Carolina Municipio
Out of a total of 61,883 households in Carolina Municipio, 39,720 (64.2%) are family households, while 22,163 (35.8%) are nonfamily households. The most numerous type of family households are 2-person households, comprising 17,713, and the most common type of nonfamily households are 1-person households, comprising 18,631.
| Household Size | Family Households | Nonfamily Households |
| 1-Person Households | - | 18,631 (30.1%) |
| 2-Person Households | 17,713 (28.6%) | 3,423 (5.5%) |
| 3-Person Households | 11,764 (19.0%) | 51 (0.1%) |
| 4-Person Households | 6,760 (10.9%) | 58 (0.1%) |
| 5-Person Households | 2,547 (4.1%) | 0 (0.0%) |
| 6-Person Households | 686 (1.1%) | 0 (0.0%) |
| 7+ Person Households | 250 (0.4%) | 0 (0.0%) |
| Total | 39,720 (64.2%) | 22,163 (35.8%) |
Female Fertility in Carolina Municipio
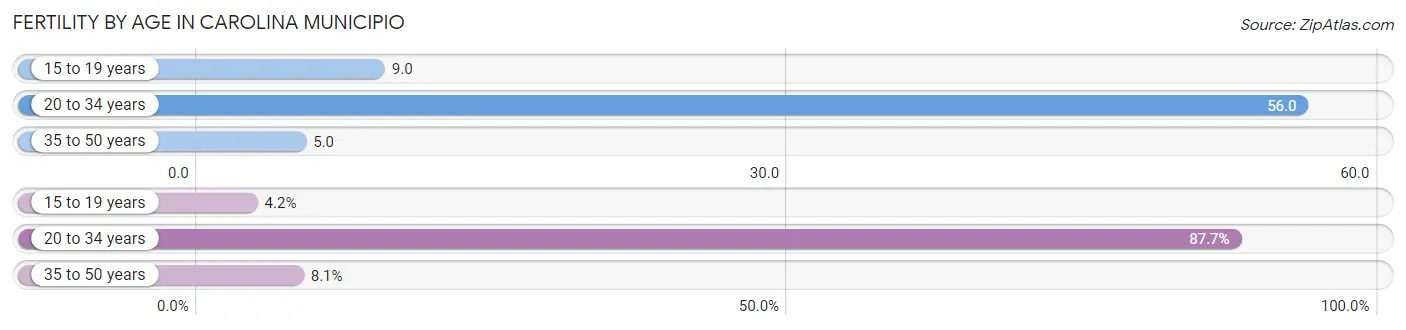
Fertility by Age in Carolina Municipio
Average fertility rate in Carolina Municipio is 27.0 births per 1,000 women. Women in the age bracket of 20 to 34 years have the highest fertility rate with 56.0 births per 1,000 women. Women in the age bracket of 20 to 34 years acount for 87.7% of all women with births.
| Age Bracket | Women with Births | Births / 1,000 Women |
| 15 to 19 years | 42 (4.2%) | 9.0 |
| 20 to 34 years | 874 (87.7%) | 56.0 |
| 35 to 50 years | 81 (8.1%) | 5.0 |
| Total | 997 (100.0%) | 27.0 |
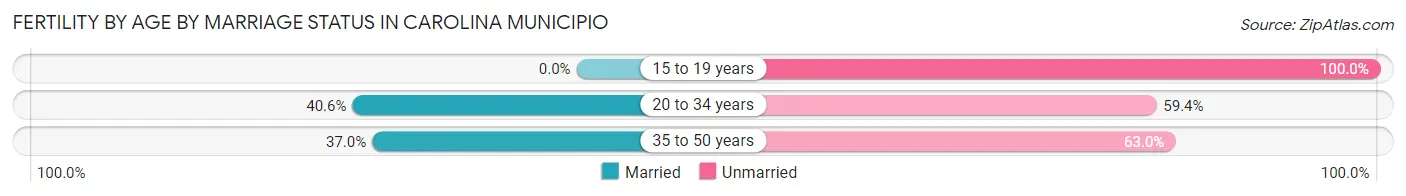
Fertility by Age by Marriage Status in Carolina Municipio
38.6% of women with births (997) in Carolina Municipio are married. The highest percentage of unmarried women with births falls into 15 to 19 years age bracket with 100.0% of them unmarried at the time of birth, while the lowest percentage of unmarried women with births belong to 20 to 34 years age bracket with 59.4% of them unmarried.
| Age Bracket | Married | Unmarried |
| 15 to 19 years | 0 (0.0%) | 42 (100.0%) |
| 20 to 34 years | 355 (40.6%) | 519 (59.4%) |
| 35 to 50 years | 30 (37.0%) | 51 (63.0%) |
| Total | 385 (38.6%) | 612 (61.4%) |
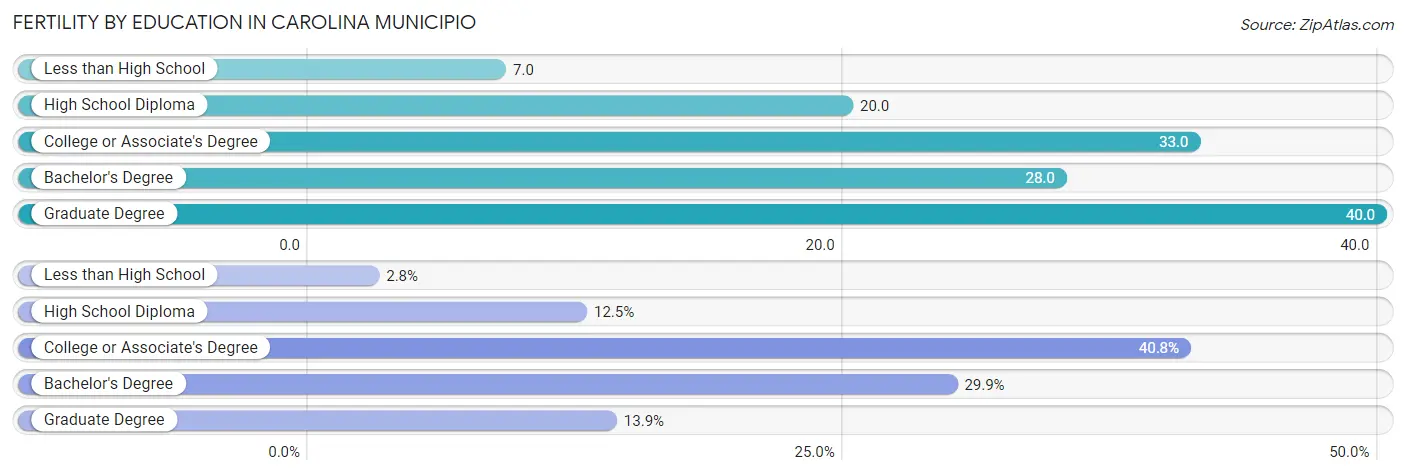
Fertility by Education in Carolina Municipio
Average fertility rate in Carolina Municipio is 27.0 births per 1,000 women. Women with the education attainment of graduate degree have the highest fertility rate of 40.0 births per 1,000 women, while women with the education attainment of less than high school have the lowest fertility at 7.0 births per 1,000 women. Women with the education attainment of college or associate's degree represent 40.8% of all women with births.
| Educational Attainment | Women with Births | Births / 1,000 Women |
| Less than High School | 28 (2.8%) | 7.0 |
| High School Diploma | 125 (12.5%) | 20.0 |
| College or Associate's Degree | 407 (40.8%) | 33.0 |
| Bachelor's Degree | 298 (29.9%) | 28.0 |
| Graduate Degree | 139 (13.9%) | 40.0 |
| Total | 997 (100.0%) | 27.0 |
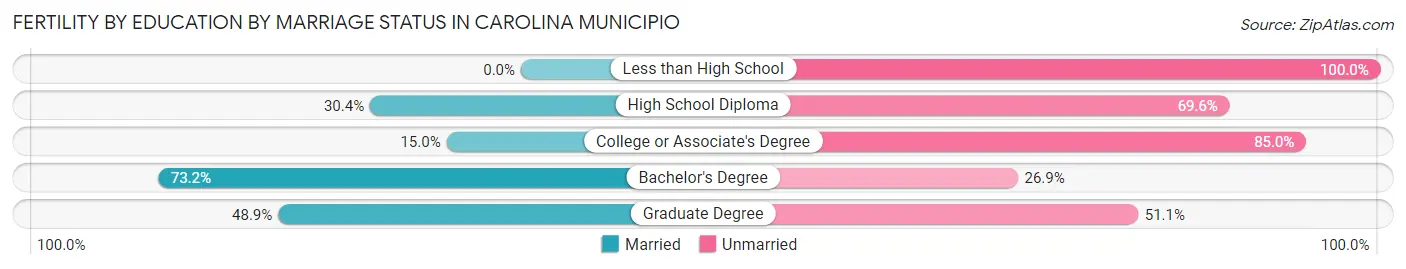
Fertility by Education by Marriage Status in Carolina Municipio
61.4% of women with births in Carolina Municipio are unmarried. Women with the educational attainment of bachelor's degree are most likely to be married with 73.2% of them married at childbirth, while women with the educational attainment of less than high school are least likely to be married with 100.0% of them unmarried at childbirth.
| Educational Attainment | Married | Unmarried |
| Less than High School | 0 (0.0%) | 28 (100.0%) |
| High School Diploma | 38 (30.4%) | 87 (69.6%) |
| College or Associate's Degree | 61 (15.0%) | 346 (85.0%) |
| Bachelor's Degree | 218 (73.2%) | 80 (26.9%) |
| Graduate Degree | 68 (48.9%) | 71 (51.1%) |
| Total | 385 (38.6%) | 612 (61.4%) |
Employment Characteristics in Carolina Municipio
Employment by Class of Employer in Carolina Municipio
Among the 57,206 employed individuals in Carolina Municipio, private company employees (36,891 | 64.5%), state government employees (6,104 | 10.7%), and self-employed (not incorporated) (5,213 | 9.1%) make up the most common classes of employment.
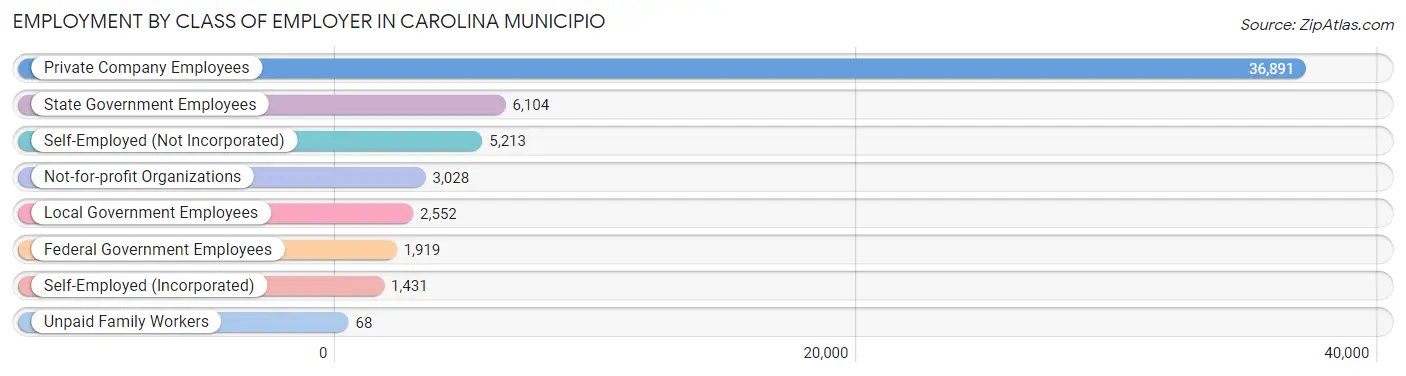
| Employer Class | # Employees | % Employees |
| Private Company Employees | 36,891 | 64.5% |
| Self-Employed (Incorporated) | 1,431 | 2.5% |
| Self-Employed (Not Incorporated) | 5,213 | 9.1% |
| Not-for-profit Organizations | 3,028 | 5.3% |
| Local Government Employees | 2,552 | 4.5% |
| State Government Employees | 6,104 | 10.7% |
| Federal Government Employees | 1,919 | 3.4% |
| Unpaid Family Workers | 68 | 0.1% |
| Total | 57,206 | 100.0% |
Employment Status by Age in Carolina Municipio
According to the labor force statistics for Carolina Municipio, out of the total population over 16 years of age (132,256), 52.5% or 69,434 individuals are in the labor force, with 13.3% or 9,235 of them unemployed. The age group with the highest labor force participation rate is 30 to 34 years, with 85.3% or 7,895 individuals in the labor force. Within the labor force, the 16 to 19 years age range has the highest percentage of unemployed individuals, with 43.5% or 626 of them being unemployed.
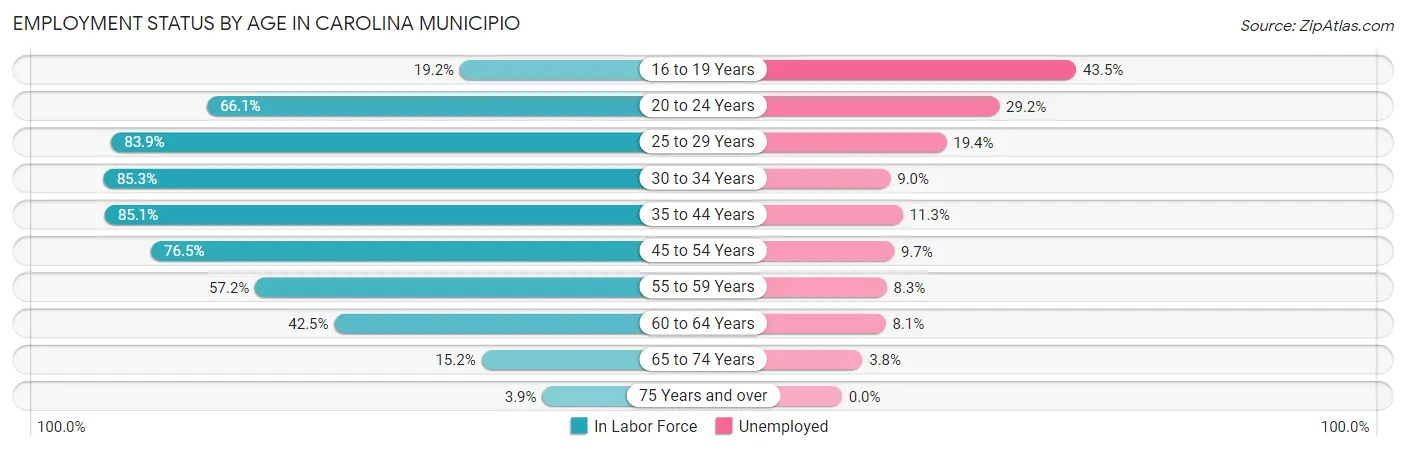
| Age Bracket | In Labor Force | Unemployed |
| 16 to 19 Years | 1,440 (19.2%) | 626 (43.5%) |
| 20 to 24 Years | 6,822 (66.1%) | 1,992 (29.2%) |
| 25 to 29 Years | 9,208 (83.9%) | 1,786 (19.4%) |
| 30 to 34 Years | 7,895 (85.3%) | 711 (9.0%) |
| 35 to 44 Years | 15,523 (85.1%) | 1,754 (11.3%) |
| 45 to 54 Years | 15,369 (76.5%) | 1,491 (9.7%) |
| 55 to 59 Years | 5,649 (57.2%) | 469 (8.3%) |
| 60 to 64 Years | 4,101 (42.5%) | 332 (8.1%) |
| 65 to 74 Years | 2,662 (15.2%) | 101 (3.8%) |
| 75 Years and over | 735 (3.9%) | 0 (0.0%) |
| Total | 69,434 (52.5%) | 9,235 (13.3%) |
Employment Status by Educational Attainment in Carolina Municipio
According to labor force statistics for Carolina Municipio, 73.9% of individuals (57,706) out of the total population between 25 and 64 years of age (78,086) are in the labor force, with 11.3% or 6,521 of them being unemployed. The group with the highest labor force participation rate are those with the educational attainment of bachelor's degree or higher, with 82.6% or 25,784 individuals in the labor force. Within the labor force, individuals with less than high school education have the highest percentage of unemployment, with 24.1% or 516 of them being unemployed.
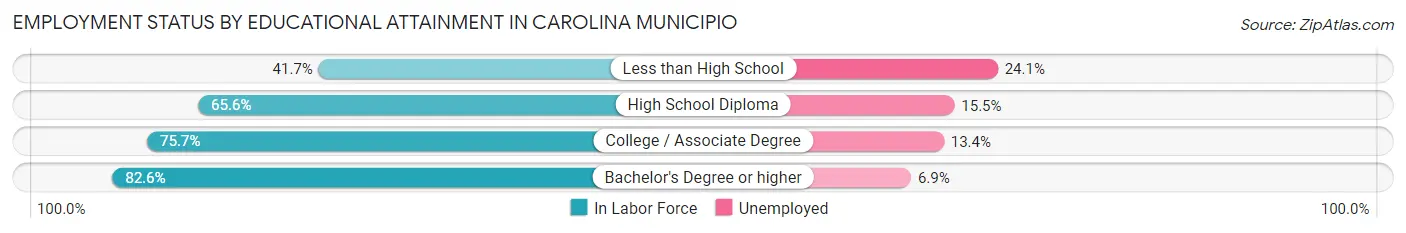
| Educational Attainment | In Labor Force | Unemployed |
| Less than High School | 2,143 (41.7%) | 1,238 (24.1%) |
| High School Diploma | 11,450 (65.6%) | 2,706 (15.5%) |
| College / Associate Degree | 18,378 (75.7%) | 3,253 (13.4%) |
| Bachelor's Degree or higher | 25,784 (82.6%) | 2,154 (6.9%) |
| Total | 57,706 (73.9%) | 8,824 (11.3%) |
Employment Occupations by Sex in Carolina Municipio
Management, Business, Science and Arts Occupations
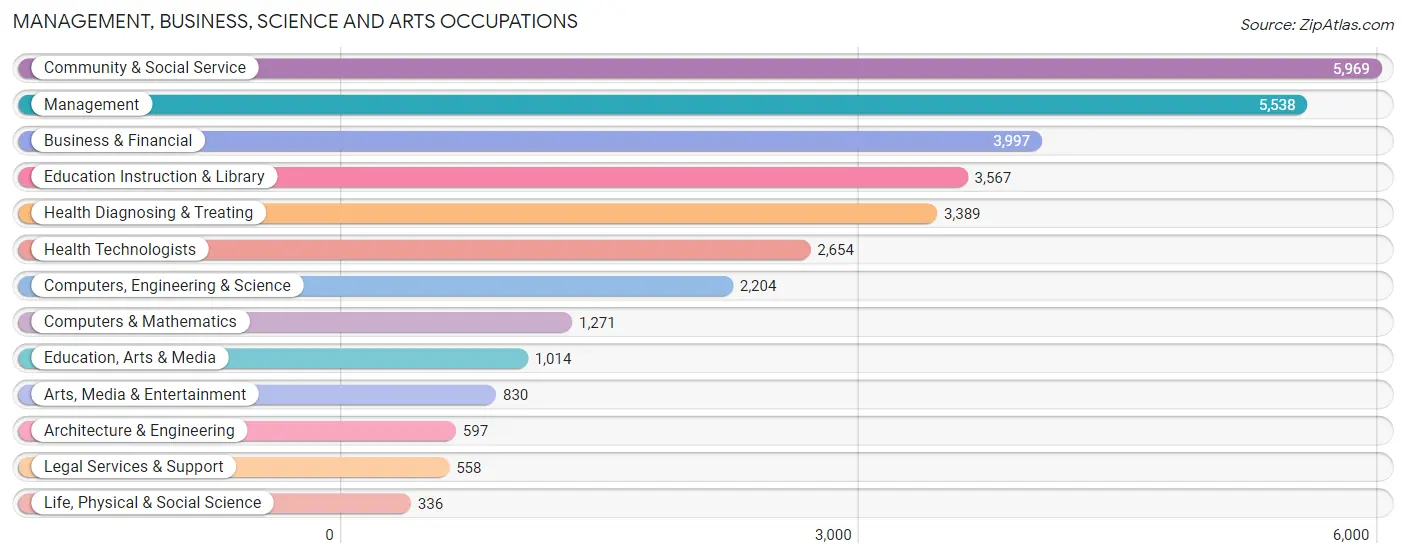
The most common Management, Business, Science and Arts occupations in Carolina Municipio are Community & Social Service (5,969 | 10.0%), Management (5,538 | 9.2%), Business & Financial (3,997 | 6.7%), Education Instruction & Library (3,567 | 5.9%), and Health Diagnosing & Treating (3,389 | 5.7%).
Management, Business, Science and Arts Occupations by Sex
Within the Management, Business, Science and Arts occupations in Carolina Municipio, the most male-oriented occupations are Architecture & Engineering (71.5%), Arts, Media & Entertainment (68.8%), and Computers & Mathematics (68.1%), while the most female-oriented occupations are Health Technologists (80.2%), Health Diagnosing & Treating (77.2%), and Education Instruction & Library (74.2%).
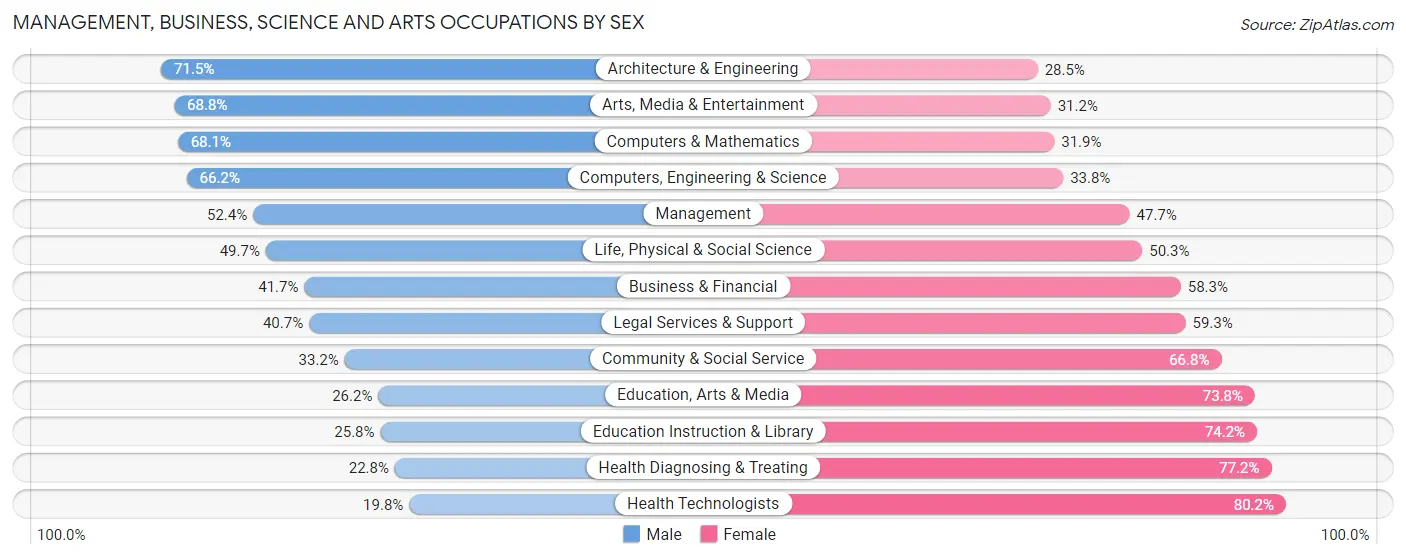
| Occupation | Male | Female |
| Management | 2,899 (52.3%) | 2,639 (47.6%) |
| Business & Financial | 1,665 (41.7%) | 2,332 (58.3%) |
| Computers, Engineering & Science | 1,459 (66.2%) | 745 (33.8%) |
| Computers & Mathematics | 865 (68.1%) | 406 (31.9%) |
| Architecture & Engineering | 427 (71.5%) | 170 (28.5%) |
| Life, Physical & Social Science | 167 (49.7%) | 169 (50.3%) |
| Community & Social Service | 1,984 (33.2%) | 3,985 (66.8%) |
| Education, Arts & Media | 266 (26.2%) | 748 (73.8%) |
| Legal Services & Support | 227 (40.7%) | 331 (59.3%) |
| Education Instruction & Library | 920 (25.8%) | 2,647 (74.2%) |
| Arts, Media & Entertainment | 571 (68.8%) | 259 (31.2%) |
| Health Diagnosing & Treating | 772 (22.8%) | 2,617 (77.2%) |
| Health Technologists | 525 (19.8%) | 2,129 (80.2%) |
| Total (Category) | 8,779 (41.6%) | 12,318 (58.4%) |
| Total (Overall) | 29,579 (49.4%) | 30,345 (50.6%) |
Services Occupations
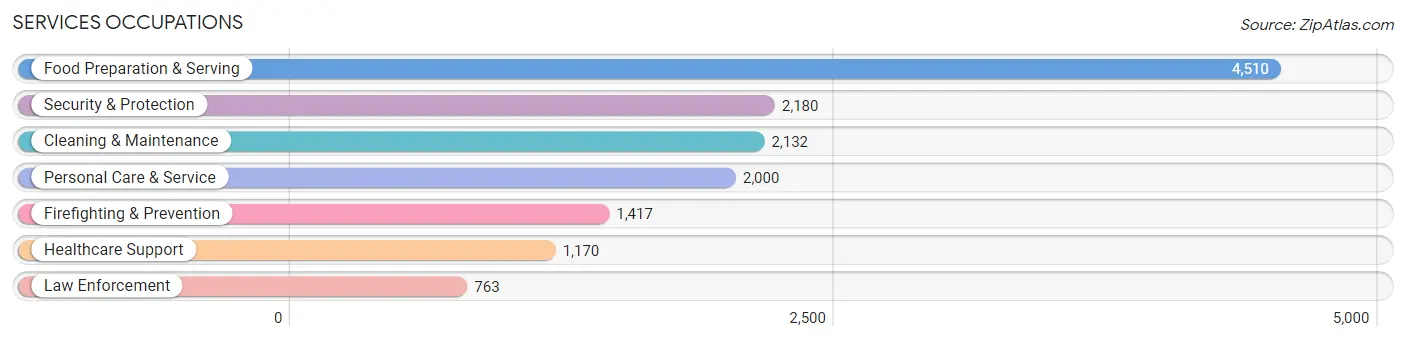
The most common Services occupations in Carolina Municipio are Food Preparation & Serving (4,510 | 7.5%), Security & Protection (2,180 | 3.6%), Cleaning & Maintenance (2,132 | 3.6%), Personal Care & Service (2,000 | 3.3%), and Firefighting & Prevention (1,417 | 2.4%).
Services Occupations by Sex
Within the Services occupations in Carolina Municipio, the most male-oriented occupations are Law Enforcement (75.2%), Security & Protection (75.0%), and Firefighting & Prevention (74.9%), while the most female-oriented occupations are Healthcare Support (82.7%), Personal Care & Service (55.4%), and Food Preparation & Serving (45.8%).
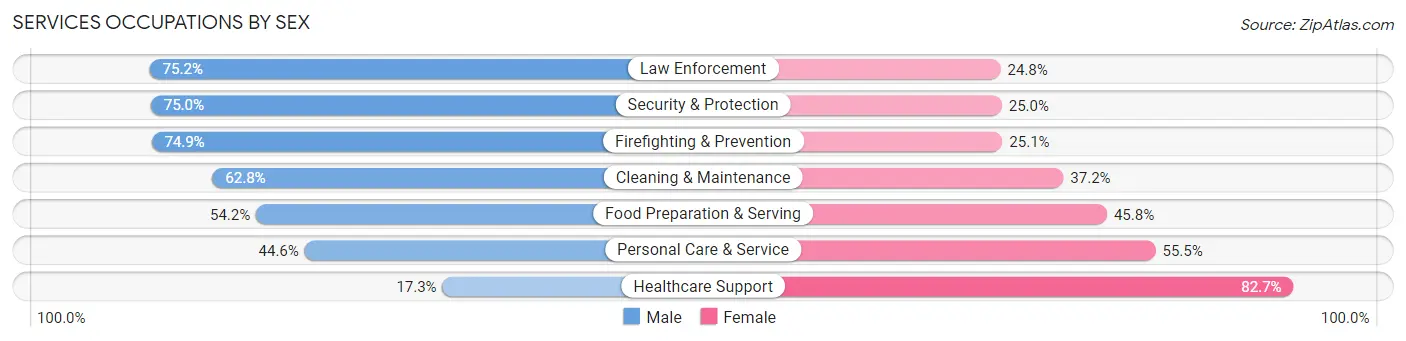
| Occupation | Male | Female |
| Healthcare Support | 202 (17.3%) | 968 (82.7%) |
| Security & Protection | 1,635 (75.0%) | 545 (25.0%) |
| Firefighting & Prevention | 1,061 (74.9%) | 356 (25.1%) |
| Law Enforcement | 574 (75.2%) | 189 (24.8%) |
| Food Preparation & Serving | 2,443 (54.2%) | 2,067 (45.8%) |
| Cleaning & Maintenance | 1,339 (62.8%) | 793 (37.2%) |
| Personal Care & Service | 891 (44.6%) | 1,109 (55.4%) |
| Total (Category) | 6,510 (54.3%) | 5,482 (45.7%) |
| Total (Overall) | 29,579 (49.4%) | 30,345 (50.6%) |
Sales and Office Occupations
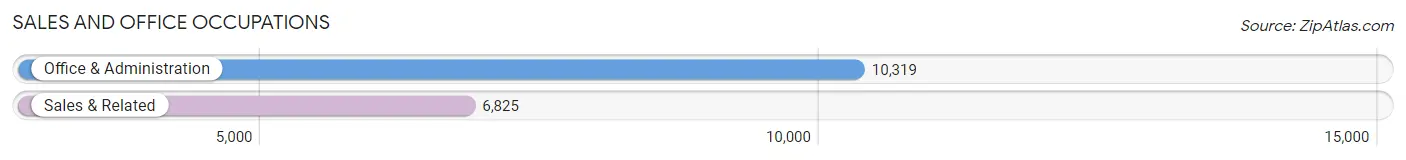
The most common Sales and Office occupations in Carolina Municipio are Office & Administration (10,319 | 17.2%), and Sales & Related (6,825 | 11.4%).
Sales and Office Occupations by Sex
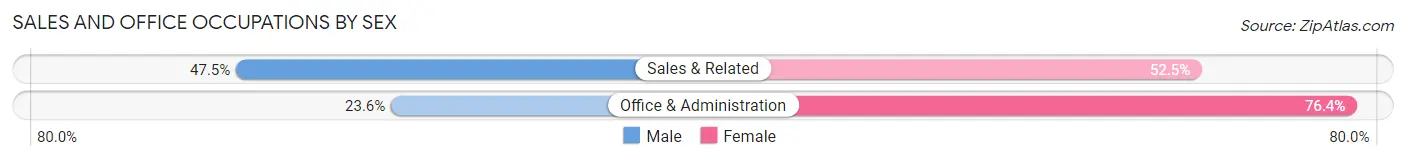
| Occupation | Male | Female |
| Sales & Related | 3,239 (47.5%) | 3,586 (52.5%) |
| Office & Administration | 2,436 (23.6%) | 7,883 (76.4%) |
| Total (Category) | 5,675 (33.1%) | 11,469 (66.9%) |
| Total (Overall) | 29,579 (49.4%) | 30,345 (50.6%) |
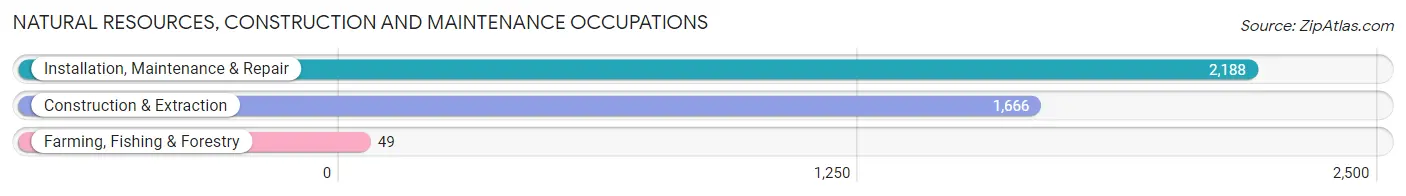
Natural Resources, Construction and Maintenance Occupations
The most common Natural Resources, Construction and Maintenance occupations in Carolina Municipio are Installation, Maintenance & Repair (2,188 | 3.6%), Construction & Extraction (1,666 | 2.8%), and Farming, Fishing & Forestry (49 | 0.1%).
Natural Resources, Construction and Maintenance Occupations by Sex
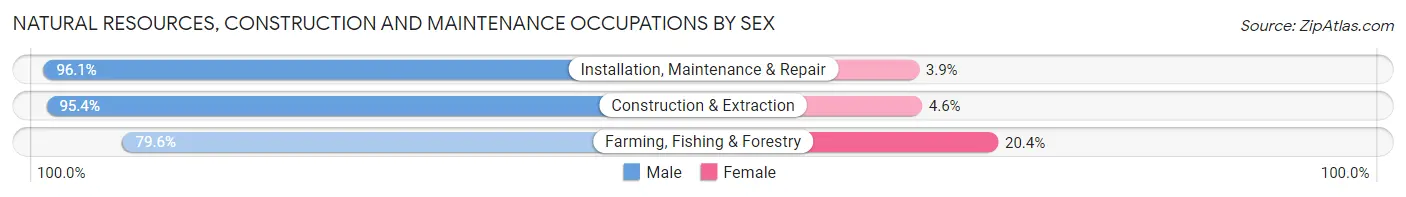
| Occupation | Male | Female |
| Farming, Fishing & Forestry | 39 (79.6%) | 10 (20.4%) |
| Construction & Extraction | 1,590 (95.4%) | 76 (4.6%) |
| Installation, Maintenance & Repair | 2,102 (96.1%) | 86 (3.9%) |
| Total (Category) | 3,731 (95.6%) | 172 (4.4%) |
| Total (Overall) | 29,579 (49.4%) | 30,345 (50.6%) |
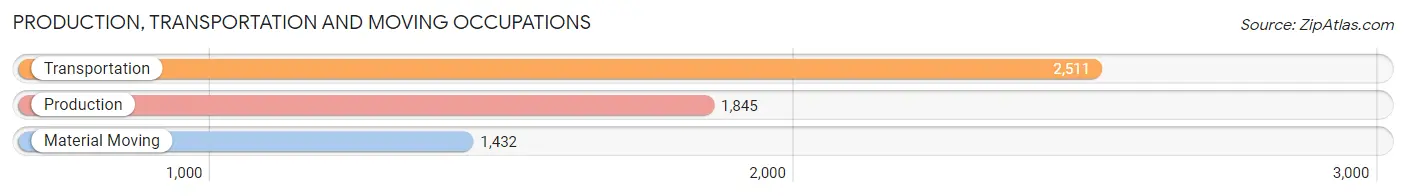
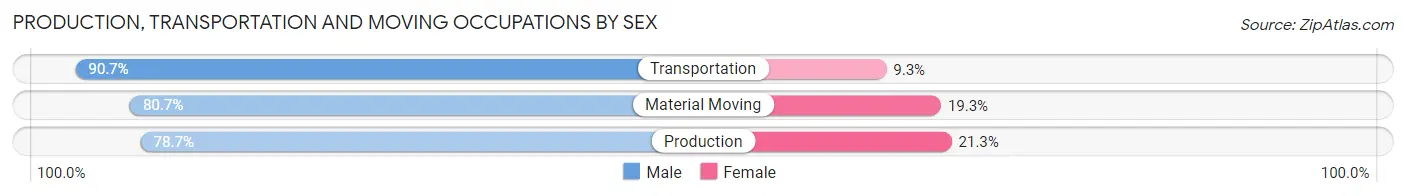
Production, Transportation and Moving Occupations
The most common Production, Transportation and Moving occupations in Carolina Municipio are Transportation (2,511 | 4.2%), Production (1,845 | 3.1%), and Material Moving (1,432 | 2.4%).
Production, Transportation and Moving Occupations by Sex
| Occupation | Male | Female |
| Production | 1,452 (78.7%) | 393 (21.3%) |
| Transportation | 2,277 (90.7%) | 234 (9.3%) |
| Material Moving | 1,155 (80.7%) | 277 (19.3%) |
| Total (Category) | 4,884 (84.4%) | 904 (15.6%) |
| Total (Overall) | 29,579 (49.4%) | 30,345 (50.6%) |
Employment Industries by Sex in Carolina Municipio
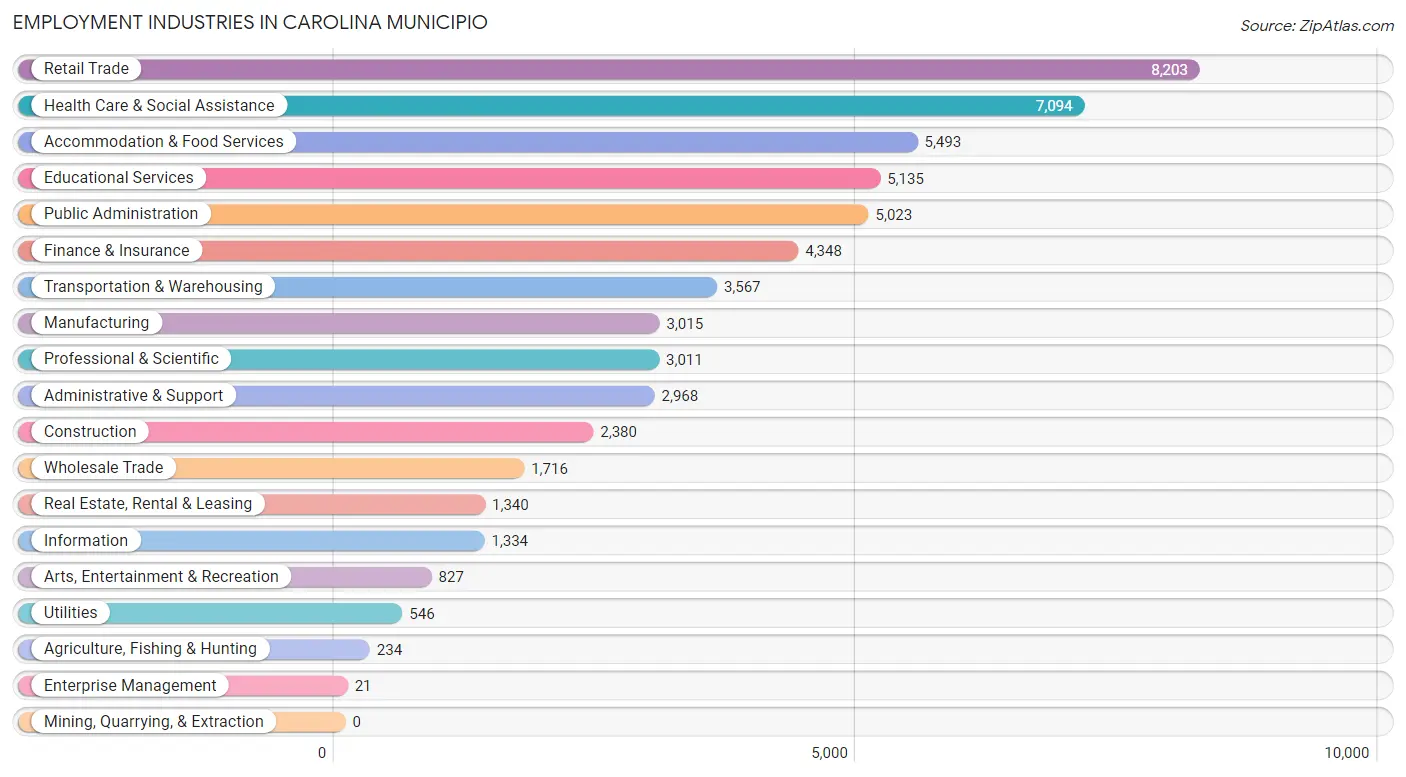
Employment Industries in Carolina Municipio
The major employment industries in Carolina Municipio include Retail Trade (8,203 | 13.7%), Health Care & Social Assistance (7,094 | 11.8%), Accommodation & Food Services (5,493 | 9.2%), Educational Services (5,135 | 8.6%), and Public Administration (5,023 | 8.4%).
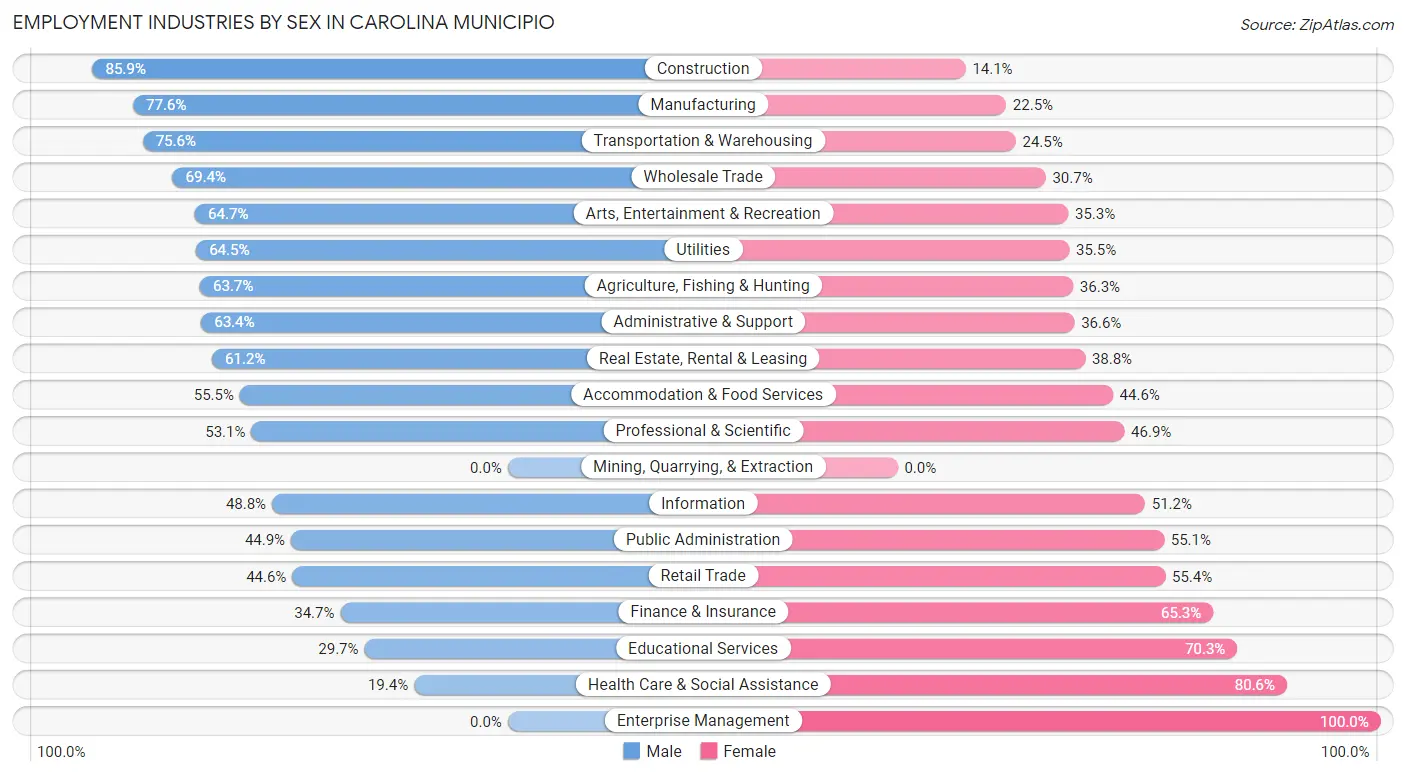
Employment Industries by Sex in Carolina Municipio
The Carolina Municipio industries that see more men than women are Construction (85.9%), Manufacturing (77.5%), and Transportation & Warehousing (75.5%), whereas the industries that tend to have a higher number of women are Enterprise Management (100.0%), Health Care & Social Assistance (80.6%), and Educational Services (70.3%).
| Industry | Male | Female |
| Agriculture, Fishing & Hunting | 149 (63.7%) | 85 (36.3%) |
| Mining, Quarrying, & Extraction | 0 (0.0%) | 0 (0.0%) |
| Construction | 2,045 (85.9%) | 335 (14.1%) |
| Manufacturing | 2,338 (77.5%) | 677 (22.5%) |
| Wholesale Trade | 1,190 (69.4%) | 526 (30.6%) |
| Retail Trade | 3,659 (44.6%) | 4,544 (55.4%) |
| Transportation & Warehousing | 2,695 (75.5%) | 872 (24.4%) |
| Utilities | 352 (64.5%) | 194 (35.5%) |
| Information | 651 (48.8%) | 683 (51.2%) |
| Finance & Insurance | 1,507 (34.7%) | 2,841 (65.3%) |
| Real Estate, Rental & Leasing | 820 (61.2%) | 520 (38.8%) |
| Professional & Scientific | 1,598 (53.1%) | 1,413 (46.9%) |
| Enterprise Management | 0 (0.0%) | 21 (100.0%) |
| Administrative & Support | 1,882 (63.4%) | 1,086 (36.6%) |
| Educational Services | 1,524 (29.7%) | 3,611 (70.3%) |
| Health Care & Social Assistance | 1,376 (19.4%) | 5,718 (80.6%) |
| Arts, Entertainment & Recreation | 535 (64.7%) | 292 (35.3%) |
| Accommodation & Food Services | 3,046 (55.4%) | 2,447 (44.6%) |
| Public Administration | 2,254 (44.9%) | 2,769 (55.1%) |
| Total | 29,579 (49.4%) | 30,345 (50.6%) |
Education in Carolina Municipio
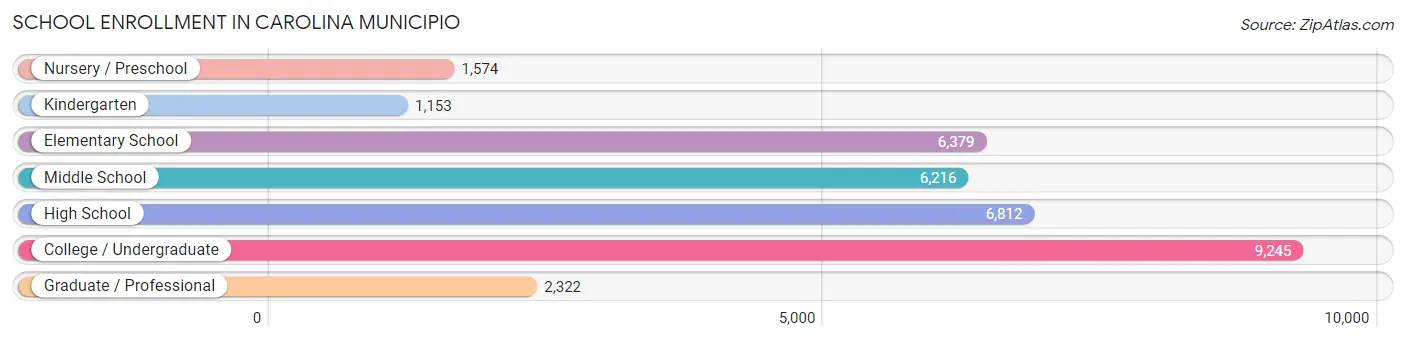
School Enrollment in Carolina Municipio
The most common levels of schooling among the 33,701 students in Carolina Municipio are college / undergraduate (9,245 | 27.4%), high school (6,812 | 20.2%), and elementary school (6,379 | 18.9%).
| School Level | # Students | % Students |
| Nursery / Preschool | 1,574 | 4.7% |
| Kindergarten | 1,153 | 3.4% |
| Elementary School | 6,379 | 18.9% |
| Middle School | 6,216 | 18.4% |
| High School | 6,812 | 20.2% |
| College / Undergraduate | 9,245 | 27.4% |
| Graduate / Professional | 2,322 | 6.9% |
| Total | 33,701 | 100.0% |
School Enrollment by Age by Funding Source in Carolina Municipio
Out of a total of 33,701 students who are enrolled in schools in Carolina Municipio, 16,244 (48.2%) attend a private institution, while the remaining 17,457 (51.8%) are enrolled in public schools. The age group of 35 years and over has the highest likelihood of being enrolled in private schools, with 1,737 (79.2% in the age bracket) enrolled. Conversely, the age group of 10 to 14 year olds has the lowest likelihood of being enrolled in a private school, with 4,629 (60.8% in the age bracket) attending a public institution.
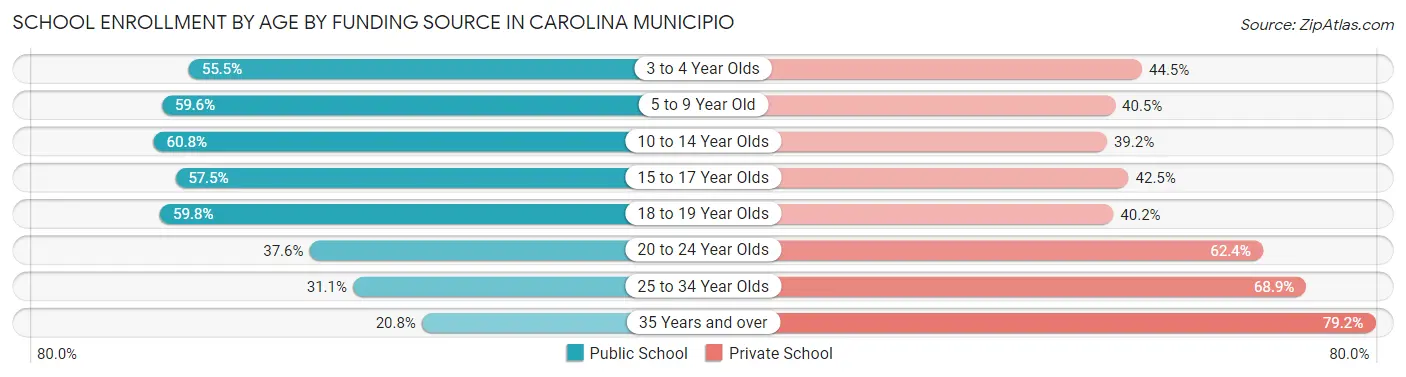
| Age Bracket | Public School | Private School |
| 3 to 4 Year Olds | 813 (55.5%) | 651 (44.5%) |
| 5 to 9 Year Old | 4,159 (59.6%) | 2,825 (40.5%) |
| 10 to 14 Year Olds | 4,629 (60.8%) | 2,990 (39.2%) |
| 15 to 17 Year Olds | 2,961 (57.5%) | 2,185 (42.5%) |
| 18 to 19 Year Olds | 1,847 (59.8%) | 1,241 (40.2%) |
| 20 to 24 Year Olds | 1,942 (37.6%) | 3,225 (62.4%) |
| 25 to 34 Year Olds | 634 (31.1%) | 1,405 (68.9%) |
| 35 Years and over | 457 (20.8%) | 1,737 (79.2%) |
| Total | 17,457 (51.8%) | 16,244 (48.2%) |
Educational Attainment by Field of Study in Carolina Municipio
Business (12,884 | 32.0%), education (5,931 | 14.7%), science & technology (4,352 | 10.8%), arts & humanities (3,465 | 8.6%), and bio, nature & agricultural (2,062 | 5.1%) are the most common fields of study among 40,215 individuals in Carolina Municipio who have obtained a bachelor's degree or higher.
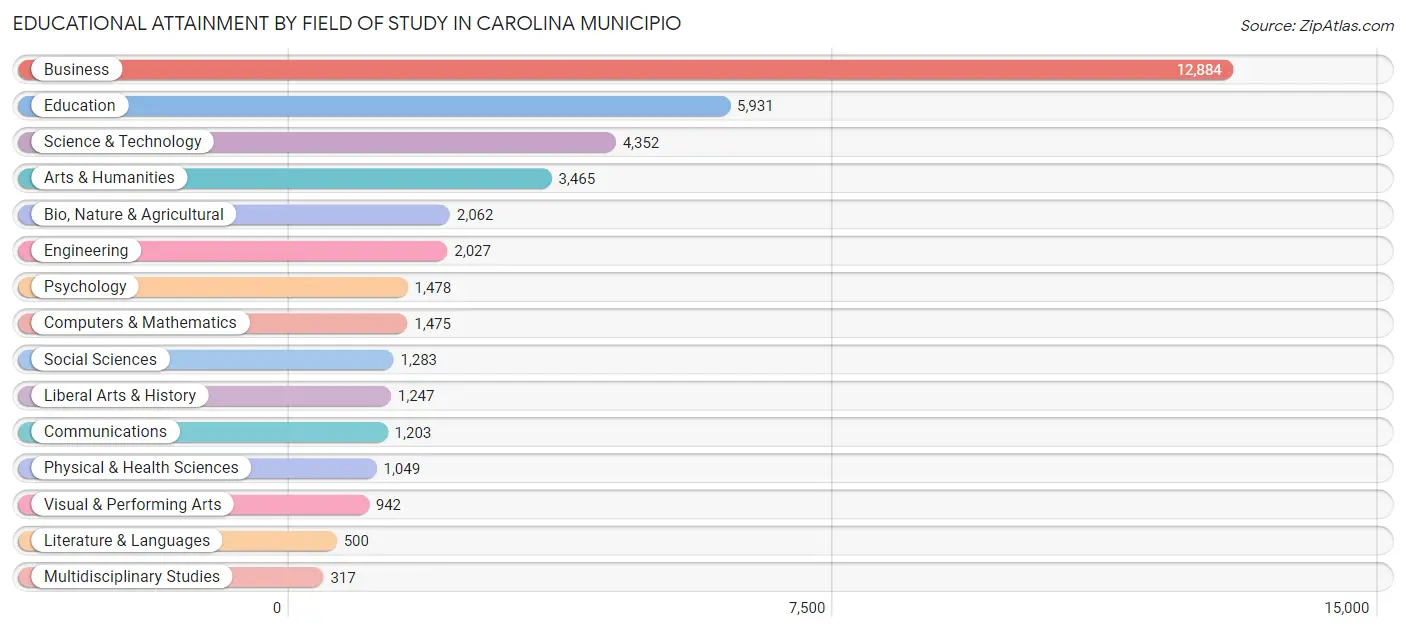
| Field of Study | # Graduates | % Graduates |
| Computers & Mathematics | 1,475 | 3.7% |
| Bio, Nature & Agricultural | 2,062 | 5.1% |
| Physical & Health Sciences | 1,049 | 2.6% |
| Psychology | 1,478 | 3.7% |
| Social Sciences | 1,283 | 3.2% |
| Engineering | 2,027 | 5.0% |
| Multidisciplinary Studies | 317 | 0.8% |
| Science & Technology | 4,352 | 10.8% |
| Business | 12,884 | 32.0% |
| Education | 5,931 | 14.7% |
| Literature & Languages | 500 | 1.2% |
| Liberal Arts & History | 1,247 | 3.1% |
| Visual & Performing Arts | 942 | 2.3% |
| Communications | 1,203 | 3.0% |
| Arts & Humanities | 3,465 | 8.6% |
| Total | 40,215 | 100.0% |
Transportation & Commute in Carolina Municipio
Vehicle Availability by Sex in Carolina Municipio
The most prevalent vehicle ownership categories in Carolina Municipio are males with 2 vehicles (12,649, accounting for 44.5%) and females with 2 vehicles (11,560, making up 44.0%).
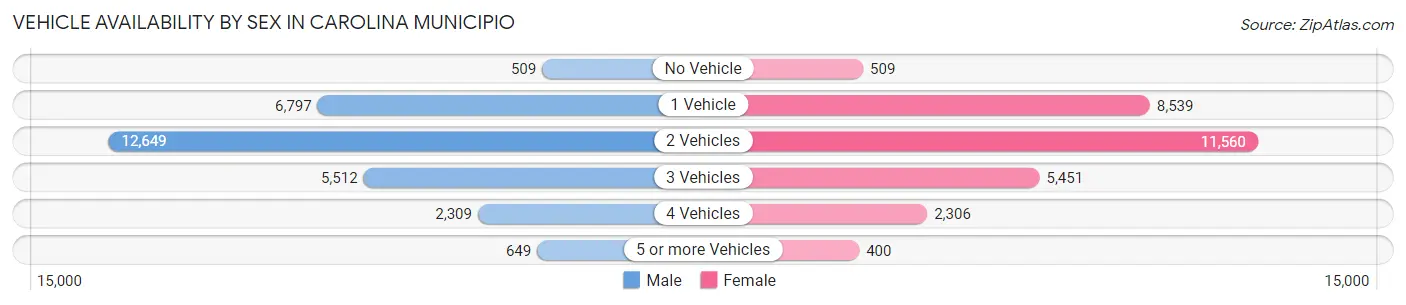
| Vehicles Available | Male | Female |
| No Vehicle | 509 (1.8%) | 509 (1.8%) |
| 1 Vehicle | 6,797 (23.9%) | 8,539 (29.7%) |
| 2 Vehicles | 12,649 (44.5%) | 11,560 (40.2%) |
| 3 Vehicles | 5,512 (19.4%) | 5,451 (19.0%) |
| 4 Vehicles | 2,309 (8.1%) | 2,306 (8.0%) |
| 5 or more Vehicles | 649 (2.3%) | 400 (1.4%) |
| Total | 28,425 (100.0%) | 28,765 (100.0%) |
Commute Time in Carolina Municipio
The most frequently occuring commute durations in Carolina Municipio are 30 to 34 minutes (9,206 commuters, 17.3%), 20 to 24 minutes (8,799 commuters, 16.6%), and 15 to 19 minutes (7,417 commuters, 14.0%).
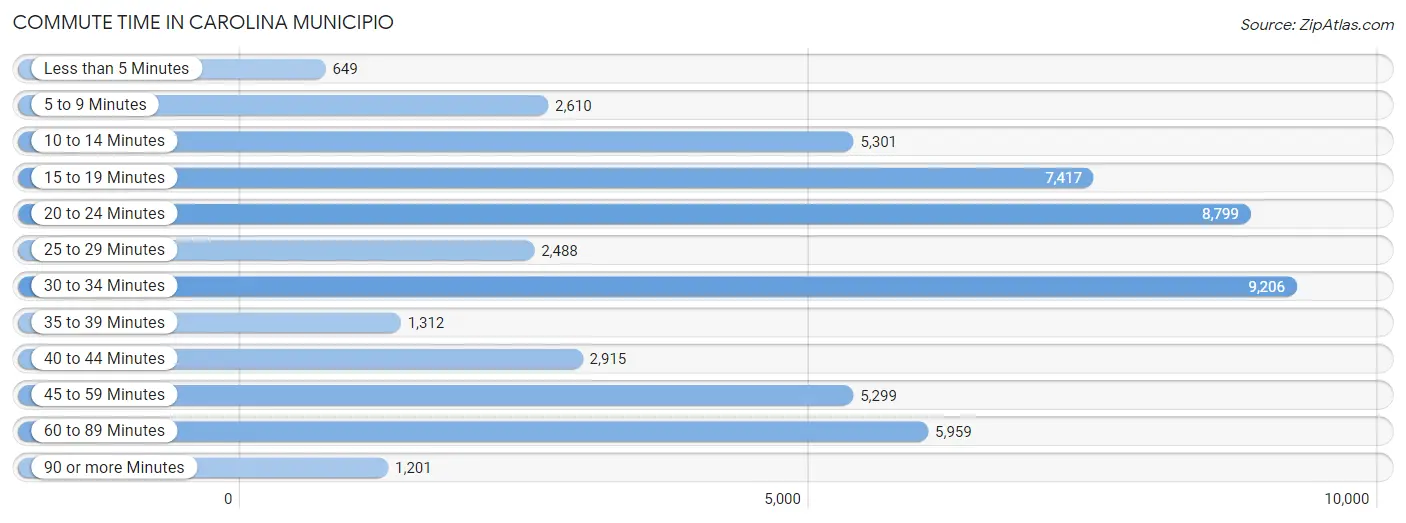
| Commute Time | # Commuters | % Commuters |
| Less than 5 Minutes | 649 | 1.2% |
| 5 to 9 Minutes | 2,610 | 4.9% |
| 10 to 14 Minutes | 5,301 | 10.0% |
| 15 to 19 Minutes | 7,417 | 14.0% |
| 20 to 24 Minutes | 8,799 | 16.6% |
| 25 to 29 Minutes | 2,488 | 4.7% |
| 30 to 34 Minutes | 9,206 | 17.3% |
| 35 to 39 Minutes | 1,312 | 2.5% |
| 40 to 44 Minutes | 2,915 | 5.5% |
| 45 to 59 Minutes | 5,299 | 10.0% |
| 60 to 89 Minutes | 5,959 | 11.2% |
| 90 or more Minutes | 1,201 | 2.3% |
Commute Time by Sex in Carolina Municipio
The most common commute times in Carolina Municipio are 30 to 34 minutes (4,570 commuters, 17.1%) for males and 30 to 34 minutes (4,636 commuters, 17.6%) for females.
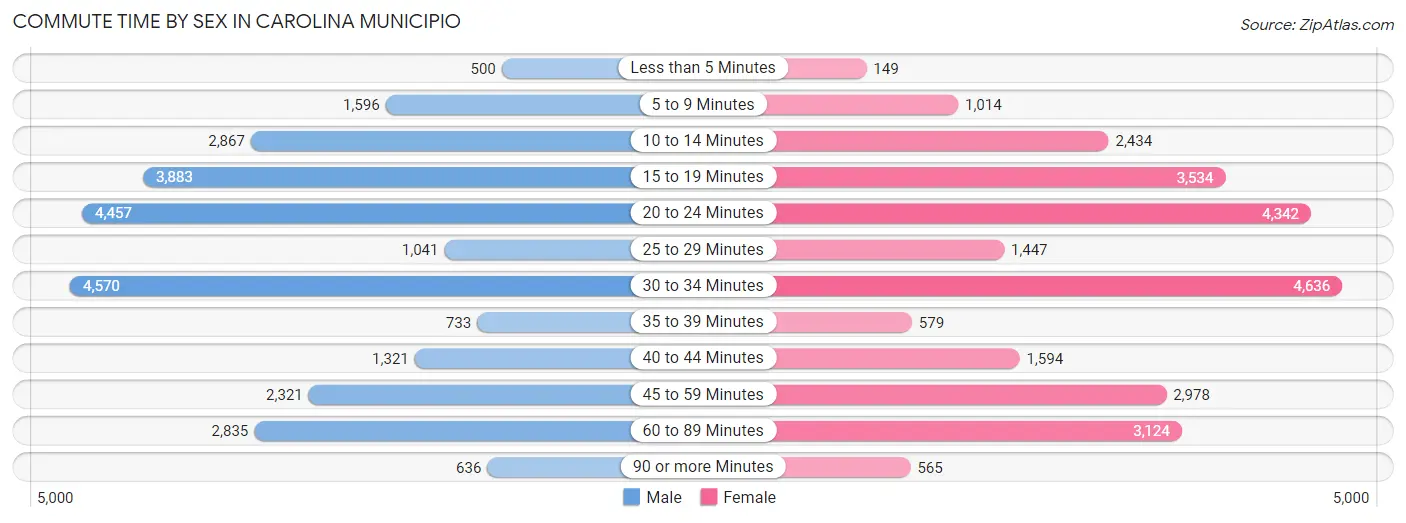
| Commute Time | Male | Female |
| Less than 5 Minutes | 500 (1.9%) | 149 (0.6%) |
| 5 to 9 Minutes | 1,596 (6.0%) | 1,014 (3.8%) |
| 10 to 14 Minutes | 2,867 (10.7%) | 2,434 (9.2%) |
| 15 to 19 Minutes | 3,883 (14.5%) | 3,534 (13.4%) |
| 20 to 24 Minutes | 4,457 (16.7%) | 4,342 (16.5%) |
| 25 to 29 Minutes | 1,041 (3.9%) | 1,447 (5.5%) |
| 30 to 34 Minutes | 4,570 (17.1%) | 4,636 (17.6%) |
| 35 to 39 Minutes | 733 (2.7%) | 579 (2.2%) |
| 40 to 44 Minutes | 1,321 (4.9%) | 1,594 (6.0%) |
| 45 to 59 Minutes | 2,321 (8.7%) | 2,978 (11.3%) |
| 60 to 89 Minutes | 2,835 (10.6%) | 3,124 (11.8%) |
| 90 or more Minutes | 636 (2.4%) | 565 (2.1%) |
Time of Departure to Work by Sex in Carolina Municipio
The most frequent times of departure to work in Carolina Municipio are 6:00 AM to 6:29 AM (3,400, 12.7%) for males and 7:00 AM to 7:29 AM (4,371, 16.6%) for females.
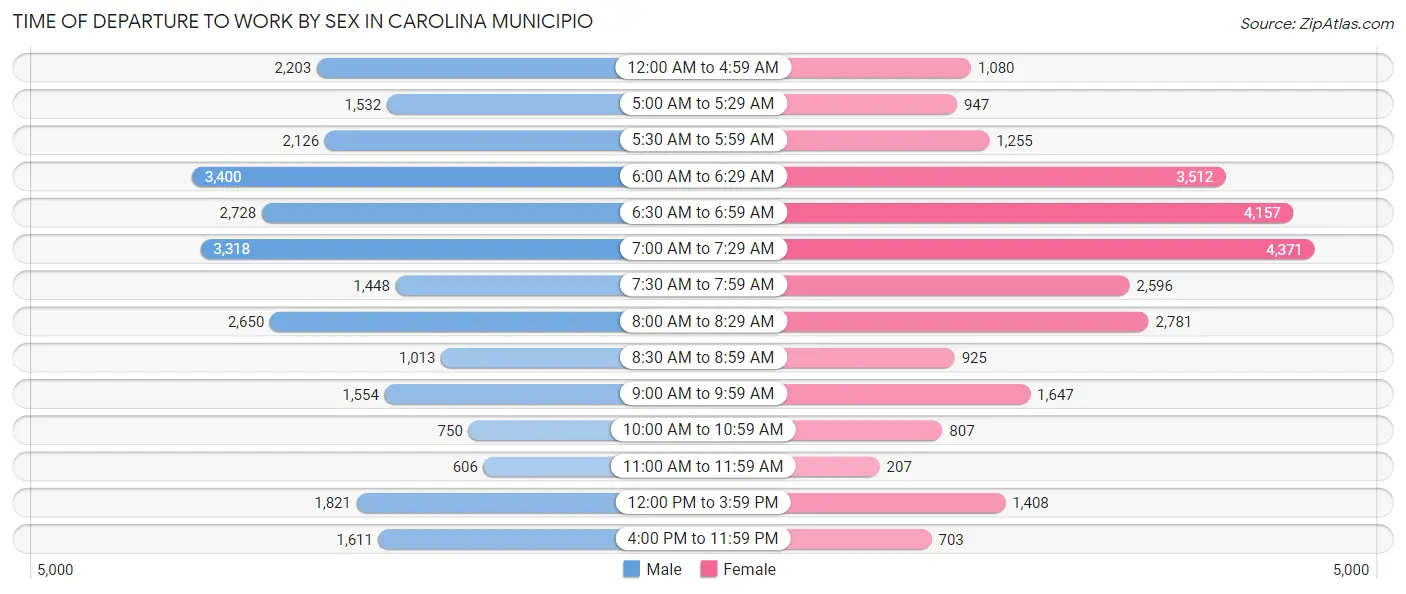
| Time of Departure | Male | Female |
| 12:00 AM to 4:59 AM | 2,203 (8.2%) | 1,080 (4.1%) |
| 5:00 AM to 5:29 AM | 1,532 (5.7%) | 947 (3.6%) |
| 5:30 AM to 5:59 AM | 2,126 (7.9%) | 1,255 (4.8%) |
| 6:00 AM to 6:29 AM | 3,400 (12.7%) | 3,512 (13.3%) |
| 6:30 AM to 6:59 AM | 2,728 (10.2%) | 4,157 (15.8%) |
| 7:00 AM to 7:29 AM | 3,318 (12.4%) | 4,371 (16.6%) |
| 7:30 AM to 7:59 AM | 1,448 (5.4%) | 2,596 (9.8%) |
| 8:00 AM to 8:29 AM | 2,650 (9.9%) | 2,781 (10.5%) |
| 8:30 AM to 8:59 AM | 1,013 (3.8%) | 925 (3.5%) |
| 9:00 AM to 9:59 AM | 1,554 (5.8%) | 1,647 (6.2%) |
| 10:00 AM to 10:59 AM | 750 (2.8%) | 807 (3.1%) |
| 11:00 AM to 11:59 AM | 606 (2.3%) | 207 (0.8%) |
| 12:00 PM to 3:59 PM | 1,821 (6.8%) | 1,408 (5.3%) |
| 4:00 PM to 11:59 PM | 1,611 (6.0%) | 703 (2.7%) |
| Total | 26,760 (100.0%) | 26,396 (100.0%) |
Housing Occupancy in Carolina Municipio
Occupancy by Ownership in Carolina Municipio
Of the total 61,883 dwellings in Carolina Municipio, owner-occupied units account for 42,850 (69.2%), while renter-occupied units make up 19,033 (30.8%).
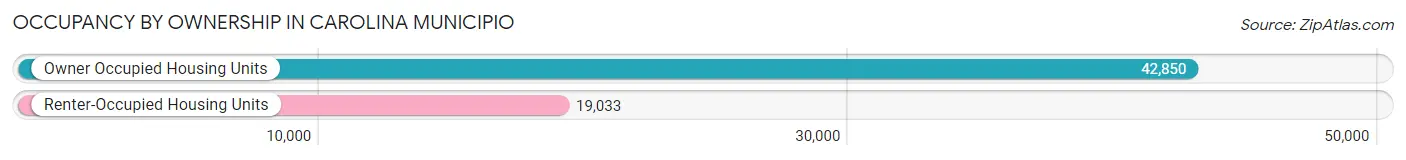
| Occupancy | # Housing Units | % Housing Units |
| Owner Occupied Housing Units | 42,850 | 69.2% |
| Renter-Occupied Housing Units | 19,033 | 30.8% |
| Total Occupied Housing Units | 61,883 | 100.0% |
Occupancy by Household Size in Carolina Municipio
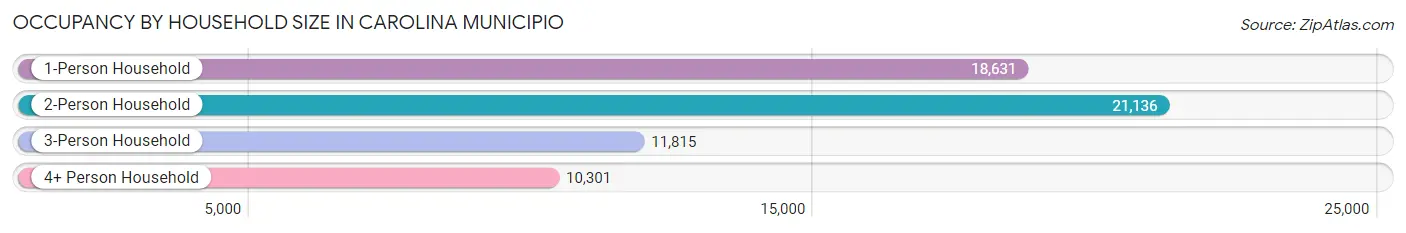
| Household Size | # Housing Units | % Housing Units |
| 1-Person Household | 18,631 | 30.1% |
| 2-Person Household | 21,136 | 34.2% |
| 3-Person Household | 11,815 | 19.1% |
| 4+ Person Household | 10,301 | 16.7% |
| Total Housing Units | 61,883 | 100.0% |
Occupancy by Ownership by Household Size in Carolina Municipio
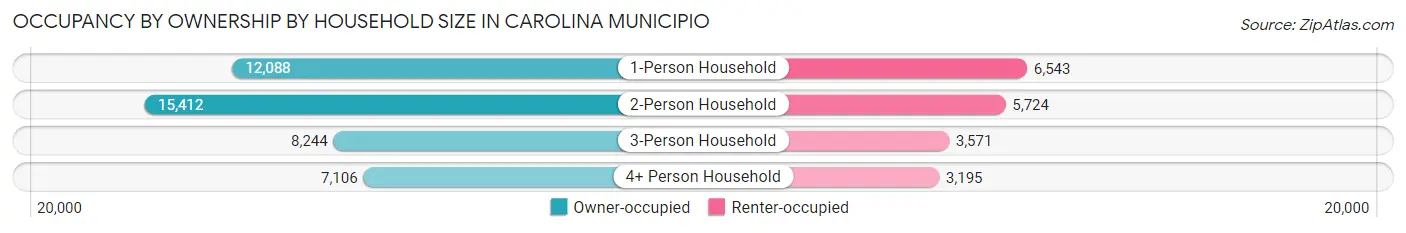
| Household Size | Owner-occupied | Renter-occupied |
| 1-Person Household | 12,088 (64.9%) | 6,543 (35.1%) |
| 2-Person Household | 15,412 (72.9%) | 5,724 (27.1%) |
| 3-Person Household | 8,244 (69.8%) | 3,571 (30.2%) |
| 4+ Person Household | 7,106 (69.0%) | 3,195 (31.0%) |
| Total Housing Units | 42,850 (69.2%) | 19,033 (30.8%) |
Occupancy by Educational Attainment in Carolina Municipio
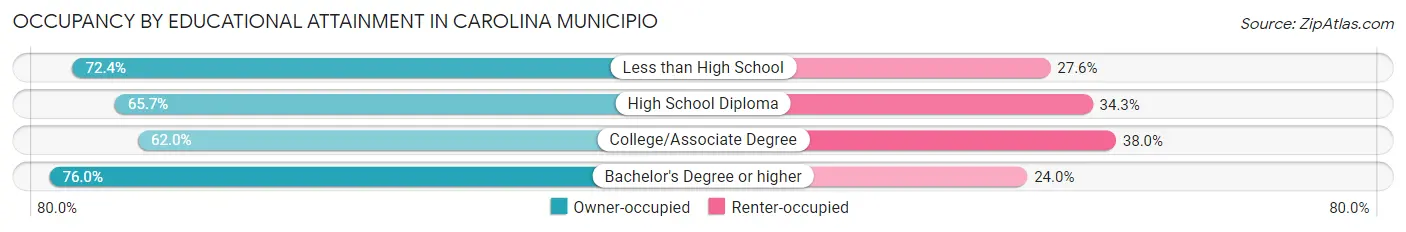
| Household Size | Owner-occupied | Renter-occupied |
| Less than High School | 5,496 (72.4%) | 2,098 (27.6%) |
| High School Diploma | 9,828 (65.7%) | 5,138 (34.3%) |
| College/Associate Degree | 10,462 (62.0%) | 6,419 (38.0%) |
| Bachelor's Degree or higher | 17,064 (76.0%) | 5,378 (24.0%) |
Occupancy by Age of Householder in Carolina Municipio
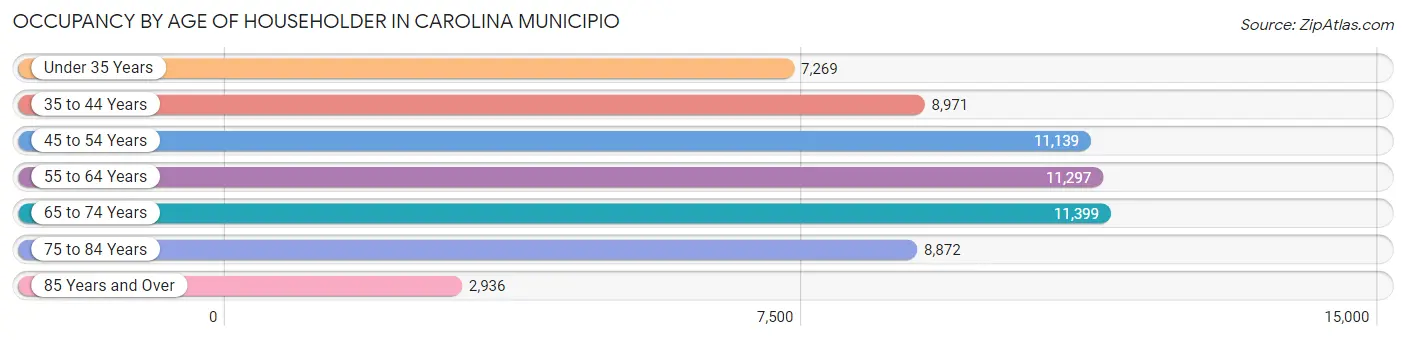
| Age Bracket | # Households | % Households |
| Under 35 Years | 7,269 | 11.7% |
| 35 to 44 Years | 8,971 | 14.5% |
| 45 to 54 Years | 11,139 | 18.0% |
| 55 to 64 Years | 11,297 | 18.3% |
| 65 to 74 Years | 11,399 | 18.4% |
| 75 to 84 Years | 8,872 | 14.3% |
| 85 Years and Over | 2,936 | 4.7% |
| Total | 61,883 | 100.0% |
Housing Finances in Carolina Municipio
Median Income by Occupancy in Carolina Municipio
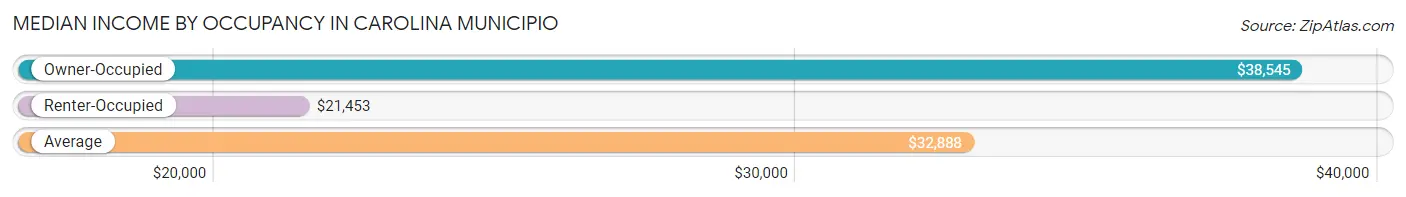
| Occupancy Type | # Households | Median Income |
| Owner-Occupied | 42,850 (69.2%) | $38,545 |
| Renter-Occupied | 19,033 (30.8%) | $21,453 |
| Average | 61,883 (100.0%) | $32,888 |
Occupancy by Householder Income Bracket in Carolina Municipio
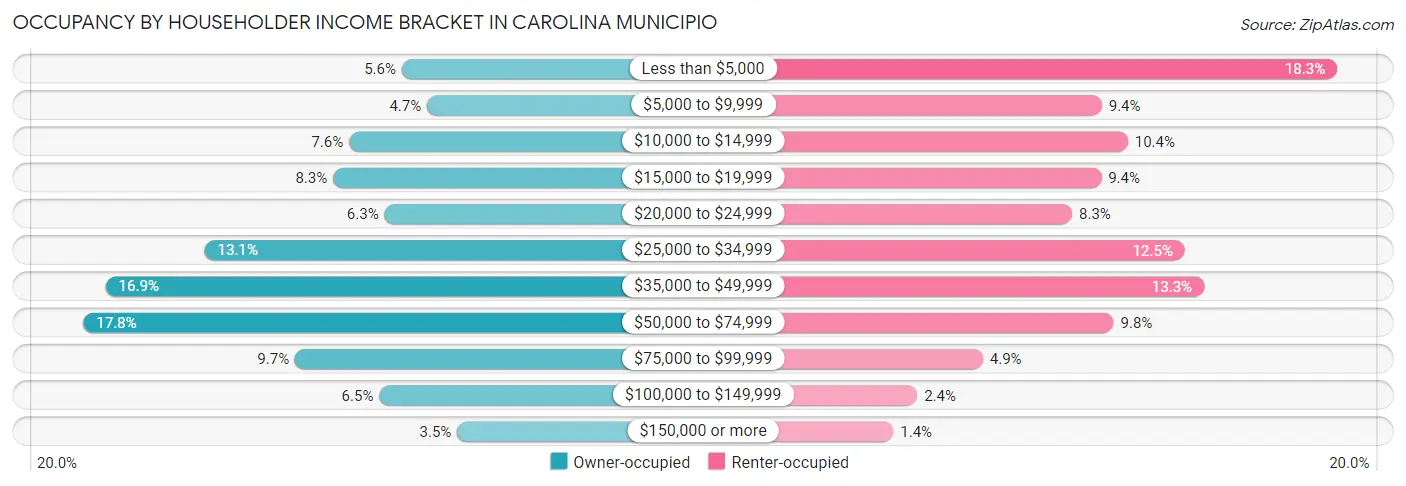
| Income Bracket | Owner-occupied | Renter-occupied |
| Less than $5,000 | 2,412 (5.6%) | 3,491 (18.3%) |
| $5,000 to $9,999 | 2,002 (4.7%) | 1,786 (9.4%) |
| $10,000 to $14,999 | 3,273 (7.6%) | 1,974 (10.4%) |
| $15,000 to $19,999 | 3,534 (8.3%) | 1,782 (9.4%) |
| $20,000 to $24,999 | 2,695 (6.3%) | 1,571 (8.3%) |
| $25,000 to $34,999 | 5,631 (13.1%) | 2,386 (12.5%) |
| $35,000 to $49,999 | 7,248 (16.9%) | 2,526 (13.3%) |
| $50,000 to $74,999 | 7,610 (17.8%) | 1,870 (9.8%) |
| $75,000 to $99,999 | 4,158 (9.7%) | 924 (4.9%) |
| $100,000 to $149,999 | 2,779 (6.5%) | 448 (2.4%) |
| $150,000 or more | 1,508 (3.5%) | 275 (1.4%) |
| Total | 42,850 (100.0%) | 19,033 (100.0%) |
Monthly Housing Cost Tiers in Carolina Municipio
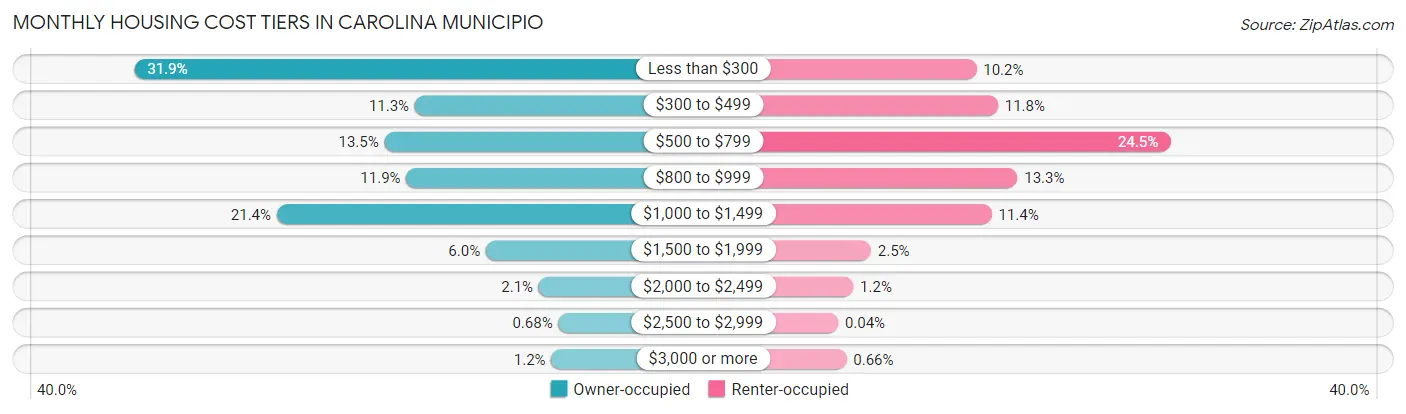
| Monthly Cost | Owner-occupied | Renter-occupied |
| Less than $300 | 13,679 (31.9%) | 1,948 (10.2%) |
| $300 to $499 | 4,822 (11.3%) | 2,247 (11.8%) |
| $500 to $799 | 5,779 (13.5%) | 4,664 (24.5%) |
| $800 to $999 | 5,092 (11.9%) | 2,521 (13.3%) |
| $1,000 to $1,499 | 9,179 (21.4%) | 2,160 (11.4%) |
| $1,500 to $1,999 | 2,581 (6.0%) | 469 (2.5%) |
| $2,000 to $2,499 | 910 (2.1%) | 220 (1.2%) |
| $2,500 to $2,999 | 292 (0.7%) | 8 (0.0%) |
| $3,000 or more | 516 (1.2%) | 126 (0.7%) |
| Total | 42,850 (100.0%) | 19,033 (100.0%) |
Physical Housing Characteristics in Carolina Municipio
Housing Structures in Carolina Municipio
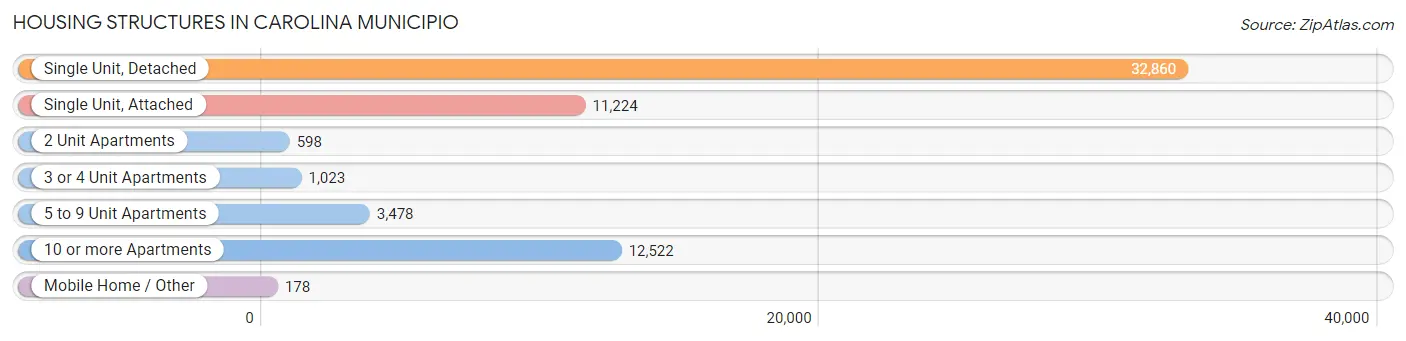
| Structure Type | # Housing Units | % Housing Units |
| Single Unit, Detached | 32,860 | 53.1% |
| Single Unit, Attached | 11,224 | 18.1% |
| 2 Unit Apartments | 598 | 1.0% |
| 3 or 4 Unit Apartments | 1,023 | 1.7% |
| 5 to 9 Unit Apartments | 3,478 | 5.6% |
| 10 or more Apartments | 12,522 | 20.2% |
| Mobile Home / Other | 178 | 0.3% |
| Total | 61,883 | 100.0% |
Housing Structures by Occupancy in Carolina Municipio
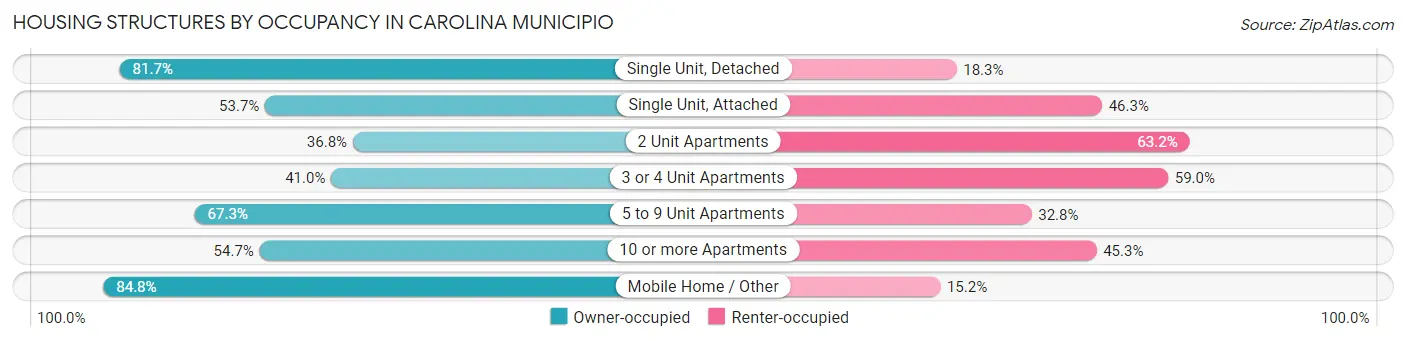
| Structure Type | Owner-occupied | Renter-occupied |
| Single Unit, Detached | 26,842 (81.7%) | 6,018 (18.3%) |
| Single Unit, Attached | 6,025 (53.7%) | 5,199 (46.3%) |
| 2 Unit Apartments | 220 (36.8%) | 378 (63.2%) |
| 3 or 4 Unit Apartments | 419 (41.0%) | 604 (59.0%) |
| 5 to 9 Unit Apartments | 2,339 (67.2%) | 1,139 (32.8%) |
| 10 or more Apartments | 6,854 (54.7%) | 5,668 (45.3%) |
| Mobile Home / Other | 151 (84.8%) | 27 (15.2%) |
| Total | 42,850 (69.2%) | 19,033 (30.8%) |
Housing Structures by Number of Rooms in Carolina Municipio
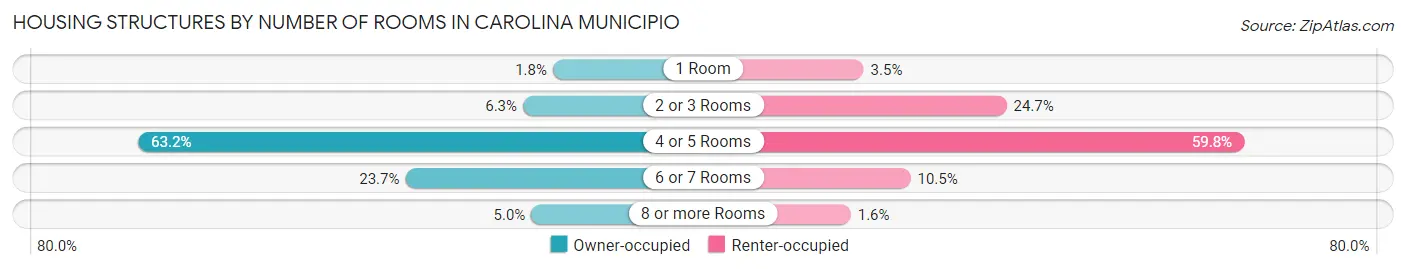
| Number of Rooms | Owner-occupied | Renter-occupied |
| 1 Room | 790 (1.8%) | 669 (3.5%) |
| 2 or 3 Rooms | 2,685 (6.3%) | 4,693 (24.7%) |
| 4 or 5 Rooms | 27,076 (63.2%) | 11,377 (59.8%) |
| 6 or 7 Rooms | 10,141 (23.7%) | 1,988 (10.4%) |
| 8 or more Rooms | 2,158 (5.0%) | 306 (1.6%) |
| Total | 42,850 (100.0%) | 19,033 (100.0%) |
Housing Structure by Heating Type in Carolina Municipio
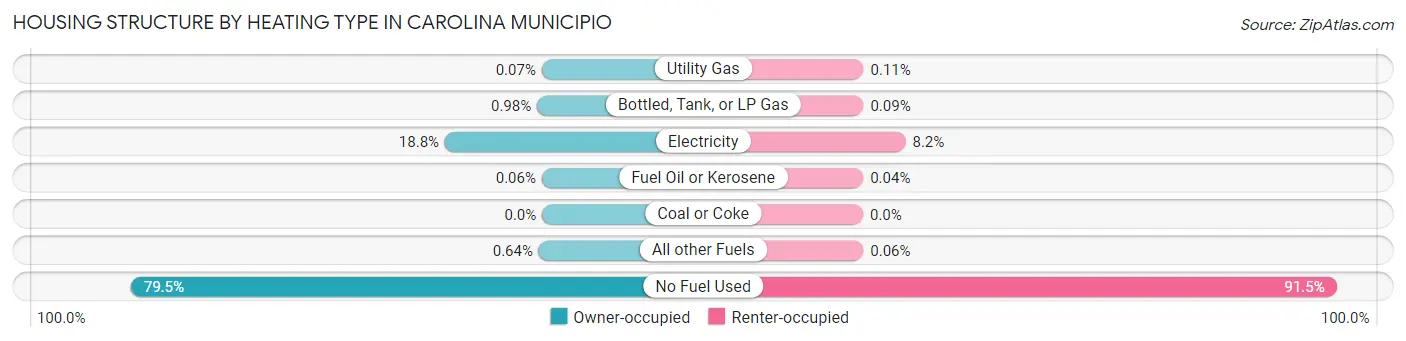
| Heating Type | Owner-occupied | Renter-occupied |
| Utility Gas | 31 (0.1%) | 20 (0.1%) |
| Bottled, Tank, or LP Gas | 420 (1.0%) | 18 (0.1%) |
| Electricity | 8,047 (18.8%) | 1,562 (8.2%) |
| Fuel Oil or Kerosene | 24 (0.1%) | 8 (0.0%) |
| Coal or Coke | 0 (0.0%) | 0 (0.0%) |
| All other Fuels | 275 (0.6%) | 12 (0.1%) |
| No Fuel Used | 34,053 (79.5%) | 17,413 (91.5%) |
| Total | 42,850 (100.0%) | 19,033 (100.0%) |
Household Vehicle Usage in Carolina Municipio
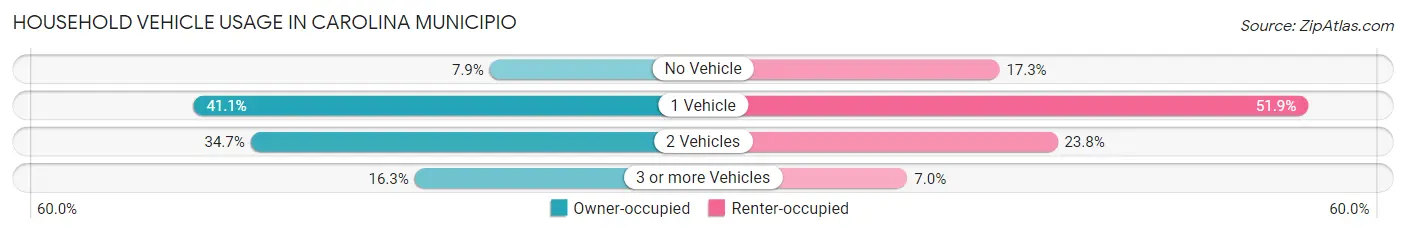
| Vehicles per Household | Owner-occupied | Renter-occupied |
| No Vehicle | 3,390 (7.9%) | 3,295 (17.3%) |
| 1 Vehicle | 17,602 (41.1%) | 9,874 (51.9%) |
| 2 Vehicles | 14,865 (34.7%) | 4,532 (23.8%) |
| 3 or more Vehicles | 6,993 (16.3%) | 1,332 (7.0%) |
| Total | 42,850 (100.0%) | 19,033 (100.0%) |
Real Estate & Mortgages in Carolina Municipio
Real Estate and Mortgage Overview in Carolina Municipio
| Characteristic | Without Mortgage | With Mortgage |
| Housing Units | 20,647 | 22,203 |
| Median Property Value | $140,200 | $153,900 |
| Median Household Income | $29,975 | $999 |
| Monthly Housing Costs | $219 | $510 |
| Real Estate Taxes | $723 | $16,211 |
Property Value by Mortgage Status in Carolina Municipio
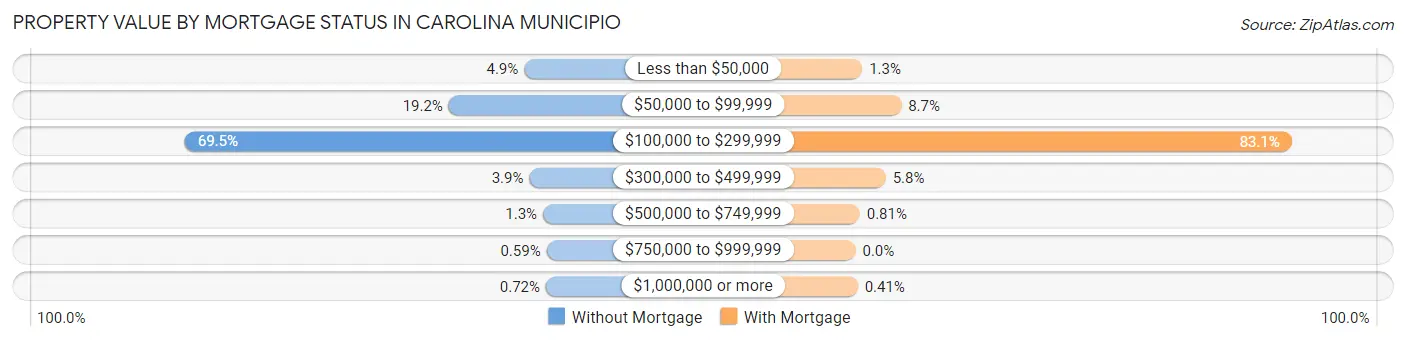
| Property Value | Without Mortgage | With Mortgage |
| Less than $50,000 | 1,002 (4.9%) | 283 (1.3%) |
| $50,000 to $99,999 | 3,968 (19.2%) | 1,931 (8.7%) |
| $100,000 to $299,999 | 14,345 (69.5%) | 18,443 (83.1%) |
| $300,000 to $499,999 | 799 (3.9%) | 1,276 (5.8%) |
| $500,000 to $749,999 | 263 (1.3%) | 180 (0.8%) |
| $750,000 to $999,999 | 121 (0.6%) | 0 (0.0%) |
| $1,000,000 or more | 149 (0.7%) | 90 (0.4%) |
| Total | 20,647 (100.0%) | 22,203 (100.0%) |
Household Income by Mortgage Status in Carolina Municipio
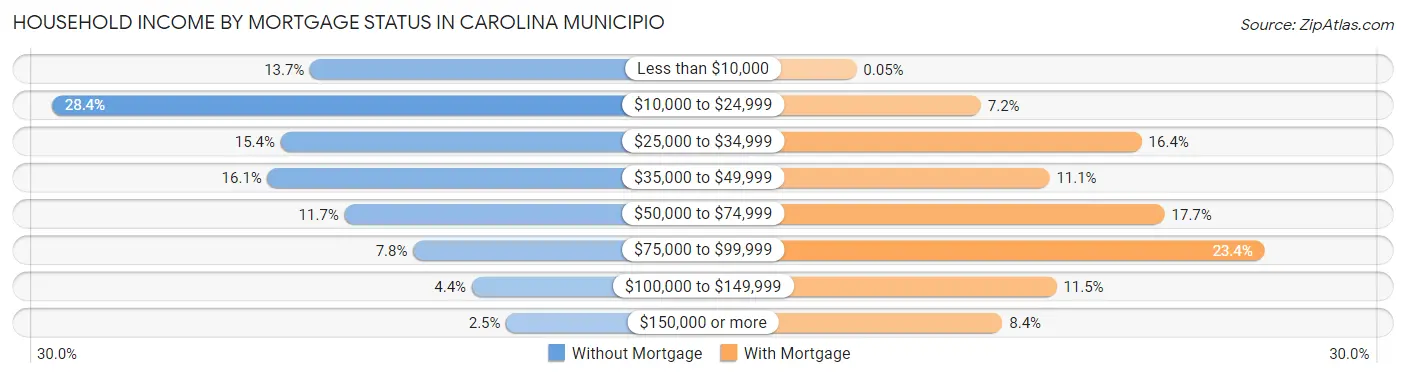
| Household Income | Without Mortgage | With Mortgage |
| Less than $10,000 | 2,825 (13.7%) | 11 (0.1%) |
| $10,000 to $24,999 | 5,872 (28.4%) | 1,589 (7.2%) |
| $25,000 to $34,999 | 3,171 (15.4%) | 3,630 (16.4%) |
| $35,000 to $49,999 | 3,327 (16.1%) | 2,460 (11.1%) |
| $50,000 to $74,999 | 2,418 (11.7%) | 3,921 (17.7%) |
| $75,000 to $99,999 | 1,609 (7.8%) | 5,192 (23.4%) |
| $100,000 to $149,999 | 916 (4.4%) | 2,549 (11.5%) |
| $150,000 or more | 509 (2.5%) | 1,863 (8.4%) |
| Total | 20,647 (100.0%) | 22,203 (100.0%) |
Property Value to Household Income Ratio in Carolina Municipio
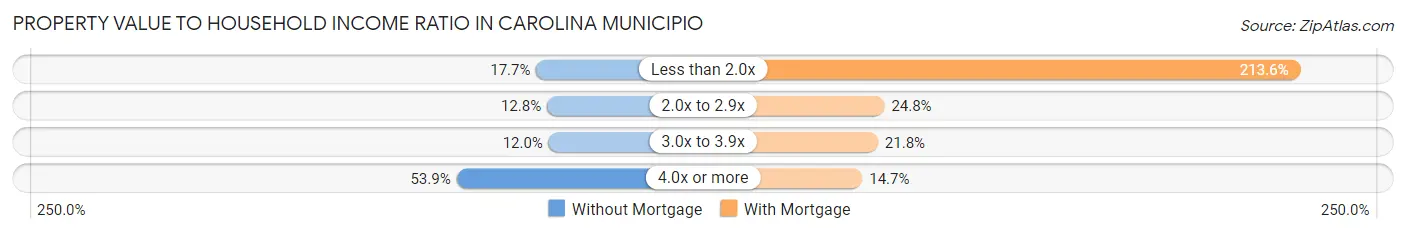
| Value-to-Income Ratio | Without Mortgage | With Mortgage |
| Less than 2.0x | 3,653 (17.7%) | 47,435 (213.6%) |
| 2.0x to 2.9x | 2,648 (12.8%) | 5,495 (24.7%) |
| 3.0x to 3.9x | 2,486 (12.0%) | 4,837 (21.8%) |
| 4.0x or more | 11,132 (53.9%) | 3,263 (14.7%) |
| Total | 20,647 (100.0%) | 22,203 (100.0%) |
Real Estate Taxes by Mortgage Status in Carolina Municipio
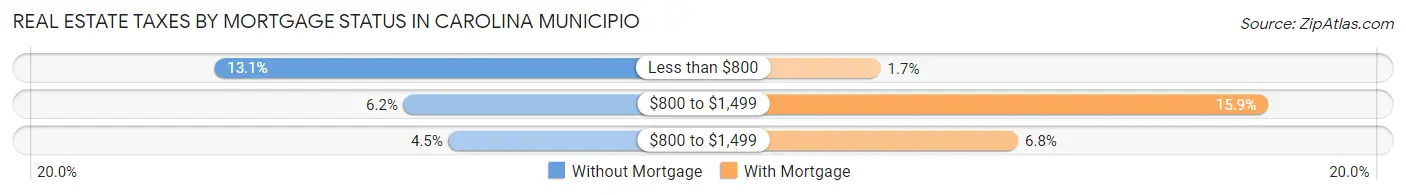
| Property Taxes | Without Mortgage | With Mortgage |
| Less than $800 | 2,699 (13.1%) | 386 (1.7%) |
| $800 to $1,499 | 1,270 (6.1%) | 3,529 (15.9%) |
| $800 to $1,499 | 932 (4.5%) | 1,500 (6.8%) |
| Total | 20,647 (100.0%) | 22,203 (100.0%) |
Health & Disability in Carolina Municipio
Health Insurance Coverage by Age in Carolina Municipio
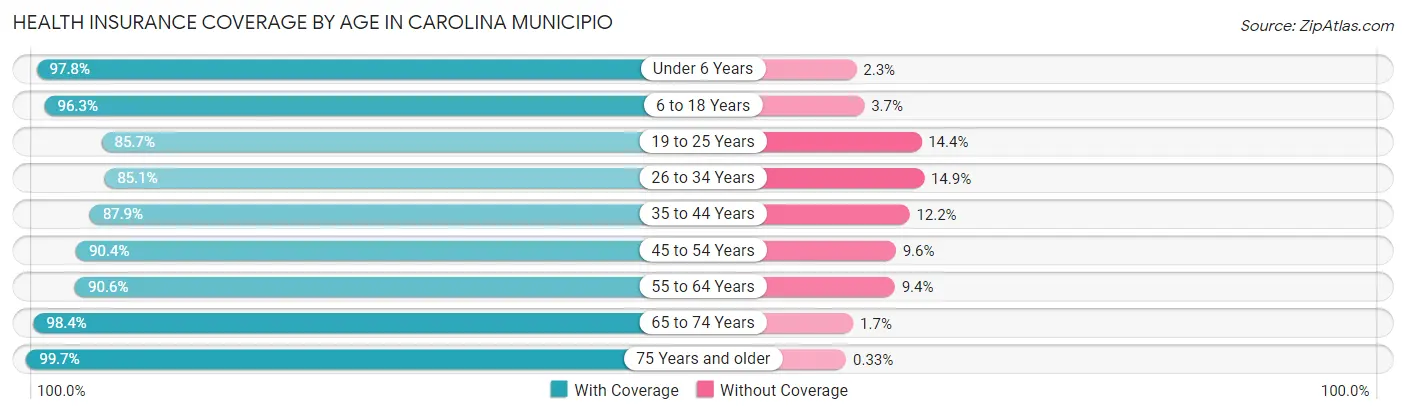
| Age Bracket | With Coverage | Without Coverage |
| Under 6 Years | 6,158 (97.8%) | 142 (2.2%) |
| 6 to 18 Years | 20,130 (96.3%) | 777 (3.7%) |
| 19 to 25 Years | 12,769 (85.7%) | 2,140 (14.3%) |
| 26 to 34 Years | 14,942 (85.1%) | 2,607 (14.9%) |
| 35 to 44 Years | 16,025 (87.8%) | 2,216 (12.1%) |
| 45 to 54 Years | 18,110 (90.4%) | 1,921 (9.6%) |
| 55 to 64 Years | 17,646 (90.6%) | 1,833 (9.4%) |
| 65 to 74 Years | 17,131 (98.4%) | 287 (1.7%) |
| 75 Years and older | 18,445 (99.7%) | 61 (0.3%) |
| Total | 141,356 (92.2%) | 11,984 (7.8%) |
Health Insurance Coverage by Citizenship Status in Carolina Municipio
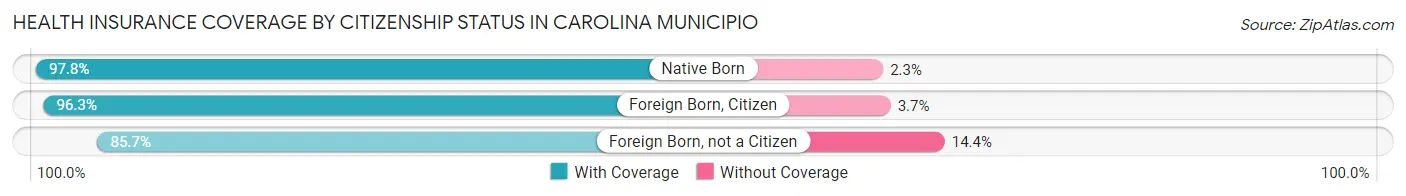
| Citizenship Status | With Coverage | Without Coverage |
| Native Born | 6,158 (97.8%) | 142 (2.2%) |
| Foreign Born, Citizen | 20,130 (96.3%) | 777 (3.7%) |
| Foreign Born, not a Citizen | 12,769 (85.7%) | 2,140 (14.3%) |
Health Insurance Coverage by Household Income in Carolina Municipio
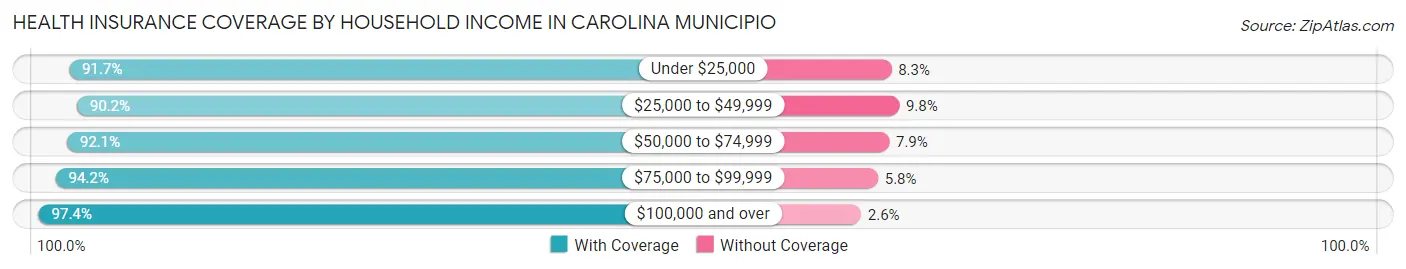
| Household Income | With Coverage | Without Coverage |
| Under $25,000 | 44,364 (91.7%) | 4,024 (8.3%) |
| $25,000 to $49,999 | 40,255 (90.2%) | 4,365 (9.8%) |
| $50,000 to $74,999 | 26,145 (92.1%) | 2,245 (7.9%) |
| $75,000 to $99,999 | 15,064 (94.2%) | 929 (5.8%) |
| $100,000 and over | 15,399 (97.4%) | 416 (2.6%) |
Public vs Private Health Insurance Coverage by Age in Carolina Municipio
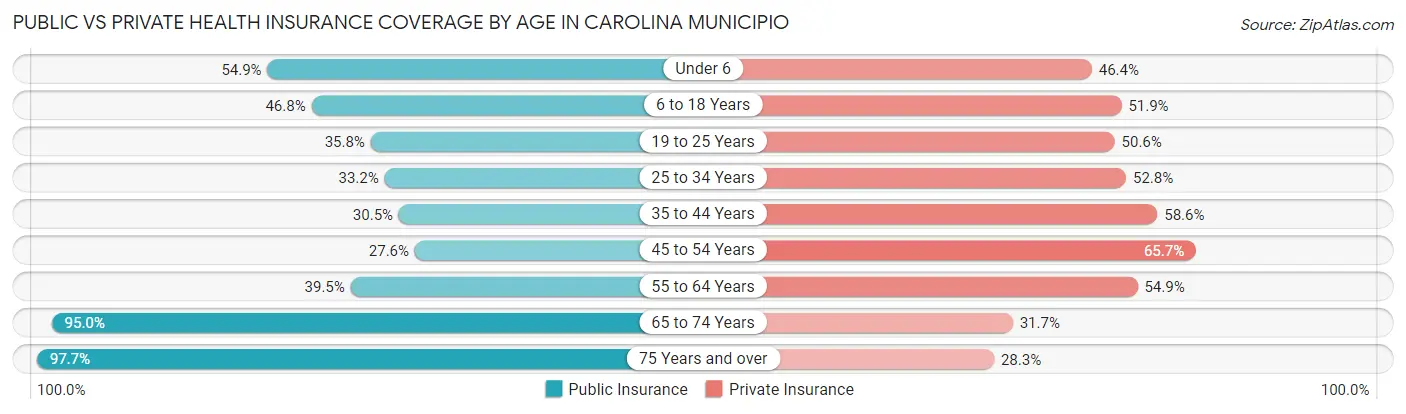
| Age Bracket | Public Insurance | Private Insurance |
| Under 6 | 3,460 (54.9%) | 2,924 (46.4%) |
| 6 to 18 Years | 9,774 (46.8%) | 10,852 (51.9%) |
| 19 to 25 Years | 5,331 (35.8%) | 7,550 (50.6%) |
| 25 to 34 Years | 5,824 (33.2%) | 9,259 (52.8%) |
| 35 to 44 Years | 5,567 (30.5%) | 10,682 (58.6%) |
| 45 to 54 Years | 5,520 (27.6%) | 13,168 (65.7%) |
| 55 to 64 Years | 7,693 (39.5%) | 10,690 (54.9%) |
| 65 to 74 Years | 16,543 (95.0%) | 5,527 (31.7%) |
| 75 Years and over | 18,086 (97.7%) | 5,228 (28.2%) |
| Total | 77,798 (50.7%) | 75,880 (49.5%) |
Disability Status by Sex by Age in Carolina Municipio
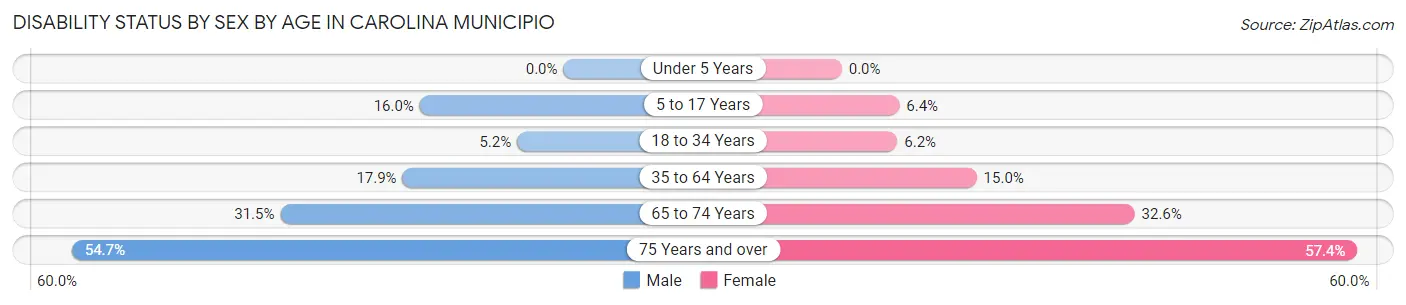
| Age Bracket | Male | Female |
| Under 5 Years | 0 (0.0%) | 0 (0.0%) |
| 5 to 17 Years | 1,622 (16.0%) | 652 (6.4%) |
| 18 to 34 Years | 858 (5.2%) | 1,088 (6.2%) |
| 35 to 64 Years | 4,683 (17.9%) | 4,748 (15.0%) |
| 65 to 74 Years | 2,228 (31.5%) | 3,375 (32.6%) |
| 75 Years and over | 3,920 (54.7%) | 6,513 (57.4%) |
Disability Class by Sex by Age in Carolina Municipio
Disability Class: Hearing Difficulty
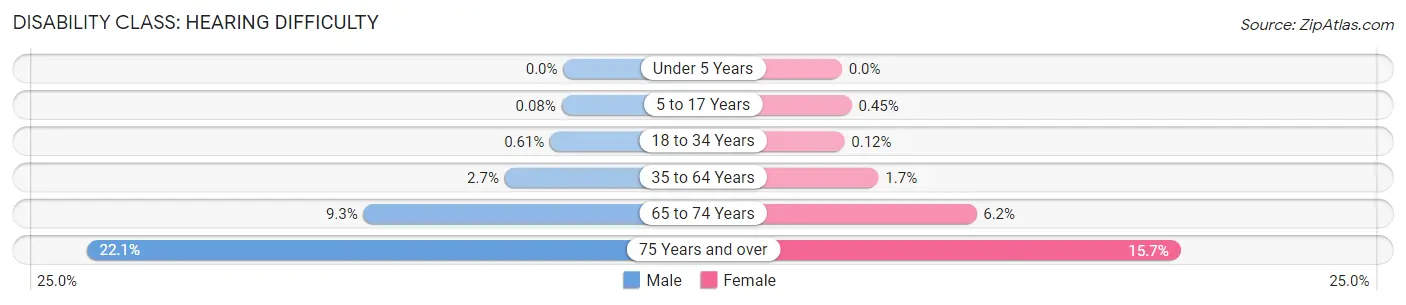
| Age Bracket | Male | Female |
| Under 5 Years | 0 (0.0%) | 0 (0.0%) |
| 5 to 17 Years | 8 (0.1%) | 46 (0.4%) |
| 18 to 34 Years | 101 (0.6%) | 21 (0.1%) |
| 35 to 64 Years | 712 (2.7%) | 536 (1.7%) |
| 65 to 74 Years | 655 (9.3%) | 646 (6.2%) |
| 75 Years and over | 1,584 (22.1%) | 1,784 (15.7%) |
Disability Class: Vision Difficulty
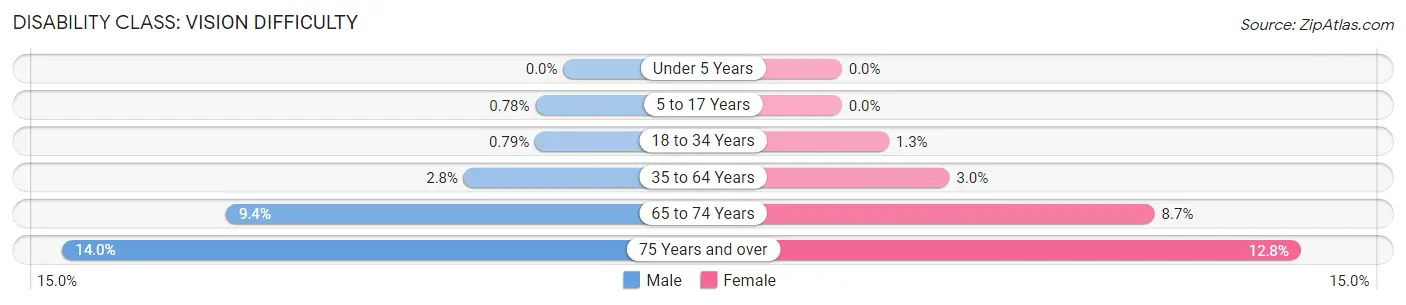
| Age Bracket | Male | Female |
| Under 5 Years | 0 (0.0%) | 0 (0.0%) |
| 5 to 17 Years | 79 (0.8%) | 0 (0.0%) |
| 18 to 34 Years | 132 (0.8%) | 231 (1.3%) |
| 35 to 64 Years | 723 (2.8%) | 949 (3.0%) |
| 65 to 74 Years | 664 (9.4%) | 902 (8.7%) |
| 75 Years and over | 999 (14.0%) | 1,450 (12.8%) |
Disability Class: Cognitive Difficulty
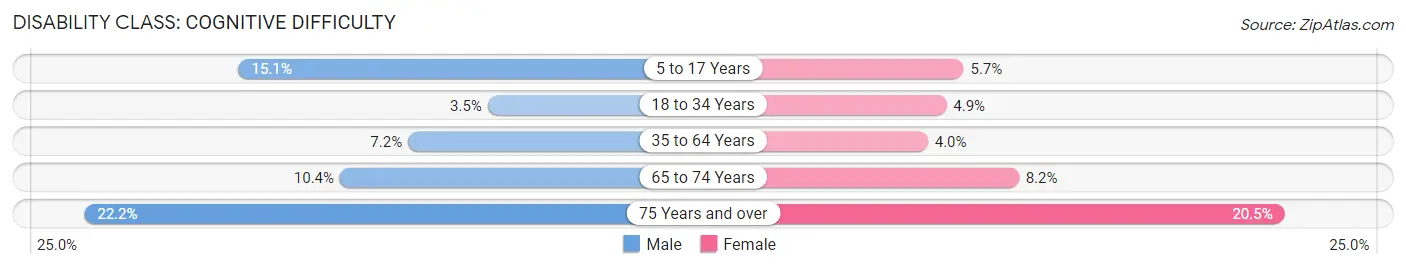
| Age Bracket | Male | Female |
| 5 to 17 Years | 1,527 (15.1%) | 574 (5.7%) |
| 18 to 34 Years | 584 (3.5%) | 853 (4.9%) |
| 35 to 64 Years | 1,885 (7.2%) | 1,261 (4.0%) |
| 65 to 74 Years | 733 (10.4%) | 850 (8.2%) |
| 75 Years and over | 1,592 (22.2%) | 2,330 (20.5%) |
Disability Class: Ambulatory Difficulty
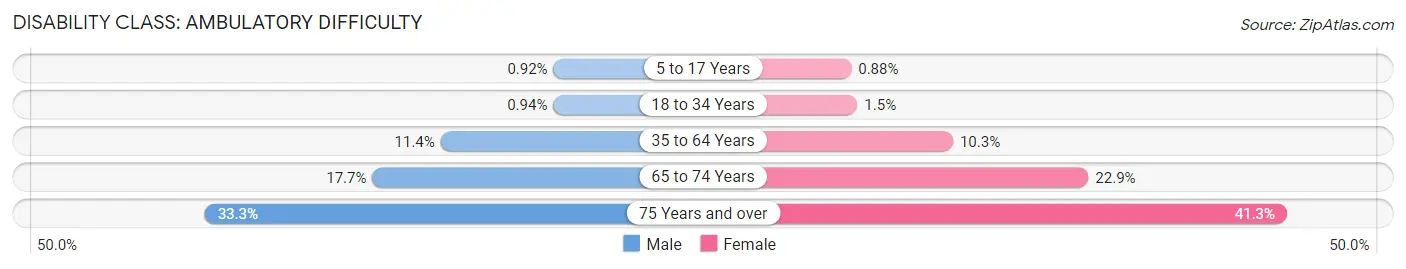
| Age Bracket | Male | Female |
| 5 to 17 Years | 93 (0.9%) | 89 (0.9%) |
| 18 to 34 Years | 156 (0.9%) | 255 (1.5%) |
| 35 to 64 Years | 2,976 (11.4%) | 3,262 (10.3%) |
| 65 to 74 Years | 1,253 (17.7%) | 2,369 (22.9%) |
| 75 Years and over | 2,383 (33.3%) | 4,686 (41.3%) |
Disability Class: Self-Care Difficulty
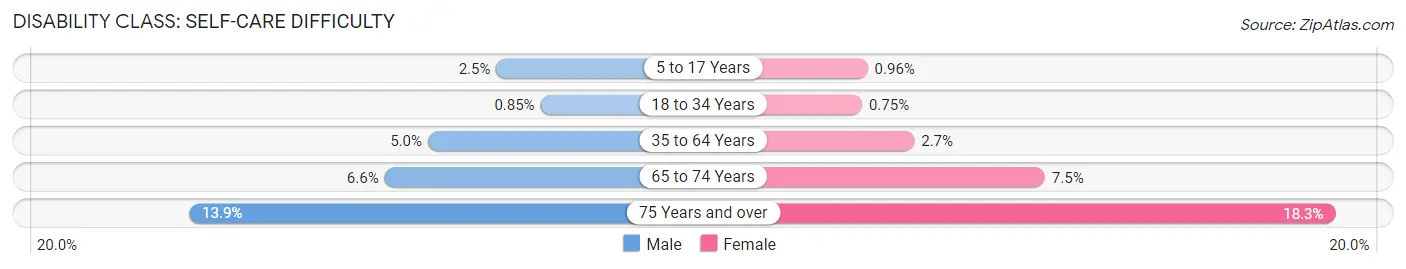
| Age Bracket | Male | Female |
| 5 to 17 Years | 252 (2.5%) | 98 (1.0%) |
| 18 to 34 Years | 141 (0.9%) | 131 (0.7%) |
| 35 to 64 Years | 1,315 (5.0%) | 849 (2.7%) |
| 65 to 74 Years | 469 (6.6%) | 780 (7.5%) |
| 75 Years and over | 995 (13.9%) | 2,078 (18.3%) |
Technology Access in Carolina Municipio
Computing Device Access in Carolina Municipio
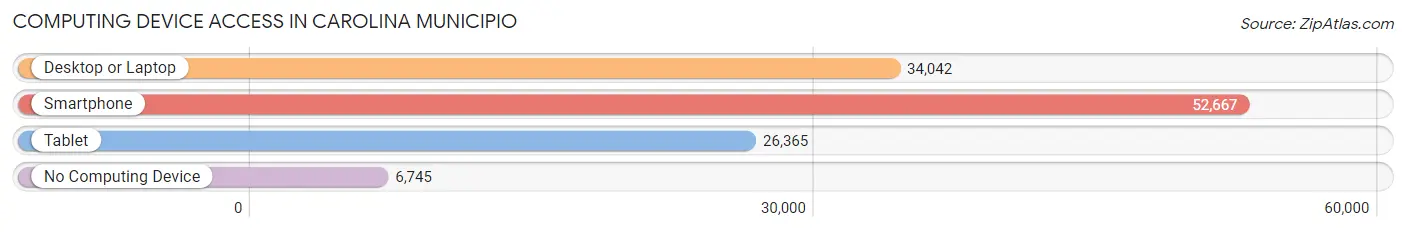
| Device Type | # Households | % Households |
| Desktop or Laptop | 34,042 | 55.0% |
| Smartphone | 52,667 | 85.1% |
| Tablet | 26,365 | 42.6% |
| No Computing Device | 6,745 | 10.9% |
| Total | 61,883 | 100.0% |
Internet Access in Carolina Municipio
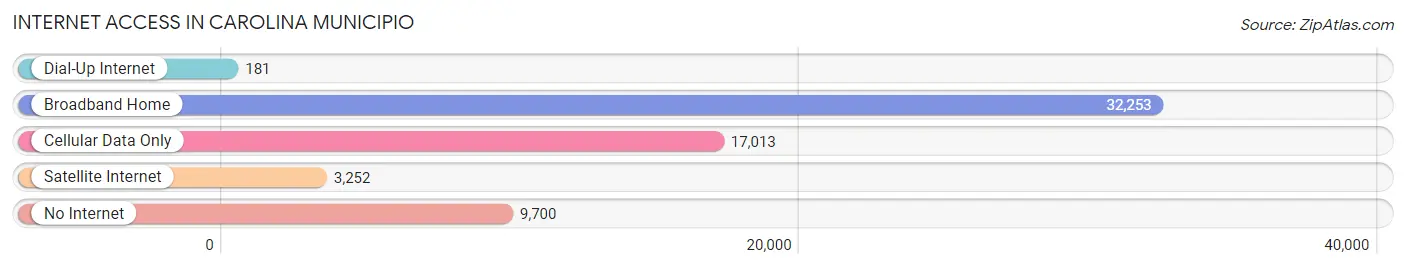
| Internet Type | # Households | % Households |
| Dial-Up Internet | 181 | 0.3% |
| Broadband Home | 32,253 | 52.1% |
| Cellular Data Only | 17,013 | 27.5% |
| Satellite Internet | 3,252 | 5.3% |
| No Internet | 9,700 | 15.7% |
| Total | 61,883 | 100.0% |
Carolina Municipio Summary
Carolina Municipio is a municipality located in the northeastern region of Puerto Rico. It is part of the San Juan-Caguas-Guaynabo Metropolitan Statistical Area. As of the 2010 census, the municipality had a population of 97,663, making it the third most populous municipality in Puerto Rico.
History
Carolina was founded in 1816 by Don Tomás de Abadía, a Spanish military officer. The town was named after King Charles II of Spain. The town was originally part of the municipality of San Juan, but it was separated in 1857.
Geography
Carolina is located in the northern coast of Puerto Rico, north of San Juan and Bayamón; east of Trujillo Alto and Cataño; and west of Canóvanas and Loíza. The municipality is spread over 8 wards and Carolina Pueblo (the downtown area and the administrative center of the city). It has a total area of 24.7 square miles (64 km2).
Economy
Carolina is an important commercial center in Puerto Rico. It is home to the largest shopping mall in the Caribbean, the Plaza Carolina Mall. The municipality is also home to the Luis Muñoz Marín International Airport, the main airport of Puerto Rico. The airport is a major hub for international and domestic flights.
The economy of Carolina is also supported by tourism, manufacturing, and agriculture. The municipality is home to several hotels and resorts, as well as a number of industrial parks. The main agricultural products are sugarcane, coffee, and tobacco.
Demographics
As of the 2010 census, the population of Carolina was 97,663, making it the third most populous municipality in Puerto Rico. The population is mostly of mixed European and African descent. The median household income was $20,845 in 2010.
The majority of the population (90.2%) speaks Spanish as their first language. English is spoken by 8.2% of the population, while 0.6% speak French and 0.1% speak German.
The majority of the population (90.2%) is Roman Catholic, while 4.2% are Protestant and 5.6% are unaffiliated.
Conclusion
Carolina is a municipality located in the northeastern region of Puerto Rico. It is part of the San Juan-Caguas-Guaynabo Metropolitan Statistical Area. As of the 2010 census, the municipality had a population of 97,663, making it the third most populous municipality in Puerto Rico. The economy of Carolina is supported by tourism, manufacturing, and agriculture. The majority of the population is of mixed European and African descent and speaks Spanish as their first language. The majority of the population is Roman Catholic, while 4.2% are Protestant and 5.6% are unaffiliated.
Common Questions
What is Per Capita Income in Carolina Municipio?
Per Capita income in Carolina Municipio is $19,220.
What is the Median Family Income in Carolina Municipio?
Median Family Income in Carolina Municipio is $38,406.
What is the Median Household income in Carolina Municipio?
Median Household Income in Carolina Municipio is $32,888.
What is Income or Wage Gap in Carolina Municipio?
Income or Wage Gap in Carolina Municipio is 7.8%.
Women in Carolina Municipio earn 92.2 cents for every dollar earned by a man.
What is Family Income Deficit in Carolina Municipio?
Family Income Deficit in Carolina Municipio is $11,488.
Families that are below poverty line in Carolina Municipio earn $11,488 less on average than the poverty threshold level.
What is Inequality or Gini Index in Carolina Municipio?
Inequality or Gini Index in Carolina Municipio is 0.49.
What is the Total Population of Carolina Municipio?
Total Population of Carolina Municipio is 154,126.
What is the Total Male Population of Carolina Municipio?
Total Male Population of Carolina Municipio is 70,159.
What is the Total Female Population of Carolina Municipio?
Total Female Population of Carolina Municipio is 83,967.
What is the Ratio of Males per 100 Females in Carolina Municipio?
There are 83.56 Males per 100 Females in Carolina Municipio.
What is the Ratio of Females per 100 Males in Carolina Municipio?
There are 119.68 Females per 100 Males in Carolina Municipio.
What is the Median Population Age in Carolina Municipio?
Median Population Age in Carolina Municipio is 44.3 Years.
What is the Average Family Size in Carolina Municipio
Average Family Size in Carolina Municipio is 3.1 People.
What is the Average Household Size in Carolina Municipio
Average Household Size in Carolina Municipio is 2.5 People.
How Large is the Labor Force in Carolina Municipio?
There are 69,434 People in the Labor Forcein in Carolina Municipio.
What is the Percentage of People in the Labor Force in Carolina Municipio?
52.5% of People are in the Labor Force in Carolina Municipio.
What is the Unemployment Rate in Carolina Municipio?
Unemployment Rate in Carolina Municipio is 13.3%.