Caguas Municipio, PR Map & Demographics
Caguas Municipio Map
Caguas Municipio Overview
$19,240
PER CAPITA INCOME
$34,876
AVG FAMILY INCOME
$29,279
AVG HOUSEHOLD INCOME
7.4%
WAGE / INCOME GAP [ % ]
92.6¢/ $1
WAGE / INCOME GAP [ $ ]
$10,769
FAMILY INCOME DEFICIT
0.55
INEQUALITY / GINI INDEX
126,772
TOTAL POPULATION
58,659
MALE POPULATION
68,113
FEMALE POPULATION
86.12
MALES / 100 FEMALES
116.12
FEMALES / 100 MALES
43.8
MEDIAN AGE
3.1
AVG FAMILY SIZE
2.5
AVG HOUSEHOLD SIZE
52,759
LABOR FORCE [ PEOPLE ]
48.7%
PERCENT IN LABOR FORCE
9.6%
UNEMPLOYMENT RATE
Income in Caguas Municipio
Income Overview in Caguas Municipio
Per Capita Income in Caguas Municipio is $19,240, while median incomes of families and households are $34,876 and $29,279 respectively.
| Characteristic | Number | Measure |
| Per Capita Income | 126,772 | $19,240 |
| Median Family Income | 32,229 | $34,876 |
| Mean Family Income | 32,229 | $53,883 |
| Median Household Income | 49,645 | $29,279 |
| Mean Household Income | 49,645 | $46,456 |
| Income Deficit | 32,229 | $10,769 |
| Wage / Income Gap (%) | 126,772 | 7.43% |
| Wage / Income Gap ($) | 126,772 | 92.57¢ per $1 |
| Gini / Inequality Index | 126,772 | 0.55 |
Earnings by Sex in Caguas Municipio
Average Earnings in Caguas Municipio are $21,529, $22,384 for men and $20,720 for women, a difference of 7.4%.
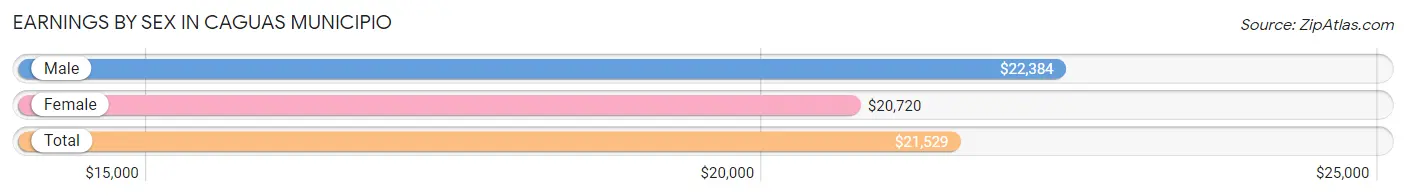
| Sex | Number | Average Earnings |
| Male | 26,689 (50.9%) | $22,384 |
| Female | 25,698 (49.0%) | $20,720 |
| Total | 52,387 (100.0%) | $21,529 |
Earnings by Sex by Income Bracket in Caguas Municipio
The most common earnings brackets in Caguas Municipio are $15,000 to $17,499 for men (2,255 | 8.5%) and $25,000 to $29,999 for women (2,182 | 8.5%).
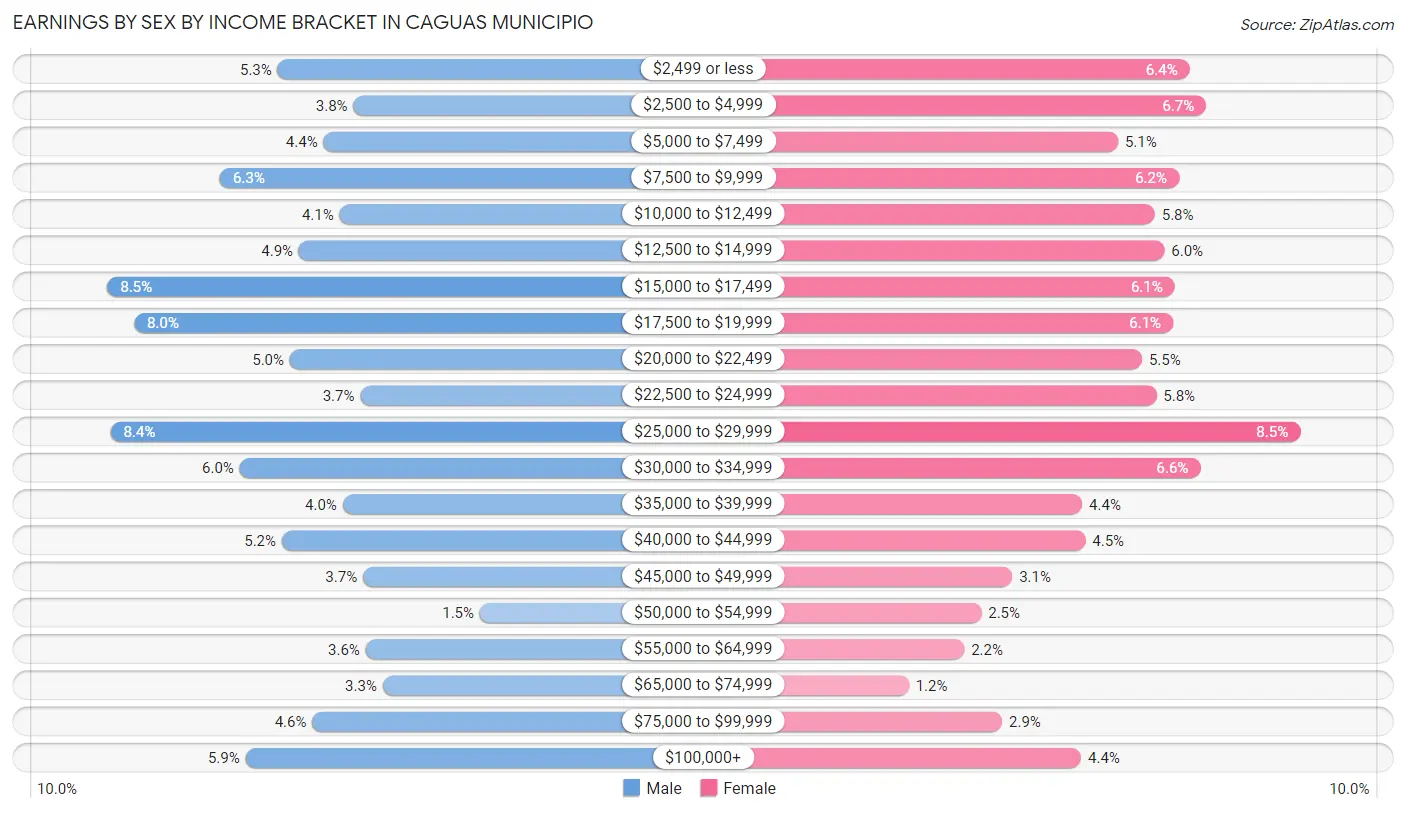
| Income | Male | Female |
| $2,499 or less | 1,405 (5.3%) | 1,650 (6.4%) |
| $2,500 to $4,999 | 1,026 (3.8%) | 1,729 (6.7%) |
| $5,000 to $7,499 | 1,174 (4.4%) | 1,305 (5.1%) |
| $7,500 to $9,999 | 1,691 (6.3%) | 1,598 (6.2%) |
| $10,000 to $12,499 | 1,094 (4.1%) | 1,482 (5.8%) |
| $12,500 to $14,999 | 1,296 (4.9%) | 1,528 (5.9%) |
| $15,000 to $17,499 | 2,255 (8.5%) | 1,577 (6.1%) |
| $17,500 to $19,999 | 2,123 (8.0%) | 1,571 (6.1%) |
| $20,000 to $22,499 | 1,343 (5.0%) | 1,420 (5.5%) |
| $22,500 to $24,999 | 990 (3.7%) | 1,491 (5.8%) |
| $25,000 to $29,999 | 2,238 (8.4%) | 2,182 (8.5%) |
| $30,000 to $34,999 | 1,592 (6.0%) | 1,701 (6.6%) |
| $35,000 to $39,999 | 1,078 (4.0%) | 1,133 (4.4%) |
| $40,000 to $44,999 | 1,382 (5.2%) | 1,148 (4.5%) |
| $45,000 to $49,999 | 977 (3.7%) | 796 (3.1%) |
| $50,000 to $54,999 | 391 (1.5%) | 648 (2.5%) |
| $55,000 to $64,999 | 963 (3.6%) | 566 (2.2%) |
| $65,000 to $74,999 | 878 (3.3%) | 298 (1.2%) |
| $75,000 to $99,999 | 1,230 (4.6%) | 747 (2.9%) |
| $100,000+ | 1,563 (5.9%) | 1,128 (4.4%) |
| Total | 26,689 (100.0%) | 25,698 (100.0%) |
Earnings by Sex by Educational Attainment in Caguas Municipio
Average earnings in Caguas Municipio are $25,135 for men and $23,033 for women, a difference of 8.4%. Men with an educational attainment of graduate degree enjoy the highest average annual earnings of $59,844, while those with less than high school education earn the least with $14,643. Women with an educational attainment of graduate degree earn the most with the average annual earnings of $36,389, while those with less than high school education have the smallest earnings of $9,543.
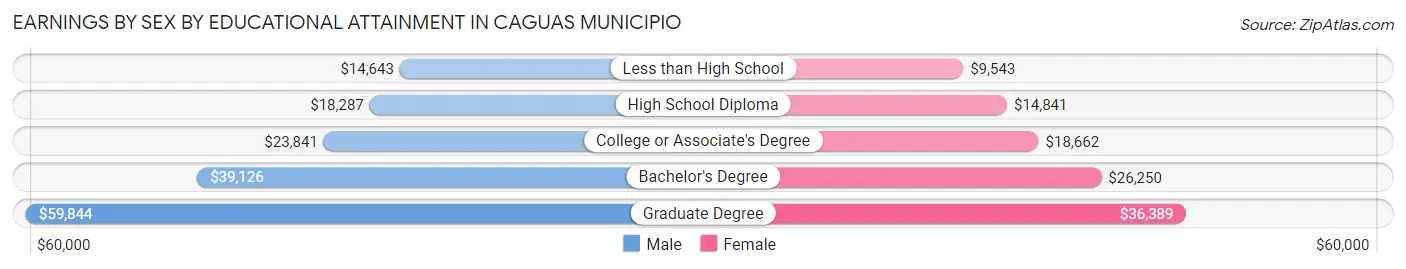
| Educational Attainment | Male Income | Female Income |
| Less than High School | $14,643 | $9,543 |
| High School Diploma | $18,287 | $14,841 |
| College or Associate's Degree | $23,841 | $18,662 |
| Bachelor's Degree | $39,126 | $26,250 |
| Graduate Degree | $59,844 | $36,389 |
| Total | $25,135 | $23,033 |
Family Income in Caguas Municipio
Family Income Brackets in Caguas Municipio
According to the Caguas Municipio family income data, there are 5,028 families falling into the less than $10,000 income range, which is the most common income bracket and makes up 15.6% of all families. Conversely, the $150,000 to $199,999 income bracket is the least frequent group with only 645 families (2.0%) belonging to this category.
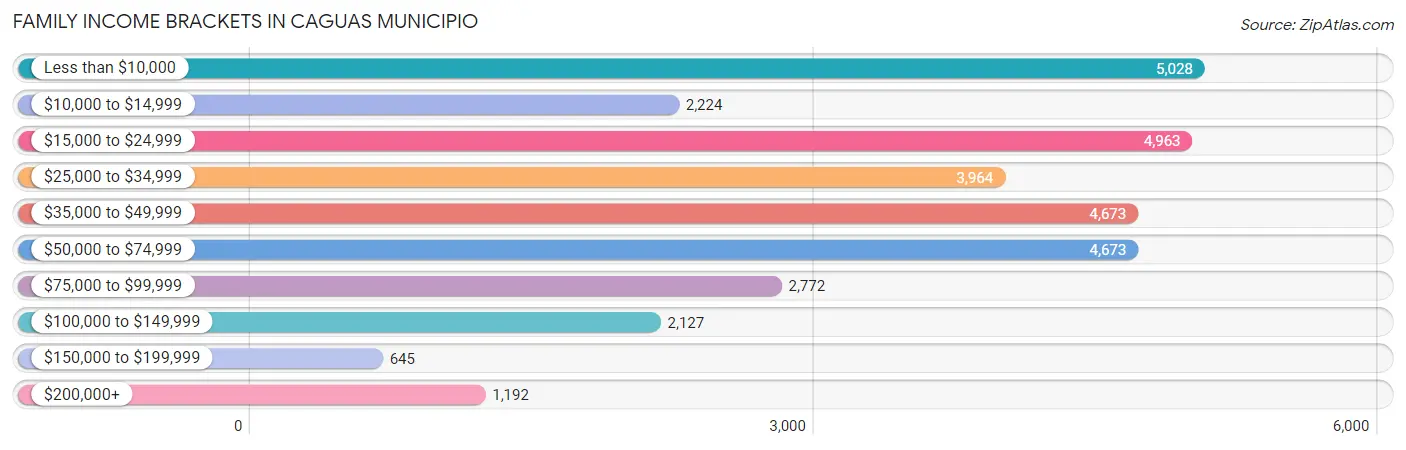
| Income Bracket | # Families | % Families |
| Less than $10,000 | 5,028 | 15.6% |
| $10,000 to $14,999 | 2,224 | 6.9% |
| $15,000 to $24,999 | 4,963 | 15.4% |
| $25,000 to $34,999 | 3,964 | 12.3% |
| $35,000 to $49,999 | 4,673 | 14.5% |
| $50,000 to $74,999 | 4,673 | 14.5% |
| $75,000 to $99,999 | 2,772 | 8.6% |
| $100,000 to $149,999 | 2,127 | 6.6% |
| $150,000 to $199,999 | 645 | 2.0% |
| $200,000+ | 1,192 | 3.7% |
Family Income by Famaliy Size in Caguas Municipio
7+ person families (91 | 0.3%) account for the highest median family income in Caguas Municipio with $78,173 per family, while 2-person families (15,888 | 49.3%) have the highest median income of $14,803 per family member.
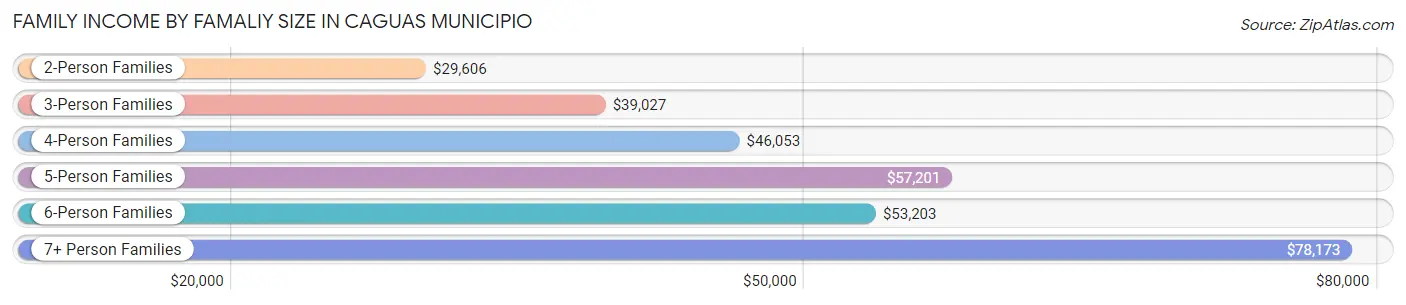
| Income Bracket | # Families | Median Income |
| 2-Person Families | 15,888 (49.3%) | $29,606 |
| 3-Person Families | 9,318 (28.9%) | $39,027 |
| 4-Person Families | 5,267 (16.3%) | $46,053 |
| 5-Person Families | 1,416 (4.4%) | $57,201 |
| 6-Person Families | 249 (0.8%) | $53,203 |
| 7+ Person Families | 91 (0.3%) | $78,173 |
| Total | 32,229 (100.0%) | $34,876 |
Family Income by Number of Earners in Caguas Municipio
The median family income in Caguas Municipio is $34,876, with families comprising 3+ earners (1,952) having the highest median family income of $80,119, while families with no earners (9,711) have the lowest median family income of $18,757, accounting for 6.1% and 30.1% of families, respectively.
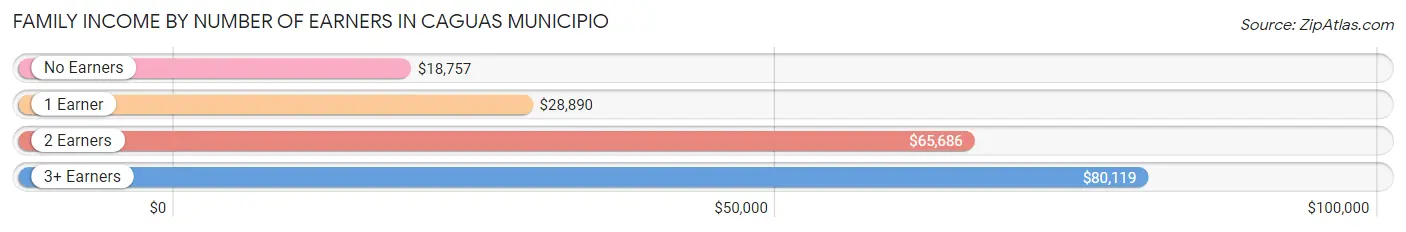
| Number of Earners | # Families | Median Income |
| No Earners | 9,711 (30.1%) | $18,757 |
| 1 Earner | 11,827 (36.7%) | $28,890 |
| 2 Earners | 8,739 (27.1%) | $65,686 |
| 3+ Earners | 1,952 (6.1%) | $80,119 |
| Total | 32,229 (100.0%) | $34,876 |
Household Income in Caguas Municipio
Household Income Brackets in Caguas Municipio
With 9,284 households falling in the category, the less than $10,000 income range is the most frequent in Caguas Municipio, accounting for 18.7% of all households. In contrast, only 745 households (1.5%) fall into the $150,000 to $199,999 income bracket, making it the least populous group.
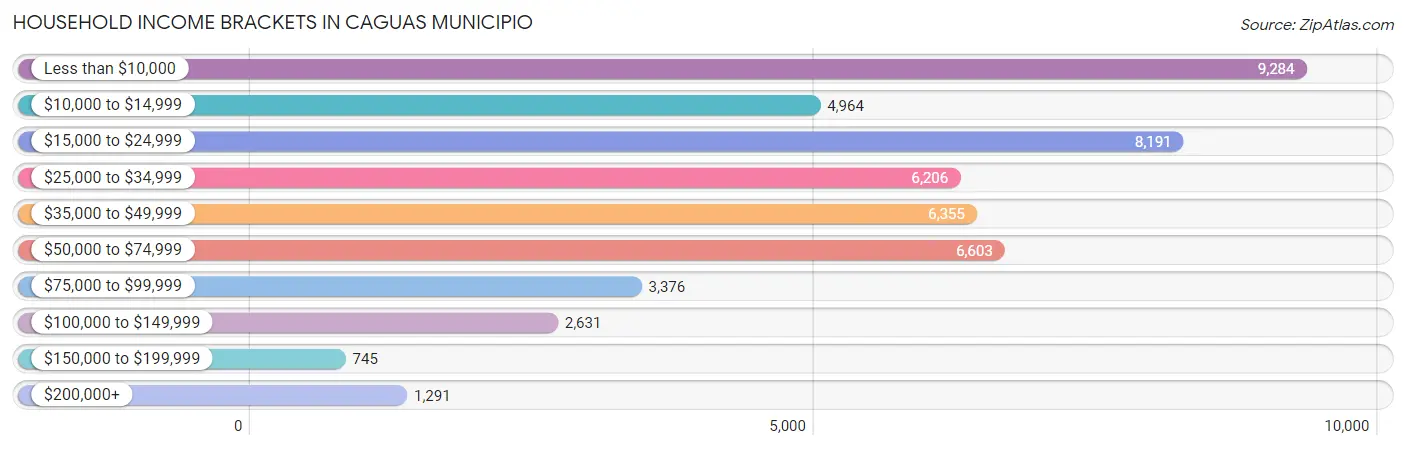
| Income Bracket | # Households | % Households |
| Less than $10,000 | 9,284 | 18.7% |
| $10,000 to $14,999 | 4,964 | 10.0% |
| $15,000 to $24,999 | 8,191 | 16.5% |
| $25,000 to $34,999 | 6,206 | 12.5% |
| $35,000 to $49,999 | 6,355 | 12.8% |
| $50,000 to $74,999 | 6,603 | 13.3% |
| $75,000 to $99,999 | 3,376 | 6.8% |
| $100,000 to $149,999 | 2,631 | 5.3% |
| $150,000 to $199,999 | 745 | 1.5% |
| $200,000+ | 1,291 | 2.6% |
Household Income by Householder Age in Caguas Municipio
The median household income in Caguas Municipio is $29,279, with the highest median household income of $36,600 found in the 45 to 64 years age bracket for the primary householder. A total of 18,902 households (38.1%) fall into this category. Meanwhile, the 15 to 24 years age bracket for the primary householder has the lowest median household income of $13,672, with 798 households (1.6%) in this group.
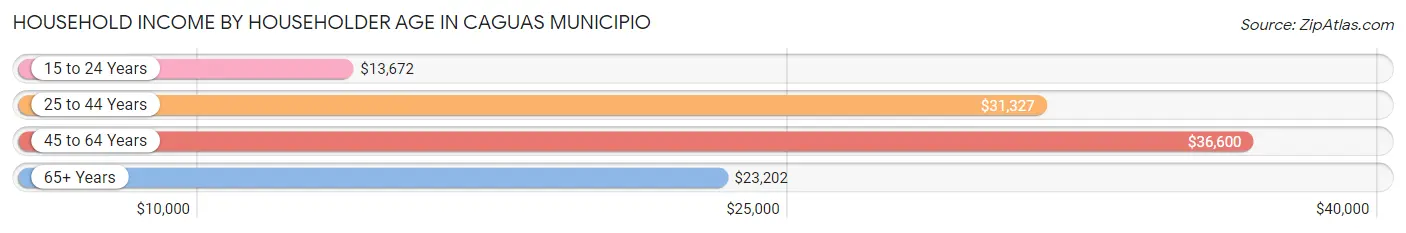
| Income Bracket | # Households | Median Income |
| 15 to 24 Years | 798 (1.6%) | $13,672 |
| 25 to 44 Years | 12,402 (25.0%) | $31,327 |
| 45 to 64 Years | 18,902 (38.1%) | $36,600 |
| 65+ Years | 17,543 (35.3%) | $23,202 |
| Total | 49,645 (100.0%) | $29,279 |
Poverty in Caguas Municipio
Income Below Poverty by Sex and Age in Caguas Municipio
With 34.7% poverty level for males and 39.0% for females among the residents of Caguas Municipio, 15 year old males and 6 to 11 year old females are the most vulnerable to poverty, with 542 males (66.6%) and 2,081 females (55.6%) in their respective age groups living below the poverty level.
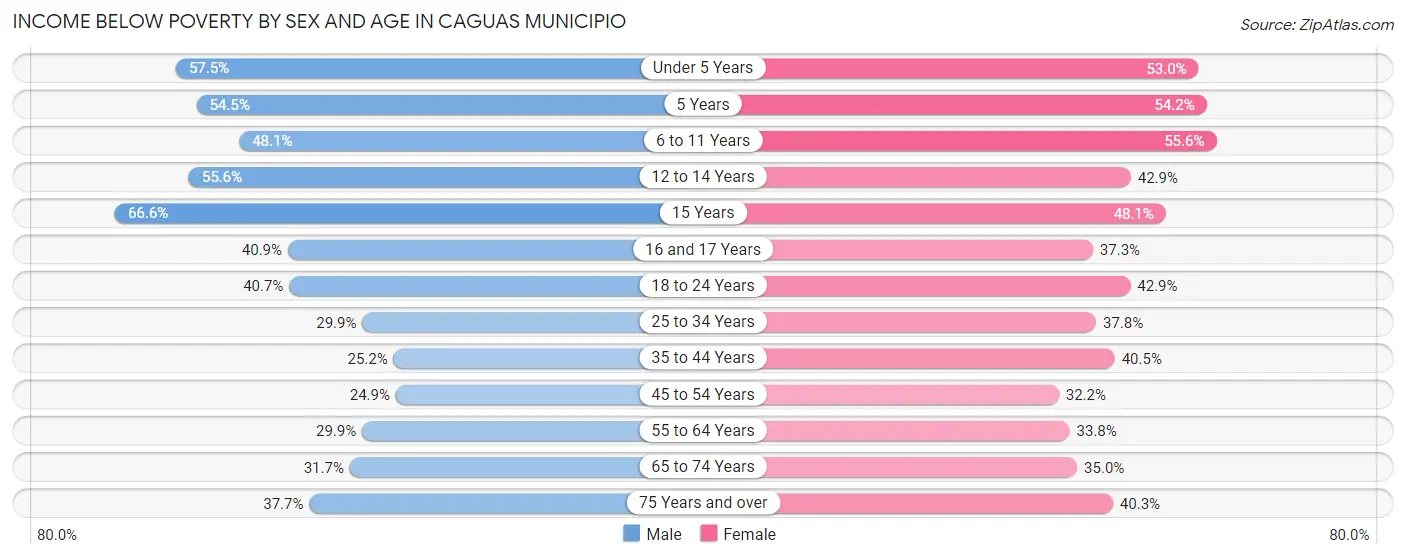
| Age Bracket | Male | Female |
| Under 5 Years | 1,224 (57.5%) | 1,102 (53.0%) |
| 5 Years | 335 (54.5%) | 247 (54.2%) |
| 6 to 11 Years | 1,750 (48.1%) | 2,081 (55.6%) |
| 12 to 14 Years | 1,209 (55.6%) | 836 (42.9%) |
| 15 Years | 542 (66.6%) | 289 (48.1%) |
| 16 and 17 Years | 623 (40.9%) | 638 (37.3%) |
| 18 to 24 Years | 2,401 (40.7%) | 2,464 (42.8%) |
| 25 to 34 Years | 2,368 (29.8%) | 3,296 (37.8%) |
| 35 to 44 Years | 1,870 (25.2%) | 3,375 (40.5%) |
| 45 to 54 Years | 1,963 (24.9%) | 2,891 (32.2%) |
| 55 to 64 Years | 2,220 (29.9%) | 3,143 (33.8%) |
| 65 to 74 Years | 1,888 (31.7%) | 2,791 (34.9%) |
| 75 Years and over | 1,852 (37.7%) | 3,240 (40.3%) |
| Total | 20,245 (34.7%) | 26,393 (39.0%) |
Income Above Poverty by Sex and Age in Caguas Municipio
According to the poverty statistics in Caguas Municipio, males aged 45 to 54 years and females aged 45 to 54 years are the age groups that are most secure financially, with 75.1% of males and 67.8% of females in these age groups living above the poverty line.
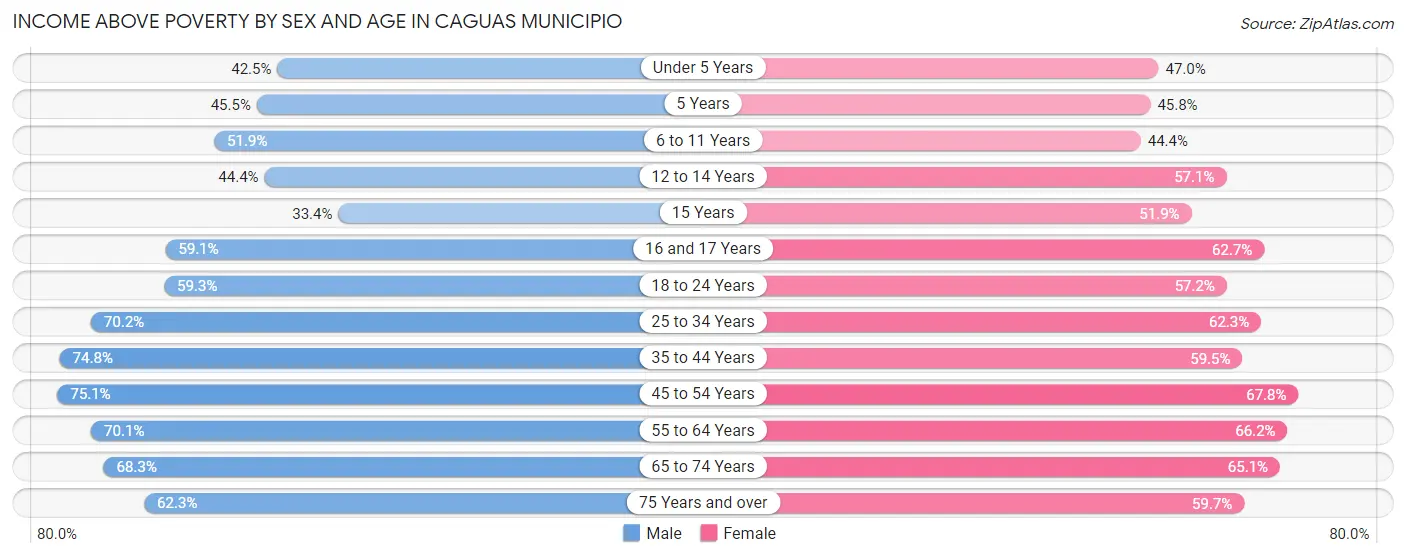
| Age Bracket | Male | Female |
| Under 5 Years | 904 (42.5%) | 979 (47.0%) |
| 5 Years | 280 (45.5%) | 209 (45.8%) |
| 6 to 11 Years | 1,886 (51.9%) | 1,662 (44.4%) |
| 12 to 14 Years | 965 (44.4%) | 1,112 (57.1%) |
| 15 Years | 272 (33.4%) | 312 (51.9%) |
| 16 and 17 Years | 900 (59.1%) | 1,073 (62.7%) |
| 18 to 24 Years | 3,497 (59.3%) | 3,286 (57.2%) |
| 25 to 34 Years | 5,566 (70.2%) | 5,434 (62.3%) |
| 35 to 44 Years | 5,548 (74.8%) | 4,953 (59.5%) |
| 45 to 54 Years | 5,927 (75.1%) | 6,082 (67.8%) |
| 55 to 64 Years | 5,207 (70.1%) | 6,147 (66.2%) |
| 65 to 74 Years | 4,064 (68.3%) | 5,195 (65.0%) |
| 75 Years and over | 3,056 (62.3%) | 4,807 (59.7%) |
| Total | 38,072 (65.3%) | 41,251 (61.0%) |
Income Below Poverty Among Married-Couple Families in Caguas Municipio
The poverty statistics for married-couple families in Caguas Municipio show that 21.4% or 3,807 of the total 17,785 families live below the poverty line. Families with 3 or 4 children have the highest poverty rate of 40.0%, comprising of 194 families. On the other hand, families with no children have the lowest poverty rate of 20.9%, which includes 2,644 families.
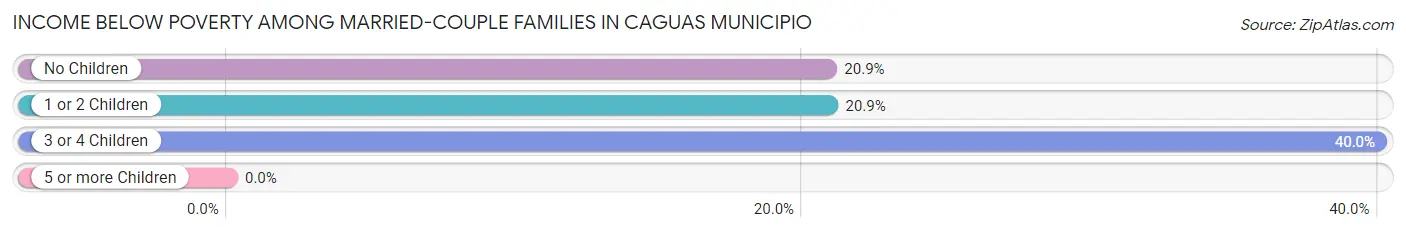
| Children | Above Poverty | Below Poverty |
| No Children | 10,022 (79.1%) | 2,644 (20.9%) |
| 1 or 2 Children | 3,665 (79.1%) | 969 (20.9%) |
| 3 or 4 Children | 291 (60.0%) | 194 (40.0%) |
| 5 or more Children | 0 (0.0%) | 0 (0.0%) |
| Total | 13,978 (78.6%) | 3,807 (21.4%) |
Income Below Poverty Among Single-Parent Households in Caguas Municipio
According to the poverty data in Caguas Municipio, 41.4% or 1,332 single-father households and 52.2% or 5,860 single-mother households are living below the poverty line. Among single-father households, those with 3 or 4 children have the highest poverty rate, with 67 households (91.8%) experiencing poverty. Likewise, among single-mother households, those with 3 or 4 children have the highest poverty rate, with 505 households (82.5%) falling below the poverty line.
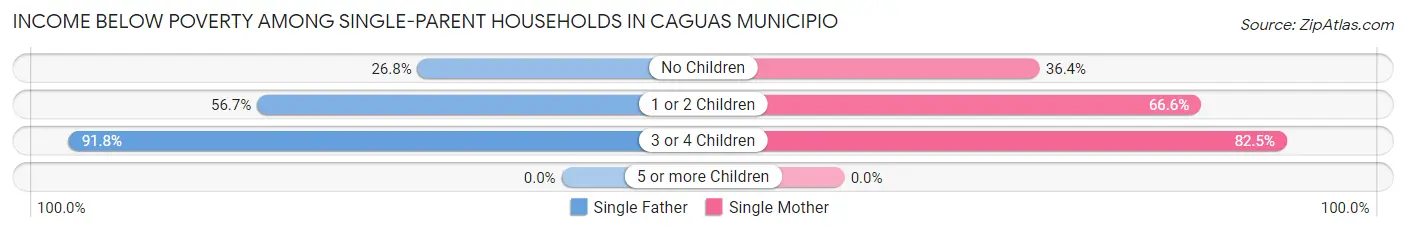
| Children | Single Father | Single Mother |
| No Children | 465 (26.8%) | 2,058 (36.4%) |
| 1 or 2 Children | 800 (56.7%) | 3,297 (66.5%) |
| 3 or 4 Children | 67 (91.8%) | 505 (82.5%) |
| 5 or more Children | 0 (0.0%) | 0 (0.0%) |
| Total | 1,332 (41.4%) | 5,860 (52.2%) |
Income Below Poverty Among Married-Couple vs Single-Parent Households in Caguas Municipio
The poverty data for Caguas Municipio shows that 3,807 of the married-couple family households (21.4%) and 7,192 of the single-parent households (49.8%) are living below the poverty level. Within the married-couple family households, those with 3 or 4 children have the highest poverty rate, with 194 households (40.0%) falling below the poverty line. Among the single-parent households, those with 3 or 4 children have the highest poverty rate, with 572 household (83.5%) living below poverty.
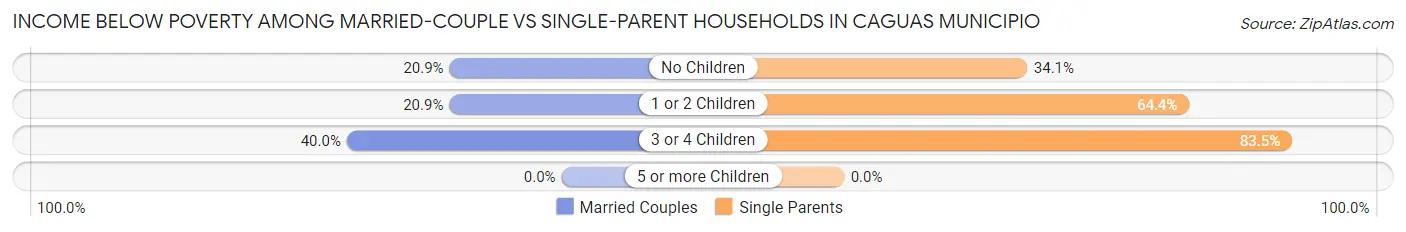
| Children | Married-Couple Families | Single-Parent Households |
| No Children | 2,644 (20.9%) | 2,523 (34.1%) |
| 1 or 2 Children | 969 (20.9%) | 4,097 (64.4%) |
| 3 or 4 Children | 194 (40.0%) | 572 (83.5%) |
| 5 or more Children | 0 (0.0%) | 0 (0.0%) |
| Total | 3,807 (21.4%) | 7,192 (49.8%) |
Race in Caguas Municipio
The most populous races in Caguas Municipio are Hispanic or Latino (124,314 | 98.1%), White / Caucasian (70,715 | 55.8%), and Some other Race (25,777 | 20.3%).
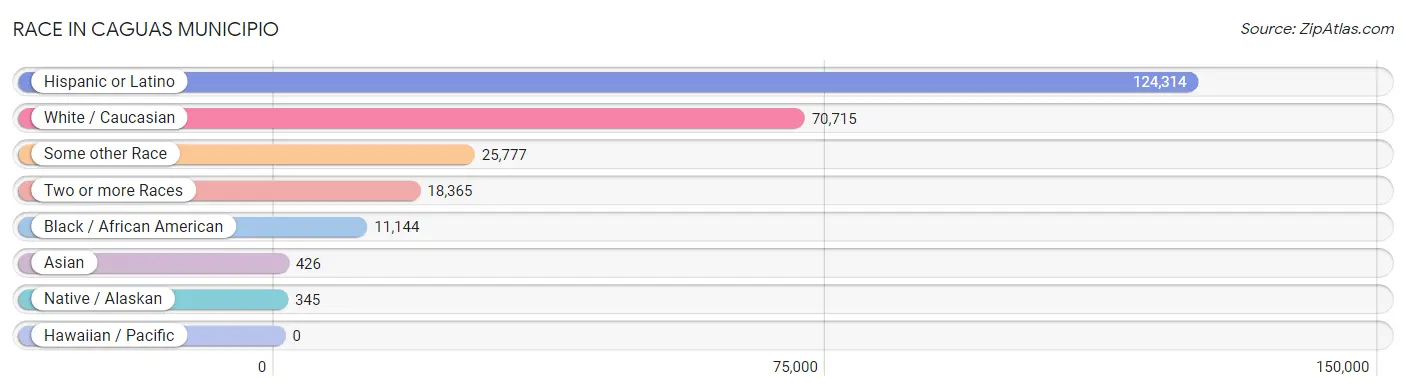
| Race | # Population | % Population |
| Asian | 426 | 0.3% |
| Black / African American | 11,144 | 8.8% |
| Hawaiian / Pacific | 0 | 0.0% |
| Hispanic or Latino | 124,314 | 98.1% |
| Native / Alaskan | 345 | 0.3% |
| White / Caucasian | 70,715 | 55.8% |
| Two or more Races | 18,365 | 14.5% |
| Some other Race | 25,777 | 20.3% |
| Total | 126,772 | 100.0% |
Ancestry in Caguas Municipio
The most populous ancestries reported in Caguas Municipio are Puerto Rican (120,305 | 94.9%), American (3,177 | 2.5%), Dominican (1,348 | 1.1%), Central American Indian (896 | 0.7%), and South American (873 | 0.7%), together accounting for 99.9% of all Caguas Municipio residents.
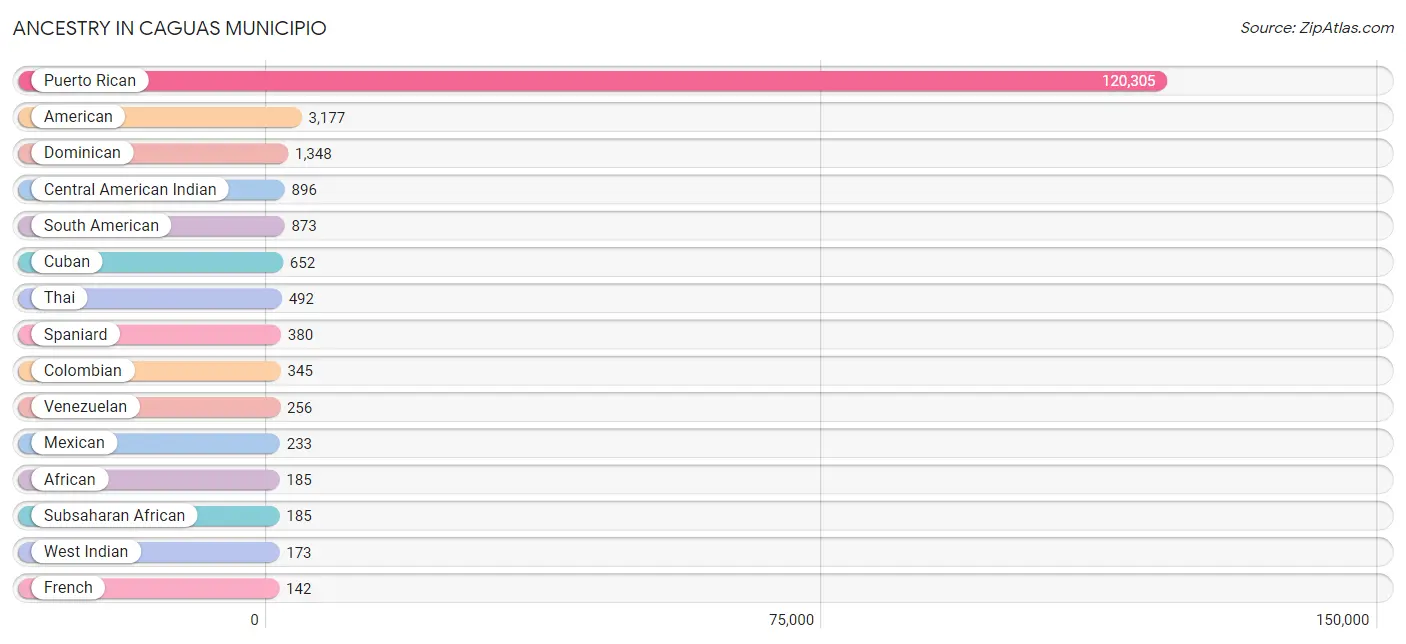
| Ancestry | # Population | % Population |
| African | 185 | 0.2% |
| American | 3,177 | 2.5% |
| Argentinean | 26 | 0.0% |
| British West Indian | 18 | 0.0% |
| Canadian | 9 | 0.0% |
| Central American | 140 | 0.1% |
| Central American Indian | 896 | 0.7% |
| Cherokee | 12 | 0.0% |
| Chilean | 80 | 0.1% |
| Colombian | 345 | 0.3% |
| Cuban | 652 | 0.5% |
| Dominican | 1,348 | 1.1% |
| Ecuadorian | 88 | 0.1% |
| English | 18 | 0.0% |
| European | 57 | 0.0% |
| Fijian | 10 | 0.0% |
| French | 142 | 0.1% |
| French Canadian | 14 | 0.0% |
| German | 31 | 0.0% |
| Guatemalan | 6 | 0.0% |
| Honduran | 106 | 0.1% |
| Indian (Asian) | 119 | 0.1% |
| Irish | 32 | 0.0% |
| Italian | 39 | 0.0% |
| Laotian | 37 | 0.0% |
| Mexican | 233 | 0.2% |
| Panamanian | 27 | 0.0% |
| Peruvian | 78 | 0.1% |
| Portuguese | 19 | 0.0% |
| Puerto Rican | 120,305 | 94.9% |
| Salvadoran | 1 | 0.0% |
| South American | 873 | 0.7% |
| Spaniard | 380 | 0.3% |
| Subsaharan African | 185 | 0.2% |
| Thai | 492 | 0.4% |
| Ukrainian | 17 | 0.0% |
| Venezuelan | 256 | 0.2% |
| West Indian | 173 | 0.1% | View All 38 Rows |
Immigrants in Caguas Municipio

| Immigration Origin | # Population | % Population | View All 0 Rows |
Sex and Age in Caguas Municipio
Sex and Age in Caguas Municipio
The most populous age groups in Caguas Municipio are 20 to 24 Years (4,237 | 7.2%) for men and 60 to 64 Years (4,794 | 7.0%) for women.
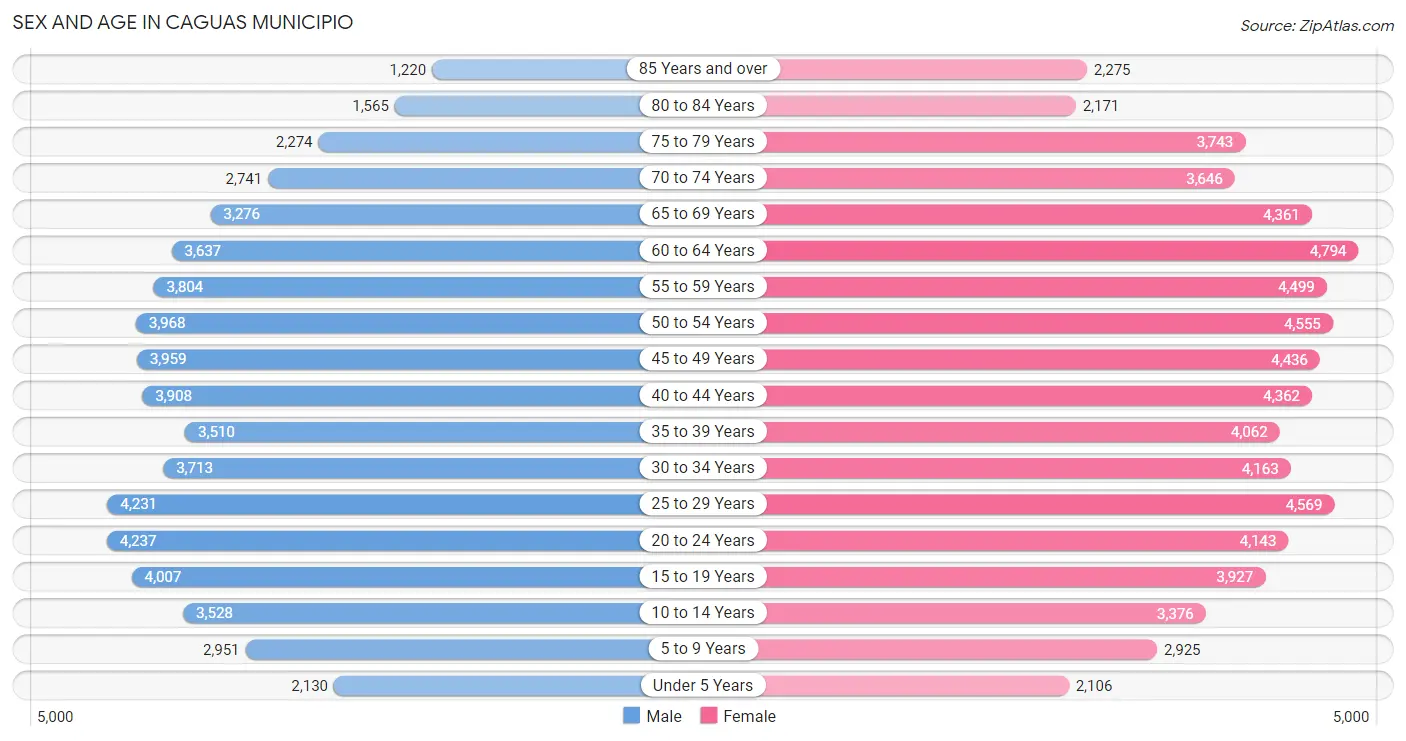
| Age Bracket | Male | Female |
| Under 5 Years | 2,130 (3.6%) | 2,106 (3.1%) |
| 5 to 9 Years | 2,951 (5.0%) | 2,925 (4.3%) |
| 10 to 14 Years | 3,528 (6.0%) | 3,376 (5.0%) |
| 15 to 19 Years | 4,007 (6.8%) | 3,927 (5.8%) |
| 20 to 24 Years | 4,237 (7.2%) | 4,143 (6.1%) |
| 25 to 29 Years | 4,231 (7.2%) | 4,569 (6.7%) |
| 30 to 34 Years | 3,713 (6.3%) | 4,163 (6.1%) |
| 35 to 39 Years | 3,510 (6.0%) | 4,062 (6.0%) |
| 40 to 44 Years | 3,908 (6.7%) | 4,362 (6.4%) |
| 45 to 49 Years | 3,959 (6.8%) | 4,436 (6.5%) |
| 50 to 54 Years | 3,968 (6.8%) | 4,555 (6.7%) |
| 55 to 59 Years | 3,804 (6.5%) | 4,499 (6.6%) |
| 60 to 64 Years | 3,637 (6.2%) | 4,794 (7.0%) |
| 65 to 69 Years | 3,276 (5.6%) | 4,361 (6.4%) |
| 70 to 74 Years | 2,741 (4.7%) | 3,646 (5.3%) |
| 75 to 79 Years | 2,274 (3.9%) | 3,743 (5.5%) |
| 80 to 84 Years | 1,565 (2.7%) | 2,171 (3.2%) |
| 85 Years and over | 1,220 (2.1%) | 2,275 (3.3%) |
| Total | 58,659 (100.0%) | 68,113 (100.0%) |
Families and Households in Caguas Municipio
Median Family Size in Caguas Municipio
The median family size in Caguas Municipio is 3.14 persons per family, with married-couple families (17,785 | 55.2%) accounting for the largest median family size of 3.18 persons per family. On the other hand, single male/father families (3,218 | 10.0%) represent the smallest median family size with 2.89 persons per family.
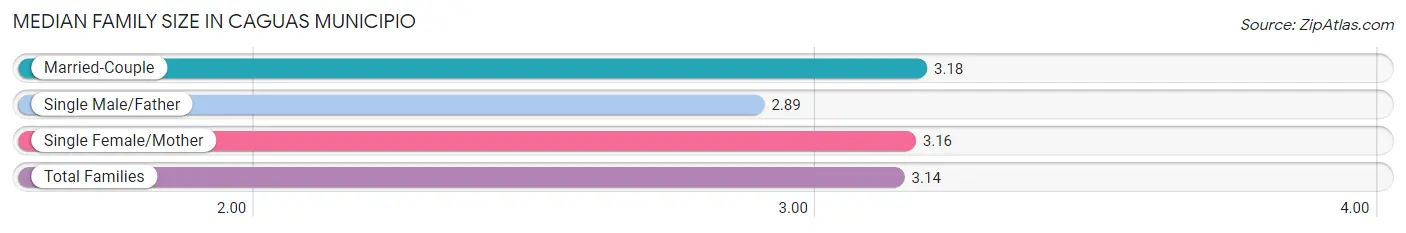
| Family Type | # Families | Family Size |
| Married-Couple | 17,785 (55.2%) | 3.18 |
| Single Male/Father | 3,218 (10.0%) | 2.89 |
| Single Female/Mother | 11,226 (34.8%) | 3.16 |
| Total Families | 32,229 (100.0%) | 3.14 |
Median Household Size in Caguas Municipio
The median household size in Caguas Municipio is 2.53 persons per household, with single male/father households (3,218 | 6.5%) accounting for the largest median household size of 3.33 persons per household. non-family households (17,416 | 35.1%) represent the smallest median household size with 1.21 persons per household.
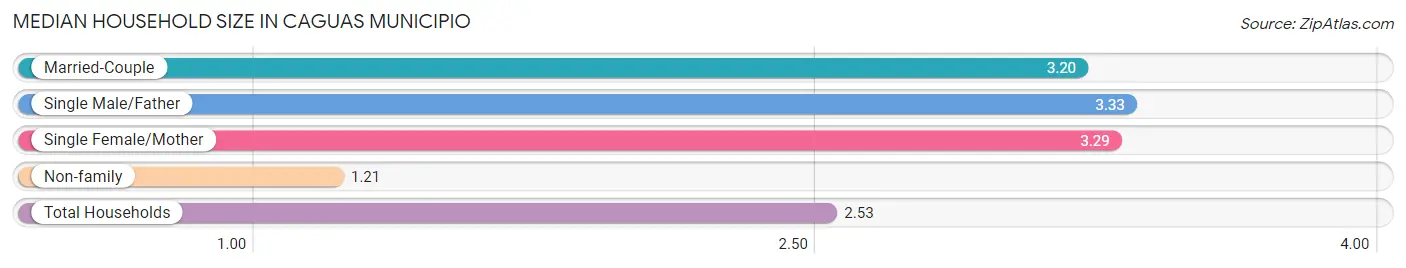
| Household Type | # Households | Household Size |
| Married-Couple | 17,785 (35.8%) | 3.20 |
| Single Male/Father | 3,218 (6.5%) | 3.33 |
| Single Female/Mother | 11,226 (22.6%) | 3.29 |
| Non-family | 17,416 (35.1%) | 1.21 |
| Total Households | 49,645 (100.0%) | 2.53 |
Household Size by Marriage Status in Caguas Municipio
Out of a total of 49,645 households in Caguas Municipio, 32,229 (64.9%) are family households, while 17,416 (35.1%) are nonfamily households. The most numerous type of family households are 2-person households, comprising 14,260, and the most common type of nonfamily households are 1-person households, comprising 14,278.
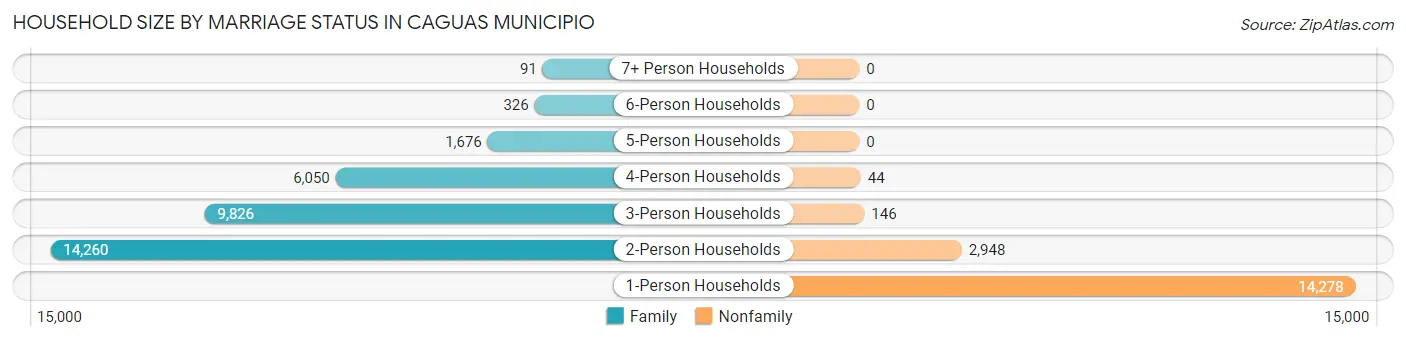
| Household Size | Family Households | Nonfamily Households |
| 1-Person Households | - | 14,278 (28.8%) |
| 2-Person Households | 14,260 (28.7%) | 2,948 (5.9%) |
| 3-Person Households | 9,826 (19.8%) | 146 (0.3%) |
| 4-Person Households | 6,050 (12.2%) | 44 (0.1%) |
| 5-Person Households | 1,676 (3.4%) | 0 (0.0%) |
| 6-Person Households | 326 (0.7%) | 0 (0.0%) |
| 7+ Person Households | 91 (0.2%) | 0 (0.0%) |
| Total | 32,229 (64.9%) | 17,416 (35.1%) |
Female Fertility in Caguas Municipio
Fertility by Age in Caguas Municipio
Average fertility rate in Caguas Municipio is 19.0 births per 1,000 women. Women in the age bracket of 20 to 34 years have the highest fertility rate with 37.0 births per 1,000 women. Women in the age bracket of 20 to 34 years acount for 83.4% of all women with births.
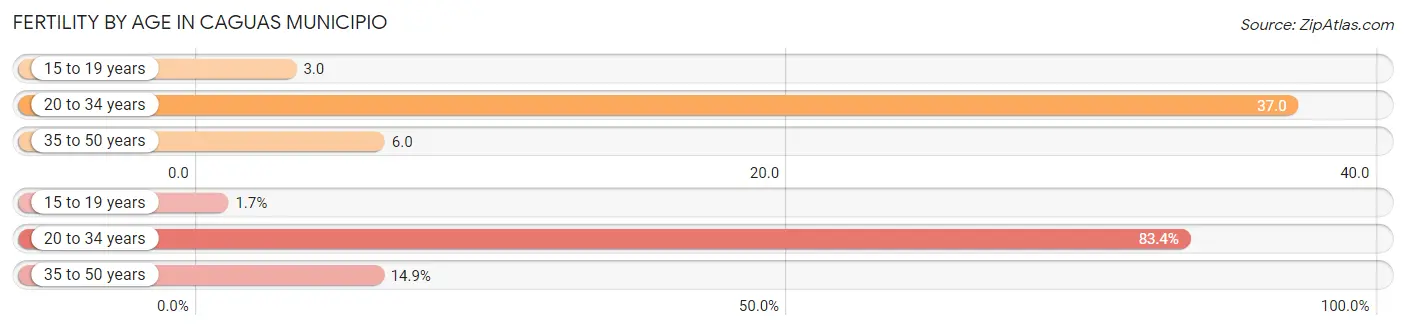
| Age Bracket | Women with Births | Births / 1,000 Women |
| 15 to 19 years | 10 (1.7%) | 3.0 |
| 20 to 34 years | 481 (83.4%) | 37.0 |
| 35 to 50 years | 86 (14.9%) | 6.0 |
| Total | 577 (100.0%) | 19.0 |
Fertility by Age by Marriage Status in Caguas Municipio
53.9% of women with births (577) in Caguas Municipio are married. The highest percentage of unmarried women with births falls into 15 to 19 years age bracket with 100.0% of them unmarried at the time of birth, while the lowest percentage of unmarried women with births belong to 20 to 34 years age bracket with 44.5% of them unmarried.
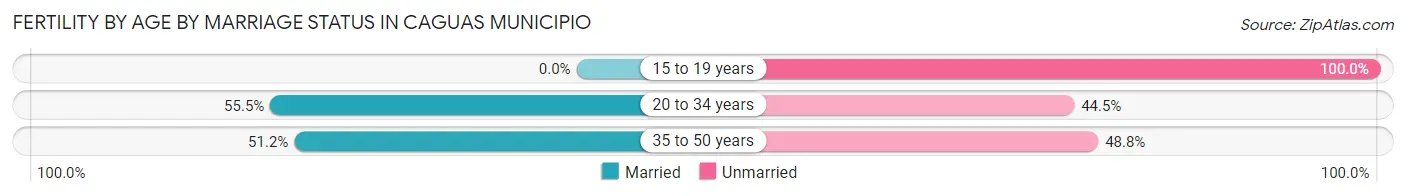
| Age Bracket | Married | Unmarried |
| 15 to 19 years | 0 (0.0%) | 10 (100.0%) |
| 20 to 34 years | 267 (55.5%) | 214 (44.5%) |
| 35 to 50 years | 44 (51.2%) | 42 (48.8%) |
| Total | 311 (53.9%) | 266 (46.1%) |
Fertility by Education in Caguas Municipio
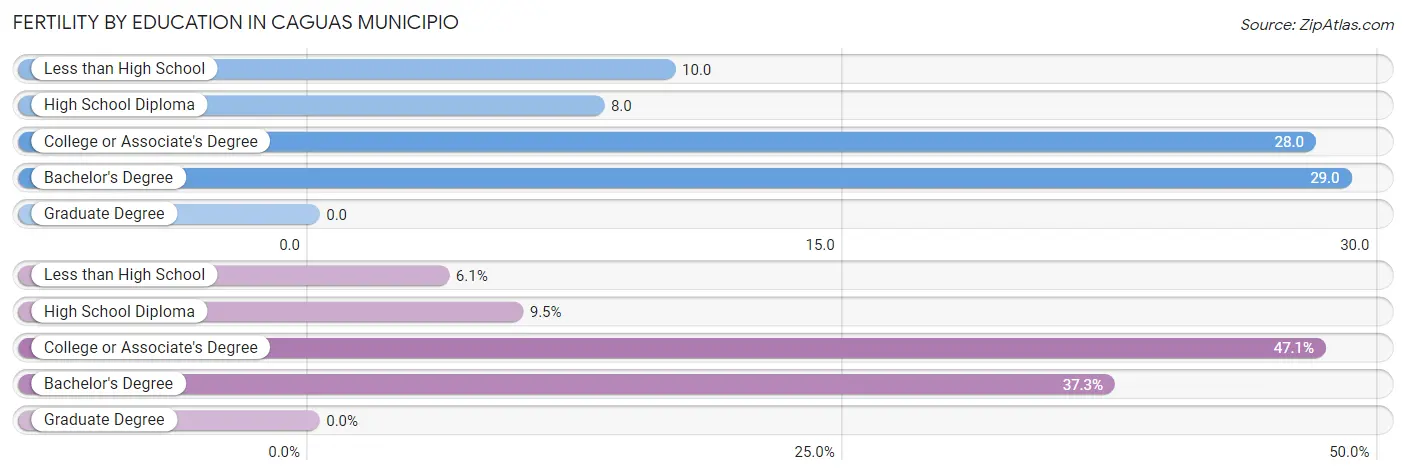
| Educational Attainment | Women with Births | Births / 1,000 Women |
| Less than High School | 35 (6.1%) | 10.0 |
| High School Diploma | 55 (9.5%) | 8.0 |
| College or Associate's Degree | 272 (47.1%) | 28.0 |
| Bachelor's Degree | 215 (37.3%) | 29.0 |
| Graduate Degree | 0 (0.0%) | 0.0 |
| Total | 577 (100.0%) | 19.0 |
Fertility by Education by Marriage Status in Caguas Municipio
46.1% of women with births in Caguas Municipio are unmarried. Women with the educational attainment of bachelor's degree are most likely to be married with 74.0% of them married at childbirth, while women with the educational attainment of less than high school are least likely to be married with 100.0% of them unmarried at childbirth.
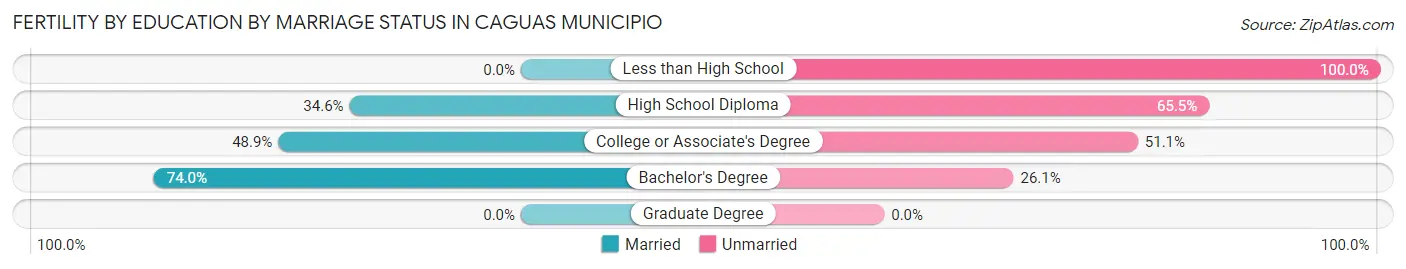
| Educational Attainment | Married | Unmarried |
| Less than High School | 0 (0.0%) | 35 (100.0%) |
| High School Diploma | 19 (34.5%) | 36 (65.4%) |
| College or Associate's Degree | 133 (48.9%) | 139 (51.1%) |
| Bachelor's Degree | 159 (74.0%) | 56 (26.1%) |
| Graduate Degree | 0 (0.0%) | 0 (0.0%) |
| Total | 311 (53.9%) | 266 (46.1%) |
Employment Characteristics in Caguas Municipio
Employment by Class of Employer in Caguas Municipio
Among the 45,289 employed individuals in Caguas Municipio, private company employees (28,957 | 63.9%), state government employees (4,814 | 10.6%), and self-employed (not incorporated) (4,406 | 9.7%) make up the most common classes of employment.
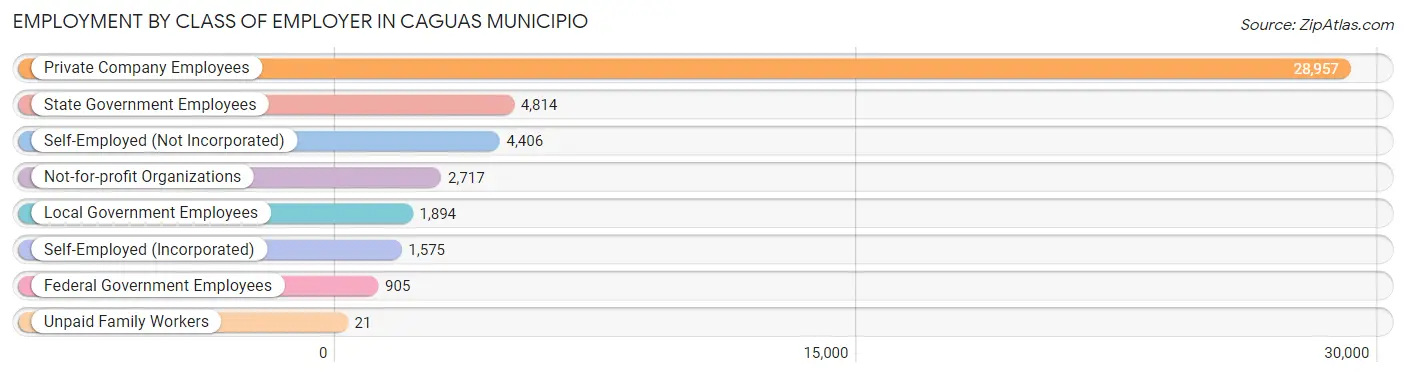
| Employer Class | # Employees | % Employees |
| Private Company Employees | 28,957 | 63.9% |
| Self-Employed (Incorporated) | 1,575 | 3.5% |
| Self-Employed (Not Incorporated) | 4,406 | 9.7% |
| Not-for-profit Organizations | 2,717 | 6.0% |
| Local Government Employees | 1,894 | 4.2% |
| State Government Employees | 4,814 | 10.6% |
| Federal Government Employees | 905 | 2.0% |
| Unpaid Family Workers | 21 | 0.1% |
| Total | 45,289 | 100.0% |
Employment Status by Age in Caguas Municipio
According to the labor force statistics for Caguas Municipio, out of the total population over 16 years of age (108,335), 48.7% or 52,759 individuals are in the labor force, with 9.6% or 5,065 of them unemployed. The age group with the highest labor force participation rate is 30 to 34 years, with 83.0% or 6,537 individuals in the labor force. Within the labor force, the 20 to 24 years age range has the highest percentage of unemployed individuals, with 27.2% or 1,310 of them being unemployed.
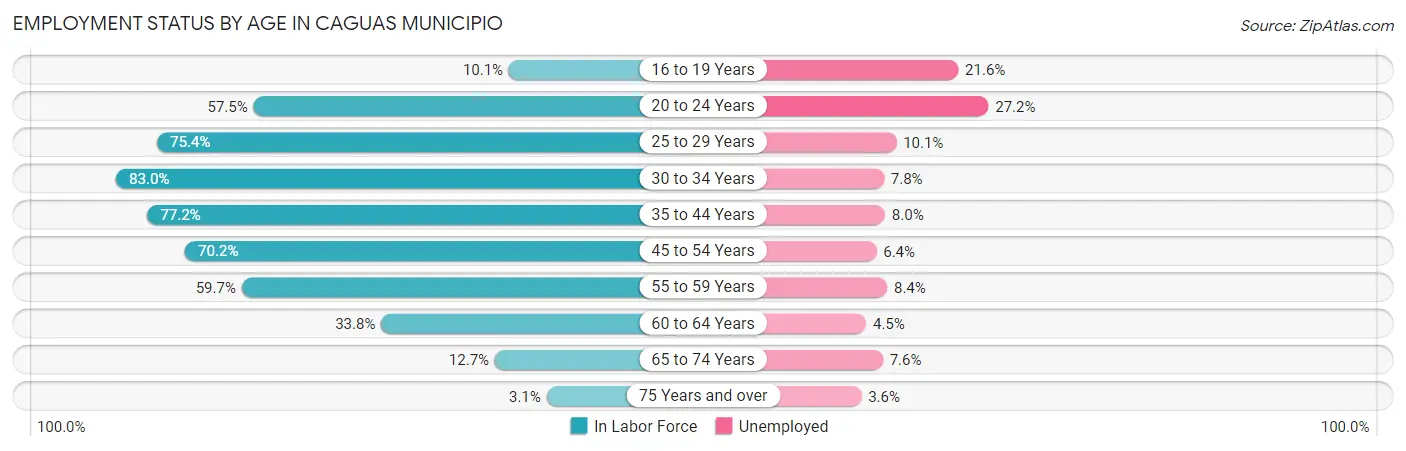
| Age Bracket | In Labor Force | Unemployed |
| 16 to 19 Years | 658 (10.1%) | 142 (21.6%) |
| 20 to 24 Years | 4,818 (57.5%) | 1,310 (27.2%) |
| 25 to 29 Years | 6,635 (75.4%) | 670 (10.1%) |
| 30 to 34 Years | 6,537 (83.0%) | 510 (7.8%) |
| 35 to 44 Years | 12,230 (77.2%) | 978 (8.0%) |
| 45 to 54 Years | 11,876 (70.2%) | 760 (6.4%) |
| 55 to 59 Years | 4,957 (59.7%) | 416 (8.4%) |
| 60 to 64 Years | 2,850 (33.8%) | 128 (4.5%) |
| 65 to 74 Years | 1,781 (12.7%) | 135 (7.6%) |
| 75 Years and over | 411 (3.1%) | 15 (3.6%) |
| Total | 52,759 (48.7%) | 5,065 (9.6%) |
Employment Status by Educational Attainment in Caguas Municipio
According to labor force statistics for Caguas Municipio, 68.1% of individuals (45,062) out of the total population between 25 and 64 years of age (66,170) are in the labor force, with 7.7% or 3,470 of them being unemployed. The group with the highest labor force participation rate are those with the educational attainment of bachelor's degree or higher, with 77.0% or 19,851 individuals in the labor force. Within the labor force, individuals with less than high school education have the highest percentage of unemployment, with 21.4% or 448 of them being unemployed.
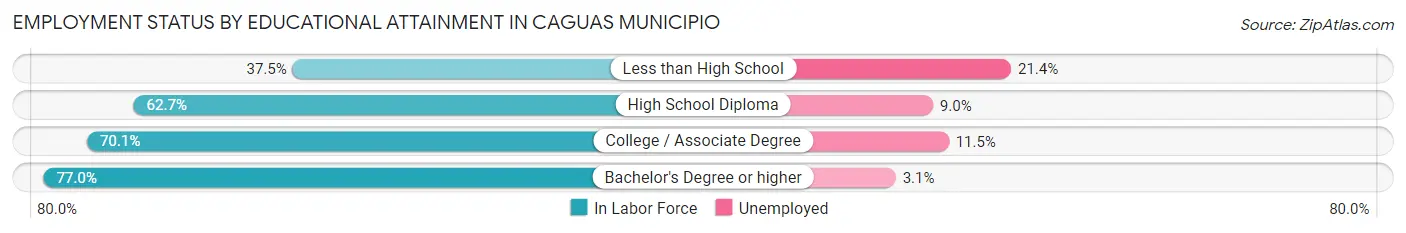
| Educational Attainment | In Labor Force | Unemployed |
| Less than High School | 2,092 (37.5%) | 1,194 (21.4%) |
| High School Diploma | 10,499 (62.7%) | 1,507 (9.0%) |
| College / Associate Degree | 12,664 (70.1%) | 2,078 (11.5%) |
| Bachelor's Degree or higher | 19,851 (77.0%) | 799 (3.1%) |
| Total | 45,062 (68.1%) | 5,095 (7.7%) |
Employment Occupations by Sex in Caguas Municipio
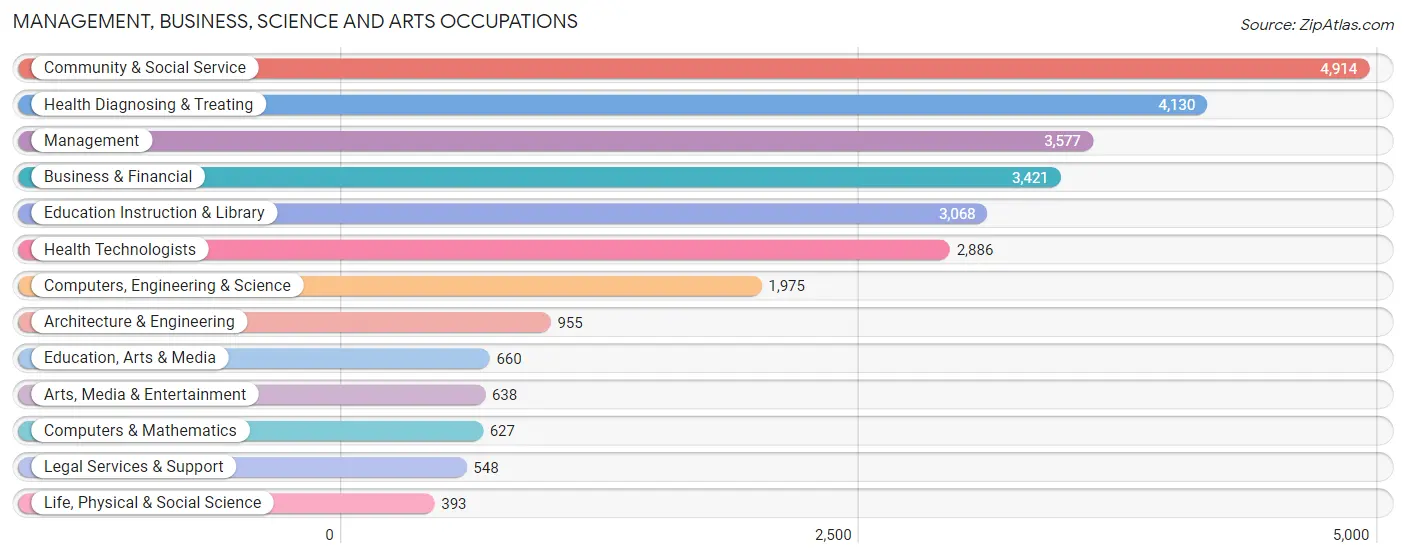
Management, Business, Science and Arts Occupations
The most common Management, Business, Science and Arts occupations in Caguas Municipio are Community & Social Service (4,914 | 10.3%), Health Diagnosing & Treating (4,130 | 8.7%), Management (3,577 | 7.5%), Business & Financial (3,421 | 7.2%), and Education Instruction & Library (3,068 | 6.4%).
Management, Business, Science and Arts Occupations by Sex
Within the Management, Business, Science and Arts occupations in Caguas Municipio, the most male-oriented occupations are Architecture & Engineering (80.6%), Computers & Mathematics (77.3%), and Arts, Media & Entertainment (75.7%), while the most female-oriented occupations are Education Instruction & Library (81.6%), Education, Arts & Media (81.5%), and Health Diagnosing & Treating (73.4%).
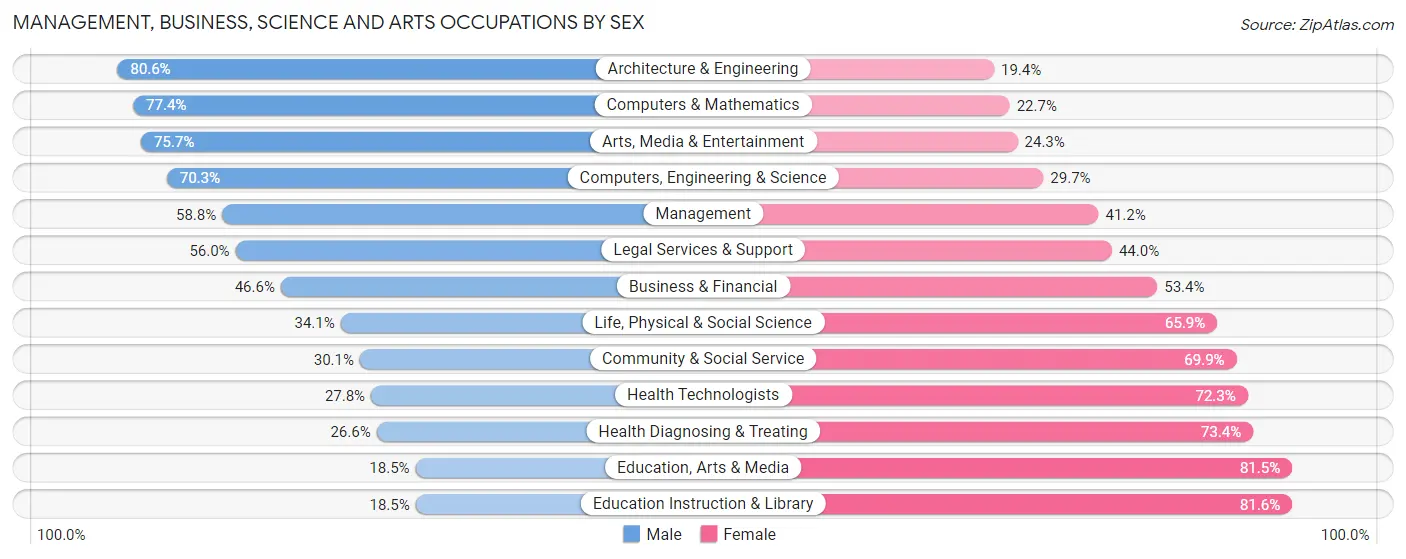
| Occupation | Male | Female |
| Management | 2,104 (58.8%) | 1,473 (41.2%) |
| Business & Financial | 1,593 (46.6%) | 1,828 (53.4%) |
| Computers, Engineering & Science | 1,389 (70.3%) | 586 (29.7%) |
| Computers & Mathematics | 485 (77.3%) | 142 (22.7%) |
| Architecture & Engineering | 770 (80.6%) | 185 (19.4%) |
| Life, Physical & Social Science | 134 (34.1%) | 259 (65.9%) |
| Community & Social Service | 1,478 (30.1%) | 3,436 (69.9%) |
| Education, Arts & Media | 122 (18.5%) | 538 (81.5%) |
| Legal Services & Support | 307 (56.0%) | 241 (44.0%) |
| Education Instruction & Library | 566 (18.4%) | 2,502 (81.6%) |
| Arts, Media & Entertainment | 483 (75.7%) | 155 (24.3%) |
| Health Diagnosing & Treating | 1,098 (26.6%) | 3,032 (73.4%) |
| Health Technologists | 801 (27.8%) | 2,085 (72.3%) |
| Total (Category) | 7,662 (42.5%) | 10,355 (57.5%) |
| Total (Overall) | 24,374 (51.2%) | 23,237 (48.8%) |
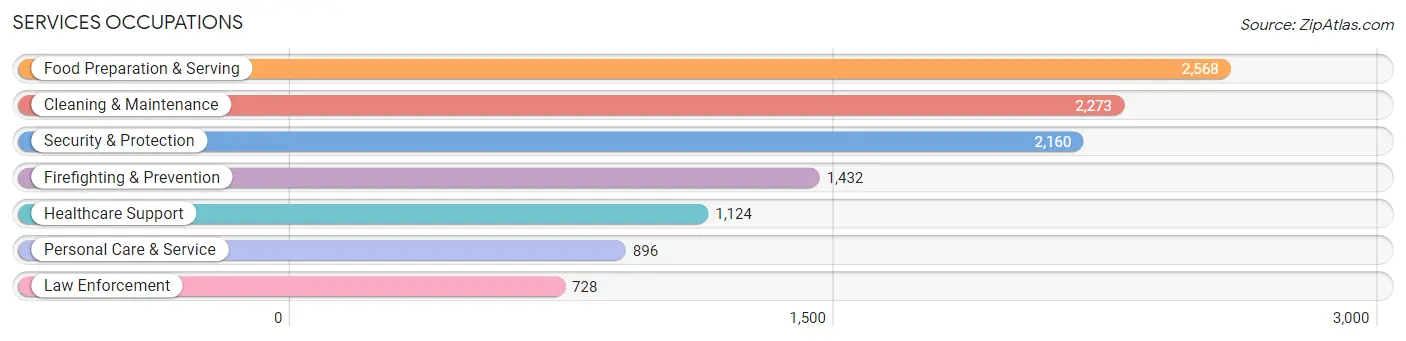
Services Occupations
The most common Services occupations in Caguas Municipio are Food Preparation & Serving (2,568 | 5.4%), Cleaning & Maintenance (2,273 | 4.8%), Security & Protection (2,160 | 4.5%), Firefighting & Prevention (1,432 | 3.0%), and Healthcare Support (1,124 | 2.4%).
Services Occupations by Sex
Within the Services occupations in Caguas Municipio, the most male-oriented occupations are Firefighting & Prevention (78.5%), Security & Protection (76.7%), and Law Enforcement (73.2%), while the most female-oriented occupations are Healthcare Support (81.0%), Personal Care & Service (46.3%), and Food Preparation & Serving (45.1%).
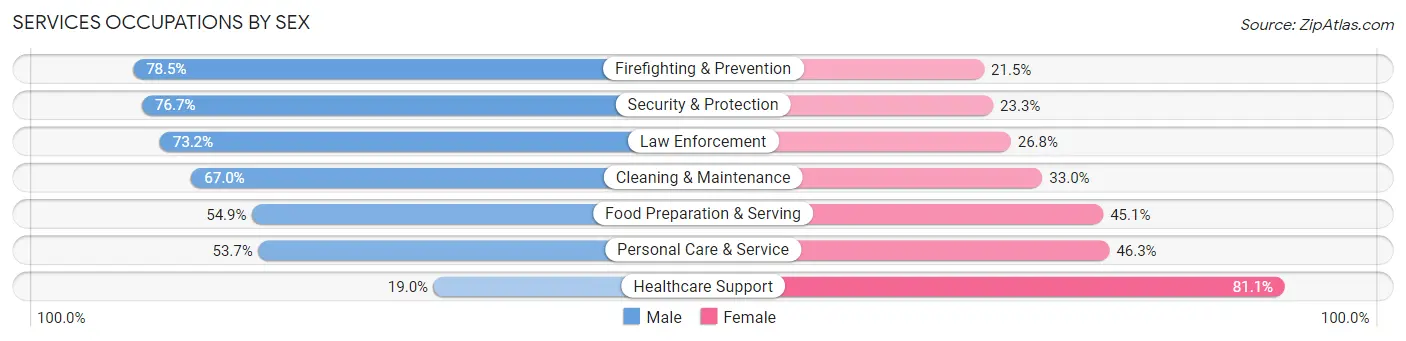
| Occupation | Male | Female |
| Healthcare Support | 213 (19.0%) | 911 (81.0%) |
| Security & Protection | 1,657 (76.7%) | 503 (23.3%) |
| Firefighting & Prevention | 1,124 (78.5%) | 308 (21.5%) |
| Law Enforcement | 533 (73.2%) | 195 (26.8%) |
| Food Preparation & Serving | 1,410 (54.9%) | 1,158 (45.1%) |
| Cleaning & Maintenance | 1,522 (67.0%) | 751 (33.0%) |
| Personal Care & Service | 481 (53.7%) | 415 (46.3%) |
| Total (Category) | 5,283 (58.6%) | 3,738 (41.4%) |
| Total (Overall) | 24,374 (51.2%) | 23,237 (48.8%) |
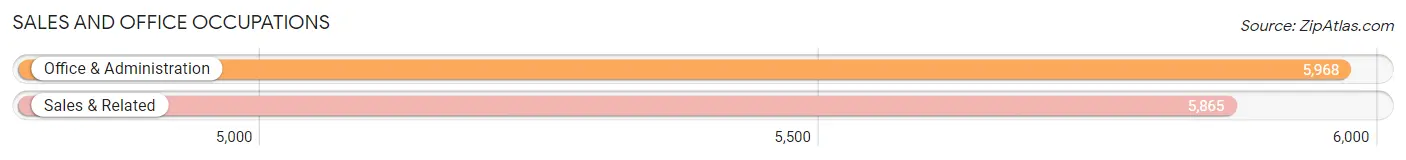
Sales and Office Occupations
The most common Sales and Office occupations in Caguas Municipio are Office & Administration (5,968 | 12.5%), and Sales & Related (5,865 | 12.3%).
Sales and Office Occupations by Sex
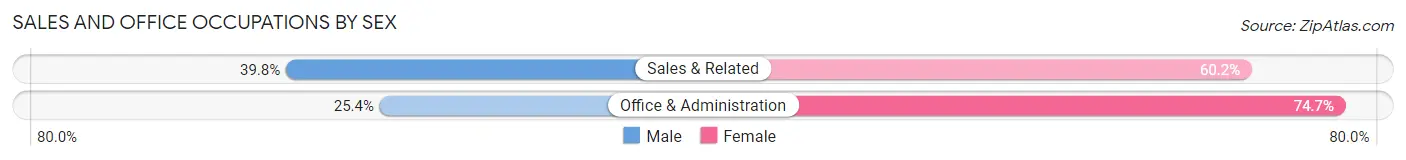
| Occupation | Male | Female |
| Sales & Related | 2,333 (39.8%) | 3,532 (60.2%) |
| Office & Administration | 1,513 (25.4%) | 4,455 (74.7%) |
| Total (Category) | 3,846 (32.5%) | 7,987 (67.5%) |
| Total (Overall) | 24,374 (51.2%) | 23,237 (48.8%) |
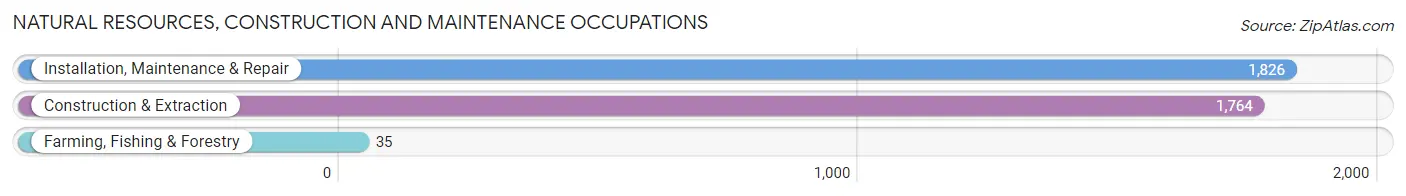
Natural Resources, Construction and Maintenance Occupations
The most common Natural Resources, Construction and Maintenance occupations in Caguas Municipio are Installation, Maintenance & Repair (1,826 | 3.8%), Construction & Extraction (1,764 | 3.7%), and Farming, Fishing & Forestry (35 | 0.1%).
Natural Resources, Construction and Maintenance Occupations by Sex
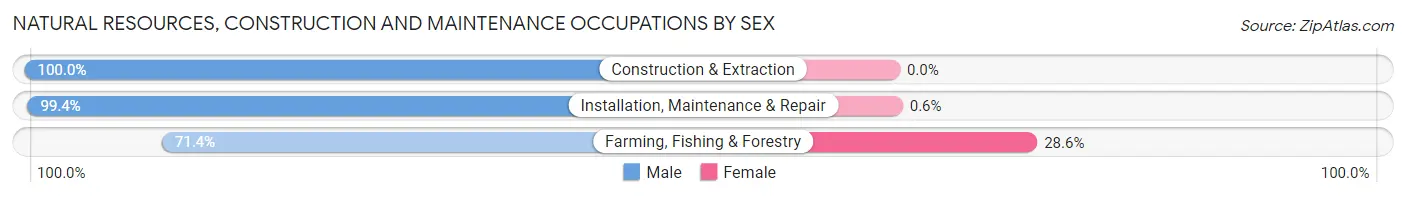
| Occupation | Male | Female |
| Farming, Fishing & Forestry | 25 (71.4%) | 10 (28.6%) |
| Construction & Extraction | 1,764 (100.0%) | 0 (0.0%) |
| Installation, Maintenance & Repair | 1,815 (99.4%) | 11 (0.6%) |
| Total (Category) | 3,604 (99.4%) | 21 (0.6%) |
| Total (Overall) | 24,374 (51.2%) | 23,237 (48.8%) |
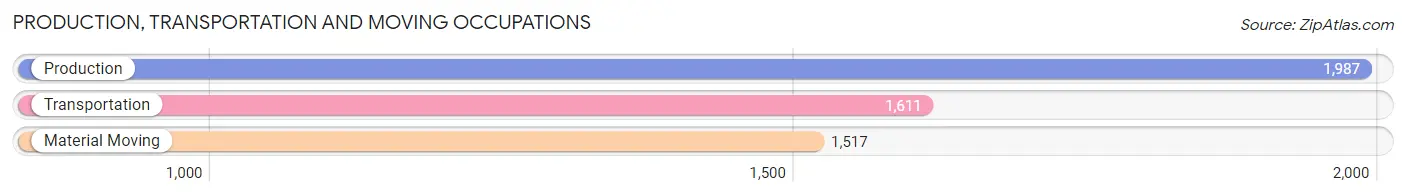
Production, Transportation and Moving Occupations
The most common Production, Transportation and Moving occupations in Caguas Municipio are Production (1,987 | 4.2%), Transportation (1,611 | 3.4%), and Material Moving (1,517 | 3.2%).
Production, Transportation and Moving Occupations by Sex
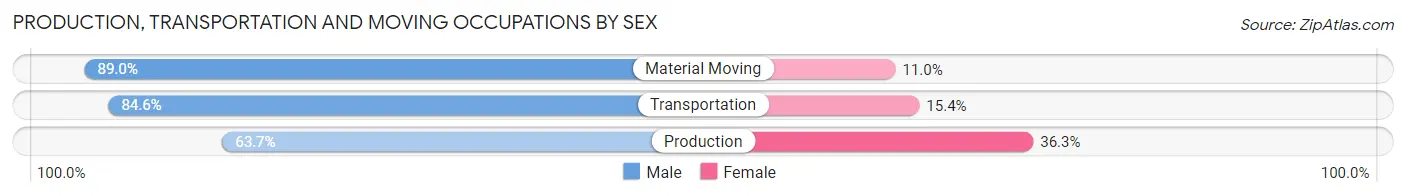
| Occupation | Male | Female |
| Production | 1,266 (63.7%) | 721 (36.3%) |
| Transportation | 1,363 (84.6%) | 248 (15.4%) |
| Material Moving | 1,350 (89.0%) | 167 (11.0%) |
| Total (Category) | 3,979 (77.8%) | 1,136 (22.2%) |
| Total (Overall) | 24,374 (51.2%) | 23,237 (48.8%) |
Employment Industries by Sex in Caguas Municipio
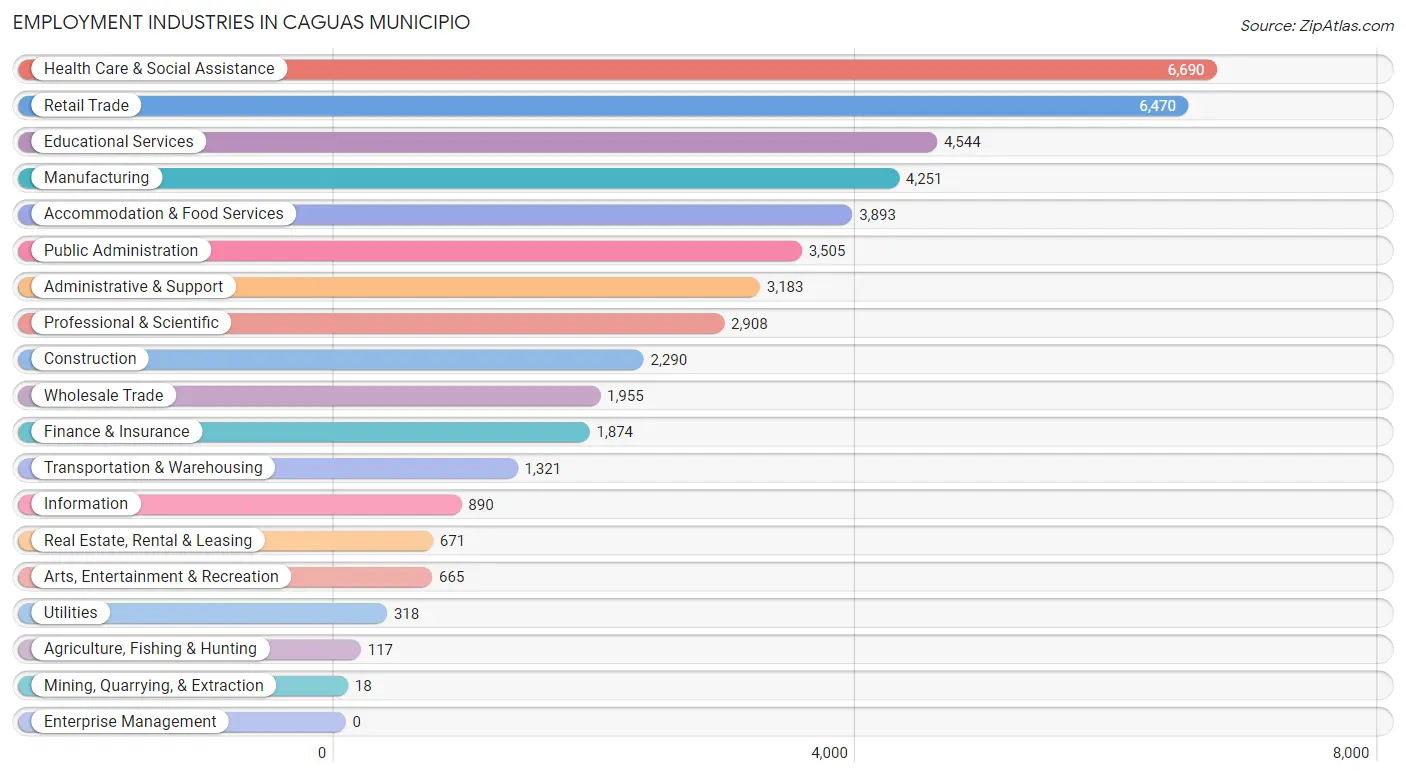
Employment Industries in Caguas Municipio
The major employment industries in Caguas Municipio include Health Care & Social Assistance (6,690 | 14.1%), Retail Trade (6,470 | 13.6%), Educational Services (4,544 | 9.5%), Manufacturing (4,251 | 8.9%), and Accommodation & Food Services (3,893 | 8.2%).
Employment Industries by Sex in Caguas Municipio
The Caguas Municipio industries that see more men than women are Construction (92.9%), Agriculture, Fishing & Hunting (91.4%), and Utilities (84.6%), whereas the industries that tend to have a higher number of women are Mining, Quarrying, & Extraction (100.0%), Educational Services (78.8%), and Health Care & Social Assistance (73.8%).
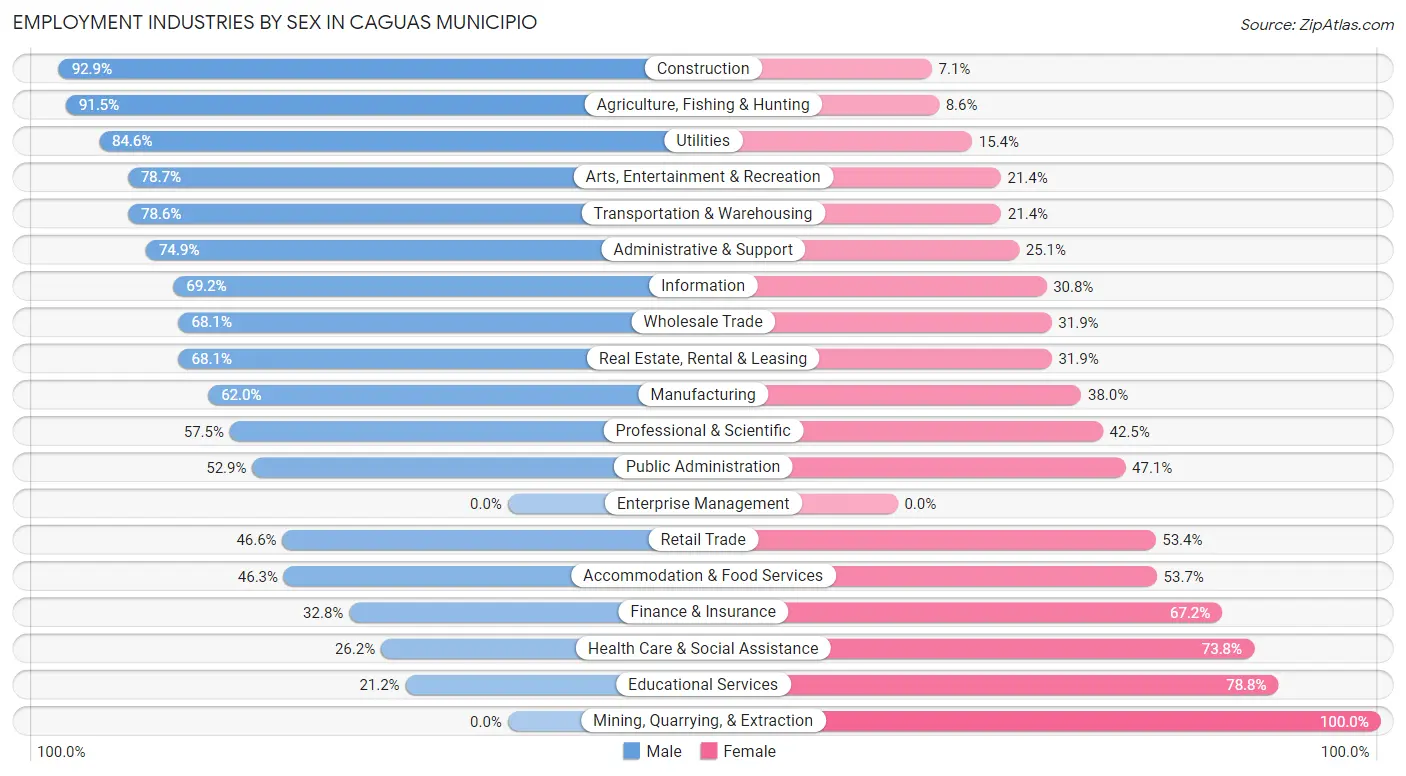
| Industry | Male | Female |
| Agriculture, Fishing & Hunting | 107 (91.4%) | 10 (8.6%) |
| Mining, Quarrying, & Extraction | 0 (0.0%) | 18 (100.0%) |
| Construction | 2,128 (92.9%) | 162 (7.1%) |
| Manufacturing | 2,635 (62.0%) | 1,616 (38.0%) |
| Wholesale Trade | 1,332 (68.1%) | 623 (31.9%) |
| Retail Trade | 3,017 (46.6%) | 3,453 (53.4%) |
| Transportation & Warehousing | 1,038 (78.6%) | 283 (21.4%) |
| Utilities | 269 (84.6%) | 49 (15.4%) |
| Information | 616 (69.2%) | 274 (30.8%) |
| Finance & Insurance | 615 (32.8%) | 1,259 (67.2%) |
| Real Estate, Rental & Leasing | 457 (68.1%) | 214 (31.9%) |
| Professional & Scientific | 1,673 (57.5%) | 1,235 (42.5%) |
| Enterprise Management | 0 (0.0%) | 0 (0.0%) |
| Administrative & Support | 2,383 (74.9%) | 800 (25.1%) |
| Educational Services | 962 (21.2%) | 3,582 (78.8%) |
| Health Care & Social Assistance | 1,755 (26.2%) | 4,935 (73.8%) |
| Arts, Entertainment & Recreation | 523 (78.6%) | 142 (21.3%) |
| Accommodation & Food Services | 1,804 (46.3%) | 2,089 (53.7%) |
| Public Administration | 1,853 (52.9%) | 1,652 (47.1%) |
| Total | 24,374 (51.2%) | 23,237 (48.8%) |
Education in Caguas Municipio
School Enrollment in Caguas Municipio
The most common levels of schooling among the 28,926 students in Caguas Municipio are college / undergraduate (8,213 | 28.4%), high school (5,969 | 20.6%), and middle school (5,467 | 18.9%).
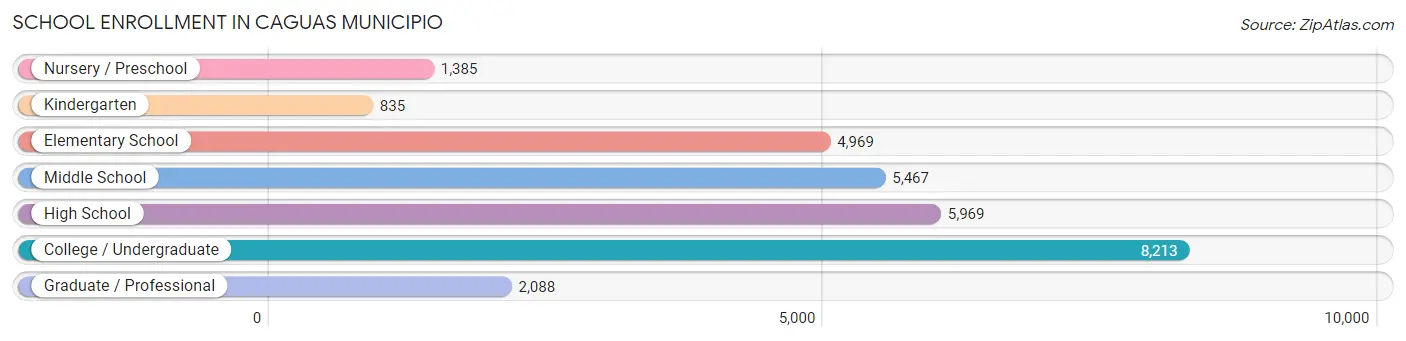
| School Level | # Students | % Students |
| Nursery / Preschool | 1,385 | 4.8% |
| Kindergarten | 835 | 2.9% |
| Elementary School | 4,969 | 17.2% |
| Middle School | 5,467 | 18.9% |
| High School | 5,969 | 20.6% |
| College / Undergraduate | 8,213 | 28.4% |
| Graduate / Professional | 2,088 | 7.2% |
| Total | 28,926 | 100.0% |
School Enrollment by Age by Funding Source in Caguas Municipio
Out of a total of 28,926 students who are enrolled in schools in Caguas Municipio, 14,174 (49.0%) attend a private institution, while the remaining 14,752 (51.0%) are enrolled in public schools. The age group of 25 to 34 year olds has the highest likelihood of being enrolled in private schools, with 2,224 (82.6% in the age bracket) enrolled. Conversely, the age group of 10 to 14 year olds has the lowest likelihood of being enrolled in a private school, with 4,345 (64.3% in the age bracket) attending a public institution.
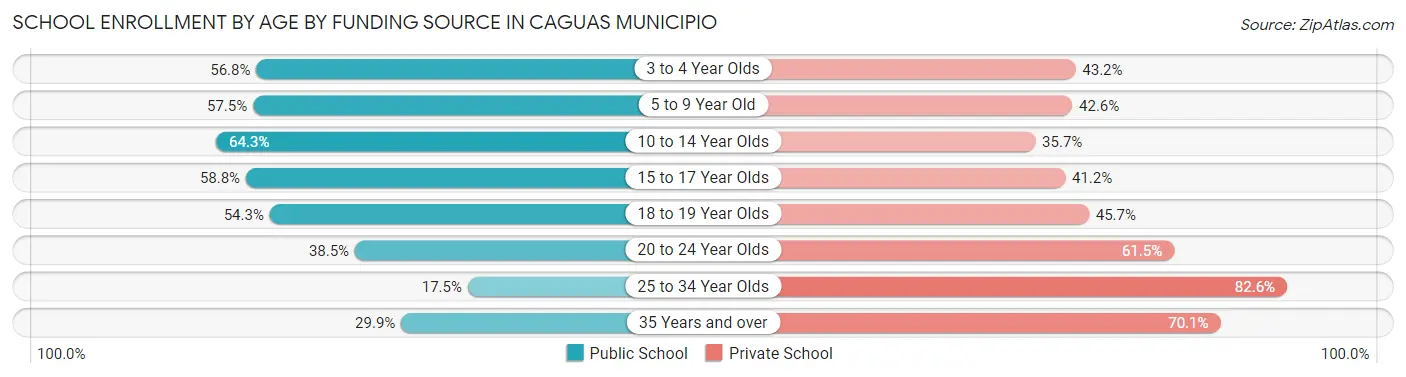
| Age Bracket | Public School | Private School |
| 3 to 4 Year Olds | 648 (56.8%) | 492 (43.2%) |
| 5 to 9 Year Old | 3,155 (57.5%) | 2,337 (42.5%) |
| 10 to 14 Year Olds | 4,345 (64.3%) | 2,409 (35.7%) |
| 15 to 17 Year Olds | 2,687 (58.8%) | 1,885 (41.2%) |
| 18 to 19 Year Olds | 1,389 (54.3%) | 1,167 (45.7%) |
| 20 to 24 Year Olds | 1,575 (38.5%) | 2,519 (61.5%) |
| 25 to 34 Year Olds | 470 (17.4%) | 2,224 (82.6%) |
| 35 Years and over | 485 (29.9%) | 1,139 (70.1%) |
| Total | 14,752 (51.0%) | 14,174 (49.0%) |
Educational Attainment by Field of Study in Caguas Municipio
Business (9,920 | 30.0%), education (4,769 | 14.4%), science & technology (4,075 | 12.3%), physical & health sciences (2,201 | 6.7%), and bio, nature & agricultural (1,963 | 5.9%) are the most common fields of study among 33,077 individuals in Caguas Municipio who have obtained a bachelor's degree or higher.
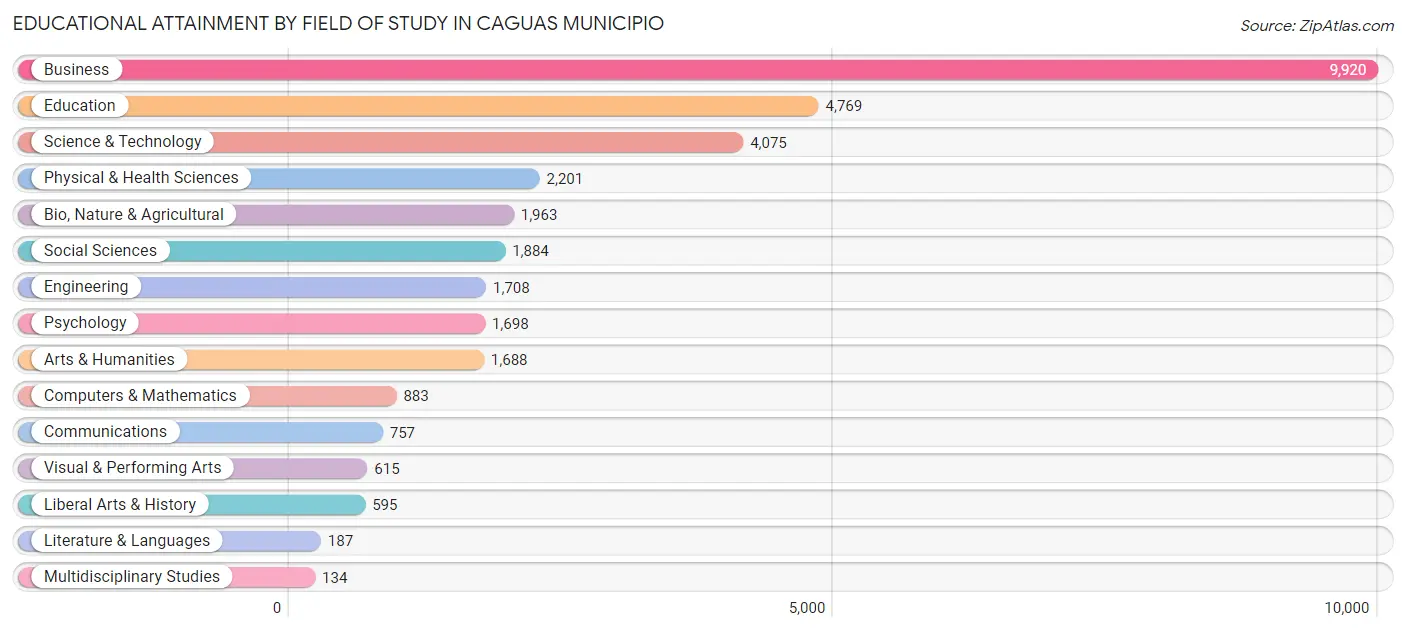
| Field of Study | # Graduates | % Graduates |
| Computers & Mathematics | 883 | 2.7% |
| Bio, Nature & Agricultural | 1,963 | 5.9% |
| Physical & Health Sciences | 2,201 | 6.7% |
| Psychology | 1,698 | 5.1% |
| Social Sciences | 1,884 | 5.7% |
| Engineering | 1,708 | 5.2% |
| Multidisciplinary Studies | 134 | 0.4% |
| Science & Technology | 4,075 | 12.3% |
| Business | 9,920 | 30.0% |
| Education | 4,769 | 14.4% |
| Literature & Languages | 187 | 0.6% |
| Liberal Arts & History | 595 | 1.8% |
| Visual & Performing Arts | 615 | 1.9% |
| Communications | 757 | 2.3% |
| Arts & Humanities | 1,688 | 5.1% |
| Total | 33,077 | 100.0% |
Transportation & Commute in Caguas Municipio
Vehicle Availability by Sex in Caguas Municipio
The most prevalent vehicle ownership categories in Caguas Municipio are males with 2 vehicles (10,208, accounting for 43.4%) and females with 2 vehicles (8,866, making up 47.1%).
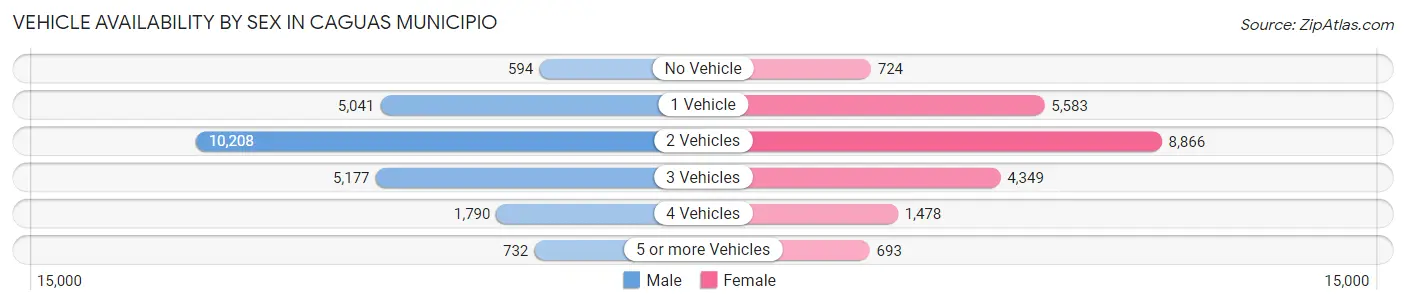
| Vehicles Available | Male | Female |
| No Vehicle | 594 (2.5%) | 724 (3.3%) |
| 1 Vehicle | 5,041 (21.4%) | 5,583 (25.7%) |
| 2 Vehicles | 10,208 (43.4%) | 8,866 (40.9%) |
| 3 Vehicles | 5,177 (22.0%) | 4,349 (20.1%) |
| 4 Vehicles | 1,790 (7.6%) | 1,478 (6.8%) |
| 5 or more Vehicles | 732 (3.1%) | 693 (3.2%) |
| Total | 23,542 (100.0%) | 21,693 (100.0%) |
Commute Time in Caguas Municipio
The most frequently occuring commute durations in Caguas Municipio are 30 to 34 minutes (7,253 commuters, 17.0%), 15 to 19 minutes (6,603 commuters, 15.4%), and 60 to 89 minutes (5,131 commuters, 12.0%).
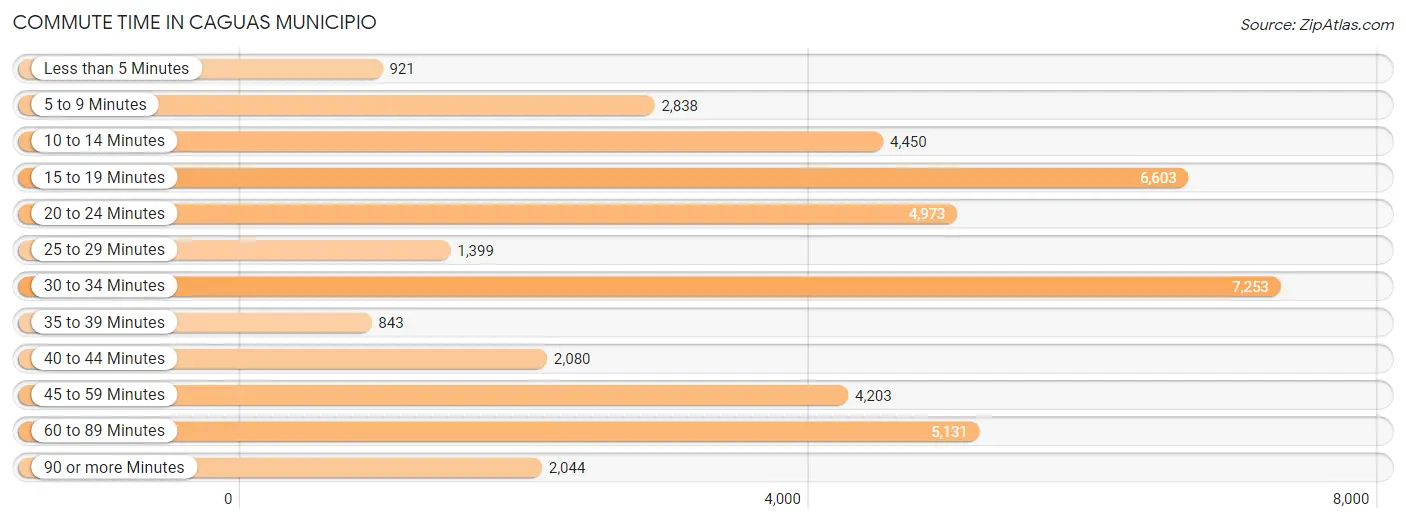
| Commute Time | # Commuters | % Commuters |
| Less than 5 Minutes | 921 | 2.1% |
| 5 to 9 Minutes | 2,838 | 6.6% |
| 10 to 14 Minutes | 4,450 | 10.4% |
| 15 to 19 Minutes | 6,603 | 15.4% |
| 20 to 24 Minutes | 4,973 | 11.6% |
| 25 to 29 Minutes | 1,399 | 3.3% |
| 30 to 34 Minutes | 7,253 | 17.0% |
| 35 to 39 Minutes | 843 | 2.0% |
| 40 to 44 Minutes | 2,080 | 4.9% |
| 45 to 59 Minutes | 4,203 | 9.8% |
| 60 to 89 Minutes | 5,131 | 12.0% |
| 90 or more Minutes | 2,044 | 4.8% |
Commute Time by Sex in Caguas Municipio
The most common commute times in Caguas Municipio are 30 to 34 minutes (4,258 commuters, 19.1%) for males and 15 to 19 minutes (3,552 commuters, 17.3%) for females.
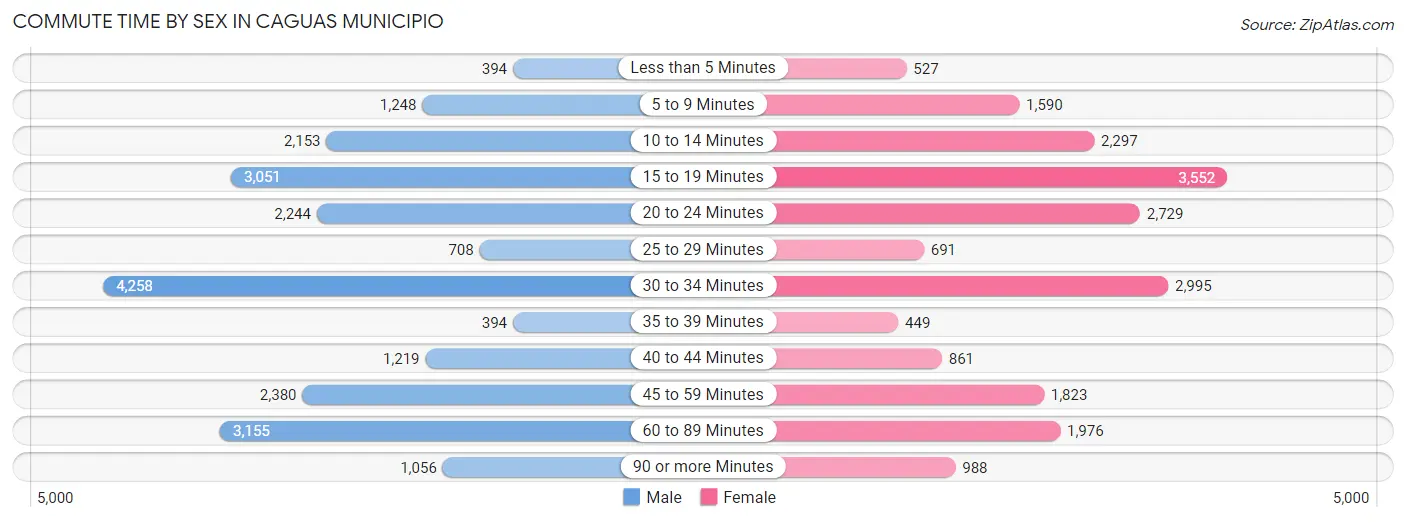
| Commute Time | Male | Female |
| Less than 5 Minutes | 394 (1.8%) | 527 (2.6%) |
| 5 to 9 Minutes | 1,248 (5.6%) | 1,590 (7.8%) |
| 10 to 14 Minutes | 2,153 (9.7%) | 2,297 (11.2%) |
| 15 to 19 Minutes | 3,051 (13.7%) | 3,552 (17.3%) |
| 20 to 24 Minutes | 2,244 (10.1%) | 2,729 (13.3%) |
| 25 to 29 Minutes | 708 (3.2%) | 691 (3.4%) |
| 30 to 34 Minutes | 4,258 (19.1%) | 2,995 (14.6%) |
| 35 to 39 Minutes | 394 (1.8%) | 449 (2.2%) |
| 40 to 44 Minutes | 1,219 (5.5%) | 861 (4.2%) |
| 45 to 59 Minutes | 2,380 (10.7%) | 1,823 (8.9%) |
| 60 to 89 Minutes | 3,155 (14.2%) | 1,976 (9.7%) |
| 90 or more Minutes | 1,056 (4.7%) | 988 (4.8%) |
Time of Departure to Work by Sex in Caguas Municipio
The most frequent times of departure to work in Caguas Municipio are 7:00 AM to 7:29 AM (4,010, 18.0%) for males and 7:00 AM to 7:29 AM (3,891, 19.0%) for females.
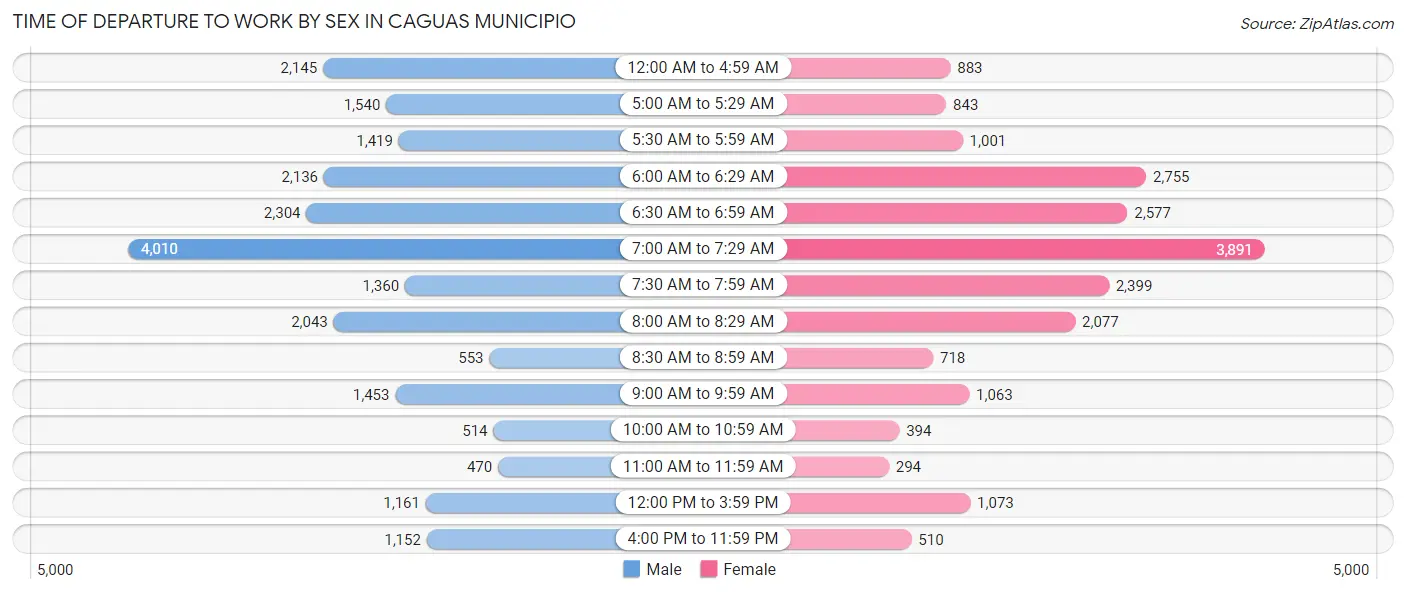
| Time of Departure | Male | Female |
| 12:00 AM to 4:59 AM | 2,145 (9.6%) | 883 (4.3%) |
| 5:00 AM to 5:29 AM | 1,540 (6.9%) | 843 (4.1%) |
| 5:30 AM to 5:59 AM | 1,419 (6.4%) | 1,001 (4.9%) |
| 6:00 AM to 6:29 AM | 2,136 (9.6%) | 2,755 (13.5%) |
| 6:30 AM to 6:59 AM | 2,304 (10.3%) | 2,577 (12.6%) |
| 7:00 AM to 7:29 AM | 4,010 (18.0%) | 3,891 (19.0%) |
| 7:30 AM to 7:59 AM | 1,360 (6.1%) | 2,399 (11.7%) |
| 8:00 AM to 8:29 AM | 2,043 (9.2%) | 2,077 (10.1%) |
| 8:30 AM to 8:59 AM | 553 (2.5%) | 718 (3.5%) |
| 9:00 AM to 9:59 AM | 1,453 (6.5%) | 1,063 (5.2%) |
| 10:00 AM to 10:59 AM | 514 (2.3%) | 394 (1.9%) |
| 11:00 AM to 11:59 AM | 470 (2.1%) | 294 (1.4%) |
| 12:00 PM to 3:59 PM | 1,161 (5.2%) | 1,073 (5.2%) |
| 4:00 PM to 11:59 PM | 1,152 (5.2%) | 510 (2.5%) |
| Total | 22,260 (100.0%) | 20,478 (100.0%) |
Housing Occupancy in Caguas Municipio
Occupancy by Ownership in Caguas Municipio
Of the total 49,645 dwellings in Caguas Municipio, owner-occupied units account for 33,126 (66.7%), while renter-occupied units make up 16,519 (33.3%).
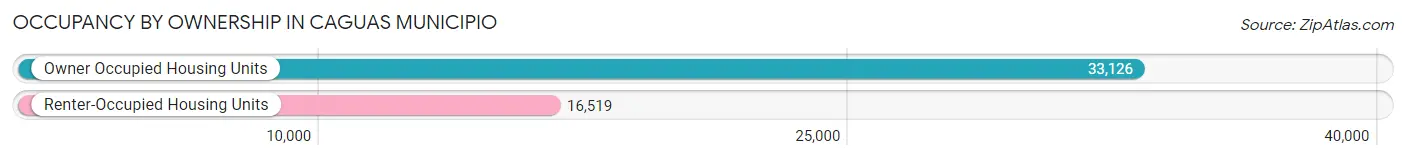
| Occupancy | # Housing Units | % Housing Units |
| Owner Occupied Housing Units | 33,126 | 66.7% |
| Renter-Occupied Housing Units | 16,519 | 33.3% |
| Total Occupied Housing Units | 49,645 | 100.0% |
Occupancy by Household Size in Caguas Municipio
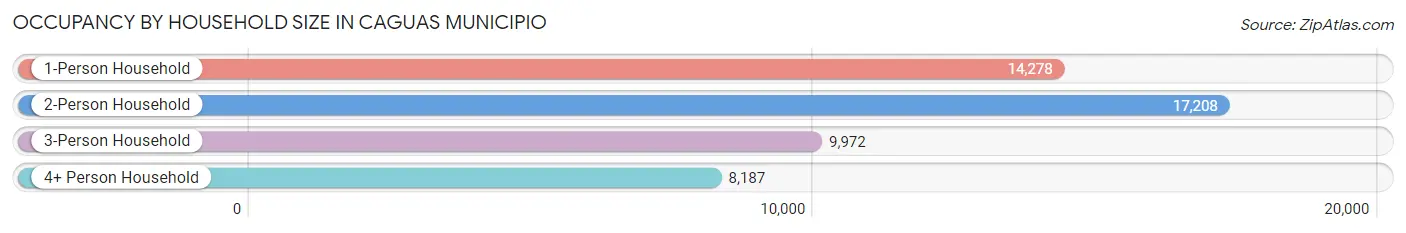
| Household Size | # Housing Units | % Housing Units |
| 1-Person Household | 14,278 | 28.8% |
| 2-Person Household | 17,208 | 34.7% |
| 3-Person Household | 9,972 | 20.1% |
| 4+ Person Household | 8,187 | 16.5% |
| Total Housing Units | 49,645 | 100.0% |
Occupancy by Ownership by Household Size in Caguas Municipio
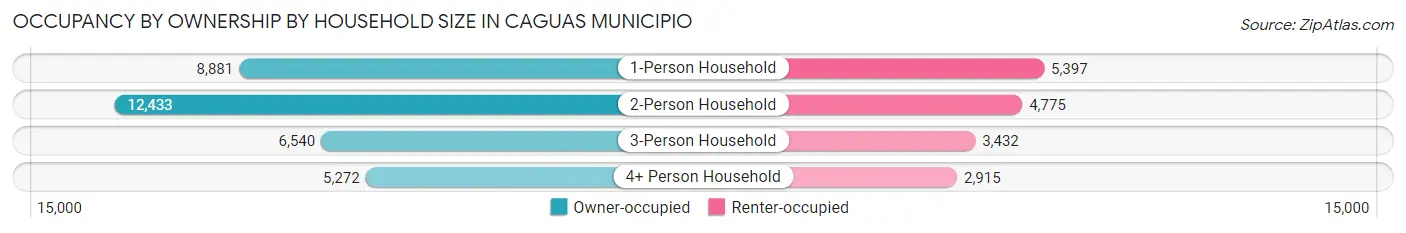
| Household Size | Owner-occupied | Renter-occupied |
| 1-Person Household | 8,881 (62.2%) | 5,397 (37.8%) |
| 2-Person Household | 12,433 (72.3%) | 4,775 (27.8%) |
| 3-Person Household | 6,540 (65.6%) | 3,432 (34.4%) |
| 4+ Person Household | 5,272 (64.4%) | 2,915 (35.6%) |
| Total Housing Units | 33,126 (66.7%) | 16,519 (33.3%) |
Occupancy by Educational Attainment in Caguas Municipio
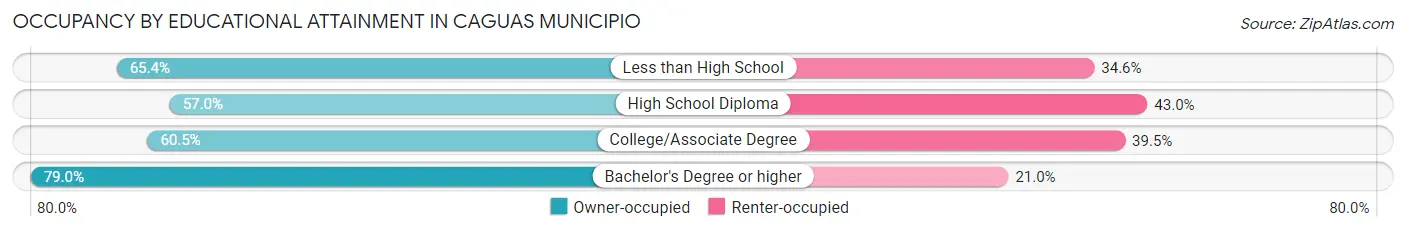
| Household Size | Owner-occupied | Renter-occupied |
| Less than High School | 4,981 (65.4%) | 2,636 (34.6%) |
| High School Diploma | 7,482 (57.0%) | 5,650 (43.0%) |
| College/Associate Degree | 7,099 (60.5%) | 4,632 (39.5%) |
| Bachelor's Degree or higher | 13,564 (79.0%) | 3,601 (21.0%) |
Occupancy by Age of Householder in Caguas Municipio
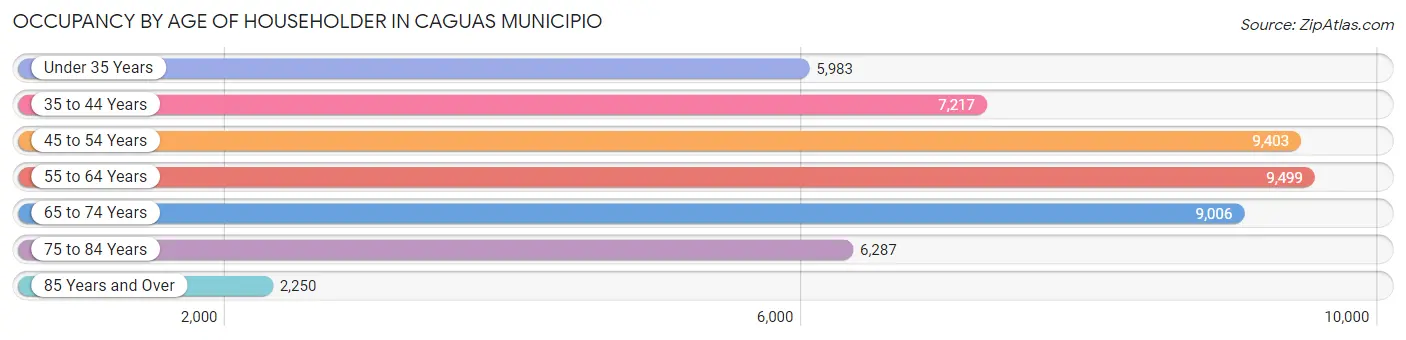
| Age Bracket | # Households | % Households |
| Under 35 Years | 5,983 | 12.0% |
| 35 to 44 Years | 7,217 | 14.5% |
| 45 to 54 Years | 9,403 | 18.9% |
| 55 to 64 Years | 9,499 | 19.1% |
| 65 to 74 Years | 9,006 | 18.1% |
| 75 to 84 Years | 6,287 | 12.7% |
| 85 Years and Over | 2,250 | 4.5% |
| Total | 49,645 | 100.0% |
Housing Finances in Caguas Municipio
Median Income by Occupancy in Caguas Municipio
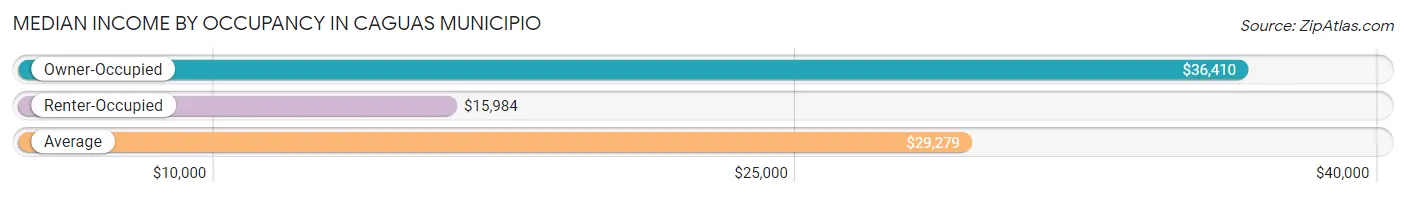
| Occupancy Type | # Households | Median Income |
| Owner-Occupied | 33,126 (66.7%) | $36,410 |
| Renter-Occupied | 16,519 (33.3%) | $15,984 |
| Average | 49,645 (100.0%) | $29,279 |
Occupancy by Householder Income Bracket in Caguas Municipio
| Income Bracket | Owner-occupied | Renter-occupied |
| Less than $5,000 | 1,738 (5.2%) | 3,291 (19.9%) |
| $5,000 to $9,999 | 2,125 (6.4%) | 2,118 (12.8%) |
| $10,000 to $14,999 | 2,513 (7.6%) | 2,464 (14.9%) |
| $15,000 to $19,999 | 2,704 (8.2%) | 1,630 (9.9%) |
| $20,000 to $24,999 | 2,499 (7.5%) | 1,362 (8.3%) |
| $25,000 to $34,999 | 4,339 (13.1%) | 1,876 (11.4%) |
| $35,000 to $49,999 | 4,963 (15.0%) | 1,400 (8.5%) |
| $50,000 to $74,999 | 5,224 (15.8%) | 1,362 (8.3%) |
| $75,000 to $99,999 | 2,913 (8.8%) | 443 (2.7%) |
| $100,000 to $149,999 | 2,165 (6.5%) | 455 (2.8%) |
| $150,000 or more | 1,943 (5.9%) | 118 (0.7%) |
| Total | 33,126 (100.0%) | 16,519 (100.0%) |
Monthly Housing Cost Tiers in Caguas Municipio
| Monthly Cost | Owner-occupied | Renter-occupied |
| Less than $300 | 12,960 (39.1%) | 1,854 (11.2%) |
| $300 to $499 | 3,404 (10.3%) | 1,800 (10.9%) |
| $500 to $799 | 4,573 (13.8%) | 3,607 (21.8%) |
| $800 to $999 | 4,090 (12.3%) | 2,065 (12.5%) |
| $1,000 to $1,499 | 5,017 (15.1%) | 900 (5.4%) |
| $1,500 to $1,999 | 1,277 (3.8%) | 263 (1.6%) |
| $2,000 to $2,499 | 755 (2.3%) | 37 (0.2%) |
| $2,500 to $2,999 | 551 (1.7%) | 0 (0.0%) |
| $3,000 or more | 499 (1.5%) | 69 (0.4%) |
| Total | 33,126 (100.0%) | 16,519 (100.0%) |
Physical Housing Characteristics in Caguas Municipio
Housing Structures in Caguas Municipio
| Structure Type | # Housing Units | % Housing Units |
| Single Unit, Detached | 33,444 | 67.4% |
| Single Unit, Attached | 5,604 | 11.3% |
| 2 Unit Apartments | 2,836 | 5.7% |
| 3 or 4 Unit Apartments | 1,807 | 3.6% |
| 5 to 9 Unit Apartments | 2,735 | 5.5% |
| 10 or more Apartments | 3,159 | 6.4% |
| Mobile Home / Other | 60 | 0.1% |
| Total | 49,645 | 100.0% |
Housing Structures by Occupancy in Caguas Municipio
| Structure Type | Owner-occupied | Renter-occupied |
| Single Unit, Detached | 26,328 (78.7%) | 7,116 (21.3%) |
| Single Unit, Attached | 3,299 (58.9%) | 2,305 (41.1%) |
| 2 Unit Apartments | 1,055 (37.2%) | 1,781 (62.8%) |
| 3 or 4 Unit Apartments | 256 (14.2%) | 1,551 (85.8%) |
| 5 to 9 Unit Apartments | 1,156 (42.3%) | 1,579 (57.7%) |
| 10 or more Apartments | 981 (31.0%) | 2,178 (69.0%) |
| Mobile Home / Other | 51 (85.0%) | 9 (15.0%) |
| Total | 33,126 (66.7%) | 16,519 (33.3%) |
Housing Structures by Number of Rooms in Caguas Municipio
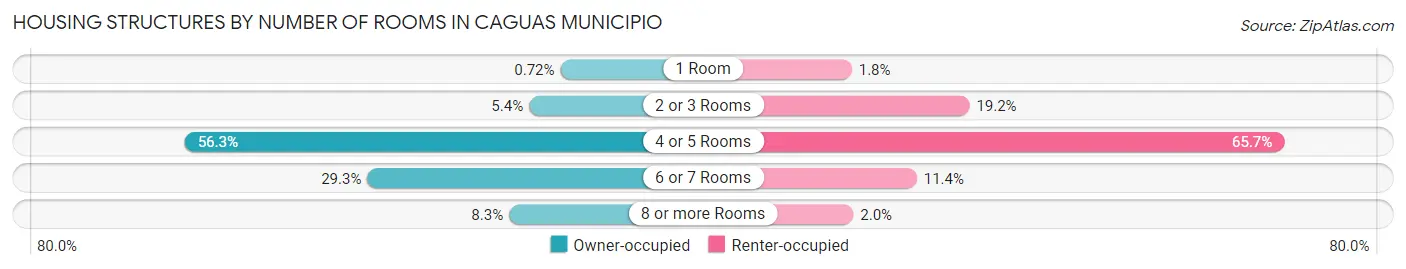
| Number of Rooms | Owner-occupied | Renter-occupied |
| 1 Room | 238 (0.7%) | 290 (1.8%) |
| 2 or 3 Rooms | 1,774 (5.4%) | 3,166 (19.2%) |
| 4 or 5 Rooms | 18,651 (56.3%) | 10,856 (65.7%) |
| 6 or 7 Rooms | 9,706 (29.3%) | 1,879 (11.4%) |
| 8 or more Rooms | 2,757 (8.3%) | 328 (2.0%) |
| Total | 33,126 (100.0%) | 16,519 (100.0%) |
Housing Structure by Heating Type in Caguas Municipio
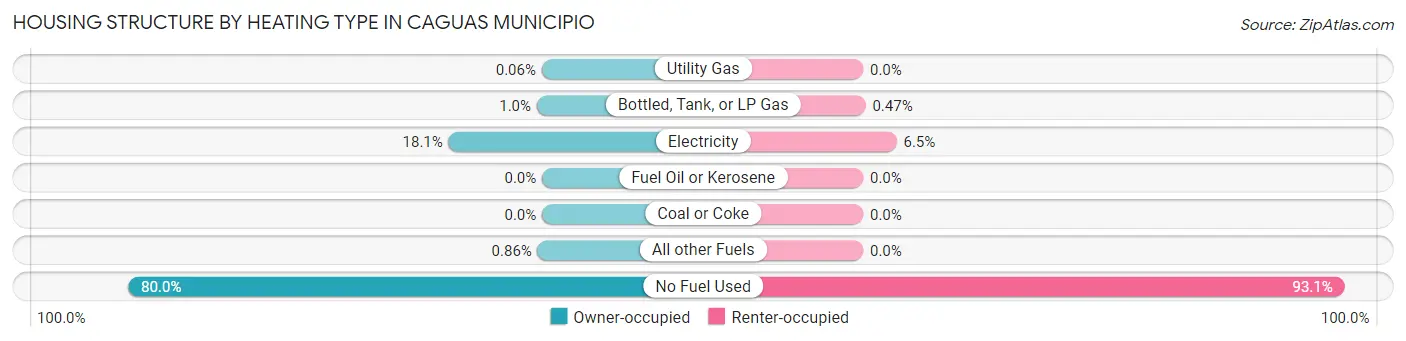
| Heating Type | Owner-occupied | Renter-occupied |
| Utility Gas | 19 (0.1%) | 0 (0.0%) |
| Bottled, Tank, or LP Gas | 336 (1.0%) | 78 (0.5%) |
| Electricity | 5,981 (18.1%) | 1,069 (6.5%) |
| Fuel Oil or Kerosene | 0 (0.0%) | 0 (0.0%) |
| Coal or Coke | 0 (0.0%) | 0 (0.0%) |
| All other Fuels | 286 (0.9%) | 0 (0.0%) |
| No Fuel Used | 26,504 (80.0%) | 15,372 (93.1%) |
| Total | 33,126 (100.0%) | 16,519 (100.0%) |
Household Vehicle Usage in Caguas Municipio
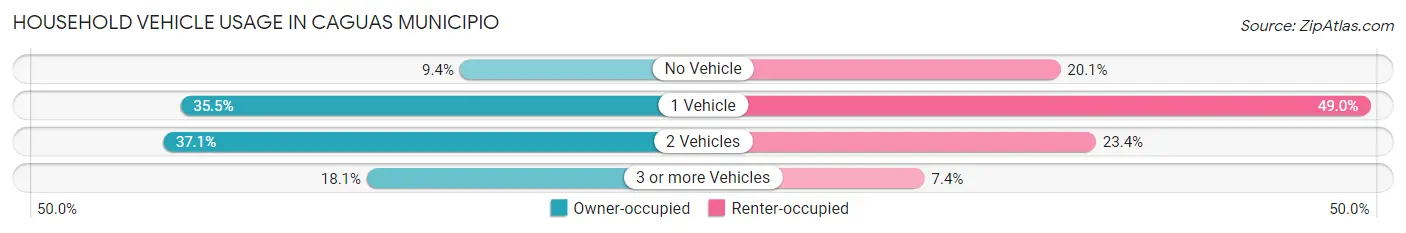
| Vehicles per Household | Owner-occupied | Renter-occupied |
| No Vehicle | 3,108 (9.4%) | 3,322 (20.1%) |
| 1 Vehicle | 11,748 (35.5%) | 8,097 (49.0%) |
| 2 Vehicles | 12,291 (37.1%) | 3,871 (23.4%) |
| 3 or more Vehicles | 5,979 (18.0%) | 1,229 (7.4%) |
| Total | 33,126 (100.0%) | 16,519 (100.0%) |
Real Estate & Mortgages in Caguas Municipio
Real Estate and Mortgage Overview in Caguas Municipio
| Characteristic | Without Mortgage | With Mortgage |
| Housing Units | 16,787 | 16,339 |
| Median Property Value | $128,900 | $148,300 |
| Median Household Income | $26,752 | $1,426 |
| Monthly Housing Costs | $177 | $489 |
| Real Estate Taxes | $638 | $12,812 |
Property Value by Mortgage Status in Caguas Municipio
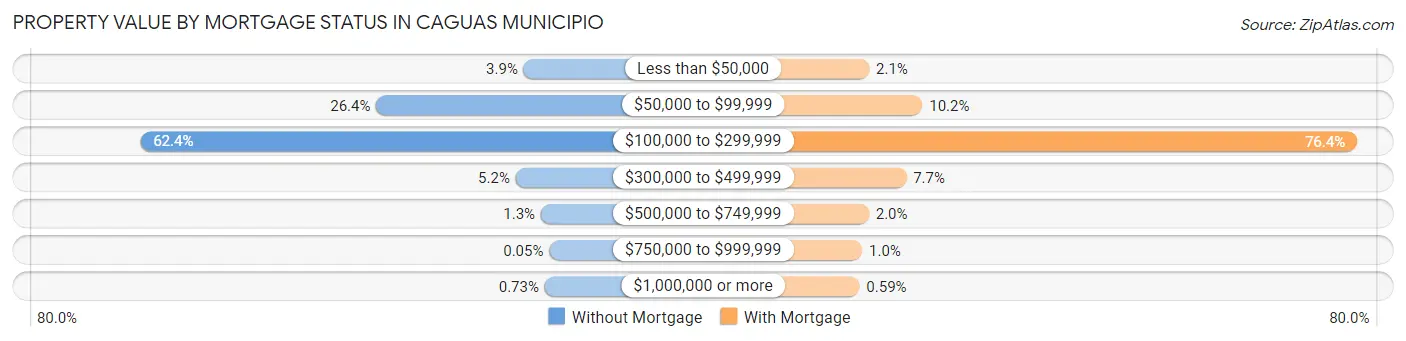
| Property Value | Without Mortgage | With Mortgage |
| Less than $50,000 | 662 (3.9%) | 336 (2.1%) |
| $50,000 to $99,999 | 4,434 (26.4%) | 1,662 (10.2%) |
| $100,000 to $299,999 | 10,472 (62.4%) | 12,490 (76.4%) |
| $300,000 to $499,999 | 866 (5.2%) | 1,261 (7.7%) |
| $500,000 to $749,999 | 222 (1.3%) | 330 (2.0%) |
| $750,000 to $999,999 | 9 (0.1%) | 164 (1.0%) |
| $1,000,000 or more | 122 (0.7%) | 96 (0.6%) |
| Total | 16,787 (100.0%) | 16,339 (100.0%) |
Household Income by Mortgage Status in Caguas Municipio
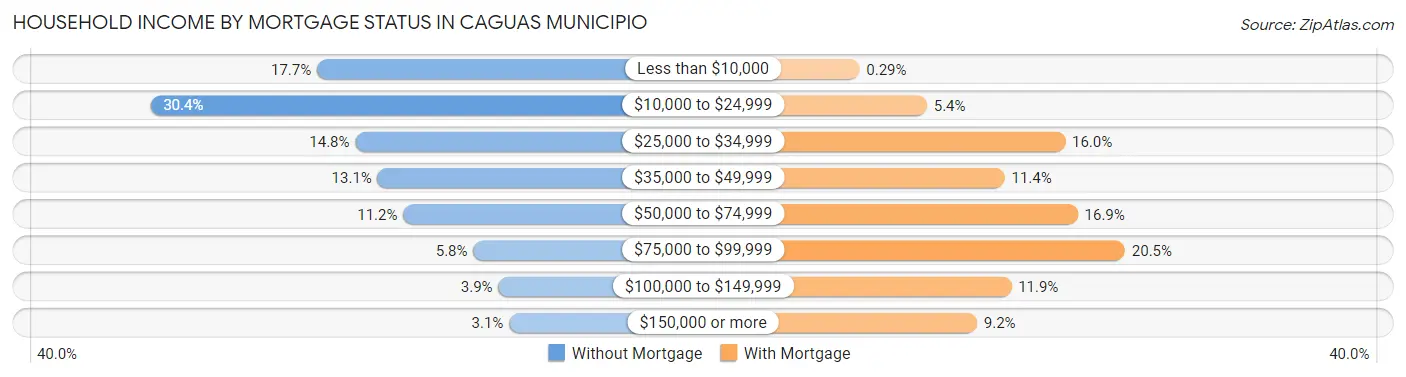
| Household Income | Without Mortgage | With Mortgage |
| Less than $10,000 | 2,975 (17.7%) | 48 (0.3%) |
| $10,000 to $24,999 | 5,108 (30.4%) | 888 (5.4%) |
| $25,000 to $34,999 | 2,485 (14.8%) | 2,608 (16.0%) |
| $35,000 to $49,999 | 2,199 (13.1%) | 1,854 (11.4%) |
| $50,000 to $74,999 | 1,872 (11.2%) | 2,764 (16.9%) |
| $75,000 to $99,999 | 976 (5.8%) | 3,352 (20.5%) |
| $100,000 to $149,999 | 655 (3.9%) | 1,937 (11.9%) |
| $150,000 or more | 517 (3.1%) | 1,510 (9.2%) |
| Total | 16,787 (100.0%) | 16,339 (100.0%) |
Property Value to Household Income Ratio in Caguas Municipio
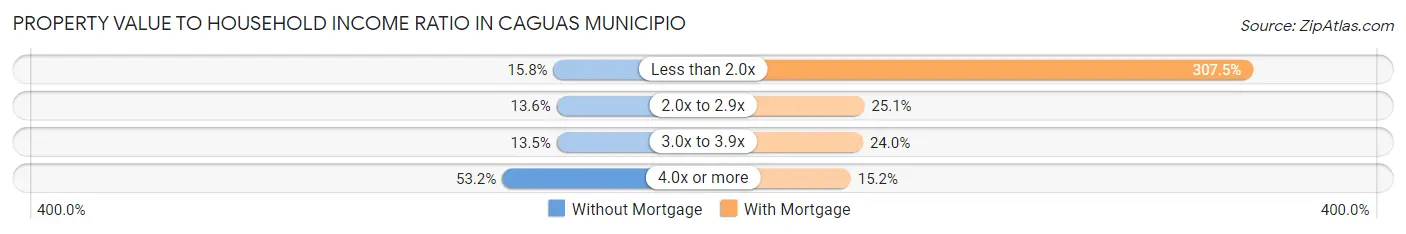
| Value-to-Income Ratio | Without Mortgage | With Mortgage |
| Less than 2.0x | 2,657 (15.8%) | 50,238 (307.5%) |
| 2.0x to 2.9x | 2,274 (13.6%) | 4,100 (25.1%) |
| 3.0x to 3.9x | 2,269 (13.5%) | 3,926 (24.0%) |
| 4.0x or more | 8,926 (53.2%) | 2,482 (15.2%) |
| Total | 16,787 (100.0%) | 16,339 (100.0%) |
Real Estate Taxes by Mortgage Status in Caguas Municipio
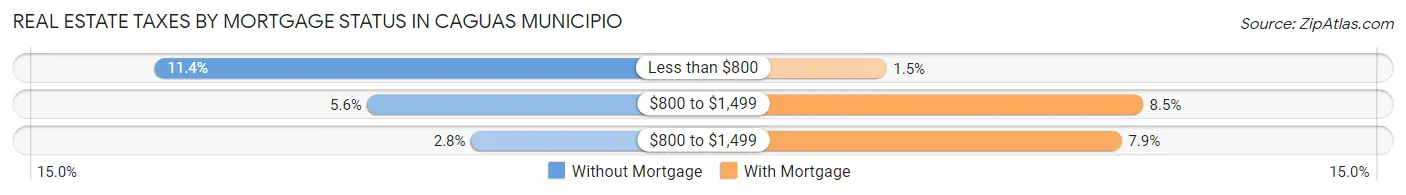
| Property Taxes | Without Mortgage | With Mortgage |
| Less than $800 | 1,920 (11.4%) | 239 (1.5%) |
| $800 to $1,499 | 940 (5.6%) | 1,385 (8.5%) |
| $800 to $1,499 | 463 (2.8%) | 1,291 (7.9%) |
| Total | 16,787 (100.0%) | 16,339 (100.0%) |
Health & Disability in Caguas Municipio
Health Insurance Coverage by Age in Caguas Municipio
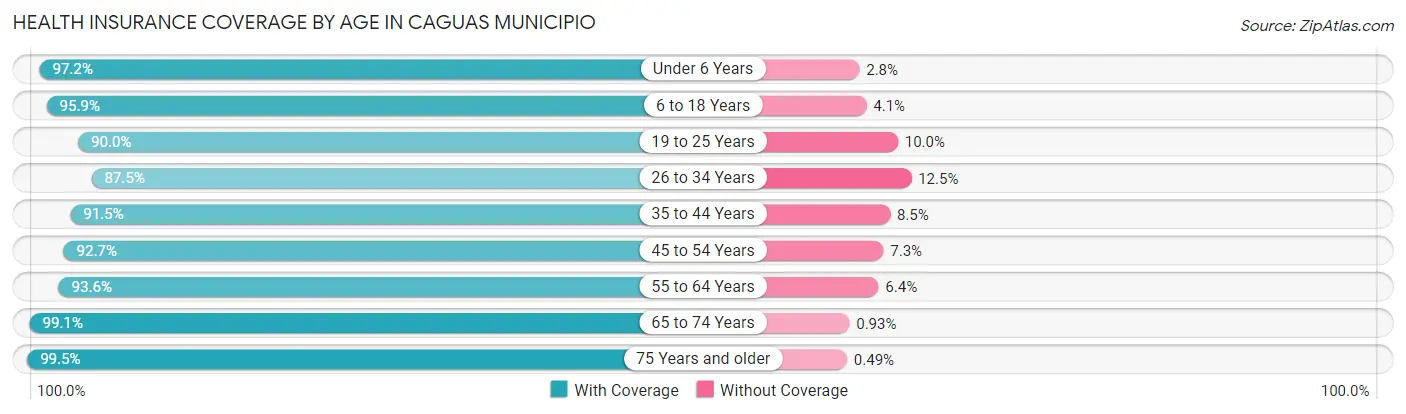
| Age Bracket | With Coverage | Without Coverage |
| Under 6 Years | 5,157 (97.2%) | 148 (2.8%) |
| 6 to 18 Years | 17,436 (95.9%) | 747 (4.1%) |
| 19 to 25 Years | 10,700 (90.0%) | 1,186 (10.0%) |
| 26 to 34 Years | 12,690 (87.5%) | 1,809 (12.5%) |
| 35 to 44 Years | 14,404 (91.5%) | 1,342 (8.5%) |
| 45 to 54 Years | 15,636 (92.7%) | 1,227 (7.3%) |
| 55 to 64 Years | 15,654 (93.6%) | 1,063 (6.4%) |
| 65 to 74 Years | 13,809 (99.1%) | 129 (0.9%) |
| 75 Years and older | 12,892 (99.5%) | 63 (0.5%) |
| Total | 118,378 (93.9%) | 7,714 (6.1%) |
Health Insurance Coverage by Citizenship Status in Caguas Municipio
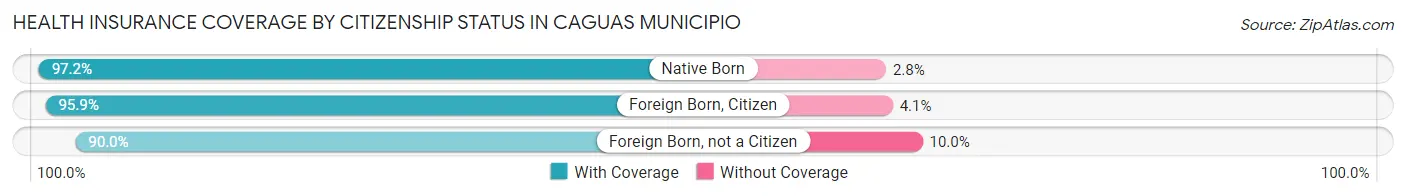
| Citizenship Status | With Coverage | Without Coverage |
| Native Born | 5,157 (97.2%) | 148 (2.8%) |
| Foreign Born, Citizen | 17,436 (95.9%) | 747 (4.1%) |
| Foreign Born, not a Citizen | 10,700 (90.0%) | 1,186 (10.0%) |
Health Insurance Coverage by Household Income in Caguas Municipio
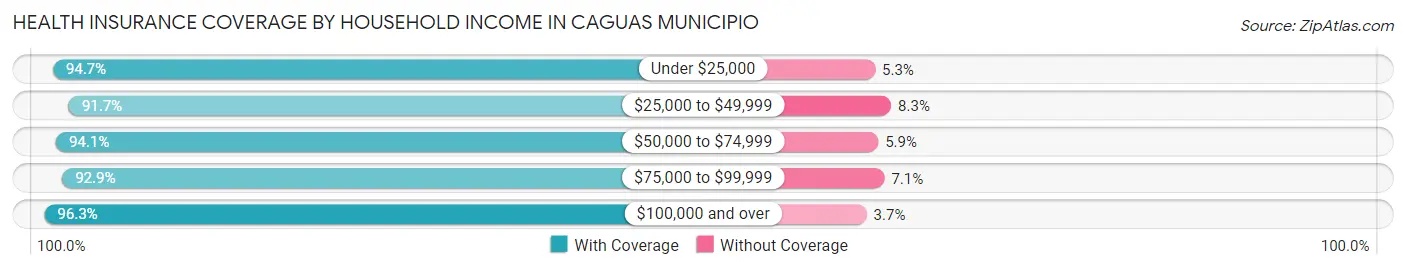
| Household Income | With Coverage | Without Coverage |
| Under $25,000 | 44,451 (94.7%) | 2,489 (5.3%) |
| $25,000 to $49,999 | 30,007 (91.7%) | 2,720 (8.3%) |
| $50,000 to $74,999 | 18,333 (94.1%) | 1,148 (5.9%) |
| $75,000 to $99,999 | 9,993 (92.9%) | 759 (7.1%) |
| $100,000 and over | 15,003 (96.3%) | 580 (3.7%) |
Public vs Private Health Insurance Coverage by Age in Caguas Municipio
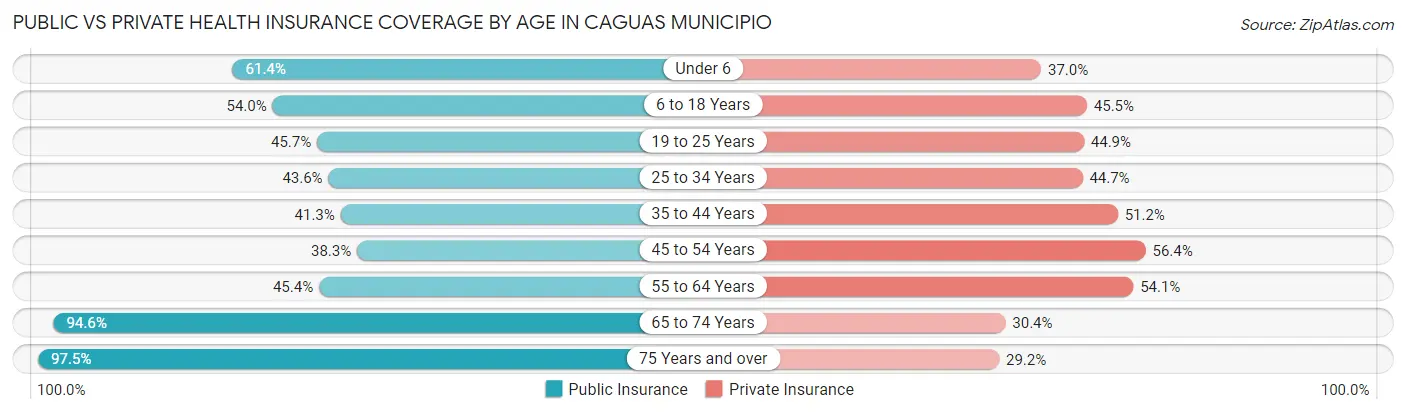
| Age Bracket | Public Insurance | Private Insurance |
| Under 6 | 3,256 (61.4%) | 1,962 (37.0%) |
| 6 to 18 Years | 9,813 (54.0%) | 8,272 (45.5%) |
| 19 to 25 Years | 5,434 (45.7%) | 5,340 (44.9%) |
| 25 to 34 Years | 6,321 (43.6%) | 6,476 (44.7%) |
| 35 to 44 Years | 6,509 (41.3%) | 8,063 (51.2%) |
| 45 to 54 Years | 6,458 (38.3%) | 9,507 (56.4%) |
| 55 to 64 Years | 7,583 (45.4%) | 9,043 (54.1%) |
| 65 to 74 Years | 13,189 (94.6%) | 4,232 (30.4%) |
| 75 Years and over | 12,633 (97.5%) | 3,782 (29.2%) |
| Total | 71,196 (56.5%) | 56,677 (45.0%) |
Disability Status by Sex by Age in Caguas Municipio
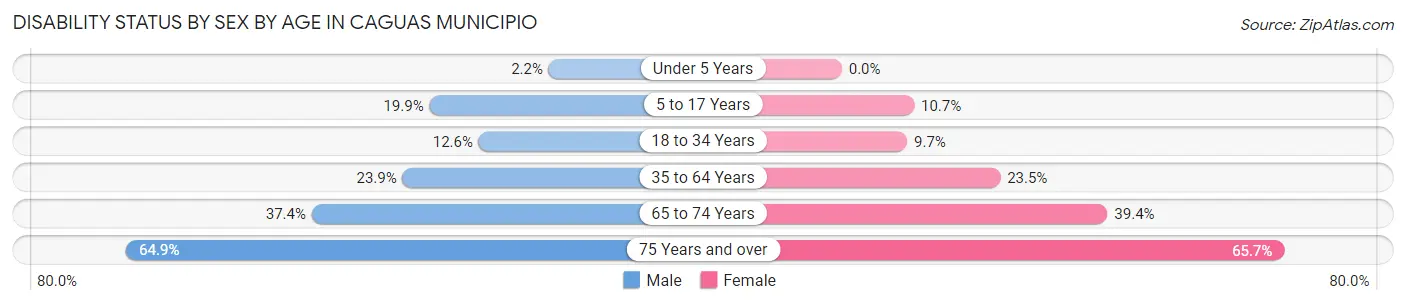
| Age Bracket | Male | Female |
| Under 5 Years | 46 (2.2%) | 0 (0.0%) |
| 5 to 17 Years | 1,752 (19.9%) | 924 (10.7%) |
| 18 to 34 Years | 1,724 (12.6%) | 1,405 (9.7%) |
| 35 to 64 Years | 5,429 (23.9%) | 6,254 (23.5%) |
| 65 to 74 Years | 2,223 (37.3%) | 3,150 (39.4%) |
| 75 Years and over | 3,187 (64.9%) | 5,286 (65.7%) |
Disability Class by Sex by Age in Caguas Municipio
Disability Class: Hearing Difficulty
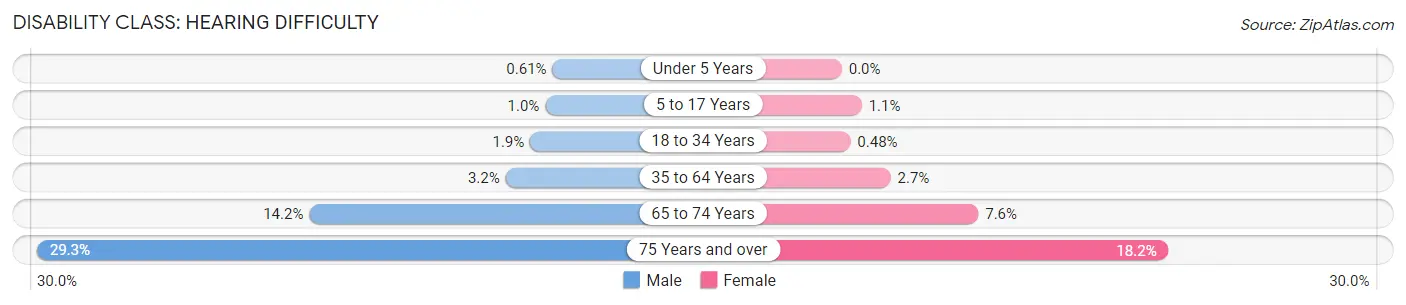
| Age Bracket | Male | Female |
| Under 5 Years | 13 (0.6%) | 0 (0.0%) |
| 5 to 17 Years | 89 (1.0%) | 96 (1.1%) |
| 18 to 34 Years | 254 (1.8%) | 70 (0.5%) |
| 35 to 64 Years | 732 (3.2%) | 722 (2.7%) |
| 65 to 74 Years | 842 (14.1%) | 607 (7.6%) |
| 75 Years and over | 1,439 (29.3%) | 1,464 (18.2%) |
Disability Class: Vision Difficulty
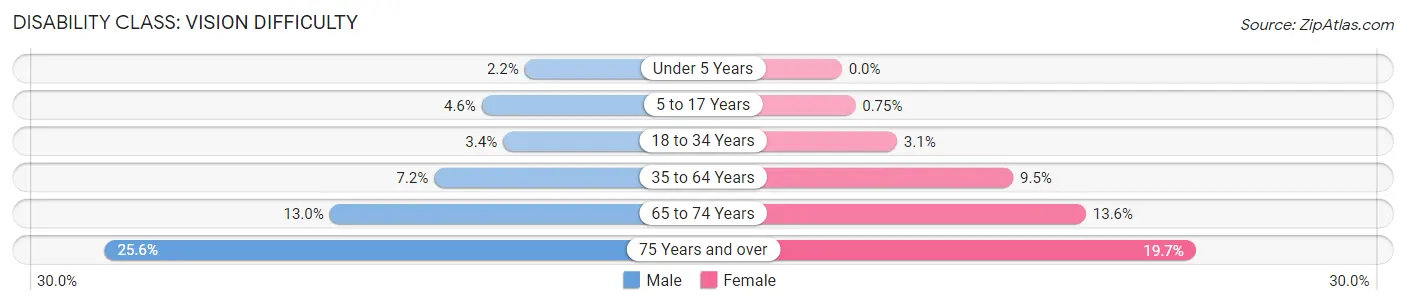
| Age Bracket | Male | Female |
| Under 5 Years | 46 (2.2%) | 0 (0.0%) |
| 5 to 17 Years | 401 (4.5%) | 65 (0.7%) |
| 18 to 34 Years | 462 (3.4%) | 445 (3.1%) |
| 35 to 64 Years | 1,638 (7.2%) | 2,538 (9.5%) |
| 65 to 74 Years | 775 (13.0%) | 1,085 (13.6%) |
| 75 Years and over | 1,254 (25.6%) | 1,585 (19.7%) |
Disability Class: Cognitive Difficulty
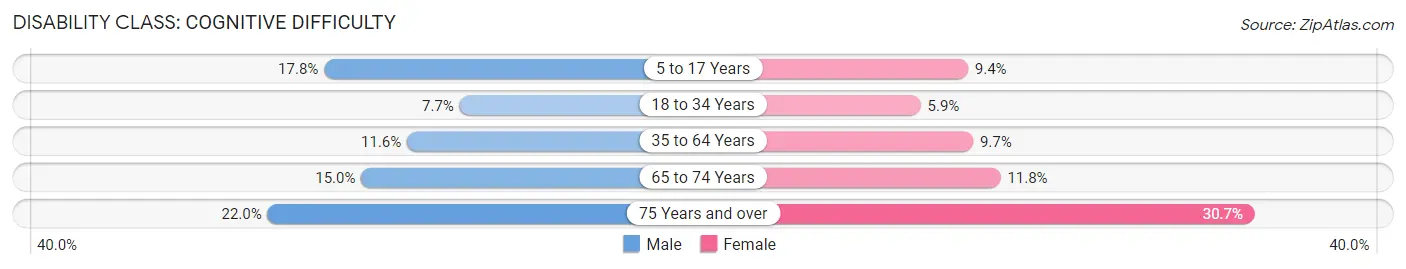
| Age Bracket | Male | Female |
| 5 to 17 Years | 1,565 (17.8%) | 806 (9.4%) |
| 18 to 34 Years | 1,057 (7.7%) | 847 (5.9%) |
| 35 to 64 Years | 2,638 (11.6%) | 2,589 (9.7%) |
| 65 to 74 Years | 893 (15.0%) | 941 (11.8%) |
| 75 Years and over | 1,078 (22.0%) | 2,467 (30.7%) |
Disability Class: Ambulatory Difficulty
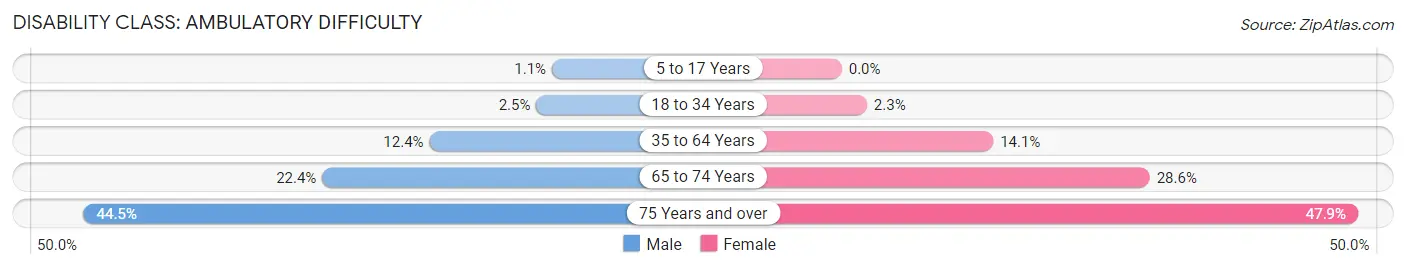
| Age Bracket | Male | Female |
| 5 to 17 Years | 93 (1.1%) | 0 (0.0%) |
| 18 to 34 Years | 345 (2.5%) | 337 (2.3%) |
| 35 to 64 Years | 2,826 (12.4%) | 3,735 (14.1%) |
| 65 to 74 Years | 1,332 (22.4%) | 2,282 (28.6%) |
| 75 Years and over | 2,185 (44.5%) | 3,854 (47.9%) |
Disability Class: Self-Care Difficulty
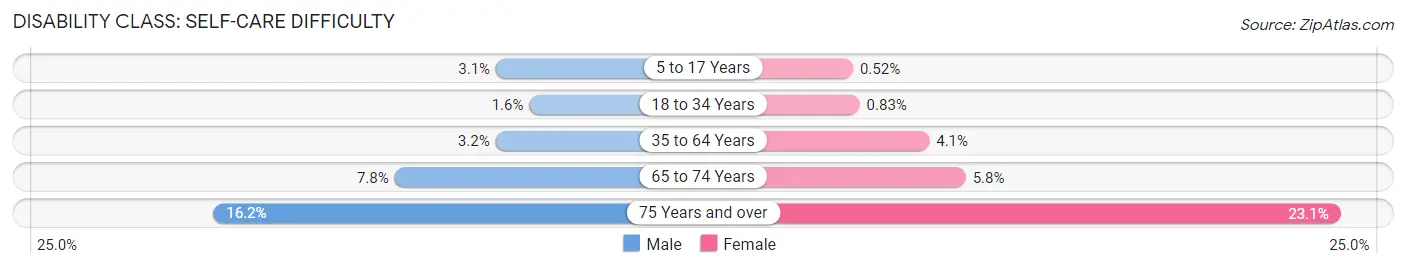
| Age Bracket | Male | Female |
| 5 to 17 Years | 276 (3.1%) | 45 (0.5%) |
| 18 to 34 Years | 217 (1.6%) | 120 (0.8%) |
| 35 to 64 Years | 717 (3.2%) | 1,079 (4.1%) |
| 65 to 74 Years | 466 (7.8%) | 459 (5.8%) |
| 75 Years and over | 797 (16.2%) | 1,862 (23.1%) |
Technology Access in Caguas Municipio
Computing Device Access in Caguas Municipio
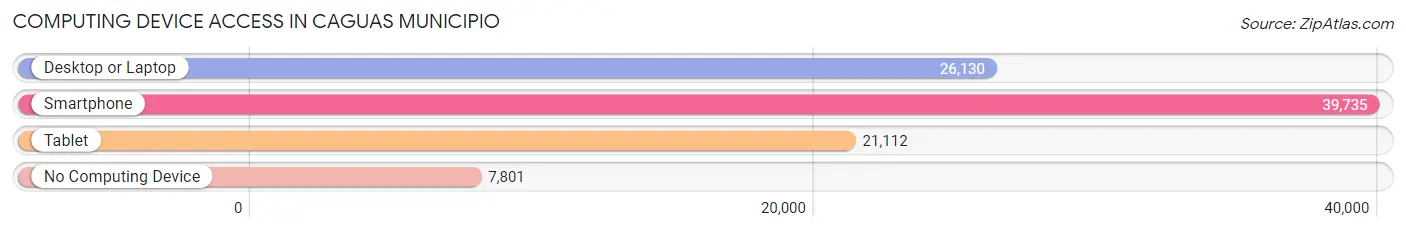
| Device Type | # Households | % Households |
| Desktop or Laptop | 26,130 | 52.6% |
| Smartphone | 39,735 | 80.0% |
| Tablet | 21,112 | 42.5% |
| No Computing Device | 7,801 | 15.7% |
| Total | 49,645 | 100.0% |
Internet Access in Caguas Municipio
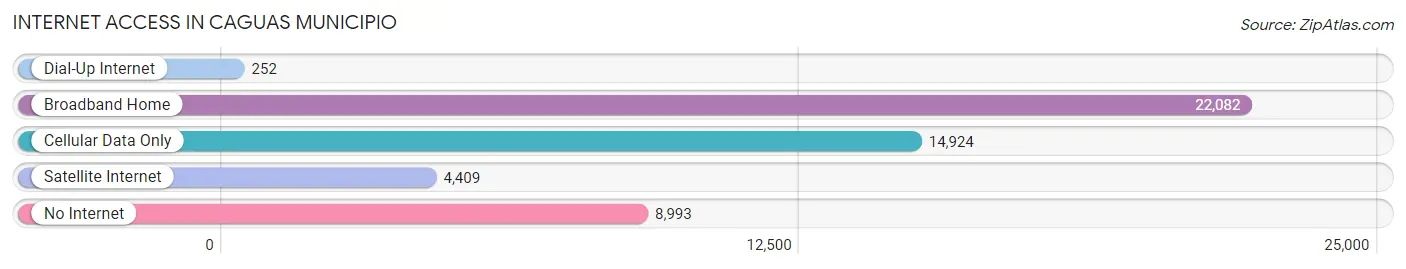
| Internet Type | # Households | % Households |
| Dial-Up Internet | 252 | 0.5% |
| Broadband Home | 22,082 | 44.5% |
| Cellular Data Only | 14,924 | 30.1% |
| Satellite Internet | 4,409 | 8.9% |
| No Internet | 8,993 | 18.1% |
| Total | 49,645 | 100.0% |
Caguas Municipio Summary
Caguas Municipio is a municipality located in the central region of Puerto Rico. It is the second largest municipality in the island, with a population of approximately 140,000 people. The municipality is located in the Caguas Valley, which is surrounded by the Cordillera Central mountain range. The municipality is known for its rich history, diverse geography, vibrant economy, and diverse demographics.
History
Caguas Municipio has a long and rich history that dates back to the 16th century. The area was originally inhabited by the Taíno people, who were the indigenous people of Puerto Rico. In 1510, the Spanish explorer Juan Ponce de León arrived in the area and established the first Spanish settlement in the area. The settlement was named San Sebastián del Piñal de Caguax, which was later shortened to Caguax. The settlement was the first Spanish settlement in the Caguas Valley and was the first capital of Puerto Rico.
In 1775, the municipality of Caguas was officially established by the Spanish government. The municipality was named after the Taíno word for “river of life”, which was “Caguax”. During the 19th century, the municipality experienced rapid growth and development due to the introduction of new industries such as sugar cane production and tobacco farming.
Geography
Caguas Municipio is located in the central region of Puerto Rico. It is bordered by the municipalities of San Juan, Bayamón, Carolina, and Trujillo Alto. The municipality is located in the Caguas Valley, which is surrounded by the Cordillera Central mountain range. The municipality has a total area of approximately 97 square miles, with a population density of approximately 1,400 people per square mile.
The municipality is divided into several distinct geographical regions. The northern region is known as the Caguas Valley, which is characterized by rolling hills and lush vegetation. The central region is known as the Caguas Valley, which is characterized by flat terrain and agricultural land. The southern region is known as the Caguas Valley, which is characterized by mountainous terrain and dense forests.
Economy
Caguas Municipio has a vibrant and diverse economy. The municipality is home to several major industries, including manufacturing, agriculture, and tourism. The manufacturing sector is the largest employer in the municipality, with major employers including pharmaceutical companies, electronics companies, and food processing companies. The agricultural sector is also an important part of the economy, with major crops including sugar cane, tobacco, and coffee. The tourism sector is also an important part of the economy, with major attractions including the Caguas Valley National Park and the Caguas Museum of Art.
Demographics
Caguas Municipio has a diverse population, with a population of approximately 140,000 people. The population is primarily of Puerto Rican descent, with a small percentage of people of other ethnic backgrounds. The majority of the population is Roman Catholic, with a small percentage of people of other religious backgrounds. The median household income in the municipality is approximately $20,000, with a poverty rate of approximately 25%. The unemployment rate in the municipality is approximately 10%.
Common Questions
What is Per Capita Income in Caguas Municipio?
Per Capita income in Caguas Municipio is $19,240.
What is the Median Family Income in Caguas Municipio?
Median Family Income in Caguas Municipio is $34,876.
What is the Median Household income in Caguas Municipio?
Median Household Income in Caguas Municipio is $29,279.
What is Income or Wage Gap in Caguas Municipio?
Income or Wage Gap in Caguas Municipio is 7.4%.
Women in Caguas Municipio earn 92.6 cents for every dollar earned by a man.
What is Family Income Deficit in Caguas Municipio?
Family Income Deficit in Caguas Municipio is $10,769.
Families that are below poverty line in Caguas Municipio earn $10,769 less on average than the poverty threshold level.
What is Inequality or Gini Index in Caguas Municipio?
Inequality or Gini Index in Caguas Municipio is 0.55.
What is the Total Population of Caguas Municipio?
Total Population of Caguas Municipio is 126,772.
What is the Total Male Population of Caguas Municipio?
Total Male Population of Caguas Municipio is 58,659.
What is the Total Female Population of Caguas Municipio?
Total Female Population of Caguas Municipio is 68,113.
What is the Ratio of Males per 100 Females in Caguas Municipio?
There are 86.12 Males per 100 Females in Caguas Municipio.
What is the Ratio of Females per 100 Males in Caguas Municipio?
There are 116.12 Females per 100 Males in Caguas Municipio.
What is the Median Population Age in Caguas Municipio?
Median Population Age in Caguas Municipio is 43.8 Years.
What is the Average Family Size in Caguas Municipio
Average Family Size in Caguas Municipio is 3.1 People.
What is the Average Household Size in Caguas Municipio
Average Household Size in Caguas Municipio is 2.5 People.
How Large is the Labor Force in Caguas Municipio?
There are 52,759 People in the Labor Forcein in Caguas Municipio.
What is the Percentage of People in the Labor Force in Caguas Municipio?
48.7% of People are in the Labor Force in Caguas Municipio.
What is the Unemployment Rate in Caguas Municipio?
Unemployment Rate in Caguas Municipio is 9.6%.