Cabo Rojo Municipio, PR Map & Demographics
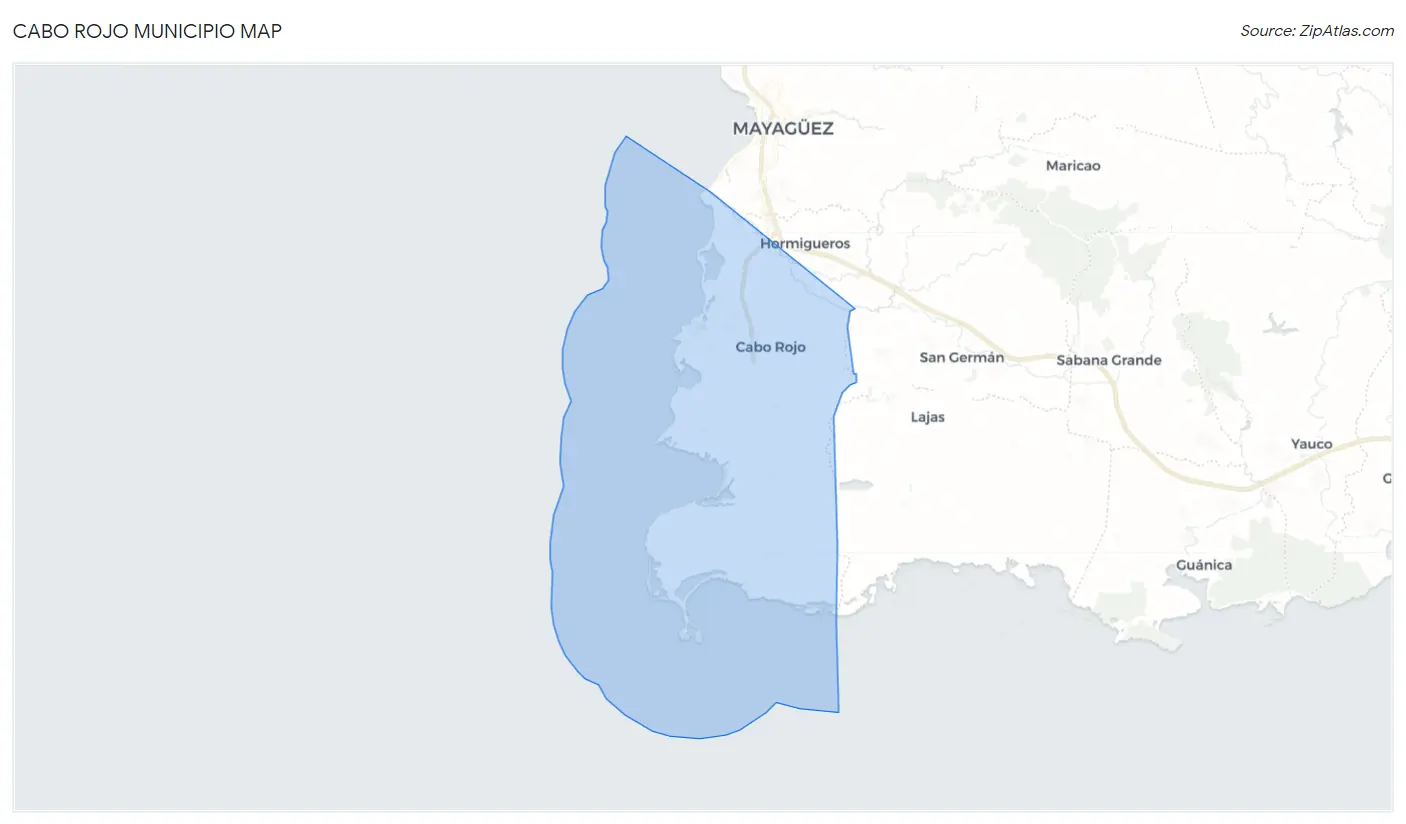
Cabo Rojo Municipio Map
Cabo Rojo Municipio Overview
$14,453
PER CAPITA INCOME
$28,556
AVG FAMILY INCOME
$23,077
AVG HOUSEHOLD INCOME
0.7%
WAGE / INCOME GAP [ % ]
99.3¢/ $1
WAGE / INCOME GAP [ $ ]
$9,993
FAMILY INCOME DEFICIT
0.52
INEQUALITY / GINI INDEX
46,983
TOTAL POPULATION
22,203
MALE POPULATION
24,780
FEMALE POPULATION
89.60
MALES / 100 FEMALES
111.61
FEMALES / 100 MALES
46.3
MEDIAN AGE
3.3
AVG FAMILY SIZE
2.7
AVG HOUSEHOLD SIZE
18,071
LABOR FORCE [ PEOPLE ]
44.5%
PERCENT IN LABOR FORCE
14.6%
UNEMPLOYMENT RATE
Cabo Rojo Municipio Area Codes
Income in Cabo Rojo Municipio
Income Overview in Cabo Rojo Municipio
Per Capita Income in Cabo Rojo Municipio is $14,453, while median incomes of families and households are $28,556 and $23,077 respectively.
| Characteristic | Number | Measure |
| Per Capita Income | 46,983 | $14,453 |
| Median Family Income | 11,587 | $28,556 |
| Mean Family Income | 11,587 | $39,469 |
| Median Household Income | 17,568 | $23,077 |
| Mean Household Income | 17,568 | $35,186 |
| Income Deficit | 11,587 | $9,993 |
| Wage / Income Gap (%) | 46,983 | 0.66% |
| Wage / Income Gap ($) | 46,983 | 99.34¢ per $1 |
| Gini / Inequality Index | 46,983 | 0.52 |
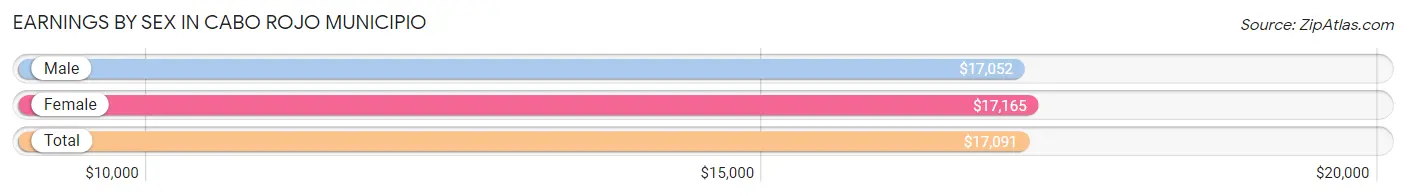
Earnings by Sex in Cabo Rojo Municipio
Average Earnings in Cabo Rojo Municipio are $17,091, $17,052 for men and $17,165 for women, a difference of 0.7%.
| Sex | Number | Average Earnings |
| Male | 9,014 (53.4%) | $17,052 |
| Female | 7,862 (46.6%) | $17,165 |
| Total | 16,876 (100.0%) | $17,091 |
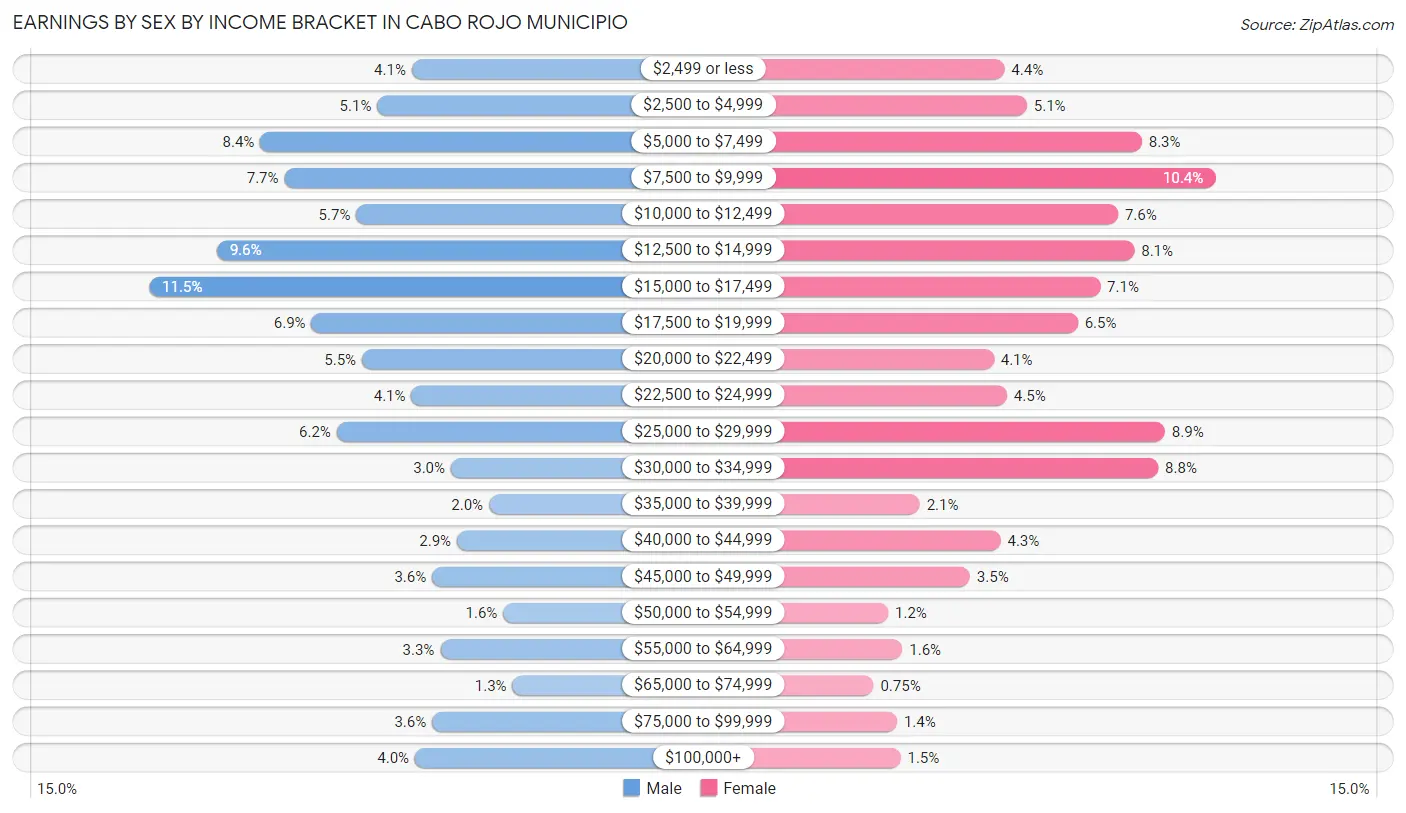
Earnings by Sex by Income Bracket in Cabo Rojo Municipio
The most common earnings brackets in Cabo Rojo Municipio are $15,000 to $17,499 for men (1,037 | 11.5%) and $7,500 to $9,999 for women (814 | 10.3%).
| Income | Male | Female |
| $2,499 or less | 371 (4.1%) | 348 (4.4%) |
| $2,500 to $4,999 | 459 (5.1%) | 398 (5.1%) |
| $5,000 to $7,499 | 755 (8.4%) | 652 (8.3%) |
| $7,500 to $9,999 | 694 (7.7%) | 814 (10.3%) |
| $10,000 to $12,499 | 512 (5.7%) | 599 (7.6%) |
| $12,500 to $14,999 | 865 (9.6%) | 635 (8.1%) |
| $15,000 to $17,499 | 1,037 (11.5%) | 560 (7.1%) |
| $17,500 to $19,999 | 626 (6.9%) | 510 (6.5%) |
| $20,000 to $22,499 | 498 (5.5%) | 325 (4.1%) |
| $22,500 to $24,999 | 372 (4.1%) | 354 (4.5%) |
| $25,000 to $29,999 | 562 (6.2%) | 703 (8.9%) |
| $30,000 to $34,999 | 272 (3.0%) | 688 (8.7%) |
| $35,000 to $39,999 | 176 (1.9%) | 161 (2.1%) |
| $40,000 to $44,999 | 257 (2.9%) | 340 (4.3%) |
| $45,000 to $49,999 | 320 (3.5%) | 272 (3.5%) |
| $50,000 to $54,999 | 140 (1.5%) | 91 (1.2%) |
| $55,000 to $64,999 | 299 (3.3%) | 123 (1.6%) |
| $65,000 to $74,999 | 116 (1.3%) | 59 (0.7%) |
| $75,000 to $99,999 | 320 (3.5%) | 111 (1.4%) |
| $100,000+ | 363 (4.0%) | 119 (1.5%) |
| Total | 9,014 (100.0%) | 7,862 (100.0%) |
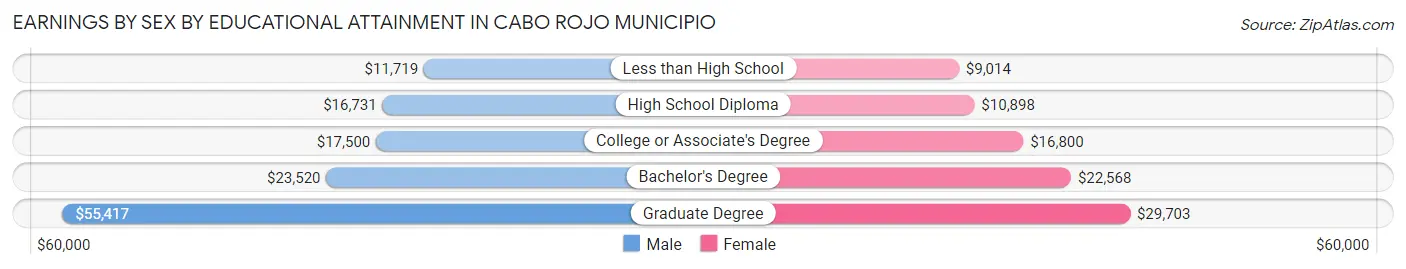
Earnings by Sex by Educational Attainment in Cabo Rojo Municipio
Average earnings in Cabo Rojo Municipio are $18,763 for men and $17,725 for women, a difference of 5.5%. Men with an educational attainment of graduate degree enjoy the highest average annual earnings of $55,417, while those with less than high school education earn the least with $11,719. Women with an educational attainment of graduate degree earn the most with the average annual earnings of $29,703, while those with less than high school education have the smallest earnings of $9,014.
| Educational Attainment | Male Income | Female Income |
| Less than High School | $11,719 | $9,014 |
| High School Diploma | $16,731 | $10,898 |
| College or Associate's Degree | $17,500 | $16,800 |
| Bachelor's Degree | $23,520 | $22,568 |
| Graduate Degree | $55,417 | $29,703 |
| Total | $18,763 | $17,725 |
Family Income in Cabo Rojo Municipio
Family Income Brackets in Cabo Rojo Municipio
According to the Cabo Rojo Municipio family income data, there are 2,317 families falling into the $15,000 to $24,999 income range, which is the most common income bracket and makes up 20.0% of all families. Conversely, the $150,000 to $199,999 income bracket is the least frequent group with only 93 families (0.8%) belonging to this category.
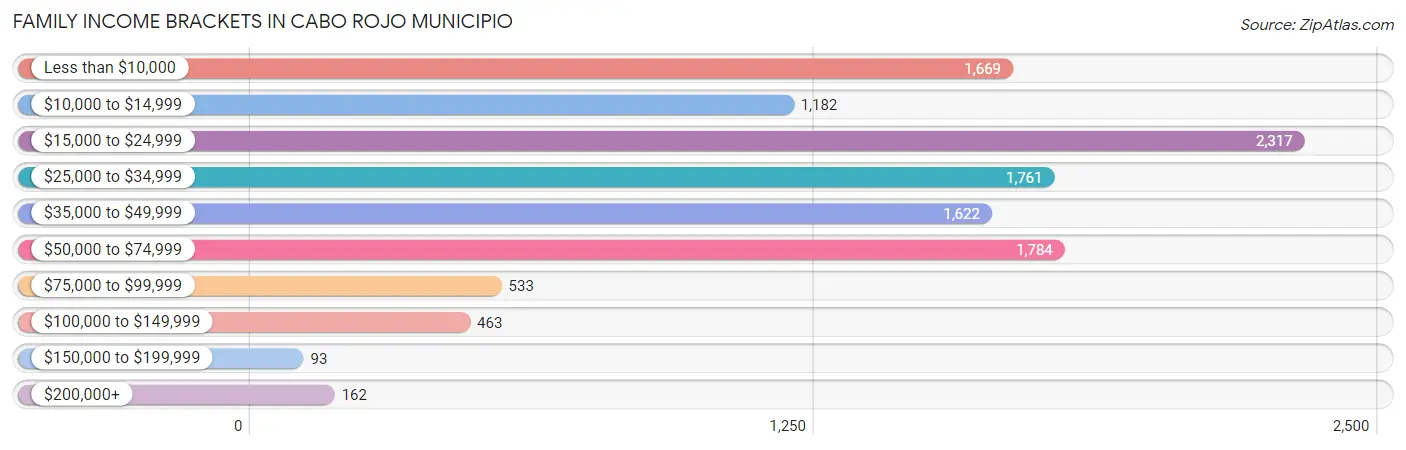
| Income Bracket | # Families | % Families |
| Less than $10,000 | 1,669 | 14.4% |
| $10,000 to $14,999 | 1,182 | 10.2% |
| $15,000 to $24,999 | 2,317 | 20.0% |
| $25,000 to $34,999 | 1,761 | 15.2% |
| $35,000 to $49,999 | 1,622 | 14.0% |
| $50,000 to $74,999 | 1,784 | 15.4% |
| $75,000 to $99,999 | 533 | 4.6% |
| $100,000 to $149,999 | 463 | 4.0% |
| $150,000 to $199,999 | 93 | 0.8% |
| $200,000+ | 162 | 1.4% |
Family Income by Famaliy Size in Cabo Rojo Municipio
7+ person families (106 | 0.9%) account for the highest median family income in Cabo Rojo Municipio with $58,627 per family, while 2-person families (5,968 | 51.5%) have the highest median income of $12,296 per family member.
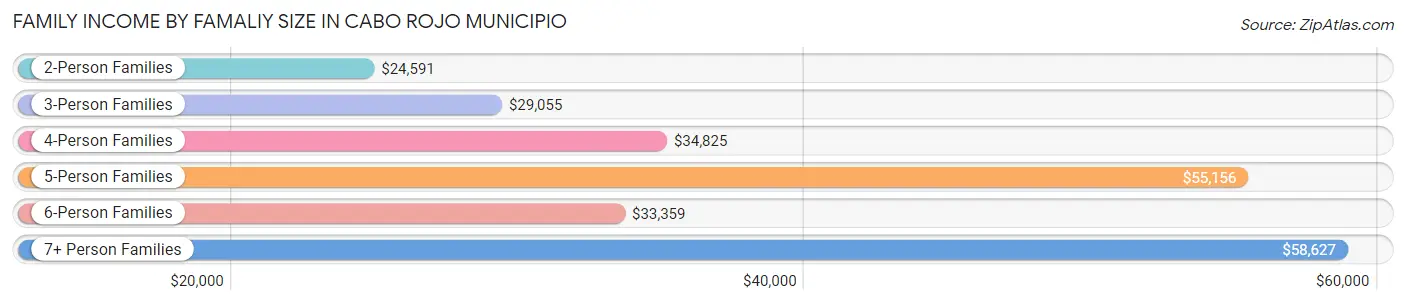
| Income Bracket | # Families | Median Income |
| 2-Person Families | 5,968 (51.5%) | $24,591 |
| 3-Person Families | 3,334 (28.8%) | $29,055 |
| 4-Person Families | 1,706 (14.7%) | $34,825 |
| 5-Person Families | 342 (2.9%) | $55,156 |
| 6-Person Families | 131 (1.1%) | $33,359 |
| 7+ Person Families | 106 (0.9%) | $58,627 |
| Total | 11,587 (100.0%) | $28,556 |
Family Income by Number of Earners in Cabo Rojo Municipio
The median family income in Cabo Rojo Municipio is $28,556, with families comprising 3+ earners (450) having the highest median family income of $59,788, while families with no earners (4,617) have the lowest median family income of $18,018, accounting for 3.9% and 39.9% of families, respectively.
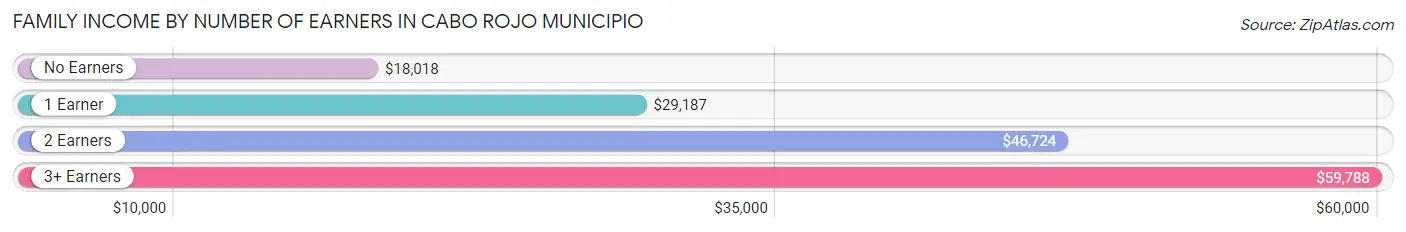
| Number of Earners | # Families | Median Income |
| No Earners | 4,617 (39.9%) | $18,018 |
| 1 Earner | 3,782 (32.6%) | $29,187 |
| 2 Earners | 2,738 (23.6%) | $46,724 |
| 3+ Earners | 450 (3.9%) | $59,788 |
| Total | 11,587 (100.0%) | $28,556 |
Household Income in Cabo Rojo Municipio
Household Income Brackets in Cabo Rojo Municipio
With 3,777 households falling in the category, the less than $10,000 income range is the most frequent in Cabo Rojo Municipio, accounting for 21.5% of all households. In contrast, only 105 households (0.6%) fall into the $150,000 to $199,999 income bracket, making it the least populous group.
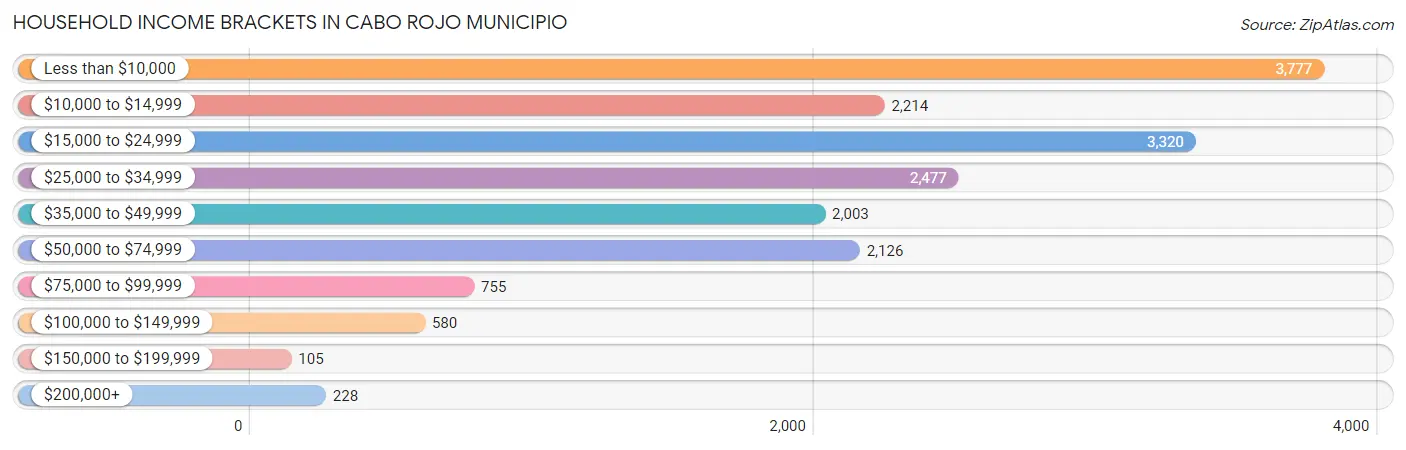
| Income Bracket | # Households | % Households |
| Less than $10,000 | 3,777 | 21.5% |
| $10,000 to $14,999 | 2,214 | 12.6% |
| $15,000 to $24,999 | 3,320 | 18.9% |
| $25,000 to $34,999 | 2,477 | 14.1% |
| $35,000 to $49,999 | 2,003 | 11.4% |
| $50,000 to $74,999 | 2,126 | 12.1% |
| $75,000 to $99,999 | 755 | 4.3% |
| $100,000 to $149,999 | 580 | 3.3% |
| $150,000 to $199,999 | 105 | 0.6% |
| $200,000+ | 228 | 1.3% |
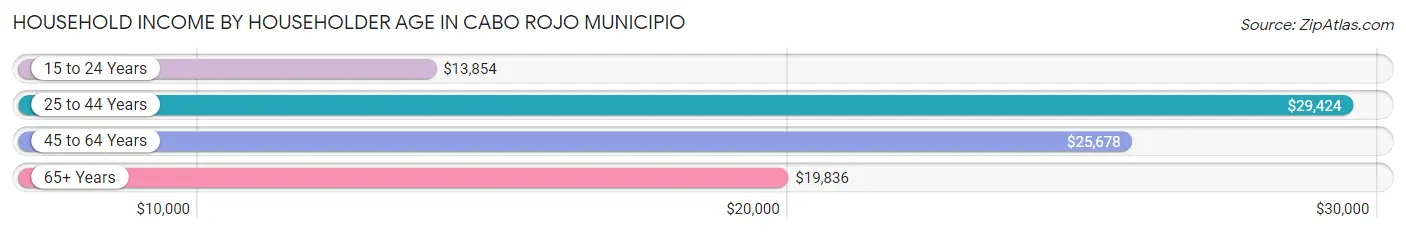
Household Income by Householder Age in Cabo Rojo Municipio
The median household income in Cabo Rojo Municipio is $23,077, with the highest median household income of $29,424 found in the 25 to 44 years age bracket for the primary householder. A total of 3,808 households (21.7%) fall into this category. Meanwhile, the 15 to 24 years age bracket for the primary householder has the lowest median household income of $13,854, with 208 households (1.2%) in this group.
| Income Bracket | # Households | Median Income |
| 15 to 24 Years | 208 (1.2%) | $13,854 |
| 25 to 44 Years | 3,808 (21.7%) | $29,424 |
| 45 to 64 Years | 6,706 (38.2%) | $25,678 |
| 65+ Years | 6,846 (39.0%) | $19,836 |
| Total | 17,568 (100.0%) | $23,077 |
Poverty in Cabo Rojo Municipio
Income Below Poverty by Sex and Age in Cabo Rojo Municipio
With 38.9% poverty level for males and 45.1% for females among the residents of Cabo Rojo Municipio, 6 to 11 year old males and 15 year old females are the most vulnerable to poverty, with 685 males (49.3%) and 122 females (65.9%) in their respective age groups living below the poverty level.
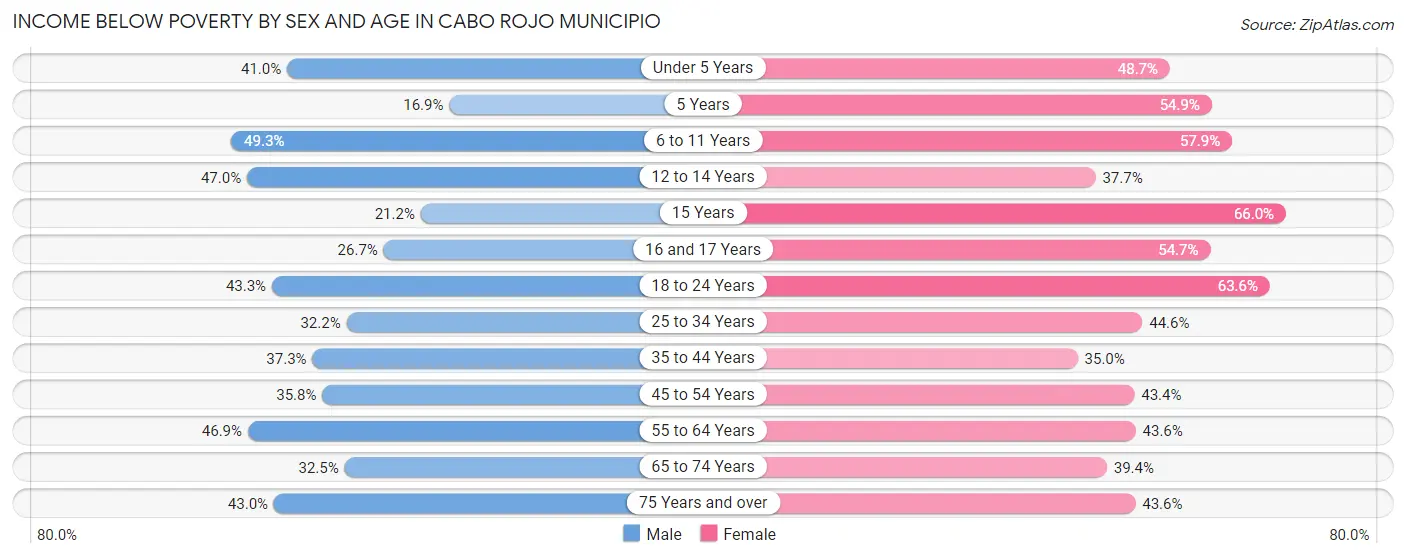
| Age Bracket | Male | Female |
| Under 5 Years | 279 (41.0%) | 320 (48.7%) |
| 5 Years | 21 (16.9%) | 173 (54.9%) |
| 6 to 11 Years | 685 (49.3%) | 682 (57.9%) |
| 12 to 14 Years | 366 (47.0%) | 304 (37.7%) |
| 15 Years | 43 (21.2%) | 122 (65.9%) |
| 16 and 17 Years | 171 (26.7%) | 336 (54.7%) |
| 18 to 24 Years | 887 (43.3%) | 1,320 (63.5%) |
| 25 to 34 Years | 860 (32.2%) | 1,331 (44.6%) |
| 35 to 44 Years | 952 (37.3%) | 1,009 (35.0%) |
| 45 to 54 Years | 1,169 (35.8%) | 1,548 (43.4%) |
| 55 to 64 Years | 1,315 (46.9%) | 1,387 (43.6%) |
| 65 to 74 Years | 848 (32.5%) | 1,223 (39.4%) |
| 75 Years and over | 1,001 (43.0%) | 1,368 (43.6%) |
| Total | 8,597 (38.9%) | 11,123 (45.1%) |
Income Above Poverty by Sex and Age in Cabo Rojo Municipio
According to the poverty statistics in Cabo Rojo Municipio, males aged 5 years and females aged 35 to 44 years are the age groups that are most secure financially, with 83.1% of males and 65.0% of females in these age groups living above the poverty line.
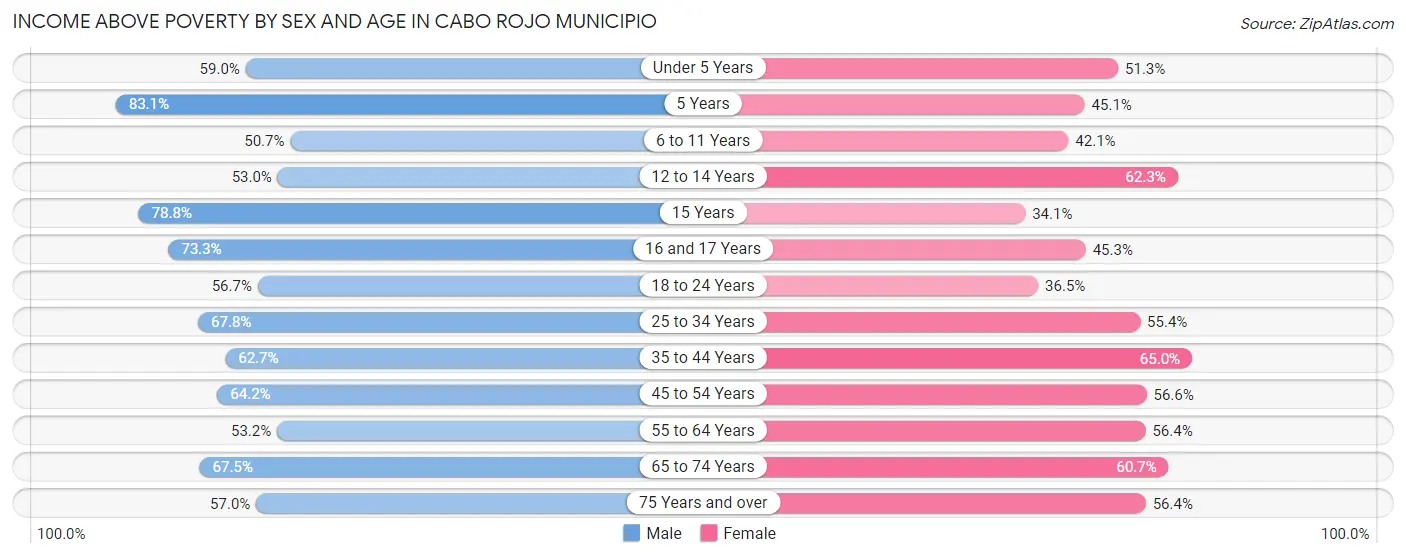
| Age Bracket | Male | Female |
| Under 5 Years | 401 (59.0%) | 337 (51.3%) |
| 5 Years | 103 (83.1%) | 142 (45.1%) |
| 6 to 11 Years | 704 (50.7%) | 495 (42.1%) |
| 12 to 14 Years | 413 (53.0%) | 503 (62.3%) |
| 15 Years | 160 (78.8%) | 63 (34.1%) |
| 16 and 17 Years | 470 (73.3%) | 278 (45.3%) |
| 18 to 24 Years | 1,163 (56.7%) | 757 (36.4%) |
| 25 to 34 Years | 1,811 (67.8%) | 1,652 (55.4%) |
| 35 to 44 Years | 1,603 (62.7%) | 1,872 (65.0%) |
| 45 to 54 Years | 2,097 (64.2%) | 2,016 (56.6%) |
| 55 to 64 Years | 1,492 (53.1%) | 1,792 (56.4%) |
| 65 to 74 Years | 1,762 (67.5%) | 1,885 (60.7%) |
| 75 Years and over | 1,328 (57.0%) | 1,771 (56.4%) |
| Total | 13,507 (61.1%) | 13,563 (54.9%) |
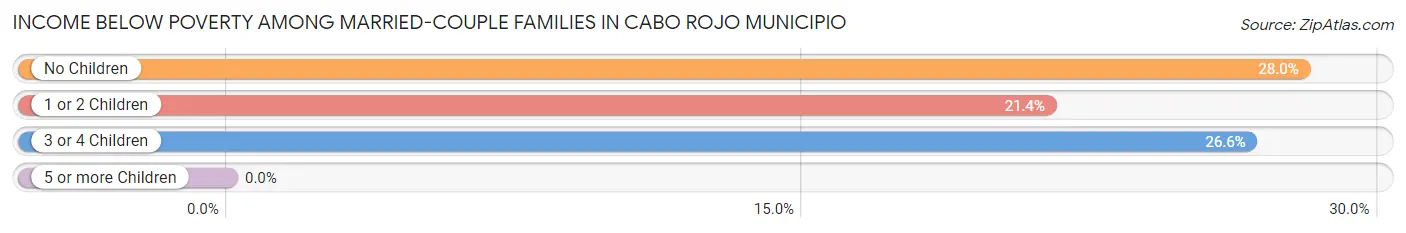
Income Below Poverty Among Married-Couple Families in Cabo Rojo Municipio
The poverty statistics for married-couple families in Cabo Rojo Municipio show that 26.3% or 1,885 of the total 7,170 families live below the poverty line. Families with no children have the highest poverty rate of 28.0%, comprising of 1,476 families. On the other hand, families with 5 or more children have the lowest poverty rate of 0.0%, which includes 0 families.
| Children | Above Poverty | Below Poverty |
| No Children | 3,794 (72.0%) | 1,476 (28.0%) |
| 1 or 2 Children | 1,368 (78.6%) | 372 (21.4%) |
| 3 or 4 Children | 102 (73.4%) | 37 (26.6%) |
| 5 or more Children | 21 (100.0%) | 0 (0.0%) |
| Total | 5,285 (73.7%) | 1,885 (26.3%) |
Income Below Poverty Among Single-Parent Households in Cabo Rojo Municipio
According to the poverty data in Cabo Rojo Municipio, 56.3% or 579 single-father households and 56.5% or 1,915 single-mother households are living below the poverty line. Among single-father households, those with 1 or 2 children have the highest poverty rate, with 293 households (65.0%) experiencing poverty. Likewise, among single-mother households, those with 3 or 4 children have the highest poverty rate, with 100 households (75.8%) falling below the poverty line.
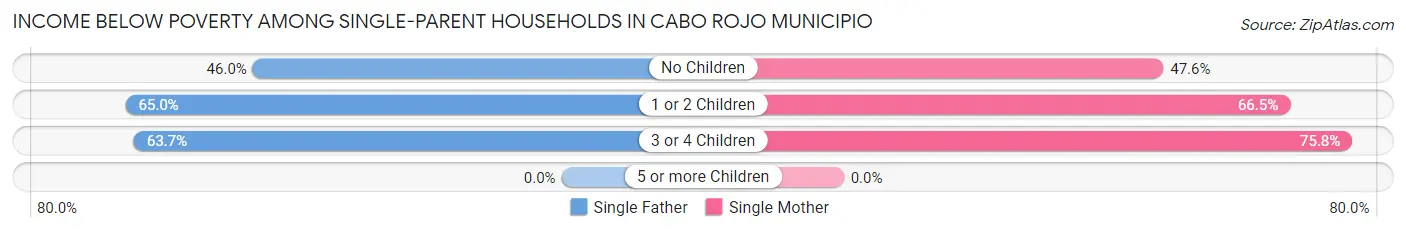
| Children | Single Father | Single Mother |
| No Children | 214 (46.0%) | 884 (47.6%) |
| 1 or 2 Children | 293 (65.0%) | 931 (66.5%) |
| 3 or 4 Children | 72 (63.7%) | 100 (75.8%) |
| 5 or more Children | 0 (0.0%) | 0 (0.0%) |
| Total | 579 (56.3%) | 1,915 (56.5%) |
Income Below Poverty Among Married-Couple vs Single-Parent Households in Cabo Rojo Municipio
The poverty data for Cabo Rojo Municipio shows that 1,885 of the married-couple family households (26.3%) and 2,494 of the single-parent households (56.5%) are living below the poverty level. Within the married-couple family households, those with no children have the highest poverty rate, with 1,476 households (28.0%) falling below the poverty line. Among the single-parent households, those with 3 or 4 children have the highest poverty rate, with 172 household (70.2%) living below poverty.
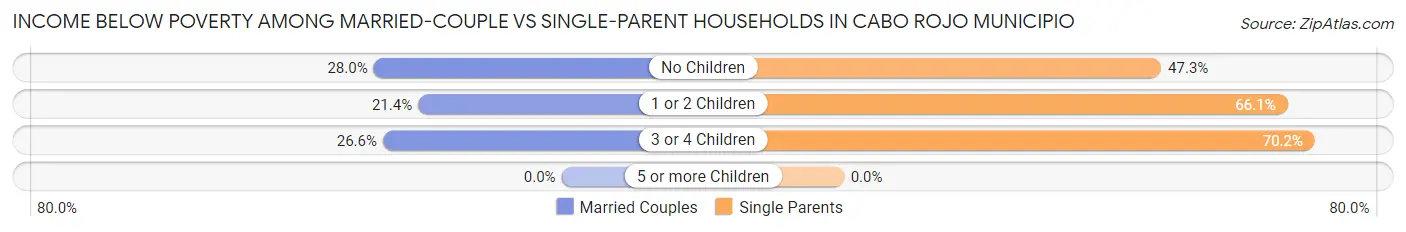
| Children | Married-Couple Families | Single-Parent Households |
| No Children | 1,476 (28.0%) | 1,098 (47.3%) |
| 1 or 2 Children | 372 (21.4%) | 1,224 (66.1%) |
| 3 or 4 Children | 37 (26.6%) | 172 (70.2%) |
| 5 or more Children | 0 (0.0%) | 0 (0.0%) |
| Total | 1,885 (26.3%) | 2,494 (56.5%) |
Race in Cabo Rojo Municipio
The most populous races in Cabo Rojo Municipio are Hispanic or Latino (46,531 | 99.0%), White / Caucasian (19,809 | 42.2%), and Some other Race (18,268 | 38.9%).
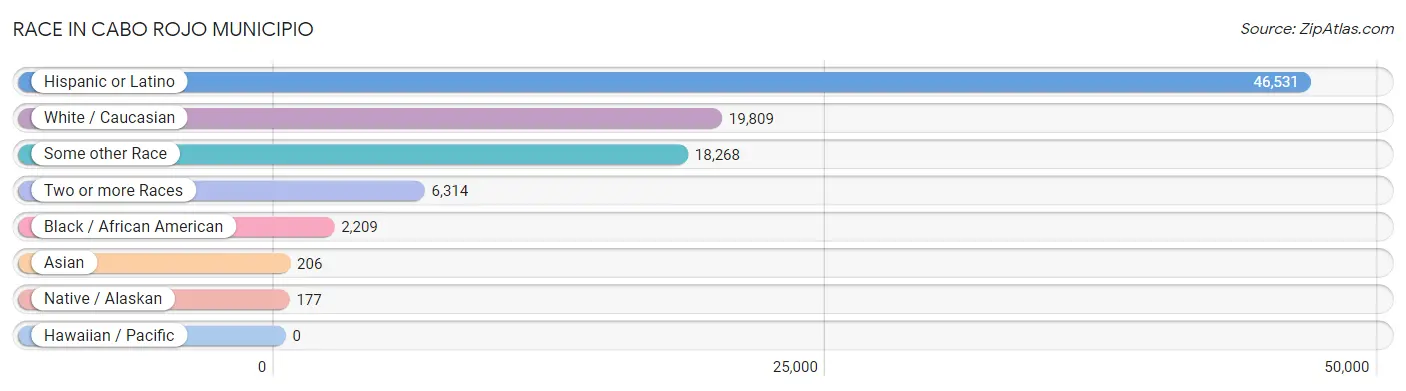
| Race | # Population | % Population |
| Asian | 206 | 0.4% |
| Black / African American | 2,209 | 4.7% |
| Hawaiian / Pacific | 0 | 0.0% |
| Hispanic or Latino | 46,531 | 99.0% |
| Native / Alaskan | 177 | 0.4% |
| White / Caucasian | 19,809 | 42.2% |
| Two or more Races | 6,314 | 13.4% |
| Some other Race | 18,268 | 38.9% |
| Total | 46,983 | 100.0% |
Ancestry in Cabo Rojo Municipio
The most populous ancestries reported in Cabo Rojo Municipio are Puerto Rican (45,744 | 97.4%), Central American Indian (3,039 | 6.5%), American (646 | 1.4%), South American (205 | 0.4%), and Mexican (203 | 0.4%), together accounting for 106.1% of all Cabo Rojo Municipio residents.
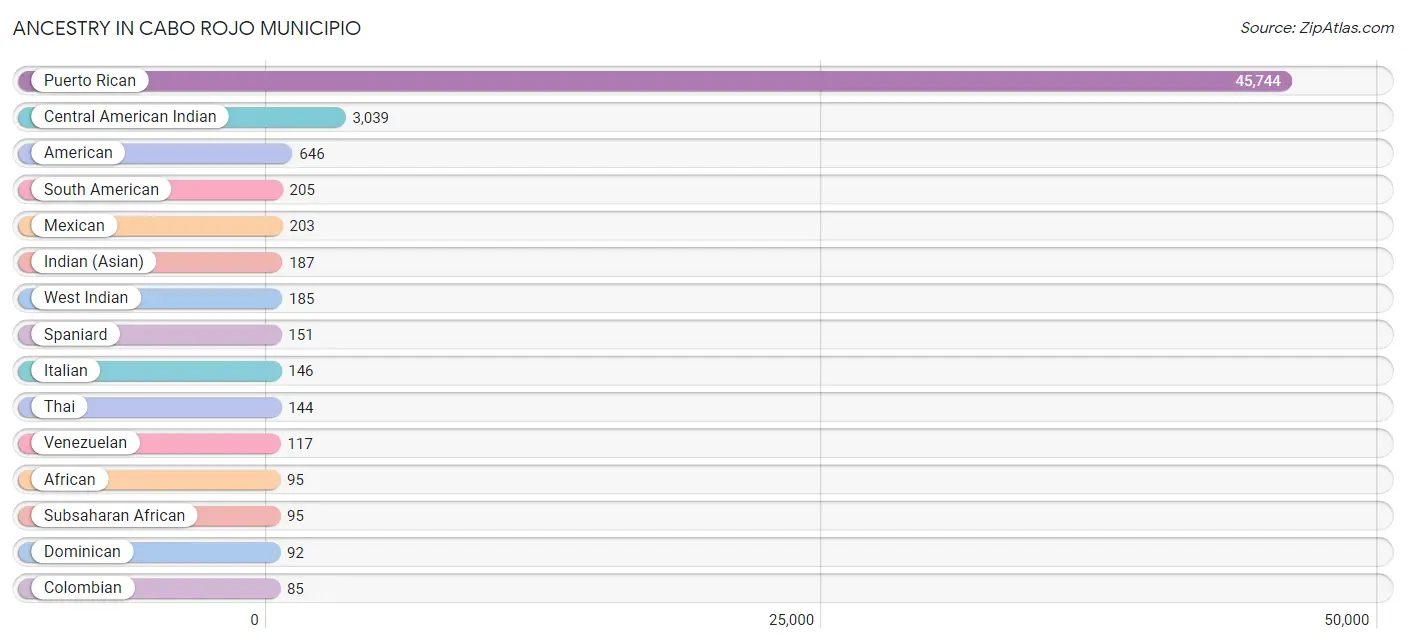
| Ancestry | # Population | % Population |
| African | 95 | 0.2% |
| American | 646 | 1.4% |
| Arab | 22 | 0.1% |
| Burmese | 19 | 0.0% |
| Central American | 49 | 0.1% |
| Central American Indian | 3,039 | 6.5% |
| Colombian | 85 | 0.2% |
| Cuban | 78 | 0.2% |
| Dominican | 92 | 0.2% |
| English | 25 | 0.1% |
| Indian (Asian) | 187 | 0.4% |
| Italian | 146 | 0.3% |
| Jamaican | 18 | 0.0% |
| Mexican | 203 | 0.4% |
| Northern European | 13 | 0.0% |
| Panamanian | 49 | 0.1% |
| Peruvian | 3 | 0.0% |
| Polish | 10 | 0.0% |
| Portuguese | 35 | 0.1% |
| Puerto Rican | 45,744 | 97.4% |
| South American | 205 | 0.4% |
| Spaniard | 151 | 0.3% |
| Subsaharan African | 95 | 0.2% |
| Thai | 144 | 0.3% |
| Venezuelan | 117 | 0.3% |
| West Indian | 185 | 0.4% | View All 26 Rows |
Immigrants in Cabo Rojo Municipio

| Immigration Origin | # Population | % Population | View All 0 Rows |
Sex and Age in Cabo Rojo Municipio
Sex and Age in Cabo Rojo Municipio
The most populous age groups in Cabo Rojo Municipio are 50 to 54 Years (1,648 | 7.4%) for men and 45 to 49 Years (1,799 | 7.3%) for women.
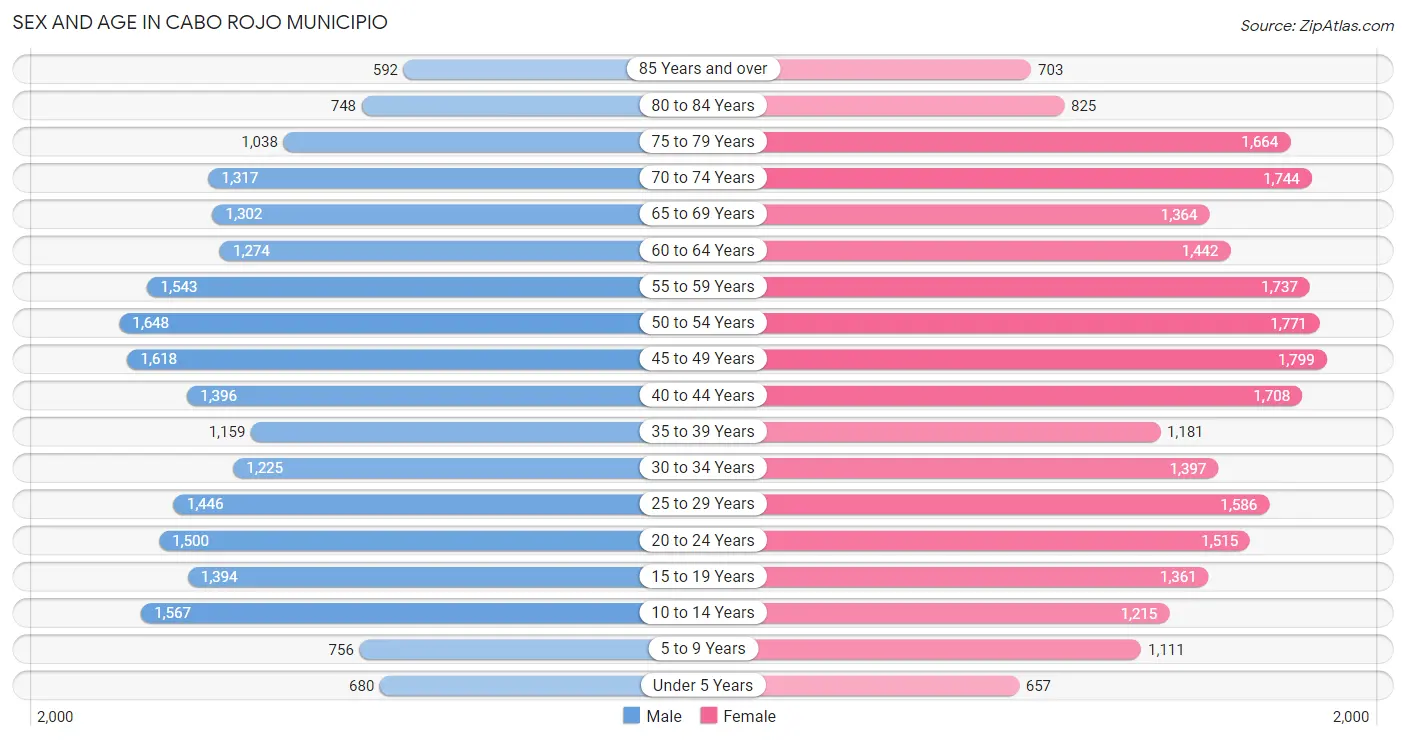
| Age Bracket | Male | Female |
| Under 5 Years | 680 (3.1%) | 657 (2.6%) |
| 5 to 9 Years | 756 (3.4%) | 1,111 (4.5%) |
| 10 to 14 Years | 1,567 (7.1%) | 1,215 (4.9%) |
| 15 to 19 Years | 1,394 (6.3%) | 1,361 (5.5%) |
| 20 to 24 Years | 1,500 (6.8%) | 1,515 (6.1%) |
| 25 to 29 Years | 1,446 (6.5%) | 1,586 (6.4%) |
| 30 to 34 Years | 1,225 (5.5%) | 1,397 (5.6%) |
| 35 to 39 Years | 1,159 (5.2%) | 1,181 (4.8%) |
| 40 to 44 Years | 1,396 (6.3%) | 1,708 (6.9%) |
| 45 to 49 Years | 1,618 (7.3%) | 1,799 (7.3%) |
| 50 to 54 Years | 1,648 (7.4%) | 1,771 (7.1%) |
| 55 to 59 Years | 1,543 (7.0%) | 1,737 (7.0%) |
| 60 to 64 Years | 1,274 (5.7%) | 1,442 (5.8%) |
| 65 to 69 Years | 1,302 (5.9%) | 1,364 (5.5%) |
| 70 to 74 Years | 1,317 (5.9%) | 1,744 (7.0%) |
| 75 to 79 Years | 1,038 (4.7%) | 1,664 (6.7%) |
| 80 to 84 Years | 748 (3.4%) | 825 (3.3%) |
| 85 Years and over | 592 (2.7%) | 703 (2.8%) |
| Total | 22,203 (100.0%) | 24,780 (100.0%) |
Families and Households in Cabo Rojo Municipio
Median Family Size in Cabo Rojo Municipio
The median family size in Cabo Rojo Municipio is 3.33 persons per family, with single female/mother families (3,388 | 29.2%) accounting for the largest median family size of 3.65 persons per family. On the other hand, married-couple families (7,170 | 61.9%) represent the smallest median family size with 3.17 persons per family.
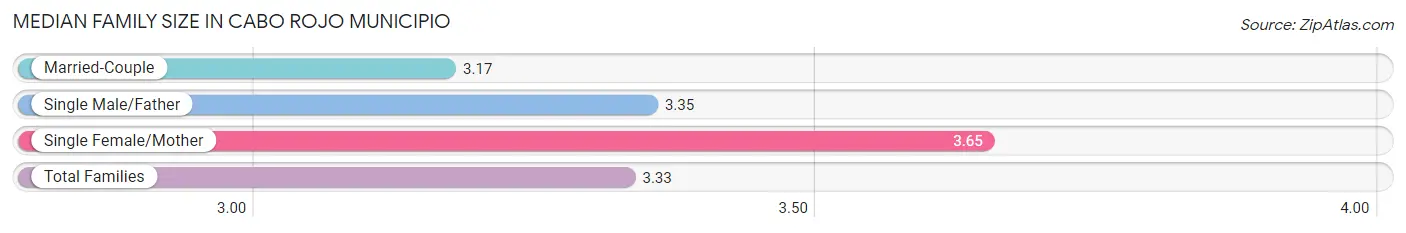
| Family Type | # Families | Family Size |
| Married-Couple | 7,170 (61.9%) | 3.17 |
| Single Male/Father | 1,029 (8.9%) | 3.35 |
| Single Female/Mother | 3,388 (29.2%) | 3.65 |
| Total Families | 11,587 (100.0%) | 3.33 |
Median Household Size in Cabo Rojo Municipio
The median household size in Cabo Rojo Municipio is 2.66 persons per household, with single male/father households (1,029 | 5.9%) accounting for the largest median household size of 3.86 persons per household. non-family households (5,981 | 34.0%) represent the smallest median household size with 1.21 persons per household.
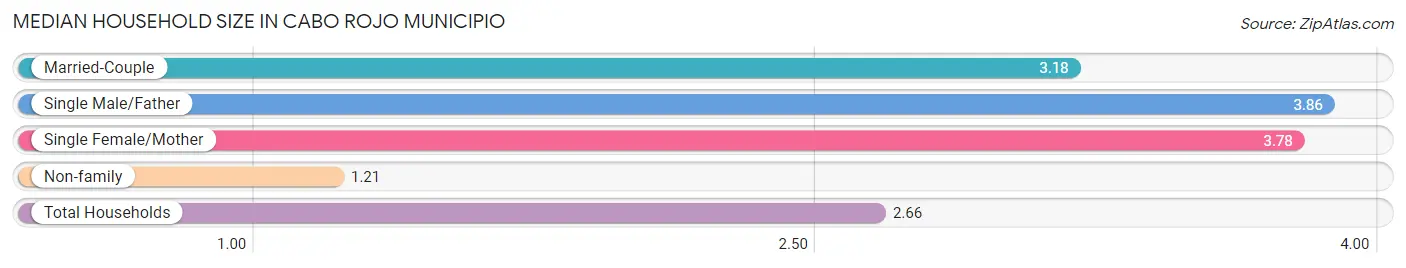
| Household Type | # Households | Household Size |
| Married-Couple | 7,170 (40.8%) | 3.18 |
| Single Male/Father | 1,029 (5.9%) | 3.86 |
| Single Female/Mother | 3,388 (19.3%) | 3.78 |
| Non-family | 5,981 (34.0%) | 1.21 |
| Total Households | 17,568 (100.0%) | 2.66 |
Household Size by Marriage Status in Cabo Rojo Municipio
Out of a total of 17,568 households in Cabo Rojo Municipio, 11,587 (66.0%) are family households, while 5,981 (34.0%) are nonfamily households. The most numerous type of family households are 2-person households, comprising 5,492, and the most common type of nonfamily households are 1-person households, comprising 4,950.
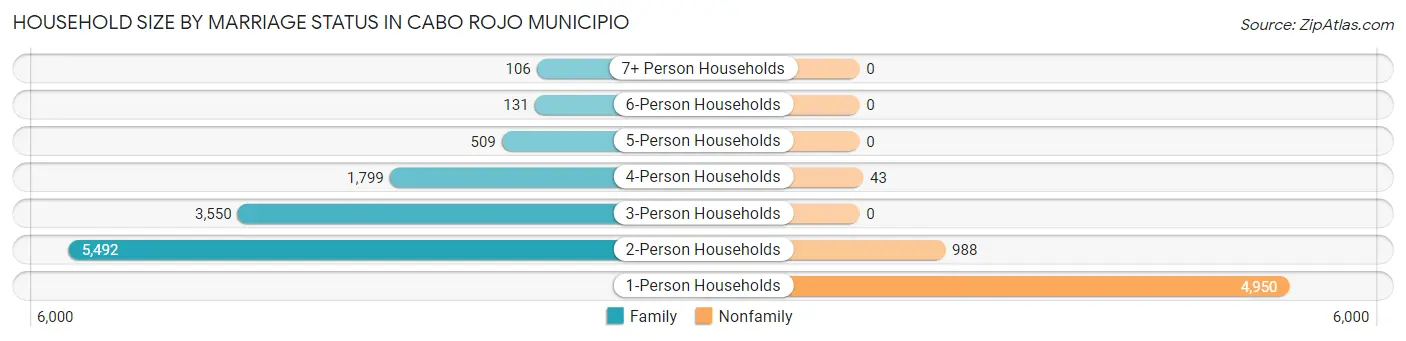
| Household Size | Family Households | Nonfamily Households |
| 1-Person Households | - | 4,950 (28.2%) |
| 2-Person Households | 5,492 (31.3%) | 988 (5.6%) |
| 3-Person Households | 3,550 (20.2%) | 0 (0.0%) |
| 4-Person Households | 1,799 (10.2%) | 43 (0.2%) |
| 5-Person Households | 509 (2.9%) | 0 (0.0%) |
| 6-Person Households | 131 (0.7%) | 0 (0.0%) |
| 7+ Person Households | 106 (0.6%) | 0 (0.0%) |
| Total | 11,587 (66.0%) | 5,981 (34.0%) |
Female Fertility in Cabo Rojo Municipio
Fertility by Age in Cabo Rojo Municipio
Average fertility rate in Cabo Rojo Municipio is 18.0 births per 1,000 women. Women in the age bracket of 20 to 34 years have the highest fertility rate with 25.0 births per 1,000 women. Women in the age bracket of 20 to 34 years acount for 56.6% of all women with births.
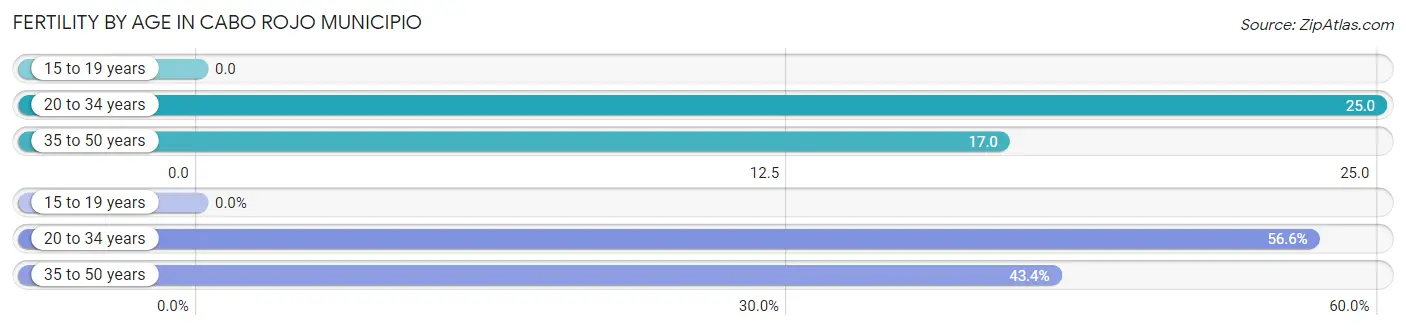
| Age Bracket | Women with Births | Births / 1,000 Women |
| 15 to 19 years | 0 (0.0%) | 0.0 |
| 20 to 34 years | 112 (56.6%) | 25.0 |
| 35 to 50 years | 86 (43.4%) | 17.0 |
| Total | 198 (100.0%) | 18.0 |
Fertility by Age by Marriage Status in Cabo Rojo Municipio
39.9% of women with births (198) in Cabo Rojo Municipio are married. The highest percentage of unmarried women with births falls into 20 to 34 years age bracket with 84.8% of them unmarried at the time of birth, while the lowest percentage of unmarried women with births belong to 35 to 50 years age bracket with 27.9% of them unmarried.
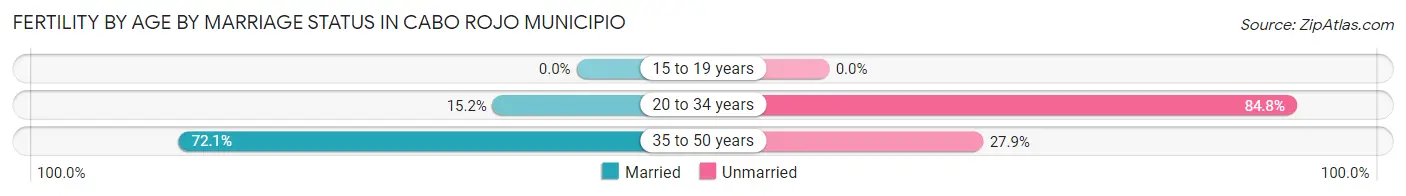
| Age Bracket | Married | Unmarried |
| 15 to 19 years | 0 (0.0%) | 0 (0.0%) |
| 20 to 34 years | 17 (15.2%) | 95 (84.8%) |
| 35 to 50 years | 62 (72.1%) | 24 (27.9%) |
| Total | 79 (39.9%) | 119 (60.1%) |
Fertility by Education in Cabo Rojo Municipio
Average fertility rate in Cabo Rojo Municipio is 18.0 births per 1,000 women. Women with the education attainment of graduate degree have the highest fertility rate of 72.0 births per 1,000 women, while women with the education attainment of high school diploma have the lowest fertility at 6.0 births per 1,000 women. Women with the education attainment of college or associate's degree represent 39.4% of all women with births.
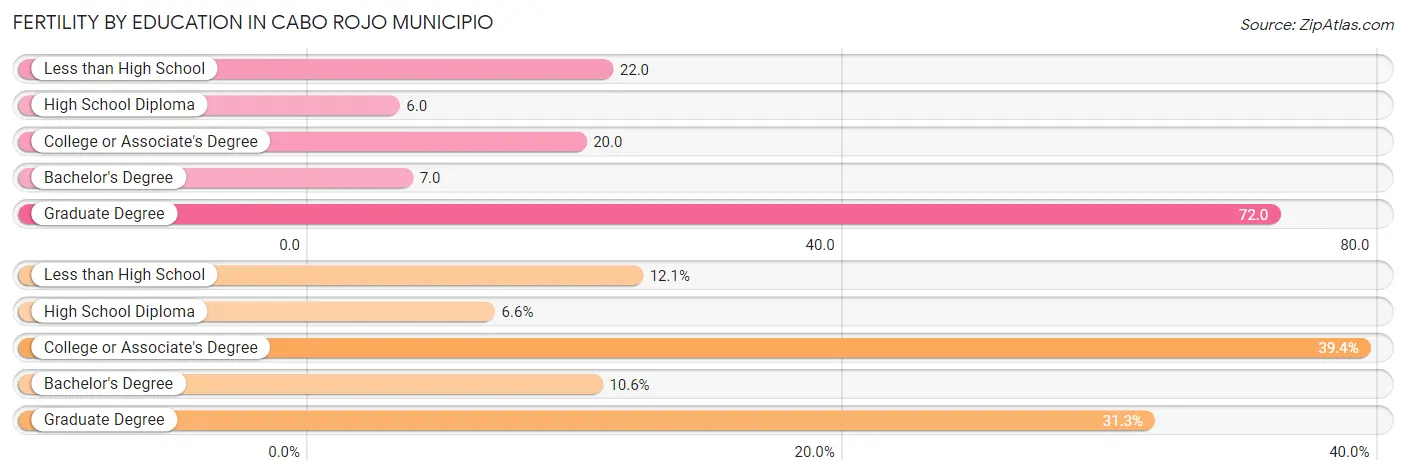
| Educational Attainment | Women with Births | Births / 1,000 Women |
| Less than High School | 24 (12.1%) | 22.0 |
| High School Diploma | 13 (6.6%) | 6.0 |
| College or Associate's Degree | 78 (39.4%) | 20.0 |
| Bachelor's Degree | 21 (10.6%) | 7.0 |
| Graduate Degree | 62 (31.3%) | 72.0 |
| Total | 198 (100.0%) | 18.0 |
Fertility by Education by Marriage Status in Cabo Rojo Municipio
60.1% of women with births in Cabo Rojo Municipio are unmarried. Women with the educational attainment of graduate degree are most likely to be married with 100.0% of them married at childbirth, while women with the educational attainment of less than high school are least likely to be married with 100.0% of them unmarried at childbirth.
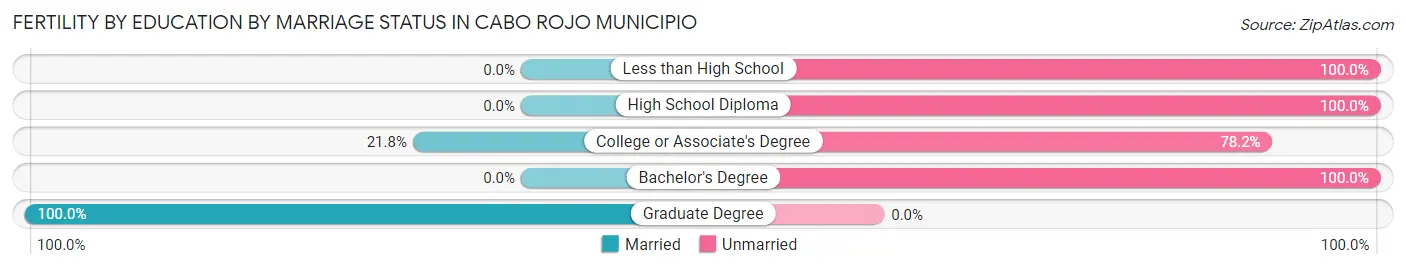
| Educational Attainment | Married | Unmarried |
| Less than High School | 0 (0.0%) | 24 (100.0%) |
| High School Diploma | 0 (0.0%) | 13 (100.0%) |
| College or Associate's Degree | 17 (21.8%) | 61 (78.2%) |
| Bachelor's Degree | 0 (0.0%) | 21 (100.0%) |
| Graduate Degree | 62 (100.0%) | 0 (0.0%) |
| Total | 79 (39.9%) | 119 (60.1%) |
Employment Characteristics in Cabo Rojo Municipio
Employment by Class of Employer in Cabo Rojo Municipio
Among the 14,829 employed individuals in Cabo Rojo Municipio, private company employees (9,283 | 62.6%), self-employed (not incorporated) (2,264 | 15.3%), and state government employees (1,537 | 10.4%) make up the most common classes of employment.
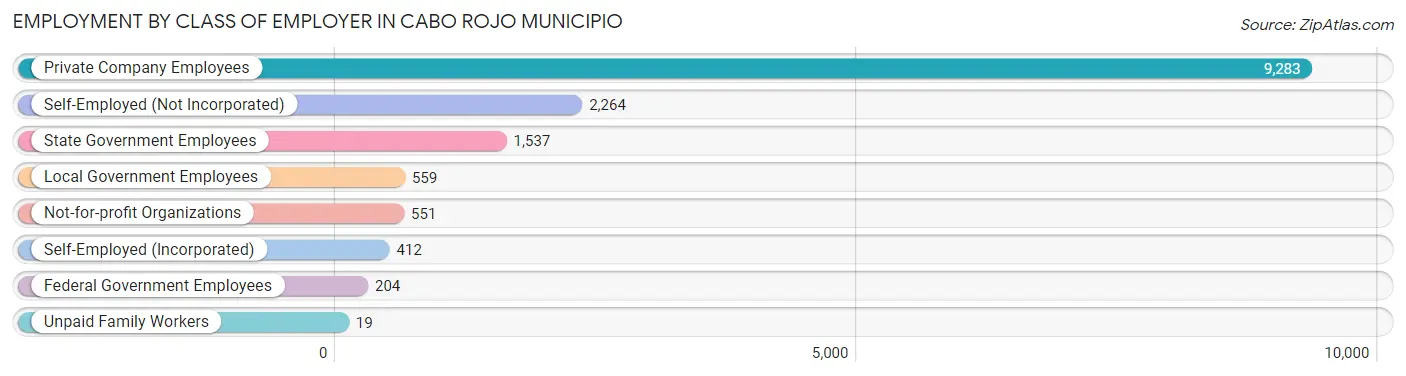
| Employer Class | # Employees | % Employees |
| Private Company Employees | 9,283 | 62.6% |
| Self-Employed (Incorporated) | 412 | 2.8% |
| Self-Employed (Not Incorporated) | 2,264 | 15.3% |
| Not-for-profit Organizations | 551 | 3.7% |
| Local Government Employees | 559 | 3.8% |
| State Government Employees | 1,537 | 10.4% |
| Federal Government Employees | 204 | 1.4% |
| Unpaid Family Workers | 19 | 0.1% |
| Total | 14,829 | 100.0% |
Employment Status by Age in Cabo Rojo Municipio
According to the labor force statistics for Cabo Rojo Municipio, out of the total population over 16 years of age (40,609), 44.5% or 18,071 individuals are in the labor force, with 14.6% or 2,638 of them unemployed. The age group with the highest labor force participation rate is 30 to 34 years, with 80.0% or 2,098 individuals in the labor force. Within the labor force, the 16 to 19 years age range has the highest percentage of unemployed individuals, with 41.5% or 170 of them being unemployed.
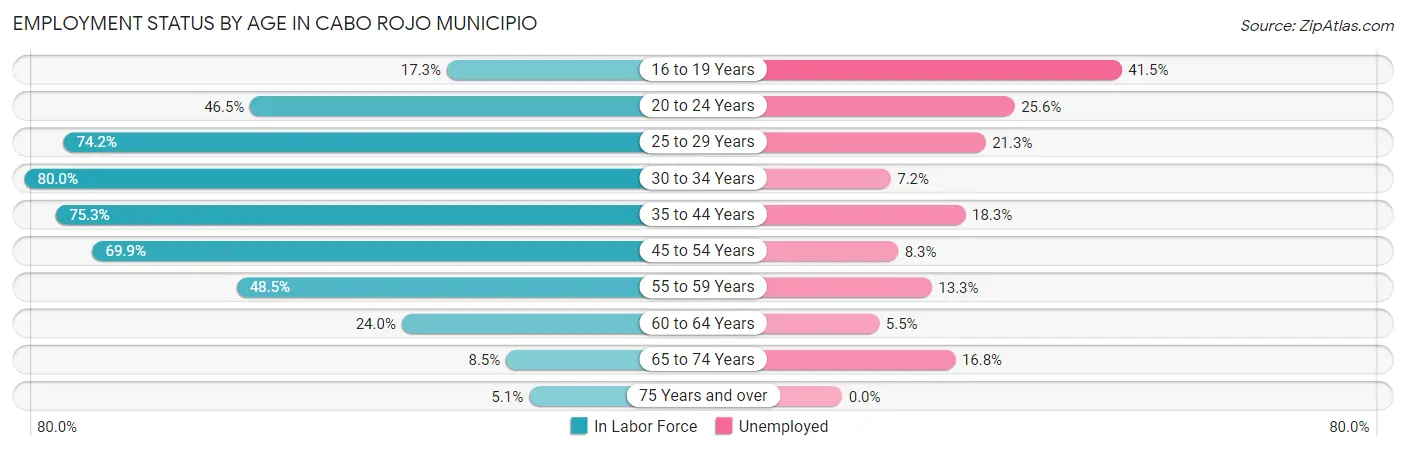
| Age Bracket | In Labor Force | Unemployed |
| 16 to 19 Years | 409 (17.3%) | 170 (41.5%) |
| 20 to 24 Years | 1,402 (46.5%) | 359 (25.6%) |
| 25 to 29 Years | 2,250 (74.2%) | 479 (21.3%) |
| 30 to 34 Years | 2,098 (80.0%) | 151 (7.2%) |
| 35 to 44 Years | 4,099 (75.3%) | 750 (18.3%) |
| 45 to 54 Years | 4,778 (69.9%) | 397 (8.3%) |
| 55 to 59 Years | 1,591 (48.5%) | 212 (13.3%) |
| 60 to 64 Years | 652 (24.0%) | 36 (5.5%) |
| 65 to 74 Years | 487 (8.5%) | 82 (16.8%) |
| 75 Years and over | 284 (5.1%) | 0 (0.0%) |
| Total | 18,071 (44.5%) | 2,638 (14.6%) |
Employment Status by Educational Attainment in Cabo Rojo Municipio
According to labor force statistics for Cabo Rojo Municipio, 64.6% of individuals (15,459) out of the total population between 25 and 64 years of age (23,930) are in the labor force, with 13.1% or 2,025 of them being unemployed. The group with the highest labor force participation rate are those with the educational attainment of bachelor's degree or higher, with 77.1% or 6,499 individuals in the labor force. Within the labor force, individuals with less than high school education have the highest percentage of unemployment, with 28.7% or 281 of them being unemployed.
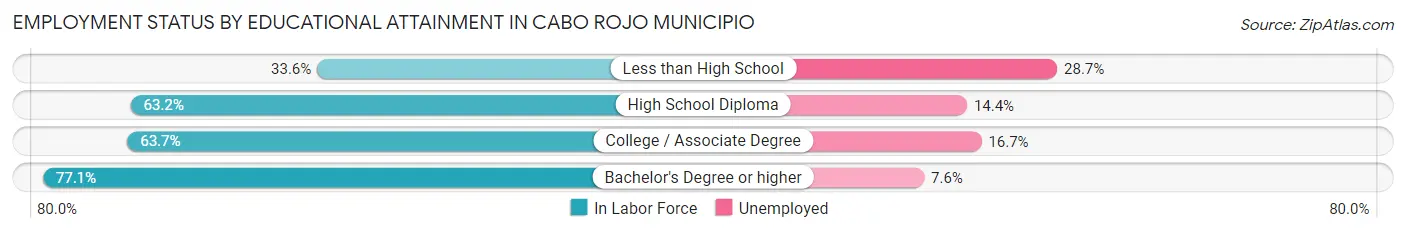
| Educational Attainment | In Labor Force | Unemployed |
| Less than High School | 978 (33.6%) | 836 (28.7%) |
| High School Diploma | 3,720 (63.2%) | 848 (14.4%) |
| College / Associate Degree | 4,270 (63.7%) | 1,119 (16.7%) |
| Bachelor's Degree or higher | 6,499 (77.1%) | 641 (7.6%) |
| Total | 15,459 (64.6%) | 3,135 (13.1%) |
Employment Occupations by Sex in Cabo Rojo Municipio
Management, Business, Science and Arts Occupations
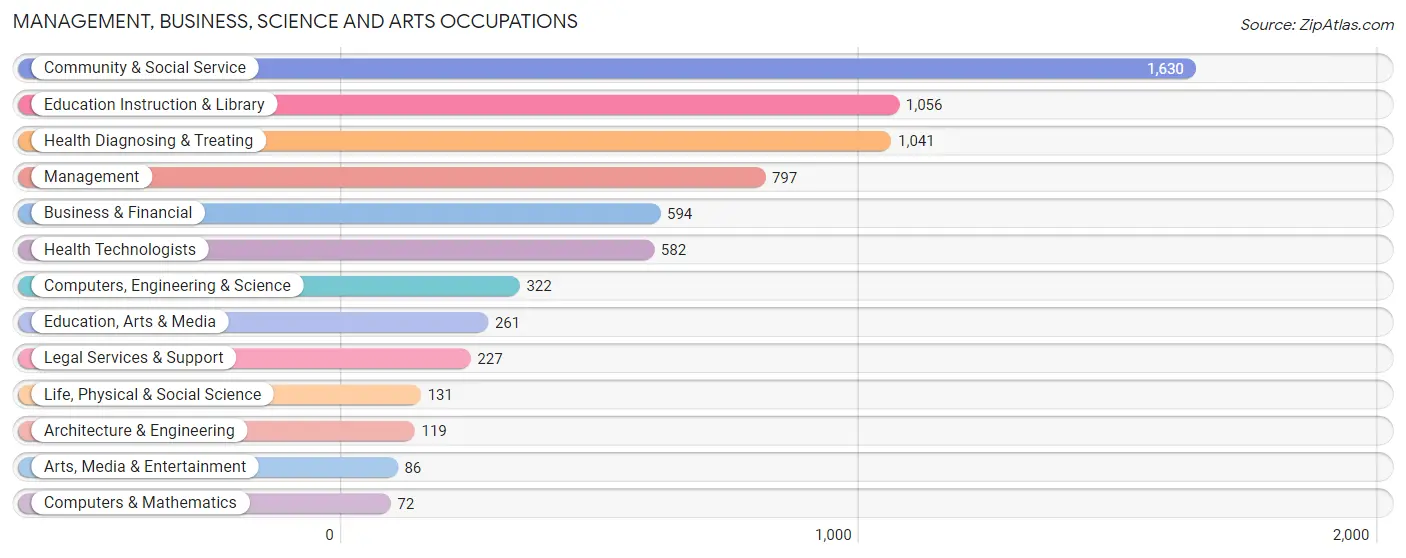
The most common Management, Business, Science and Arts occupations in Cabo Rojo Municipio are Community & Social Service (1,630 | 10.6%), Education Instruction & Library (1,056 | 6.9%), Health Diagnosing & Treating (1,041 | 6.8%), Management (797 | 5.2%), and Business & Financial (594 | 3.9%).
Management, Business, Science and Arts Occupations by Sex
Within the Management, Business, Science and Arts occupations in Cabo Rojo Municipio, the most male-oriented occupations are Computers & Mathematics (100.0%), Architecture & Engineering (81.5%), and Arts, Media & Entertainment (65.1%), while the most female-oriented occupations are Life, Physical & Social Science (100.0%), Education Instruction & Library (81.4%), and Education, Arts & Media (78.9%).
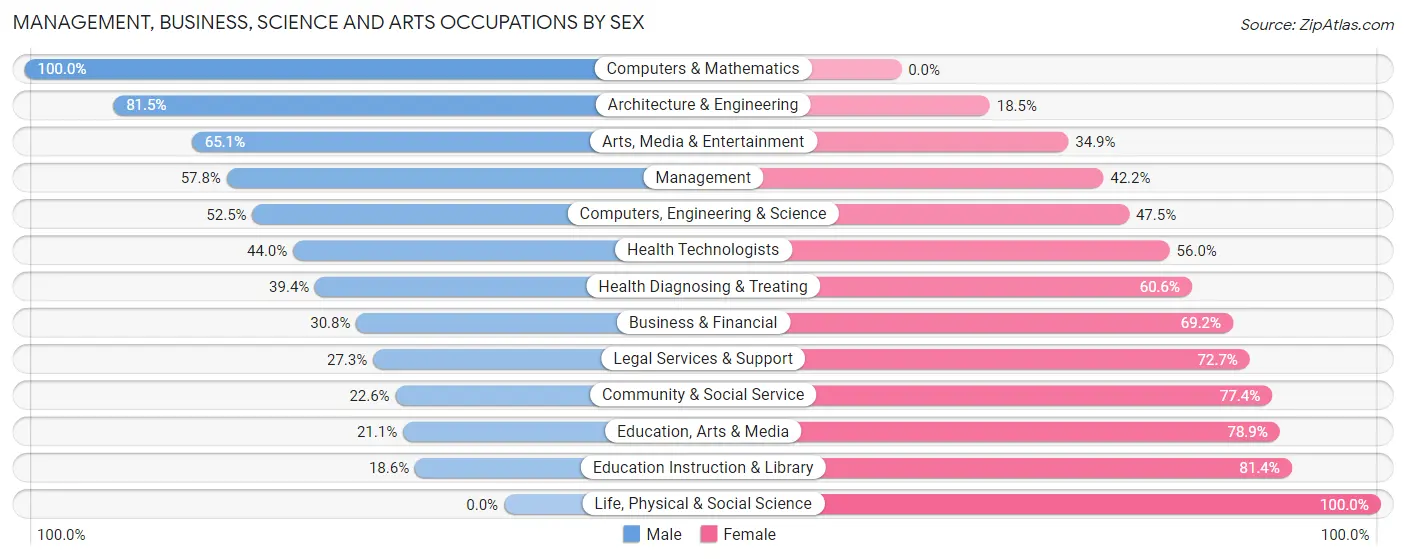
| Occupation | Male | Female |
| Management | 461 (57.8%) | 336 (42.2%) |
| Business & Financial | 183 (30.8%) | 411 (69.2%) |
| Computers, Engineering & Science | 169 (52.5%) | 153 (47.5%) |
| Computers & Mathematics | 72 (100.0%) | 0 (0.0%) |
| Architecture & Engineering | 97 (81.5%) | 22 (18.5%) |
| Life, Physical & Social Science | 0 (0.0%) | 131 (100.0%) |
| Community & Social Service | 369 (22.6%) | 1,261 (77.4%) |
| Education, Arts & Media | 55 (21.1%) | 206 (78.9%) |
| Legal Services & Support | 62 (27.3%) | 165 (72.7%) |
| Education Instruction & Library | 196 (18.6%) | 860 (81.4%) |
| Arts, Media & Entertainment | 56 (65.1%) | 30 (34.9%) |
| Health Diagnosing & Treating | 410 (39.4%) | 631 (60.6%) |
| Health Technologists | 256 (44.0%) | 326 (56.0%) |
| Total (Category) | 1,592 (36.3%) | 2,792 (63.7%) |
| Total (Overall) | 8,304 (53.9%) | 7,098 (46.1%) |
Services Occupations
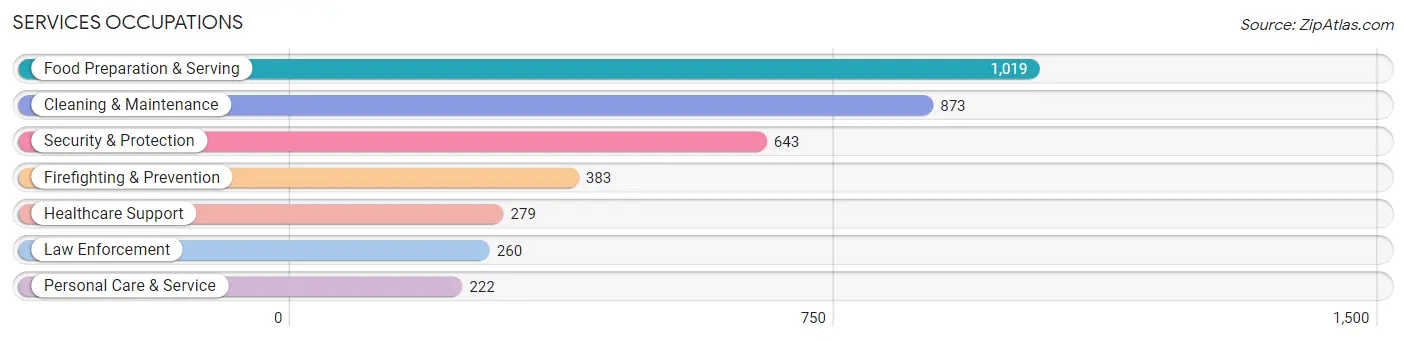
The most common Services occupations in Cabo Rojo Municipio are Food Preparation & Serving (1,019 | 6.6%), Cleaning & Maintenance (873 | 5.7%), Security & Protection (643 | 4.2%), Firefighting & Prevention (383 | 2.5%), and Healthcare Support (279 | 1.8%).
Services Occupations by Sex
Within the Services occupations in Cabo Rojo Municipio, the most male-oriented occupations are Law Enforcement (91.9%), Security & Protection (84.0%), and Firefighting & Prevention (78.6%), while the most female-oriented occupations are Healthcare Support (100.0%), Food Preparation & Serving (46.0%), and Cleaning & Maintenance (42.3%).
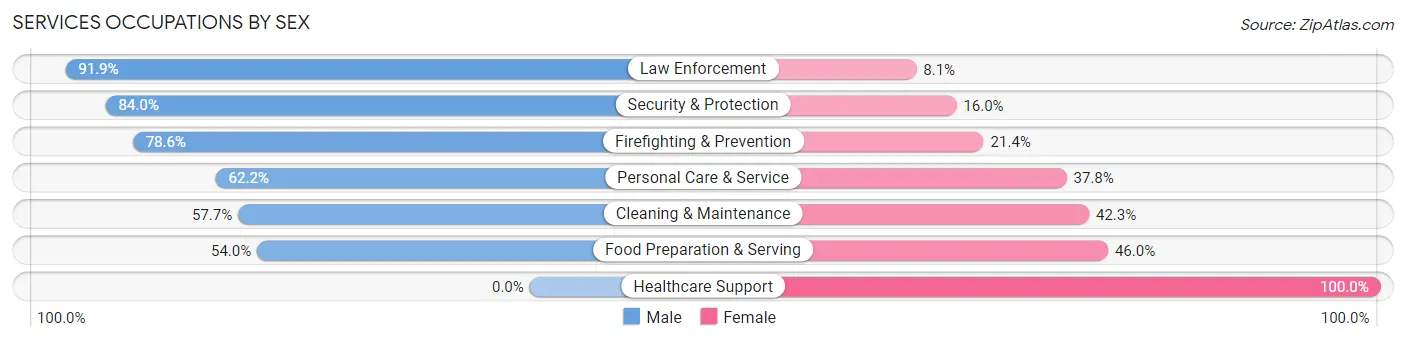
| Occupation | Male | Female |
| Healthcare Support | 0 (0.0%) | 279 (100.0%) |
| Security & Protection | 540 (84.0%) | 103 (16.0%) |
| Firefighting & Prevention | 301 (78.6%) | 82 (21.4%) |
| Law Enforcement | 239 (91.9%) | 21 (8.1%) |
| Food Preparation & Serving | 550 (54.0%) | 469 (46.0%) |
| Cleaning & Maintenance | 504 (57.7%) | 369 (42.3%) |
| Personal Care & Service | 138 (62.2%) | 84 (37.8%) |
| Total (Category) | 1,732 (57.1%) | 1,304 (42.9%) |
| Total (Overall) | 8,304 (53.9%) | 7,098 (46.1%) |
Sales and Office Occupations
The most common Sales and Office occupations in Cabo Rojo Municipio are Office & Administration (2,117 | 13.7%), and Sales & Related (2,006 | 13.0%).

Sales and Office Occupations by Sex
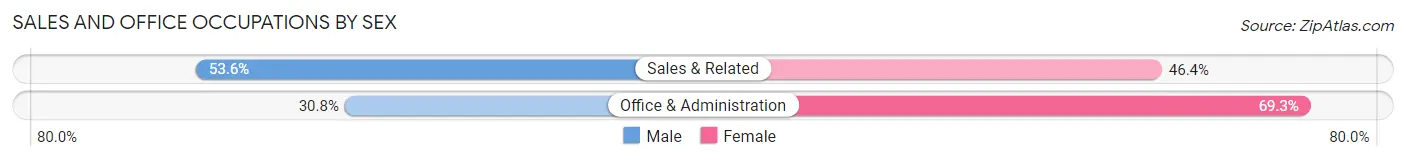
| Occupation | Male | Female |
| Sales & Related | 1,076 (53.6%) | 930 (46.4%) |
| Office & Administration | 651 (30.7%) | 1,466 (69.3%) |
| Total (Category) | 1,727 (41.9%) | 2,396 (58.1%) |
| Total (Overall) | 8,304 (53.9%) | 7,098 (46.1%) |
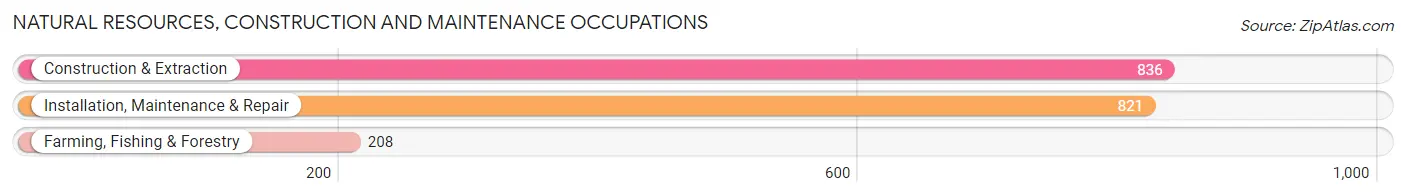
Natural Resources, Construction and Maintenance Occupations
The most common Natural Resources, Construction and Maintenance occupations in Cabo Rojo Municipio are Construction & Extraction (836 | 5.4%), Installation, Maintenance & Repair (821 | 5.3%), and Farming, Fishing & Forestry (208 | 1.3%).
Natural Resources, Construction and Maintenance Occupations by Sex
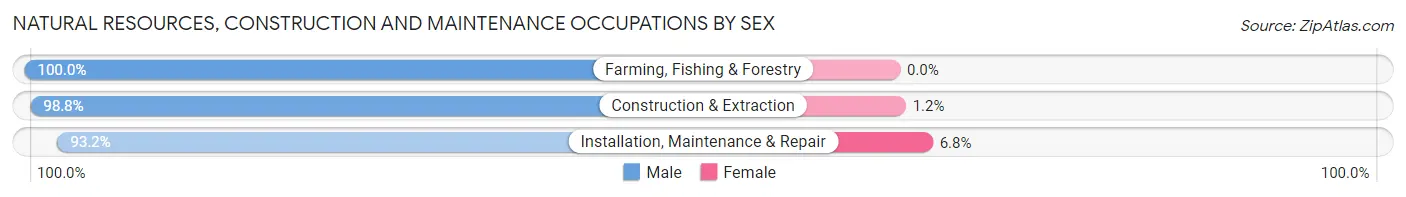
| Occupation | Male | Female |
| Farming, Fishing & Forestry | 208 (100.0%) | 0 (0.0%) |
| Construction & Extraction | 826 (98.8%) | 10 (1.2%) |
| Installation, Maintenance & Repair | 765 (93.2%) | 56 (6.8%) |
| Total (Category) | 1,799 (96.5%) | 66 (3.5%) |
| Total (Overall) | 8,304 (53.9%) | 7,098 (46.1%) |
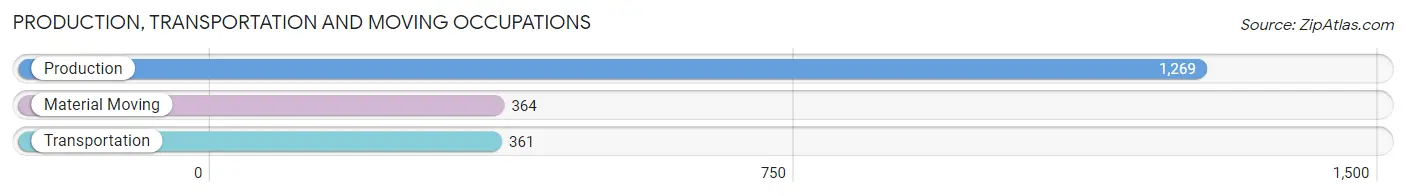
Production, Transportation and Moving Occupations
The most common Production, Transportation and Moving occupations in Cabo Rojo Municipio are Production (1,269 | 8.2%), Material Moving (364 | 2.4%), and Transportation (361 | 2.3%).
Production, Transportation and Moving Occupations by Sex
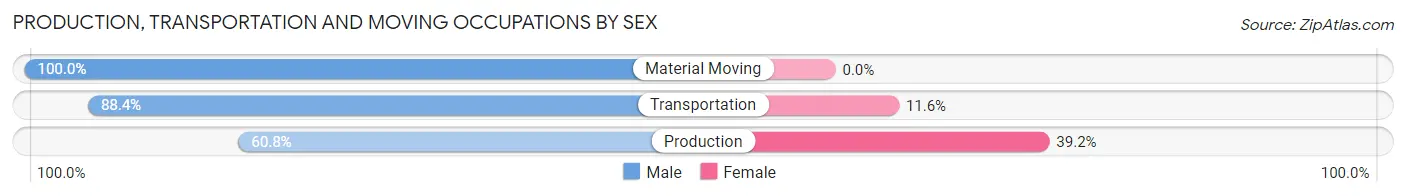
| Occupation | Male | Female |
| Production | 771 (60.8%) | 498 (39.2%) |
| Transportation | 319 (88.4%) | 42 (11.6%) |
| Material Moving | 364 (100.0%) | 0 (0.0%) |
| Total (Category) | 1,454 (72.9%) | 540 (27.1%) |
| Total (Overall) | 8,304 (53.9%) | 7,098 (46.1%) |
Employment Industries by Sex in Cabo Rojo Municipio
Employment Industries in Cabo Rojo Municipio
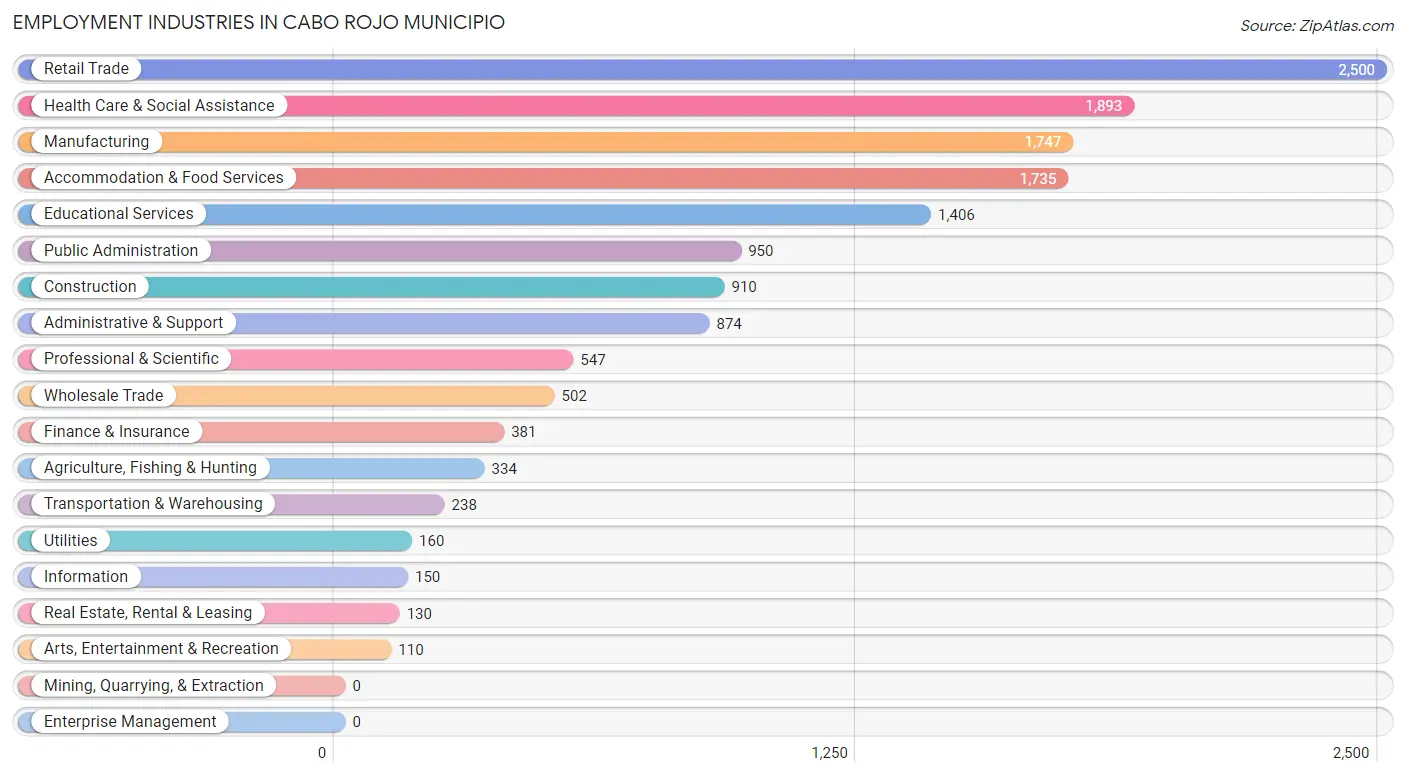
The major employment industries in Cabo Rojo Municipio include Retail Trade (2,500 | 16.2%), Health Care & Social Assistance (1,893 | 12.3%), Manufacturing (1,747 | 11.3%), Accommodation & Food Services (1,735 | 11.3%), and Educational Services (1,406 | 9.1%).
Employment Industries by Sex in Cabo Rojo Municipio
The Cabo Rojo Municipio industries that see more men than women are Utilities (100.0%), Construction (97.0%), and Information (88.7%), whereas the industries that tend to have a higher number of women are Real Estate, Rental & Leasing (76.9%), Educational Services (74.0%), and Health Care & Social Assistance (73.3%).
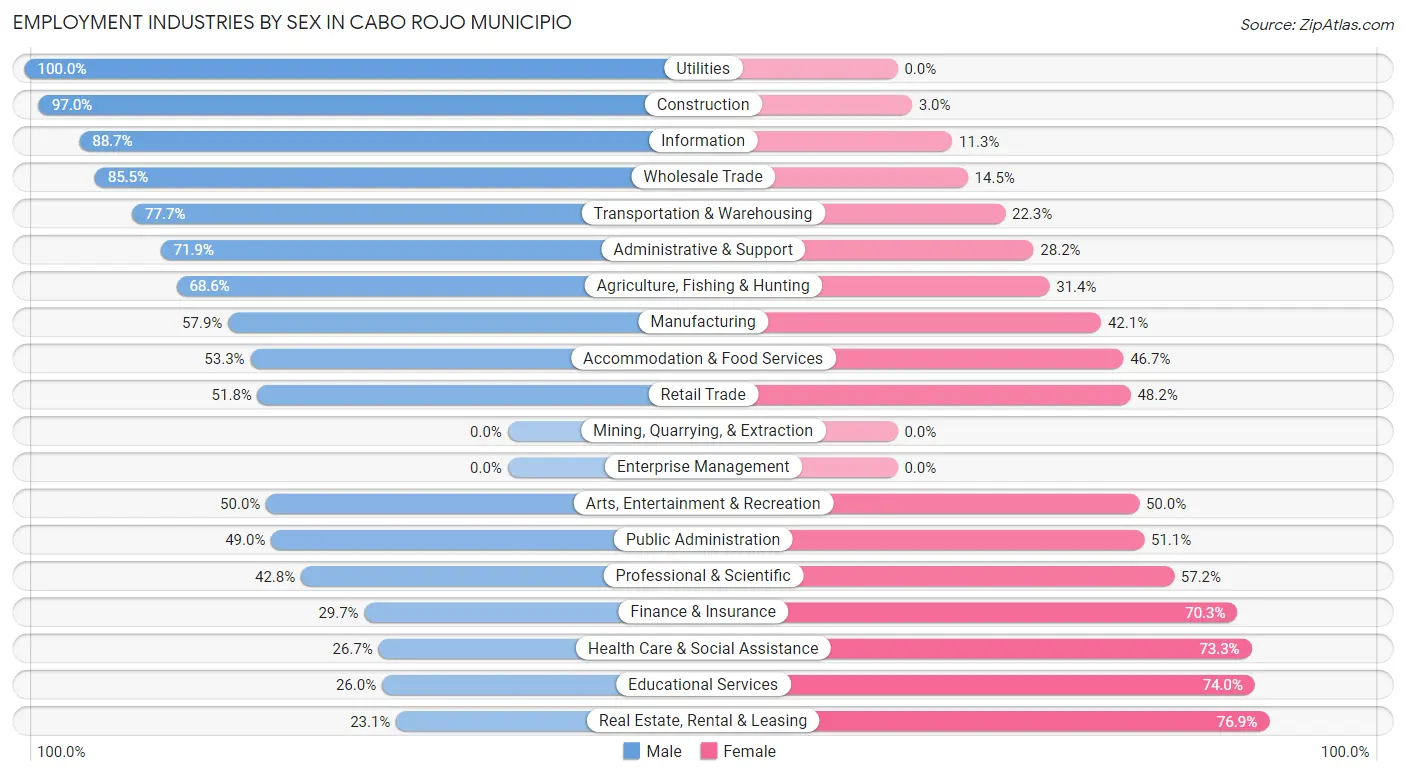
| Industry | Male | Female |
| Agriculture, Fishing & Hunting | 229 (68.6%) | 105 (31.4%) |
| Mining, Quarrying, & Extraction | 0 (0.0%) | 0 (0.0%) |
| Construction | 883 (97.0%) | 27 (3.0%) |
| Manufacturing | 1,011 (57.9%) | 736 (42.1%) |
| Wholesale Trade | 429 (85.5%) | 73 (14.5%) |
| Retail Trade | 1,294 (51.8%) | 1,206 (48.2%) |
| Transportation & Warehousing | 185 (77.7%) | 53 (22.3%) |
| Utilities | 160 (100.0%) | 0 (0.0%) |
| Information | 133 (88.7%) | 17 (11.3%) |
| Finance & Insurance | 113 (29.7%) | 268 (70.3%) |
| Real Estate, Rental & Leasing | 30 (23.1%) | 100 (76.9%) |
| Professional & Scientific | 234 (42.8%) | 313 (57.2%) |
| Enterprise Management | 0 (0.0%) | 0 (0.0%) |
| Administrative & Support | 628 (71.9%) | 246 (28.1%) |
| Educational Services | 366 (26.0%) | 1,040 (74.0%) |
| Health Care & Social Assistance | 506 (26.7%) | 1,387 (73.3%) |
| Arts, Entertainment & Recreation | 55 (50.0%) | 55 (50.0%) |
| Accommodation & Food Services | 924 (53.3%) | 811 (46.7%) |
| Public Administration | 465 (48.9%) | 485 (51.0%) |
| Total | 8,304 (53.9%) | 7,098 (46.1%) |
Education in Cabo Rojo Municipio
School Enrollment in Cabo Rojo Municipio
The most common levels of schooling among the 9,420 students in Cabo Rojo Municipio are college / undergraduate (2,568 | 27.3%), high school (2,059 | 21.9%), and middle school (2,035 | 21.6%).
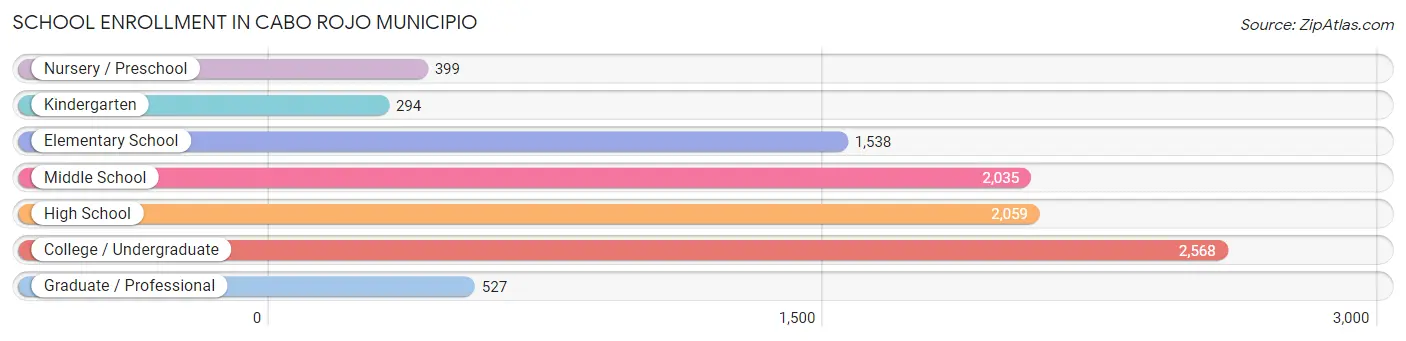
| School Level | # Students | % Students |
| Nursery / Preschool | 399 | 4.2% |
| Kindergarten | 294 | 3.1% |
| Elementary School | 1,538 | 16.3% |
| Middle School | 2,035 | 21.6% |
| High School | 2,059 | 21.9% |
| College / Undergraduate | 2,568 | 27.3% |
| Graduate / Professional | 527 | 5.6% |
| Total | 9,420 | 100.0% |
School Enrollment by Age by Funding Source in Cabo Rojo Municipio
Out of a total of 9,420 students who are enrolled in schools in Cabo Rojo Municipio, 4,060 (43.1%) attend a private institution, while the remaining 5,360 (56.9%) are enrolled in public schools. The age group of 25 to 34 year olds has the highest likelihood of being enrolled in private schools, with 503 (76.7% in the age bracket) enrolled. Conversely, the age group of 10 to 14 year olds has the lowest likelihood of being enrolled in a private school, with 1,980 (75.2% in the age bracket) attending a public institution.
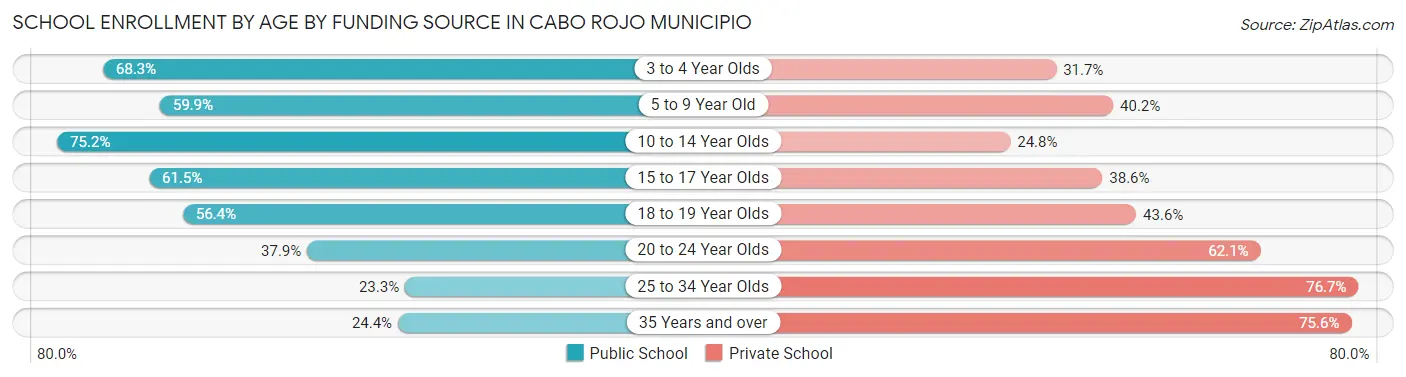
| Age Bracket | Public School | Private School |
| 3 to 4 Year Olds | 192 (68.3%) | 89 (31.7%) |
| 5 to 9 Year Old | 1,015 (59.9%) | 681 (40.2%) |
| 10 to 14 Year Olds | 1,980 (75.2%) | 654 (24.8%) |
| 15 to 17 Year Olds | 955 (61.5%) | 599 (38.6%) |
| 18 to 19 Year Olds | 466 (56.4%) | 360 (43.6%) |
| 20 to 24 Year Olds | 462 (37.9%) | 757 (62.1%) |
| 25 to 34 Year Olds | 153 (23.3%) | 503 (76.7%) |
| 35 Years and over | 135 (24.4%) | 419 (75.6%) |
| Total | 5,360 (56.9%) | 4,060 (43.1%) |
Educational Attainment by Field of Study in Cabo Rojo Municipio
Business (2,923 | 29.5%), education (1,506 | 15.2%), science & technology (1,208 | 12.2%), bio, nature & agricultural (1,053 | 10.6%), and arts & humanities (606 | 6.1%) are the most common fields of study among 9,906 individuals in Cabo Rojo Municipio who have obtained a bachelor's degree or higher.
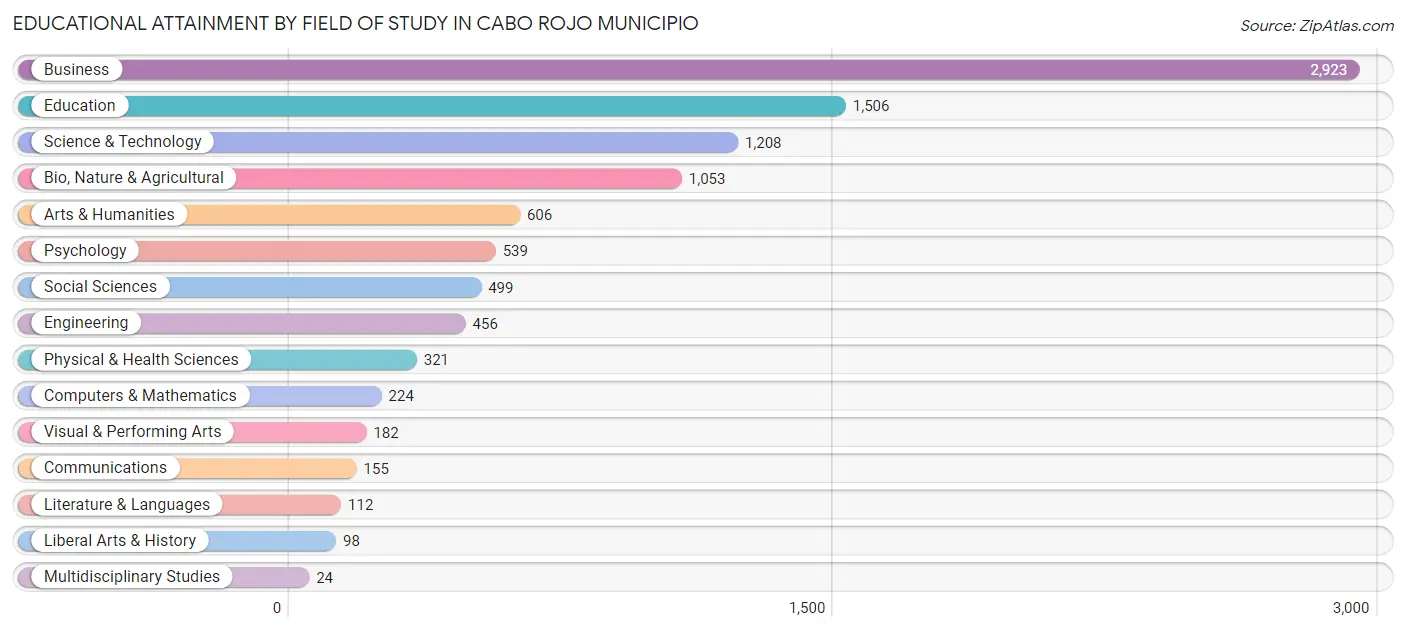
| Field of Study | # Graduates | % Graduates |
| Computers & Mathematics | 224 | 2.3% |
| Bio, Nature & Agricultural | 1,053 | 10.6% |
| Physical & Health Sciences | 321 | 3.2% |
| Psychology | 539 | 5.4% |
| Social Sciences | 499 | 5.0% |
| Engineering | 456 | 4.6% |
| Multidisciplinary Studies | 24 | 0.2% |
| Science & Technology | 1,208 | 12.2% |
| Business | 2,923 | 29.5% |
| Education | 1,506 | 15.2% |
| Literature & Languages | 112 | 1.1% |
| Liberal Arts & History | 98 | 1.0% |
| Visual & Performing Arts | 182 | 1.8% |
| Communications | 155 | 1.6% |
| Arts & Humanities | 606 | 6.1% |
| Total | 9,906 | 100.0% |
Transportation & Commute in Cabo Rojo Municipio
Vehicle Availability by Sex in Cabo Rojo Municipio
The most prevalent vehicle ownership categories in Cabo Rojo Municipio are males with 2 vehicles (3,864, accounting for 47.3%) and females with 2 vehicles (2,878, making up 58.0%).
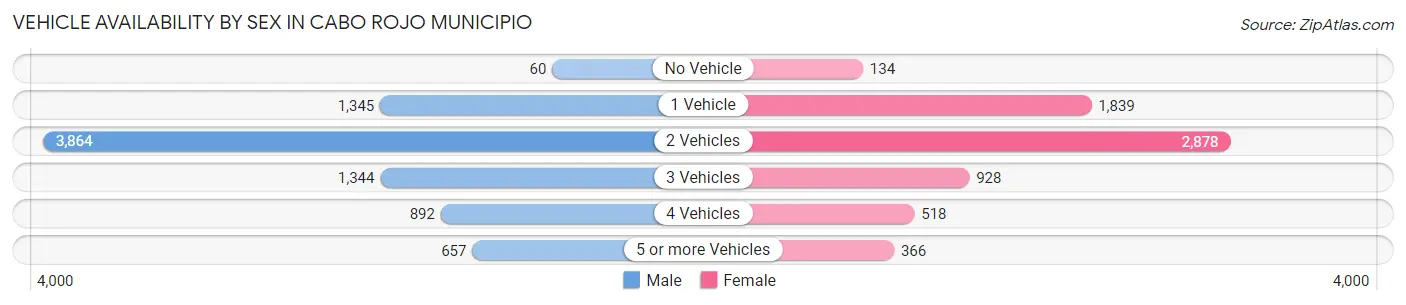
| Vehicles Available | Male | Female |
| No Vehicle | 60 (0.7%) | 134 (2.0%) |
| 1 Vehicle | 1,345 (16.5%) | 1,839 (27.6%) |
| 2 Vehicles | 3,864 (47.3%) | 2,878 (43.2%) |
| 3 Vehicles | 1,344 (16.5%) | 928 (13.9%) |
| 4 Vehicles | 892 (10.9%) | 518 (7.8%) |
| 5 or more Vehicles | 657 (8.1%) | 366 (5.5%) |
| Total | 8,162 (100.0%) | 6,663 (100.0%) |
Commute Time in Cabo Rojo Municipio
The most frequently occuring commute durations in Cabo Rojo Municipio are 10 to 14 minutes (2,255 commuters, 16.2%), 20 to 24 minutes (2,103 commuters, 15.1%), and 30 to 34 minutes (2,051 commuters, 14.7%).
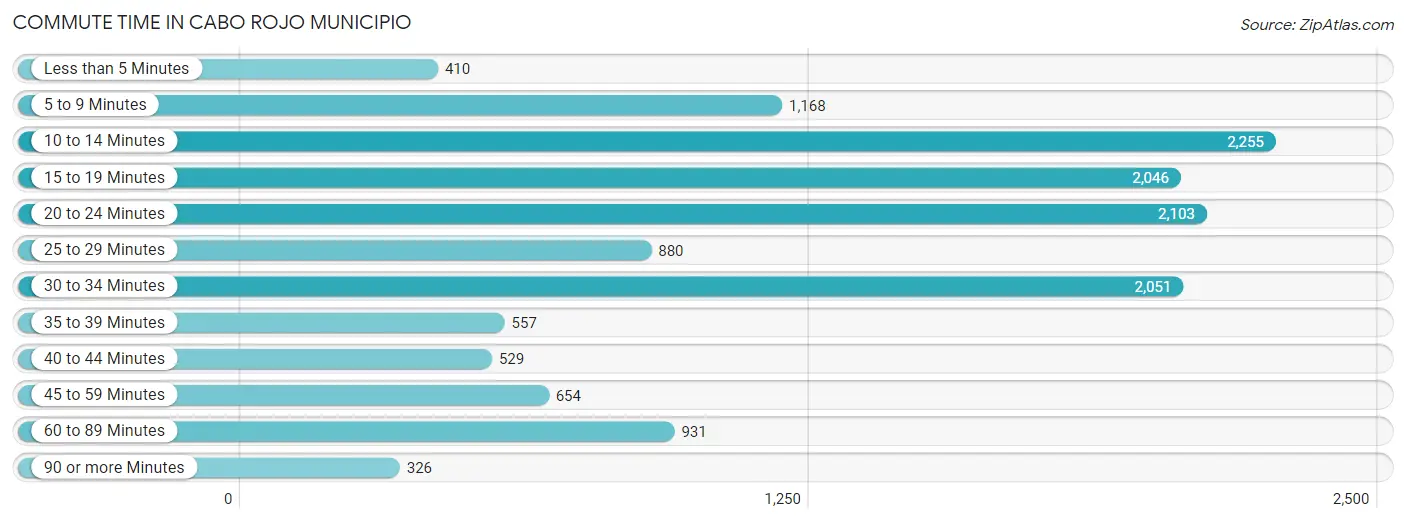
| Commute Time | # Commuters | % Commuters |
| Less than 5 Minutes | 410 | 2.9% |
| 5 to 9 Minutes | 1,168 | 8.4% |
| 10 to 14 Minutes | 2,255 | 16.2% |
| 15 to 19 Minutes | 2,046 | 14.7% |
| 20 to 24 Minutes | 2,103 | 15.1% |
| 25 to 29 Minutes | 880 | 6.3% |
| 30 to 34 Minutes | 2,051 | 14.7% |
| 35 to 39 Minutes | 557 | 4.0% |
| 40 to 44 Minutes | 529 | 3.8% |
| 45 to 59 Minutes | 654 | 4.7% |
| 60 to 89 Minutes | 931 | 6.7% |
| 90 or more Minutes | 326 | 2.3% |
Commute Time by Sex in Cabo Rojo Municipio
The most common commute times in Cabo Rojo Municipio are 10 to 14 minutes (1,226 commuters, 16.3%) for males and 30 to 34 minutes (1,058 commuters, 16.6%) for females.
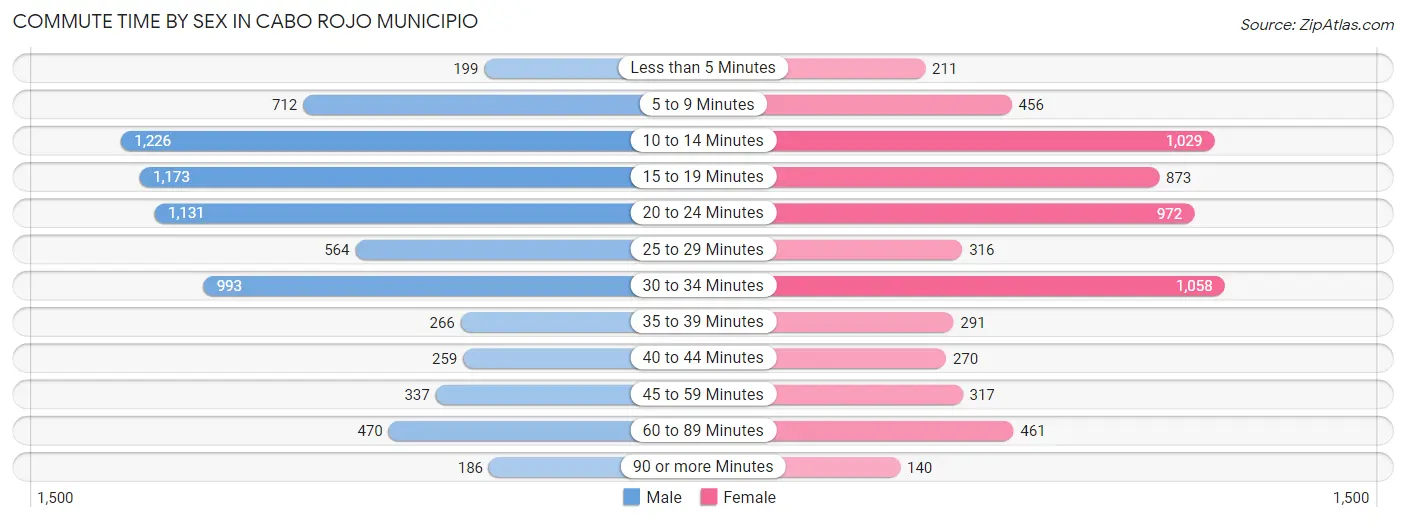
| Commute Time | Male | Female |
| Less than 5 Minutes | 199 (2.6%) | 211 (3.3%) |
| 5 to 9 Minutes | 712 (9.5%) | 456 (7.1%) |
| 10 to 14 Minutes | 1,226 (16.3%) | 1,029 (16.1%) |
| 15 to 19 Minutes | 1,173 (15.6%) | 873 (13.7%) |
| 20 to 24 Minutes | 1,131 (15.0%) | 972 (15.2%) |
| 25 to 29 Minutes | 564 (7.5%) | 316 (4.9%) |
| 30 to 34 Minutes | 993 (13.2%) | 1,058 (16.6%) |
| 35 to 39 Minutes | 266 (3.5%) | 291 (4.5%) |
| 40 to 44 Minutes | 259 (3.5%) | 270 (4.2%) |
| 45 to 59 Minutes | 337 (4.5%) | 317 (5.0%) |
| 60 to 89 Minutes | 470 (6.2%) | 461 (7.2%) |
| 90 or more Minutes | 186 (2.5%) | 140 (2.2%) |
Time of Departure to Work by Sex in Cabo Rojo Municipio
The most frequent times of departure to work in Cabo Rojo Municipio are 7:00 AM to 7:29 AM (1,127, 15.0%) for males and 7:00 AM to 7:29 AM (1,518, 23.7%) for females.
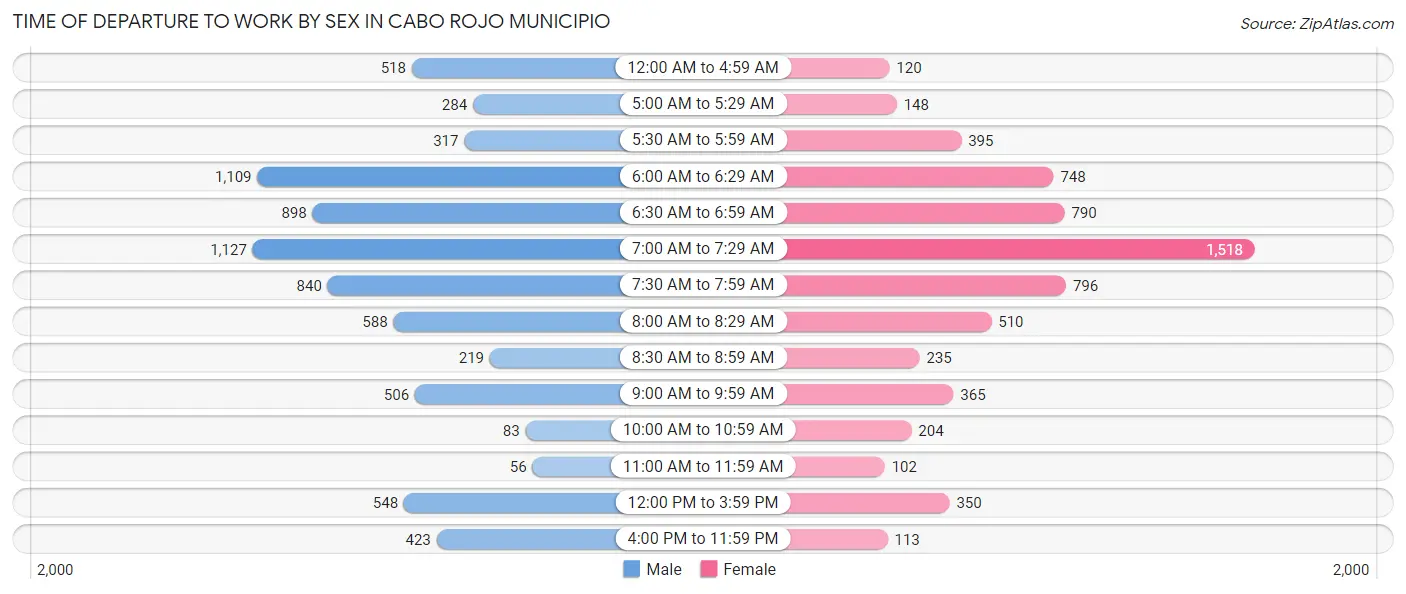
| Time of Departure | Male | Female |
| 12:00 AM to 4:59 AM | 518 (6.9%) | 120 (1.9%) |
| 5:00 AM to 5:29 AM | 284 (3.8%) | 148 (2.3%) |
| 5:30 AM to 5:59 AM | 317 (4.2%) | 395 (6.2%) |
| 6:00 AM to 6:29 AM | 1,109 (14.8%) | 748 (11.7%) |
| 6:30 AM to 6:59 AM | 898 (11.9%) | 790 (12.4%) |
| 7:00 AM to 7:29 AM | 1,127 (15.0%) | 1,518 (23.7%) |
| 7:30 AM to 7:59 AM | 840 (11.2%) | 796 (12.4%) |
| 8:00 AM to 8:29 AM | 588 (7.8%) | 510 (8.0%) |
| 8:30 AM to 8:59 AM | 219 (2.9%) | 235 (3.7%) |
| 9:00 AM to 9:59 AM | 506 (6.7%) | 365 (5.7%) |
| 10:00 AM to 10:59 AM | 83 (1.1%) | 204 (3.2%) |
| 11:00 AM to 11:59 AM | 56 (0.7%) | 102 (1.6%) |
| 12:00 PM to 3:59 PM | 548 (7.3%) | 350 (5.5%) |
| 4:00 PM to 11:59 PM | 423 (5.6%) | 113 (1.8%) |
| Total | 7,516 (100.0%) | 6,394 (100.0%) |
Housing Occupancy in Cabo Rojo Municipio
Occupancy by Ownership in Cabo Rojo Municipio
Of the total 17,568 dwellings in Cabo Rojo Municipio, owner-occupied units account for 13,061 (74.4%), while renter-occupied units make up 4,507 (25.7%).
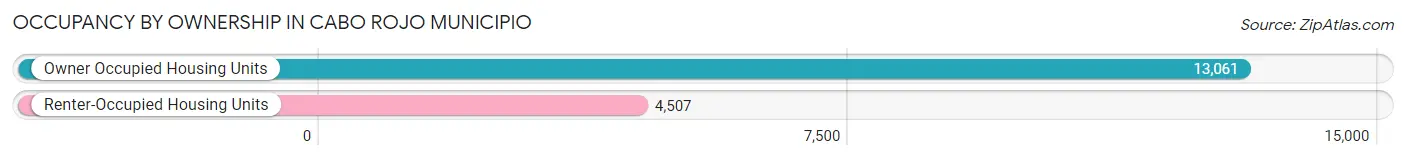
| Occupancy | # Housing Units | % Housing Units |
| Owner Occupied Housing Units | 13,061 | 74.4% |
| Renter-Occupied Housing Units | 4,507 | 25.7% |
| Total Occupied Housing Units | 17,568 | 100.0% |
Occupancy by Household Size in Cabo Rojo Municipio
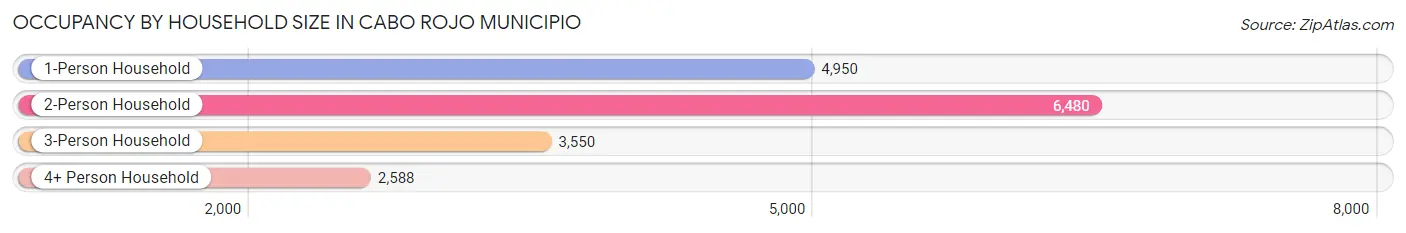
| Household Size | # Housing Units | % Housing Units |
| 1-Person Household | 4,950 | 28.2% |
| 2-Person Household | 6,480 | 36.9% |
| 3-Person Household | 3,550 | 20.2% |
| 4+ Person Household | 2,588 | 14.7% |
| Total Housing Units | 17,568 | 100.0% |
Occupancy by Ownership by Household Size in Cabo Rojo Municipio
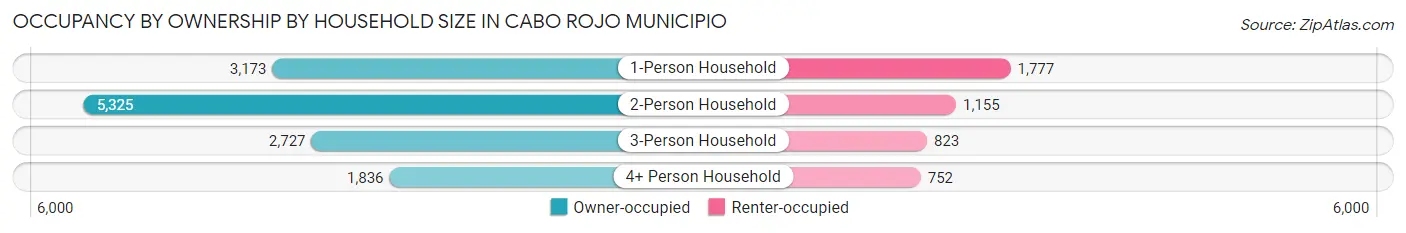
| Household Size | Owner-occupied | Renter-occupied |
| 1-Person Household | 3,173 (64.1%) | 1,777 (35.9%) |
| 2-Person Household | 5,325 (82.2%) | 1,155 (17.8%) |
| 3-Person Household | 2,727 (76.8%) | 823 (23.2%) |
| 4+ Person Household | 1,836 (70.9%) | 752 (29.1%) |
| Total Housing Units | 13,061 (74.4%) | 4,507 (25.7%) |
Occupancy by Educational Attainment in Cabo Rojo Municipio
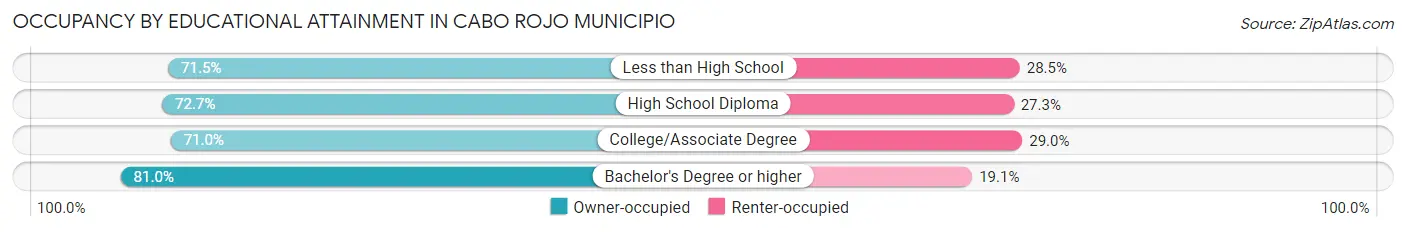
| Household Size | Owner-occupied | Renter-occupied |
| Less than High School | 3,407 (71.5%) | 1,356 (28.5%) |
| High School Diploma | 2,811 (72.7%) | 1,054 (27.3%) |
| College/Associate Degree | 2,822 (71.0%) | 1,151 (29.0%) |
| Bachelor's Degree or higher | 4,021 (80.9%) | 946 (19.1%) |
Occupancy by Age of Householder in Cabo Rojo Municipio
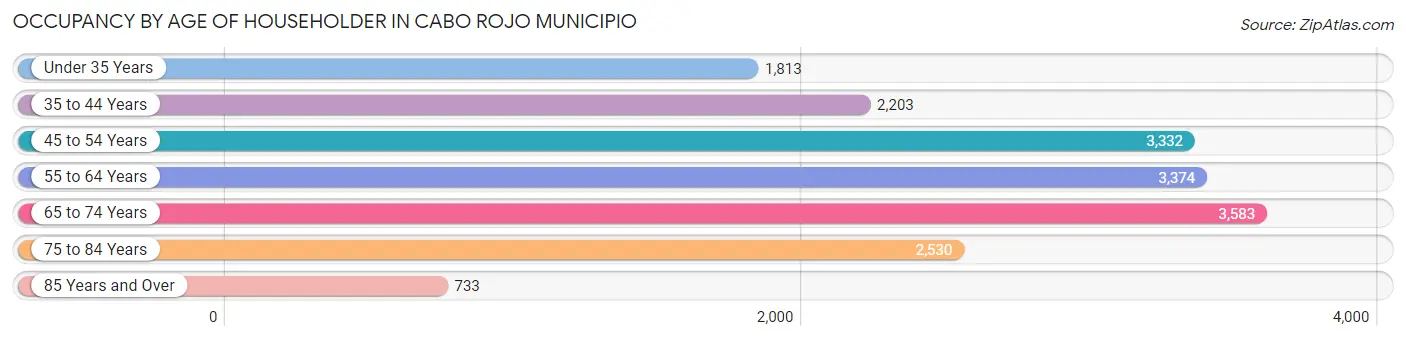
| Age Bracket | # Households | % Households |
| Under 35 Years | 1,813 | 10.3% |
| 35 to 44 Years | 2,203 | 12.5% |
| 45 to 54 Years | 3,332 | 19.0% |
| 55 to 64 Years | 3,374 | 19.2% |
| 65 to 74 Years | 3,583 | 20.4% |
| 75 to 84 Years | 2,530 | 14.4% |
| 85 Years and Over | 733 | 4.2% |
| Total | 17,568 | 100.0% |
Housing Finances in Cabo Rojo Municipio
Median Income by Occupancy in Cabo Rojo Municipio
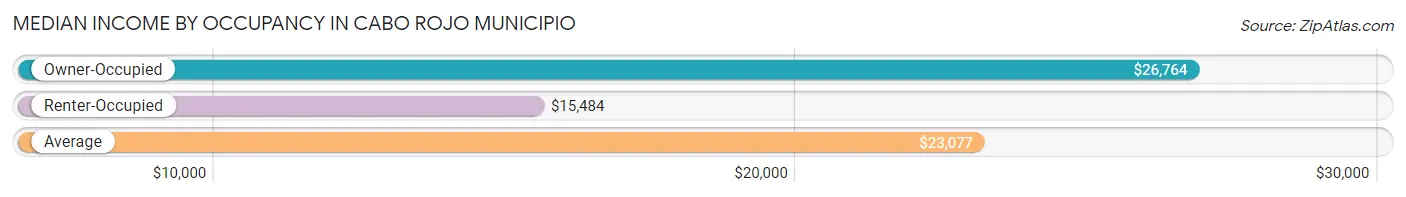
| Occupancy Type | # Households | Median Income |
| Owner-Occupied | 13,061 (74.4%) | $26,764 |
| Renter-Occupied | 4,507 (25.7%) | $15,484 |
| Average | 17,568 (100.0%) | $23,077 |
Occupancy by Householder Income Bracket in Cabo Rojo Municipio
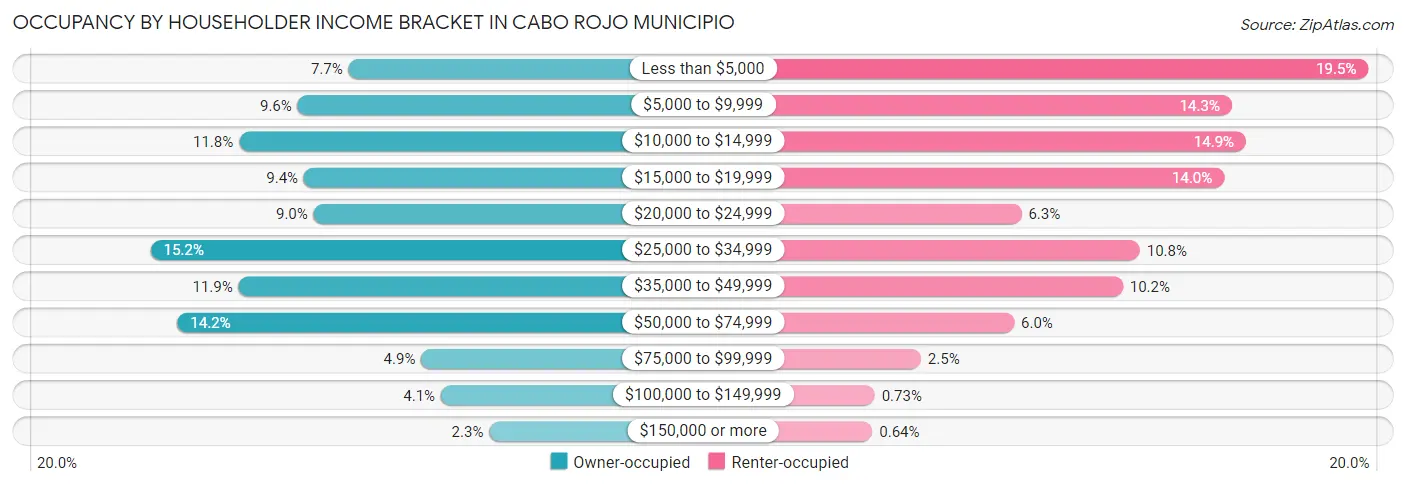
| Income Bracket | Owner-occupied | Renter-occupied |
| Less than $5,000 | 1,001 (7.7%) | 880 (19.5%) |
| $5,000 to $9,999 | 1,254 (9.6%) | 646 (14.3%) |
| $10,000 to $14,999 | 1,545 (11.8%) | 670 (14.9%) |
| $15,000 to $19,999 | 1,222 (9.4%) | 633 (14.0%) |
| $20,000 to $24,999 | 1,174 (9.0%) | 285 (6.3%) |
| $25,000 to $34,999 | 1,985 (15.2%) | 488 (10.8%) |
| $35,000 to $49,999 | 1,548 (11.8%) | 459 (10.2%) |
| $50,000 to $74,999 | 1,852 (14.2%) | 272 (6.0%) |
| $75,000 to $99,999 | 639 (4.9%) | 112 (2.5%) |
| $100,000 to $149,999 | 541 (4.1%) | 33 (0.7%) |
| $150,000 or more | 300 (2.3%) | 29 (0.6%) |
| Total | 13,061 (100.0%) | 4,507 (100.0%) |
Monthly Housing Cost Tiers in Cabo Rojo Municipio
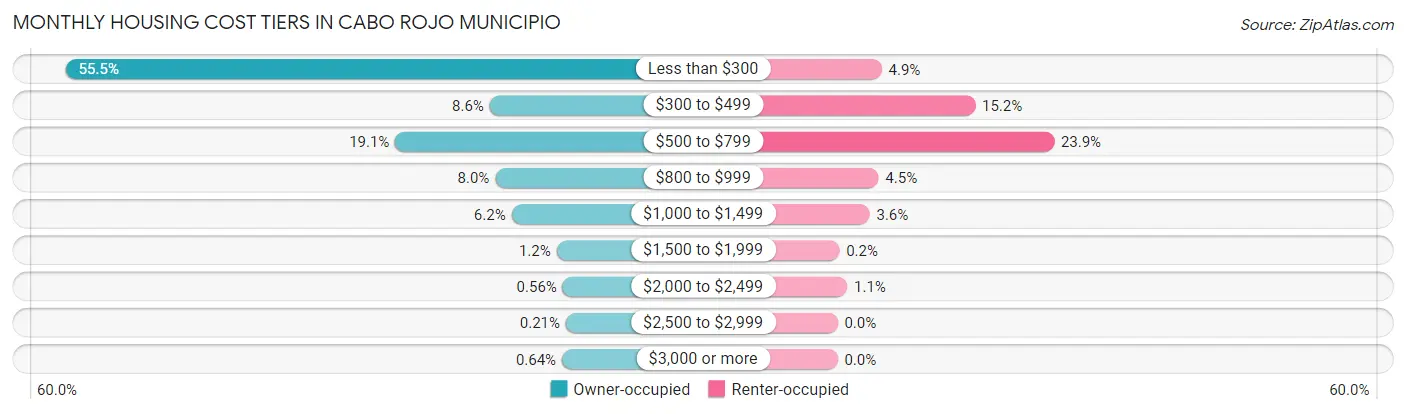
| Monthly Cost | Owner-occupied | Renter-occupied |
| Less than $300 | 7,246 (55.5%) | 220 (4.9%) |
| $300 to $499 | 1,126 (8.6%) | 685 (15.2%) |
| $500 to $799 | 2,489 (19.1%) | 1,078 (23.9%) |
| $800 to $999 | 1,046 (8.0%) | 204 (4.5%) |
| $1,000 to $1,499 | 811 (6.2%) | 160 (3.5%) |
| $1,500 to $1,999 | 160 (1.2%) | 9 (0.2%) |
| $2,000 to $2,499 | 73 (0.6%) | 48 (1.1%) |
| $2,500 to $2,999 | 27 (0.2%) | 0 (0.0%) |
| $3,000 or more | 83 (0.6%) | 0 (0.0%) |
| Total | 13,061 (100.0%) | 4,507 (100.0%) |
Physical Housing Characteristics in Cabo Rojo Municipio
Housing Structures in Cabo Rojo Municipio
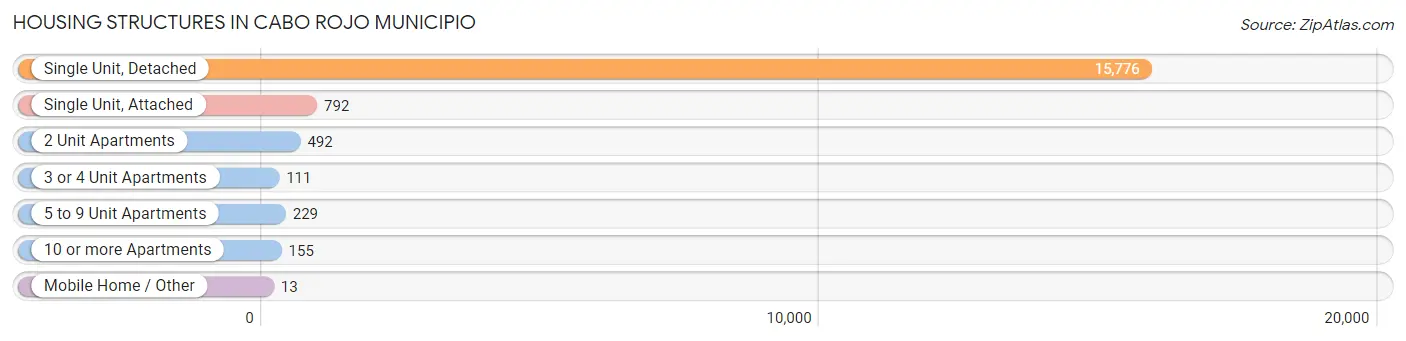
| Structure Type | # Housing Units | % Housing Units |
| Single Unit, Detached | 15,776 | 89.8% |
| Single Unit, Attached | 792 | 4.5% |
| 2 Unit Apartments | 492 | 2.8% |
| 3 or 4 Unit Apartments | 111 | 0.6% |
| 5 to 9 Unit Apartments | 229 | 1.3% |
| 10 or more Apartments | 155 | 0.9% |
| Mobile Home / Other | 13 | 0.1% |
| Total | 17,568 | 100.0% |
Housing Structures by Occupancy in Cabo Rojo Municipio
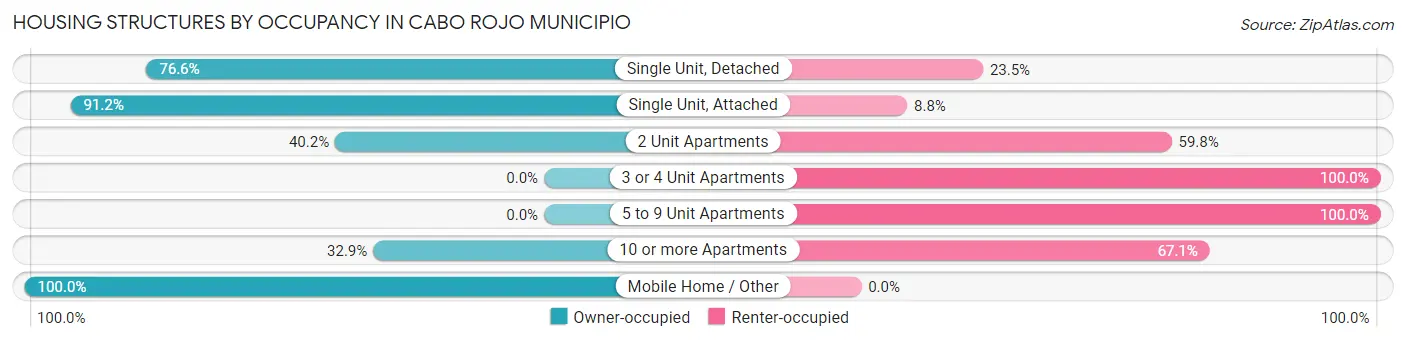
| Structure Type | Owner-occupied | Renter-occupied |
| Single Unit, Detached | 12,077 (76.5%) | 3,699 (23.4%) |
| Single Unit, Attached | 722 (91.2%) | 70 (8.8%) |
| 2 Unit Apartments | 198 (40.2%) | 294 (59.8%) |
| 3 or 4 Unit Apartments | 0 (0.0%) | 111 (100.0%) |
| 5 to 9 Unit Apartments | 0 (0.0%) | 229 (100.0%) |
| 10 or more Apartments | 51 (32.9%) | 104 (67.1%) |
| Mobile Home / Other | 13 (100.0%) | 0 (0.0%) |
| Total | 13,061 (74.4%) | 4,507 (25.7%) |
Housing Structures by Number of Rooms in Cabo Rojo Municipio
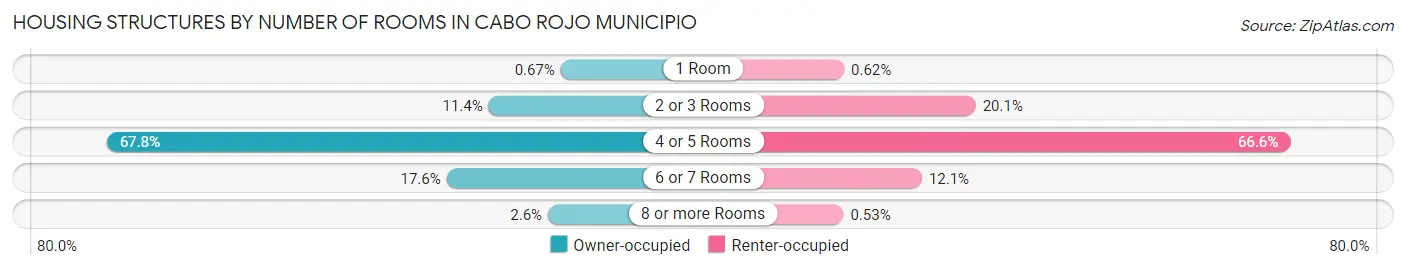
| Number of Rooms | Owner-occupied | Renter-occupied |
| 1 Room | 88 (0.7%) | 28 (0.6%) |
| 2 or 3 Rooms | 1,483 (11.4%) | 906 (20.1%) |
| 4 or 5 Rooms | 8,861 (67.8%) | 3,002 (66.6%) |
| 6 or 7 Rooms | 2,294 (17.6%) | 547 (12.1%) |
| 8 or more Rooms | 335 (2.6%) | 24 (0.5%) |
| Total | 13,061 (100.0%) | 4,507 (100.0%) |
Housing Structure by Heating Type in Cabo Rojo Municipio
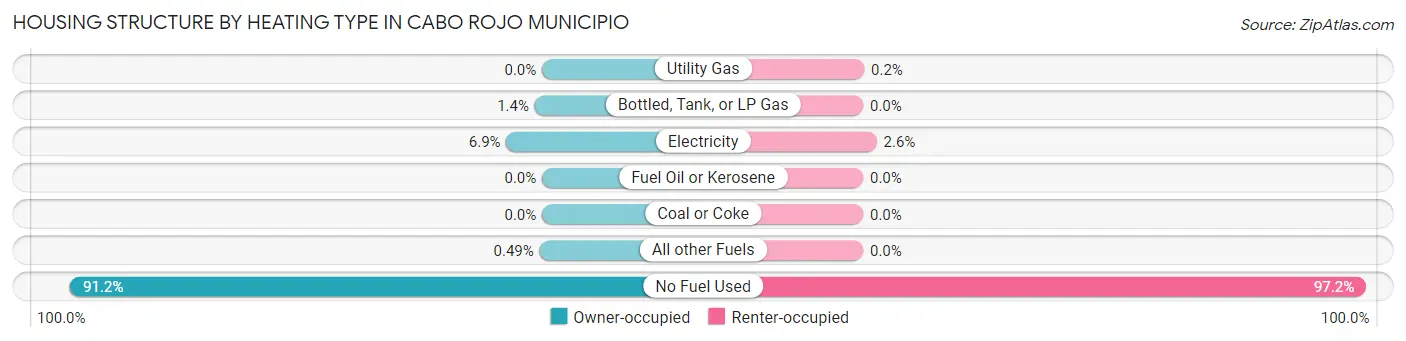
| Heating Type | Owner-occupied | Renter-occupied |
| Utility Gas | 0 (0.0%) | 9 (0.2%) |
| Bottled, Tank, or LP Gas | 184 (1.4%) | 0 (0.0%) |
| Electricity | 900 (6.9%) | 118 (2.6%) |
| Fuel Oil or Kerosene | 0 (0.0%) | 0 (0.0%) |
| Coal or Coke | 0 (0.0%) | 0 (0.0%) |
| All other Fuels | 64 (0.5%) | 0 (0.0%) |
| No Fuel Used | 11,913 (91.2%) | 4,380 (97.2%) |
| Total | 13,061 (100.0%) | 4,507 (100.0%) |
Household Vehicle Usage in Cabo Rojo Municipio
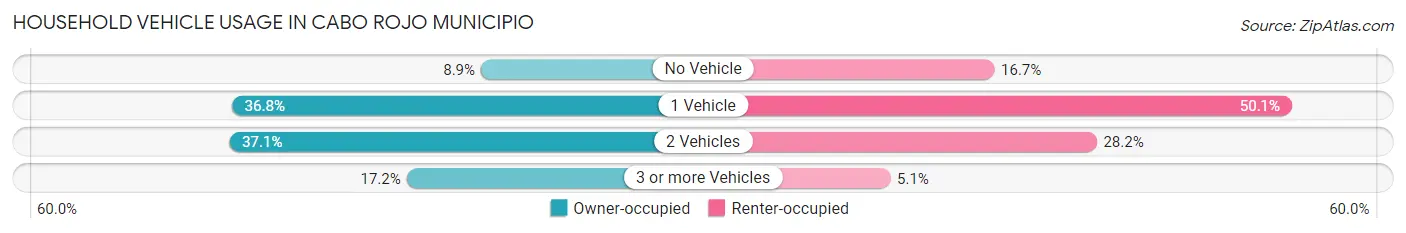
| Vehicles per Household | Owner-occupied | Renter-occupied |
| No Vehicle | 1,161 (8.9%) | 753 (16.7%) |
| 1 Vehicle | 4,806 (36.8%) | 2,256 (50.1%) |
| 2 Vehicles | 4,846 (37.1%) | 1,270 (28.2%) |
| 3 or more Vehicles | 2,248 (17.2%) | 228 (5.1%) |
| Total | 13,061 (100.0%) | 4,507 (100.0%) |
Real Estate & Mortgages in Cabo Rojo Municipio
Real Estate and Mortgage Overview in Cabo Rojo Municipio
| Characteristic | Without Mortgage | With Mortgage |
| Housing Units | 8,193 | 4,868 |
| Median Property Value | $96,900 | $134,400 |
| Median Household Income | $20,639 | $170 |
| Monthly Housing Costs | $153 | $83 |
| Real Estate Taxes | $372 | $4,534 |
Property Value by Mortgage Status in Cabo Rojo Municipio
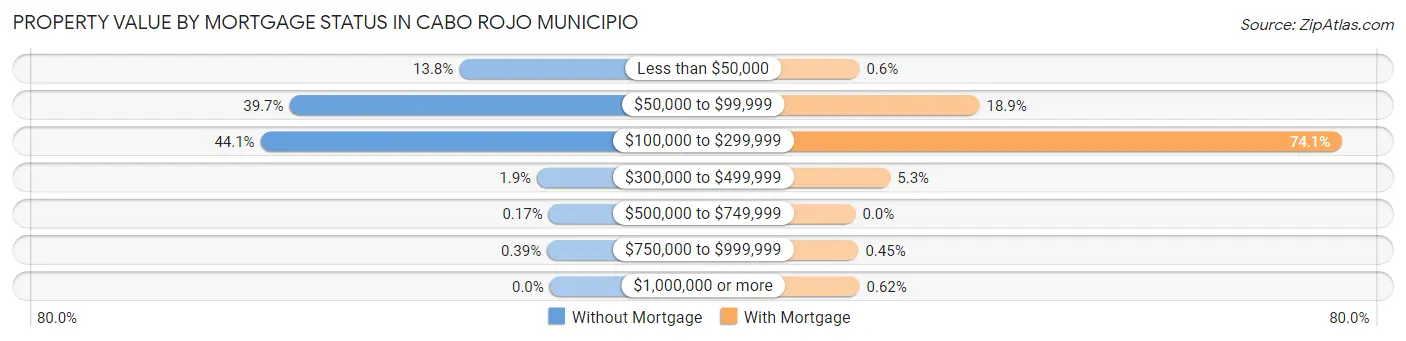
| Property Value | Without Mortgage | With Mortgage |
| Less than $50,000 | 1,130 (13.8%) | 29 (0.6%) |
| $50,000 to $99,999 | 3,249 (39.7%) | 920 (18.9%) |
| $100,000 to $299,999 | 3,610 (44.1%) | 3,609 (74.1%) |
| $300,000 to $499,999 | 158 (1.9%) | 258 (5.3%) |
| $500,000 to $749,999 | 14 (0.2%) | 0 (0.0%) |
| $750,000 to $999,999 | 32 (0.4%) | 22 (0.4%) |
| $1,000,000 or more | 0 (0.0%) | 30 (0.6%) |
| Total | 8,193 (100.0%) | 4,868 (100.0%) |
Household Income by Mortgage Status in Cabo Rojo Municipio
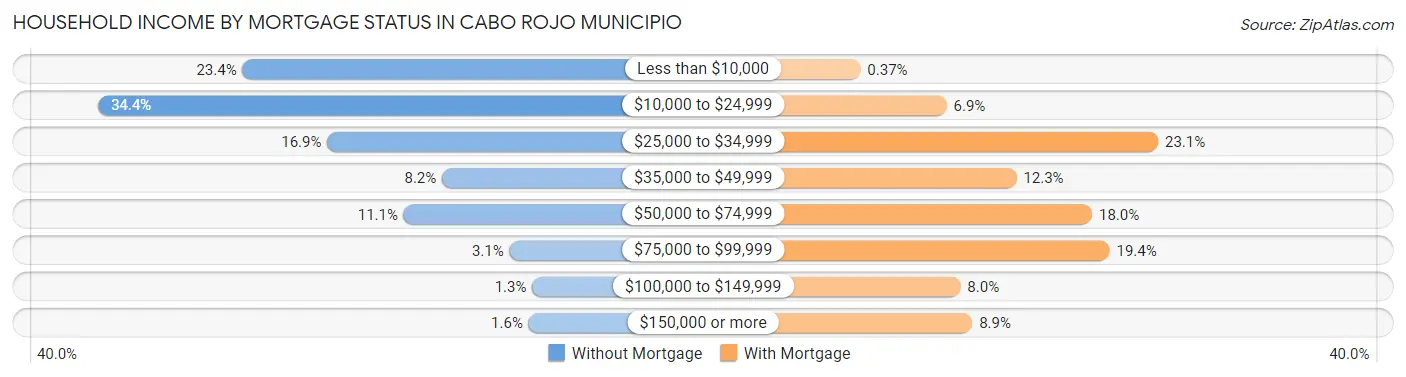
| Household Income | Without Mortgage | With Mortgage |
| Less than $10,000 | 1,917 (23.4%) | 18 (0.4%) |
| $10,000 to $24,999 | 2,819 (34.4%) | 338 (6.9%) |
| $25,000 to $34,999 | 1,388 (16.9%) | 1,122 (23.1%) |
| $35,000 to $49,999 | 671 (8.2%) | 597 (12.3%) |
| $50,000 to $74,999 | 910 (11.1%) | 877 (18.0%) |
| $75,000 to $99,999 | 250 (3.0%) | 942 (19.4%) |
| $100,000 to $149,999 | 108 (1.3%) | 389 (8.0%) |
| $150,000 or more | 130 (1.6%) | 433 (8.9%) |
| Total | 8,193 (100.0%) | 4,868 (100.0%) |
Property Value to Household Income Ratio in Cabo Rojo Municipio
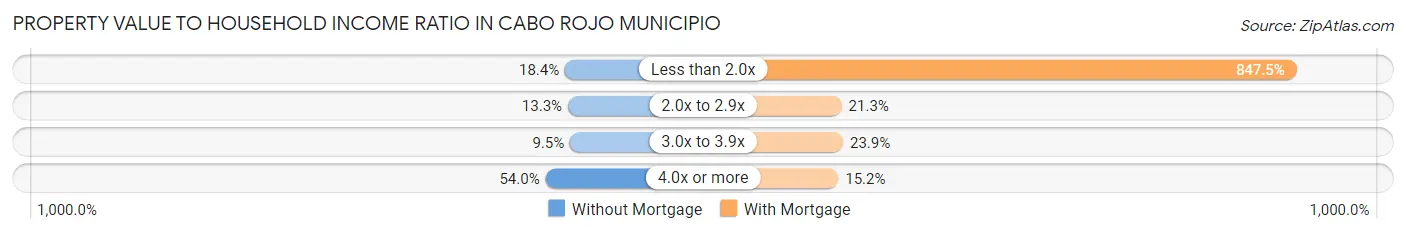
| Value-to-Income Ratio | Without Mortgage | With Mortgage |
| Less than 2.0x | 1,509 (18.4%) | 41,256 (847.5%) |
| 2.0x to 2.9x | 1,089 (13.3%) | 1,038 (21.3%) |
| 3.0x to 3.9x | 774 (9.5%) | 1,161 (23.8%) |
| 4.0x or more | 4,424 (54.0%) | 739 (15.2%) |
| Total | 8,193 (100.0%) | 4,868 (100.0%) |
Real Estate Taxes by Mortgage Status in Cabo Rojo Municipio
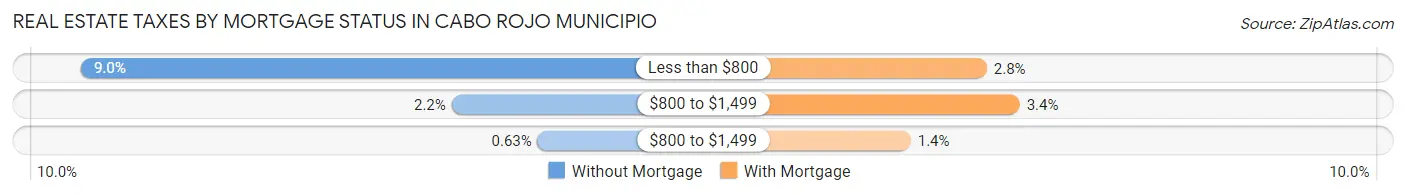
| Property Taxes | Without Mortgage | With Mortgage |
| Less than $800 | 735 (9.0%) | 137 (2.8%) |
| $800 to $1,499 | 180 (2.2%) | 166 (3.4%) |
| $800 to $1,499 | 52 (0.6%) | 69 (1.4%) |
| Total | 8,193 (100.0%) | 4,868 (100.0%) |
Health & Disability in Cabo Rojo Municipio
Health Insurance Coverage by Age in Cabo Rojo Municipio
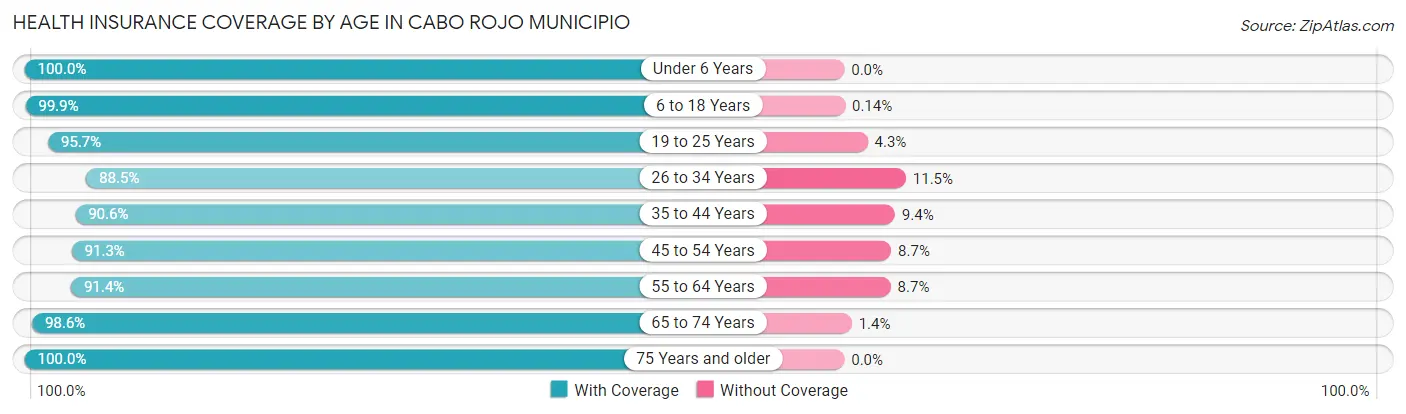
| Age Bracket | With Coverage | Without Coverage |
| Under 6 Years | 1,776 (100.0%) | 0 (0.0%) |
| 6 to 18 Years | 6,352 (99.9%) | 9 (0.1%) |
| 19 to 25 Years | 3,987 (95.7%) | 181 (4.3%) |
| 26 to 34 Years | 4,519 (88.5%) | 586 (11.5%) |
| 35 to 44 Years | 4,923 (90.6%) | 513 (9.4%) |
| 45 to 54 Years | 6,215 (91.3%) | 595 (8.7%) |
| 55 to 64 Years | 5,468 (91.3%) | 518 (8.6%) |
| 65 to 74 Years | 5,639 (98.6%) | 79 (1.4%) |
| 75 Years and older | 5,468 (100.0%) | 0 (0.0%) |
| Total | 44,347 (94.7%) | 2,481 (5.3%) |
Health Insurance Coverage by Citizenship Status in Cabo Rojo Municipio
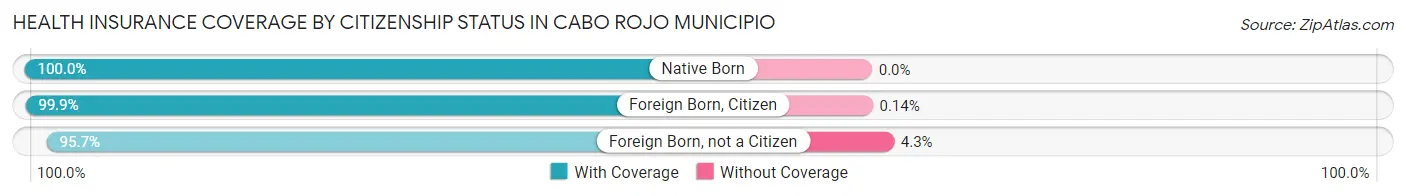
| Citizenship Status | With Coverage | Without Coverage |
| Native Born | 1,776 (100.0%) | 0 (0.0%) |
| Foreign Born, Citizen | 6,352 (99.9%) | 9 (0.1%) |
| Foreign Born, not a Citizen | 3,987 (95.7%) | 181 (4.3%) |
Health Insurance Coverage by Household Income in Cabo Rojo Municipio
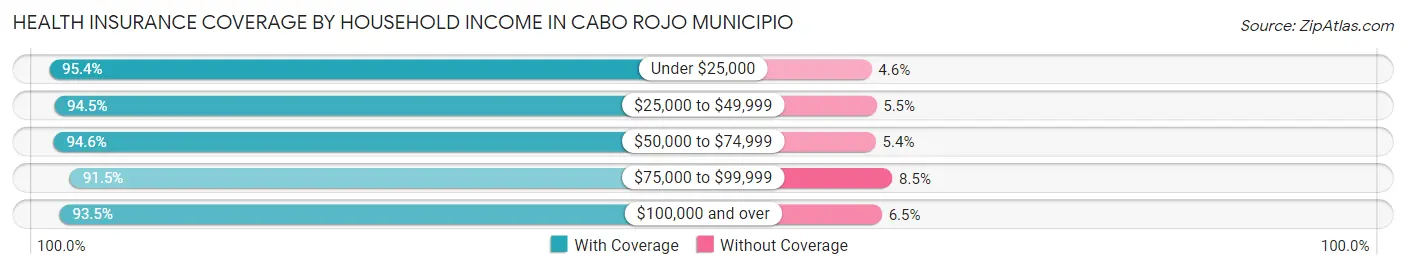
| Household Income | With Coverage | Without Coverage |
| Under $25,000 | 19,896 (95.4%) | 961 (4.6%) |
| $25,000 to $49,999 | 12,205 (94.5%) | 713 (5.5%) |
| $50,000 to $74,999 | 7,428 (94.6%) | 425 (5.4%) |
| $75,000 to $99,999 | 1,917 (91.5%) | 178 (8.5%) |
| $100,000 and over | 2,872 (93.5%) | 201 (6.5%) |
Public vs Private Health Insurance Coverage by Age in Cabo Rojo Municipio
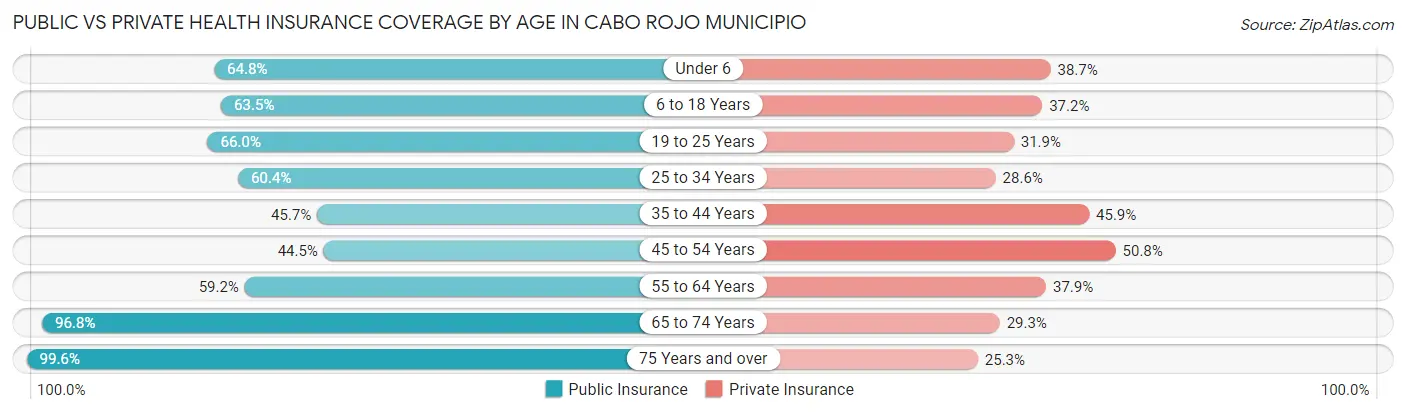
| Age Bracket | Public Insurance | Private Insurance |
| Under 6 | 1,151 (64.8%) | 688 (38.7%) |
| 6 to 18 Years | 4,042 (63.5%) | 2,366 (37.2%) |
| 19 to 25 Years | 2,752 (66.0%) | 1,331 (31.9%) |
| 25 to 34 Years | 3,083 (60.4%) | 1,458 (28.6%) |
| 35 to 44 Years | 2,485 (45.7%) | 2,495 (45.9%) |
| 45 to 54 Years | 3,029 (44.5%) | 3,461 (50.8%) |
| 55 to 64 Years | 3,541 (59.2%) | 2,269 (37.9%) |
| 65 to 74 Years | 5,533 (96.8%) | 1,676 (29.3%) |
| 75 Years and over | 5,447 (99.6%) | 1,381 (25.3%) |
| Total | 31,063 (66.3%) | 17,125 (36.6%) |
Disability Status by Sex by Age in Cabo Rojo Municipio
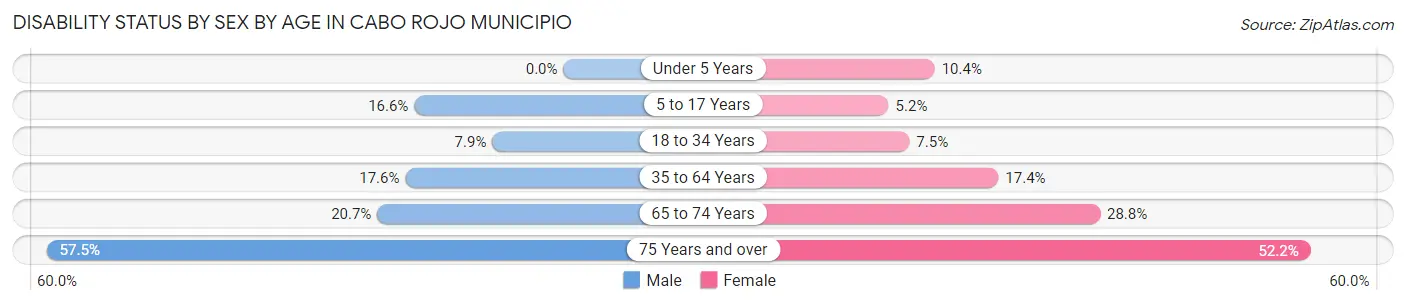
| Age Bracket | Male | Female |
| Under 5 Years | 0 (0.0%) | 68 (10.3%) |
| 5 to 17 Years | 526 (16.6%) | 163 (5.2%) |
| 18 to 34 Years | 374 (7.9%) | 381 (7.5%) |
| 35 to 64 Years | 1,515 (17.6%) | 1,678 (17.4%) |
| 65 to 74 Years | 541 (20.7%) | 894 (28.8%) |
| 75 Years and over | 1,340 (57.5%) | 1,639 (52.2%) |
Disability Class by Sex by Age in Cabo Rojo Municipio
Disability Class: Hearing Difficulty
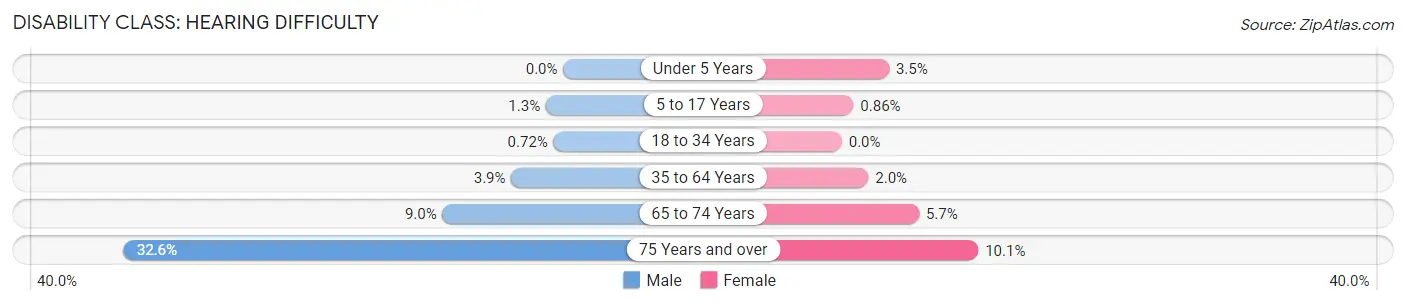
| Age Bracket | Male | Female |
| Under 5 Years | 0 (0.0%) | 23 (3.5%) |
| 5 to 17 Years | 41 (1.3%) | 27 (0.9%) |
| 18 to 34 Years | 34 (0.7%) | 0 (0.0%) |
| 35 to 64 Years | 332 (3.9%) | 190 (2.0%) |
| 65 to 74 Years | 234 (9.0%) | 178 (5.7%) |
| 75 Years and over | 760 (32.6%) | 318 (10.1%) |
Disability Class: Vision Difficulty
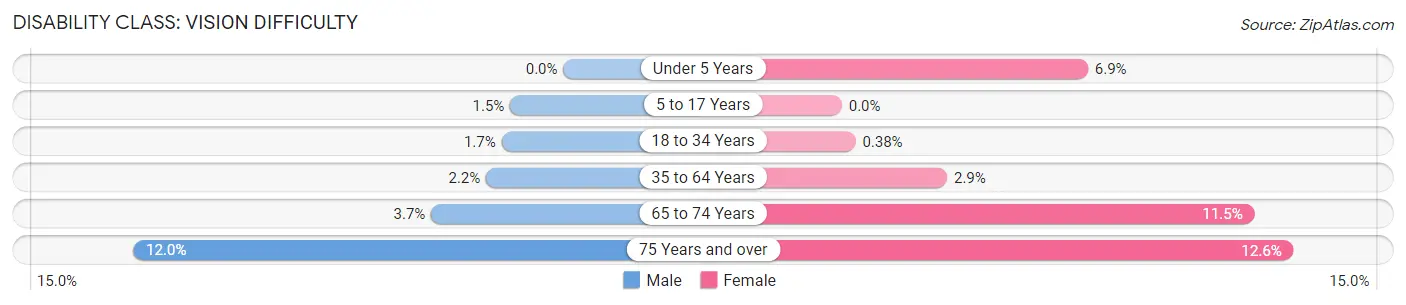
| Age Bracket | Male | Female |
| Under 5 Years | 0 (0.0%) | 45 (6.9%) |
| 5 to 17 Years | 47 (1.5%) | 0 (0.0%) |
| 18 to 34 Years | 81 (1.7%) | 19 (0.4%) |
| 35 to 64 Years | 185 (2.1%) | 282 (2.9%) |
| 65 to 74 Years | 96 (3.7%) | 357 (11.5%) |
| 75 Years and over | 279 (12.0%) | 395 (12.6%) |
Disability Class: Cognitive Difficulty
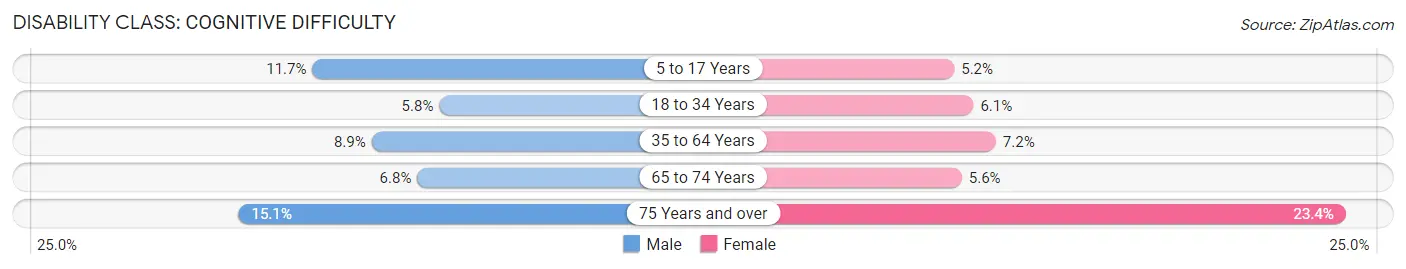
| Age Bracket | Male | Female |
| 5 to 17 Years | 369 (11.7%) | 163 (5.2%) |
| 18 to 34 Years | 272 (5.8%) | 309 (6.1%) |
| 35 to 64 Years | 766 (8.9%) | 688 (7.1%) |
| 65 to 74 Years | 177 (6.8%) | 173 (5.6%) |
| 75 Years and over | 351 (15.1%) | 734 (23.4%) |
Disability Class: Ambulatory Difficulty
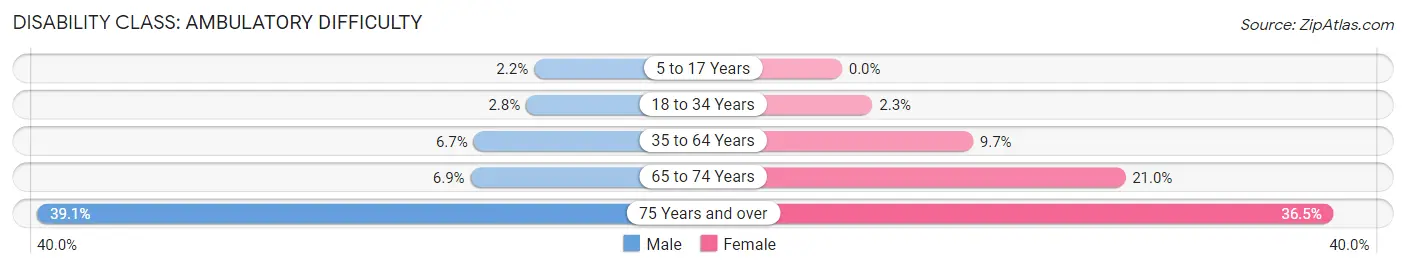
| Age Bracket | Male | Female |
| 5 to 17 Years | 69 (2.2%) | 0 (0.0%) |
| 18 to 34 Years | 131 (2.8%) | 115 (2.3%) |
| 35 to 64 Years | 574 (6.7%) | 936 (9.7%) |
| 65 to 74 Years | 180 (6.9%) | 654 (21.0%) |
| 75 Years and over | 910 (39.1%) | 1,146 (36.5%) |
Disability Class: Self-Care Difficulty
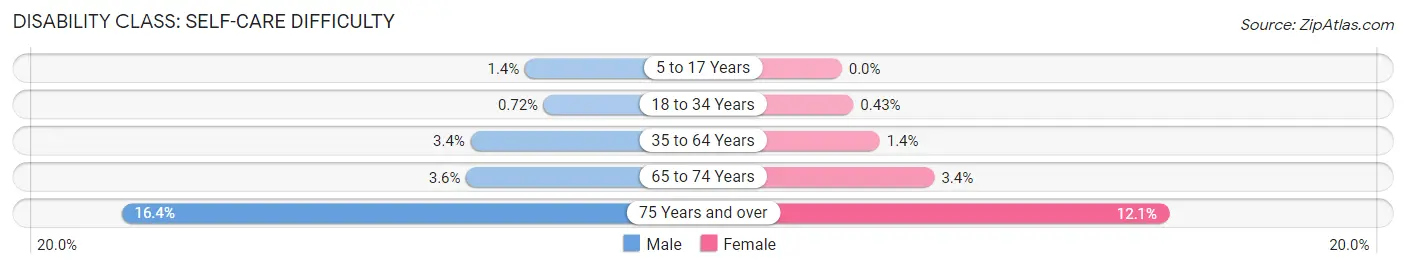
| Age Bracket | Male | Female |
| 5 to 17 Years | 45 (1.4%) | 0 (0.0%) |
| 18 to 34 Years | 34 (0.7%) | 22 (0.4%) |
| 35 to 64 Years | 296 (3.4%) | 136 (1.4%) |
| 65 to 74 Years | 94 (3.6%) | 107 (3.4%) |
| 75 Years and over | 382 (16.4%) | 381 (12.1%) |
Technology Access in Cabo Rojo Municipio
Computing Device Access in Cabo Rojo Municipio
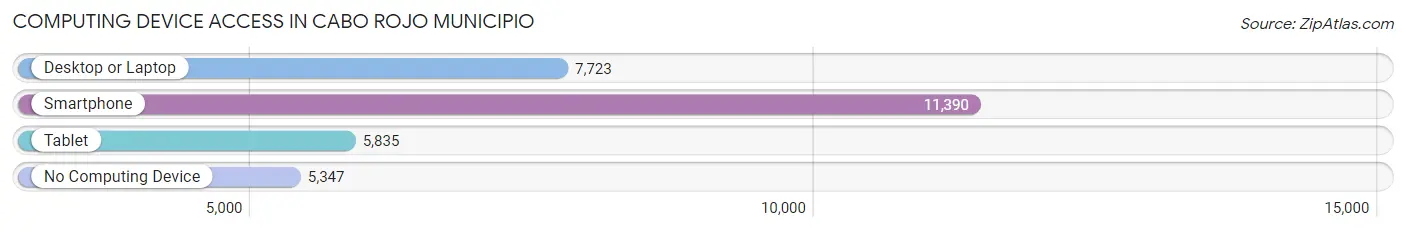
| Device Type | # Households | % Households |
| Desktop or Laptop | 7,723 | 44.0% |
| Smartphone | 11,390 | 64.8% |
| Tablet | 5,835 | 33.2% |
| No Computing Device | 5,347 | 30.4% |
| Total | 17,568 | 100.0% |
Internet Access in Cabo Rojo Municipio
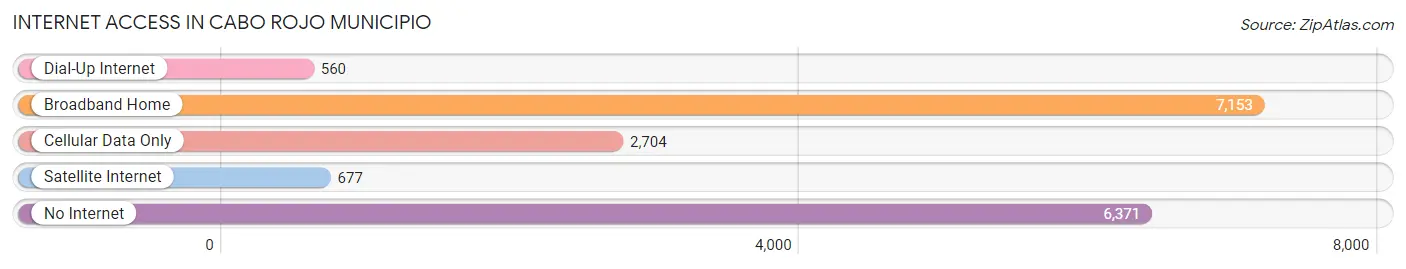
| Internet Type | # Households | % Households |
| Dial-Up Internet | 560 | 3.2% |
| Broadband Home | 7,153 | 40.7% |
| Cellular Data Only | 2,704 | 15.4% |
| Satellite Internet | 677 | 3.8% |
| No Internet | 6,371 | 36.3% |
| Total | 17,568 | 100.0% |
Cabo Rojo Municipio Summary
Cabo Rojo Municipio is a municipality located in the southwestern region of Puerto Rico. It is bordered by the municipalities of Mayagüez, San Germán, Lajas, and Hormigueros. The municipality is home to a population of approximately 45,000 people, making it the fourth most populous municipality in Puerto Rico.
History
The area that is now Cabo Rojo Municipio was originally inhabited by the Taíno people, who called the area “Yucayo.” The area was later colonized by the Spanish in the 16th century, and the town of Cabo Rojo was founded in 1771. The town was named after the red cliffs that line the coast of the municipality.
During the 19th century, the area was a major center of the sugar industry, and the town of Cabo Rojo was an important port for the export of sugar and other goods. The town was also the site of a major battle during the Spanish-American War in 1898.
Geography
Cabo Rojo Municipio is located in the southwestern region of Puerto Rico, and is bordered by the municipalities of Mayagüez, San Germán, Lajas, and Hormigueros. The municipality covers an area of approximately 140 square miles, and is home to a population of approximately 45,000 people.
The municipality is divided into two regions: the coastal region and the interior region. The coastal region is characterized by its red cliffs, which are a major tourist attraction. The interior region is mostly flat and is home to the majority of the population.
Economy
The economy of Cabo Rojo Municipio is largely based on agriculture and tourism. The municipality is home to a number of agricultural products, including sugar cane, coffee, and bananas. The municipality is also home to a number of tourist attractions, including the Cabo Rojo National Wildlife Refuge, the Cabo Rojo Lighthouse, and the Boquerón Beach.
Demographics
As of the 2010 census, the population of Cabo Rojo Municipio was 45,068. The population is largely of Hispanic descent, with approximately 95% of the population identifying as Hispanic or Latino. The median household income in the municipality is $17,845, and the poverty rate is approximately 40%.
Conclusion
Cabo Rojo Municipio is a municipality located in the southwestern region of Puerto Rico. It is home to a population of approximately 45,000 people, and is largely of Hispanic descent. The economy of the municipality is largely based on agriculture and tourism, and the median household income is $17,845. The municipality is home to a number of tourist attractions, including the Cabo Rojo National Wildlife Refuge, the Cabo Rojo Lighthouse, and the Boquerón Beach.
Common Questions
What is Per Capita Income in Cabo Rojo Municipio?
Per Capita income in Cabo Rojo Municipio is $14,453.
What is the Median Family Income in Cabo Rojo Municipio?
Median Family Income in Cabo Rojo Municipio is $28,556.
What is the Median Household income in Cabo Rojo Municipio?
Median Household Income in Cabo Rojo Municipio is $23,077.
What is Income or Wage Gap in Cabo Rojo Municipio?
Income or Wage Gap in Cabo Rojo Municipio is 0.7%.
Women in Cabo Rojo Municipio earn 99.3 cents for every dollar earned by a man.
What is Family Income Deficit in Cabo Rojo Municipio?
Family Income Deficit in Cabo Rojo Municipio is $9,993.
Families that are below poverty line in Cabo Rojo Municipio earn $9,993 less on average than the poverty threshold level.
What is Inequality or Gini Index in Cabo Rojo Municipio?
Inequality or Gini Index in Cabo Rojo Municipio is 0.52.
What is the Total Population of Cabo Rojo Municipio?
Total Population of Cabo Rojo Municipio is 46,983.
What is the Total Male Population of Cabo Rojo Municipio?
Total Male Population of Cabo Rojo Municipio is 22,203.
What is the Total Female Population of Cabo Rojo Municipio?
Total Female Population of Cabo Rojo Municipio is 24,780.
What is the Ratio of Males per 100 Females in Cabo Rojo Municipio?
There are 89.60 Males per 100 Females in Cabo Rojo Municipio.
What is the Ratio of Females per 100 Males in Cabo Rojo Municipio?
There are 111.61 Females per 100 Males in Cabo Rojo Municipio.
What is the Median Population Age in Cabo Rojo Municipio?
Median Population Age in Cabo Rojo Municipio is 46.3 Years.
What is the Average Family Size in Cabo Rojo Municipio
Average Family Size in Cabo Rojo Municipio is 3.3 People.
What is the Average Household Size in Cabo Rojo Municipio
Average Household Size in Cabo Rojo Municipio is 2.7 People.
How Large is the Labor Force in Cabo Rojo Municipio?
There are 18,071 People in the Labor Forcein in Cabo Rojo Municipio.
What is the Percentage of People in the Labor Force in Cabo Rojo Municipio?
44.5% of People are in the Labor Force in Cabo Rojo Municipio.
What is the Unemployment Rate in Cabo Rojo Municipio?
Unemployment Rate in Cabo Rojo Municipio is 14.6%.