Bayamon Municipio, PR Map & Demographics
Bayamon Municipio Overview
$16,905
PER CAPITA INCOME
$36,180
AVG FAMILY INCOME
$29,403
AVG HOUSEHOLD INCOME
5.2%
WAGE / INCOME GAP [ % ]
94.8¢/ $1
WAGE / INCOME GAP [ $ ]
$11,424
FAMILY INCOME DEFICIT
0.50
INEQUALITY / GINI INDEX
184,326
TOTAL POPULATION
86,344
MALE POPULATION
97,982
FEMALE POPULATION
88.12
MALES / 100 FEMALES
113.48
FEMALES / 100 MALES
43.7
MEDIAN AGE
3.2
AVG FAMILY SIZE
2.6
AVG HOUSEHOLD SIZE
74,405
LABOR FORCE [ PEOPLE ]
47.0%
PERCENT IN LABOR FORCE
9.9%
UNEMPLOYMENT RATE
Income in Bayamon Municipio
Income Overview in Bayamon Municipio
Per Capita Income in Bayamon Municipio is $16,905, while median incomes of families and households are $36,180 and $29,403 respectively.
| Characteristic | Number | Measure |
| Per Capita Income | 184,326 | $16,905 |
| Median Family Income | 45,420 | $36,180 |
| Mean Family Income | 45,420 | $47,183 |
| Median Household Income | 69,043 | $29,403 |
| Mean Household Income | 69,043 | $41,287 |
| Income Deficit | 45,420 | $11,424 |
| Wage / Income Gap (%) | 184,326 | 5.24% |
| Wage / Income Gap ($) | 184,326 | 94.76¢ per $1 |
| Gini / Inequality Index | 184,326 | 0.50 |
Earnings by Sex in Bayamon Municipio
Average Earnings in Bayamon Municipio are $20,591, $19,987 for men and $21,093 for women, a difference of 5.2%.
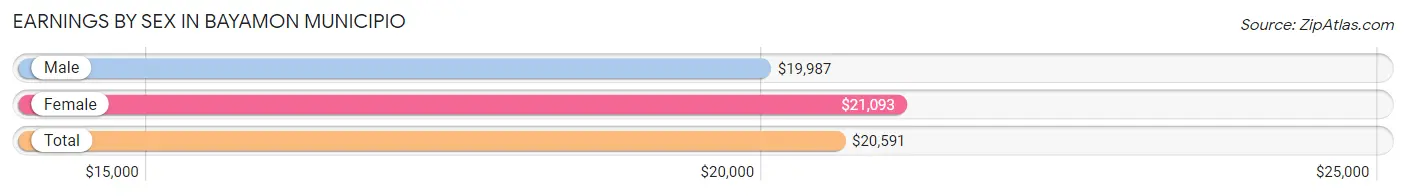
| Sex | Number | Average Earnings |
| Male | 37,353 (50.5%) | $19,987 |
| Female | 36,584 (49.5%) | $21,093 |
| Total | 73,937 (100.0%) | $20,591 |
Earnings by Sex by Income Bracket in Bayamon Municipio
The most common earnings brackets in Bayamon Municipio are $15,000 to $17,499 for men (3,090 | 8.3%) and $25,000 to $29,999 for women (3,452 | 9.4%).
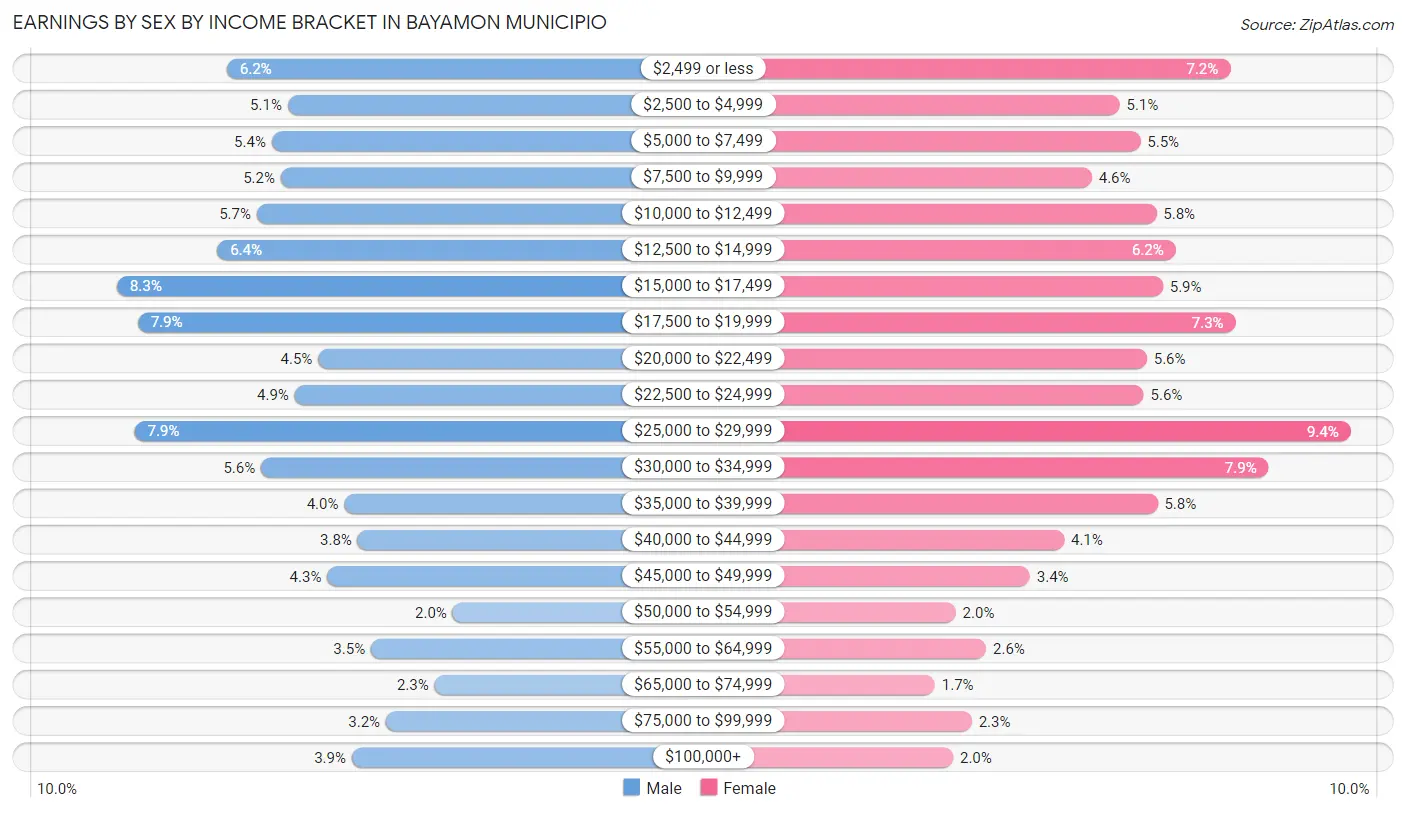
| Income | Male | Female |
| $2,499 or less | 2,318 (6.2%) | 2,626 (7.2%) |
| $2,500 to $4,999 | 1,892 (5.1%) | 1,868 (5.1%) |
| $5,000 to $7,499 | 2,006 (5.4%) | 2,012 (5.5%) |
| $7,500 to $9,999 | 1,943 (5.2%) | 1,680 (4.6%) |
| $10,000 to $12,499 | 2,111 (5.7%) | 2,122 (5.8%) |
| $12,500 to $14,999 | 2,387 (6.4%) | 2,254 (6.2%) |
| $15,000 to $17,499 | 3,090 (8.3%) | 2,167 (5.9%) |
| $17,500 to $19,999 | 2,945 (7.9%) | 2,664 (7.3%) |
| $20,000 to $22,499 | 1,681 (4.5%) | 2,057 (5.6%) |
| $22,500 to $24,999 | 1,847 (4.9%) | 2,033 (5.6%) |
| $25,000 to $29,999 | 2,966 (7.9%) | 3,452 (9.4%) |
| $30,000 to $34,999 | 2,079 (5.6%) | 2,889 (7.9%) |
| $35,000 to $39,999 | 1,498 (4.0%) | 2,128 (5.8%) |
| $40,000 to $44,999 | 1,406 (3.8%) | 1,489 (4.1%) |
| $45,000 to $49,999 | 1,617 (4.3%) | 1,254 (3.4%) |
| $50,000 to $54,999 | 739 (2.0%) | 747 (2.0%) |
| $55,000 to $64,999 | 1,310 (3.5%) | 955 (2.6%) |
| $65,000 to $74,999 | 865 (2.3%) | 603 (1.7%) |
| $75,000 to $99,999 | 1,207 (3.2%) | 855 (2.3%) |
| $100,000+ | 1,446 (3.9%) | 729 (2.0%) |
| Total | 37,353 (100.0%) | 36,584 (100.0%) |
Earnings by Sex by Educational Attainment in Bayamon Municipio
Average earnings in Bayamon Municipio are $22,503 for men and $22,883 for women, a difference of 1.7%. Men with an educational attainment of graduate degree enjoy the highest average annual earnings of $35,319, while those with less than high school education earn the least with $13,817. Women with an educational attainment of graduate degree earn the most with the average annual earnings of $37,114, while those with less than high school education have the smallest earnings of $11,441.
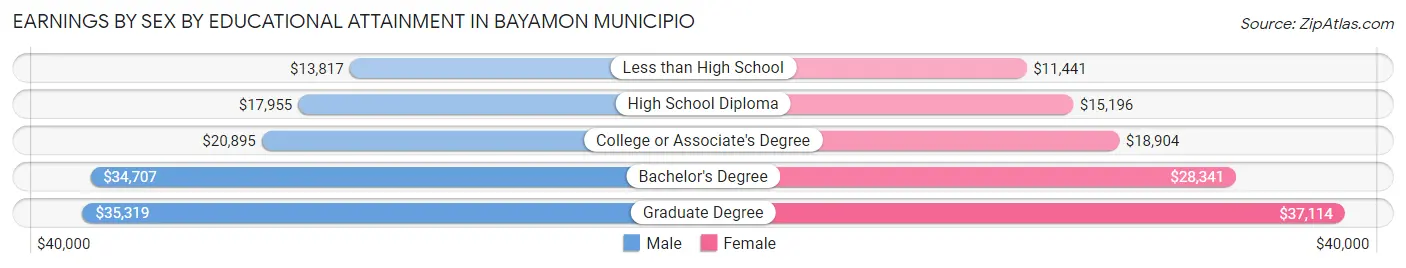
| Educational Attainment | Male Income | Female Income |
| Less than High School | $13,817 | $11,441 |
| High School Diploma | $17,955 | $15,196 |
| College or Associate's Degree | $20,895 | $18,904 |
| Bachelor's Degree | $34,707 | $28,341 |
| Graduate Degree | $35,319 | $37,114 |
| Total | $22,503 | $22,883 |
Family Income in Bayamon Municipio
Family Income Brackets in Bayamon Municipio
According to the Bayamon Municipio family income data, there are 8,312 families falling into the $50,000 to $74,999 income range, which is the most common income bracket and makes up 18.3% of all families. Conversely, the $200,000+ income bracket is the least frequent group with only 500 families (1.1%) belonging to this category.
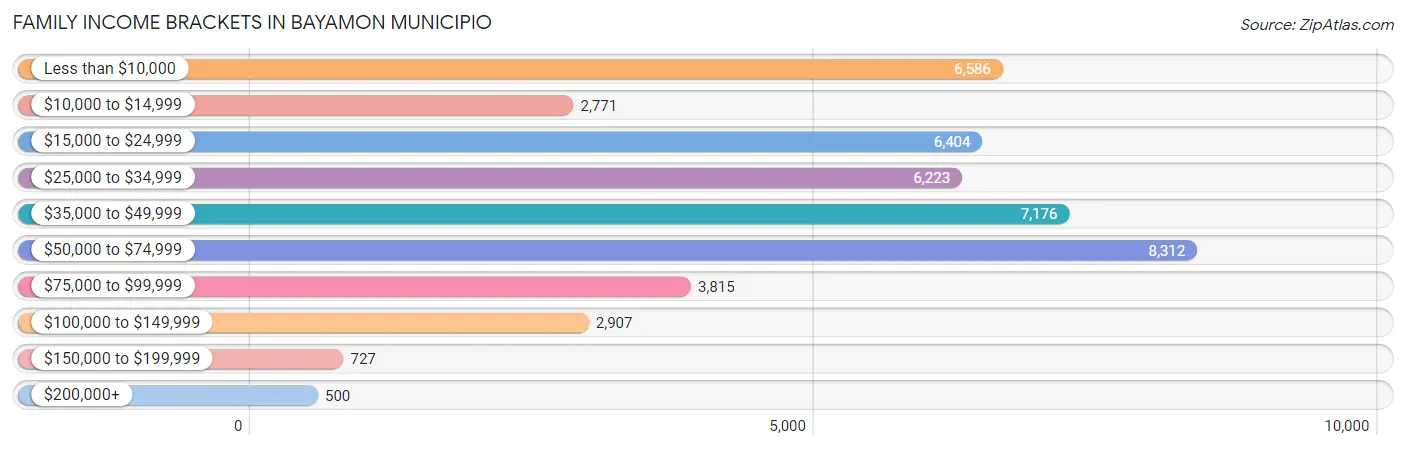
| Income Bracket | # Families | % Families |
| Less than $10,000 | 6,586 | 14.5% |
| $10,000 to $14,999 | 2,771 | 6.1% |
| $15,000 to $24,999 | 6,404 | 14.1% |
| $25,000 to $34,999 | 6,223 | 13.7% |
| $35,000 to $49,999 | 7,176 | 15.8% |
| $50,000 to $74,999 | 8,312 | 18.3% |
| $75,000 to $99,999 | 3,815 | 8.4% |
| $100,000 to $149,999 | 2,907 | 6.4% |
| $150,000 to $199,999 | 727 | 1.6% |
| $200,000+ | 500 | 1.1% |
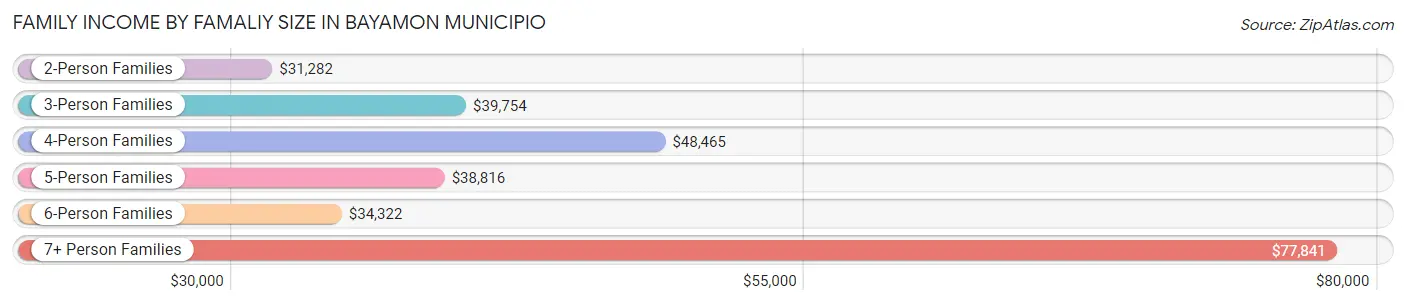
Family Income by Famaliy Size in Bayamon Municipio
7+ person families (193 | 0.4%) account for the highest median family income in Bayamon Municipio with $77,841 per family, while 2-person families (22,290 | 49.1%) have the highest median income of $15,641 per family member.
| Income Bracket | # Families | Median Income |
| 2-Person Families | 22,290 (49.1%) | $31,282 |
| 3-Person Families | 13,514 (29.7%) | $39,754 |
| 4-Person Families | 6,987 (15.4%) | $48,465 |
| 5-Person Families | 1,904 (4.2%) | $38,816 |
| 6-Person Families | 532 (1.2%) | $34,322 |
| 7+ Person Families | 193 (0.4%) | $77,841 |
| Total | 45,420 (100.0%) | $36,180 |
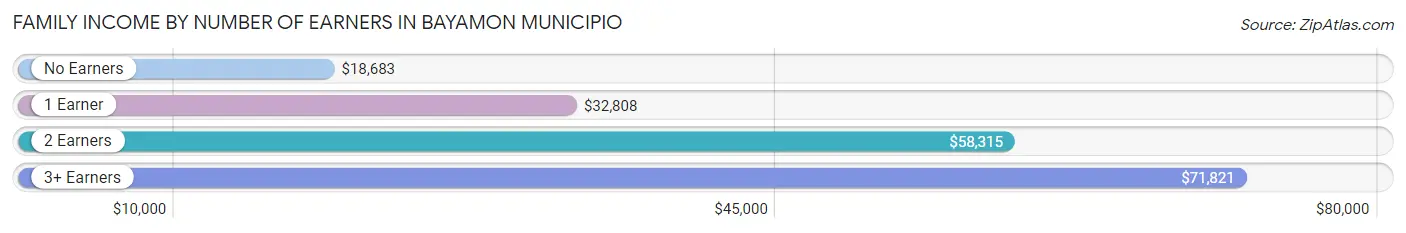
Family Income by Number of Earners in Bayamon Municipio
The median family income in Bayamon Municipio is $36,180, with families comprising 3+ earners (2,664) having the highest median family income of $71,821, while families with no earners (13,816) have the lowest median family income of $18,683, accounting for 5.9% and 30.4% of families, respectively.
| Number of Earners | # Families | Median Income |
| No Earners | 13,816 (30.4%) | $18,683 |
| 1 Earner | 17,119 (37.7%) | $32,808 |
| 2 Earners | 11,821 (26.0%) | $58,315 |
| 3+ Earners | 2,664 (5.9%) | $71,821 |
| Total | 45,420 (100.0%) | $36,180 |
Household Income in Bayamon Municipio
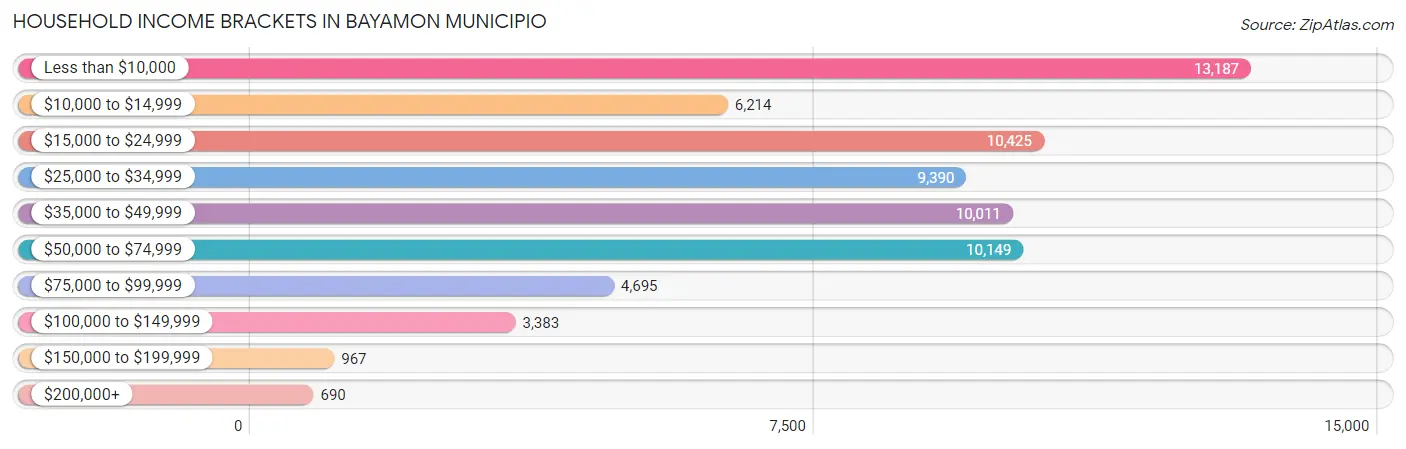
Household Income Brackets in Bayamon Municipio
With 13,187 households falling in the category, the less than $10,000 income range is the most frequent in Bayamon Municipio, accounting for 19.1% of all households. In contrast, only 690 households (1.0%) fall into the $200,000+ income bracket, making it the least populous group.
| Income Bracket | # Households | % Households |
| Less than $10,000 | 13,187 | 19.1% |
| $10,000 to $14,999 | 6,214 | 9.0% |
| $15,000 to $24,999 | 10,425 | 15.1% |
| $25,000 to $34,999 | 9,390 | 13.6% |
| $35,000 to $49,999 | 10,011 | 14.5% |
| $50,000 to $74,999 | 10,149 | 14.7% |
| $75,000 to $99,999 | 4,695 | 6.8% |
| $100,000 to $149,999 | 3,383 | 4.9% |
| $150,000 to $199,999 | 967 | 1.4% |
| $200,000+ | 690 | 1.0% |
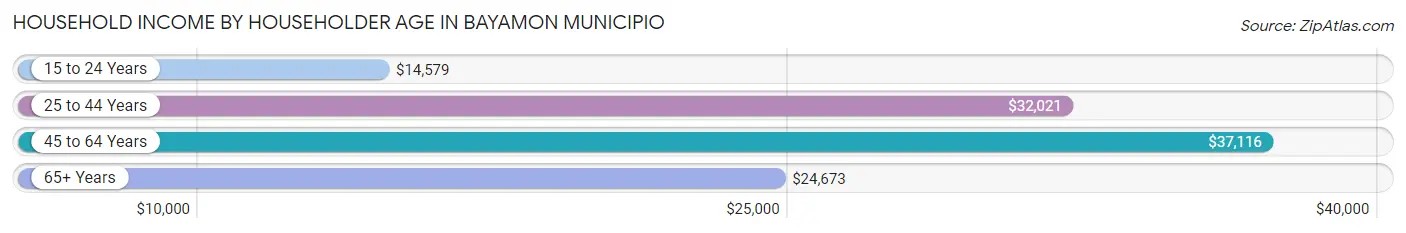
Household Income by Householder Age in Bayamon Municipio
The median household income in Bayamon Municipio is $29,403, with the highest median household income of $37,116 found in the 45 to 64 years age bracket for the primary householder. A total of 24,362 households (35.3%) fall into this category. Meanwhile, the 15 to 24 years age bracket for the primary householder has the lowest median household income of $14,579, with 1,190 households (1.7%) in this group.
| Income Bracket | # Households | Median Income |
| 15 to 24 Years | 1,190 (1.7%) | $14,579 |
| 25 to 44 Years | 17,010 (24.6%) | $32,021 |
| 45 to 64 Years | 24,362 (35.3%) | $37,116 |
| 65+ Years | 26,481 (38.4%) | $24,673 |
| Total | 69,043 (100.0%) | $29,403 |
Poverty in Bayamon Municipio
Income Below Poverty by Sex and Age in Bayamon Municipio
With 31.9% poverty level for males and 37.3% for females among the residents of Bayamon Municipio, under 5 year old males and 5 year old females are the most vulnerable to poverty, with 1,934 males (58.3%) and 538 females (54.7%) in their respective age groups living below the poverty level.
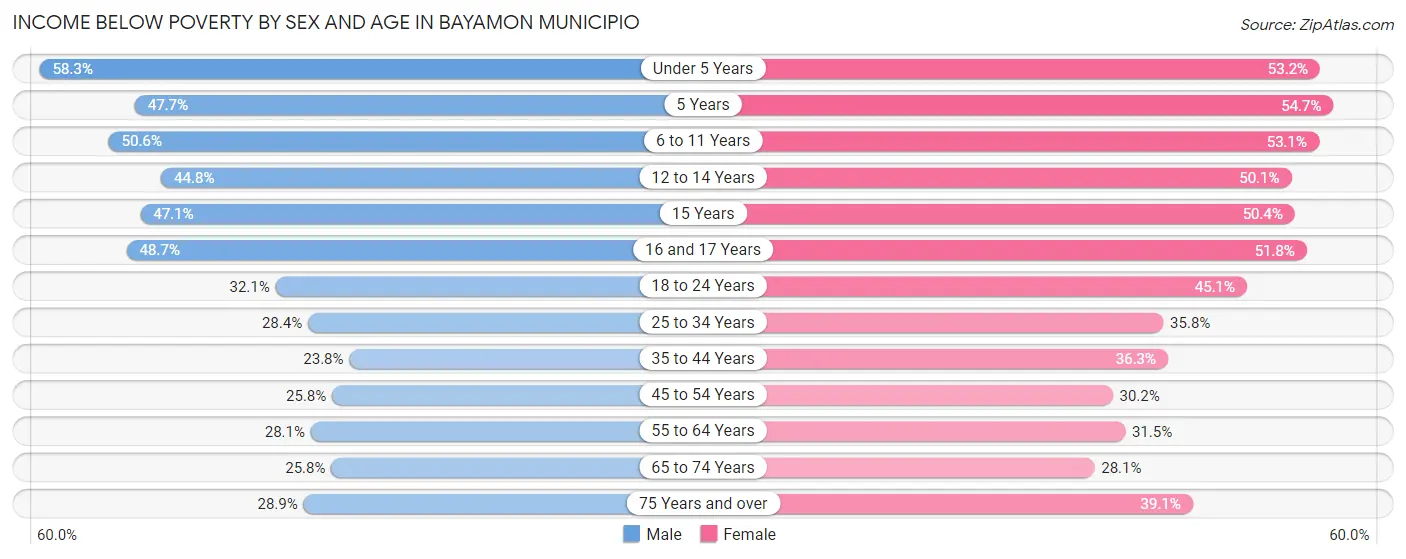
| Age Bracket | Male | Female |
| Under 5 Years | 1,934 (58.3%) | 1,678 (53.2%) |
| 5 Years | 304 (47.7%) | 538 (54.7%) |
| 6 to 11 Years | 2,698 (50.6%) | 2,605 (53.1%) |
| 12 to 14 Years | 1,267 (44.8%) | 1,302 (50.1%) |
| 15 Years | 456 (47.1%) | 516 (50.4%) |
| 16 and 17 Years | 1,078 (48.6%) | 1,011 (51.8%) |
| 18 to 24 Years | 2,761 (32.1%) | 3,641 (45.1%) |
| 25 to 34 Years | 3,469 (28.4%) | 4,401 (35.8%) |
| 35 to 44 Years | 2,206 (23.8%) | 4,218 (36.3%) |
| 45 to 54 Years | 2,427 (25.8%) | 3,540 (30.1%) |
| 55 to 64 Years | 2,938 (28.1%) | 4,396 (31.5%) |
| 65 to 74 Years | 2,211 (25.8%) | 3,366 (28.1%) |
| 75 Years and over | 2,449 (28.9%) | 5,033 (39.1%) |
| Total | 26,198 (31.9%) | 36,245 (37.3%) |
Income Above Poverty by Sex and Age in Bayamon Municipio
According to the poverty statistics in Bayamon Municipio, males aged 35 to 44 years and females aged 65 to 74 years are the age groups that are most secure financially, with 76.2% of males and 71.9% of females in these age groups living above the poverty line.
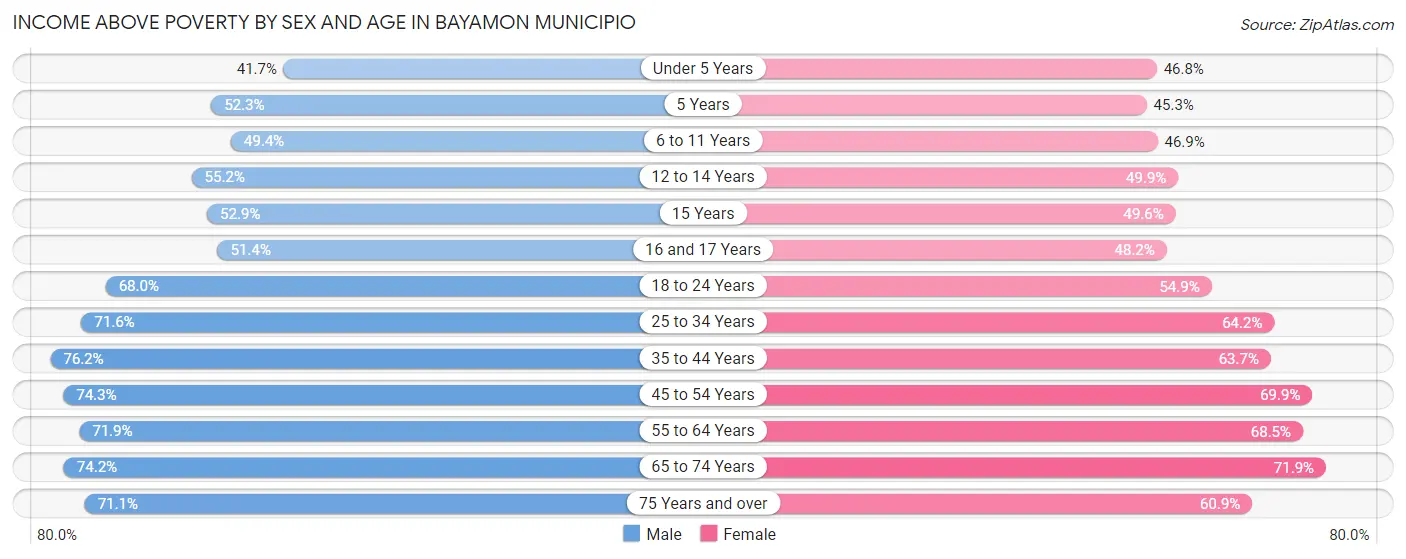
| Age Bracket | Male | Female |
| Under 5 Years | 1,381 (41.7%) | 1,474 (46.8%) |
| 5 Years | 333 (52.3%) | 445 (45.3%) |
| 6 to 11 Years | 2,630 (49.4%) | 2,299 (46.9%) |
| 12 to 14 Years | 1,561 (55.2%) | 1,299 (49.9%) |
| 15 Years | 512 (52.9%) | 507 (49.6%) |
| 16 and 17 Years | 1,138 (51.3%) | 942 (48.2%) |
| 18 to 24 Years | 5,853 (67.9%) | 4,431 (54.9%) |
| 25 to 34 Years | 8,728 (71.6%) | 7,895 (64.2%) |
| 35 to 44 Years | 7,052 (76.2%) | 7,400 (63.7%) |
| 45 to 54 Years | 6,999 (74.3%) | 8,202 (69.9%) |
| 55 to 64 Years | 7,506 (71.9%) | 9,543 (68.5%) |
| 65 to 74 Years | 6,345 (74.2%) | 8,605 (71.9%) |
| 75 Years and over | 6,015 (71.1%) | 7,849 (60.9%) |
| Total | 56,053 (68.1%) | 60,891 (62.7%) |
Income Below Poverty Among Married-Couple Families in Bayamon Municipio
The poverty statistics for married-couple families in Bayamon Municipio show that 20.7% or 5,117 of the total 24,758 families live below the poverty line. Families with 5 or more children have the highest poverty rate of 67.9%, comprising of 19 families. On the other hand, families with no children have the lowest poverty rate of 18.7%, which includes 3,382 families.
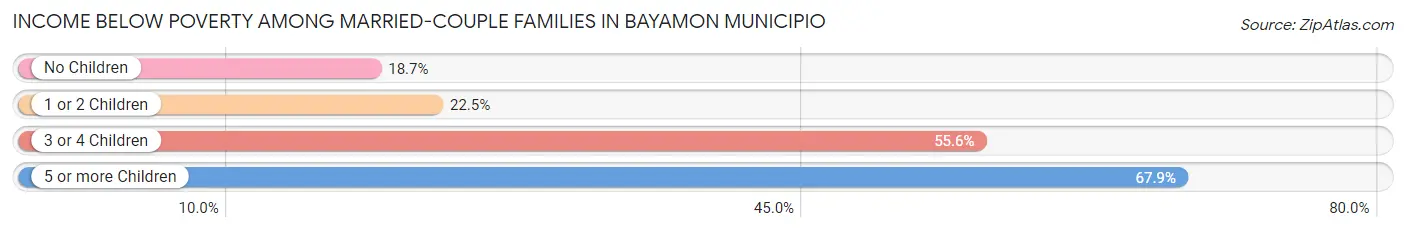
| Children | Above Poverty | Below Poverty |
| No Children | 14,679 (81.3%) | 3,382 (18.7%) |
| 1 or 2 Children | 4,663 (77.5%) | 1,353 (22.5%) |
| 3 or 4 Children | 290 (44.4%) | 363 (55.6%) |
| 5 or more Children | 9 (32.1%) | 19 (67.9%) |
| Total | 19,641 (79.3%) | 5,117 (20.7%) |
Income Below Poverty Among Single-Parent Households in Bayamon Municipio
According to the poverty data in Bayamon Municipio, 31.2% or 1,189 single-father households and 47.3% or 7,968 single-mother households are living below the poverty line. Among single-father households, those with 5 or more children have the highest poverty rate, with 10 households (100.0%) experiencing poverty. Likewise, among single-mother households, those with 5 or more children have the highest poverty rate, with 19 households (100.0%) falling below the poverty line.
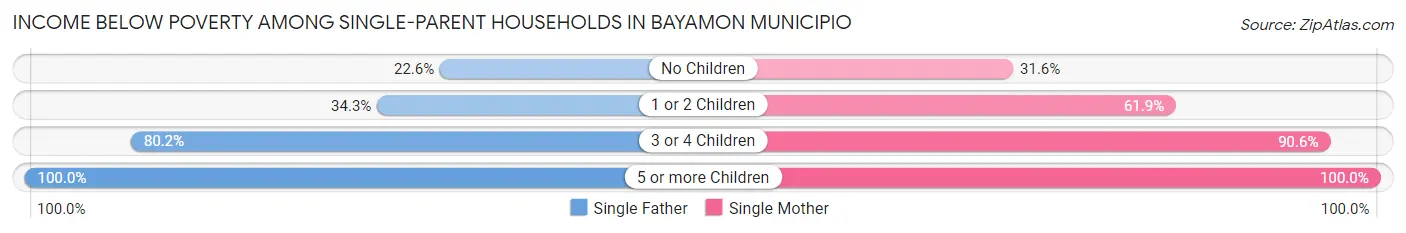
| Children | Single Father | Single Mother |
| No Children | 483 (22.6%) | 2,786 (31.6%) |
| 1 or 2 Children | 481 (34.3%) | 4,496 (61.9%) |
| 3 or 4 Children | 215 (80.2%) | 667 (90.6%) |
| 5 or more Children | 10 (100.0%) | 19 (100.0%) |
| Total | 1,189 (31.2%) | 7,968 (47.3%) |
Income Below Poverty Among Married-Couple vs Single-Parent Households in Bayamon Municipio
The poverty data for Bayamon Municipio shows that 5,117 of the married-couple family households (20.7%) and 9,157 of the single-parent households (44.3%) are living below the poverty level. Within the married-couple family households, those with 5 or more children have the highest poverty rate, with 19 households (67.9%) falling below the poverty line. Among the single-parent households, those with 5 or more children have the highest poverty rate, with 29 household (100.0%) living below poverty.
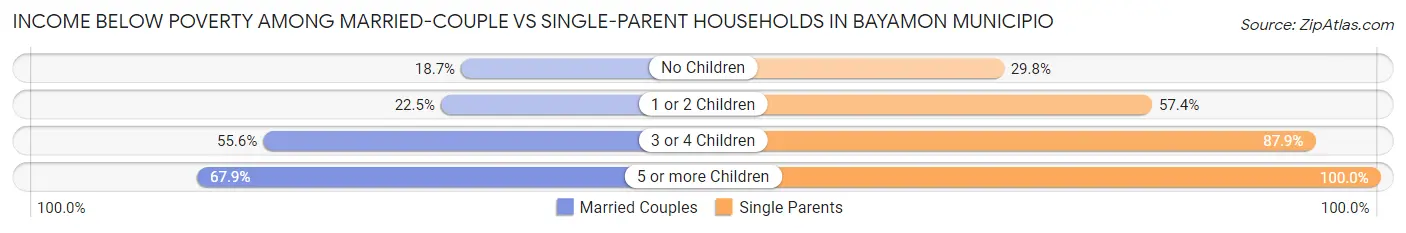
| Children | Married-Couple Families | Single-Parent Households |
| No Children | 3,382 (18.7%) | 3,269 (29.8%) |
| 1 or 2 Children | 1,353 (22.5%) | 4,977 (57.4%) |
| 3 or 4 Children | 363 (55.6%) | 882 (87.8%) |
| 5 or more Children | 19 (67.9%) | 29 (100.0%) |
| Total | 5,117 (20.7%) | 9,157 (44.3%) |
Race in Bayamon Municipio
The most populous races in Bayamon Municipio are Hispanic or Latino (182,187 | 98.8%), White / Caucasian (67,758 | 36.8%), and Two or more Races (59,572 | 32.3%).
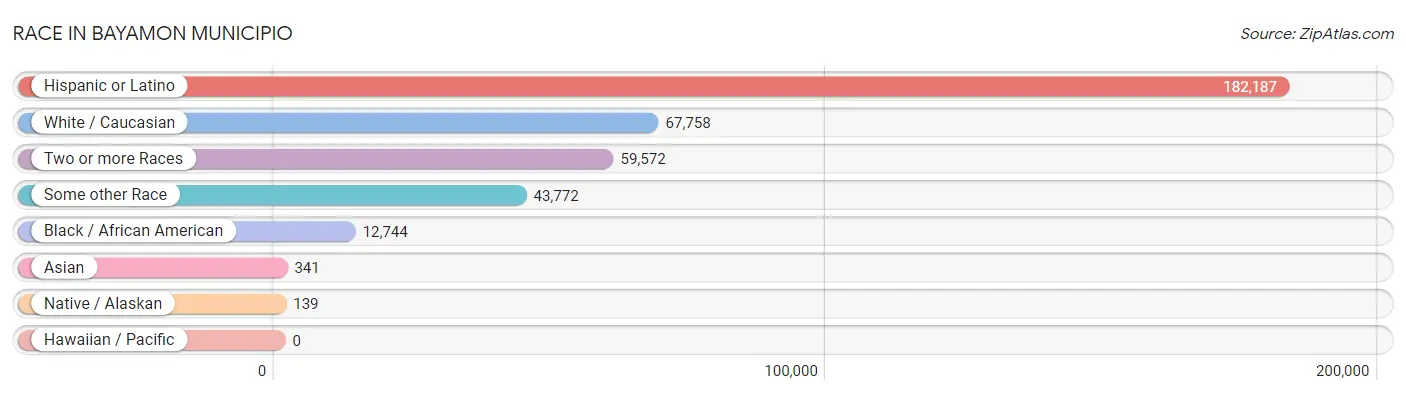
| Race | # Population | % Population |
| Asian | 341 | 0.2% |
| Black / African American | 12,744 | 6.9% |
| Hawaiian / Pacific | 0 | 0.0% |
| Hispanic or Latino | 182,187 | 98.8% |
| Native / Alaskan | 139 | 0.1% |
| White / Caucasian | 67,758 | 36.8% |
| Two or more Races | 59,572 | 32.3% |
| Some other Race | 43,772 | 23.7% |
| Total | 184,326 | 100.0% |
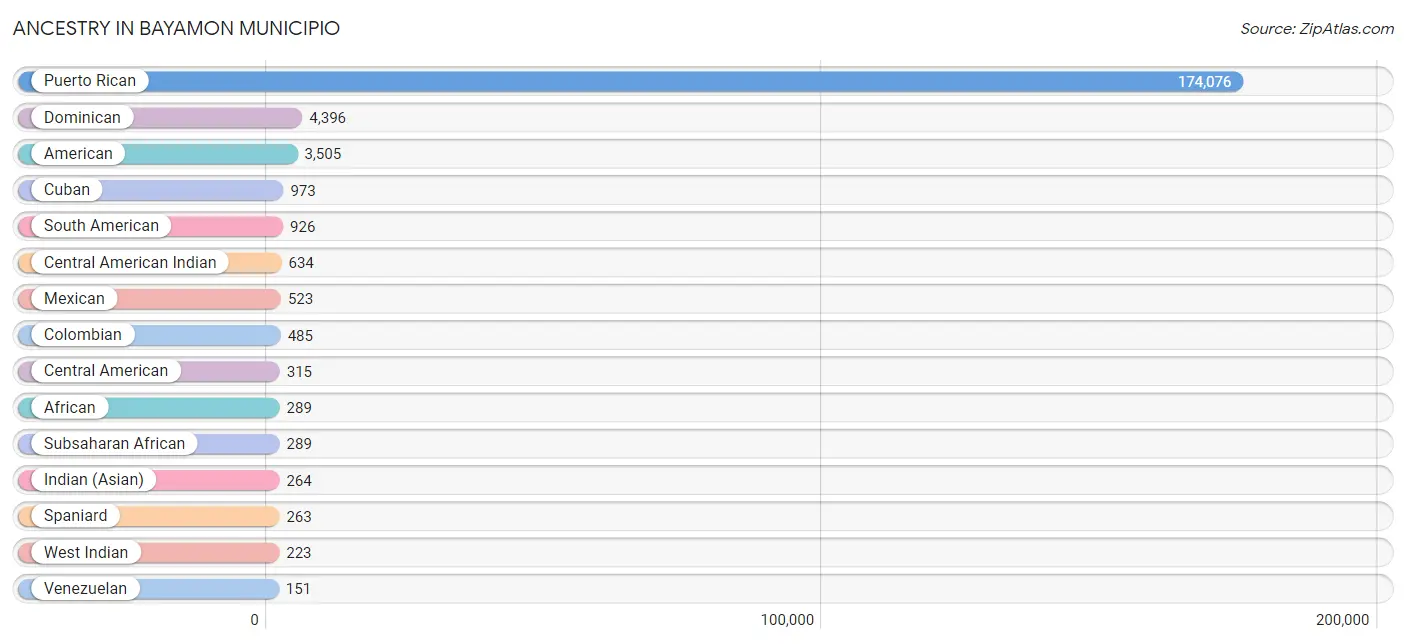
Ancestry in Bayamon Municipio
The most populous ancestries reported in Bayamon Municipio are Puerto Rican (174,076 | 94.4%), Dominican (4,396 | 2.4%), American (3,505 | 1.9%), Cuban (973 | 0.5%), and South American (926 | 0.5%), together accounting for 99.8% of all Bayamon Municipio residents.
| Ancestry | # Population | % Population |
| African | 289 | 0.2% |
| American | 3,505 | 1.9% |
| Arab | 56 | 0.0% |
| Argentinean | 47 | 0.0% |
| Bhutanese | 8 | 0.0% |
| Brazilian | 16 | 0.0% |
| British West Indian | 141 | 0.1% |
| Central American | 315 | 0.2% |
| Central American Indian | 634 | 0.3% |
| Chilean | 61 | 0.0% |
| Colombian | 485 | 0.3% |
| Costa Rican | 2 | 0.0% |
| Cuban | 973 | 0.5% |
| Czechoslovakian | 9 | 0.0% |
| Dominican | 4,396 | 2.4% |
| Dutch West Indian | 24 | 0.0% |
| Ecuadorian | 30 | 0.0% |
| European | 47 | 0.0% |
| French | 70 | 0.0% |
| French Canadian | 21 | 0.0% |
| German | 81 | 0.0% |
| Guamanian / Chamorro | 8 | 0.0% |
| Guatemalan | 23 | 0.0% |
| Haitian | 76 | 0.0% |
| Honduran | 49 | 0.0% |
| Indian (Asian) | 264 | 0.1% |
| Irish | 84 | 0.1% |
| Italian | 94 | 0.1% |
| Korean | 68 | 0.0% |
| Lebanese | 19 | 0.0% |
| Mexican | 523 | 0.3% |
| Nicaraguan | 123 | 0.1% |
| Palestinian | 5 | 0.0% |
| Panamanian | 90 | 0.1% |
| Paraguayan | 9 | 0.0% |
| Peruvian | 143 | 0.1% |
| Portuguese | 61 | 0.0% |
| Puerto Rican | 174,076 | 94.4% |
| Salvadoran | 28 | 0.0% |
| Scottish | 9 | 0.0% |
| South American | 926 | 0.5% |
| Spaniard | 263 | 0.1% |
| Spanish | 8 | 0.0% |
| Spanish American Indian | 96 | 0.1% |
| Sri Lankan | 13 | 0.0% |
| Subsaharan African | 289 | 0.2% |
| Thai | 138 | 0.1% |
| Trinidadian and Tobagonian | 31 | 0.0% |
| U.S. Virgin Islander | 16 | 0.0% |
| Venezuelan | 151 | 0.1% |
| West Indian | 223 | 0.1% | View All 51 Rows |
Immigrants in Bayamon Municipio

| Immigration Origin | # Population | % Population | View All 0 Rows |
Sex and Age in Bayamon Municipio
Sex and Age in Bayamon Municipio
The most populous age groups in Bayamon Municipio are 25 to 29 Years (7,421 | 8.6%) for men and 60 to 64 Years (7,024 | 7.2%) for women.
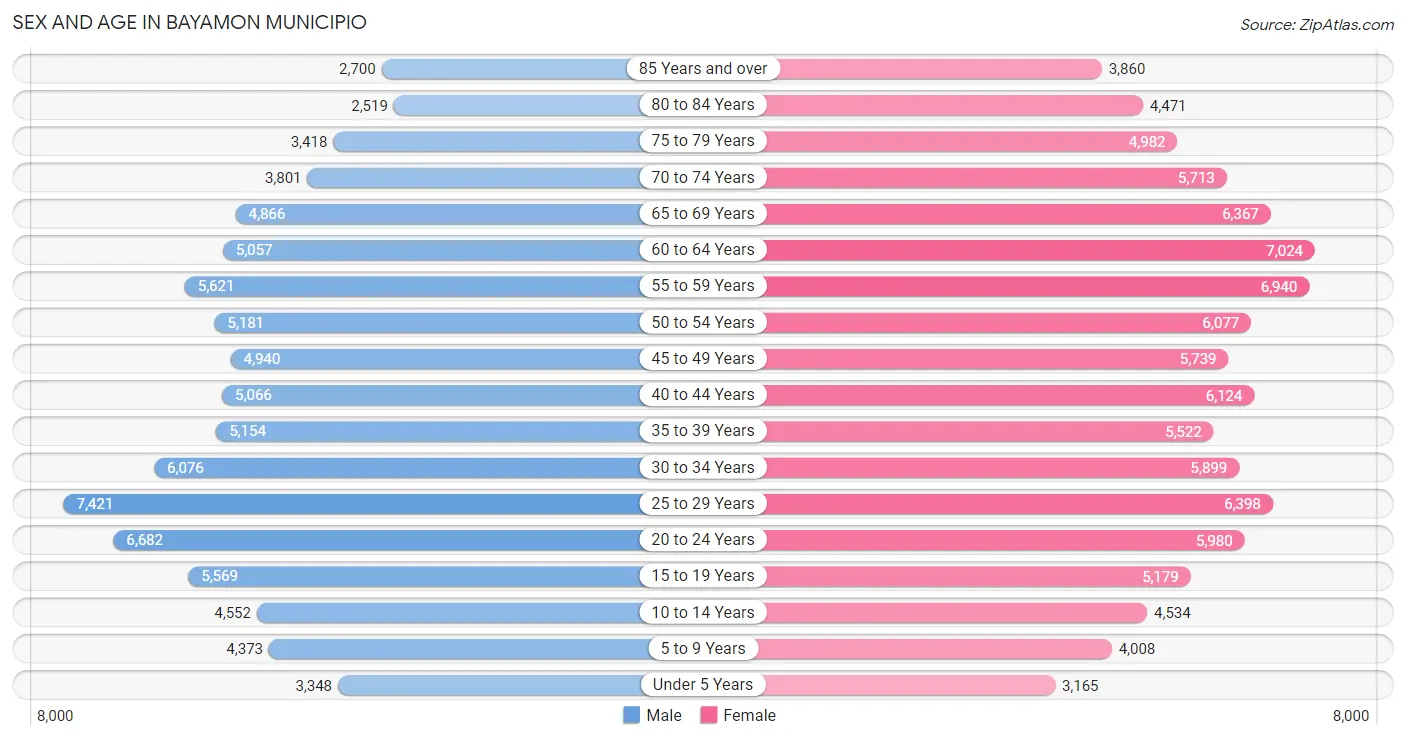
| Age Bracket | Male | Female |
| Under 5 Years | 3,348 (3.9%) | 3,165 (3.2%) |
| 5 to 9 Years | 4,373 (5.1%) | 4,008 (4.1%) |
| 10 to 14 Years | 4,552 (5.3%) | 4,534 (4.6%) |
| 15 to 19 Years | 5,569 (6.5%) | 5,179 (5.3%) |
| 20 to 24 Years | 6,682 (7.7%) | 5,980 (6.1%) |
| 25 to 29 Years | 7,421 (8.6%) | 6,398 (6.5%) |
| 30 to 34 Years | 6,076 (7.0%) | 5,899 (6.0%) |
| 35 to 39 Years | 5,154 (6.0%) | 5,522 (5.6%) |
| 40 to 44 Years | 5,066 (5.9%) | 6,124 (6.2%) |
| 45 to 49 Years | 4,940 (5.7%) | 5,739 (5.9%) |
| 50 to 54 Years | 5,181 (6.0%) | 6,077 (6.2%) |
| 55 to 59 Years | 5,621 (6.5%) | 6,940 (7.1%) |
| 60 to 64 Years | 5,057 (5.9%) | 7,024 (7.2%) |
| 65 to 69 Years | 4,866 (5.6%) | 6,367 (6.5%) |
| 70 to 74 Years | 3,801 (4.4%) | 5,713 (5.8%) |
| 75 to 79 Years | 3,418 (4.0%) | 4,982 (5.1%) |
| 80 to 84 Years | 2,519 (2.9%) | 4,471 (4.6%) |
| 85 Years and over | 2,700 (3.1%) | 3,860 (3.9%) |
| Total | 86,344 (100.0%) | 97,982 (100.0%) |
Families and Households in Bayamon Municipio
Median Family Size in Bayamon Municipio
The median family size in Bayamon Municipio is 3.24 persons per family, with single female/mother families (16,847 | 37.1%) accounting for the largest median family size of 3.29 persons per family. On the other hand, married-couple families (24,758 | 54.5%) represent the smallest median family size with 3.20 persons per family.
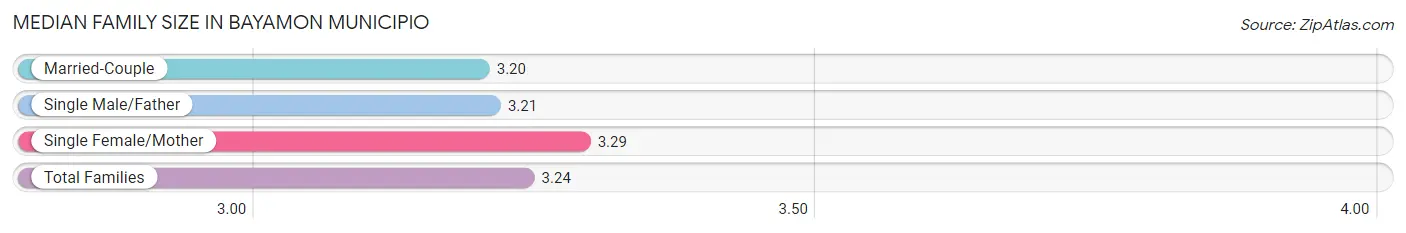
| Family Type | # Families | Family Size |
| Married-Couple | 24,758 (54.5%) | 3.20 |
| Single Male/Father | 3,815 (8.4%) | 3.21 |
| Single Female/Mother | 16,847 (37.1%) | 3.29 |
| Total Families | 45,420 (100.0%) | 3.24 |
Median Household Size in Bayamon Municipio
The median household size in Bayamon Municipio is 2.59 persons per household, with single male/father households (3,815 | 5.5%) accounting for the largest median household size of 3.58 persons per household. non-family households (23,623 | 34.2%) represent the smallest median household size with 1.17 persons per household.
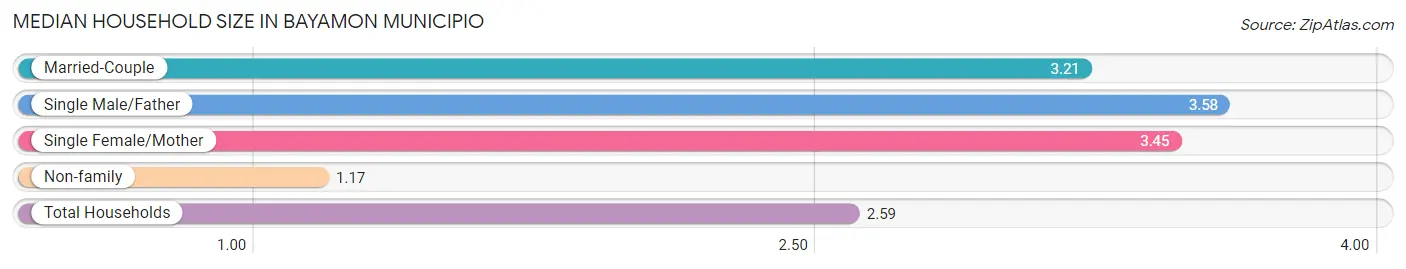
| Household Type | # Households | Household Size |
| Married-Couple | 24,758 (35.9%) | 3.21 |
| Single Male/Father | 3,815 (5.5%) | 3.58 |
| Single Female/Mother | 16,847 (24.4%) | 3.45 |
| Non-family | 23,623 (34.2%) | 1.17 |
| Total Households | 69,043 (100.0%) | 2.59 |
Household Size by Marriage Status in Bayamon Municipio
Out of a total of 69,043 households in Bayamon Municipio, 45,420 (65.8%) are family households, while 23,623 (34.2%) are nonfamily households. The most numerous type of family households are 2-person households, comprising 20,403, and the most common type of nonfamily households are 1-person households, comprising 20,420.
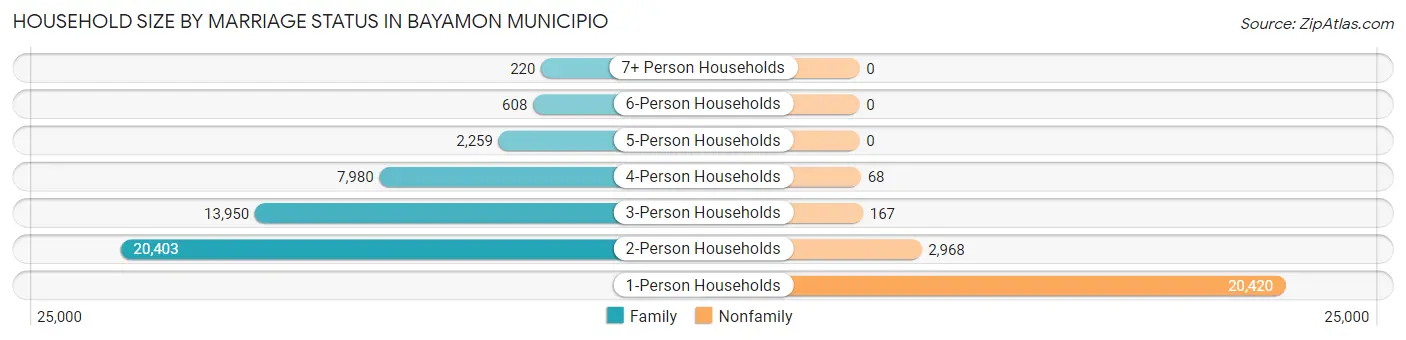
| Household Size | Family Households | Nonfamily Households |
| 1-Person Households | - | 20,420 (29.6%) |
| 2-Person Households | 20,403 (29.5%) | 2,968 (4.3%) |
| 3-Person Households | 13,950 (20.2%) | 167 (0.2%) |
| 4-Person Households | 7,980 (11.6%) | 68 (0.1%) |
| 5-Person Households | 2,259 (3.3%) | 0 (0.0%) |
| 6-Person Households | 608 (0.9%) | 0 (0.0%) |
| 7+ Person Households | 220 (0.3%) | 0 (0.0%) |
| Total | 45,420 (65.8%) | 23,623 (34.2%) |
Female Fertility in Bayamon Municipio
Fertility by Age in Bayamon Municipio
Average fertility rate in Bayamon Municipio is 25.0 births per 1,000 women. Women in the age bracket of 20 to 34 years have the highest fertility rate with 43.0 births per 1,000 women. Women in the age bracket of 20 to 34 years acount for 73.9% of all women with births.
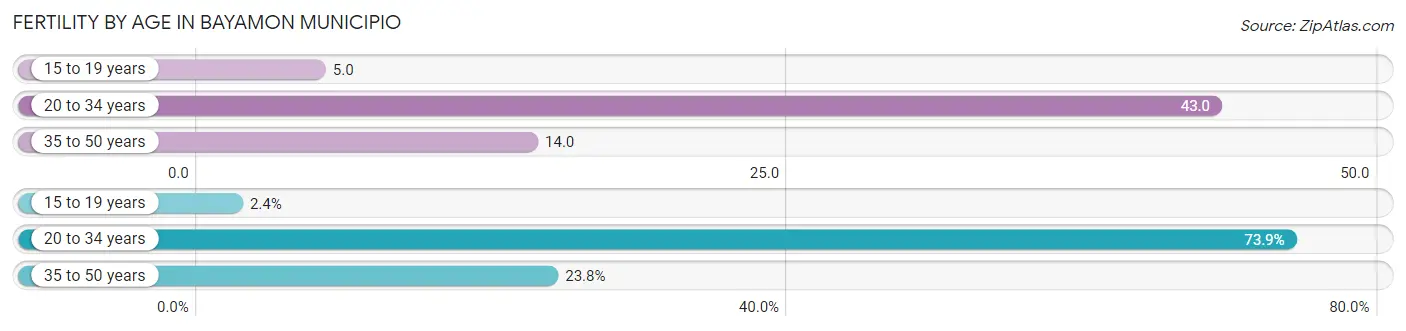
| Age Bracket | Women with Births | Births / 1,000 Women |
| 15 to 19 years | 25 (2.4%) | 5.0 |
| 20 to 34 years | 780 (73.9%) | 43.0 |
| 35 to 50 years | 251 (23.8%) | 14.0 |
| Total | 1,056 (100.0%) | 25.0 |
Fertility by Age by Marriage Status in Bayamon Municipio
44.8% of women with births (1,056) in Bayamon Municipio are married. The highest percentage of unmarried women with births falls into 20 to 34 years age bracket with 60.0% of them unmarried at the time of birth, while the lowest percentage of unmarried women with births belong to 35 to 50 years age bracket with 41.4% of them unmarried.
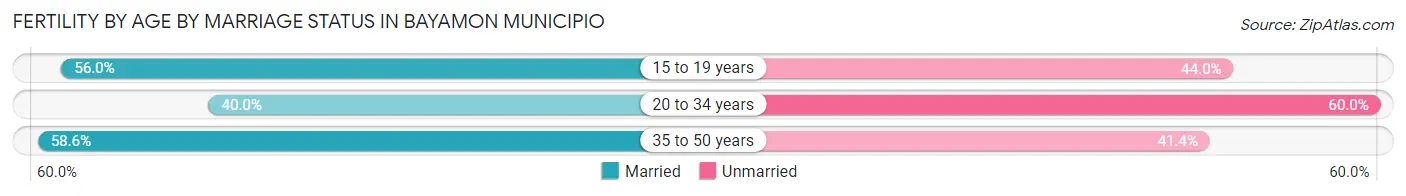
| Age Bracket | Married | Unmarried |
| 15 to 19 years | 14 (56.0%) | 11 (44.0%) |
| 20 to 34 years | 312 (40.0%) | 468 (60.0%) |
| 35 to 50 years | 147 (58.6%) | 104 (41.4%) |
| Total | 473 (44.8%) | 583 (55.2%) |
Fertility by Education in Bayamon Municipio
Average fertility rate in Bayamon Municipio is 25.0 births per 1,000 women. Women with the education attainment of graduate degree have the highest fertility rate of 33.0 births per 1,000 women, while women with the education attainment of less than high school have the lowest fertility at 11.0 births per 1,000 women. Women with the education attainment of college or associate's degree represent 41.9% of all women with births.
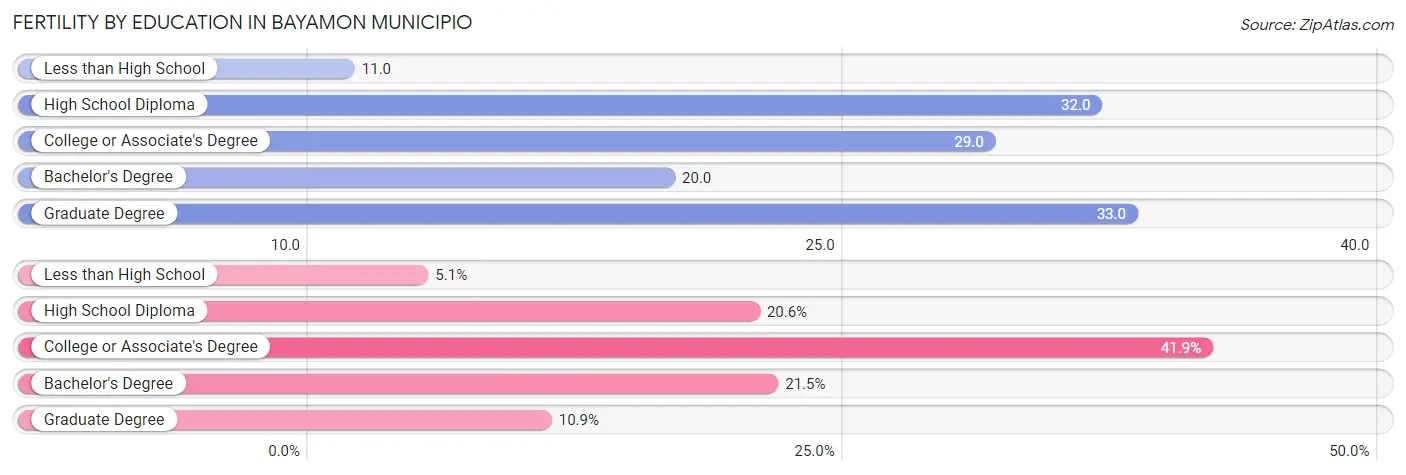
| Educational Attainment | Women with Births | Births / 1,000 Women |
| Less than High School | 54 (5.1%) | 11.0 |
| High School Diploma | 218 (20.6%) | 32.0 |
| College or Associate's Degree | 442 (41.9%) | 29.0 |
| Bachelor's Degree | 227 (21.5%) | 20.0 |
| Graduate Degree | 115 (10.9%) | 33.0 |
| Total | 1,056 (100.0%) | 25.0 |
Fertility by Education by Marriage Status in Bayamon Municipio
55.2% of women with births in Bayamon Municipio are unmarried. Women with the educational attainment of graduate degree are most likely to be married with 67.0% of them married at childbirth, while women with the educational attainment of less than high school are least likely to be married with 100.0% of them unmarried at childbirth.
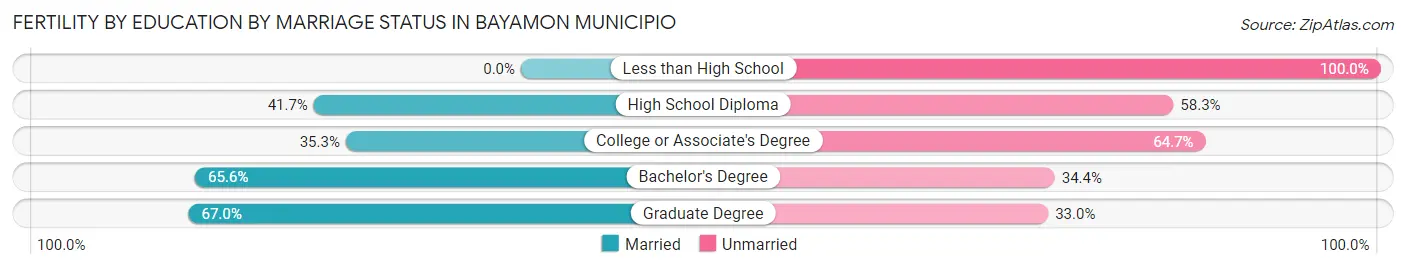
| Educational Attainment | Married | Unmarried |
| Less than High School | 0 (0.0%) | 54 (100.0%) |
| High School Diploma | 91 (41.7%) | 127 (58.3%) |
| College or Associate's Degree | 156 (35.3%) | 286 (64.7%) |
| Bachelor's Degree | 149 (65.6%) | 78 (34.4%) |
| Graduate Degree | 77 (67.0%) | 38 (33.0%) |
| Total | 473 (44.8%) | 583 (55.2%) |
Employment Characteristics in Bayamon Municipio
Employment by Class of Employer in Bayamon Municipio
Among the 66,121 employed individuals in Bayamon Municipio, private company employees (42,599 | 64.4%), self-employed (not incorporated) (6,910 | 10.4%), and state government employees (6,653 | 10.1%) make up the most common classes of employment.
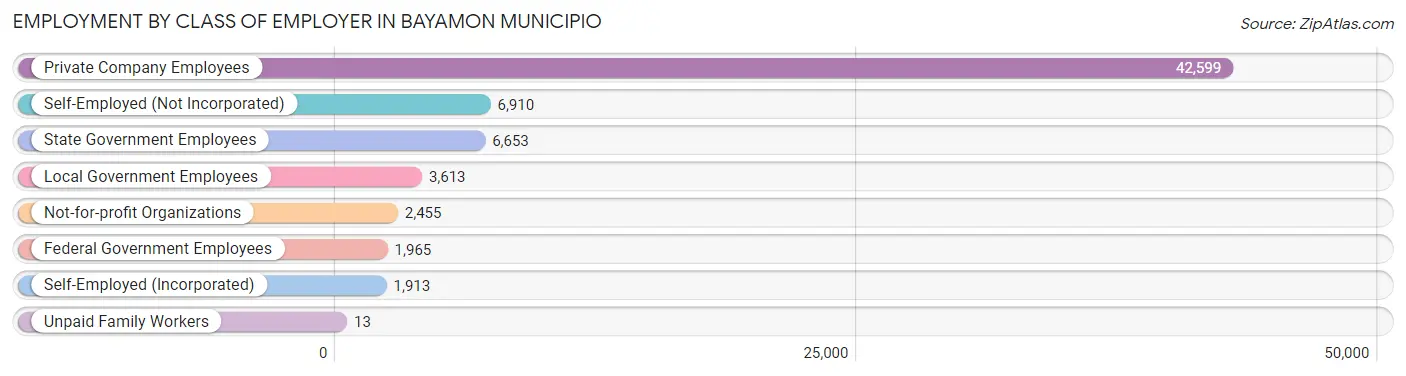
| Employer Class | # Employees | % Employees |
| Private Company Employees | 42,599 | 64.4% |
| Self-Employed (Incorporated) | 1,913 | 2.9% |
| Self-Employed (Not Incorporated) | 6,910 | 10.4% |
| Not-for-profit Organizations | 2,455 | 3.7% |
| Local Government Employees | 3,613 | 5.5% |
| State Government Employees | 6,653 | 10.1% |
| Federal Government Employees | 1,965 | 3.0% |
| Unpaid Family Workers | 13 | 0.0% |
| Total | 66,121 | 100.0% |
Employment Status by Age in Bayamon Municipio
According to the labor force statistics for Bayamon Municipio, out of the total population over 16 years of age (158,308), 47.0% or 74,405 individuals are in the labor force, with 9.9% or 7,366 of them unemployed. The age group with the highest labor force participation rate is 35 to 44 years, with 78.2% or 17,099 individuals in the labor force. Within the labor force, the 16 to 19 years age range has the highest percentage of unemployed individuals, with 29.8% or 405 of them being unemployed.
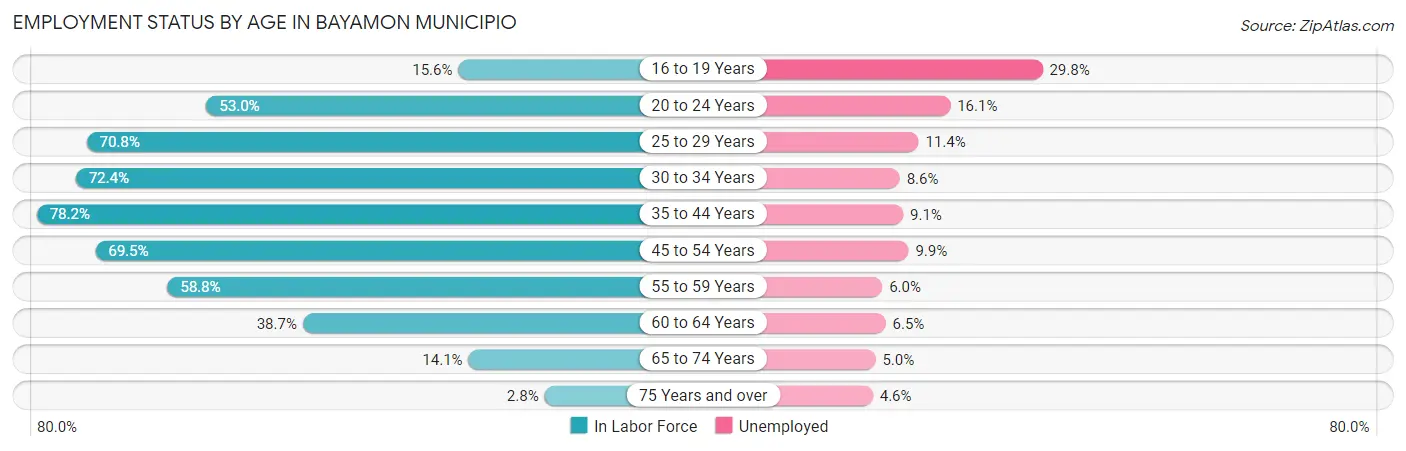
| Age Bracket | In Labor Force | Unemployed |
| 16 to 19 Years | 1,359 (15.6%) | 405 (29.8%) |
| 20 to 24 Years | 6,711 (53.0%) | 1,080 (16.1%) |
| 25 to 29 Years | 9,784 (70.8%) | 1,115 (11.4%) |
| 30 to 34 Years | 8,670 (72.4%) | 746 (8.6%) |
| 35 to 44 Years | 17,099 (78.2%) | 1,556 (9.1%) |
| 45 to 54 Years | 15,246 (69.5%) | 1,509 (9.9%) |
| 55 to 59 Years | 7,386 (58.8%) | 443 (6.0%) |
| 60 to 64 Years | 4,675 (38.7%) | 304 (6.5%) |
| 65 to 74 Years | 2,925 (14.1%) | 146 (5.0%) |
| 75 Years and over | 615 (2.8%) | 28 (4.6%) |
| Total | 74,405 (47.0%) | 7,366 (9.9%) |
Employment Status by Educational Attainment in Bayamon Municipio
According to labor force statistics for Bayamon Municipio, 66.7% of individuals (62,857) out of the total population between 25 and 64 years of age (94,239) are in the labor force, with 9.0% or 5,657 of them being unemployed. The group with the highest labor force participation rate are those with the educational attainment of bachelor's degree or higher, with 77.9% or 25,854 individuals in the labor force. Within the labor force, individuals with less than high school education have the highest percentage of unemployment, with 25.0% or 956 of them being unemployed.
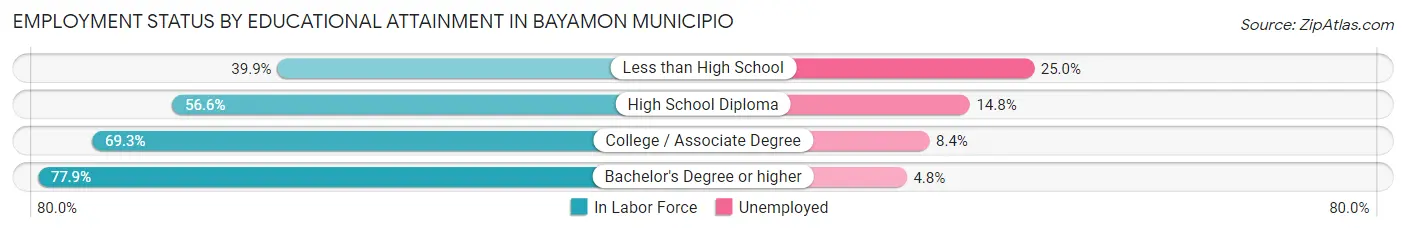
| Educational Attainment | In Labor Force | Unemployed |
| Less than High School | 3,824 (39.9%) | 2,396 (25.0%) |
| High School Diploma | 10,967 (56.6%) | 2,868 (14.8%) |
| College / Associate Degree | 22,238 (69.3%) | 2,695 (8.4%) |
| Bachelor's Degree or higher | 25,854 (77.9%) | 1,593 (4.8%) |
| Total | 62,857 (66.7%) | 8,482 (9.0%) |
Employment Occupations by Sex in Bayamon Municipio
Management, Business, Science and Arts Occupations
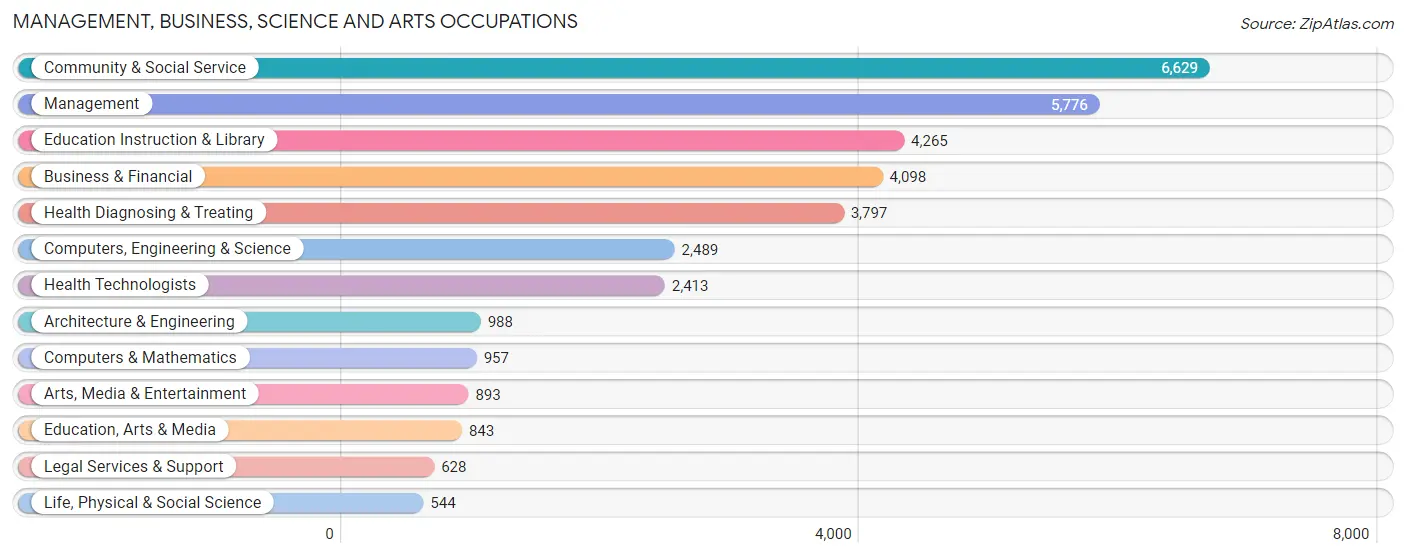
The most common Management, Business, Science and Arts occupations in Bayamon Municipio are Community & Social Service (6,629 | 9.9%), Management (5,776 | 8.6%), Education Instruction & Library (4,265 | 6.4%), Business & Financial (4,098 | 6.1%), and Health Diagnosing & Treating (3,797 | 5.7%).
Management, Business, Science and Arts Occupations by Sex
Within the Management, Business, Science and Arts occupations in Bayamon Municipio, the most male-oriented occupations are Architecture & Engineering (83.7%), Computers & Mathematics (74.0%), and Arts, Media & Entertainment (70.1%), while the most female-oriented occupations are Health Technologists (75.7%), Education Instruction & Library (75.0%), and Health Diagnosing & Treating (73.6%).
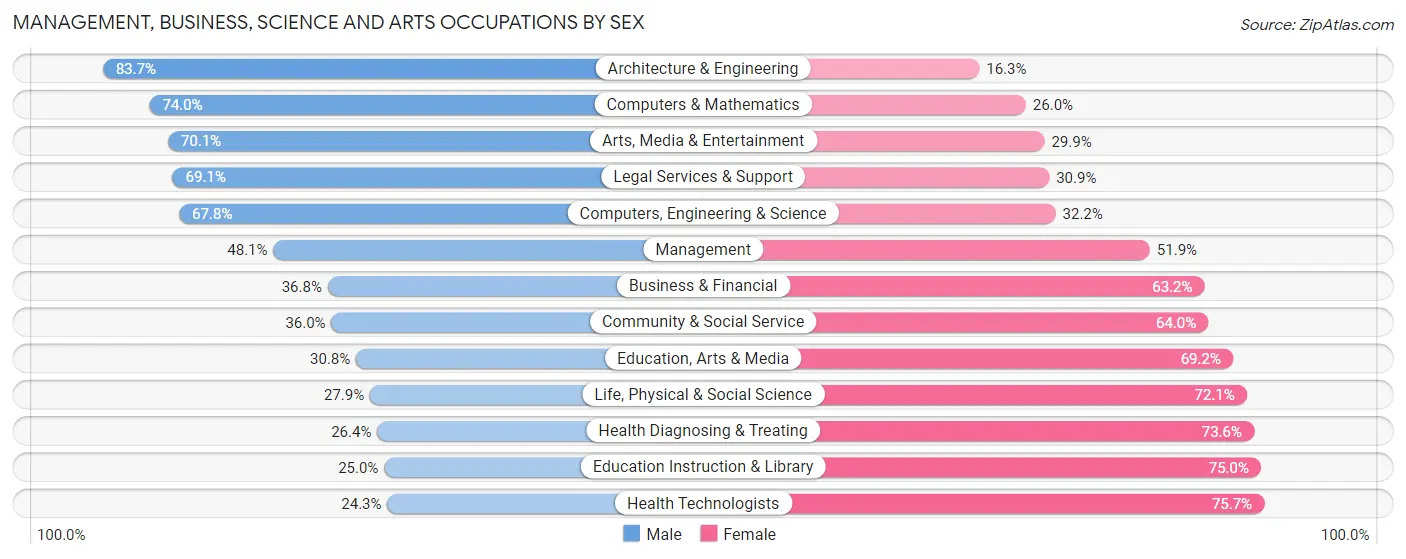
| Occupation | Male | Female |
| Management | 2,779 (48.1%) | 2,997 (51.9%) |
| Business & Financial | 1,507 (36.8%) | 2,591 (63.2%) |
| Computers, Engineering & Science | 1,687 (67.8%) | 802 (32.2%) |
| Computers & Mathematics | 708 (74.0%) | 249 (26.0%) |
| Architecture & Engineering | 827 (83.7%) | 161 (16.3%) |
| Life, Physical & Social Science | 152 (27.9%) | 392 (72.1%) |
| Community & Social Service | 2,386 (36.0%) | 4,243 (64.0%) |
| Education, Arts & Media | 260 (30.8%) | 583 (69.2%) |
| Legal Services & Support | 434 (69.1%) | 194 (30.9%) |
| Education Instruction & Library | 1,066 (25.0%) | 3,199 (75.0%) |
| Arts, Media & Entertainment | 626 (70.1%) | 267 (29.9%) |
| Health Diagnosing & Treating | 1,004 (26.4%) | 2,793 (73.6%) |
| Health Technologists | 587 (24.3%) | 1,826 (75.7%) |
| Total (Category) | 9,363 (41.1%) | 13,426 (58.9%) |
| Total (Overall) | 33,695 (50.4%) | 33,213 (49.6%) |
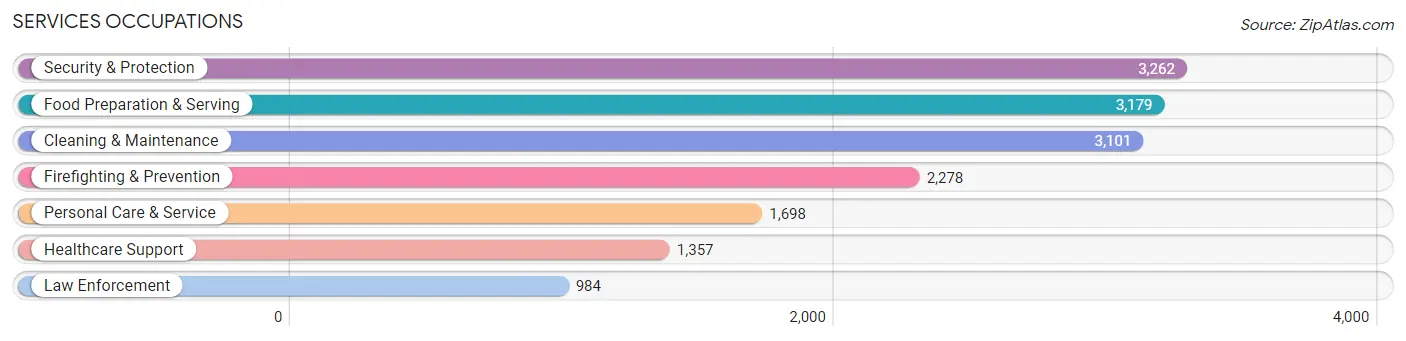
Services Occupations
The most common Services occupations in Bayamon Municipio are Security & Protection (3,262 | 4.9%), Food Preparation & Serving (3,179 | 4.8%), Cleaning & Maintenance (3,101 | 4.6%), Firefighting & Prevention (2,278 | 3.4%), and Personal Care & Service (1,698 | 2.5%).
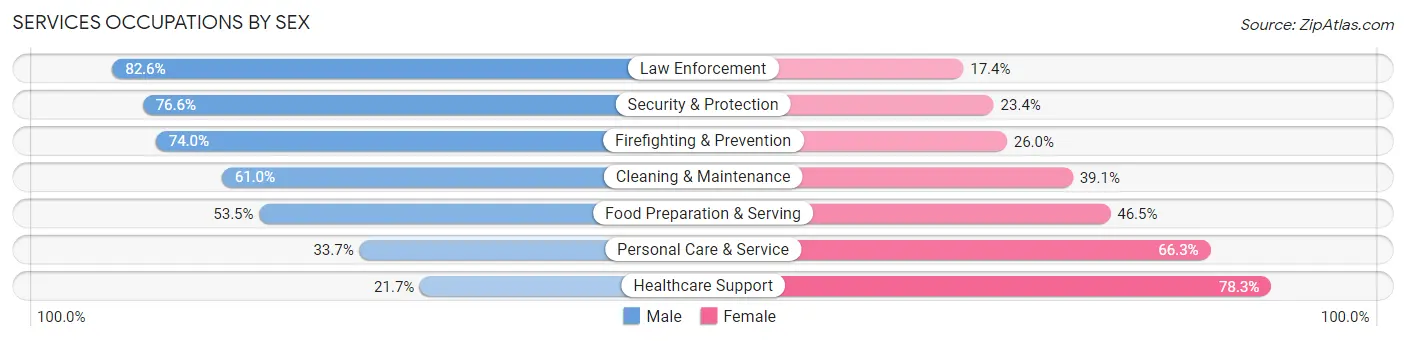
Services Occupations by Sex
Within the Services occupations in Bayamon Municipio, the most male-oriented occupations are Law Enforcement (82.6%), Security & Protection (76.6%), and Firefighting & Prevention (74.0%), while the most female-oriented occupations are Healthcare Support (78.3%), Personal Care & Service (66.3%), and Food Preparation & Serving (46.5%).
| Occupation | Male | Female |
| Healthcare Support | 294 (21.7%) | 1,063 (78.3%) |
| Security & Protection | 2,499 (76.6%) | 763 (23.4%) |
| Firefighting & Prevention | 1,686 (74.0%) | 592 (26.0%) |
| Law Enforcement | 813 (82.6%) | 171 (17.4%) |
| Food Preparation & Serving | 1,701 (53.5%) | 1,478 (46.5%) |
| Cleaning & Maintenance | 1,890 (61.0%) | 1,211 (39.1%) |
| Personal Care & Service | 572 (33.7%) | 1,126 (66.3%) |
| Total (Category) | 6,956 (55.2%) | 5,641 (44.8%) |
| Total (Overall) | 33,695 (50.4%) | 33,213 (49.6%) |
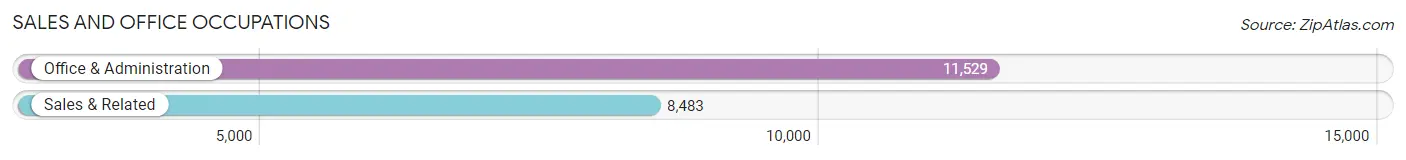
Sales and Office Occupations
The most common Sales and Office occupations in Bayamon Municipio are Office & Administration (11,529 | 17.2%), and Sales & Related (8,483 | 12.7%).
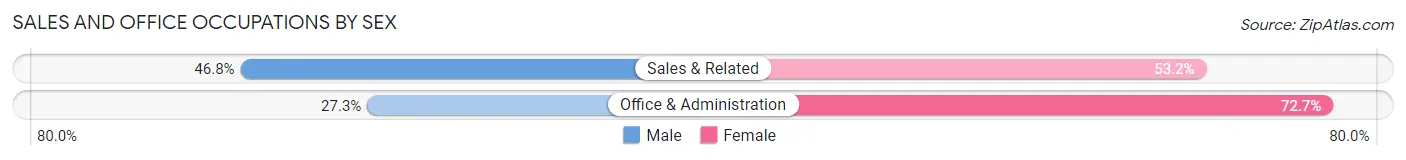
Sales and Office Occupations by Sex
| Occupation | Male | Female |
| Sales & Related | 3,970 (46.8%) | 4,513 (53.2%) |
| Office & Administration | 3,147 (27.3%) | 8,382 (72.7%) |
| Total (Category) | 7,117 (35.6%) | 12,895 (64.4%) |
| Total (Overall) | 33,695 (50.4%) | 33,213 (49.6%) |
Natural Resources, Construction and Maintenance Occupations
The most common Natural Resources, Construction and Maintenance occupations in Bayamon Municipio are Construction & Extraction (2,463 | 3.7%), Installation, Maintenance & Repair (2,445 | 3.6%), and Farming, Fishing & Forestry (90 | 0.1%).
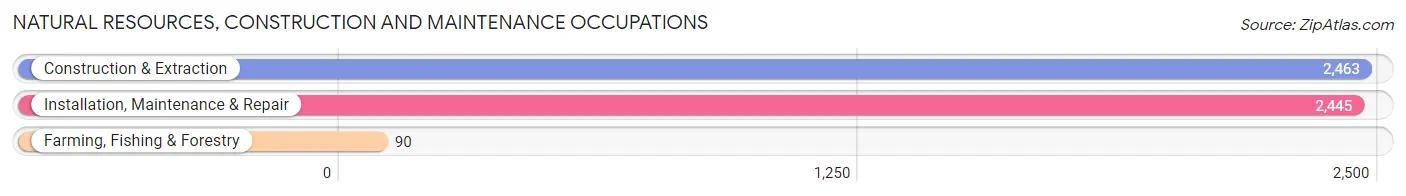
Natural Resources, Construction and Maintenance Occupations by Sex
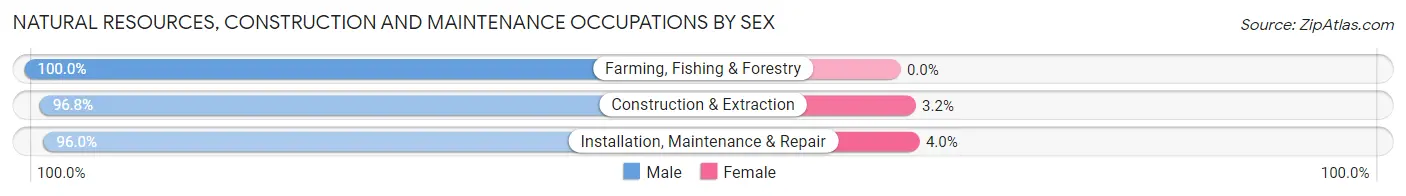
| Occupation | Male | Female |
| Farming, Fishing & Forestry | 90 (100.0%) | 0 (0.0%) |
| Construction & Extraction | 2,385 (96.8%) | 78 (3.2%) |
| Installation, Maintenance & Repair | 2,348 (96.0%) | 97 (4.0%) |
| Total (Category) | 4,823 (96.5%) | 175 (3.5%) |
| Total (Overall) | 33,695 (50.4%) | 33,213 (49.6%) |
Production, Transportation and Moving Occupations
The most common Production, Transportation and Moving occupations in Bayamon Municipio are Material Moving (2,491 | 3.7%), Transportation (2,065 | 3.1%), and Production (1,956 | 2.9%).
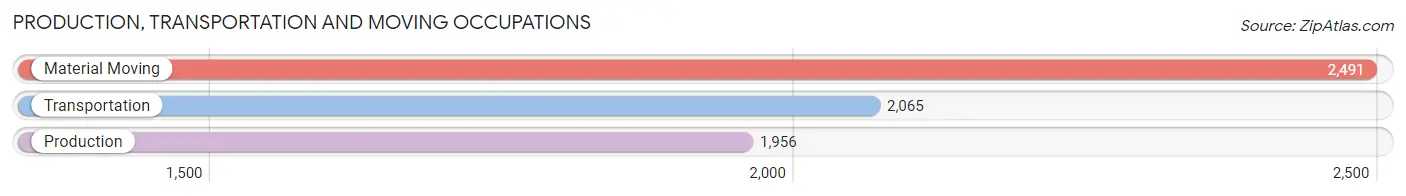
Production, Transportation and Moving Occupations by Sex
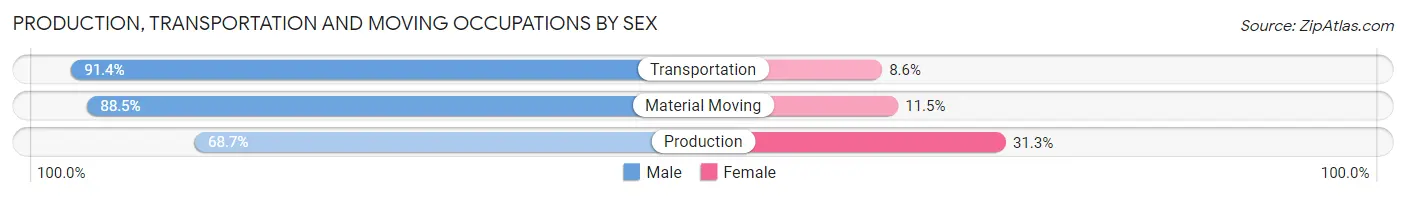
| Occupation | Male | Female |
| Production | 1,344 (68.7%) | 612 (31.3%) |
| Transportation | 1,888 (91.4%) | 177 (8.6%) |
| Material Moving | 2,204 (88.5%) | 287 (11.5%) |
| Total (Category) | 5,436 (83.5%) | 1,076 (16.5%) |
| Total (Overall) | 33,695 (50.4%) | 33,213 (49.6%) |
Employment Industries by Sex in Bayamon Municipio
Employment Industries in Bayamon Municipio
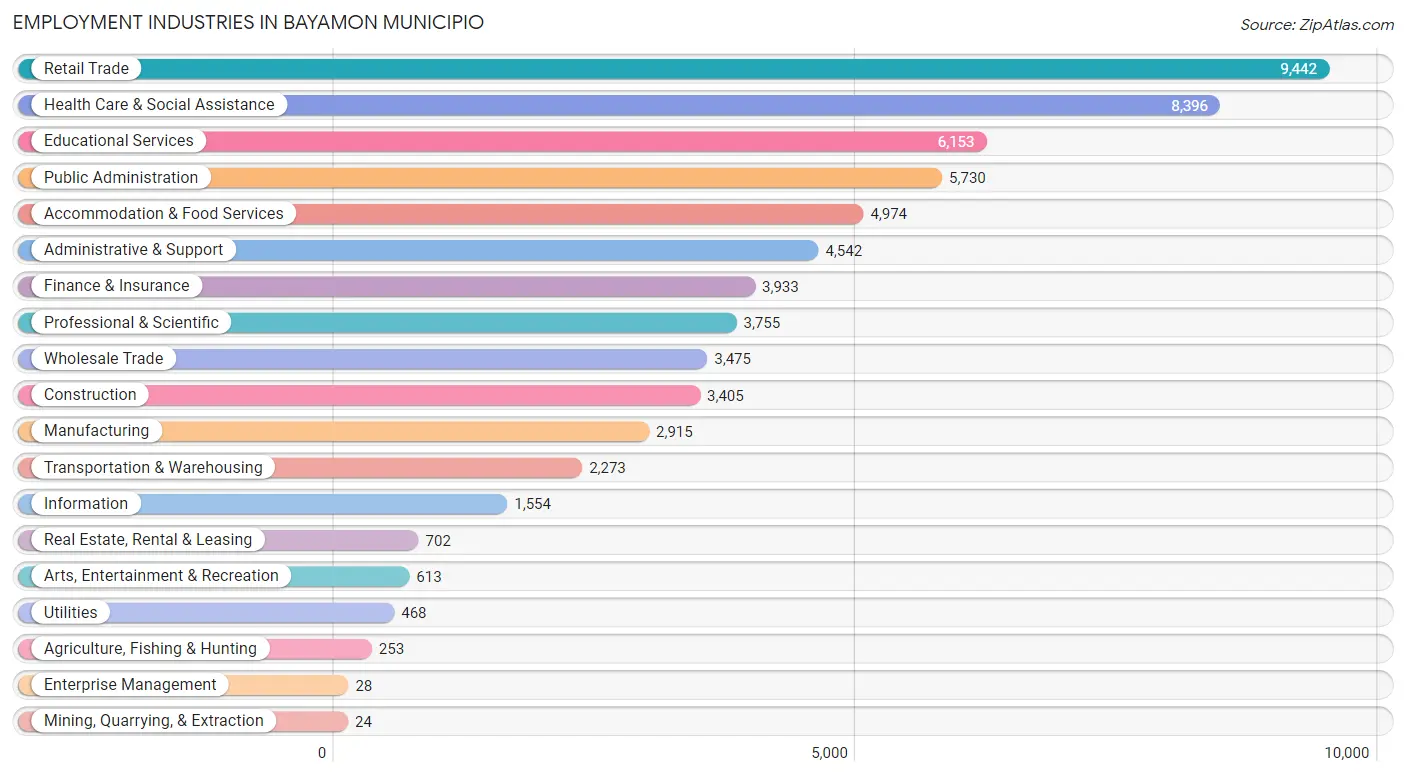
The major employment industries in Bayamon Municipio include Retail Trade (9,442 | 14.1%), Health Care & Social Assistance (8,396 | 12.6%), Educational Services (6,153 | 9.2%), Public Administration (5,730 | 8.6%), and Accommodation & Food Services (4,974 | 7.4%).
Employment Industries by Sex in Bayamon Municipio
The Bayamon Municipio industries that see more men than women are Mining, Quarrying, & Extraction (100.0%), Construction (90.6%), and Agriculture, Fishing & Hunting (86.2%), whereas the industries that tend to have a higher number of women are Health Care & Social Assistance (76.4%), Finance & Insurance (68.9%), and Educational Services (68.1%).
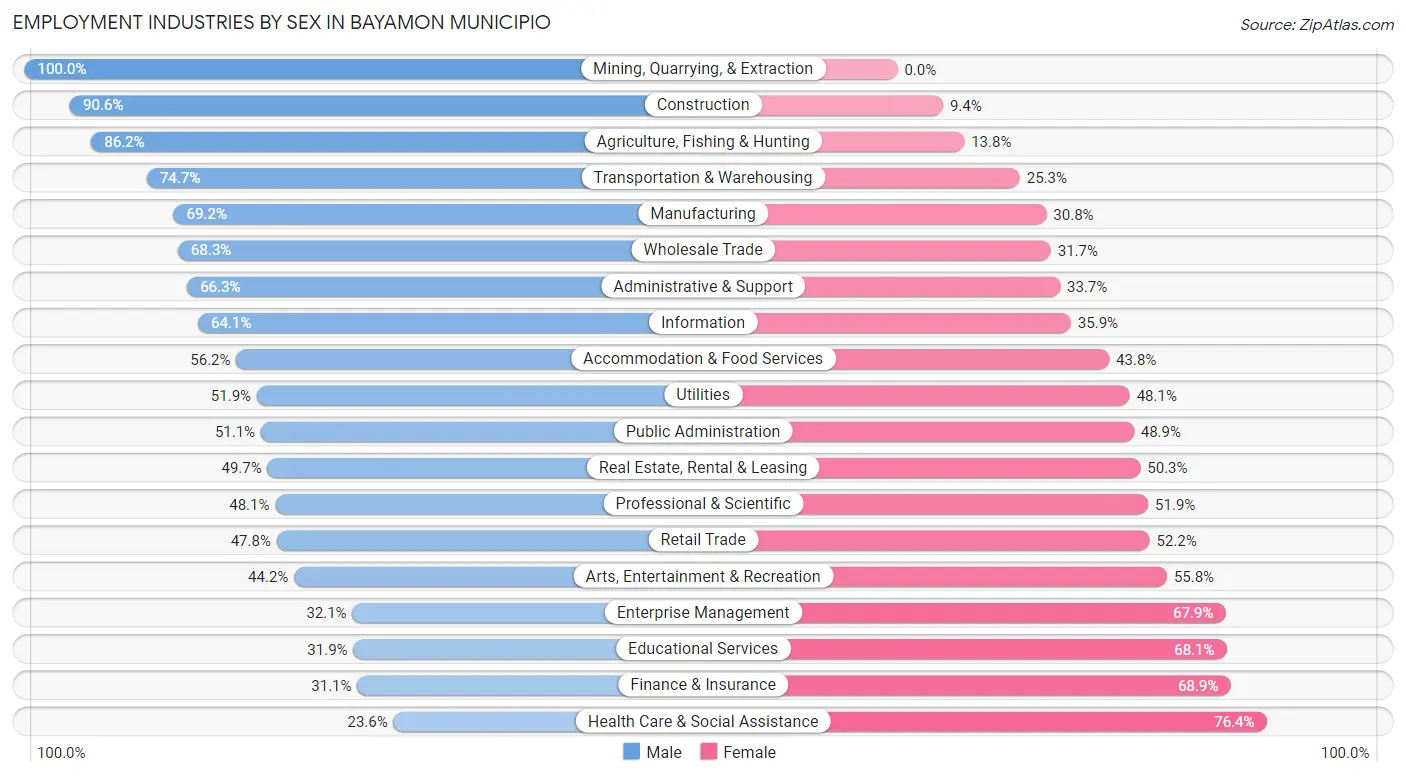
| Industry | Male | Female |
| Agriculture, Fishing & Hunting | 218 (86.2%) | 35 (13.8%) |
| Mining, Quarrying, & Extraction | 24 (100.0%) | 0 (0.0%) |
| Construction | 3,084 (90.6%) | 321 (9.4%) |
| Manufacturing | 2,016 (69.2%) | 899 (30.8%) |
| Wholesale Trade | 2,372 (68.3%) | 1,103 (31.7%) |
| Retail Trade | 4,514 (47.8%) | 4,928 (52.2%) |
| Transportation & Warehousing | 1,697 (74.7%) | 576 (25.3%) |
| Utilities | 243 (51.9%) | 225 (48.1%) |
| Information | 996 (64.1%) | 558 (35.9%) |
| Finance & Insurance | 1,224 (31.1%) | 2,709 (68.9%) |
| Real Estate, Rental & Leasing | 349 (49.7%) | 353 (50.3%) |
| Professional & Scientific | 1,806 (48.1%) | 1,949 (51.9%) |
| Enterprise Management | 9 (32.1%) | 19 (67.9%) |
| Administrative & Support | 3,013 (66.3%) | 1,529 (33.7%) |
| Educational Services | 1,965 (31.9%) | 4,188 (68.1%) |
| Health Care & Social Assistance | 1,985 (23.6%) | 6,411 (76.4%) |
| Arts, Entertainment & Recreation | 271 (44.2%) | 342 (55.8%) |
| Accommodation & Food Services | 2,794 (56.2%) | 2,180 (43.8%) |
| Public Administration | 2,927 (51.1%) | 2,803 (48.9%) |
| Total | 33,695 (50.4%) | 33,213 (49.6%) |
Education in Bayamon Municipio
School Enrollment in Bayamon Municipio
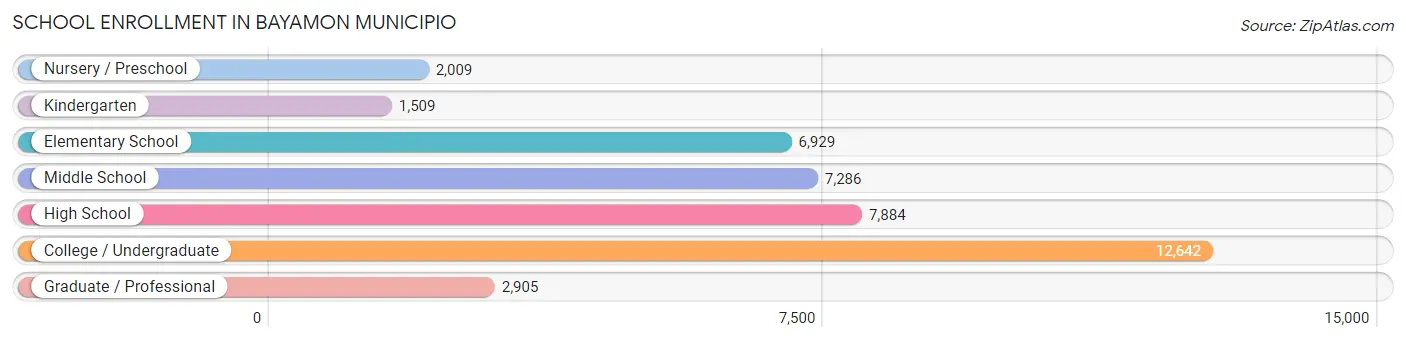
The most common levels of schooling among the 41,164 students in Bayamon Municipio are college / undergraduate (12,642 | 30.7%), high school (7,884 | 19.2%), and middle school (7,286 | 17.7%).
| School Level | # Students | % Students |
| Nursery / Preschool | 2,009 | 4.9% |
| Kindergarten | 1,509 | 3.7% |
| Elementary School | 6,929 | 16.8% |
| Middle School | 7,286 | 17.7% |
| High School | 7,884 | 19.2% |
| College / Undergraduate | 12,642 | 30.7% |
| Graduate / Professional | 2,905 | 7.1% |
| Total | 41,164 | 100.0% |
School Enrollment by Age by Funding Source in Bayamon Municipio
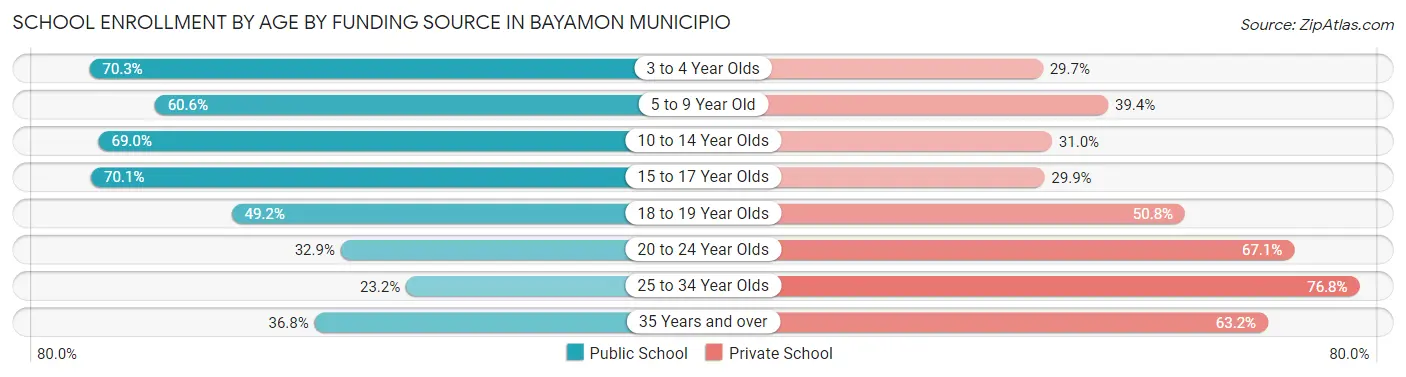
Out of a total of 41,164 students who are enrolled in schools in Bayamon Municipio, 18,935 (46.0%) attend a private institution, while the remaining 22,229 (54.0%) are enrolled in public schools. The age group of 25 to 34 year olds has the highest likelihood of being enrolled in private schools, with 2,615 (76.8% in the age bracket) enrolled. Conversely, the age group of 3 to 4 year olds has the lowest likelihood of being enrolled in a private school, with 1,245 (70.3% in the age bracket) attending a public institution.
| Age Bracket | Public School | Private School |
| 3 to 4 Year Olds | 1,245 (70.3%) | 525 (29.7%) |
| 5 to 9 Year Old | 4,921 (60.6%) | 3,200 (39.4%) |
| 10 to 14 Year Olds | 6,154 (69.0%) | 2,769 (31.0%) |
| 15 to 17 Year Olds | 4,132 (70.1%) | 1,763 (29.9%) |
| 18 to 19 Year Olds | 1,688 (49.2%) | 1,746 (50.8%) |
| 20 to 24 Year Olds | 2,053 (32.9%) | 4,189 (67.1%) |
| 25 to 34 Year Olds | 788 (23.2%) | 2,615 (76.8%) |
| 35 Years and over | 1,242 (36.8%) | 2,134 (63.2%) |
| Total | 22,229 (54.0%) | 18,935 (46.0%) |
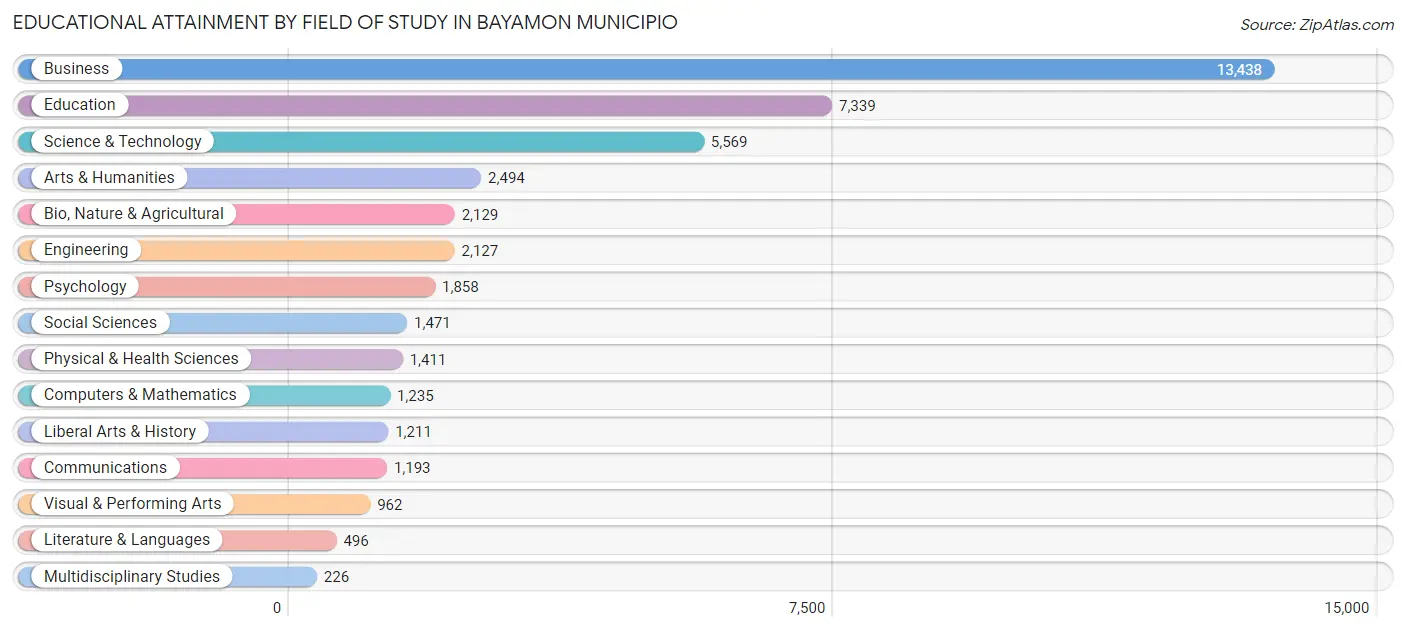
Educational Attainment by Field of Study in Bayamon Municipio
Business (13,438 | 31.1%), education (7,339 | 17.0%), science & technology (5,569 | 12.9%), arts & humanities (2,494 | 5.8%), and bio, nature & agricultural (2,129 | 4.9%) are the most common fields of study among 43,159 individuals in Bayamon Municipio who have obtained a bachelor's degree or higher.
| Field of Study | # Graduates | % Graduates |
| Computers & Mathematics | 1,235 | 2.9% |
| Bio, Nature & Agricultural | 2,129 | 4.9% |
| Physical & Health Sciences | 1,411 | 3.3% |
| Psychology | 1,858 | 4.3% |
| Social Sciences | 1,471 | 3.4% |
| Engineering | 2,127 | 4.9% |
| Multidisciplinary Studies | 226 | 0.5% |
| Science & Technology | 5,569 | 12.9% |
| Business | 13,438 | 31.1% |
| Education | 7,339 | 17.0% |
| Literature & Languages | 496 | 1.1% |
| Liberal Arts & History | 1,211 | 2.8% |
| Visual & Performing Arts | 962 | 2.2% |
| Communications | 1,193 | 2.8% |
| Arts & Humanities | 2,494 | 5.8% |
| Total | 43,159 | 100.0% |
Transportation & Commute in Bayamon Municipio
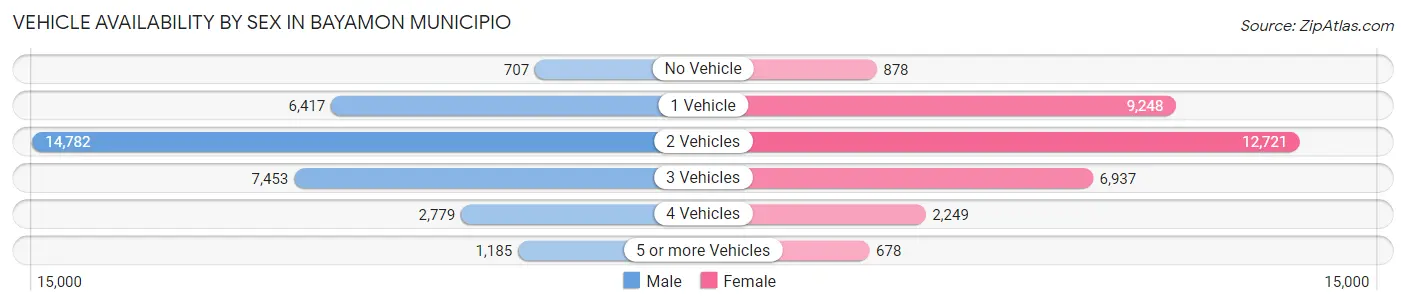
Vehicle Availability by Sex in Bayamon Municipio
The most prevalent vehicle ownership categories in Bayamon Municipio are males with 2 vehicles (14,782, accounting for 44.4%) and females with 2 vehicles (12,721, making up 45.2%).
| Vehicles Available | Male | Female |
| No Vehicle | 707 (2.1%) | 878 (2.7%) |
| 1 Vehicle | 6,417 (19.3%) | 9,248 (28.3%) |
| 2 Vehicles | 14,782 (44.4%) | 12,721 (38.9%) |
| 3 Vehicles | 7,453 (22.4%) | 6,937 (21.2%) |
| 4 Vehicles | 2,779 (8.3%) | 2,249 (6.9%) |
| 5 or more Vehicles | 1,185 (3.6%) | 678 (2.1%) |
| Total | 33,323 (100.0%) | 32,711 (100.0%) |
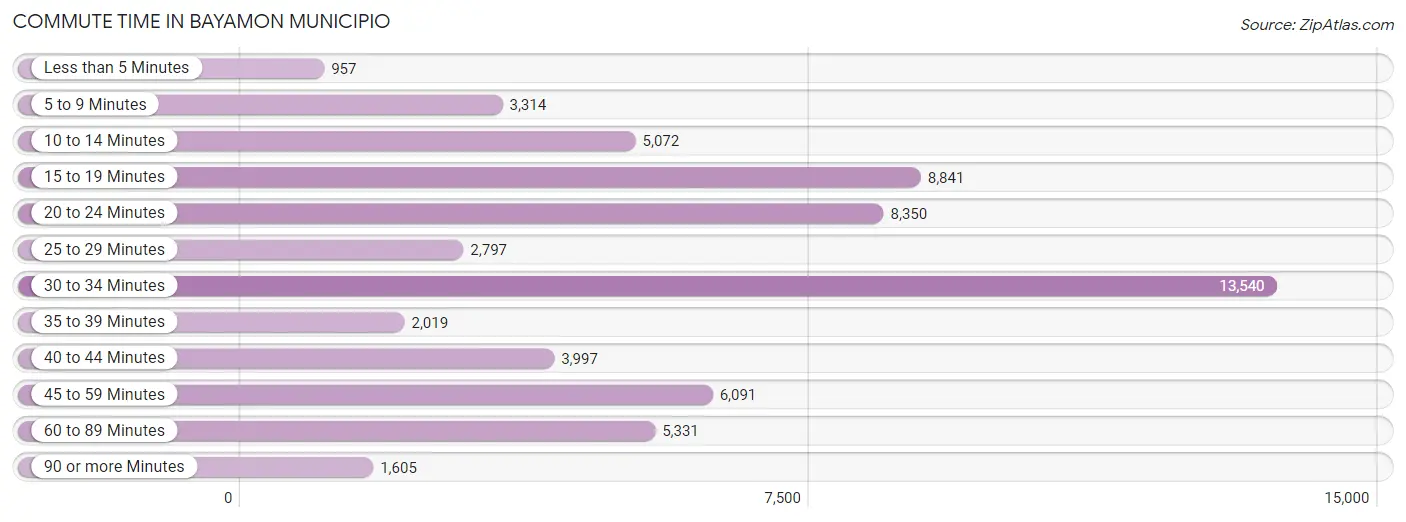
Commute Time in Bayamon Municipio
The most frequently occuring commute durations in Bayamon Municipio are 30 to 34 minutes (13,540 commuters, 21.9%), 15 to 19 minutes (8,841 commuters, 14.3%), and 20 to 24 minutes (8,350 commuters, 13.5%).
| Commute Time | # Commuters | % Commuters |
| Less than 5 Minutes | 957 | 1.5% |
| 5 to 9 Minutes | 3,314 | 5.3% |
| 10 to 14 Minutes | 5,072 | 8.2% |
| 15 to 19 Minutes | 8,841 | 14.3% |
| 20 to 24 Minutes | 8,350 | 13.5% |
| 25 to 29 Minutes | 2,797 | 4.5% |
| 30 to 34 Minutes | 13,540 | 21.9% |
| 35 to 39 Minutes | 2,019 | 3.3% |
| 40 to 44 Minutes | 3,997 | 6.5% |
| 45 to 59 Minutes | 6,091 | 9.8% |
| 60 to 89 Minutes | 5,331 | 8.6% |
| 90 or more Minutes | 1,605 | 2.6% |
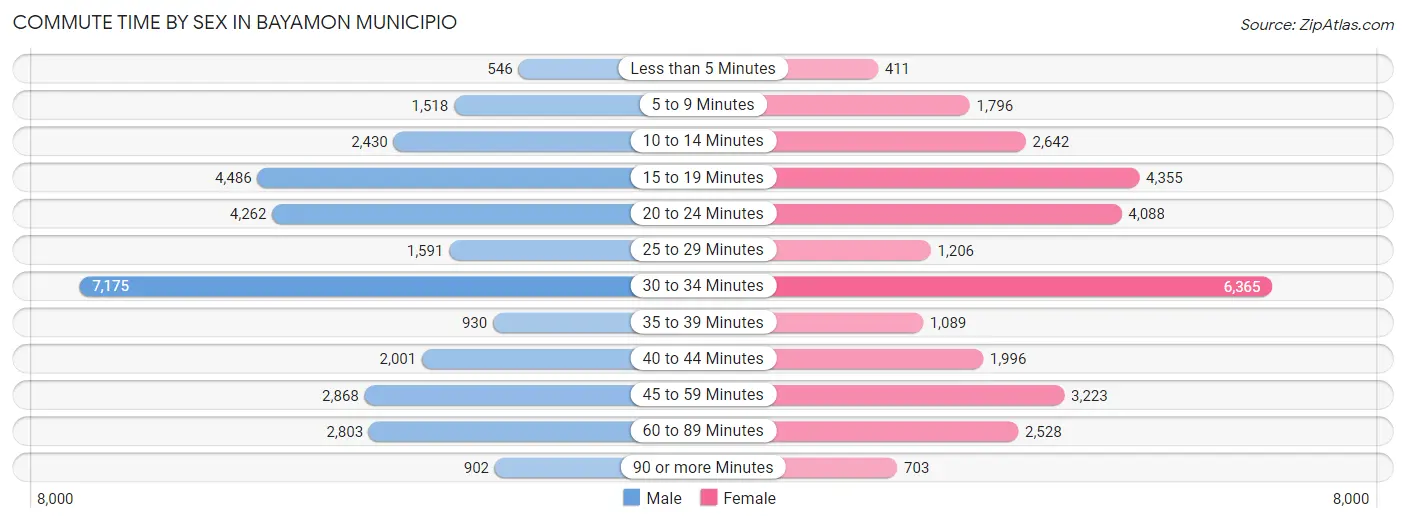
Commute Time by Sex in Bayamon Municipio
The most common commute times in Bayamon Municipio are 30 to 34 minutes (7,175 commuters, 22.8%) for males and 30 to 34 minutes (6,365 commuters, 20.9%) for females.
| Commute Time | Male | Female |
| Less than 5 Minutes | 546 (1.7%) | 411 (1.3%) |
| 5 to 9 Minutes | 1,518 (4.8%) | 1,796 (5.9%) |
| 10 to 14 Minutes | 2,430 (7.7%) | 2,642 (8.7%) |
| 15 to 19 Minutes | 4,486 (14.2%) | 4,355 (14.3%) |
| 20 to 24 Minutes | 4,262 (13.5%) | 4,088 (13.5%) |
| 25 to 29 Minutes | 1,591 (5.1%) | 1,206 (4.0%) |
| 30 to 34 Minutes | 7,175 (22.8%) | 6,365 (20.9%) |
| 35 to 39 Minutes | 930 (2.9%) | 1,089 (3.6%) |
| 40 to 44 Minutes | 2,001 (6.4%) | 1,996 (6.6%) |
| 45 to 59 Minutes | 2,868 (9.1%) | 3,223 (10.6%) |
| 60 to 89 Minutes | 2,803 (8.9%) | 2,528 (8.3%) |
| 90 or more Minutes | 902 (2.9%) | 703 (2.3%) |
Time of Departure to Work by Sex in Bayamon Municipio
The most frequent times of departure to work in Bayamon Municipio are 7:00 AM to 7:29 AM (4,595, 14.6%) for males and 7:00 AM to 7:29 AM (5,911, 19.4%) for females.
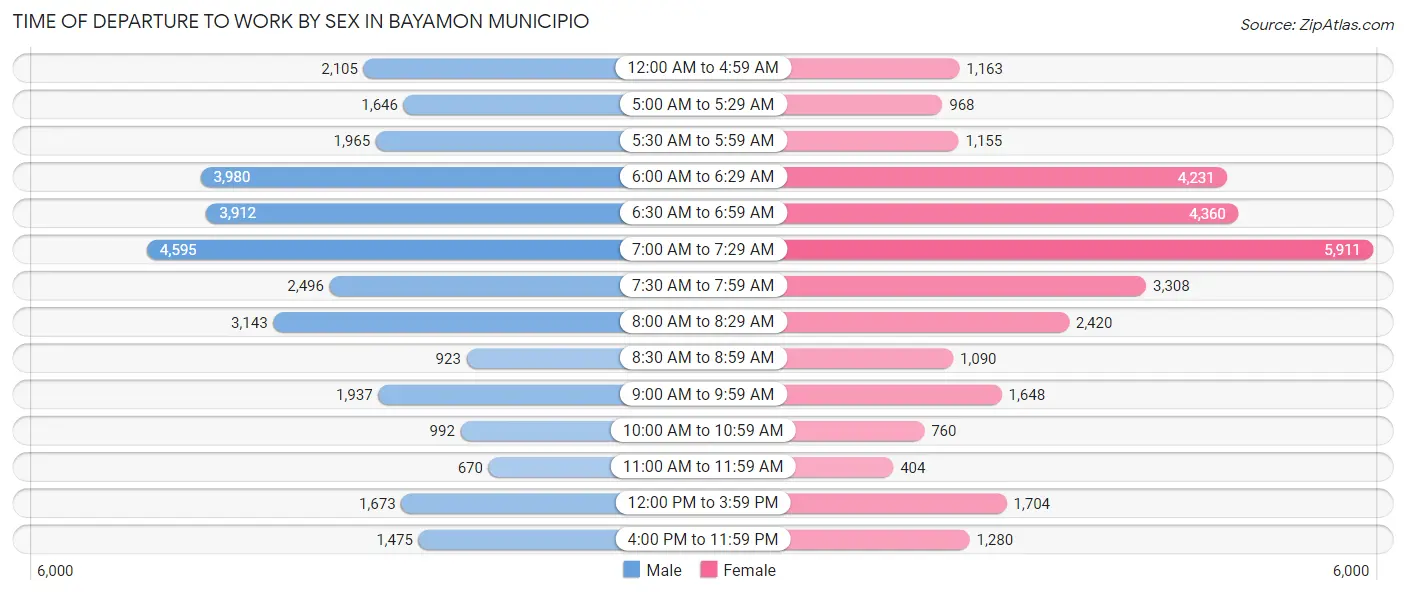
| Time of Departure | Male | Female |
| 12:00 AM to 4:59 AM | 2,105 (6.7%) | 1,163 (3.8%) |
| 5:00 AM to 5:29 AM | 1,646 (5.2%) | 968 (3.2%) |
| 5:30 AM to 5:59 AM | 1,965 (6.2%) | 1,155 (3.8%) |
| 6:00 AM to 6:29 AM | 3,980 (12.6%) | 4,231 (13.9%) |
| 6:30 AM to 6:59 AM | 3,912 (12.4%) | 4,360 (14.3%) |
| 7:00 AM to 7:29 AM | 4,595 (14.6%) | 5,911 (19.4%) |
| 7:30 AM to 7:59 AM | 2,496 (7.9%) | 3,308 (10.9%) |
| 8:00 AM to 8:29 AM | 3,143 (10.0%) | 2,420 (8.0%) |
| 8:30 AM to 8:59 AM | 923 (2.9%) | 1,090 (3.6%) |
| 9:00 AM to 9:59 AM | 1,937 (6.1%) | 1,648 (5.4%) |
| 10:00 AM to 10:59 AM | 992 (3.2%) | 760 (2.5%) |
| 11:00 AM to 11:59 AM | 670 (2.1%) | 404 (1.3%) |
| 12:00 PM to 3:59 PM | 1,673 (5.3%) | 1,704 (5.6%) |
| 4:00 PM to 11:59 PM | 1,475 (4.7%) | 1,280 (4.2%) |
| Total | 31,512 (100.0%) | 30,402 (100.0%) |
Housing Occupancy in Bayamon Municipio
Occupancy by Ownership in Bayamon Municipio
Of the total 69,043 dwellings in Bayamon Municipio, owner-occupied units account for 47,833 (69.3%), while renter-occupied units make up 21,210 (30.7%).
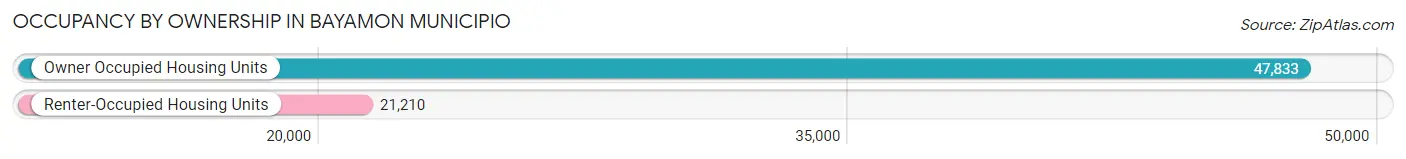
| Occupancy | # Housing Units | % Housing Units |
| Owner Occupied Housing Units | 47,833 | 69.3% |
| Renter-Occupied Housing Units | 21,210 | 30.7% |
| Total Occupied Housing Units | 69,043 | 100.0% |
Occupancy by Household Size in Bayamon Municipio
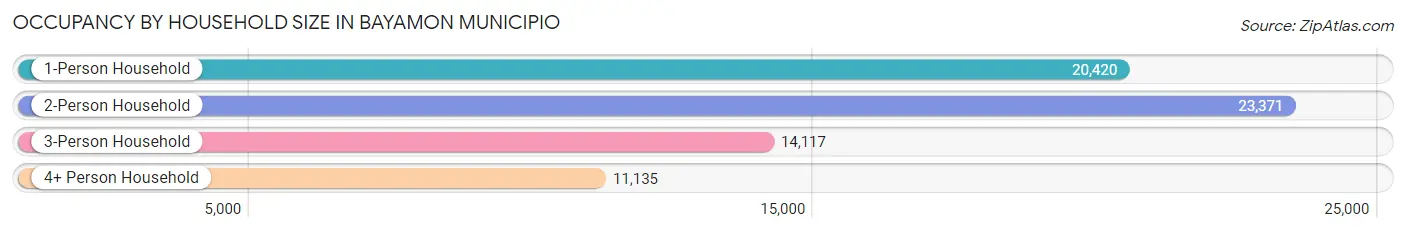
| Household Size | # Housing Units | % Housing Units |
| 1-Person Household | 20,420 | 29.6% |
| 2-Person Household | 23,371 | 33.9% |
| 3-Person Household | 14,117 | 20.4% |
| 4+ Person Household | 11,135 | 16.1% |
| Total Housing Units | 69,043 | 100.0% |
Occupancy by Ownership by Household Size in Bayamon Municipio
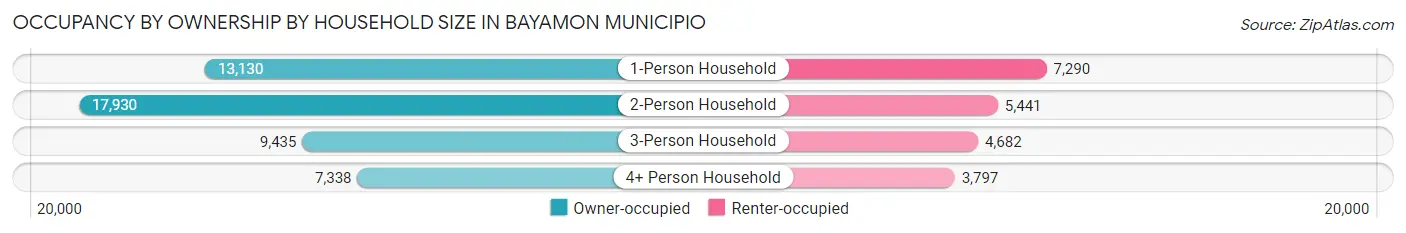
| Household Size | Owner-occupied | Renter-occupied |
| 1-Person Household | 13,130 (64.3%) | 7,290 (35.7%) |
| 2-Person Household | 17,930 (76.7%) | 5,441 (23.3%) |
| 3-Person Household | 9,435 (66.8%) | 4,682 (33.2%) |
| 4+ Person Household | 7,338 (65.9%) | 3,797 (34.1%) |
| Total Housing Units | 47,833 (69.3%) | 21,210 (30.7%) |
Occupancy by Educational Attainment in Bayamon Municipio
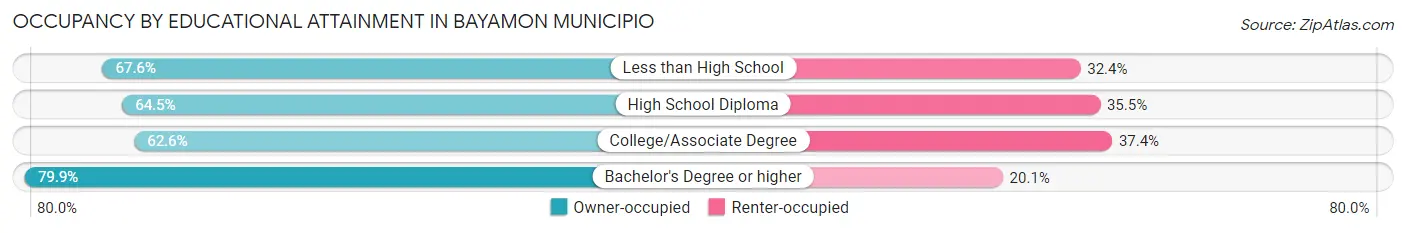
| Household Size | Owner-occupied | Renter-occupied |
| Less than High School | 7,746 (67.6%) | 3,710 (32.4%) |
| High School Diploma | 9,651 (64.5%) | 5,311 (35.5%) |
| College/Associate Degree | 13,141 (62.6%) | 7,850 (37.4%) |
| Bachelor's Degree or higher | 17,295 (79.9%) | 4,339 (20.1%) |
Occupancy by Age of Householder in Bayamon Municipio
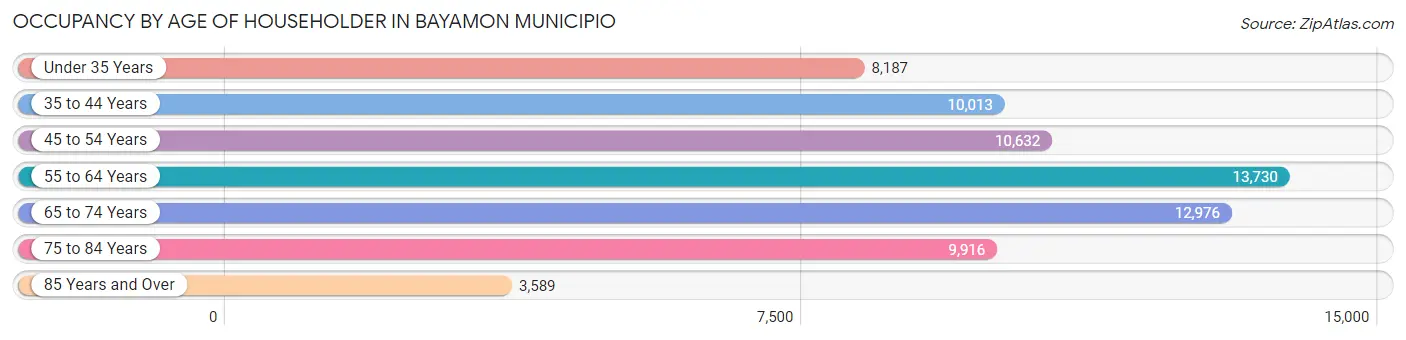
| Age Bracket | # Households | % Households |
| Under 35 Years | 8,187 | 11.9% |
| 35 to 44 Years | 10,013 | 14.5% |
| 45 to 54 Years | 10,632 | 15.4% |
| 55 to 64 Years | 13,730 | 19.9% |
| 65 to 74 Years | 12,976 | 18.8% |
| 75 to 84 Years | 9,916 | 14.4% |
| 85 Years and Over | 3,589 | 5.2% |
| Total | 69,043 | 100.0% |
Housing Finances in Bayamon Municipio
Median Income by Occupancy in Bayamon Municipio
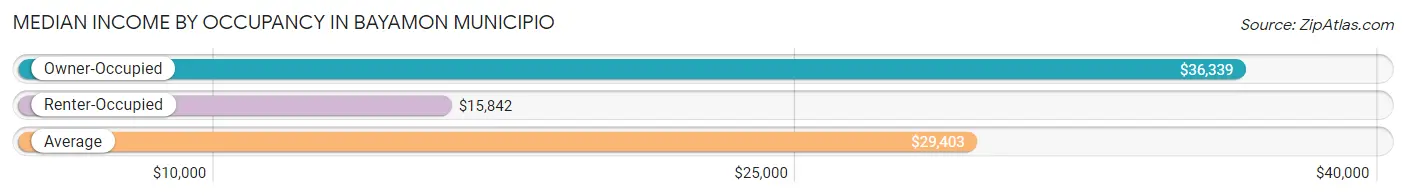
| Occupancy Type | # Households | Median Income |
| Owner-Occupied | 47,833 (69.3%) | $36,339 |
| Renter-Occupied | 21,210 (30.7%) | $15,842 |
| Average | 69,043 (100.0%) | $29,403 |
Occupancy by Householder Income Bracket in Bayamon Municipio
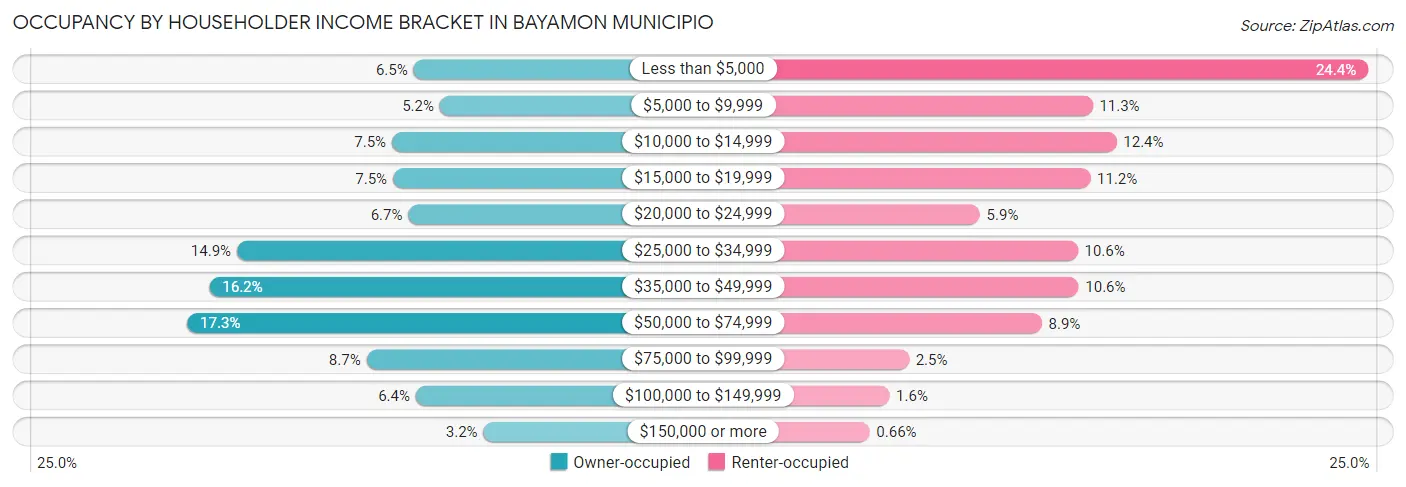
| Income Bracket | Owner-occupied | Renter-occupied |
| Less than $5,000 | 3,100 (6.5%) | 5,176 (24.4%) |
| $5,000 to $9,999 | 2,503 (5.2%) | 2,392 (11.3%) |
| $10,000 to $14,999 | 3,591 (7.5%) | 2,634 (12.4%) |
| $15,000 to $19,999 | 3,570 (7.5%) | 2,369 (11.2%) |
| $20,000 to $24,999 | 3,217 (6.7%) | 1,253 (5.9%) |
| $25,000 to $34,999 | 7,120 (14.9%) | 2,241 (10.6%) |
| $35,000 to $49,999 | 7,750 (16.2%) | 2,251 (10.6%) |
| $50,000 to $74,999 | 8,258 (17.3%) | 1,879 (8.9%) |
| $75,000 to $99,999 | 4,173 (8.7%) | 536 (2.5%) |
| $100,000 to $149,999 | 3,046 (6.4%) | 339 (1.6%) |
| $150,000 or more | 1,505 (3.2%) | 140 (0.7%) |
| Total | 47,833 (100.0%) | 21,210 (100.0%) |
Monthly Housing Cost Tiers in Bayamon Municipio
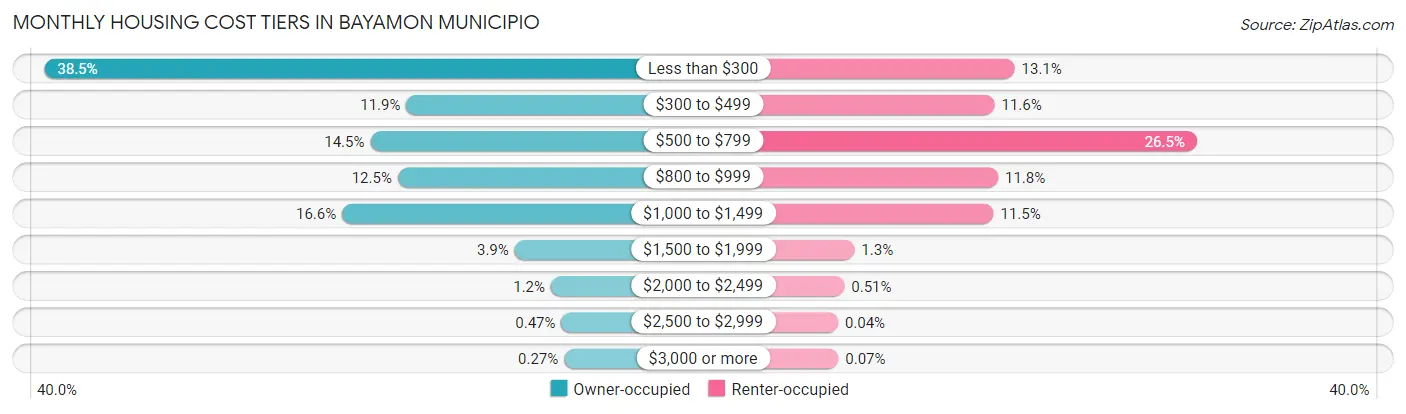
| Monthly Cost | Owner-occupied | Renter-occupied |
| Less than $300 | 18,437 (38.5%) | 2,767 (13.1%) |
| $300 to $499 | 5,687 (11.9%) | 2,454 (11.6%) |
| $500 to $799 | 6,956 (14.5%) | 5,613 (26.5%) |
| $800 to $999 | 5,988 (12.5%) | 2,510 (11.8%) |
| $1,000 to $1,499 | 7,948 (16.6%) | 2,439 (11.5%) |
| $1,500 to $1,999 | 1,869 (3.9%) | 265 (1.3%) |
| $2,000 to $2,499 | 591 (1.2%) | 109 (0.5%) |
| $2,500 to $2,999 | 226 (0.5%) | 8 (0.0%) |
| $3,000 or more | 131 (0.3%) | 15 (0.1%) |
| Total | 47,833 (100.0%) | 21,210 (100.0%) |
Physical Housing Characteristics in Bayamon Municipio
Housing Structures in Bayamon Municipio
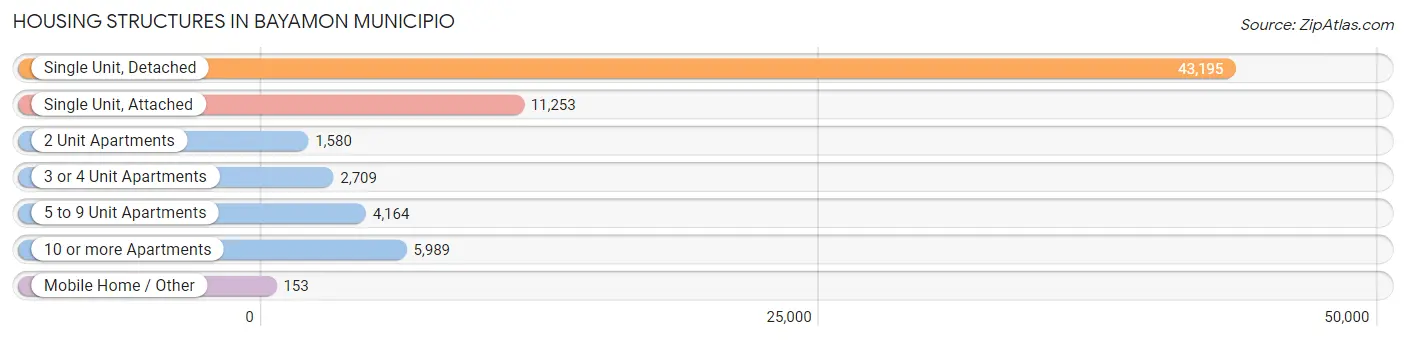
| Structure Type | # Housing Units | % Housing Units |
| Single Unit, Detached | 43,195 | 62.6% |
| Single Unit, Attached | 11,253 | 16.3% |
| 2 Unit Apartments | 1,580 | 2.3% |
| 3 or 4 Unit Apartments | 2,709 | 3.9% |
| 5 to 9 Unit Apartments | 4,164 | 6.0% |
| 10 or more Apartments | 5,989 | 8.7% |
| Mobile Home / Other | 153 | 0.2% |
| Total | 69,043 | 100.0% |
Housing Structures by Occupancy in Bayamon Municipio
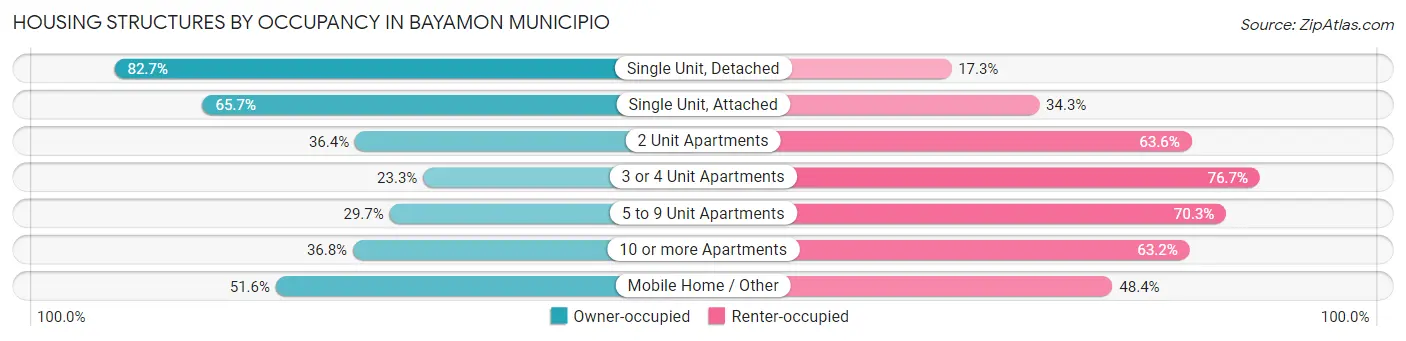
| Structure Type | Owner-occupied | Renter-occupied |
| Single Unit, Detached | 35,711 (82.7%) | 7,484 (17.3%) |
| Single Unit, Attached | 7,397 (65.7%) | 3,856 (34.3%) |
| 2 Unit Apartments | 575 (36.4%) | 1,005 (63.6%) |
| 3 or 4 Unit Apartments | 630 (23.3%) | 2,079 (76.7%) |
| 5 to 9 Unit Apartments | 1,238 (29.7%) | 2,926 (70.3%) |
| 10 or more Apartments | 2,203 (36.8%) | 3,786 (63.2%) |
| Mobile Home / Other | 79 (51.6%) | 74 (48.4%) |
| Total | 47,833 (69.3%) | 21,210 (30.7%) |
Housing Structures by Number of Rooms in Bayamon Municipio
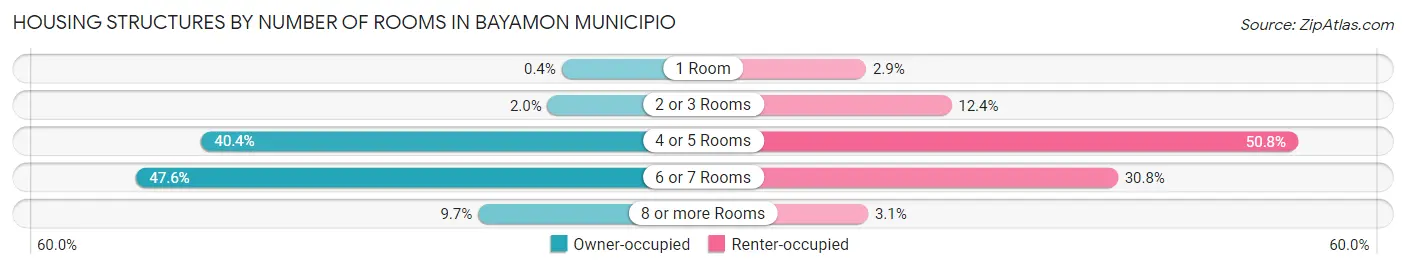
| Number of Rooms | Owner-occupied | Renter-occupied |
| 1 Room | 193 (0.4%) | 613 (2.9%) |
| 2 or 3 Rooms | 936 (2.0%) | 2,621 (12.4%) |
| 4 or 5 Rooms | 19,315 (40.4%) | 10,778 (50.8%) |
| 6 or 7 Rooms | 22,763 (47.6%) | 6,539 (30.8%) |
| 8 or more Rooms | 4,626 (9.7%) | 659 (3.1%) |
| Total | 47,833 (100.0%) | 21,210 (100.0%) |
Housing Structure by Heating Type in Bayamon Municipio
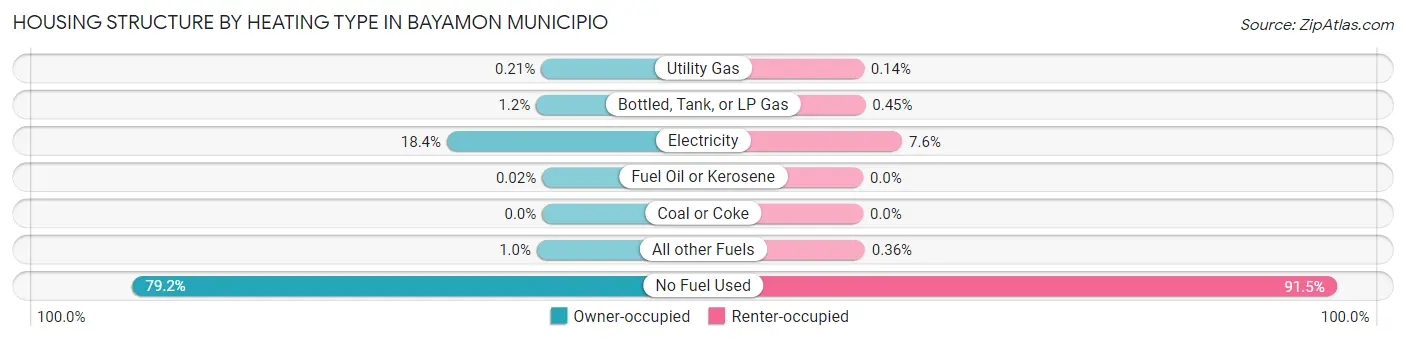
| Heating Type | Owner-occupied | Renter-occupied |
| Utility Gas | 100 (0.2%) | 30 (0.1%) |
| Bottled, Tank, or LP Gas | 560 (1.2%) | 96 (0.4%) |
| Electricity | 8,805 (18.4%) | 1,603 (7.6%) |
| Fuel Oil or Kerosene | 11 (0.0%) | 0 (0.0%) |
| Coal or Coke | 0 (0.0%) | 0 (0.0%) |
| All other Fuels | 494 (1.0%) | 77 (0.4%) |
| No Fuel Used | 37,863 (79.2%) | 19,404 (91.5%) |
| Total | 47,833 (100.0%) | 21,210 (100.0%) |
Household Vehicle Usage in Bayamon Municipio
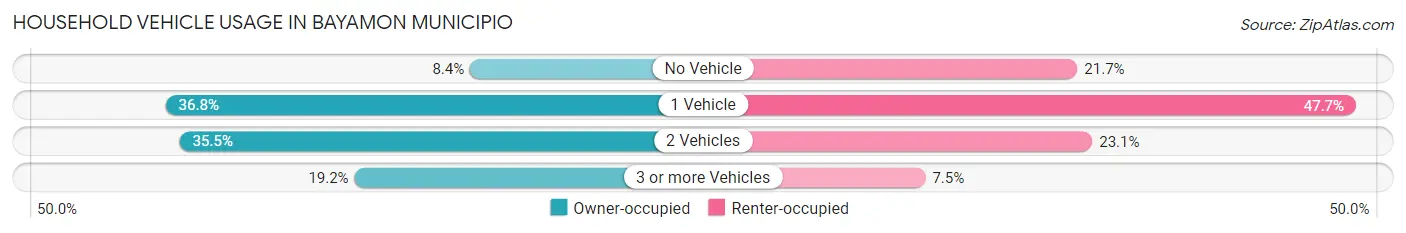
| Vehicles per Household | Owner-occupied | Renter-occupied |
| No Vehicle | 4,029 (8.4%) | 4,602 (21.7%) |
| 1 Vehicle | 17,618 (36.8%) | 10,114 (47.7%) |
| 2 Vehicles | 16,999 (35.5%) | 4,898 (23.1%) |
| 3 or more Vehicles | 9,187 (19.2%) | 1,596 (7.5%) |
| Total | 47,833 (100.0%) | 21,210 (100.0%) |
Real Estate & Mortgages in Bayamon Municipio
Real Estate and Mortgage Overview in Bayamon Municipio
| Characteristic | Without Mortgage | With Mortgage |
| Housing Units | 25,197 | 22,636 |
| Median Property Value | $132,100 | $145,800 |
| Median Household Income | $27,089 | $986 |
| Monthly Housing Costs | $204 | $110 |
| Real Estate Taxes | $568 | $19,706 |
Property Value by Mortgage Status in Bayamon Municipio
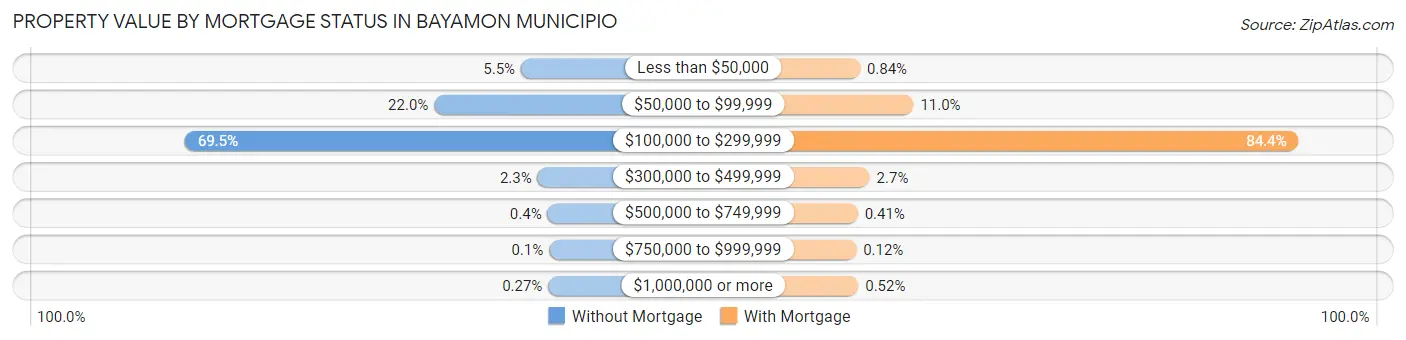
| Property Value | Without Mortgage | With Mortgage |
| Less than $50,000 | 1,377 (5.5%) | 191 (0.8%) |
| $50,000 to $99,999 | 5,540 (22.0%) | 2,497 (11.0%) |
| $100,000 to $299,999 | 17,507 (69.5%) | 19,100 (84.4%) |
| $300,000 to $499,999 | 580 (2.3%) | 610 (2.7%) |
| $500,000 to $749,999 | 100 (0.4%) | 92 (0.4%) |
| $750,000 to $999,999 | 25 (0.1%) | 28 (0.1%) |
| $1,000,000 or more | 68 (0.3%) | 118 (0.5%) |
| Total | 25,197 (100.0%) | 22,636 (100.0%) |
Household Income by Mortgage Status in Bayamon Municipio
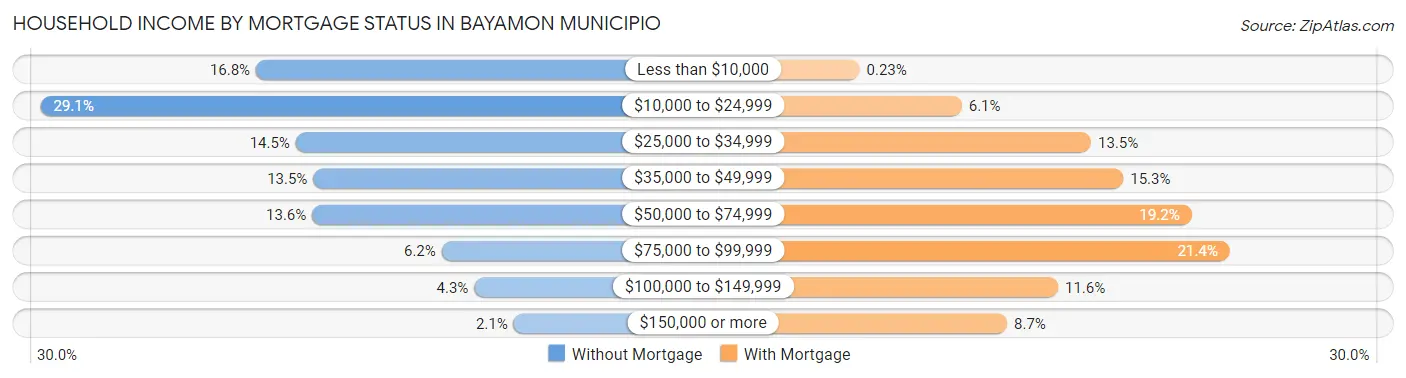
| Household Income | Without Mortgage | With Mortgage |
| Less than $10,000 | 4,229 (16.8%) | 51 (0.2%) |
| $10,000 to $24,999 | 7,331 (29.1%) | 1,374 (6.1%) |
| $25,000 to $34,999 | 3,656 (14.5%) | 3,047 (13.5%) |
| $35,000 to $49,999 | 3,403 (13.5%) | 3,464 (15.3%) |
| $50,000 to $74,999 | 3,418 (13.6%) | 4,347 (19.2%) |
| $75,000 to $99,999 | 1,555 (6.2%) | 4,840 (21.4%) |
| $100,000 to $149,999 | 1,086 (4.3%) | 2,618 (11.6%) |
| $150,000 or more | 519 (2.1%) | 1,960 (8.7%) |
| Total | 25,197 (100.0%) | 22,636 (100.0%) |
Property Value to Household Income Ratio in Bayamon Municipio
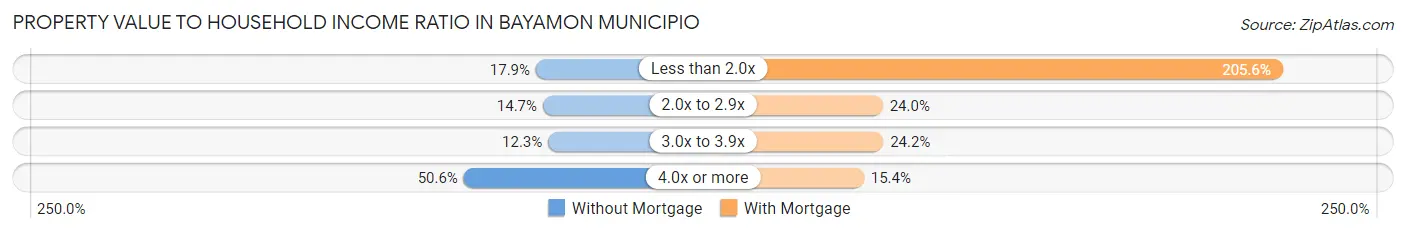
| Value-to-Income Ratio | Without Mortgage | With Mortgage |
| Less than 2.0x | 4,502 (17.9%) | 46,536 (205.6%) |
| 2.0x to 2.9x | 3,702 (14.7%) | 5,426 (24.0%) |
| 3.0x to 3.9x | 3,099 (12.3%) | 5,475 (24.2%) |
| 4.0x or more | 12,756 (50.6%) | 3,479 (15.4%) |
| Total | 25,197 (100.0%) | 22,636 (100.0%) |
Real Estate Taxes by Mortgage Status in Bayamon Municipio
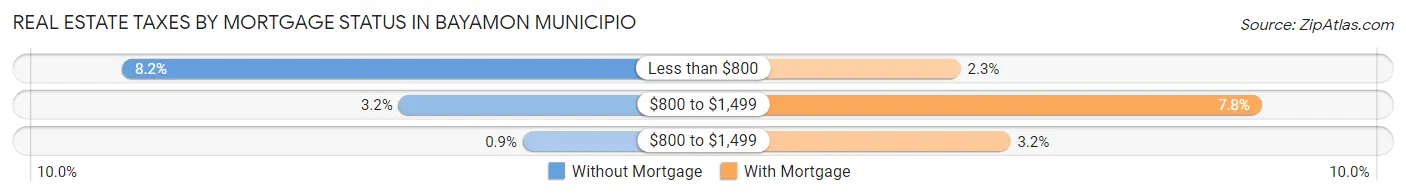
| Property Taxes | Without Mortgage | With Mortgage |
| Less than $800 | 2,070 (8.2%) | 528 (2.3%) |
| $800 to $1,499 | 800 (3.2%) | 1,772 (7.8%) |
| $800 to $1,499 | 226 (0.9%) | 733 (3.2%) |
| Total | 25,197 (100.0%) | 22,636 (100.0%) |
Health & Disability in Bayamon Municipio
Health Insurance Coverage by Age in Bayamon Municipio
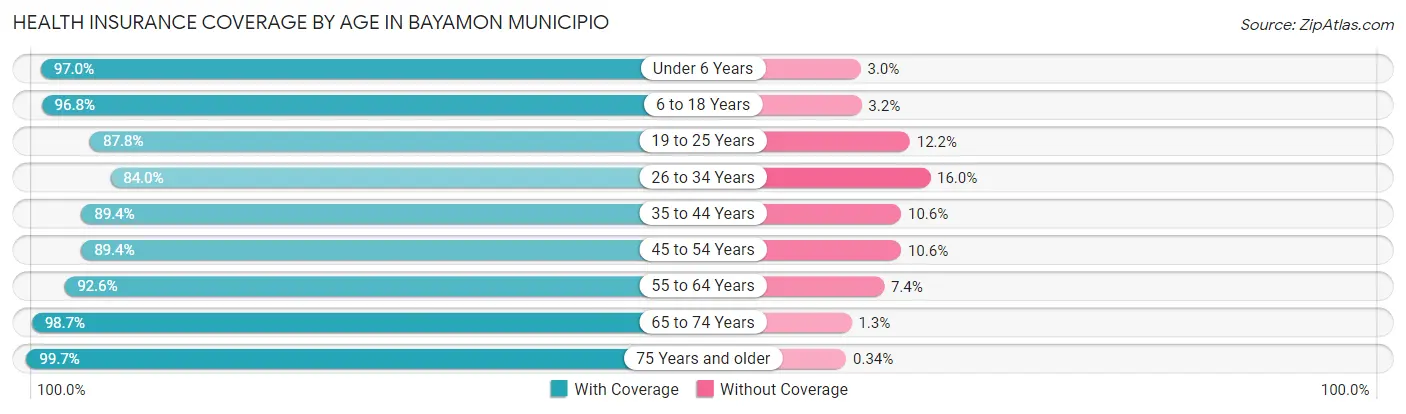
| Age Bracket | With Coverage | Without Coverage |
| Under 6 Years | 7,878 (97.0%) | 246 (3.0%) |
| 6 to 18 Years | 23,591 (96.8%) | 778 (3.2%) |
| 19 to 25 Years | 15,424 (87.8%) | 2,146 (12.2%) |
| 26 to 34 Years | 17,698 (84.0%) | 3,369 (16.0%) |
| 35 to 44 Years | 18,567 (89.4%) | 2,199 (10.6%) |
| 45 to 54 Years | 18,922 (89.4%) | 2,236 (10.6%) |
| 55 to 64 Years | 22,578 (92.6%) | 1,805 (7.4%) |
| 65 to 74 Years | 20,254 (98.7%) | 273 (1.3%) |
| 75 Years and older | 21,273 (99.7%) | 73 (0.3%) |
| Total | 166,185 (92.7%) | 13,125 (7.3%) |
Health Insurance Coverage by Citizenship Status in Bayamon Municipio
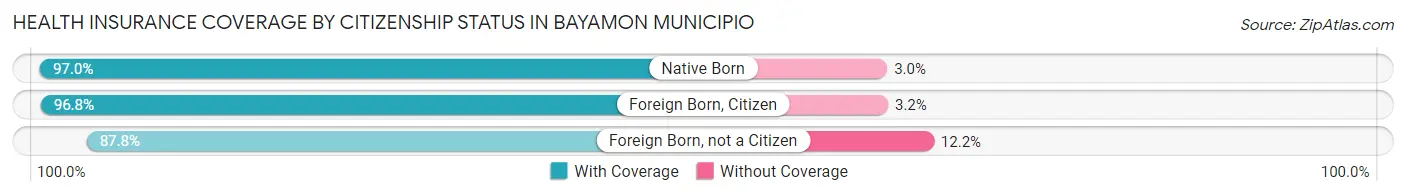
| Citizenship Status | With Coverage | Without Coverage |
| Native Born | 7,878 (97.0%) | 246 (3.0%) |
| Foreign Born, Citizen | 23,591 (96.8%) | 778 (3.2%) |
| Foreign Born, not a Citizen | 15,424 (87.8%) | 2,146 (12.2%) |
Health Insurance Coverage by Household Income in Bayamon Municipio
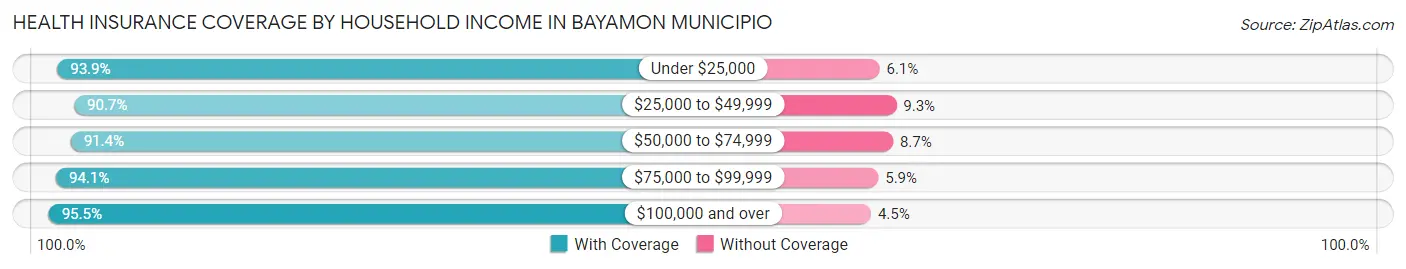
| Household Income | With Coverage | Without Coverage |
| Under $25,000 | 57,227 (93.9%) | 3,737 (6.1%) |
| $25,000 to $49,999 | 47,332 (90.7%) | 4,844 (9.3%) |
| $50,000 to $74,999 | 29,254 (91.3%) | 2,771 (8.6%) |
| $75,000 to $99,999 | 15,447 (94.1%) | 968 (5.9%) |
| $100,000 and over | 16,138 (95.5%) | 766 (4.5%) |
Public vs Private Health Insurance Coverage by Age in Bayamon Municipio
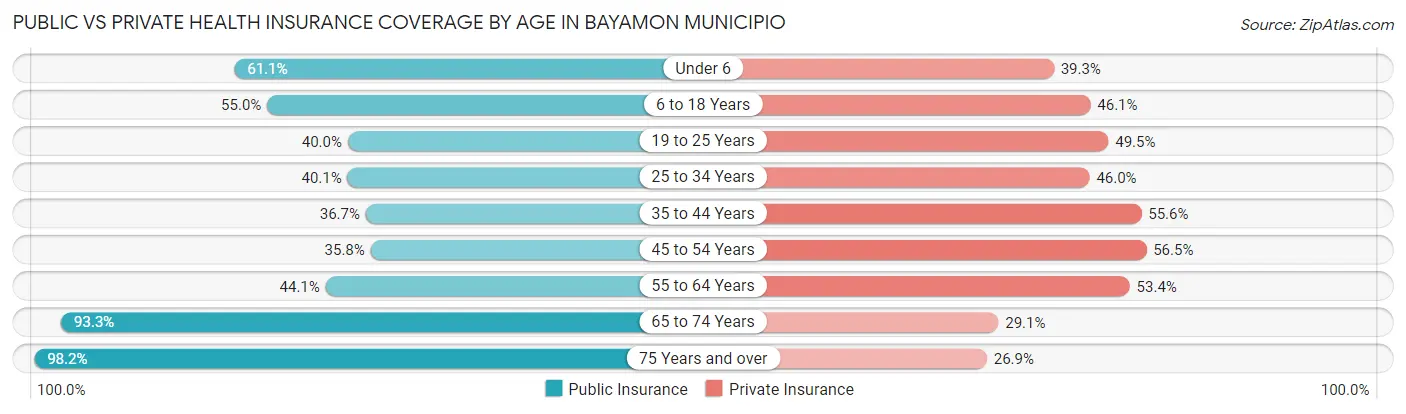
| Age Bracket | Public Insurance | Private Insurance |
| Under 6 | 4,961 (61.1%) | 3,195 (39.3%) |
| 6 to 18 Years | 13,397 (55.0%) | 11,243 (46.1%) |
| 19 to 25 Years | 7,029 (40.0%) | 8,692 (49.5%) |
| 25 to 34 Years | 8,439 (40.1%) | 9,685 (46.0%) |
| 35 to 44 Years | 7,615 (36.7%) | 11,543 (55.6%) |
| 45 to 54 Years | 7,570 (35.8%) | 11,956 (56.5%) |
| 55 to 64 Years | 10,760 (44.1%) | 13,027 (53.4%) |
| 65 to 74 Years | 19,141 (93.2%) | 5,963 (29.0%) |
| 75 Years and over | 20,963 (98.2%) | 5,746 (26.9%) |
| Total | 99,875 (55.7%) | 81,050 (45.2%) |
Disability Status by Sex by Age in Bayamon Municipio
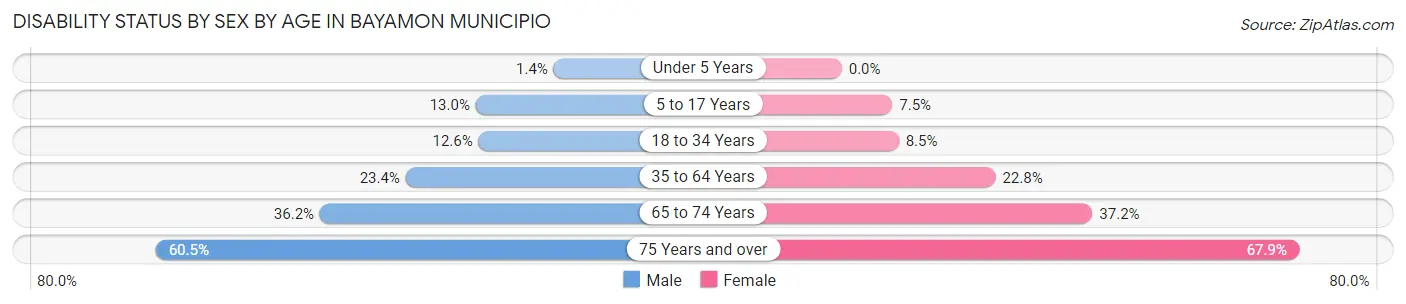
| Age Bracket | Male | Female |
| Under 5 Years | 48 (1.4%) | 0 (0.0%) |
| 5 to 17 Years | 1,571 (13.0%) | 862 (7.5%) |
| 18 to 34 Years | 2,606 (12.6%) | 1,721 (8.5%) |
| 35 to 64 Years | 6,799 (23.4%) | 8,503 (22.8%) |
| 65 to 74 Years | 3,093 (36.1%) | 4,454 (37.2%) |
| 75 Years and over | 5,122 (60.5%) | 8,740 (67.8%) |
Disability Class by Sex by Age in Bayamon Municipio
Disability Class: Hearing Difficulty
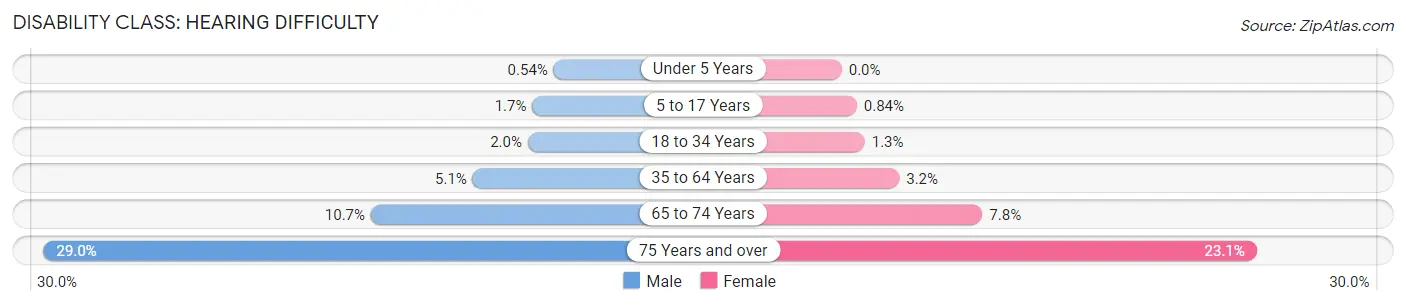
| Age Bracket | Male | Female |
| Under 5 Years | 18 (0.5%) | 0 (0.0%) |
| 5 to 17 Years | 209 (1.7%) | 97 (0.8%) |
| 18 to 34 Years | 410 (2.0%) | 261 (1.3%) |
| 35 to 64 Years | 1,467 (5.1%) | 1,193 (3.2%) |
| 65 to 74 Years | 917 (10.7%) | 937 (7.8%) |
| 75 Years and over | 2,450 (28.9%) | 2,976 (23.1%) |
Disability Class: Vision Difficulty
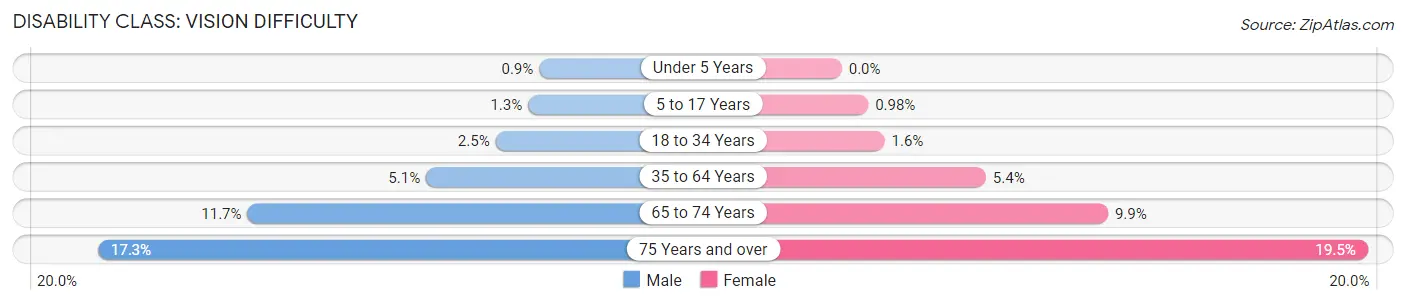
| Age Bracket | Male | Female |
| Under 5 Years | 30 (0.9%) | 0 (0.0%) |
| 5 to 17 Years | 158 (1.3%) | 113 (1.0%) |
| 18 to 34 Years | 522 (2.5%) | 325 (1.6%) |
| 35 to 64 Years | 1,482 (5.1%) | 1,993 (5.3%) |
| 65 to 74 Years | 1,004 (11.7%) | 1,183 (9.9%) |
| 75 Years and over | 1,463 (17.3%) | 2,514 (19.5%) |
Disability Class: Cognitive Difficulty
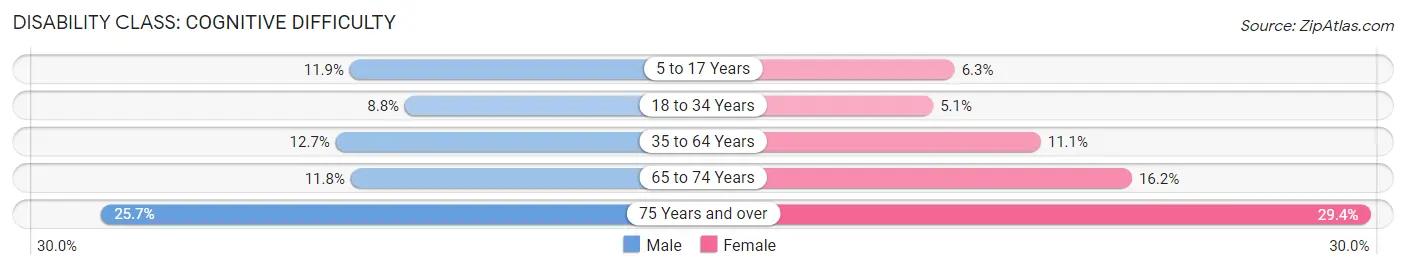
| Age Bracket | Male | Female |
| 5 to 17 Years | 1,435 (11.9%) | 723 (6.3%) |
| 18 to 34 Years | 1,826 (8.8%) | 1,038 (5.1%) |
| 35 to 64 Years | 3,684 (12.7%) | 4,129 (11.1%) |
| 65 to 74 Years | 1,013 (11.8%) | 1,934 (16.2%) |
| 75 Years and over | 2,178 (25.7%) | 3,790 (29.4%) |
Disability Class: Ambulatory Difficulty
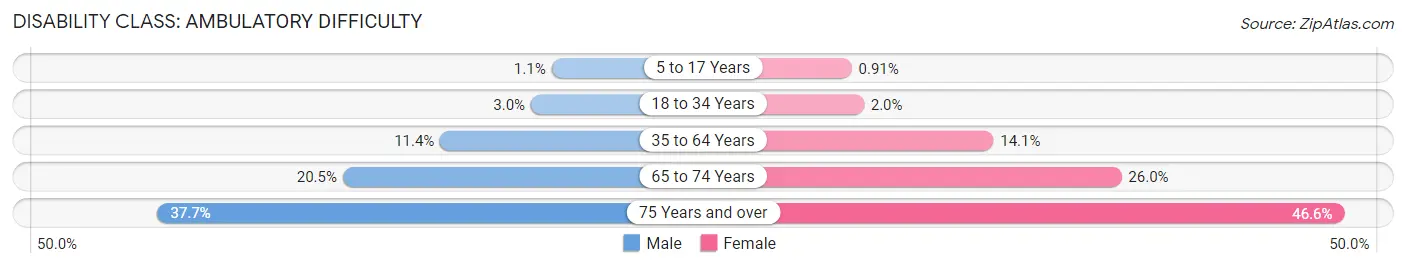
| Age Bracket | Male | Female |
| 5 to 17 Years | 133 (1.1%) | 105 (0.9%) |
| 18 to 34 Years | 624 (3.0%) | 416 (2.0%) |
| 35 to 64 Years | 3,319 (11.4%) | 5,239 (14.1%) |
| 65 to 74 Years | 1,751 (20.5%) | 3,107 (26.0%) |
| 75 Years and over | 3,188 (37.7%) | 6,008 (46.6%) |
Disability Class: Self-Care Difficulty
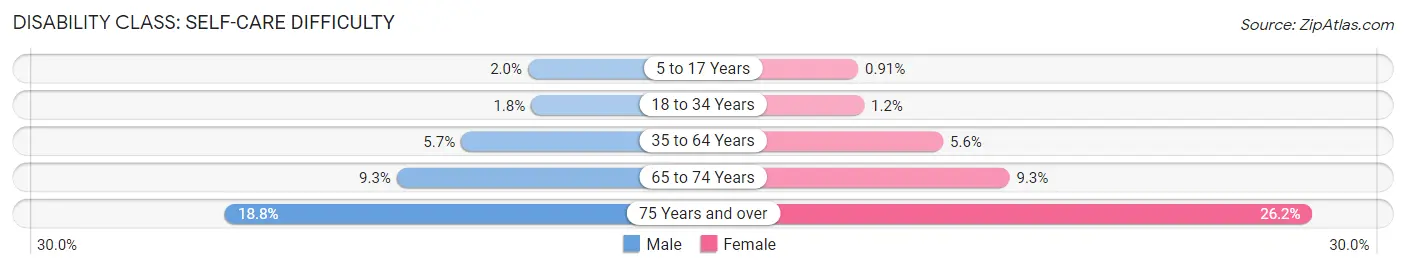
| Age Bracket | Male | Female |
| 5 to 17 Years | 239 (2.0%) | 104 (0.9%) |
| 18 to 34 Years | 373 (1.8%) | 253 (1.2%) |
| 35 to 64 Years | 1,656 (5.7%) | 2,103 (5.6%) |
| 65 to 74 Years | 794 (9.3%) | 1,118 (9.3%) |
| 75 Years and over | 1,594 (18.8%) | 3,375 (26.2%) |
Technology Access in Bayamon Municipio
Computing Device Access in Bayamon Municipio
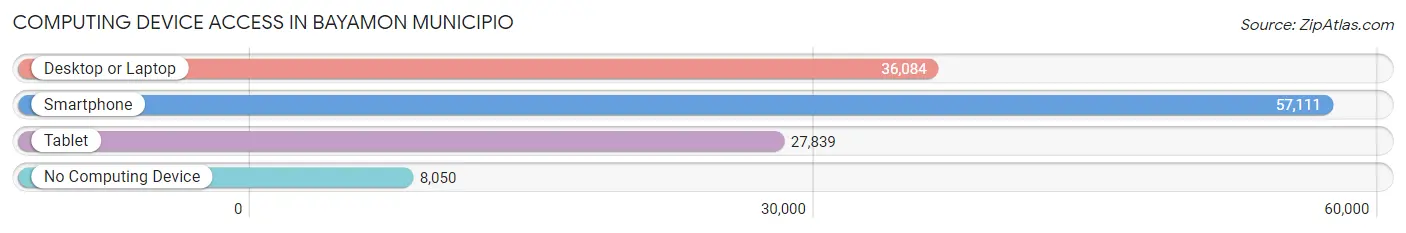
| Device Type | # Households | % Households |
| Desktop or Laptop | 36,084 | 52.3% |
| Smartphone | 57,111 | 82.7% |
| Tablet | 27,839 | 40.3% |
| No Computing Device | 8,050 | 11.7% |
| Total | 69,043 | 100.0% |
Internet Access in Bayamon Municipio
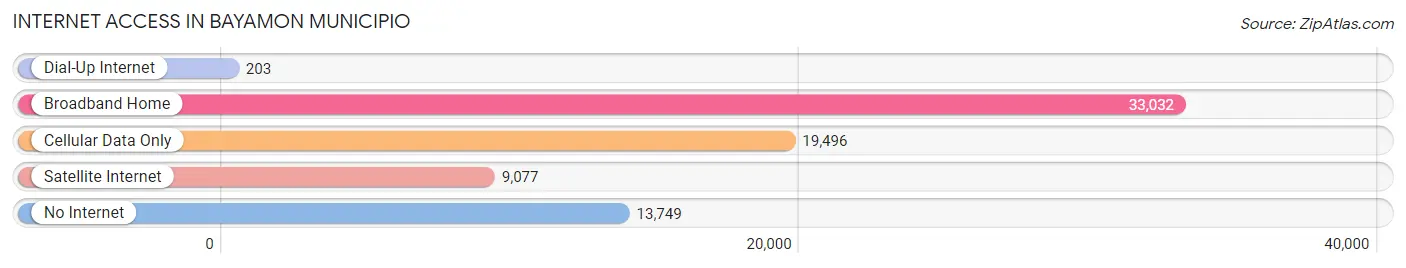
| Internet Type | # Households | % Households |
| Dial-Up Internet | 203 | 0.3% |
| Broadband Home | 33,032 | 47.8% |
| Cellular Data Only | 19,496 | 28.2% |
| Satellite Internet | 9,077 | 13.2% |
| No Internet | 13,749 | 19.9% |
| Total | 69,043 | 100.0% |
Bayamon Municipio Summary
Bayamon Municipio, Puerto Rico is a municipality located in the northern part of the island of Puerto Rico. It is part of the San Juan-Caguas-Guaynabo Metropolitan Statistical Area. As of the 2010 census, the municipality had a population of 209,433, making it the second most populous municipality in Puerto Rico.
History
The area of Bayamon was originally inhabited by the Taíno Indians, who called the area “Bayamón”, which means “place of many fish”. The area was later colonized by the Spanish in the 16th century. During the 19th century, the area was part of the municipality of San Juan. In 1841, the area was separated from San Juan and became its own municipality.
Geography
Bayamon is located in the northern part of Puerto Rico, about 10 miles west of San Juan. It is bordered by the municipalities of Toa Baja, Toa Alta, Naranjito, and Comerio. The municipality covers an area of approximately 40 square miles and is located at an elevation of about 500 feet above sea level. The terrain is mostly flat, with some hills in the western part of the municipality. The climate is tropical, with temperatures ranging from the mid-70s to the mid-80s.
Economy
The economy of Bayamon is largely based on manufacturing and services. The municipality is home to several large manufacturing companies, including pharmaceuticals, electronics, and food processing. The municipality also has a large retail sector, with several shopping malls and retail stores. The municipality is also home to several universities and colleges, including the University of Puerto Rico at Bayamon.
Demographics
As of the 2010 census, the population of Bayamon was 209,433, making it the second most populous municipality in Puerto Rico. The population is largely of Hispanic or Latino origin, with about 95% of the population identifying as such. The median household income in the municipality is about $20,000, and the median age is about 33 years. The unemployment rate in the municipality is about 11%, which is slightly higher than the national average.
Conclusion
Bayamon Municipio, Puerto Rico is a municipality located in the northern part of the island of Puerto Rico. It is part of the San Juan-Caguas-Guaynabo Metropolitan Statistical Area and has a population of 209,433, making it the second most populous municipality in Puerto Rico. The economy of Bayamon is largely based on manufacturing and services, and the population is largely of Hispanic or Latino origin. The median household income in the municipality is about $20,000, and the unemployment rate is about 11%.
Common Questions
What is Per Capita Income in Bayamon Municipio?
Per Capita income in Bayamon Municipio is $16,905.
What is the Median Family Income in Bayamon Municipio?
Median Family Income in Bayamon Municipio is $36,180.
What is the Median Household income in Bayamon Municipio?
Median Household Income in Bayamon Municipio is $29,403.
What is Income or Wage Gap in Bayamon Municipio?
Income or Wage Gap in Bayamon Municipio is 5.2%.
Women in Bayamon Municipio earn 94.8 cents for every dollar earned by a man.
What is Family Income Deficit in Bayamon Municipio?
Family Income Deficit in Bayamon Municipio is $11,424.
Families that are below poverty line in Bayamon Municipio earn $11,424 less on average than the poverty threshold level.
What is Inequality or Gini Index in Bayamon Municipio?
Inequality or Gini Index in Bayamon Municipio is 0.50.
What is the Total Population of Bayamon Municipio?
Total Population of Bayamon Municipio is 184,326.
What is the Total Male Population of Bayamon Municipio?
Total Male Population of Bayamon Municipio is 86,344.
What is the Total Female Population of Bayamon Municipio?
Total Female Population of Bayamon Municipio is 97,982.
What is the Ratio of Males per 100 Females in Bayamon Municipio?
There are 88.12 Males per 100 Females in Bayamon Municipio.
What is the Ratio of Females per 100 Males in Bayamon Municipio?
There are 113.48 Females per 100 Males in Bayamon Municipio.
What is the Median Population Age in Bayamon Municipio?
Median Population Age in Bayamon Municipio is 43.7 Years.
What is the Average Family Size in Bayamon Municipio
Average Family Size in Bayamon Municipio is 3.2 People.
What is the Average Household Size in Bayamon Municipio
Average Household Size in Bayamon Municipio is 2.6 People.
How Large is the Labor Force in Bayamon Municipio?
There are 74,405 People in the Labor Forcein in Bayamon Municipio.
What is the Percentage of People in the Labor Force in Bayamon Municipio?
47.0% of People are in the Labor Force in Bayamon Municipio.
What is the Unemployment Rate in Bayamon Municipio?
Unemployment Rate in Bayamon Municipio is 9.9%.