Barceloneta Municipio, PR Map & Demographics
Barceloneta Municipio Map
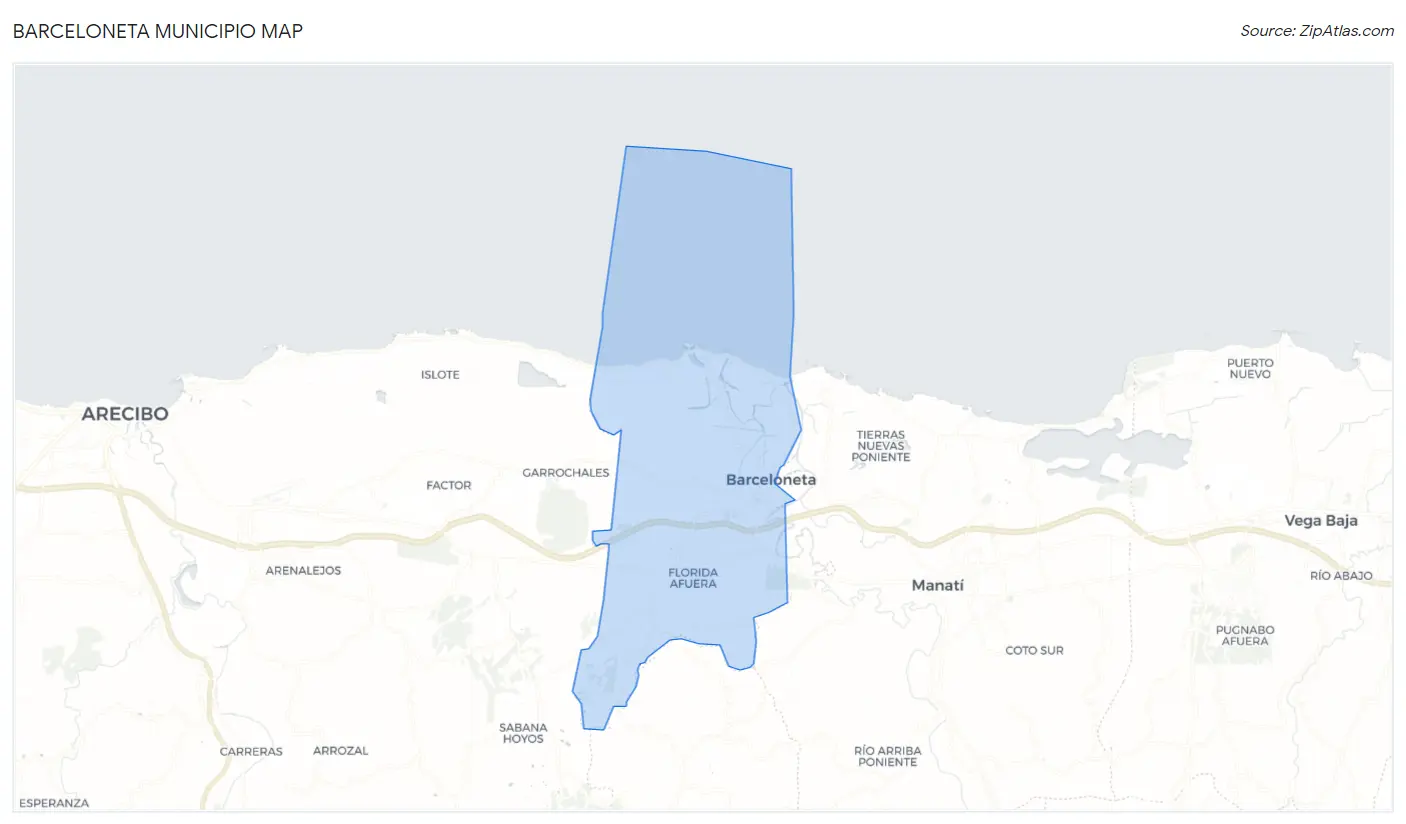
Barceloneta Municipio Overview
$13,368
PER CAPITA INCOME
$22,309
AVG FAMILY INCOME
$20,282
AVG HOUSEHOLD INCOME
0.7%
WAGE / INCOME GAP [ % ]
99.3¢/ $1
WAGE / INCOME GAP [ $ ]
$11,220
FAMILY INCOME DEFICIT
0.50
INEQUALITY / GINI INDEX
22,604
TOTAL POPULATION
10,661
MALE POPULATION
11,943
FEMALE POPULATION
89.27
MALES / 100 FEMALES
112.03
FEMALES / 100 MALES
42.7
MEDIAN AGE
3.2
AVG FAMILY SIZE
2.7
AVG HOUSEHOLD SIZE
8,214
LABOR FORCE [ PEOPLE ]
43.1%
PERCENT IN LABOR FORCE
15.8%
UNEMPLOYMENT RATE
Barceloneta Municipio Area Codes
Income in Barceloneta Municipio
Income Overview in Barceloneta Municipio
Per Capita Income in Barceloneta Municipio is $13,368, while median incomes of families and households are $22,309 and $20,282 respectively.
| Characteristic | Number | Measure |
| Per Capita Income | 22,604 | $13,368 |
| Median Family Income | 5,797 | $22,309 |
| Mean Family Income | 5,797 | $34,753 |
| Median Household Income | 8,254 | $20,282 |
| Mean Household Income | 8,254 | $32,453 |
| Income Deficit | 5,797 | $11,220 |
| Wage / Income Gap (%) | 22,604 | 0.74% |
| Wage / Income Gap ($) | 22,604 | 99.26¢ per $1 |
| Gini / Inequality Index | 22,604 | 0.50 |
Earnings by Sex in Barceloneta Municipio
Average Earnings in Barceloneta Municipio are $19,360, $19,289 for men and $19,433 for women, a difference of 0.7%.
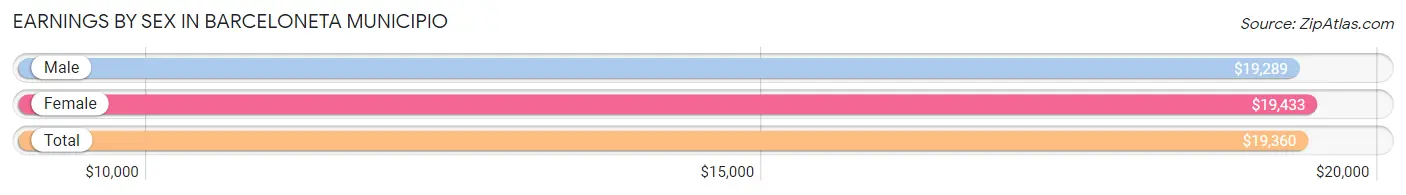
| Sex | Number | Average Earnings |
| Male | 3,597 (47.8%) | $19,289 |
| Female | 3,933 (52.2%) | $19,433 |
| Total | 7,530 (100.0%) | $19,360 |
Earnings by Sex by Income Bracket in Barceloneta Municipio
The most common earnings brackets in Barceloneta Municipio are $17,500 to $19,999 for men (385 | 10.7%) and $17,500 to $19,999 for women (377 | 9.6%).
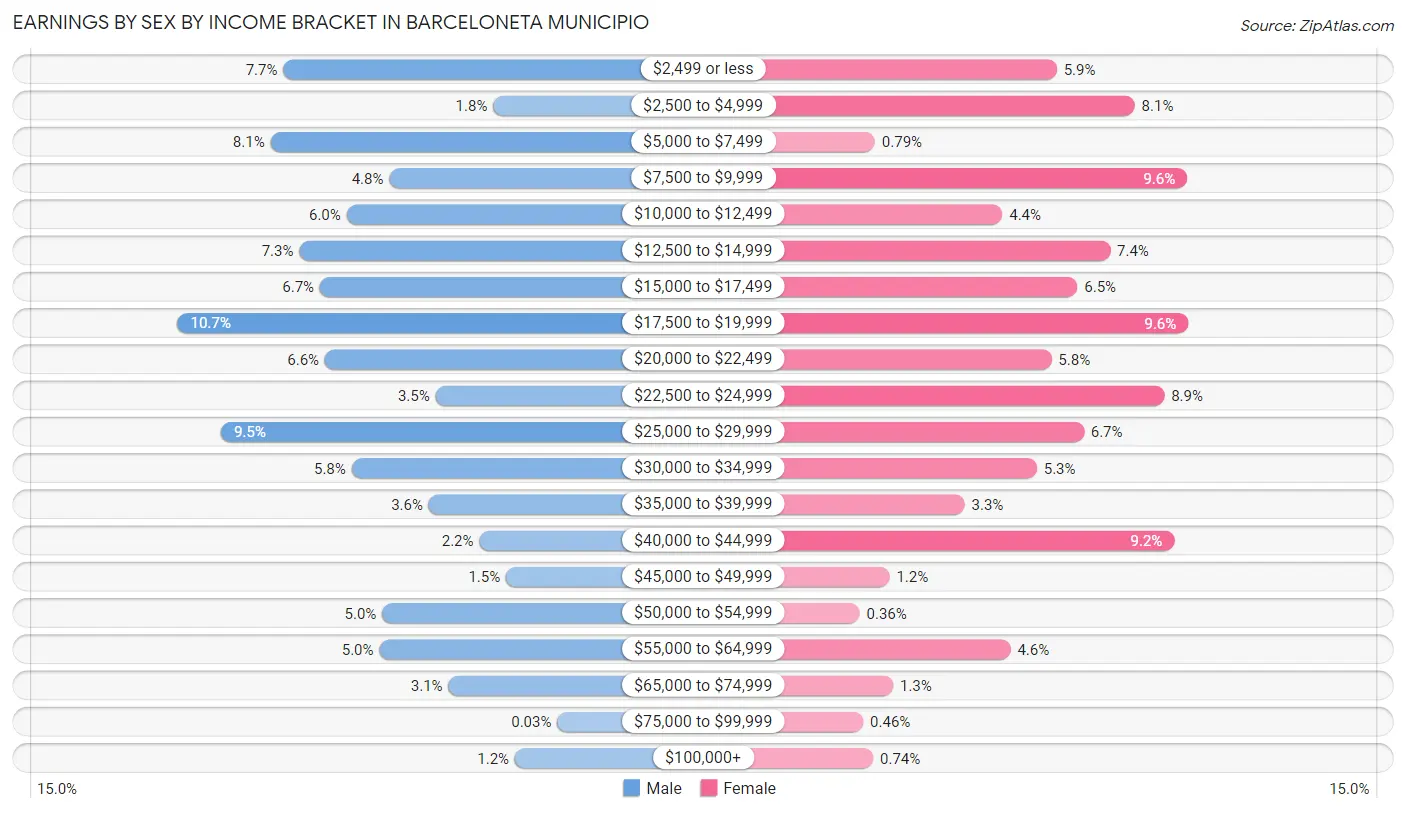
| Income | Male | Female |
| $2,499 or less | 278 (7.7%) | 232 (5.9%) |
| $2,500 to $4,999 | 66 (1.8%) | 318 (8.1%) |
| $5,000 to $7,499 | 291 (8.1%) | 31 (0.8%) |
| $7,500 to $9,999 | 171 (4.8%) | 376 (9.6%) |
| $10,000 to $12,499 | 214 (5.9%) | 172 (4.4%) |
| $12,500 to $14,999 | 262 (7.3%) | 291 (7.4%) |
| $15,000 to $17,499 | 241 (6.7%) | 255 (6.5%) |
| $17,500 to $19,999 | 385 (10.7%) | 377 (9.6%) |
| $20,000 to $22,499 | 236 (6.6%) | 226 (5.8%) |
| $22,500 to $24,999 | 124 (3.5%) | 351 (8.9%) |
| $25,000 to $29,999 | 341 (9.5%) | 262 (6.7%) |
| $30,000 to $34,999 | 209 (5.8%) | 210 (5.3%) |
| $35,000 to $39,999 | 131 (3.6%) | 130 (3.3%) |
| $40,000 to $44,999 | 80 (2.2%) | 362 (9.2%) |
| $45,000 to $49,999 | 53 (1.5%) | 47 (1.2%) |
| $50,000 to $54,999 | 178 (5.0%) | 14 (0.4%) |
| $55,000 to $64,999 | 181 (5.0%) | 181 (4.6%) |
| $65,000 to $74,999 | 111 (3.1%) | 51 (1.3%) |
| $75,000 to $99,999 | 1 (0.0%) | 18 (0.5%) |
| $100,000+ | 44 (1.2%) | 29 (0.7%) |
| Total | 3,597 (100.0%) | 3,933 (100.0%) |
Earnings by Sex by Educational Attainment in Barceloneta Municipio
Average earnings in Barceloneta Municipio are $21,149 for men and $20,990 for women, a difference of 0.7%. Men with an educational attainment of graduate degree enjoy the highest average annual earnings of $51,373, while those with less than high school education earn the least with $10,546. Women with an educational attainment of bachelor's degree earn the most with the average annual earnings of $32,897, while those with high school diploma education have the smallest earnings of $13,226.
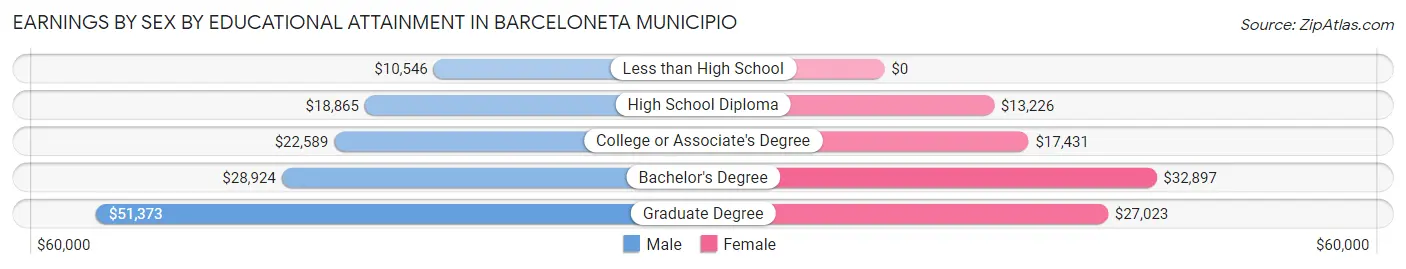
| Educational Attainment | Male Income | Female Income |
| Less than High School | $10,546 | $0 |
| High School Diploma | $18,865 | $13,226 |
| College or Associate's Degree | $22,589 | $17,431 |
| Bachelor's Degree | $28,924 | $32,897 |
| Graduate Degree | $51,373 | $27,023 |
| Total | $21,149 | $20,990 |
Family Income in Barceloneta Municipio
Family Income Brackets in Barceloneta Municipio
According to the Barceloneta Municipio family income data, there are 1,258 families falling into the $15,000 to $24,999 income range, which is the most common income bracket and makes up 21.7% of all families. Conversely, the $200,000+ income bracket is the least frequent group with only 41 families (0.7%) belonging to this category.
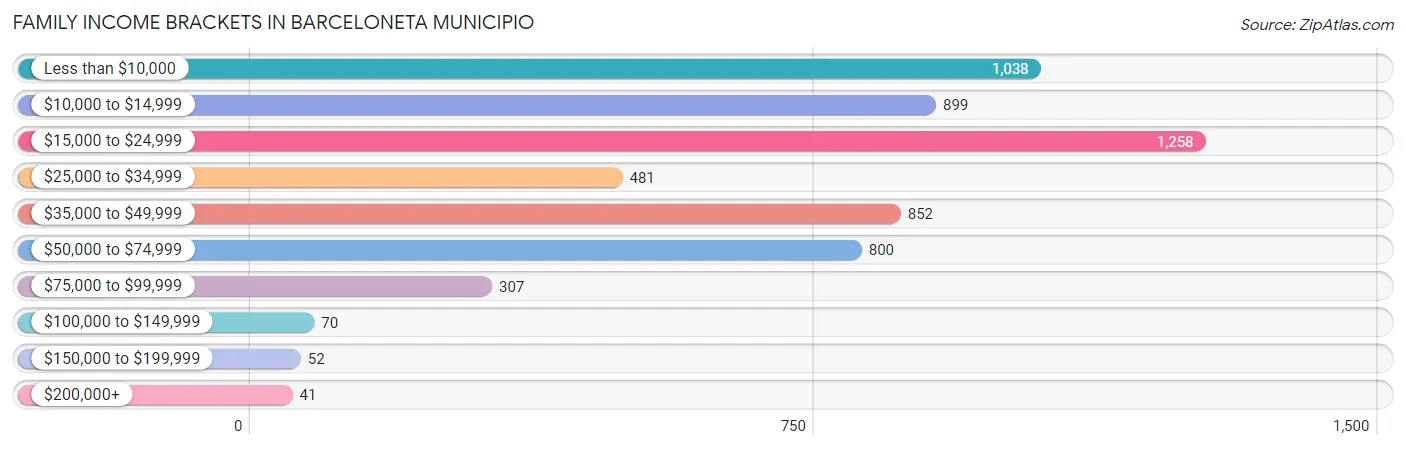
| Income Bracket | # Families | % Families |
| Less than $10,000 | 1,038 | 17.9% |
| $10,000 to $14,999 | 899 | 15.5% |
| $15,000 to $24,999 | 1,258 | 21.7% |
| $25,000 to $34,999 | 481 | 8.3% |
| $35,000 to $49,999 | 852 | 14.7% |
| $50,000 to $74,999 | 800 | 13.8% |
| $75,000 to $99,999 | 307 | 5.3% |
| $100,000 to $149,999 | 70 | 1.2% |
| $150,000 to $199,999 | 52 | 0.9% |
| $200,000+ | 41 | 0.7% |
Family Income by Famaliy Size in Barceloneta Municipio
4-person families (901 | 15.5%) account for the highest median family income in Barceloneta Municipio with $45,433 per family, while 4-person families (901 | 15.5%) have the highest median income of $11,358 per family member.
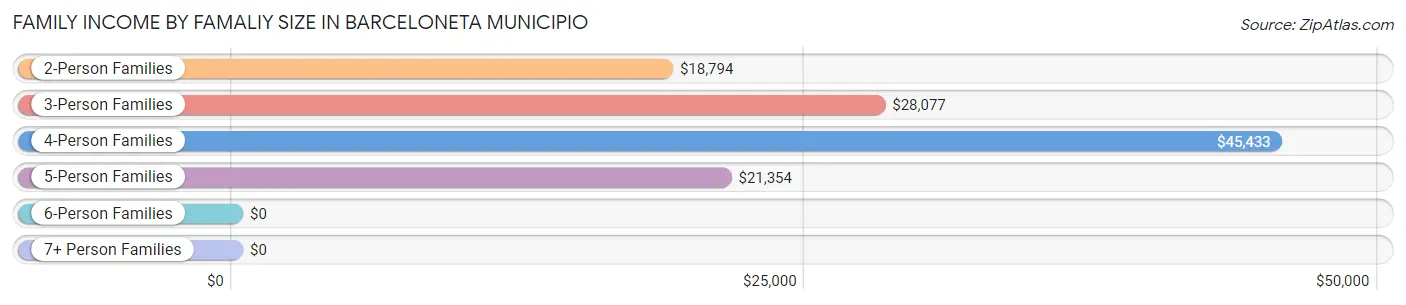
| Income Bracket | # Families | Median Income |
| 2-Person Families | 2,900 (50.0%) | $18,794 |
| 3-Person Families | 1,828 (31.5%) | $28,077 |
| 4-Person Families | 901 (15.5%) | $45,433 |
| 5-Person Families | 136 (2.4%) | $21,354 |
| 6-Person Families | 0 (0.0%) | $0 |
| 7+ Person Families | 32 (0.5%) | $0 |
| Total | 5,797 (100.0%) | $22,309 |
Family Income by Number of Earners in Barceloneta Municipio
The median family income in Barceloneta Municipio is $22,309, with families comprising 3+ earners (130) having the highest median family income of $57,803, while families with no earners (2,408) have the lowest median family income of $14,222, accounting for 2.2% and 41.5% of families, respectively.
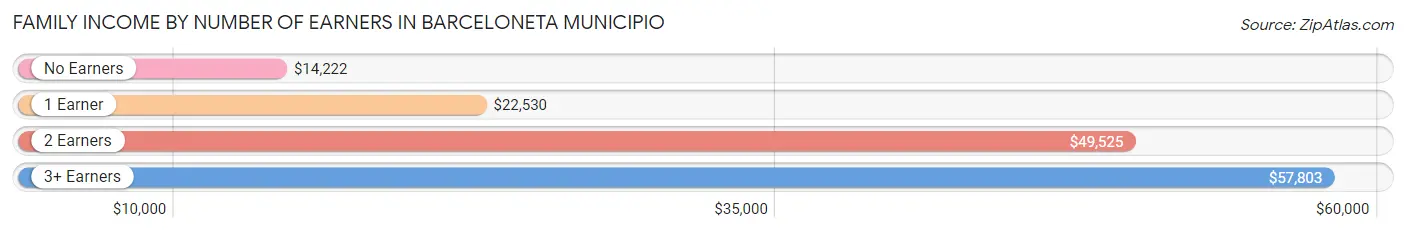
| Number of Earners | # Families | Median Income |
| No Earners | 2,408 (41.5%) | $14,222 |
| 1 Earner | 2,143 (37.0%) | $22,530 |
| 2 Earners | 1,116 (19.3%) | $49,525 |
| 3+ Earners | 130 (2.2%) | $57,803 |
| Total | 5,797 (100.0%) | $22,309 |
Household Income in Barceloneta Municipio
Household Income Brackets in Barceloneta Municipio
With 1,684 households falling in the category, the less than $10,000 income range is the most frequent in Barceloneta Municipio, accounting for 20.4% of all households. In contrast, only 41 households (0.5%) fall into the $200,000+ income bracket, making it the least populous group.
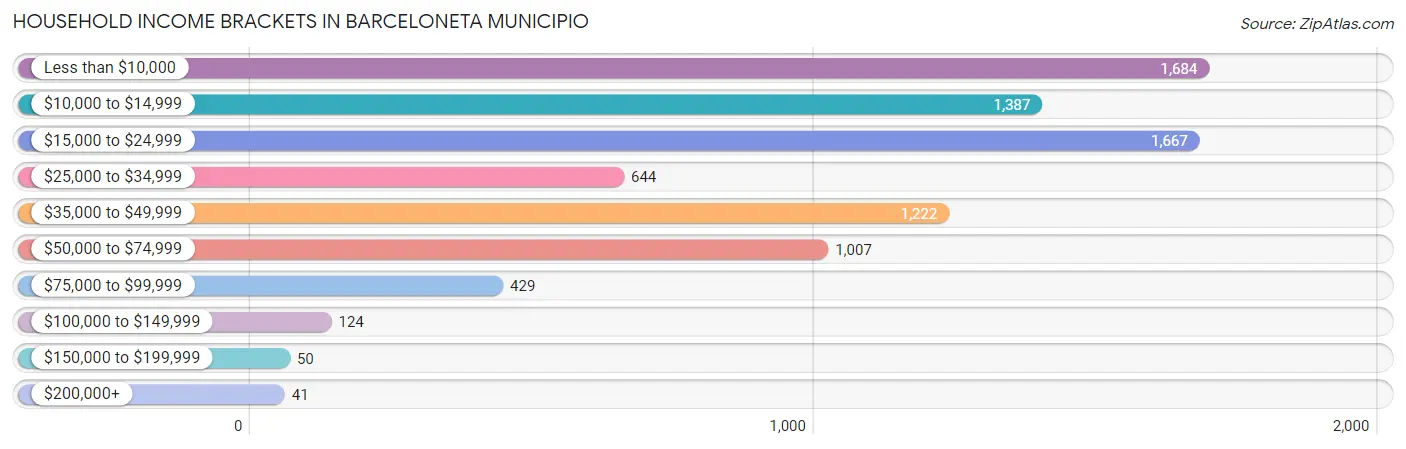
| Income Bracket | # Households | % Households |
| Less than $10,000 | 1,684 | 20.4% |
| $10,000 to $14,999 | 1,387 | 16.8% |
| $15,000 to $24,999 | 1,667 | 20.2% |
| $25,000 to $34,999 | 644 | 7.8% |
| $35,000 to $49,999 | 1,222 | 14.8% |
| $50,000 to $74,999 | 1,007 | 12.2% |
| $75,000 to $99,999 | 429 | 5.2% |
| $100,000 to $149,999 | 124 | 1.5% |
| $150,000 to $199,999 | 50 | 0.6% |
| $200,000+ | 41 | 0.5% |
Household Income by Householder Age in Barceloneta Municipio
The median household income in Barceloneta Municipio is $20,282, with the highest median household income of $24,223 found in the 25 to 44 years age bracket for the primary householder. A total of 2,435 households (29.5%) fall into this category. Meanwhile, the 15 to 24 years age bracket for the primary householder has the lowest median household income of $0, with 55 households (0.7%) in this group.
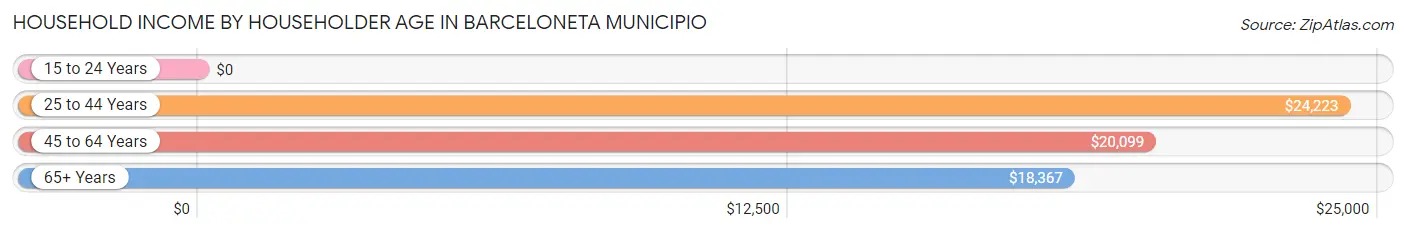
| Income Bracket | # Households | Median Income |
| 15 to 24 Years | 55 (0.7%) | $0 |
| 25 to 44 Years | 2,435 (29.5%) | $24,223 |
| 45 to 64 Years | 2,831 (34.3%) | $20,099 |
| 65+ Years | 2,933 (35.5%) | $18,367 |
| Total | 8,254 (100.0%) | $20,282 |
Poverty in Barceloneta Municipio
Income Below Poverty by Sex and Age in Barceloneta Municipio
With 44.1% poverty level for males and 48.9% for females among the residents of Barceloneta Municipio, 15 year old males and 5 year old females are the most vulnerable to poverty, with 169 males (77.2%) and 100 females (100.0%) in their respective age groups living below the poverty level.
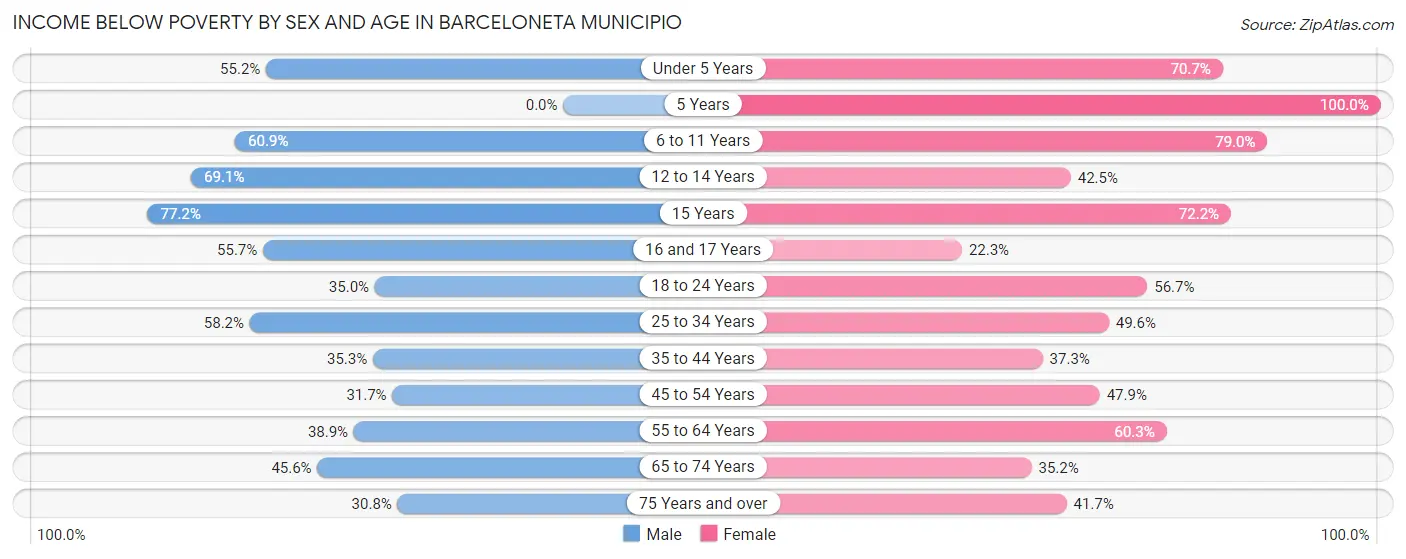
| Age Bracket | Male | Female |
| Under 5 Years | 230 (55.2%) | 287 (70.7%) |
| 5 Years | 0 (0.0%) | 100 (100.0%) |
| 6 to 11 Years | 463 (60.9%) | 417 (79.0%) |
| 12 to 14 Years | 295 (69.1%) | 227 (42.5%) |
| 15 Years | 169 (77.2%) | 91 (72.2%) |
| 16 and 17 Years | 107 (55.7%) | 64 (22.3%) |
| 18 to 24 Years | 368 (35.0%) | 609 (56.7%) |
| 25 to 34 Years | 856 (58.2%) | 844 (49.6%) |
| 35 to 44 Years | 480 (35.3%) | 595 (37.3%) |
| 45 to 54 Years | 451 (31.7%) | 780 (47.9%) |
| 55 to 64 Years | 473 (38.9%) | 839 (60.3%) |
| 65 to 74 Years | 503 (45.6%) | 460 (35.2%) |
| 75 Years and over | 303 (30.8%) | 524 (41.7%) |
| Total | 4,698 (44.1%) | 5,837 (48.9%) |
Income Above Poverty by Sex and Age in Barceloneta Municipio
According to the poverty statistics in Barceloneta Municipio, males aged 5 years and females aged 16 and 17 years are the age groups that are most secure financially, with 100.0% of males and 77.7% of females in these age groups living above the poverty line.
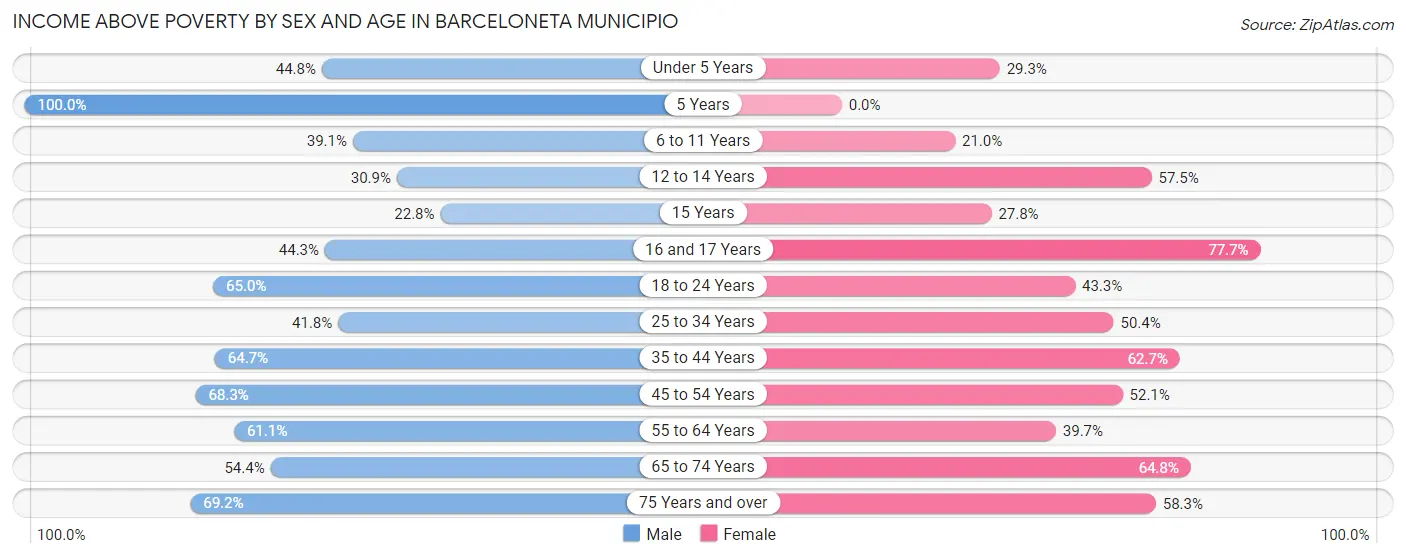
| Age Bracket | Male | Female |
| Under 5 Years | 187 (44.8%) | 119 (29.3%) |
| 5 Years | 30 (100.0%) | 0 (0.0%) |
| 6 to 11 Years | 297 (39.1%) | 111 (21.0%) |
| 12 to 14 Years | 132 (30.9%) | 307 (57.5%) |
| 15 Years | 50 (22.8%) | 35 (27.8%) |
| 16 and 17 Years | 85 (44.3%) | 223 (77.7%) |
| 18 to 24 Years | 684 (65.0%) | 465 (43.3%) |
| 25 to 34 Years | 615 (41.8%) | 859 (50.4%) |
| 35 to 44 Years | 879 (64.7%) | 1,001 (62.7%) |
| 45 to 54 Years | 971 (68.3%) | 849 (52.1%) |
| 55 to 64 Years | 744 (61.1%) | 553 (39.7%) |
| 65 to 74 Years | 599 (54.4%) | 846 (64.8%) |
| 75 Years and over | 682 (69.2%) | 732 (58.3%) |
| Total | 5,955 (55.9%) | 6,100 (51.1%) |
Income Below Poverty Among Married-Couple Families in Barceloneta Municipio
The poverty statistics for married-couple families in Barceloneta Municipio show that 30.6% or 788 of the total 2,572 families live below the poverty line. Families with 3 or 4 children have the highest poverty rate of 100.0%, comprising of 32 families. On the other hand, families with 1 or 2 children have the lowest poverty rate of 25.4%, which includes 273 families.
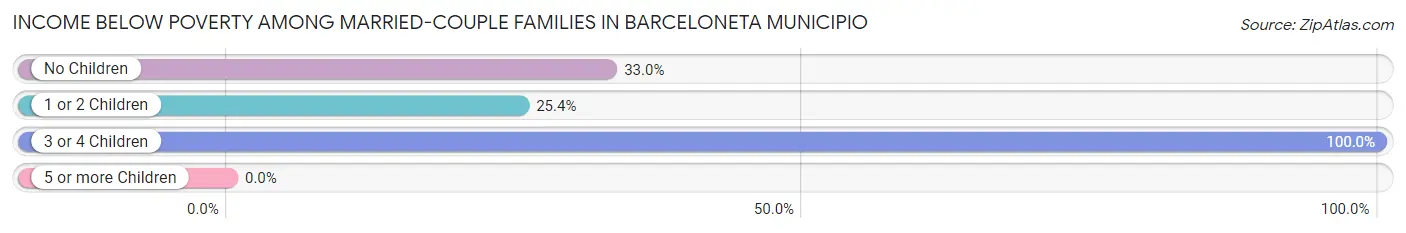
| Children | Above Poverty | Below Poverty |
| No Children | 980 (67.0%) | 483 (33.0%) |
| 1 or 2 Children | 804 (74.7%) | 273 (25.4%) |
| 3 or 4 Children | 0 (0.0%) | 32 (100.0%) |
| 5 or more Children | 0 (0.0%) | 0 (0.0%) |
| Total | 1,784 (69.4%) | 788 (30.6%) |
Income Below Poverty Among Single-Parent Households in Barceloneta Municipio
According to the poverty data in Barceloneta Municipio, 39.4% or 194 single-father households and 61.6% or 1,682 single-mother households are living below the poverty line. Among single-father households, those with 1 or 2 children have the highest poverty rate, with 102 households (100.0%) experiencing poverty. Likewise, among single-mother households, those with 3 or 4 children have the highest poverty rate, with 172 households (100.0%) falling below the poverty line.
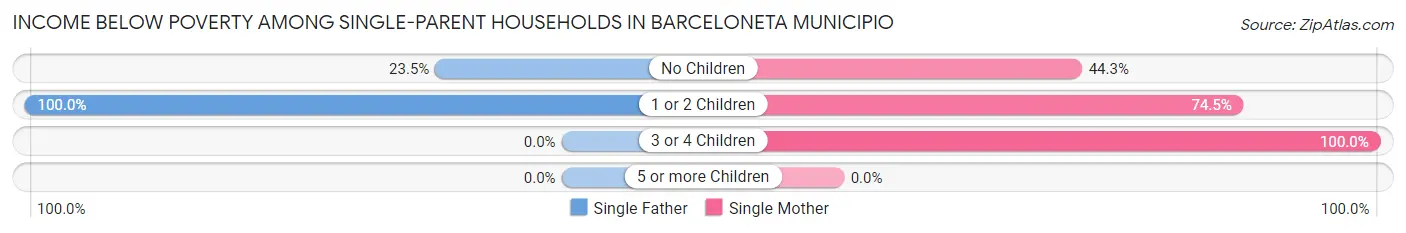
| Children | Single Father | Single Mother |
| No Children | 92 (23.5%) | 584 (44.3%) |
| 1 or 2 Children | 102 (100.0%) | 926 (74.5%) |
| 3 or 4 Children | 0 (0.0%) | 172 (100.0%) |
| 5 or more Children | 0 (0.0%) | 0 (0.0%) |
| Total | 194 (39.4%) | 1,682 (61.6%) |
Income Below Poverty Among Married-Couple vs Single-Parent Households in Barceloneta Municipio
The poverty data for Barceloneta Municipio shows that 788 of the married-couple family households (30.6%) and 1,876 of the single-parent households (58.2%) are living below the poverty level. Within the married-couple family households, those with 3 or 4 children have the highest poverty rate, with 32 households (100.0%) falling below the poverty line. Among the single-parent households, those with 3 or 4 children have the highest poverty rate, with 172 household (100.0%) living below poverty.
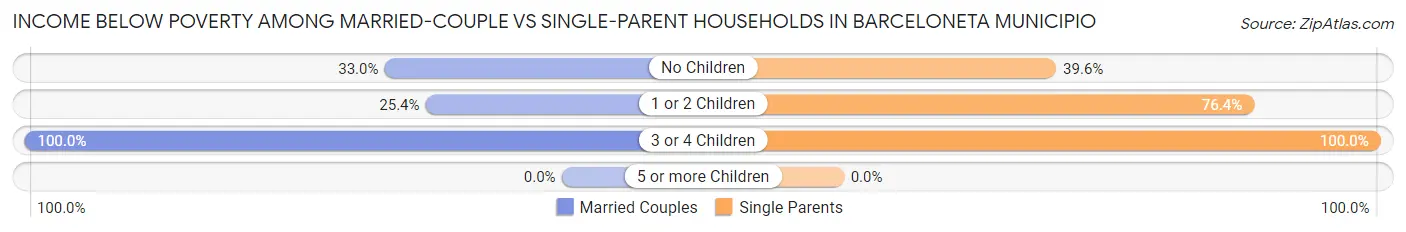
| Children | Married-Couple Families | Single-Parent Households |
| No Children | 483 (33.0%) | 676 (39.6%) |
| 1 or 2 Children | 273 (25.4%) | 1,028 (76.4%) |
| 3 or 4 Children | 32 (100.0%) | 172 (100.0%) |
| 5 or more Children | 0 (0.0%) | 0 (0.0%) |
| Total | 788 (30.6%) | 1,876 (58.2%) |
Race in Barceloneta Municipio
The most populous races in Barceloneta Municipio are Hispanic or Latino (22,436 | 99.3%), Two or more Races (8,583 | 38.0%), and White / Caucasian (8,527 | 37.7%).
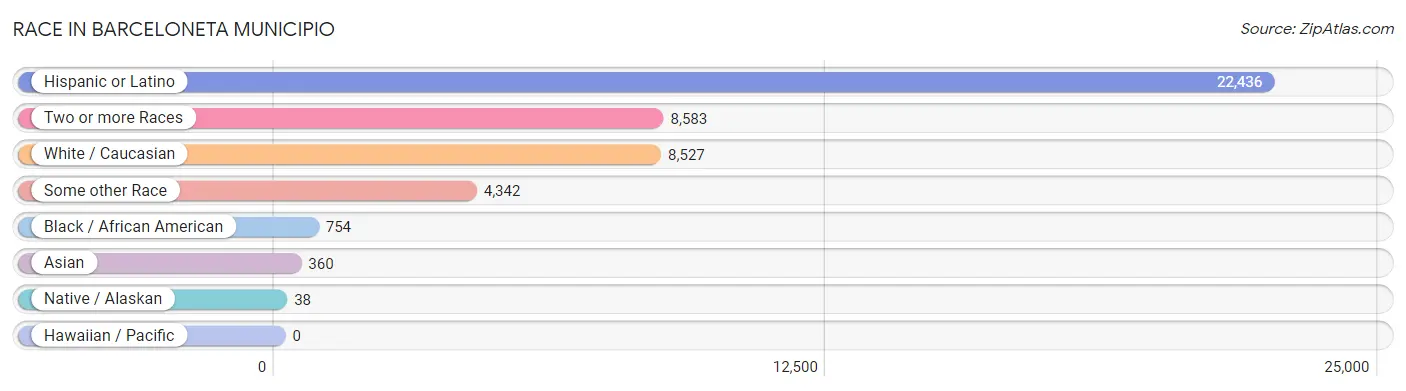
| Race | # Population | % Population |
| Asian | 360 | 1.6% |
| Black / African American | 754 | 3.3% |
| Hawaiian / Pacific | 0 | 0.0% |
| Hispanic or Latino | 22,436 | 99.3% |
| Native / Alaskan | 38 | 0.2% |
| White / Caucasian | 8,527 | 37.7% |
| Two or more Races | 8,583 | 38.0% |
| Some other Race | 4,342 | 19.2% |
| Total | 22,604 | 100.0% |
Ancestry in Barceloneta Municipio
The most populous ancestries reported in Barceloneta Municipio are Puerto Rican (22,348 | 98.9%), Thai (379 | 1.7%), American (148 | 0.6%), Central American Indian (115 | 0.5%), and Peruvian (65 | 0.3%), together accounting for 102.0% of all Barceloneta Municipio residents.
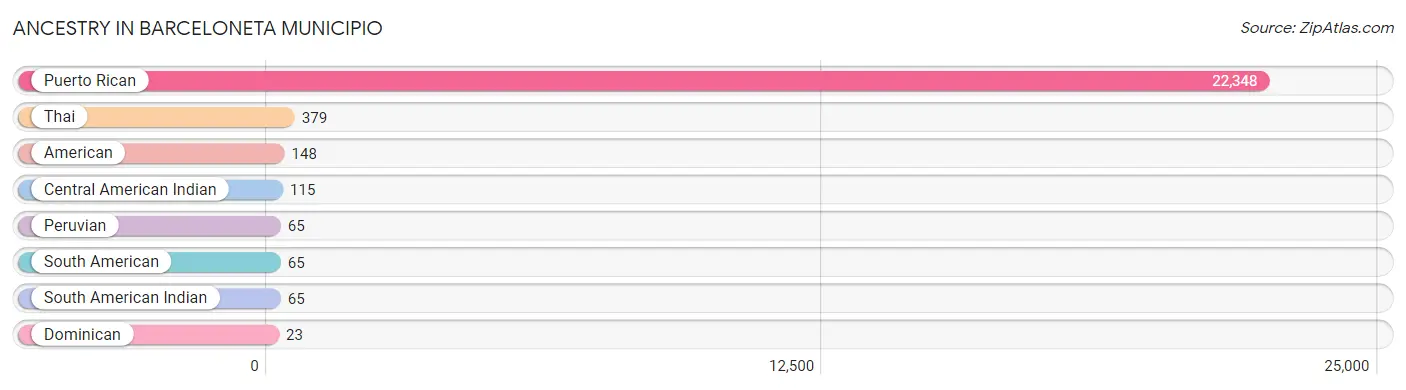
| Ancestry | # Population | % Population |
| American | 148 | 0.6% |
| Central American Indian | 115 | 0.5% |
| Dominican | 23 | 0.1% |
| Peruvian | 65 | 0.3% |
| Puerto Rican | 22,348 | 98.9% |
| South American | 65 | 0.3% |
| South American Indian | 65 | 0.3% |
| Thai | 379 | 1.7% | View All 8 Rows |
Immigrants in Barceloneta Municipio

| Immigration Origin | # Population | % Population | View All 0 Rows |
Sex and Age in Barceloneta Municipio
Sex and Age in Barceloneta Municipio
The most populous age groups in Barceloneta Municipio are 25 to 29 Years (781 | 7.3%) for men and 40 to 44 Years (1,024 | 8.6%) for women.
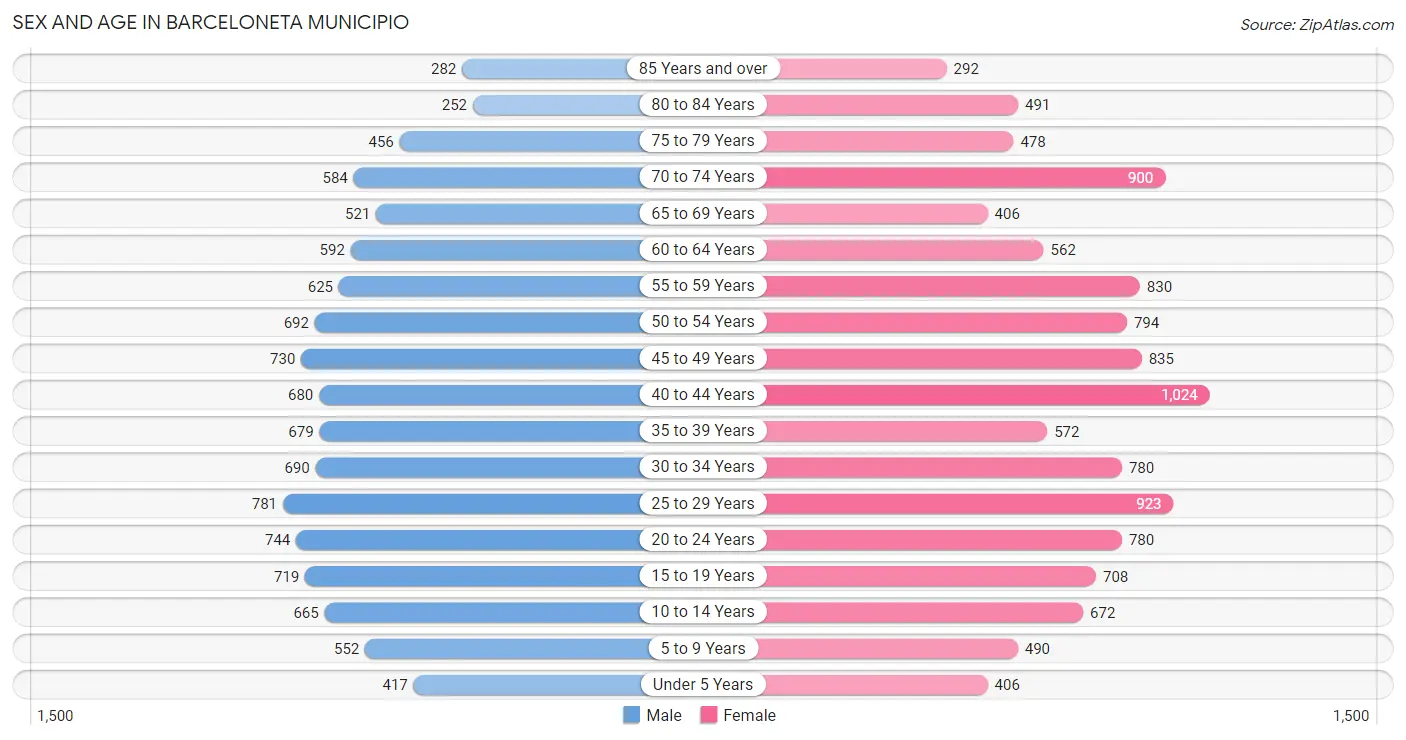
| Age Bracket | Male | Female |
| Under 5 Years | 417 (3.9%) | 406 (3.4%) |
| 5 to 9 Years | 552 (5.2%) | 490 (4.1%) |
| 10 to 14 Years | 665 (6.2%) | 672 (5.6%) |
| 15 to 19 Years | 719 (6.7%) | 708 (5.9%) |
| 20 to 24 Years | 744 (7.0%) | 780 (6.5%) |
| 25 to 29 Years | 781 (7.3%) | 923 (7.7%) |
| 30 to 34 Years | 690 (6.5%) | 780 (6.5%) |
| 35 to 39 Years | 679 (6.4%) | 572 (4.8%) |
| 40 to 44 Years | 680 (6.4%) | 1,024 (8.6%) |
| 45 to 49 Years | 730 (6.9%) | 835 (7.0%) |
| 50 to 54 Years | 692 (6.5%) | 794 (6.7%) |
| 55 to 59 Years | 625 (5.9%) | 830 (7.0%) |
| 60 to 64 Years | 592 (5.6%) | 562 (4.7%) |
| 65 to 69 Years | 521 (4.9%) | 406 (3.4%) |
| 70 to 74 Years | 584 (5.5%) | 900 (7.5%) |
| 75 to 79 Years | 456 (4.3%) | 478 (4.0%) |
| 80 to 84 Years | 252 (2.4%) | 491 (4.1%) |
| 85 Years and over | 282 (2.6%) | 292 (2.4%) |
| Total | 10,661 (100.0%) | 11,943 (100.0%) |
Families and Households in Barceloneta Municipio
Median Family Size in Barceloneta Municipio
The median family size in Barceloneta Municipio is 3.25 persons per family, with single female/mother families (2,732 | 47.1%) accounting for the largest median family size of 3.28 persons per family. On the other hand, single male/father families (493 | 8.5%) represent the smallest median family size with 3.00 persons per family.
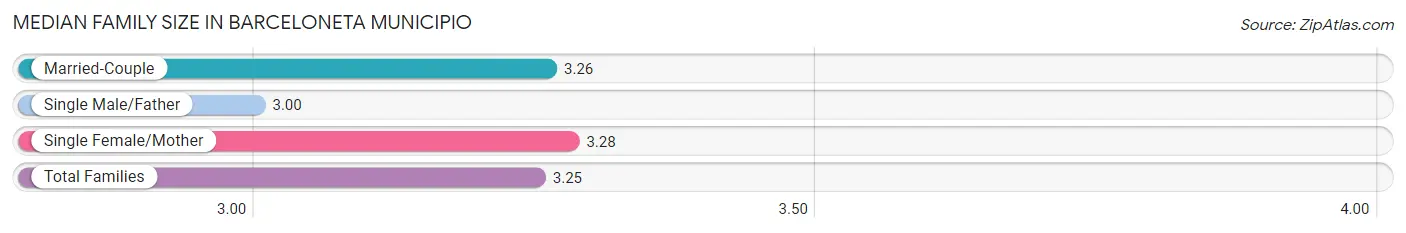
| Family Type | # Families | Family Size |
| Married-Couple | 2,572 (44.4%) | 3.26 |
| Single Male/Father | 493 (8.5%) | 3.00 |
| Single Female/Mother | 2,732 (47.1%) | 3.28 |
| Total Families | 5,797 (100.0%) | 3.25 |
Median Household Size in Barceloneta Municipio
The median household size in Barceloneta Municipio is 2.74 persons per household, with single female/mother households (2,732 | 33.1%) accounting for the largest median household size of 3.46 persons per household. non-family households (2,457 | 29.8%) represent the smallest median household size with 1.26 persons per household.
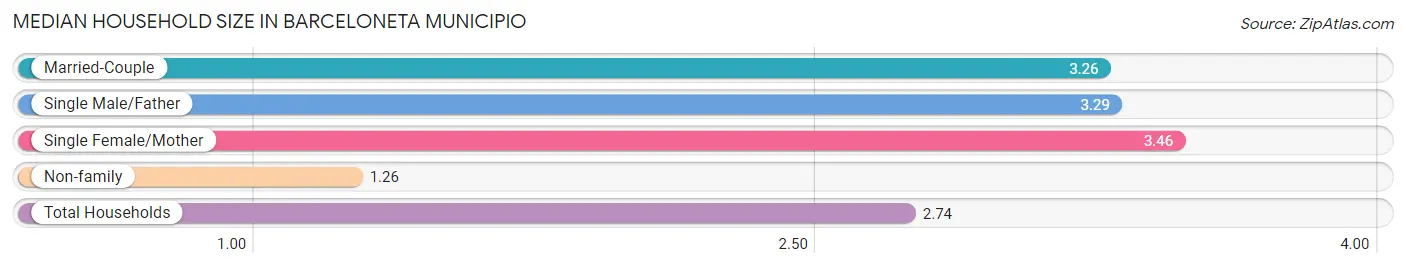
| Household Type | # Households | Household Size |
| Married-Couple | 2,572 (31.2%) | 3.26 |
| Single Male/Father | 493 (6.0%) | 3.29 |
| Single Female/Mother | 2,732 (33.1%) | 3.46 |
| Non-family | 2,457 (29.8%) | 1.26 |
| Total Households | 8,254 (100.0%) | 2.74 |
Household Size by Marriage Status in Barceloneta Municipio
Out of a total of 8,254 households in Barceloneta Municipio, 5,797 (70.2%) are family households, while 2,457 (29.8%) are nonfamily households. The most numerous type of family households are 2-person households, comprising 2,533, and the most common type of nonfamily households are 1-person households, comprising 1,905.
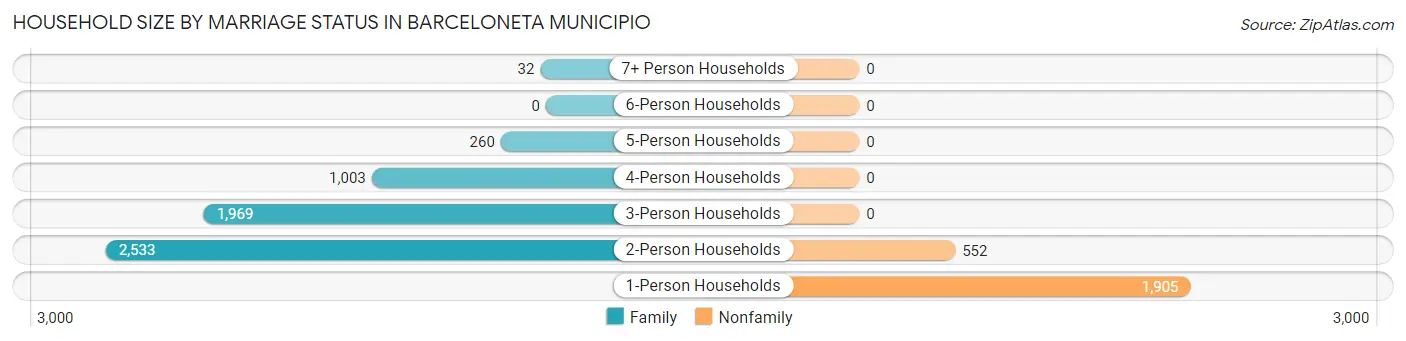
| Household Size | Family Households | Nonfamily Households |
| 1-Person Households | - | 1,905 (23.1%) |
| 2-Person Households | 2,533 (30.7%) | 552 (6.7%) |
| 3-Person Households | 1,969 (23.9%) | 0 (0.0%) |
| 4-Person Households | 1,003 (12.1%) | 0 (0.0%) |
| 5-Person Households | 260 (3.2%) | 0 (0.0%) |
| 6-Person Households | 0 (0.0%) | 0 (0.0%) |
| 7+ Person Households | 32 (0.4%) | 0 (0.0%) |
| Total | 5,797 (70.2%) | 2,457 (29.8%) |
Female Fertility in Barceloneta Municipio
Fertility by Age in Barceloneta Municipio
Average fertility rate in Barceloneta Municipio is 30.0 births per 1,000 women. Women in the age bracket of 20 to 34 years have the highest fertility rate with 46.0 births per 1,000 women. Women in the age bracket of 20 to 34 years acount for 65.3% of all women with births.
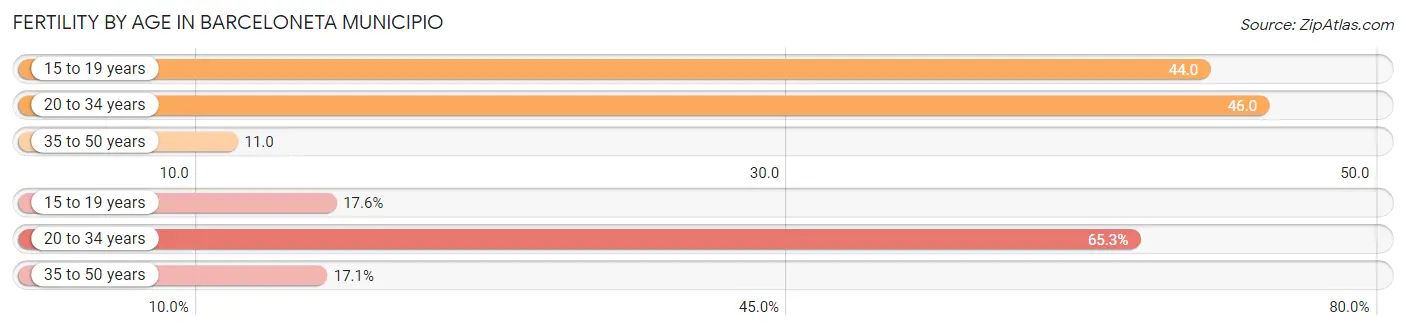
| Age Bracket | Women with Births | Births / 1,000 Women |
| 15 to 19 years | 31 (17.6%) | 44.0 |
| 20 to 34 years | 115 (65.3%) | 46.0 |
| 35 to 50 years | 30 (17.1%) | 11.0 |
| Total | 176 (100.0%) | 30.0 |
Fertility by Age by Marriage Status in Barceloneta Municipio
39.2% of women with births (176) in Barceloneta Municipio are married. The highest percentage of unmarried women with births falls into 15 to 19 years age bracket with 100.0% of them unmarried at the time of birth, while the lowest percentage of unmarried women with births belong to 20 to 34 years age bracket with 40.0% of them unmarried.
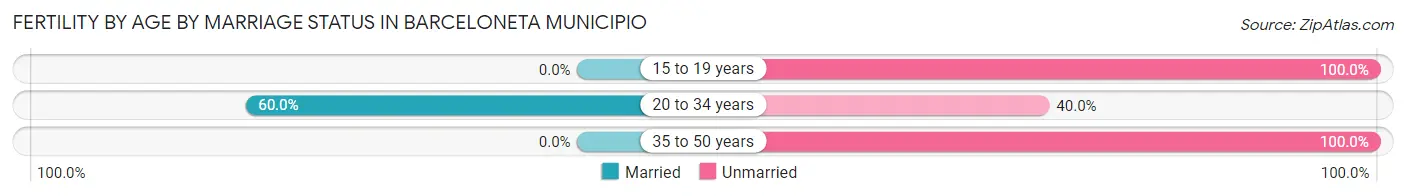
| Age Bracket | Married | Unmarried |
| 15 to 19 years | 0 (0.0%) | 31 (100.0%) |
| 20 to 34 years | 69 (60.0%) | 46 (40.0%) |
| 35 to 50 years | 0 (0.0%) | 30 (100.0%) |
| Total | 69 (39.2%) | 107 (60.8%) |
Fertility by Education in Barceloneta Municipio
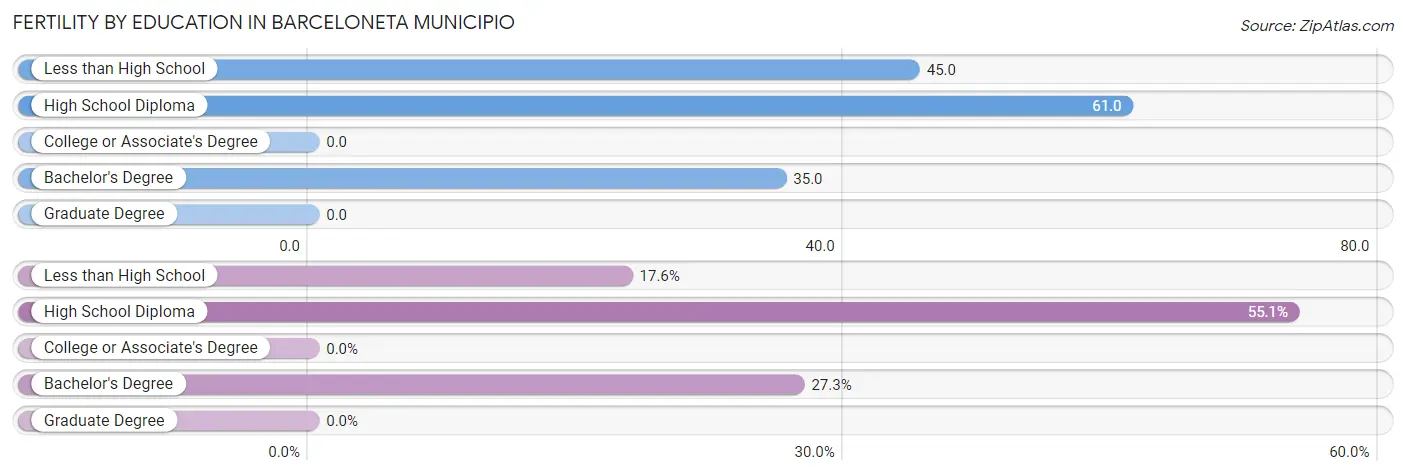
| Educational Attainment | Women with Births | Births / 1,000 Women |
| Less than High School | 31 (17.6%) | 45.0 |
| High School Diploma | 97 (55.1%) | 61.0 |
| College or Associate's Degree | 0 (0.0%) | 0.0 |
| Bachelor's Degree | 48 (27.3%) | 35.0 |
| Graduate Degree | 0 (0.0%) | 0.0 |
| Total | 176 (100.0%) | 30.0 |
Fertility by Education by Marriage Status in Barceloneta Municipio
60.8% of women with births in Barceloneta Municipio are unmarried. Women with the educational attainment of bachelor's degree are most likely to be married with 64.6% of them married at childbirth, while women with the educational attainment of less than high school are least likely to be married with 100.0% of them unmarried at childbirth.
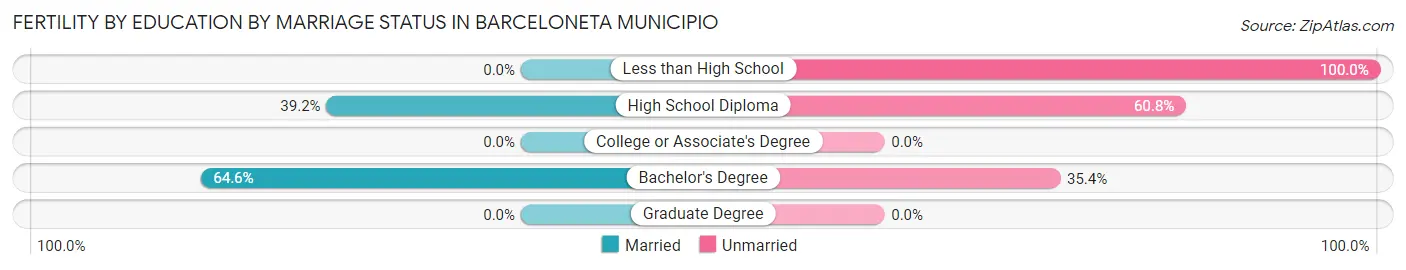
| Educational Attainment | Married | Unmarried |
| Less than High School | 0 (0.0%) | 31 (100.0%) |
| High School Diploma | 38 (39.2%) | 59 (60.8%) |
| College or Associate's Degree | 0 (0.0%) | 0 (0.0%) |
| Bachelor's Degree | 31 (64.6%) | 17 (35.4%) |
| Graduate Degree | 0 (0.0%) | 0 (0.0%) |
| Total | 69 (39.2%) | 107 (60.8%) |
Employment Characteristics in Barceloneta Municipio
Employment by Class of Employer in Barceloneta Municipio
Among the 6,265 employed individuals in Barceloneta Municipio, private company employees (3,962 | 63.2%), local government employees (838 | 13.4%), and self-employed (not incorporated) (680 | 10.8%) make up the most common classes of employment.
| Employer Class | # Employees | % Employees |
| Private Company Employees | 3,962 | 63.2% |
| Self-Employed (Incorporated) | 53 | 0.9% |
| Self-Employed (Not Incorporated) | 680 | 10.8% |
| Not-for-profit Organizations | 149 | 2.4% |
| Local Government Employees | 838 | 13.4% |
| State Government Employees | 520 | 8.3% |
| Federal Government Employees | 63 | 1.0% |
| Unpaid Family Workers | 0 | 0.0% |
| Total | 6,265 | 100.0% |
Employment Status by Age in Barceloneta Municipio
According to the labor force statistics for Barceloneta Municipio, out of the total population over 16 years of age (19,057), 43.1% or 8,214 individuals are in the labor force, with 15.8% or 1,298 of them unemployed. The age group with the highest labor force participation rate is 30 to 34 years, with 82.2% or 1,208 individuals in the labor force. Within the labor force, the 20 to 24 years age range has the highest percentage of unemployed individuals, with 39.1% or 311 of them being unemployed.
| Age Bracket | In Labor Force | Unemployed |
| 16 to 19 Years | 283 (26.2%) | 106 (37.3%) |
| 20 to 24 Years | 796 (52.2%) | 311 (39.1%) |
| 25 to 29 Years | 1,290 (75.7%) | 322 (25.0%) |
| 30 to 34 Years | 1,208 (82.2%) | 211 (17.5%) |
| 35 to 44 Years | 2,136 (72.3%) | 173 (8.1%) |
| 45 to 54 Years | 1,681 (55.1%) | 126 (7.5%) |
| 55 to 59 Years | 499 (34.3%) | 44 (8.8%) |
| 60 to 64 Years | 177 (15.3%) | 0 (0.0%) |
| 65 to 74 Years | 75 (3.1%) | 0 (0.0%) |
| 75 Years and over | 63 (2.8%) | 0 (0.0%) |
| Total | 8,214 (43.1%) | 1,298 (15.8%) |
Employment Status by Educational Attainment in Barceloneta Municipio
According to labor force statistics for Barceloneta Municipio, 59.3% of individuals (6,991) out of the total population between 25 and 64 years of age (11,789) are in the labor force, with 12.6% or 881 of them being unemployed. The group with the highest labor force participation rate are those with the educational attainment of bachelor's degree or higher, with 82.2% or 2,561 individuals in the labor force. Within the labor force, individuals with college / associate degree education have the highest percentage of unemployment, with 17.1% or 361 of them being unemployed.
| Educational Attainment | In Labor Force | Unemployed |
| Less than High School | 183 (11.3%) | 0 (0.0%) |
| High School Diploma | 2,132 (50.9%) | 620 (14.8%) |
| College / Associate Degree | 2,112 (73.8%) | 489 (17.1%) |
| Bachelor's Degree or higher | 2,561 (82.2%) | 246 (7.9%) |
| Total | 6,991 (59.3%) | 1,485 (12.6%) |
Employment Occupations by Sex in Barceloneta Municipio
Management, Business, Science and Arts Occupations
The most common Management, Business, Science and Arts occupations in Barceloneta Municipio are Business & Financial (499 | 7.2%), Community & Social Service (465 | 6.7%), Health Diagnosing & Treating (383 | 5.5%), Computers, Engineering & Science (327 | 4.7%), and Management (323 | 4.7%).
Management, Business, Science and Arts Occupations by Sex
Within the Management, Business, Science and Arts occupations in Barceloneta Municipio, the most male-oriented occupations are Computers & Mathematics (100.0%), Architecture & Engineering (100.0%), and Computers, Engineering & Science (67.3%), while the most female-oriented occupations are Education Instruction & Library (100.0%), Arts, Media & Entertainment (100.0%), and Legal Services & Support (88.1%).
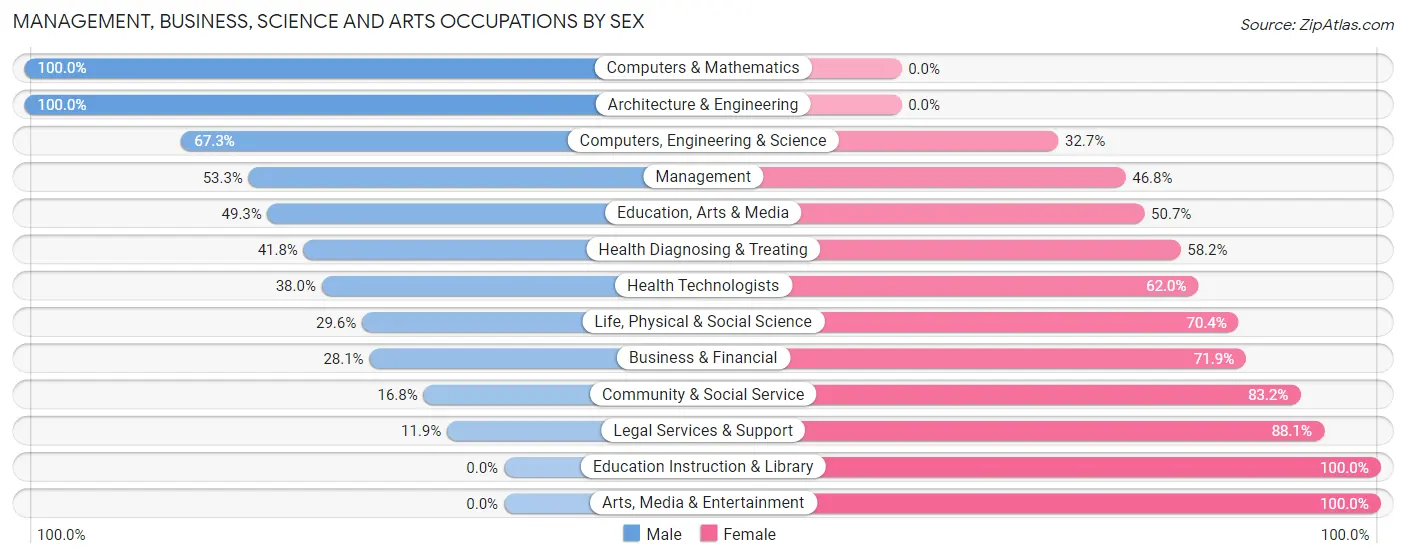
| Occupation | Male | Female |
| Management | 172 (53.2%) | 151 (46.8%) |
| Business & Financial | 140 (28.1%) | 359 (71.9%) |
| Computers, Engineering & Science | 220 (67.3%) | 107 (32.7%) |
| Computers & Mathematics | 106 (100.0%) | 0 (0.0%) |
| Architecture & Engineering | 69 (100.0%) | 0 (0.0%) |
| Life, Physical & Social Science | 45 (29.6%) | 107 (70.4%) |
| Community & Social Service | 78 (16.8%) | 387 (83.2%) |
| Education, Arts & Media | 71 (49.3%) | 73 (50.7%) |
| Legal Services & Support | 7 (11.9%) | 52 (88.1%) |
| Education Instruction & Library | 0 (0.0%) | 211 (100.0%) |
| Arts, Media & Entertainment | 0 (0.0%) | 51 (100.0%) |
| Health Diagnosing & Treating | 160 (41.8%) | 223 (58.2%) |
| Health Technologists | 100 (38.0%) | 163 (62.0%) |
| Total (Category) | 770 (38.6%) | 1,227 (61.4%) |
| Total (Overall) | 3,136 (45.4%) | 3,777 (54.6%) |
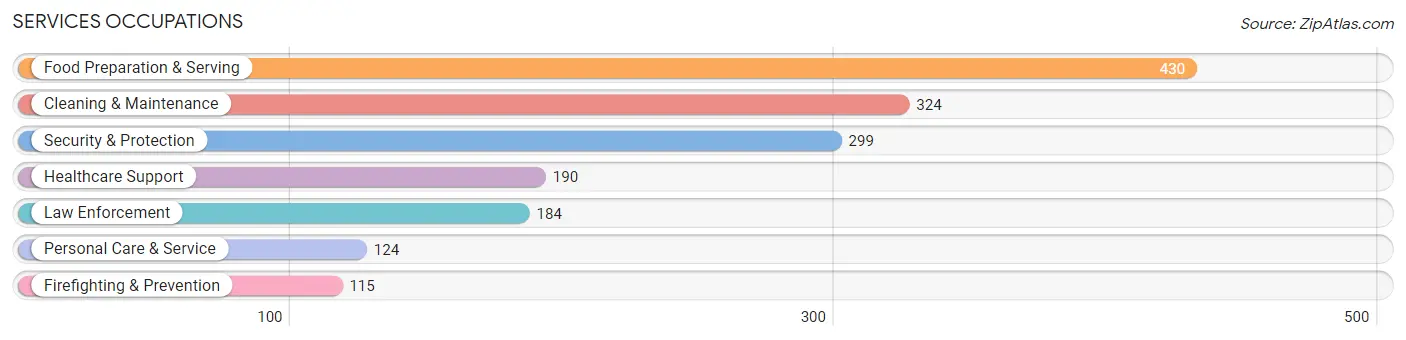
Services Occupations
The most common Services occupations in Barceloneta Municipio are Food Preparation & Serving (430 | 6.2%), Cleaning & Maintenance (324 | 4.7%), Security & Protection (299 | 4.3%), Healthcare Support (190 | 2.8%), and Law Enforcement (184 | 2.7%).
Services Occupations by Sex
Within the Services occupations in Barceloneta Municipio, the most male-oriented occupations are Food Preparation & Serving (60.9%), Firefighting & Prevention (52.2%), and Security & Protection (43.1%), while the most female-oriented occupations are Healthcare Support (100.0%), Cleaning & Maintenance (66.7%), and Personal Care & Service (65.3%).
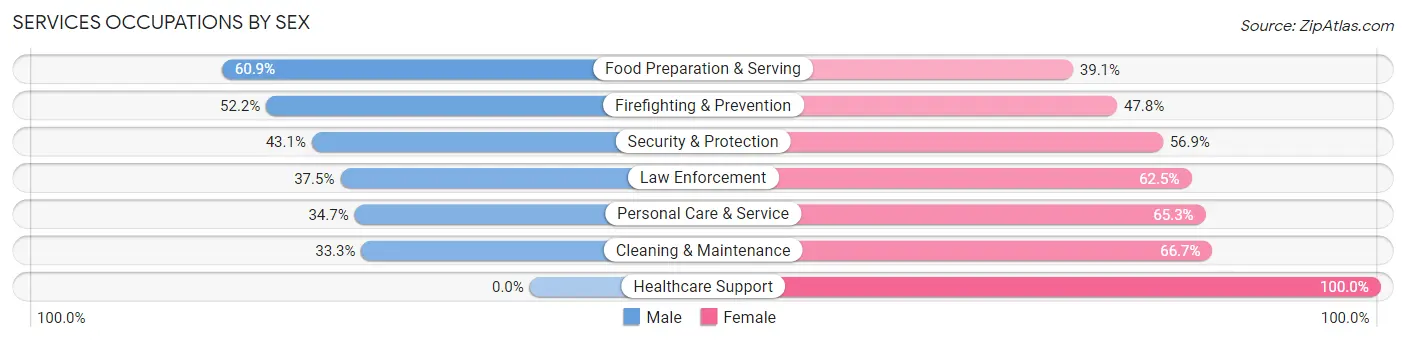
| Occupation | Male | Female |
| Healthcare Support | 0 (0.0%) | 190 (100.0%) |
| Security & Protection | 129 (43.1%) | 170 (56.9%) |
| Firefighting & Prevention | 60 (52.2%) | 55 (47.8%) |
| Law Enforcement | 69 (37.5%) | 115 (62.5%) |
| Food Preparation & Serving | 262 (60.9%) | 168 (39.1%) |
| Cleaning & Maintenance | 108 (33.3%) | 216 (66.7%) |
| Personal Care & Service | 43 (34.7%) | 81 (65.3%) |
| Total (Category) | 542 (39.7%) | 825 (60.4%) |
| Total (Overall) | 3,136 (45.4%) | 3,777 (54.6%) |
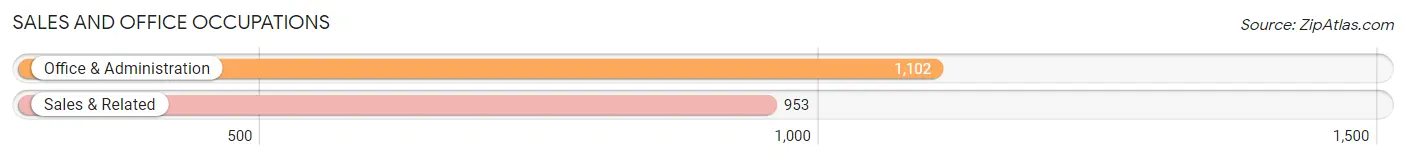
Sales and Office Occupations
The most common Sales and Office occupations in Barceloneta Municipio are Office & Administration (1,102 | 15.9%), and Sales & Related (953 | 13.8%).
Sales and Office Occupations by Sex
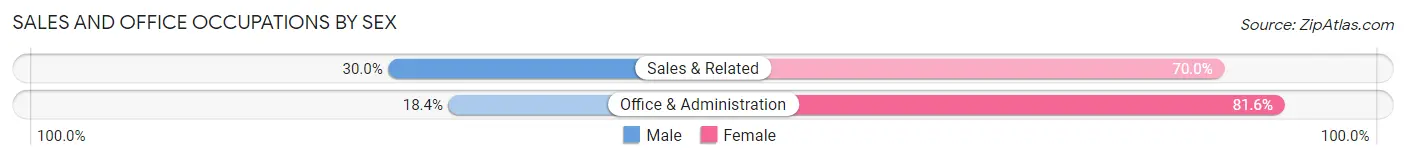
| Occupation | Male | Female |
| Sales & Related | 286 (30.0%) | 667 (70.0%) |
| Office & Administration | 203 (18.4%) | 899 (81.6%) |
| Total (Category) | 489 (23.8%) | 1,566 (76.2%) |
| Total (Overall) | 3,136 (45.4%) | 3,777 (54.6%) |
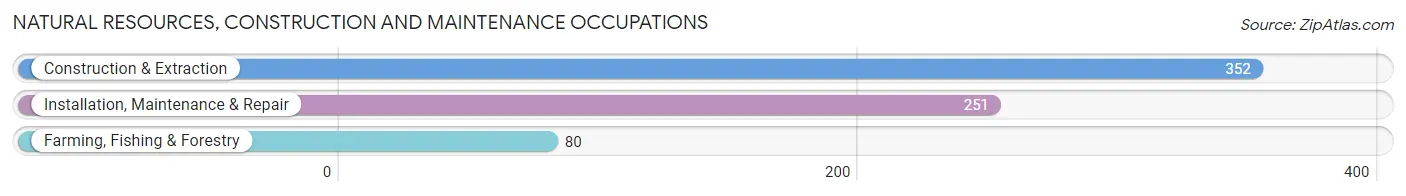
Natural Resources, Construction and Maintenance Occupations
The most common Natural Resources, Construction and Maintenance occupations in Barceloneta Municipio are Construction & Extraction (352 | 5.1%), Installation, Maintenance & Repair (251 | 3.6%), and Farming, Fishing & Forestry (80 | 1.2%).
Natural Resources, Construction and Maintenance Occupations by Sex
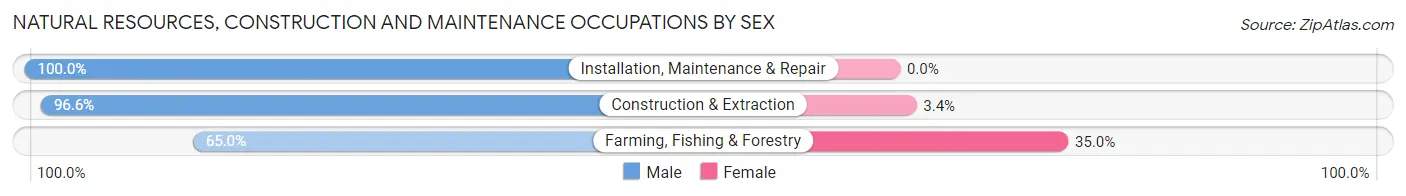
| Occupation | Male | Female |
| Farming, Fishing & Forestry | 52 (65.0%) | 28 (35.0%) |
| Construction & Extraction | 340 (96.6%) | 12 (3.4%) |
| Installation, Maintenance & Repair | 251 (100.0%) | 0 (0.0%) |
| Total (Category) | 643 (94.1%) | 40 (5.9%) |
| Total (Overall) | 3,136 (45.4%) | 3,777 (54.6%) |
Production, Transportation and Moving Occupations
The most common Production, Transportation and Moving occupations in Barceloneta Municipio are Production (399 | 5.8%), Transportation (222 | 3.2%), and Material Moving (190 | 2.8%).
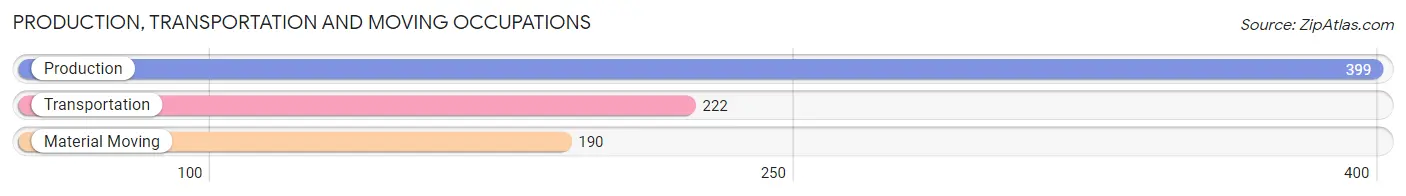
Production, Transportation and Moving Occupations by Sex
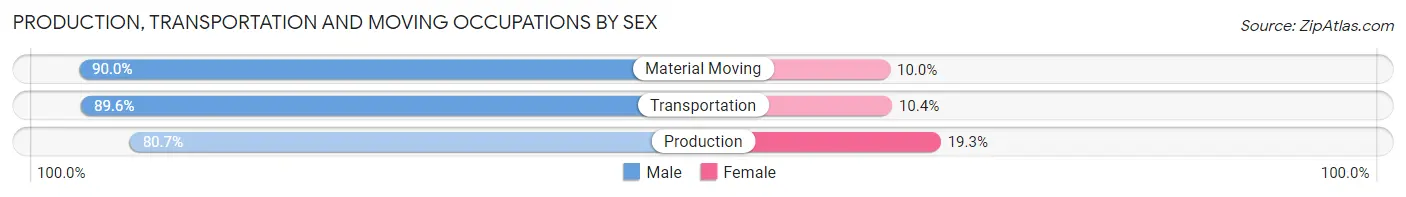
| Occupation | Male | Female |
| Production | 322 (80.7%) | 77 (19.3%) |
| Transportation | 199 (89.6%) | 23 (10.4%) |
| Material Moving | 171 (90.0%) | 19 (10.0%) |
| Total (Category) | 692 (85.3%) | 119 (14.7%) |
| Total (Overall) | 3,136 (45.4%) | 3,777 (54.6%) |
Employment Industries by Sex in Barceloneta Municipio
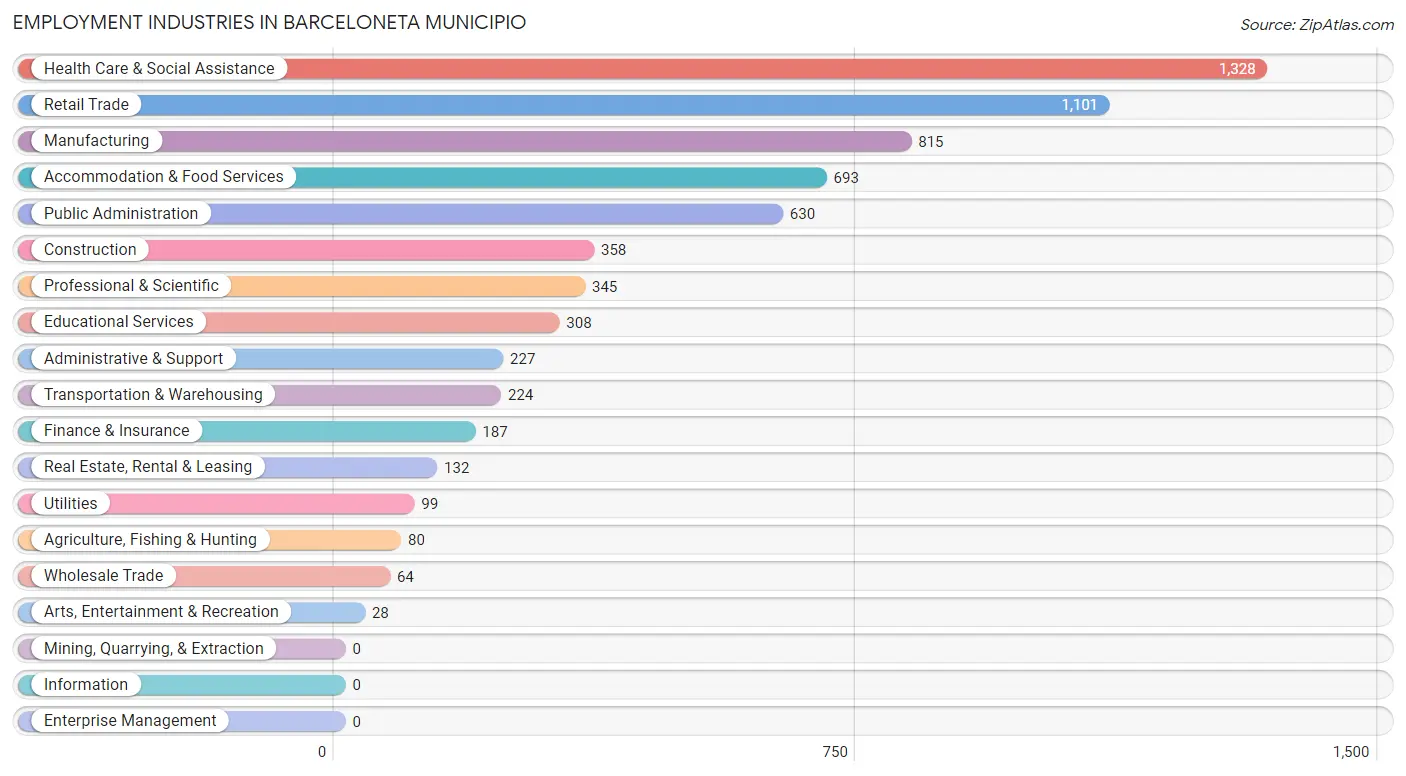
Employment Industries in Barceloneta Municipio
The major employment industries in Barceloneta Municipio include Health Care & Social Assistance (1,328 | 19.2%), Retail Trade (1,101 | 15.9%), Manufacturing (815 | 11.8%), Accommodation & Food Services (693 | 10.0%), and Public Administration (630 | 9.1%).
Employment Industries by Sex in Barceloneta Municipio
The Barceloneta Municipio industries that see more men than women are Transportation & Warehousing (100.0%), Real Estate, Rental & Leasing (100.0%), and Arts, Entertainment & Recreation (100.0%), whereas the industries that tend to have a higher number of women are Finance & Insurance (100.0%), Educational Services (76.0%), and Health Care & Social Assistance (75.1%).
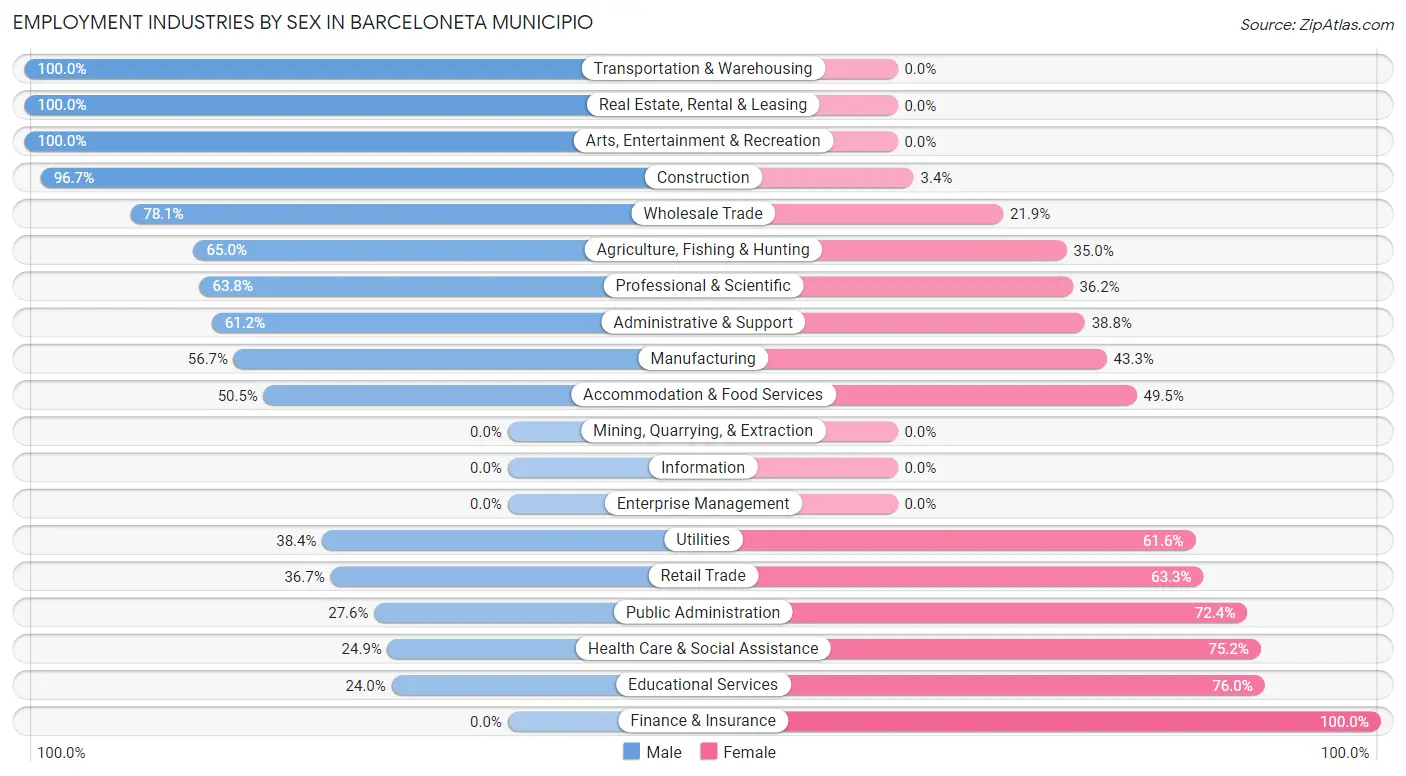
| Industry | Male | Female |
| Agriculture, Fishing & Hunting | 52 (65.0%) | 28 (35.0%) |
| Mining, Quarrying, & Extraction | 0 (0.0%) | 0 (0.0%) |
| Construction | 346 (96.7%) | 12 (3.4%) |
| Manufacturing | 462 (56.7%) | 353 (43.3%) |
| Wholesale Trade | 50 (78.1%) | 14 (21.9%) |
| Retail Trade | 404 (36.7%) | 697 (63.3%) |
| Transportation & Warehousing | 224 (100.0%) | 0 (0.0%) |
| Utilities | 38 (38.4%) | 61 (61.6%) |
| Information | 0 (0.0%) | 0 (0.0%) |
| Finance & Insurance | 0 (0.0%) | 187 (100.0%) |
| Real Estate, Rental & Leasing | 132 (100.0%) | 0 (0.0%) |
| Professional & Scientific | 220 (63.8%) | 125 (36.2%) |
| Enterprise Management | 0 (0.0%) | 0 (0.0%) |
| Administrative & Support | 139 (61.2%) | 88 (38.8%) |
| Educational Services | 74 (24.0%) | 234 (76.0%) |
| Health Care & Social Assistance | 330 (24.8%) | 998 (75.1%) |
| Arts, Entertainment & Recreation | 28 (100.0%) | 0 (0.0%) |
| Accommodation & Food Services | 350 (50.5%) | 343 (49.5%) |
| Public Administration | 174 (27.6%) | 456 (72.4%) |
| Total | 3,136 (45.4%) | 3,777 (54.6%) |
Education in Barceloneta Municipio
School Enrollment in Barceloneta Municipio
The most common levels of schooling among the 4,915 students in Barceloneta Municipio are college / undergraduate (1,300 | 26.5%), high school (1,065 | 21.7%), and middle school (1,064 | 21.6%).
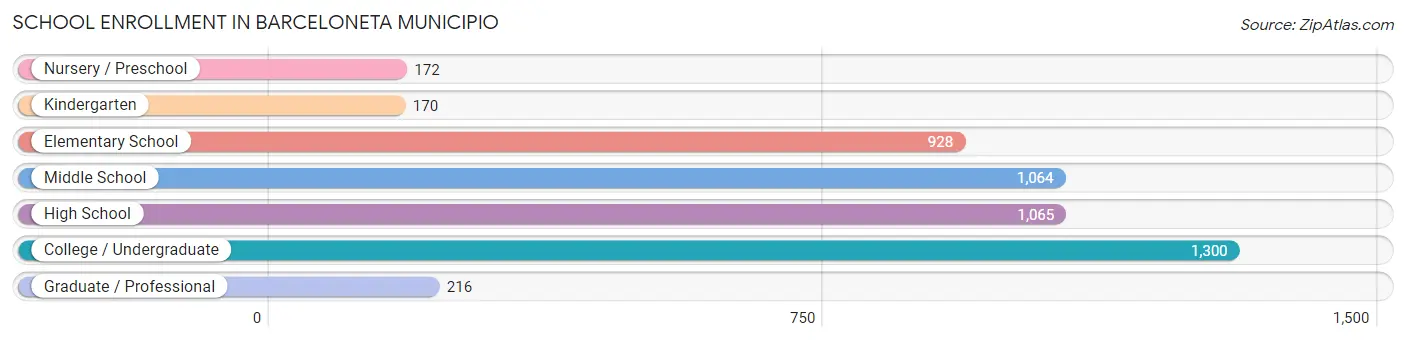
| School Level | # Students | % Students |
| Nursery / Preschool | 172 | 3.5% |
| Kindergarten | 170 | 3.5% |
| Elementary School | 928 | 18.9% |
| Middle School | 1,064 | 21.6% |
| High School | 1,065 | 21.7% |
| College / Undergraduate | 1,300 | 26.5% |
| Graduate / Professional | 216 | 4.4% |
| Total | 4,915 | 100.0% |
School Enrollment by Age by Funding Source in Barceloneta Municipio
Out of a total of 4,915 students who are enrolled in schools in Barceloneta Municipio, 1,946 (39.6%) attend a private institution, while the remaining 2,969 (60.4%) are enrolled in public schools. The age group of 35 years and over has the highest likelihood of being enrolled in private schools, with 219 (81.1% in the age bracket) enrolled. Conversely, the age group of 3 to 4 year olds has the lowest likelihood of being enrolled in a private school, with 172 (81.1% in the age bracket) attending a public institution.
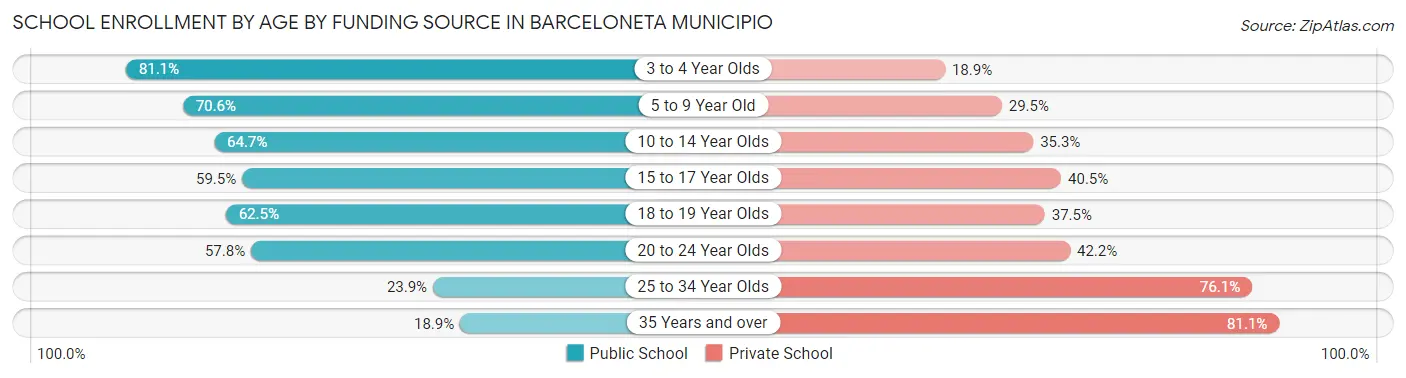
| Age Bracket | Public School | Private School |
| 3 to 4 Year Olds | 172 (81.1%) | 40 (18.9%) |
| 5 to 9 Year Old | 702 (70.6%) | 293 (29.4%) |
| 10 to 14 Year Olds | 865 (64.7%) | 472 (35.3%) |
| 15 to 17 Year Olds | 473 (59.5%) | 322 (40.5%) |
| 18 to 19 Year Olds | 292 (62.5%) | 175 (37.5%) |
| 20 to 24 Year Olds | 362 (57.8%) | 264 (42.2%) |
| 25 to 34 Year Olds | 51 (23.9%) | 162 (76.1%) |
| 35 Years and over | 51 (18.9%) | 219 (81.1%) |
| Total | 2,969 (60.4%) | 1,946 (39.6%) |
Educational Attainment by Field of Study in Barceloneta Municipio
Business (1,220 | 31.8%), education (618 | 16.1%), science & technology (544 | 14.2%), arts & humanities (346 | 9.0%), and communications (240 | 6.2%) are the most common fields of study among 3,840 individuals in Barceloneta Municipio who have obtained a bachelor's degree or higher.
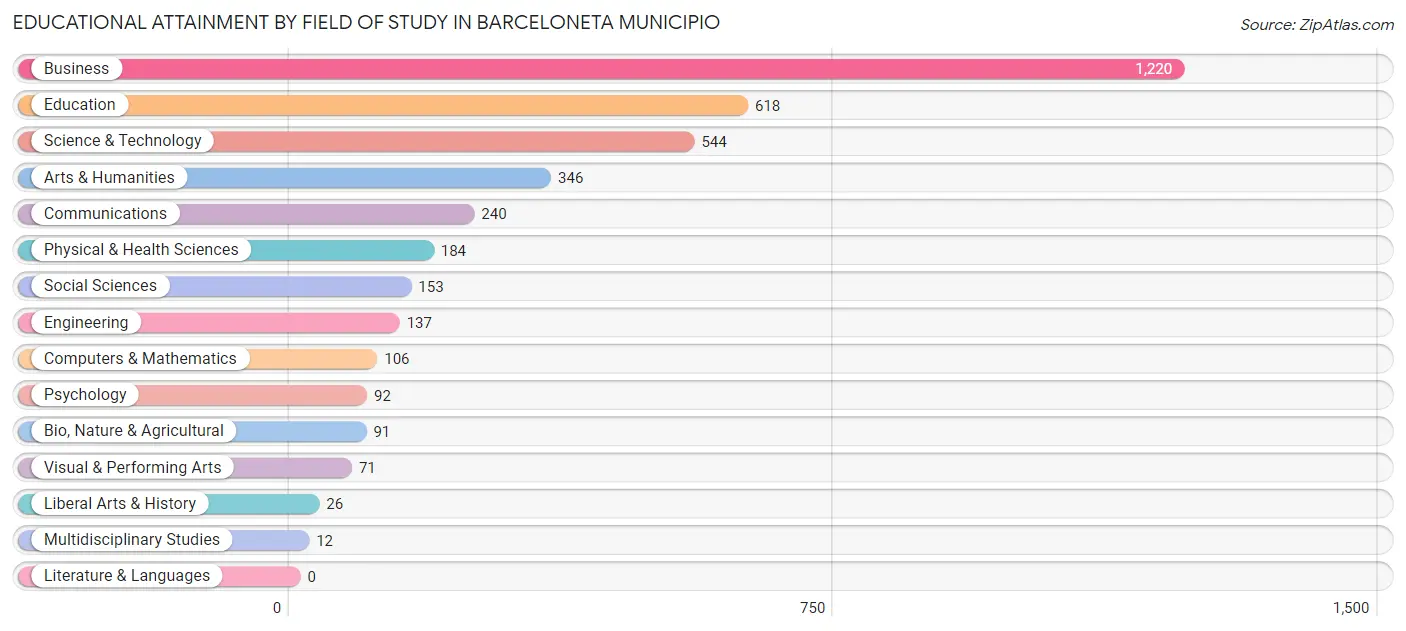
| Field of Study | # Graduates | % Graduates |
| Computers & Mathematics | 106 | 2.8% |
| Bio, Nature & Agricultural | 91 | 2.4% |
| Physical & Health Sciences | 184 | 4.8% |
| Psychology | 92 | 2.4% |
| Social Sciences | 153 | 4.0% |
| Engineering | 137 | 3.6% |
| Multidisciplinary Studies | 12 | 0.3% |
| Science & Technology | 544 | 14.2% |
| Business | 1,220 | 31.8% |
| Education | 618 | 16.1% |
| Literature & Languages | 0 | 0.0% |
| Liberal Arts & History | 26 | 0.7% |
| Visual & Performing Arts | 71 | 1.8% |
| Communications | 240 | 6.2% |
| Arts & Humanities | 346 | 9.0% |
| Total | 3,840 | 100.0% |
Transportation & Commute in Barceloneta Municipio
Vehicle Availability by Sex in Barceloneta Municipio
The most prevalent vehicle ownership categories in Barceloneta Municipio are males with 2 vehicles (1,465, accounting for 53.2%) and females with 2 vehicles (1,512, making up 41.7%).
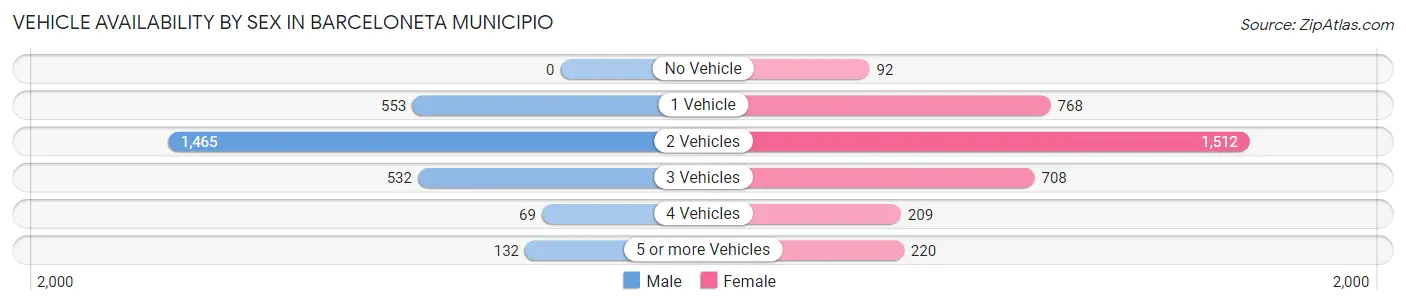
| Vehicles Available | Male | Female |
| No Vehicle | 0 (0.0%) | 92 (2.6%) |
| 1 Vehicle | 553 (20.1%) | 768 (21.9%) |
| 2 Vehicles | 1,465 (53.2%) | 1,512 (43.1%) |
| 3 Vehicles | 532 (19.3%) | 708 (20.2%) |
| 4 Vehicles | 69 (2.5%) | 209 (6.0%) |
| 5 or more Vehicles | 132 (4.8%) | 220 (6.3%) |
| Total | 2,751 (100.0%) | 3,509 (100.0%) |
Commute Time in Barceloneta Municipio
The most frequently occuring commute durations in Barceloneta Municipio are 20 to 24 minutes (1,103 commuters, 18.1%), 15 to 19 minutes (1,037 commuters, 17.1%), and 10 to 14 minutes (855 commuters, 14.1%).
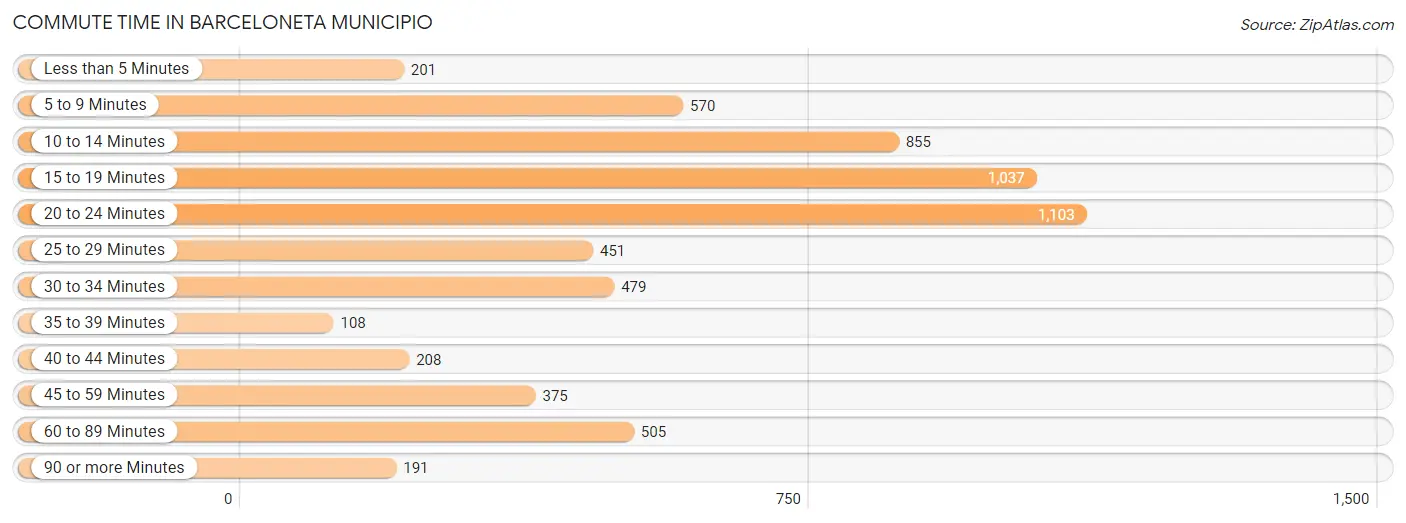
| Commute Time | # Commuters | % Commuters |
| Less than 5 Minutes | 201 | 3.3% |
| 5 to 9 Minutes | 570 | 9.4% |
| 10 to 14 Minutes | 855 | 14.1% |
| 15 to 19 Minutes | 1,037 | 17.1% |
| 20 to 24 Minutes | 1,103 | 18.1% |
| 25 to 29 Minutes | 451 | 7.4% |
| 30 to 34 Minutes | 479 | 7.9% |
| 35 to 39 Minutes | 108 | 1.8% |
| 40 to 44 Minutes | 208 | 3.4% |
| 45 to 59 Minutes | 375 | 6.2% |
| 60 to 89 Minutes | 505 | 8.3% |
| 90 or more Minutes | 191 | 3.1% |
Commute Time by Sex in Barceloneta Municipio
The most common commute times in Barceloneta Municipio are 5 to 9 minutes (478 commuters, 17.9%) for males and 20 to 24 minutes (714 commuters, 20.9%) for females.
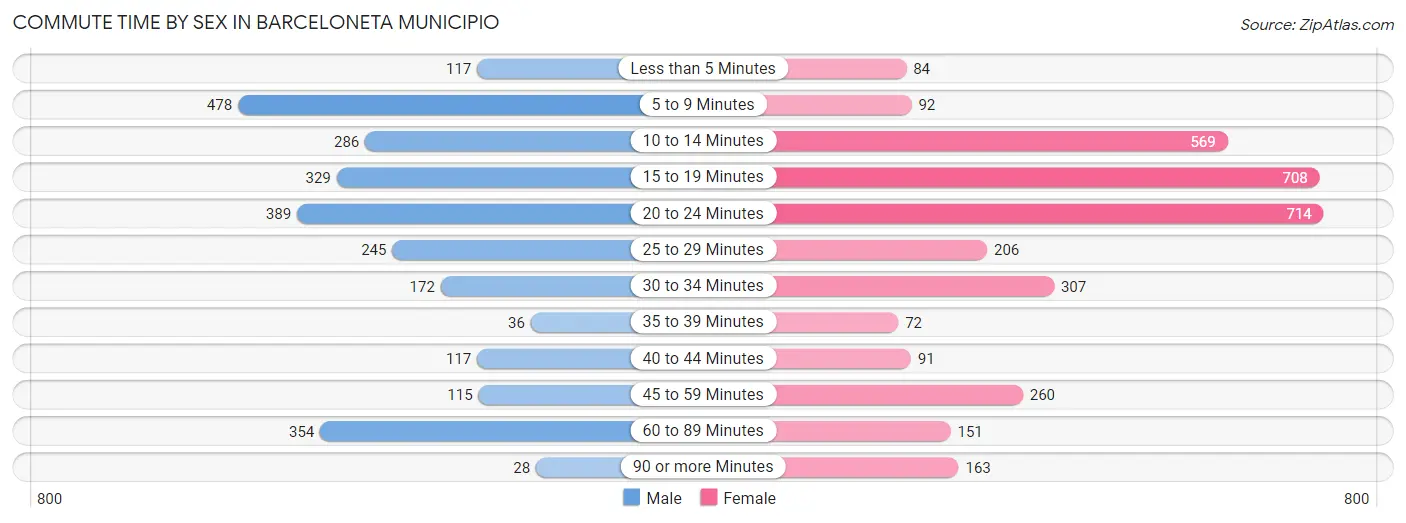
| Commute Time | Male | Female |
| Less than 5 Minutes | 117 (4.4%) | 84 (2.5%) |
| 5 to 9 Minutes | 478 (17.9%) | 92 (2.7%) |
| 10 to 14 Minutes | 286 (10.7%) | 569 (16.7%) |
| 15 to 19 Minutes | 329 (12.3%) | 708 (20.7%) |
| 20 to 24 Minutes | 389 (14.6%) | 714 (20.9%) |
| 25 to 29 Minutes | 245 (9.2%) | 206 (6.0%) |
| 30 to 34 Minutes | 172 (6.5%) | 307 (9.0%) |
| 35 to 39 Minutes | 36 (1.3%) | 72 (2.1%) |
| 40 to 44 Minutes | 117 (4.4%) | 91 (2.7%) |
| 45 to 59 Minutes | 115 (4.3%) | 260 (7.6%) |
| 60 to 89 Minutes | 354 (13.3%) | 151 (4.4%) |
| 90 or more Minutes | 28 (1.1%) | 163 (4.8%) |
Time of Departure to Work by Sex in Barceloneta Municipio
The most frequent times of departure to work in Barceloneta Municipio are 7:00 AM to 7:29 AM (430, 16.1%) for males and 7:00 AM to 7:29 AM (618, 18.1%) for females.
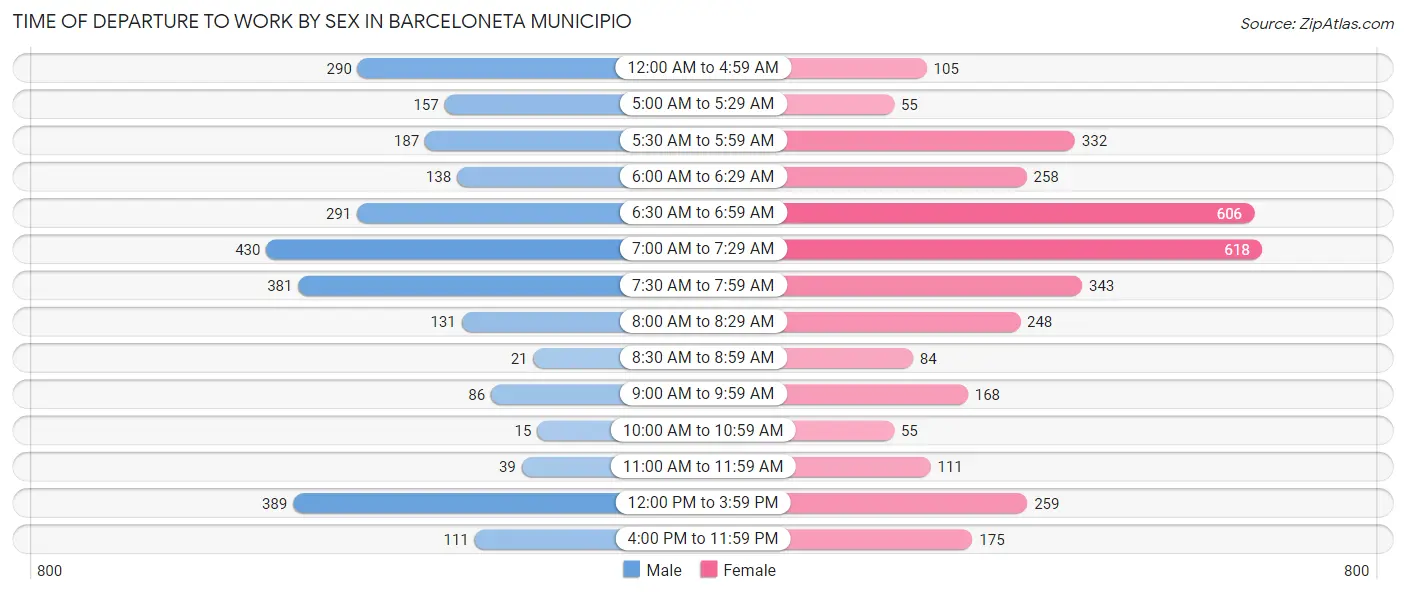
| Time of Departure | Male | Female |
| 12:00 AM to 4:59 AM | 290 (10.9%) | 105 (3.1%) |
| 5:00 AM to 5:29 AM | 157 (5.9%) | 55 (1.6%) |
| 5:30 AM to 5:59 AM | 187 (7.0%) | 332 (9.7%) |
| 6:00 AM to 6:29 AM | 138 (5.2%) | 258 (7.5%) |
| 6:30 AM to 6:59 AM | 291 (10.9%) | 606 (17.7%) |
| 7:00 AM to 7:29 AM | 430 (16.1%) | 618 (18.1%) |
| 7:30 AM to 7:59 AM | 381 (14.3%) | 343 (10.0%) |
| 8:00 AM to 8:29 AM | 131 (4.9%) | 248 (7.3%) |
| 8:30 AM to 8:59 AM | 21 (0.8%) | 84 (2.5%) |
| 9:00 AM to 9:59 AM | 86 (3.2%) | 168 (4.9%) |
| 10:00 AM to 10:59 AM | 15 (0.6%) | 55 (1.6%) |
| 11:00 AM to 11:59 AM | 39 (1.5%) | 111 (3.3%) |
| 12:00 PM to 3:59 PM | 389 (14.6%) | 259 (7.6%) |
| 4:00 PM to 11:59 PM | 111 (4.2%) | 175 (5.1%) |
| Total | 2,666 (100.0%) | 3,417 (100.0%) |
Housing Occupancy in Barceloneta Municipio
Occupancy by Ownership in Barceloneta Municipio
Of the total 8,254 dwellings in Barceloneta Municipio, owner-occupied units account for 6,046 (73.3%), while renter-occupied units make up 2,208 (26.8%).
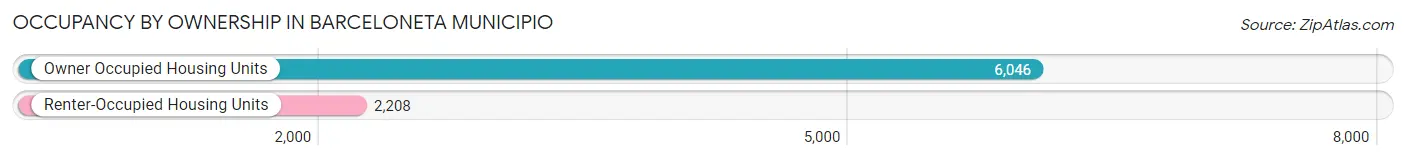
| Occupancy | # Housing Units | % Housing Units |
| Owner Occupied Housing Units | 6,046 | 73.3% |
| Renter-Occupied Housing Units | 2,208 | 26.8% |
| Total Occupied Housing Units | 8,254 | 100.0% |
Occupancy by Household Size in Barceloneta Municipio
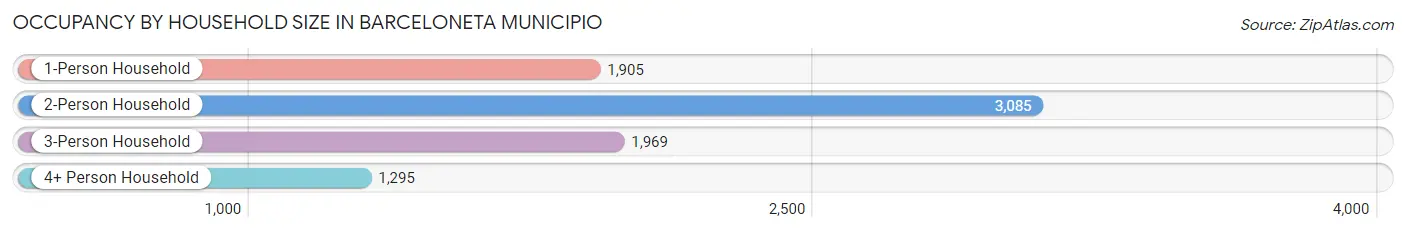
| Household Size | # Housing Units | % Housing Units |
| 1-Person Household | 1,905 | 23.1% |
| 2-Person Household | 3,085 | 37.4% |
| 3-Person Household | 1,969 | 23.9% |
| 4+ Person Household | 1,295 | 15.7% |
| Total Housing Units | 8,254 | 100.0% |
Occupancy by Ownership by Household Size in Barceloneta Municipio
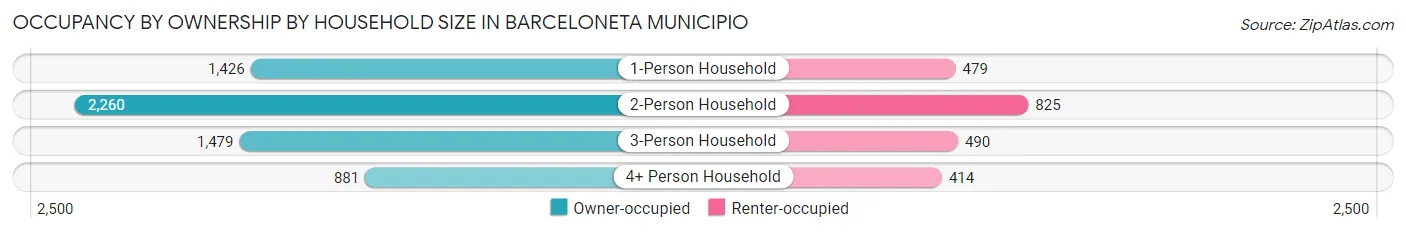
| Household Size | Owner-occupied | Renter-occupied |
| 1-Person Household | 1,426 (74.9%) | 479 (25.1%) |
| 2-Person Household | 2,260 (73.3%) | 825 (26.7%) |
| 3-Person Household | 1,479 (75.1%) | 490 (24.9%) |
| 4+ Person Household | 881 (68.0%) | 414 (32.0%) |
| Total Housing Units | 6,046 (73.3%) | 2,208 (26.8%) |
Occupancy by Educational Attainment in Barceloneta Municipio
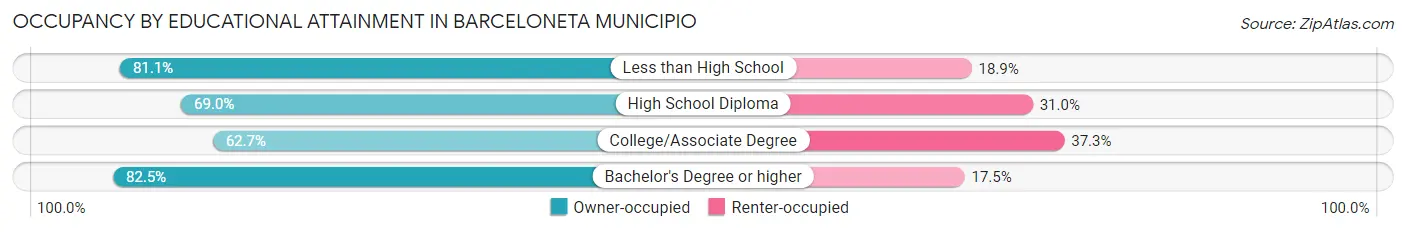
| Household Size | Owner-occupied | Renter-occupied |
| Less than High School | 1,428 (81.1%) | 333 (18.9%) |
| High School Diploma | 1,837 (69.0%) | 827 (31.0%) |
| College/Associate Degree | 1,195 (62.7%) | 711 (37.3%) |
| Bachelor's Degree or higher | 1,586 (82.5%) | 337 (17.5%) |
Occupancy by Age of Householder in Barceloneta Municipio
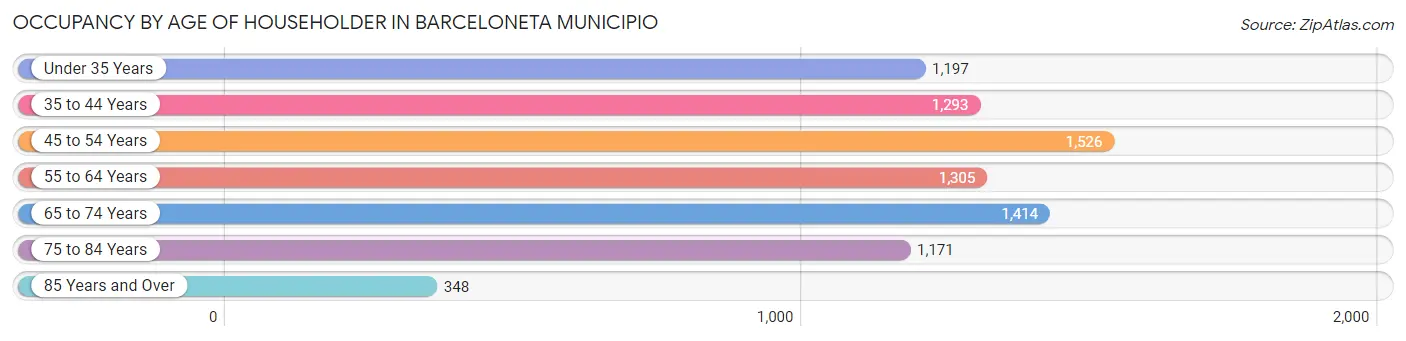
| Age Bracket | # Households | % Households |
| Under 35 Years | 1,197 | 14.5% |
| 35 to 44 Years | 1,293 | 15.7% |
| 45 to 54 Years | 1,526 | 18.5% |
| 55 to 64 Years | 1,305 | 15.8% |
| 65 to 74 Years | 1,414 | 17.1% |
| 75 to 84 Years | 1,171 | 14.2% |
| 85 Years and Over | 348 | 4.2% |
| Total | 8,254 | 100.0% |
Housing Finances in Barceloneta Municipio
Median Income by Occupancy in Barceloneta Municipio
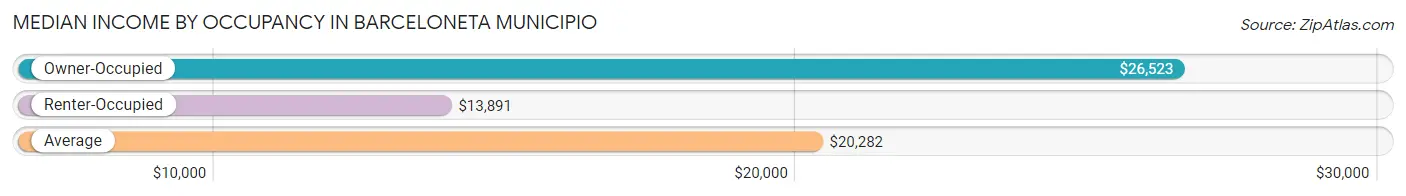
| Occupancy Type | # Households | Median Income |
| Owner-Occupied | 6,046 (73.3%) | $26,523 |
| Renter-Occupied | 2,208 (26.8%) | $13,891 |
| Average | 8,254 (100.0%) | $20,282 |
Occupancy by Householder Income Bracket in Barceloneta Municipio
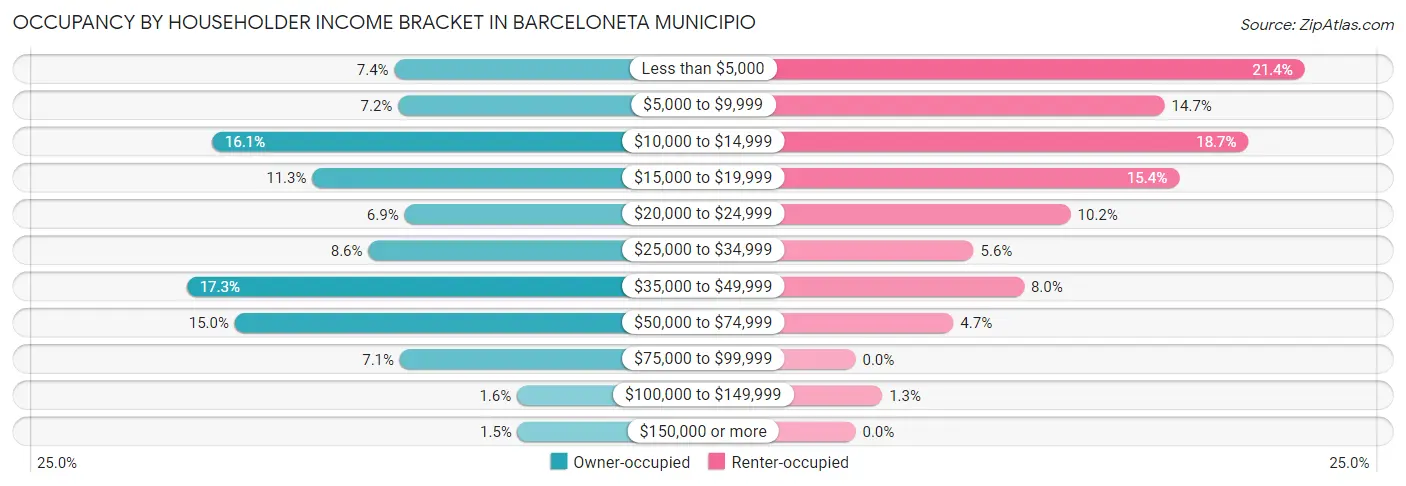
| Income Bracket | Owner-occupied | Renter-occupied |
| Less than $5,000 | 447 (7.4%) | 472 (21.4%) |
| $5,000 to $9,999 | 436 (7.2%) | 325 (14.7%) |
| $10,000 to $14,999 | 972 (16.1%) | 413 (18.7%) |
| $15,000 to $19,999 | 683 (11.3%) | 340 (15.4%) |
| $20,000 to $24,999 | 418 (6.9%) | 226 (10.2%) |
| $25,000 to $34,999 | 522 (8.6%) | 124 (5.6%) |
| $35,000 to $49,999 | 1,045 (17.3%) | 177 (8.0%) |
| $50,000 to $74,999 | 906 (15.0%) | 103 (4.7%) |
| $75,000 to $99,999 | 431 (7.1%) | 0 (0.0%) |
| $100,000 to $149,999 | 94 (1.5%) | 28 (1.3%) |
| $150,000 or more | 92 (1.5%) | 0 (0.0%) |
| Total | 6,046 (100.0%) | 2,208 (100.0%) |
Monthly Housing Cost Tiers in Barceloneta Municipio
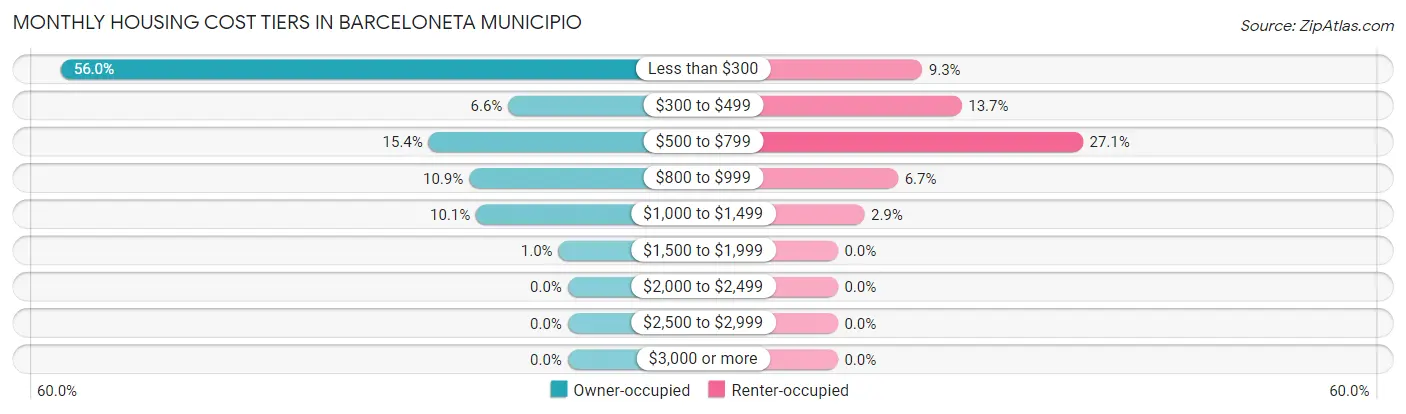
| Monthly Cost | Owner-occupied | Renter-occupied |
| Less than $300 | 3,386 (56.0%) | 206 (9.3%) |
| $300 to $499 | 398 (6.6%) | 302 (13.7%) |
| $500 to $799 | 929 (15.4%) | 598 (27.1%) |
| $800 to $999 | 659 (10.9%) | 147 (6.7%) |
| $1,000 to $1,499 | 612 (10.1%) | 65 (2.9%) |
| $1,500 to $1,999 | 62 (1.0%) | 0 (0.0%) |
| $2,000 to $2,499 | 0 (0.0%) | 0 (0.0%) |
| $2,500 to $2,999 | 0 (0.0%) | 0 (0.0%) |
| $3,000 or more | 0 (0.0%) | 0 (0.0%) |
| Total | 6,046 (100.0%) | 2,208 (100.0%) |
Physical Housing Characteristics in Barceloneta Municipio
Housing Structures in Barceloneta Municipio
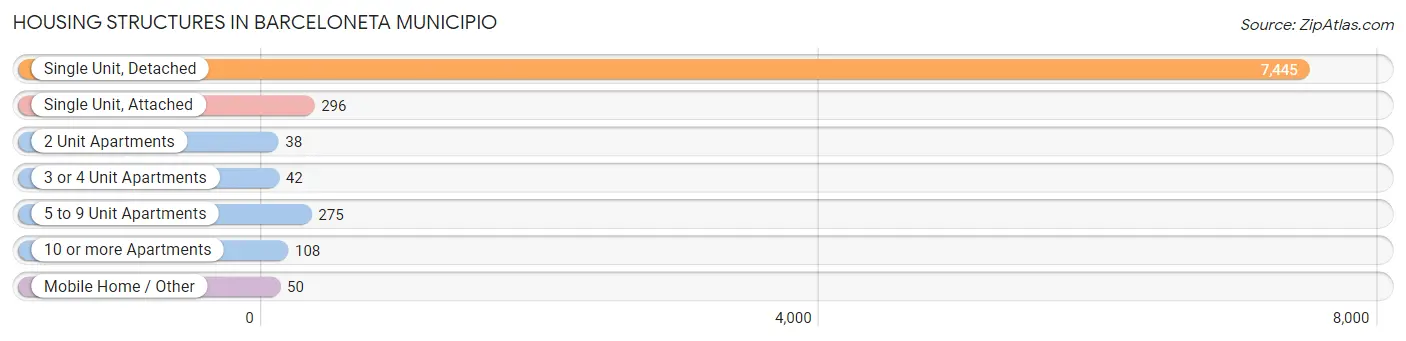
| Structure Type | # Housing Units | % Housing Units |
| Single Unit, Detached | 7,445 | 90.2% |
| Single Unit, Attached | 296 | 3.6% |
| 2 Unit Apartments | 38 | 0.5% |
| 3 or 4 Unit Apartments | 42 | 0.5% |
| 5 to 9 Unit Apartments | 275 | 3.3% |
| 10 or more Apartments | 108 | 1.3% |
| Mobile Home / Other | 50 | 0.6% |
| Total | 8,254 | 100.0% |
Housing Structures by Occupancy in Barceloneta Municipio
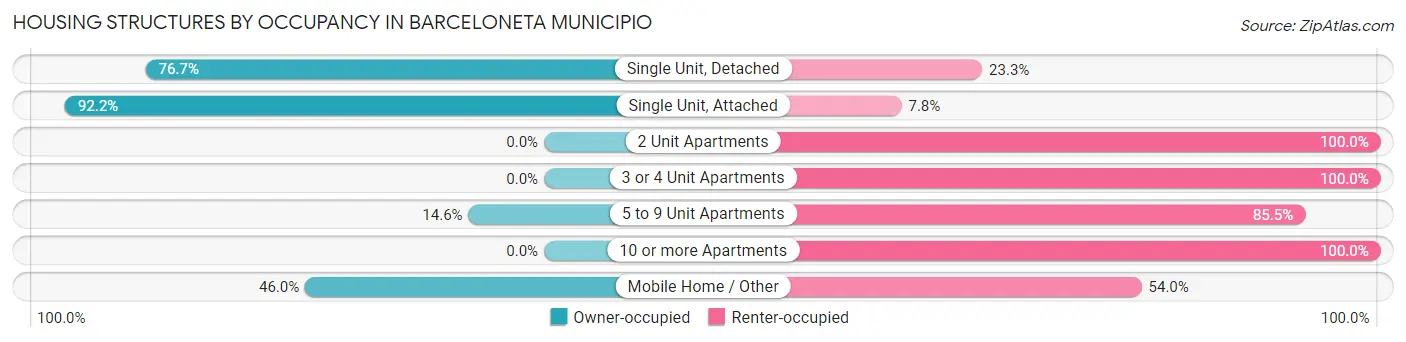
| Structure Type | Owner-occupied | Renter-occupied |
| Single Unit, Detached | 5,710 (76.7%) | 1,735 (23.3%) |
| Single Unit, Attached | 273 (92.2%) | 23 (7.8%) |
| 2 Unit Apartments | 0 (0.0%) | 38 (100.0%) |
| 3 or 4 Unit Apartments | 0 (0.0%) | 42 (100.0%) |
| 5 to 9 Unit Apartments | 40 (14.5%) | 235 (85.5%) |
| 10 or more Apartments | 0 (0.0%) | 108 (100.0%) |
| Mobile Home / Other | 23 (46.0%) | 27 (54.0%) |
| Total | 6,046 (73.3%) | 2,208 (26.8%) |
Housing Structures by Number of Rooms in Barceloneta Municipio
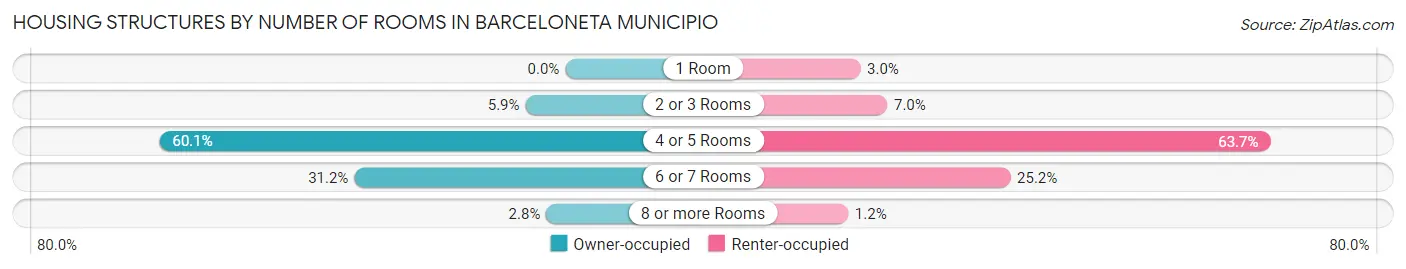
| Number of Rooms | Owner-occupied | Renter-occupied |
| 1 Room | 0 (0.0%) | 66 (3.0%) |
| 2 or 3 Rooms | 357 (5.9%) | 154 (7.0%) |
| 4 or 5 Rooms | 3,631 (60.1%) | 1,406 (63.7%) |
| 6 or 7 Rooms | 1,888 (31.2%) | 556 (25.2%) |
| 8 or more Rooms | 170 (2.8%) | 26 (1.2%) |
| Total | 6,046 (100.0%) | 2,208 (100.0%) |
Housing Structure by Heating Type in Barceloneta Municipio
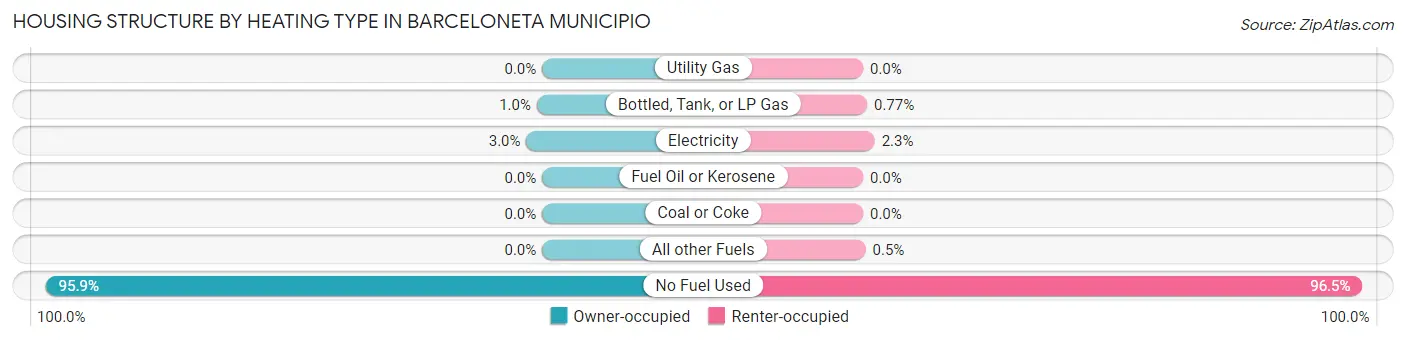
| Heating Type | Owner-occupied | Renter-occupied |
| Utility Gas | 0 (0.0%) | 0 (0.0%) |
| Bottled, Tank, or LP Gas | 62 (1.0%) | 17 (0.8%) |
| Electricity | 184 (3.0%) | 50 (2.3%) |
| Fuel Oil or Kerosene | 0 (0.0%) | 0 (0.0%) |
| Coal or Coke | 0 (0.0%) | 0 (0.0%) |
| All other Fuels | 0 (0.0%) | 11 (0.5%) |
| No Fuel Used | 5,800 (95.9%) | 2,130 (96.5%) |
| Total | 6,046 (100.0%) | 2,208 (100.0%) |
Household Vehicle Usage in Barceloneta Municipio
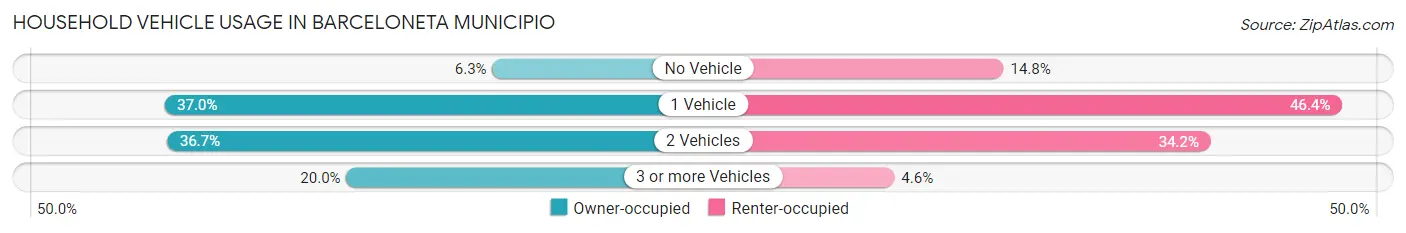
| Vehicles per Household | Owner-occupied | Renter-occupied |
| No Vehicle | 383 (6.3%) | 327 (14.8%) |
| 1 Vehicle | 2,236 (37.0%) | 1,025 (46.4%) |
| 2 Vehicles | 2,220 (36.7%) | 754 (34.2%) |
| 3 or more Vehicles | 1,207 (20.0%) | 102 (4.6%) |
| Total | 6,046 (100.0%) | 2,208 (100.0%) |
Real Estate & Mortgages in Barceloneta Municipio
Real Estate and Mortgage Overview in Barceloneta Municipio
| Characteristic | Without Mortgage | With Mortgage |
| Housing Units | 3,723 | 2,323 |
| Median Property Value | $100,500 | $137,400 |
| Median Household Income | $17,979 | $22 |
| Monthly Housing Costs | $147 | $0 |
| Real Estate Taxes | $676 | $2,110 |
Property Value by Mortgage Status in Barceloneta Municipio
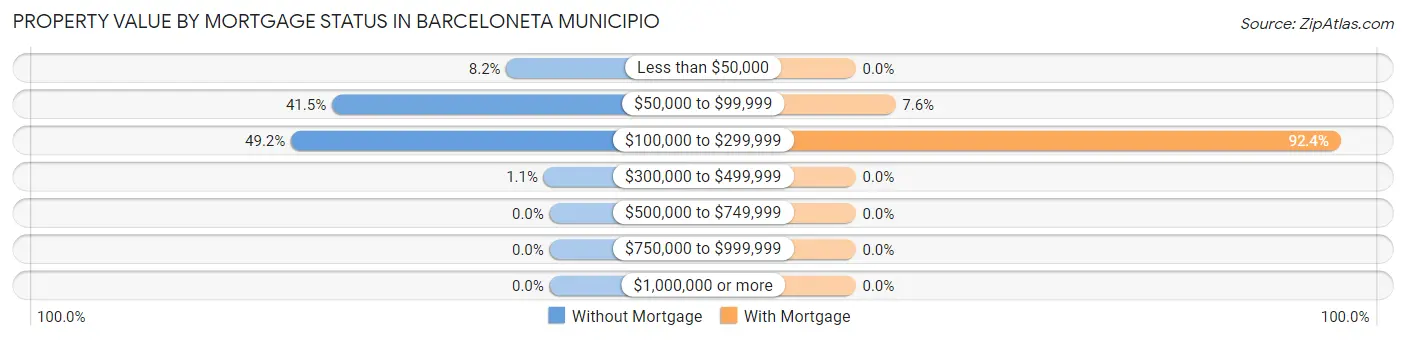
| Property Value | Without Mortgage | With Mortgage |
| Less than $50,000 | 306 (8.2%) | 0 (0.0%) |
| $50,000 to $99,999 | 1,543 (41.4%) | 176 (7.6%) |
| $100,000 to $299,999 | 1,833 (49.2%) | 2,147 (92.4%) |
| $300,000 to $499,999 | 41 (1.1%) | 0 (0.0%) |
| $500,000 to $749,999 | 0 (0.0%) | 0 (0.0%) |
| $750,000 to $999,999 | 0 (0.0%) | 0 (0.0%) |
| $1,000,000 or more | 0 (0.0%) | 0 (0.0%) |
| Total | 3,723 (100.0%) | 2,323 (100.0%) |
Household Income by Mortgage Status in Barceloneta Municipio
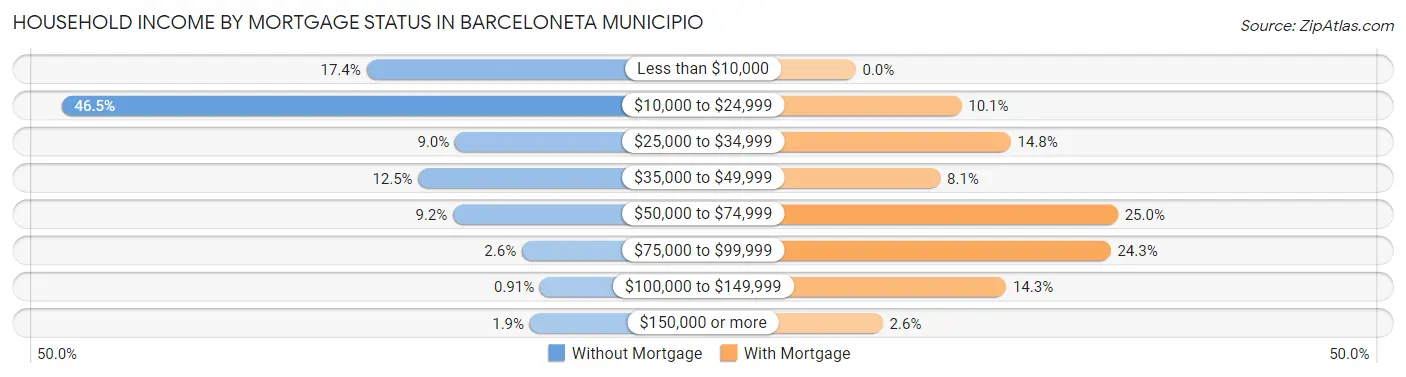
| Household Income | Without Mortgage | With Mortgage |
| Less than $10,000 | 649 (17.4%) | 0 (0.0%) |
| $10,000 to $24,999 | 1,730 (46.5%) | 234 (10.1%) |
| $25,000 to $34,999 | 335 (9.0%) | 343 (14.8%) |
| $35,000 to $49,999 | 465 (12.5%) | 187 (8.1%) |
| $50,000 to $74,999 | 342 (9.2%) | 580 (25.0%) |
| $75,000 to $99,999 | 98 (2.6%) | 564 (24.3%) |
| $100,000 to $149,999 | 34 (0.9%) | 333 (14.3%) |
| $150,000 or more | 70 (1.9%) | 60 (2.6%) |
| Total | 3,723 (100.0%) | 2,323 (100.0%) |
Property Value to Household Income Ratio in Barceloneta Municipio
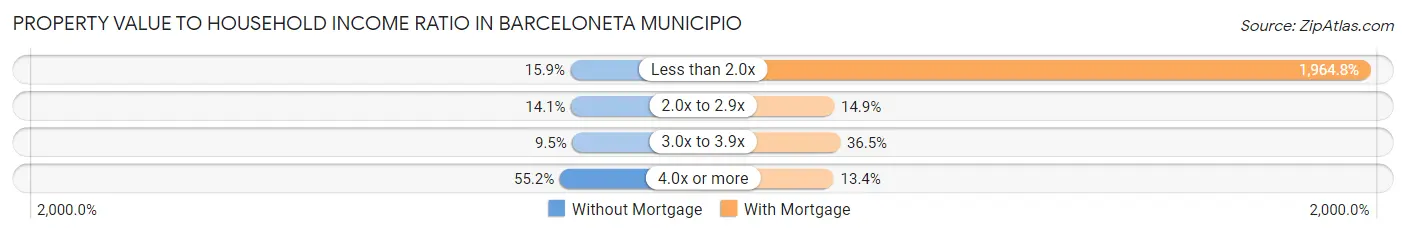
| Value-to-Income Ratio | Without Mortgage | With Mortgage |
| Less than 2.0x | 591 (15.9%) | 45,642 (1,964.8%) |
| 2.0x to 2.9x | 524 (14.1%) | 347 (14.9%) |
| 3.0x to 3.9x | 352 (9.5%) | 847 (36.5%) |
| 4.0x or more | 2,054 (55.2%) | 312 (13.4%) |
| Total | 3,723 (100.0%) | 2,323 (100.0%) |
Real Estate Taxes by Mortgage Status in Barceloneta Municipio
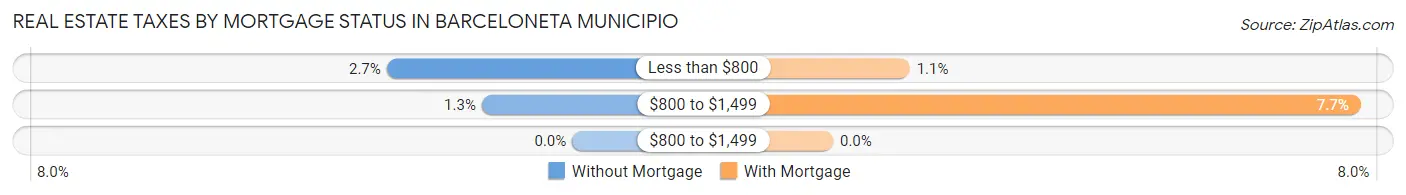
| Property Taxes | Without Mortgage | With Mortgage |
| Less than $800 | 101 (2.7%) | 26 (1.1%) |
| $800 to $1,499 | 49 (1.3%) | 179 (7.7%) |
| $800 to $1,499 | 0 (0.0%) | 0 (0.0%) |
| Total | 3,723 (100.0%) | 2,323 (100.0%) |
Health & Disability in Barceloneta Municipio
Health Insurance Coverage by Age in Barceloneta Municipio
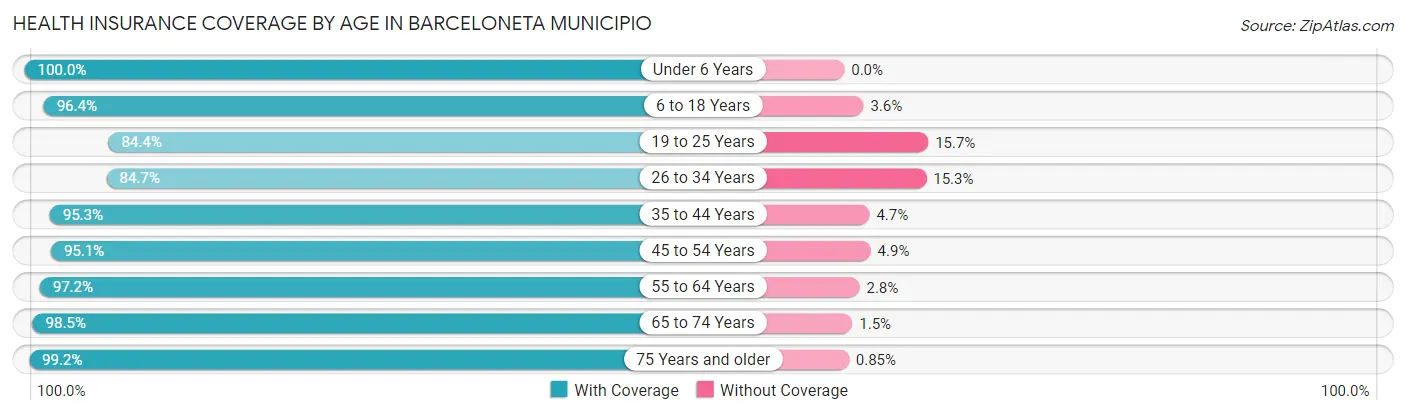
| Age Bracket | With Coverage | Without Coverage |
| Under 6 Years | 953 (100.0%) | 0 (0.0%) |
| 6 to 18 Years | 3,219 (96.4%) | 119 (3.6%) |
| 19 to 25 Years | 1,919 (84.4%) | 356 (15.7%) |
| 26 to 34 Years | 2,338 (84.7%) | 422 (15.3%) |
| 35 to 44 Years | 2,816 (95.3%) | 139 (4.7%) |
| 45 to 54 Years | 2,901 (95.1%) | 150 (4.9%) |
| 55 to 64 Years | 2,535 (97.2%) | 74 (2.8%) |
| 65 to 74 Years | 2,372 (98.5%) | 36 (1.5%) |
| 75 Years and older | 2,222 (99.2%) | 19 (0.9%) |
| Total | 21,275 (94.2%) | 1,315 (5.8%) |
Health Insurance Coverage by Citizenship Status in Barceloneta Municipio
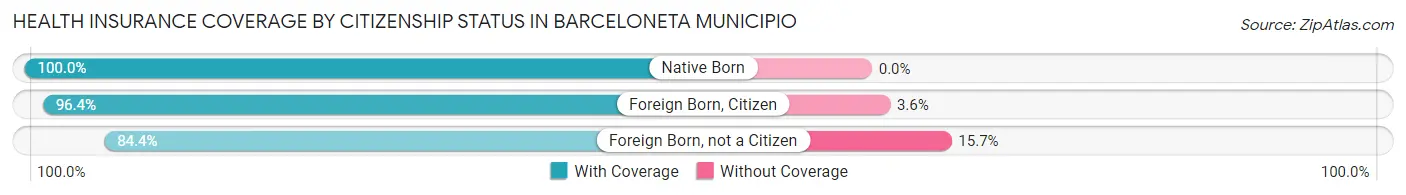
| Citizenship Status | With Coverage | Without Coverage |
| Native Born | 953 (100.0%) | 0 (0.0%) |
| Foreign Born, Citizen | 3,219 (96.4%) | 119 (3.6%) |
| Foreign Born, not a Citizen | 1,919 (84.4%) | 356 (15.7%) |
Health Insurance Coverage by Household Income in Barceloneta Municipio
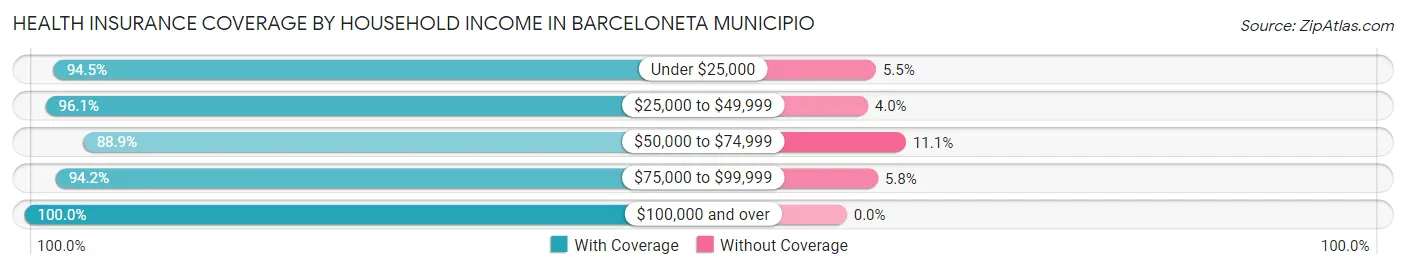
| Household Income | With Coverage | Without Coverage |
| Under $25,000 | 10,842 (94.5%) | 626 (5.5%) |
| $25,000 to $49,999 | 4,987 (96.1%) | 205 (4.0%) |
| $50,000 to $74,999 | 3,192 (88.9%) | 398 (11.1%) |
| $75,000 to $99,999 | 1,387 (94.2%) | 86 (5.8%) |
| $100,000 and over | 860 (100.0%) | 0 (0.0%) |
Public vs Private Health Insurance Coverage by Age in Barceloneta Municipio
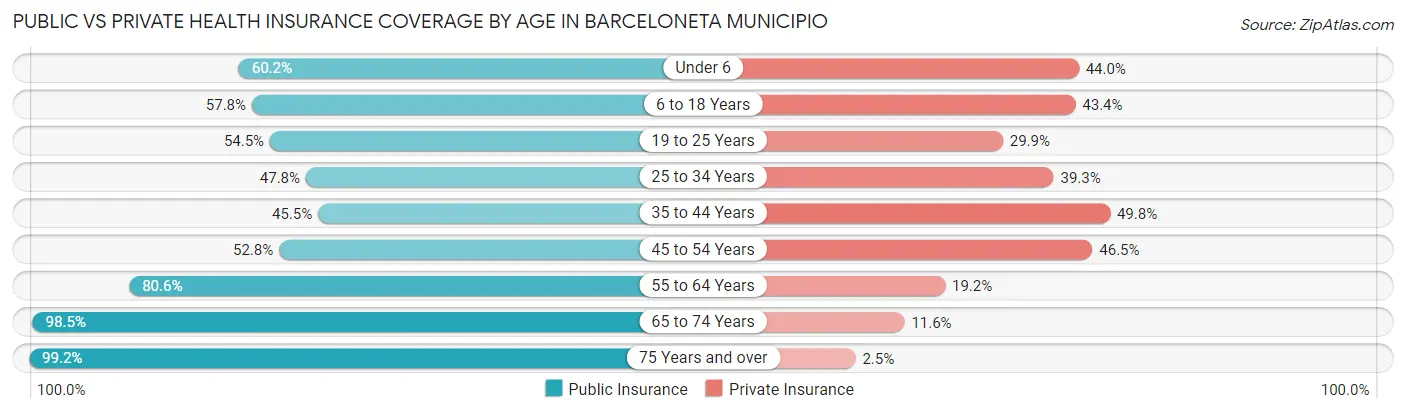
| Age Bracket | Public Insurance | Private Insurance |
| Under 6 | 574 (60.2%) | 419 (44.0%) |
| 6 to 18 Years | 1,930 (57.8%) | 1,447 (43.3%) |
| 19 to 25 Years | 1,239 (54.5%) | 680 (29.9%) |
| 25 to 34 Years | 1,319 (47.8%) | 1,085 (39.3%) |
| 35 to 44 Years | 1,345 (45.5%) | 1,471 (49.8%) |
| 45 to 54 Years | 1,610 (52.8%) | 1,419 (46.5%) |
| 55 to 64 Years | 2,102 (80.6%) | 500 (19.2%) |
| 65 to 74 Years | 2,372 (98.5%) | 280 (11.6%) |
| 75 Years and over | 2,222 (99.2%) | 57 (2.5%) |
| Total | 14,713 (65.1%) | 7,358 (32.6%) |
Disability Status by Sex by Age in Barceloneta Municipio
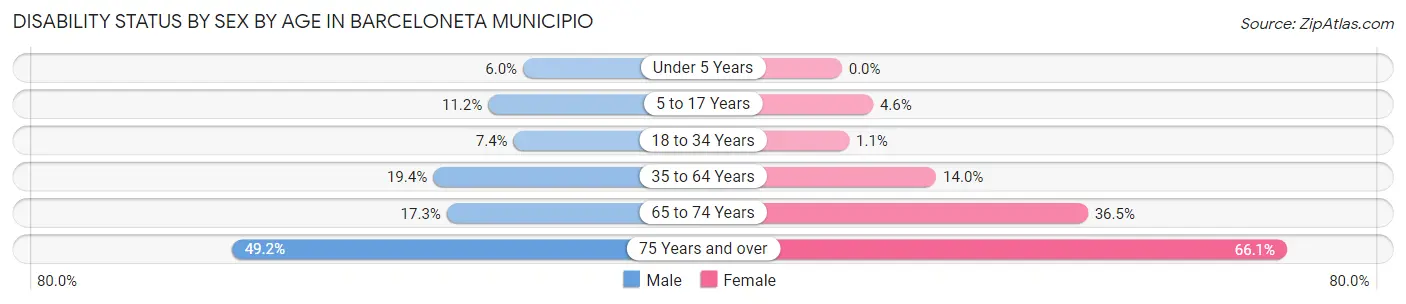
| Age Bracket | Male | Female |
| Under 5 Years | 25 (6.0%) | 0 (0.0%) |
| 5 to 17 Years | 182 (11.2%) | 73 (4.6%) |
| 18 to 34 Years | 187 (7.4%) | 30 (1.1%) |
| 35 to 64 Years | 774 (19.4%) | 647 (14.0%) |
| 65 to 74 Years | 191 (17.3%) | 477 (36.5%) |
| 75 Years and over | 485 (49.2%) | 830 (66.1%) |
Disability Class by Sex by Age in Barceloneta Municipio
Disability Class: Hearing Difficulty
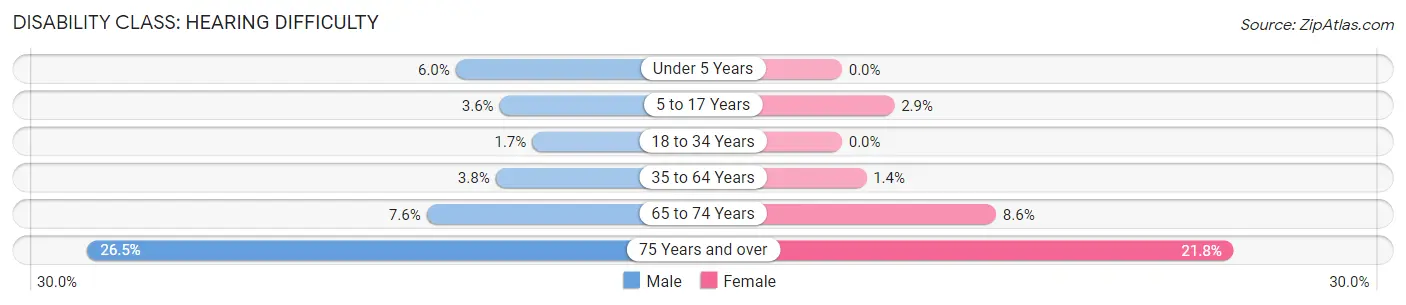
| Age Bracket | Male | Female |
| Under 5 Years | 25 (6.0%) | 0 (0.0%) |
| 5 to 17 Years | 58 (3.6%) | 46 (2.9%) |
| 18 to 34 Years | 44 (1.7%) | 0 (0.0%) |
| 35 to 64 Years | 151 (3.8%) | 63 (1.4%) |
| 65 to 74 Years | 84 (7.6%) | 112 (8.6%) |
| 75 Years and over | 261 (26.5%) | 274 (21.8%) |
Disability Class: Vision Difficulty
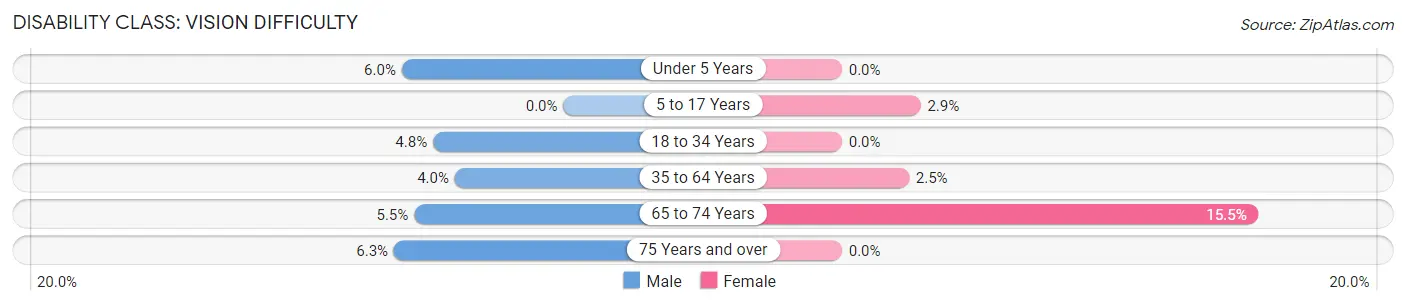
| Age Bracket | Male | Female |
| Under 5 Years | 25 (6.0%) | 0 (0.0%) |
| 5 to 17 Years | 0 (0.0%) | 46 (2.9%) |
| 18 to 34 Years | 122 (4.8%) | 0 (0.0%) |
| 35 to 64 Years | 161 (4.0%) | 115 (2.5%) |
| 65 to 74 Years | 61 (5.5%) | 202 (15.5%) |
| 75 Years and over | 62 (6.3%) | 0 (0.0%) |
Disability Class: Cognitive Difficulty
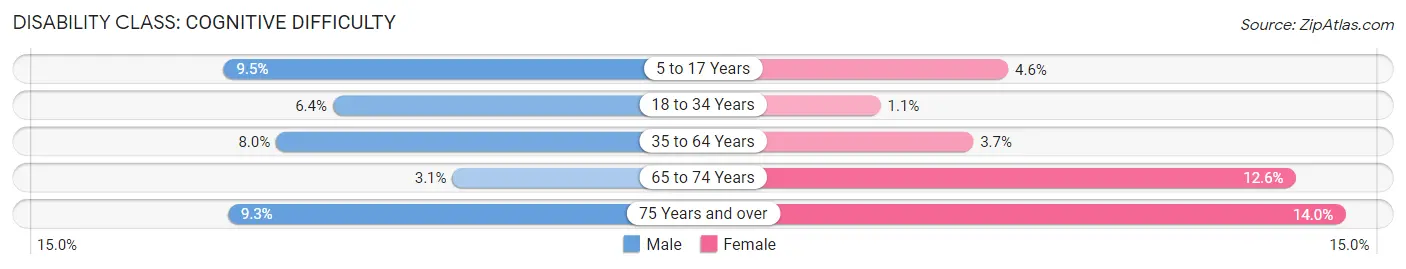
| Age Bracket | Male | Female |
| 5 to 17 Years | 154 (9.5%) | 73 (4.6%) |
| 18 to 34 Years | 162 (6.4%) | 30 (1.1%) |
| 35 to 64 Years | 320 (8.0%) | 169 (3.7%) |
| 65 to 74 Years | 34 (3.1%) | 165 (12.6%) |
| 75 Years and over | 92 (9.3%) | 176 (14.0%) |
Disability Class: Ambulatory Difficulty
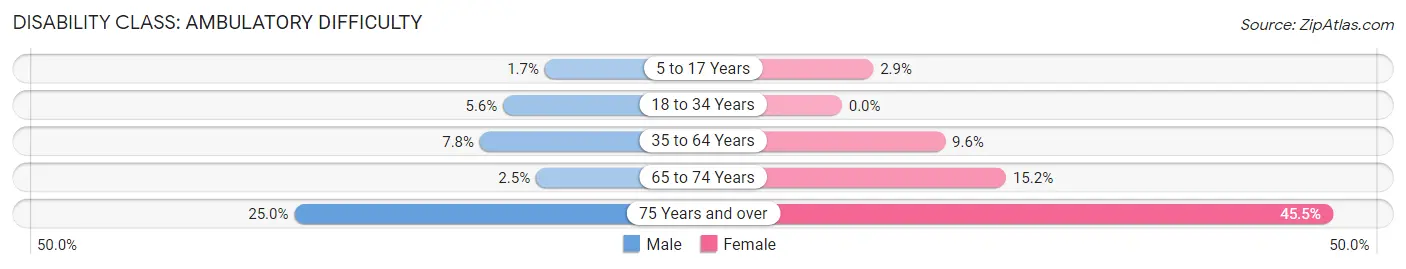
| Age Bracket | Male | Female |
| 5 to 17 Years | 28 (1.7%) | 46 (2.9%) |
| 18 to 34 Years | 141 (5.6%) | 0 (0.0%) |
| 35 to 64 Years | 310 (7.7%) | 443 (9.6%) |
| 65 to 74 Years | 28 (2.5%) | 199 (15.2%) |
| 75 Years and over | 246 (25.0%) | 572 (45.5%) |
Disability Class: Self-Care Difficulty
| Age Bracket | Male | Female |
| 5 to 17 Years | 28 (1.7%) | 46 (2.9%) |
| 18 to 34 Years | 97 (3.8%) | 30 (1.1%) |
| 35 to 64 Years | 260 (6.5%) | 130 (2.8%) |
| 65 to 74 Years | 32 (2.9%) | 23 (1.8%) |
| 75 Years and over | 71 (7.2%) | 181 (14.4%) |
Technology Access in Barceloneta Municipio
Computing Device Access in Barceloneta Municipio
| Device Type | # Households | % Households |
| Desktop or Laptop | 3,663 | 44.4% |
| Smartphone | 6,506 | 78.8% |
| Tablet | 3,293 | 39.9% |
| No Computing Device | 1,585 | 19.2% |
| Total | 8,254 | 100.0% |
Internet Access in Barceloneta Municipio
| Internet Type | # Households | % Households |
| Dial-Up Internet | 0 | 0.0% |
| Broadband Home | 4,023 | 48.7% |
| Cellular Data Only | 1,662 | 20.1% |
| Satellite Internet | 198 | 2.4% |
| No Internet | 2,374 | 28.8% |
| Total | 8,254 | 100.0% |
Barceloneta Municipio Summary
Barceloneta Municipio is located in the northern region of Puerto Rico, and is part of the San Juan-Caguas-Guaynabo Metropolitan Statistical Area. It is bordered by the municipalities of Arecibo, Manatí, and Vega Baja. The municipality has a total area of 28.2 square miles, and a population of approximately 28,000 people.
History
The area that is now Barceloneta Municipio was originally inhabited by the Taíno people, who were the indigenous people of Puerto Rico. The Taíno people were eventually displaced by Spanish settlers in the 16th century. The area was then known as Barceloneta, named after the Spanish city of Barcelona. The area was officially established as a municipality in 1881.
Geography
Barceloneta Municipio is located in the northern region of Puerto Rico, and is part of the San Juan-Caguas-Guaynabo Metropolitan Statistical Area. It is bordered by the municipalities of Arecibo, Manatí, and Vega Baja. The municipality has a total area of 28.2 square miles, and is located at an elevation of approximately 200 feet above sea level. The terrain is mostly flat, with some hills in the northern part of the municipality. The climate is tropical, with temperatures ranging from the mid-70s to the mid-80s Fahrenheit.
Economy
The economy of Barceloneta Municipio is largely based on agriculture and manufacturing. The main agricultural products grown in the area include sugarcane, bananas, coffee, and tobacco. The manufacturing sector is dominated by the production of pharmaceuticals, electronics, and food products. The municipality also has a thriving tourism industry, with many visitors coming to the area to enjoy its beaches and other attractions.
Demographics
As of the 2010 census, the population of Barceloneta Municipio was 28,039. The population is predominantly of Hispanic origin, with the majority being of Puerto Rican descent. The median household income in the municipality is $20,845, and the median age is 37. The unemployment rate in the municipality is 8.3%, which is slightly higher than the national average.
Conclusion
Barceloneta Municipio is a small municipality located in the northern region of Puerto Rico. It has a total area of 28.2 square miles, and a population of approximately 28,000 people. The economy of the municipality is largely based on agriculture and manufacturing, and it also has a thriving tourism industry. The population is predominantly of Hispanic origin, with the majority being of Puerto Rican descent. The median household income in the municipality is $20,845, and the median age is 37.
Common Questions
What is Per Capita Income in Barceloneta Municipio?
Per Capita income in Barceloneta Municipio is $13,368.
What is the Median Family Income in Barceloneta Municipio?
Median Family Income in Barceloneta Municipio is $22,309.
What is the Median Household income in Barceloneta Municipio?
Median Household Income in Barceloneta Municipio is $20,282.
What is Income or Wage Gap in Barceloneta Municipio?
Income or Wage Gap in Barceloneta Municipio is 0.7%.
Women in Barceloneta Municipio earn 99.3 cents for every dollar earned by a man.
What is Family Income Deficit in Barceloneta Municipio?
Family Income Deficit in Barceloneta Municipio is $11,220.
Families that are below poverty line in Barceloneta Municipio earn $11,220 less on average than the poverty threshold level.
What is Inequality or Gini Index in Barceloneta Municipio?
Inequality or Gini Index in Barceloneta Municipio is 0.50.
What is the Total Population of Barceloneta Municipio?
Total Population of Barceloneta Municipio is 22,604.
What is the Total Male Population of Barceloneta Municipio?
Total Male Population of Barceloneta Municipio is 10,661.
What is the Total Female Population of Barceloneta Municipio?
Total Female Population of Barceloneta Municipio is 11,943.
What is the Ratio of Males per 100 Females in Barceloneta Municipio?
There are 89.27 Males per 100 Females in Barceloneta Municipio.
What is the Ratio of Females per 100 Males in Barceloneta Municipio?
There are 112.03 Females per 100 Males in Barceloneta Municipio.
What is the Median Population Age in Barceloneta Municipio?
Median Population Age in Barceloneta Municipio is 42.7 Years.
What is the Average Family Size in Barceloneta Municipio
Average Family Size in Barceloneta Municipio is 3.2 People.
What is the Average Household Size in Barceloneta Municipio
Average Household Size in Barceloneta Municipio is 2.7 People.
How Large is the Labor Force in Barceloneta Municipio?
There are 8,214 People in the Labor Forcein in Barceloneta Municipio.
What is the Percentage of People in the Labor Force in Barceloneta Municipio?
43.1% of People are in the Labor Force in Barceloneta Municipio.
What is the Unemployment Rate in Barceloneta Municipio?
Unemployment Rate in Barceloneta Municipio is 15.8%.