Aguadilla Municipio, PR Map & Demographics
Aguadilla Municipio Map
Aguadilla Municipio Overview
$12,887
PER CAPITA INCOME
$23,972
AVG FAMILY INCOME
$18,348
AVG HOUSEHOLD INCOME
4.9%
WAGE / INCOME GAP [ % ]
95.1¢/ $1
WAGE / INCOME GAP [ $ ]
$12,118
FAMILY INCOME DEFICIT
0.55
INEQUALITY / GINI INDEX
54,752
TOTAL POPULATION
26,561
MALE POPULATION
28,191
FEMALE POPULATION
94.22
MALES / 100 FEMALES
106.14
FEMALES / 100 MALES
44.0
MEDIAN AGE
3.1
AVG FAMILY SIZE
2.5
AVG HOUSEHOLD SIZE
17,966
LABOR FORCE [ PEOPLE ]
38.6%
PERCENT IN LABOR FORCE
15.5%
UNEMPLOYMENT RATE
Aguadilla Municipio Area Codes
Income in Aguadilla Municipio
Income Overview in Aguadilla Municipio
Per Capita Income in Aguadilla Municipio is $12,887, while median incomes of families and households are $23,972 and $18,348 respectively.
| Characteristic | Number | Measure |
| Per Capita Income | 54,752 | $12,887 |
| Median Family Income | 14,202 | $23,972 |
| Mean Family Income | 14,202 | $35,978 |
| Median Household Income | 21,650 | $18,348 |
| Mean Household Income | 21,650 | $30,605 |
| Income Deficit | 14,202 | $12,118 |
| Wage / Income Gap (%) | 54,752 | 4.93% |
| Wage / Income Gap ($) | 54,752 | 95.07¢ per $1 |
| Gini / Inequality Index | 54,752 | 0.55 |
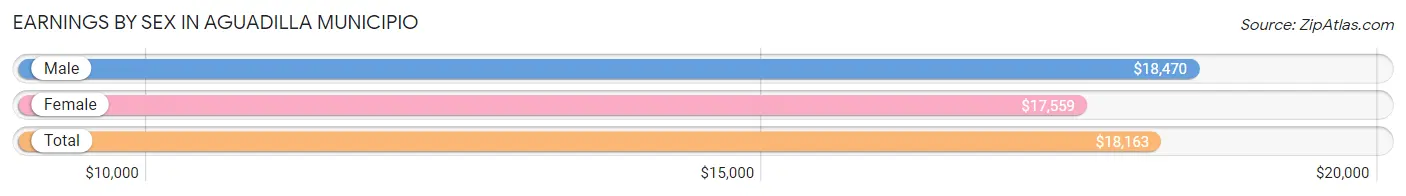
Earnings by Sex in Aguadilla Municipio
Average Earnings in Aguadilla Municipio are $18,163, $18,470 for men and $17,559 for women, a difference of 4.9%.
| Sex | Number | Average Earnings |
| Male | 9,205 (55.2%) | $18,470 |
| Female | 7,483 (44.8%) | $17,559 |
| Total | 16,688 (100.0%) | $18,163 |
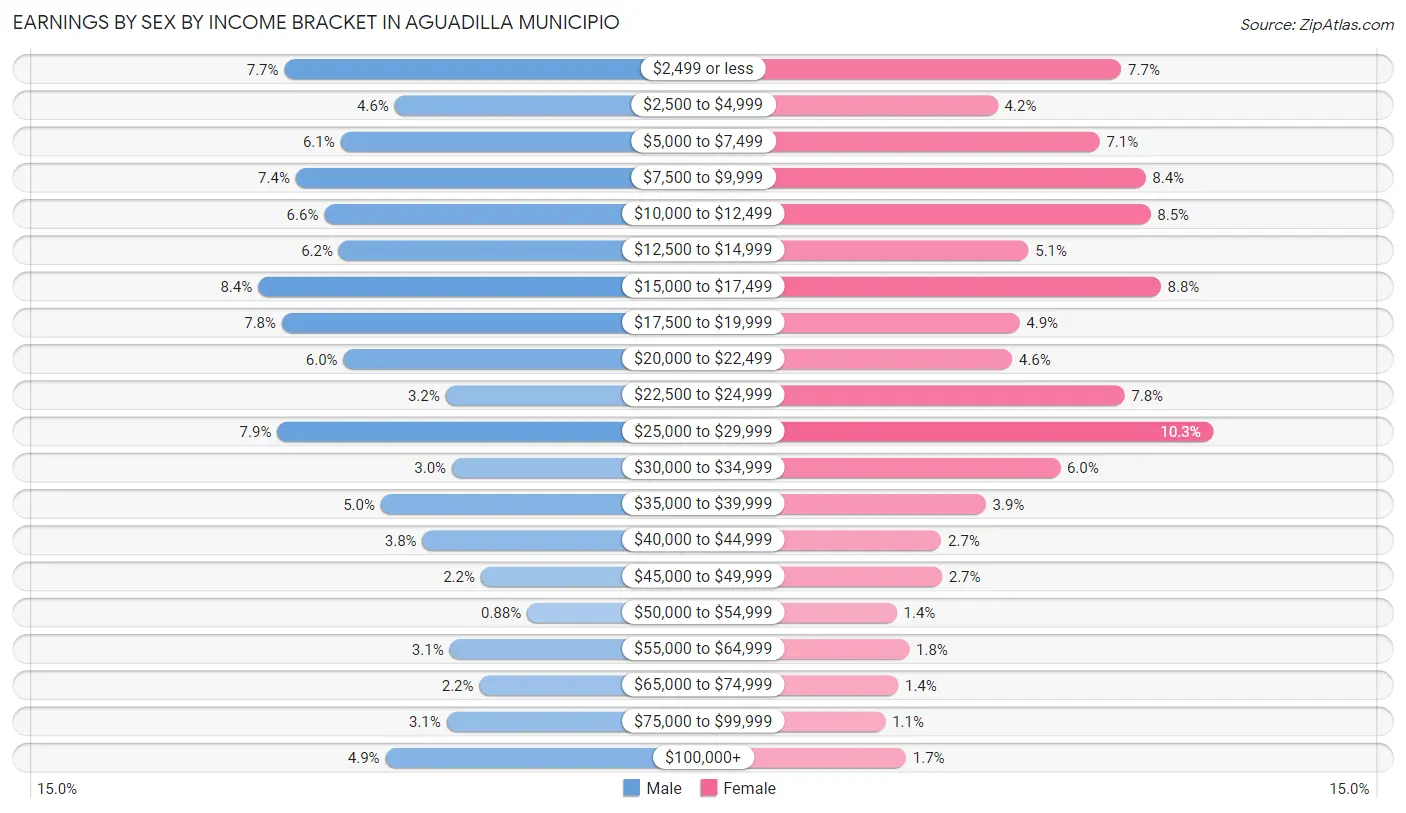
Earnings by Sex by Income Bracket in Aguadilla Municipio
The most common earnings brackets in Aguadilla Municipio are $15,000 to $17,499 for men (777 | 8.4%) and $25,000 to $29,999 for women (769 | 10.3%).
| Income | Male | Female |
| $2,499 or less | 709 (7.7%) | 577 (7.7%) |
| $2,500 to $4,999 | 423 (4.6%) | 317 (4.2%) |
| $5,000 to $7,499 | 563 (6.1%) | 531 (7.1%) |
| $7,500 to $9,999 | 679 (7.4%) | 628 (8.4%) |
| $10,000 to $12,499 | 606 (6.6%) | 638 (8.5%) |
| $12,500 to $14,999 | 568 (6.2%) | 382 (5.1%) |
| $15,000 to $17,499 | 777 (8.4%) | 660 (8.8%) |
| $17,500 to $19,999 | 715 (7.8%) | 363 (4.9%) |
| $20,000 to $22,499 | 556 (6.0%) | 347 (4.6%) |
| $22,500 to $24,999 | 292 (3.2%) | 584 (7.8%) |
| $25,000 to $29,999 | 727 (7.9%) | 769 (10.3%) |
| $30,000 to $34,999 | 275 (3.0%) | 448 (6.0%) |
| $35,000 to $39,999 | 459 (5.0%) | 292 (3.9%) |
| $40,000 to $44,999 | 352 (3.8%) | 198 (2.6%) |
| $45,000 to $49,999 | 201 (2.2%) | 200 (2.7%) |
| $50,000 to $54,999 | 81 (0.9%) | 105 (1.4%) |
| $55,000 to $64,999 | 282 (3.1%) | 131 (1.8%) |
| $65,000 to $74,999 | 204 (2.2%) | 108 (1.4%) |
| $75,000 to $99,999 | 289 (3.1%) | 81 (1.1%) |
| $100,000+ | 447 (4.9%) | 124 (1.7%) |
| Total | 9,205 (100.0%) | 7,483 (100.0%) |
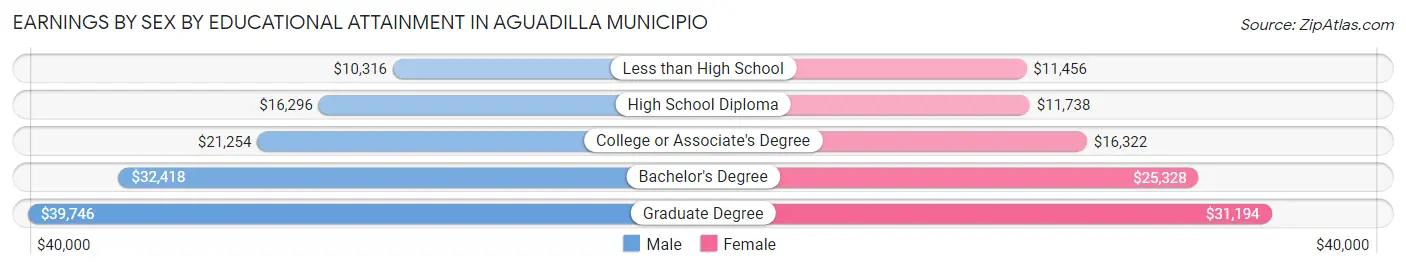
Earnings by Sex by Educational Attainment in Aguadilla Municipio
Average earnings in Aguadilla Municipio are $19,830 for men and $19,622 for women, a difference of 1.1%. Men with an educational attainment of graduate degree enjoy the highest average annual earnings of $39,746, while those with less than high school education earn the least with $10,316. Women with an educational attainment of graduate degree earn the most with the average annual earnings of $31,194, while those with less than high school education have the smallest earnings of $11,456.
| Educational Attainment | Male Income | Female Income |
| Less than High School | $10,316 | $11,456 |
| High School Diploma | $16,296 | $11,738 |
| College or Associate's Degree | $21,254 | $16,322 |
| Bachelor's Degree | $32,418 | $25,328 |
| Graduate Degree | $39,746 | $31,194 |
| Total | $19,830 | $19,622 |
Family Income in Aguadilla Municipio
Family Income Brackets in Aguadilla Municipio
According to the Aguadilla Municipio family income data, there are 3,494 families falling into the less than $10,000 income range, which is the most common income bracket and makes up 24.6% of all families. Conversely, the $200,000+ income bracket is the least frequent group with only 142 families (1.0%) belonging to this category.
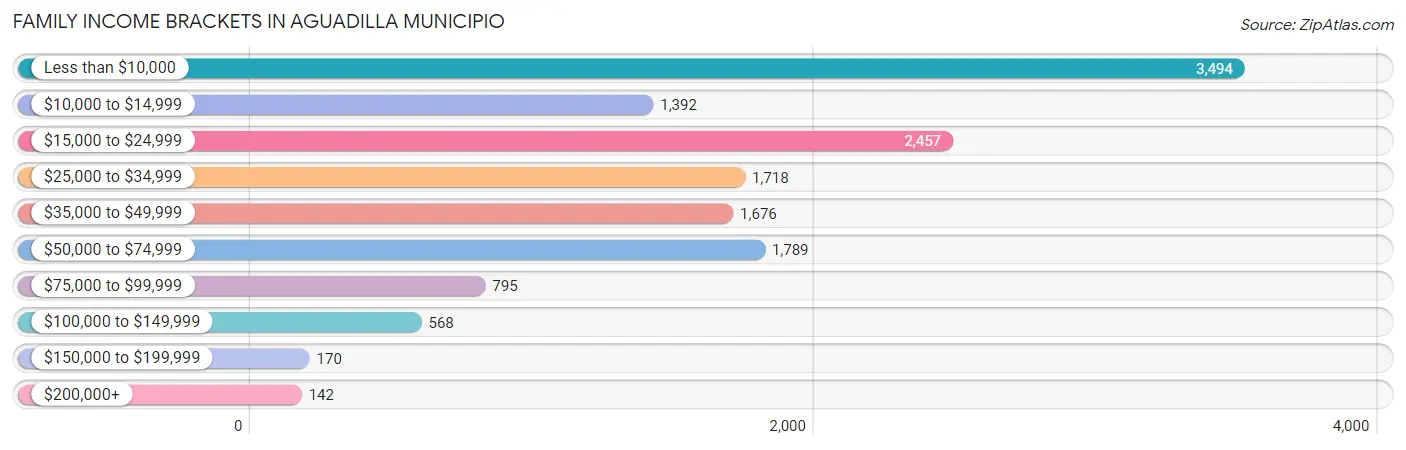
| Income Bracket | # Families | % Families |
| Less than $10,000 | 3,494 | 24.6% |
| $10,000 to $14,999 | 1,392 | 9.8% |
| $15,000 to $24,999 | 2,457 | 17.3% |
| $25,000 to $34,999 | 1,718 | 12.1% |
| $35,000 to $49,999 | 1,676 | 11.8% |
| $50,000 to $74,999 | 1,789 | 12.6% |
| $75,000 to $99,999 | 795 | 5.6% |
| $100,000 to $149,999 | 568 | 4.0% |
| $150,000 to $199,999 | 170 | 1.2% |
| $200,000+ | 142 | 1.0% |
Family Income by Famaliy Size in Aguadilla Municipio
5-person families (615 | 4.3%) account for the highest median family income in Aguadilla Municipio with $39,955 per family, while 2-person families (7,001 | 49.3%) have the highest median income of $9,894 per family member.
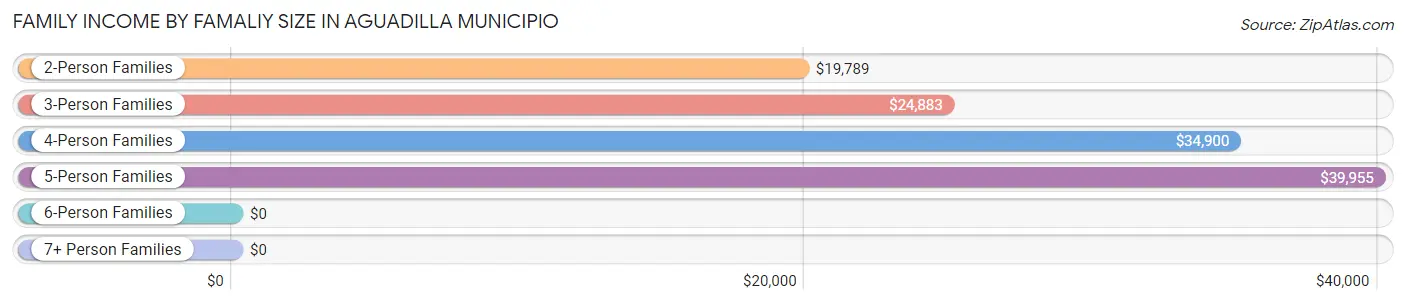
| Income Bracket | # Families | Median Income |
| 2-Person Families | 7,001 (49.3%) | $19,789 |
| 3-Person Families | 4,346 (30.6%) | $24,883 |
| 4-Person Families | 2,006 (14.1%) | $34,900 |
| 5-Person Families | 615 (4.3%) | $39,955 |
| 6-Person Families | 201 (1.4%) | $0 |
| 7+ Person Families | 33 (0.2%) | $0 |
| Total | 14,202 (100.0%) | $23,972 |
Family Income by Number of Earners in Aguadilla Municipio
The median family income in Aguadilla Municipio is $23,972, with families comprising 3+ earners (732) having the highest median family income of $64,049, while families with no earners (6,077) have the lowest median family income of $13,740, accounting for 5.1% and 42.8% of families, respectively.
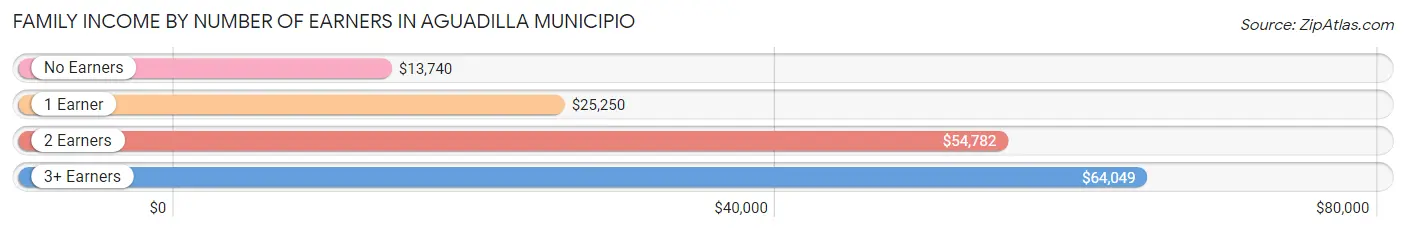
| Number of Earners | # Families | Median Income |
| No Earners | 6,077 (42.8%) | $13,740 |
| 1 Earner | 4,976 (35.0%) | $25,250 |
| 2 Earners | 2,417 (17.0%) | $54,782 |
| 3+ Earners | 732 (5.1%) | $64,049 |
| Total | 14,202 (100.0%) | $23,972 |
Household Income in Aguadilla Municipio
Household Income Brackets in Aguadilla Municipio
With 6,343 households falling in the category, the less than $10,000 income range is the most frequent in Aguadilla Municipio, accounting for 29.3% of all households. In contrast, only 173 households (0.8%) fall into the $200,000+ income bracket, making it the least populous group.
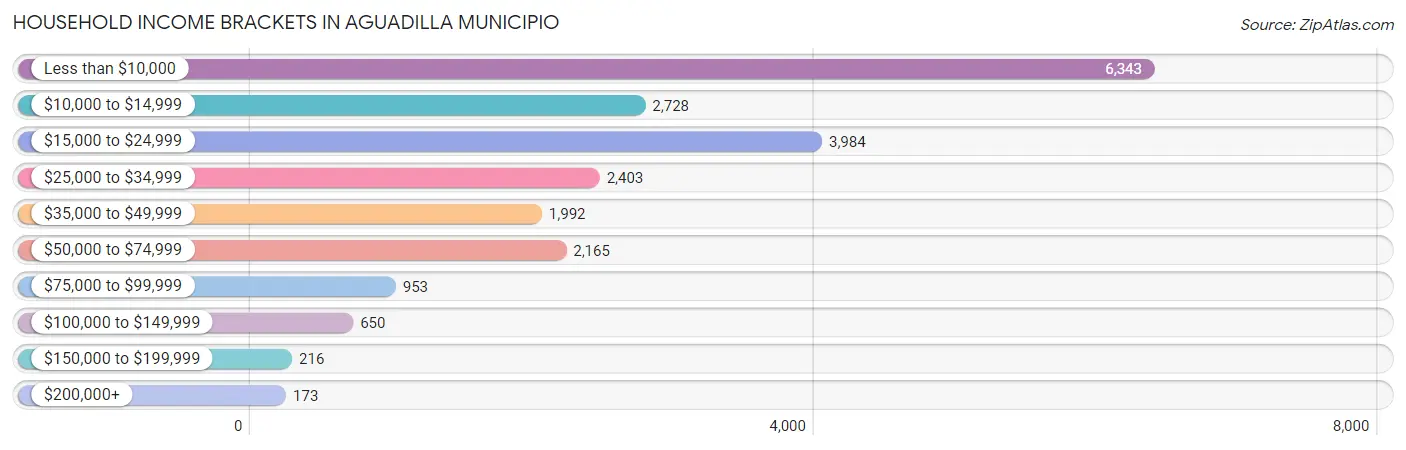
| Income Bracket | # Households | % Households |
| Less than $10,000 | 6,343 | 29.3% |
| $10,000 to $14,999 | 2,728 | 12.6% |
| $15,000 to $24,999 | 3,984 | 18.4% |
| $25,000 to $34,999 | 2,403 | 11.1% |
| $35,000 to $49,999 | 1,992 | 9.2% |
| $50,000 to $74,999 | 2,165 | 10.0% |
| $75,000 to $99,999 | 953 | 4.4% |
| $100,000 to $149,999 | 650 | 3.0% |
| $150,000 to $199,999 | 216 | 1.0% |
| $200,000+ | 173 | 0.8% |
Household Income by Householder Age in Aguadilla Municipio
The median household income in Aguadilla Municipio is $18,348, with the highest median household income of $22,668 found in the 45 to 64 years age bracket for the primary householder. A total of 7,992 households (36.9%) fall into this category. Meanwhile, the 15 to 24 years age bracket for the primary householder has the lowest median household income of $2,499, with 494 households (2.3%) in this group.
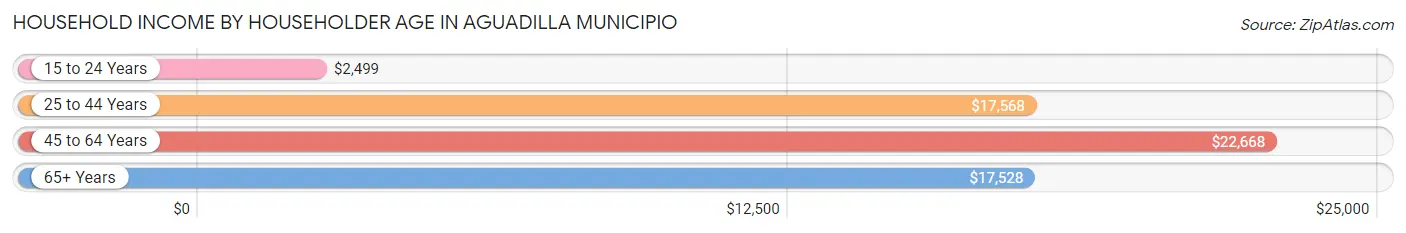
| Income Bracket | # Households | Median Income |
| 15 to 24 Years | 494 (2.3%) | $2,499 |
| 25 to 44 Years | 5,250 (24.2%) | $17,568 |
| 45 to 64 Years | 7,992 (36.9%) | $22,668 |
| 65+ Years | 7,914 (36.5%) | $17,528 |
| Total | 21,650 (100.0%) | $18,348 |
Poverty in Aguadilla Municipio
Income Below Poverty by Sex and Age in Aguadilla Municipio
With 45.5% poverty level for males and 51.6% for females among the residents of Aguadilla Municipio, under 5 year old males and 5 year old females are the most vulnerable to poverty, with 722 males (75.9%) and 92 females (82.1%) in their respective age groups living below the poverty level.
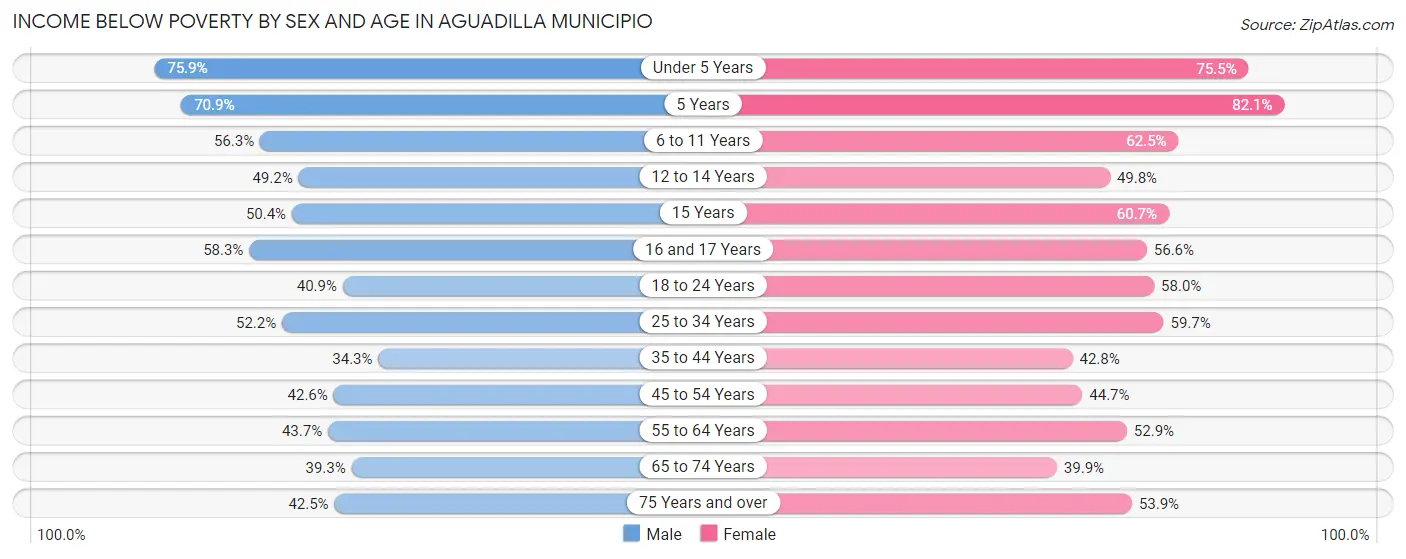
| Age Bracket | Male | Female |
| Under 5 Years | 722 (75.9%) | 675 (75.5%) |
| 5 Years | 139 (70.9%) | 92 (82.1%) |
| 6 to 11 Years | 923 (56.3%) | 916 (62.5%) |
| 12 to 14 Years | 526 (49.2%) | 550 (49.8%) |
| 15 Years | 200 (50.4%) | 207 (60.7%) |
| 16 and 17 Years | 407 (58.3%) | 342 (56.6%) |
| 18 to 24 Years | 1,110 (40.9%) | 1,363 (58.0%) |
| 25 to 34 Years | 1,711 (52.2%) | 1,961 (59.7%) |
| 35 to 44 Years | 1,021 (34.3%) | 1,478 (42.8%) |
| 45 to 54 Years | 1,338 (42.6%) | 1,639 (44.7%) |
| 55 to 64 Years | 1,433 (43.7%) | 2,121 (52.9%) |
| 65 to 74 Years | 1,232 (39.3%) | 1,472 (39.9%) |
| 75 Years and over | 1,078 (42.5%) | 1,660 (53.9%) |
| Total | 11,840 (45.5%) | 14,476 (51.6%) |
Income Above Poverty by Sex and Age in Aguadilla Municipio
According to the poverty statistics in Aguadilla Municipio, males aged 35 to 44 years and females aged 65 to 74 years are the age groups that are most secure financially, with 65.7% of males and 60.1% of females in these age groups living above the poverty line.
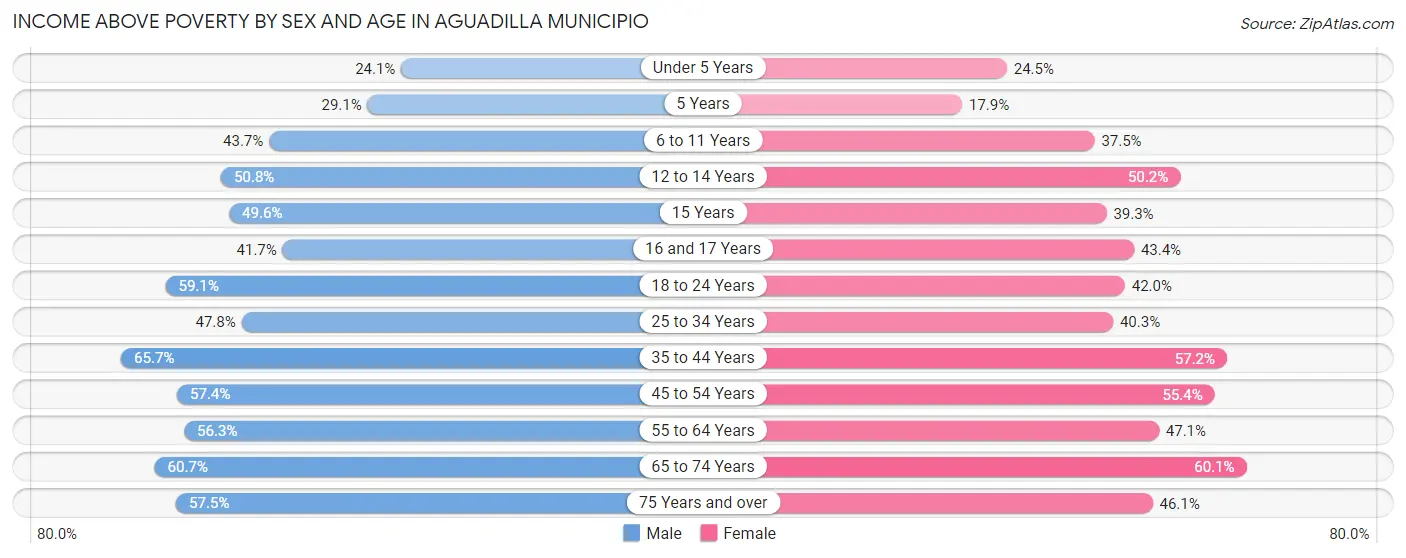
| Age Bracket | Male | Female |
| Under 5 Years | 229 (24.1%) | 219 (24.5%) |
| 5 Years | 57 (29.1%) | 20 (17.9%) |
| 6 to 11 Years | 716 (43.7%) | 550 (37.5%) |
| 12 to 14 Years | 544 (50.8%) | 555 (50.2%) |
| 15 Years | 197 (49.6%) | 134 (39.3%) |
| 16 and 17 Years | 291 (41.7%) | 262 (43.4%) |
| 18 to 24 Years | 1,602 (59.1%) | 988 (42.0%) |
| 25 to 34 Years | 1,566 (47.8%) | 1,322 (40.3%) |
| 35 to 44 Years | 1,952 (65.7%) | 1,973 (57.2%) |
| 45 to 54 Years | 1,800 (57.4%) | 2,032 (55.3%) |
| 55 to 64 Years | 1,847 (56.3%) | 1,887 (47.1%) |
| 65 to 74 Years | 1,902 (60.7%) | 2,214 (60.1%) |
| 75 Years and over | 1,459 (57.5%) | 1,422 (46.1%) |
| Total | 14,162 (54.5%) | 13,578 (48.4%) |
Income Below Poverty Among Married-Couple Families in Aguadilla Municipio
The poverty statistics for married-couple families in Aguadilla Municipio show that 31.6% or 2,439 of the total 7,717 families live below the poverty line. Families with no children have the highest poverty rate of 33.3%, comprising of 1,886 families. On the other hand, families with 3 or 4 children have the lowest poverty rate of 25.1%, which includes 48 families.
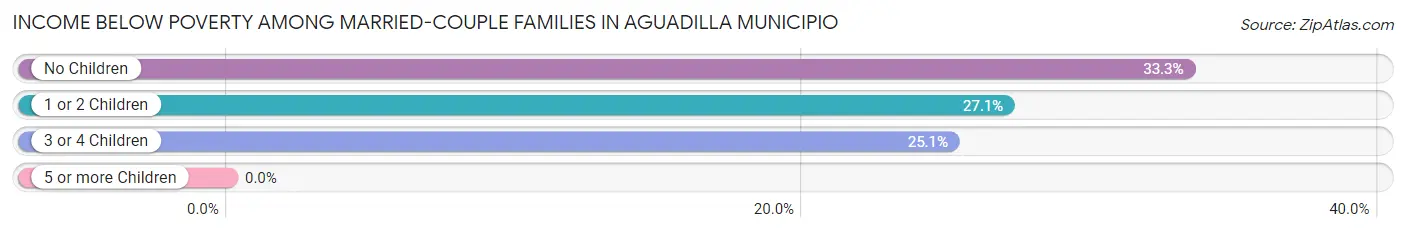
| Children | Above Poverty | Below Poverty |
| No Children | 3,773 (66.7%) | 1,886 (33.3%) |
| 1 or 2 Children | 1,362 (73.0%) | 505 (27.1%) |
| 3 or 4 Children | 143 (74.9%) | 48 (25.1%) |
| 5 or more Children | 0 (0.0%) | 0 (0.0%) |
| Total | 5,278 (68.4%) | 2,439 (31.6%) |
Income Below Poverty Among Single-Parent Households in Aguadilla Municipio
According to the poverty data in Aguadilla Municipio, 54.3% or 819 single-father households and 67.2% or 3,345 single-mother households are living below the poverty line. Among single-father households, those with 3 or 4 children have the highest poverty rate, with 176 households (90.3%) experiencing poverty. Likewise, among single-mother households, those with 3 or 4 children have the highest poverty rate, with 283 households (95.0%) falling below the poverty line.
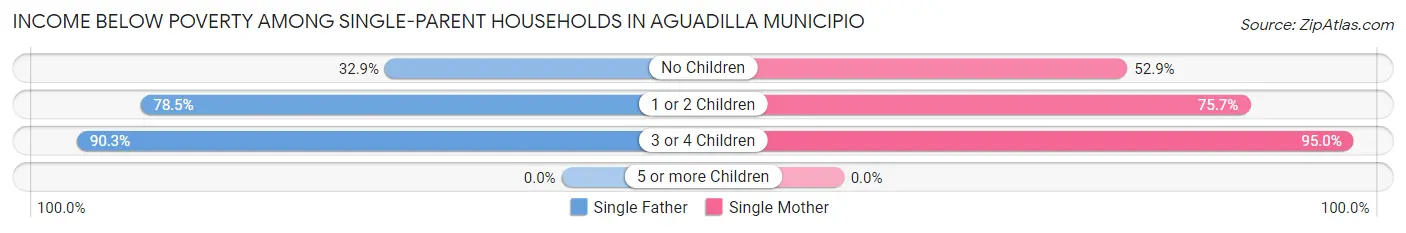
| Children | Single Father | Single Mother |
| No Children | 279 (32.9%) | 1,112 (52.8%) |
| 1 or 2 Children | 364 (78.4%) | 1,950 (75.7%) |
| 3 or 4 Children | 176 (90.3%) | 283 (95.0%) |
| 5 or more Children | 0 (0.0%) | 0 (0.0%) |
| Total | 819 (54.3%) | 3,345 (67.2%) |
Income Below Poverty Among Married-Couple vs Single-Parent Households in Aguadilla Municipio
The poverty data for Aguadilla Municipio shows that 2,439 of the married-couple family households (31.6%) and 4,164 of the single-parent households (64.2%) are living below the poverty level. Within the married-couple family households, those with no children have the highest poverty rate, with 1,886 households (33.3%) falling below the poverty line. Among the single-parent households, those with 3 or 4 children have the highest poverty rate, with 459 household (93.1%) living below poverty.
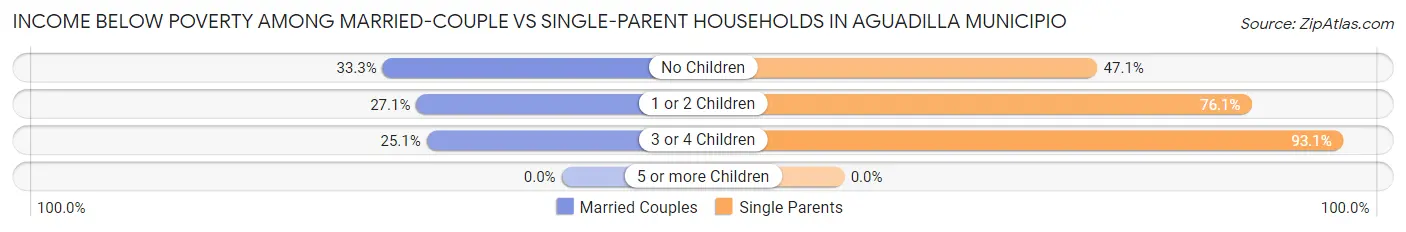
| Children | Married-Couple Families | Single-Parent Households |
| No Children | 1,886 (33.3%) | 1,391 (47.1%) |
| 1 or 2 Children | 505 (27.1%) | 2,314 (76.1%) |
| 3 or 4 Children | 48 (25.1%) | 459 (93.1%) |
| 5 or more Children | 0 (0.0%) | 0 (0.0%) |
| Total | 2,439 (31.6%) | 4,164 (64.2%) |
Race in Aguadilla Municipio
The most populous races in Aguadilla Municipio are Hispanic or Latino (53,802 | 98.3%), White / Caucasian (40,132 | 73.3%), and Some other Race (7,350 | 13.4%).
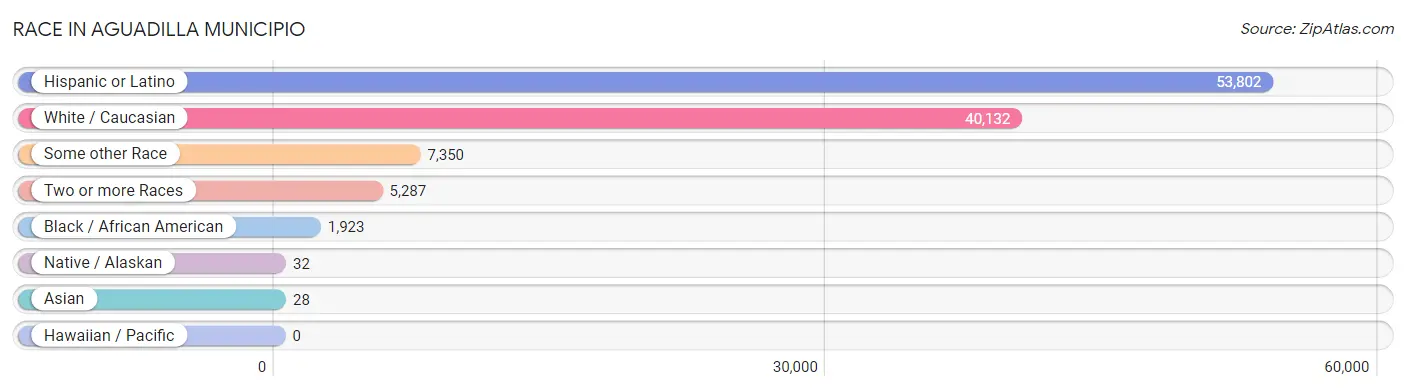
| Race | # Population | % Population |
| Asian | 28 | 0.1% |
| Black / African American | 1,923 | 3.5% |
| Hawaiian / Pacific | 0 | 0.0% |
| Hispanic or Latino | 53,802 | 98.3% |
| Native / Alaskan | 32 | 0.1% |
| White / Caucasian | 40,132 | 73.3% |
| Two or more Races | 5,287 | 9.7% |
| Some other Race | 7,350 | 13.4% |
| Total | 54,752 | 100.0% |
Ancestry in Aguadilla Municipio
The most populous ancestries reported in Aguadilla Municipio are Puerto Rican (52,873 | 96.6%), American (923 | 1.7%), Central American Indian (663 | 1.2%), European (282 | 0.5%), and South American (265 | 0.5%), together accounting for 100.5% of all Aguadilla Municipio residents.
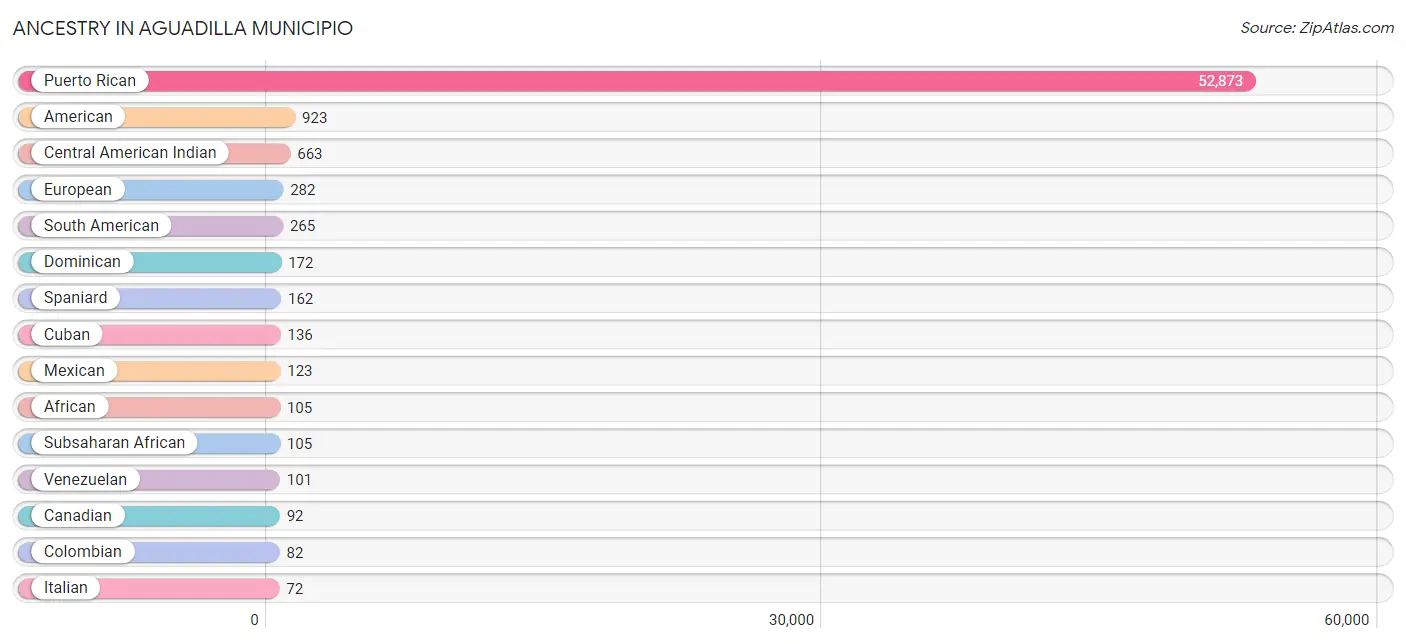
| Ancestry | # Population | % Population |
| African | 105 | 0.2% |
| American | 923 | 1.7% |
| Argentinean | 57 | 0.1% |
| British West Indian | 16 | 0.0% |
| Burmese | 17 | 0.0% |
| Canadian | 92 | 0.2% |
| Central American | 71 | 0.1% |
| Central American Indian | 663 | 1.2% |
| Colombian | 82 | 0.2% |
| Costa Rican | 24 | 0.0% |
| Cuban | 136 | 0.3% |
| Czechoslovakian | 17 | 0.0% |
| Dominican | 172 | 0.3% |
| English | 60 | 0.1% |
| European | 282 | 0.5% |
| French | 16 | 0.0% |
| German | 67 | 0.1% |
| Indian (Asian) | 28 | 0.1% |
| Irish | 61 | 0.1% |
| Italian | 72 | 0.1% |
| Mexican | 123 | 0.2% |
| Panamanian | 17 | 0.0% |
| Peruvian | 13 | 0.0% |
| Polish | 30 | 0.1% |
| Puerto Rican | 52,873 | 96.6% |
| Russian | 20 | 0.0% |
| Salvadoran | 30 | 0.1% |
| Scotch-Irish | 25 | 0.1% |
| South American | 265 | 0.5% |
| Spaniard | 162 | 0.3% |
| Spanish American Indian | 10 | 0.0% |
| Subsaharan African | 105 | 0.2% |
| Venezuelan | 101 | 0.2% |
| West Indian | 32 | 0.1% | View All 34 Rows |
Immigrants in Aguadilla Municipio

| Immigration Origin | # Population | % Population | View All 0 Rows |
Sex and Age in Aguadilla Municipio
Sex and Age in Aguadilla Municipio
The most populous age groups in Aguadilla Municipio are 20 to 24 Years (1,960 | 7.4%) for men and 60 to 64 Years (2,247 | 8.0%) for women.
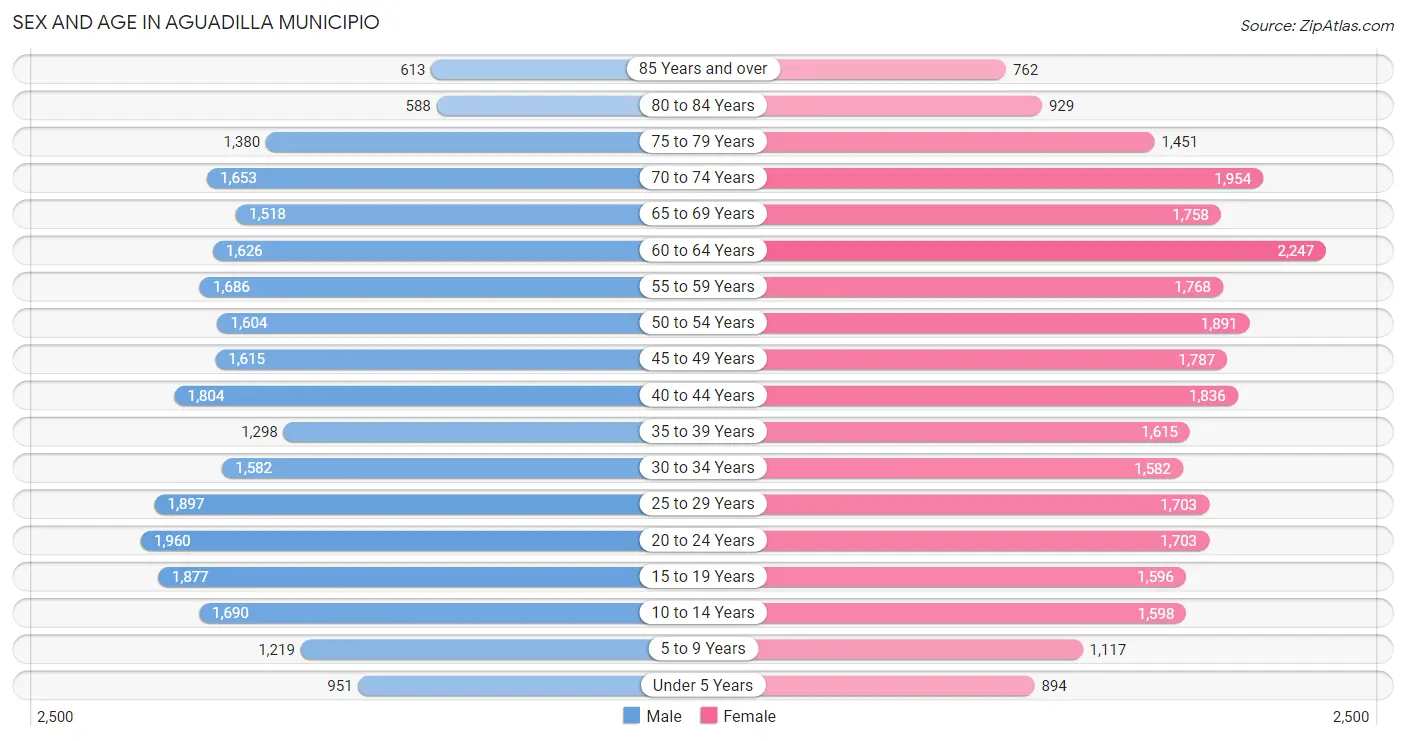
| Age Bracket | Male | Female |
| Under 5 Years | 951 (3.6%) | 894 (3.2%) |
| 5 to 9 Years | 1,219 (4.6%) | 1,117 (4.0%) |
| 10 to 14 Years | 1,690 (6.4%) | 1,598 (5.7%) |
| 15 to 19 Years | 1,877 (7.1%) | 1,596 (5.7%) |
| 20 to 24 Years | 1,960 (7.4%) | 1,703 (6.0%) |
| 25 to 29 Years | 1,897 (7.1%) | 1,703 (6.0%) |
| 30 to 34 Years | 1,582 (6.0%) | 1,582 (5.6%) |
| 35 to 39 Years | 1,298 (4.9%) | 1,615 (5.7%) |
| 40 to 44 Years | 1,804 (6.8%) | 1,836 (6.5%) |
| 45 to 49 Years | 1,615 (6.1%) | 1,787 (6.3%) |
| 50 to 54 Years | 1,604 (6.0%) | 1,891 (6.7%) |
| 55 to 59 Years | 1,686 (6.4%) | 1,768 (6.3%) |
| 60 to 64 Years | 1,626 (6.1%) | 2,247 (8.0%) |
| 65 to 69 Years | 1,518 (5.7%) | 1,758 (6.2%) |
| 70 to 74 Years | 1,653 (6.2%) | 1,954 (6.9%) |
| 75 to 79 Years | 1,380 (5.2%) | 1,451 (5.1%) |
| 80 to 84 Years | 588 (2.2%) | 929 (3.3%) |
| 85 Years and over | 613 (2.3%) | 762 (2.7%) |
| Total | 26,561 (100.0%) | 28,191 (100.0%) |
Families and Households in Aguadilla Municipio
Median Family Size in Aguadilla Municipio
The median family size in Aguadilla Municipio is 3.10 persons per family, with single male/father families (1,507 | 10.6%) accounting for the largest median family size of 3.15 persons per family. On the other hand, single female/mother families (4,978 | 35.0%) represent the smallest median family size with 3.09 persons per family.
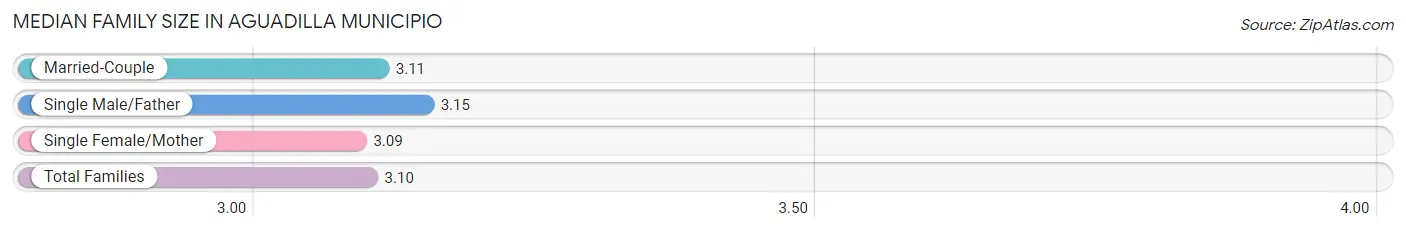
| Family Type | # Families | Family Size |
| Married-Couple | 7,717 (54.3%) | 3.11 |
| Single Male/Father | 1,507 (10.6%) | 3.15 |
| Single Female/Mother | 4,978 (35.0%) | 3.09 |
| Total Families | 14,202 (100.0%) | 3.10 |
Median Household Size in Aguadilla Municipio
The median household size in Aguadilla Municipio is 2.48 persons per household, with single male/father households (1,507 | 7.0%) accounting for the largest median household size of 3.5 persons per household. non-family households (7,448 | 34.4%) represent the smallest median household size with 1.14 persons per household.
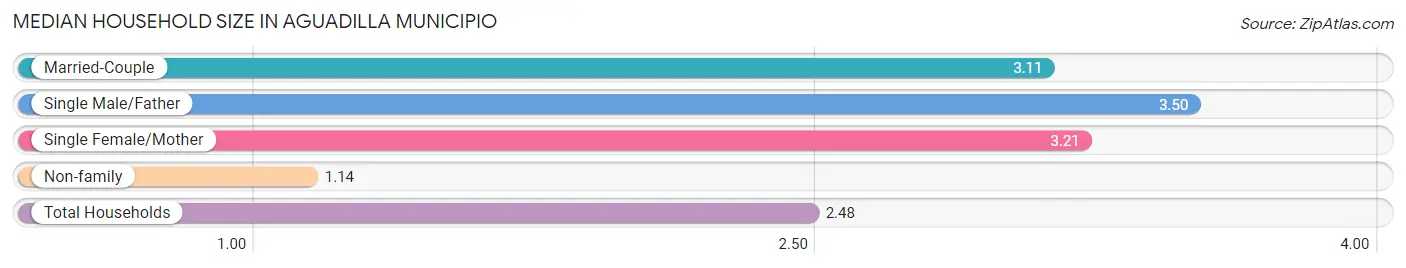
| Household Type | # Households | Household Size |
| Married-Couple | 7,717 (35.6%) | 3.11 |
| Single Male/Father | 1,507 (7.0%) | 3.50 |
| Single Female/Mother | 4,978 (23.0%) | 3.21 |
| Non-family | 7,448 (34.4%) | 1.14 |
| Total Households | 21,650 (100.0%) | 2.48 |
Household Size by Marriage Status in Aguadilla Municipio
Out of a total of 21,650 households in Aguadilla Municipio, 14,202 (65.6%) are family households, while 7,448 (34.4%) are nonfamily households. The most numerous type of family households are 2-person households, comprising 6,576, and the most common type of nonfamily households are 1-person households, comprising 6,532.
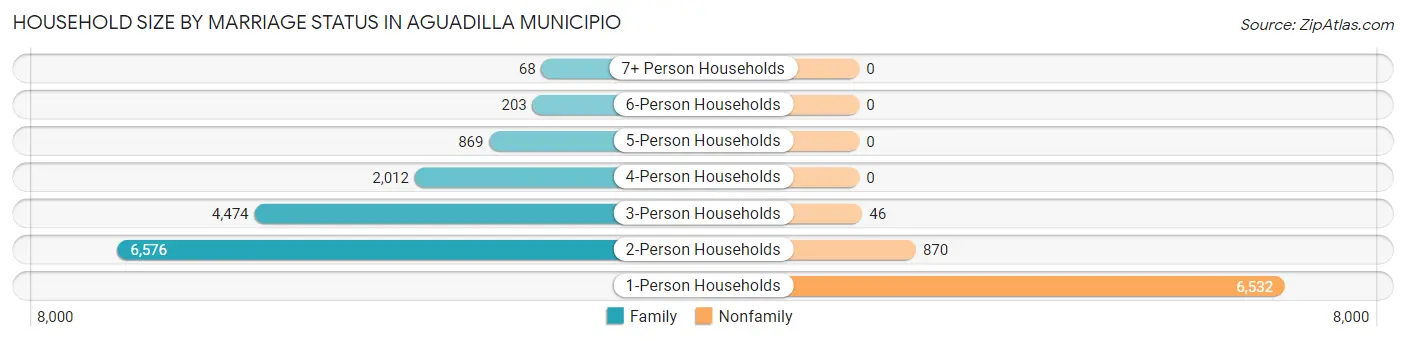
| Household Size | Family Households | Nonfamily Households |
| 1-Person Households | - | 6,532 (30.2%) |
| 2-Person Households | 6,576 (30.4%) | 870 (4.0%) |
| 3-Person Households | 4,474 (20.7%) | 46 (0.2%) |
| 4-Person Households | 2,012 (9.3%) | 0 (0.0%) |
| 5-Person Households | 869 (4.0%) | 0 (0.0%) |
| 6-Person Households | 203 (0.9%) | 0 (0.0%) |
| 7+ Person Households | 68 (0.3%) | 0 (0.0%) |
| Total | 14,202 (65.6%) | 7,448 (34.4%) |
Female Fertility in Aguadilla Municipio
Fertility by Age in Aguadilla Municipio
Average fertility rate in Aguadilla Municipio is 28.0 births per 1,000 women. Women in the age bracket of 20 to 34 years have the highest fertility rate with 49.0 births per 1,000 women. Women in the age bracket of 20 to 34 years acount for 71.9% of all women with births.
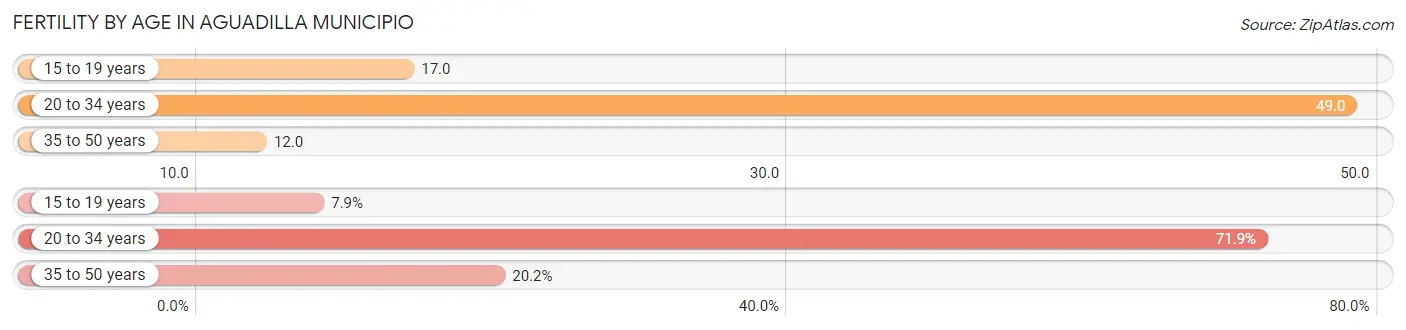
| Age Bracket | Women with Births | Births / 1,000 Women |
| 15 to 19 years | 27 (7.9%) | 17.0 |
| 20 to 34 years | 246 (71.9%) | 49.0 |
| 35 to 50 years | 69 (20.2%) | 12.0 |
| Total | 342 (100.0%) | 28.0 |
Fertility by Age by Marriage Status in Aguadilla Municipio
46.5% of women with births (342) in Aguadilla Municipio are married. The highest percentage of unmarried women with births falls into 15 to 19 years age bracket with 100.0% of them unmarried at the time of birth, while the lowest percentage of unmarried women with births belong to 20 to 34 years age bracket with 46.3% of them unmarried.
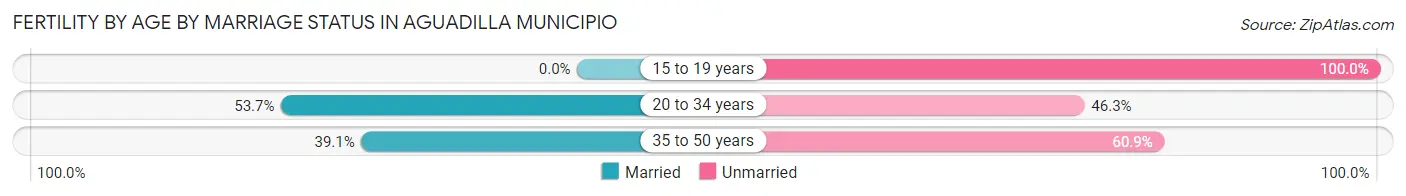
| Age Bracket | Married | Unmarried |
| 15 to 19 years | 0 (0.0%) | 27 (100.0%) |
| 20 to 34 years | 132 (53.7%) | 114 (46.3%) |
| 35 to 50 years | 27 (39.1%) | 42 (60.9%) |
| Total | 159 (46.5%) | 183 (53.5%) |
Fertility by Education in Aguadilla Municipio
Average fertility rate in Aguadilla Municipio is 28.0 births per 1,000 women. Women with the education attainment of bachelor's degree have the highest fertility rate of 42.0 births per 1,000 women, while women with the education attainment of less than high school have the lowest fertility at 13.0 births per 1,000 women. Women with the education attainment of bachelor's degree represent 36.3% of all women with births.
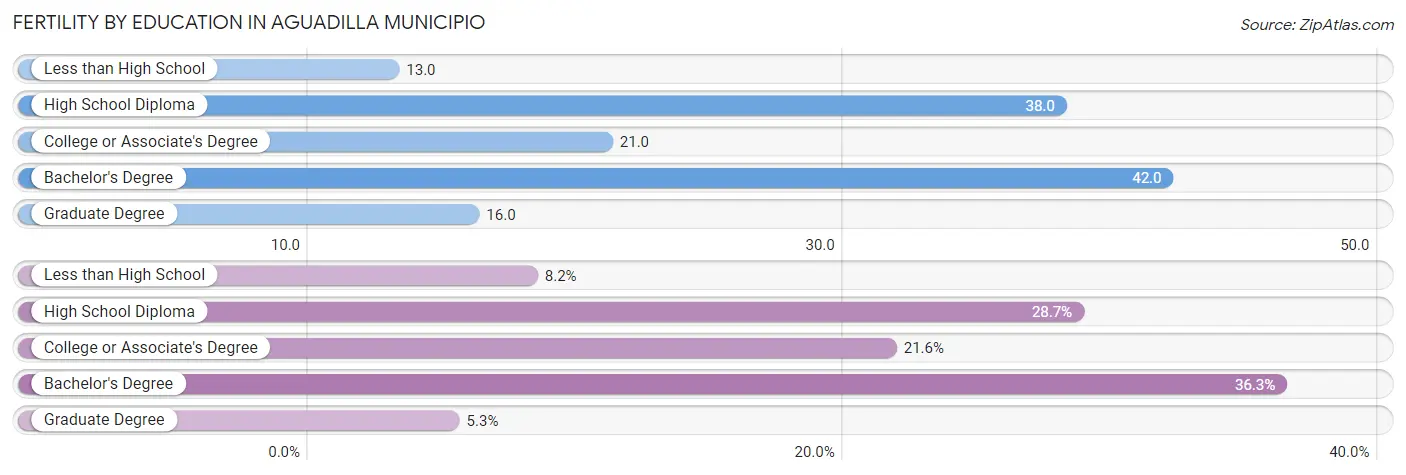
| Educational Attainment | Women with Births | Births / 1,000 Women |
| Less than High School | 28 (8.2%) | 13.0 |
| High School Diploma | 98 (28.6%) | 38.0 |
| College or Associate's Degree | 74 (21.6%) | 21.0 |
| Bachelor's Degree | 124 (36.3%) | 42.0 |
| Graduate Degree | 18 (5.3%) | 16.0 |
| Total | 342 (100.0%) | 28.0 |
Fertility by Education by Marriage Status in Aguadilla Municipio
53.5% of women with births in Aguadilla Municipio are unmarried. Women with the educational attainment of bachelor's degree are most likely to be married with 100.0% of them married at childbirth, while women with the educational attainment of high school diploma are least likely to be married with 100.0% of them unmarried at childbirth.
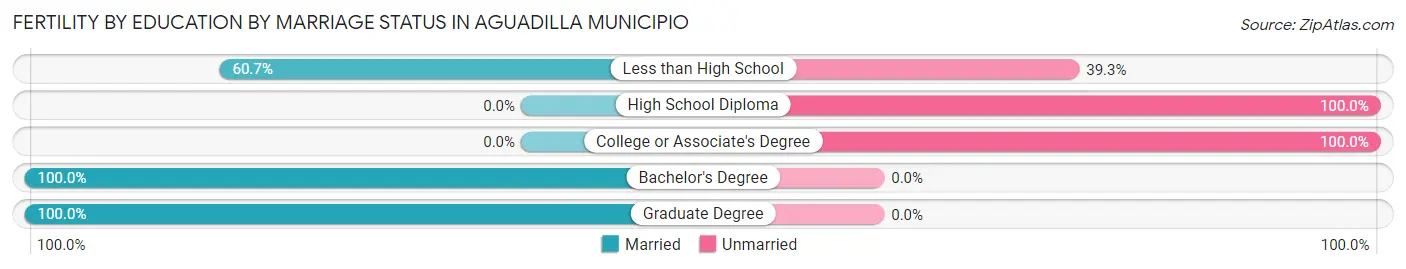
| Educational Attainment | Married | Unmarried |
| Less than High School | 17 (60.7%) | 11 (39.3%) |
| High School Diploma | 0 (0.0%) | 98 (100.0%) |
| College or Associate's Degree | 0 (0.0%) | 74 (100.0%) |
| Bachelor's Degree | 124 (100.0%) | 0 (0.0%) |
| Graduate Degree | 18 (100.0%) | 0 (0.0%) |
| Total | 159 (46.5%) | 183 (53.5%) |
Employment Characteristics in Aguadilla Municipio
Employment by Class of Employer in Aguadilla Municipio
Among the 14,138 employed individuals in Aguadilla Municipio, private company employees (8,886 | 62.8%), state government employees (1,863 | 13.2%), and self-employed (not incorporated) (1,290 | 9.1%) make up the most common classes of employment.
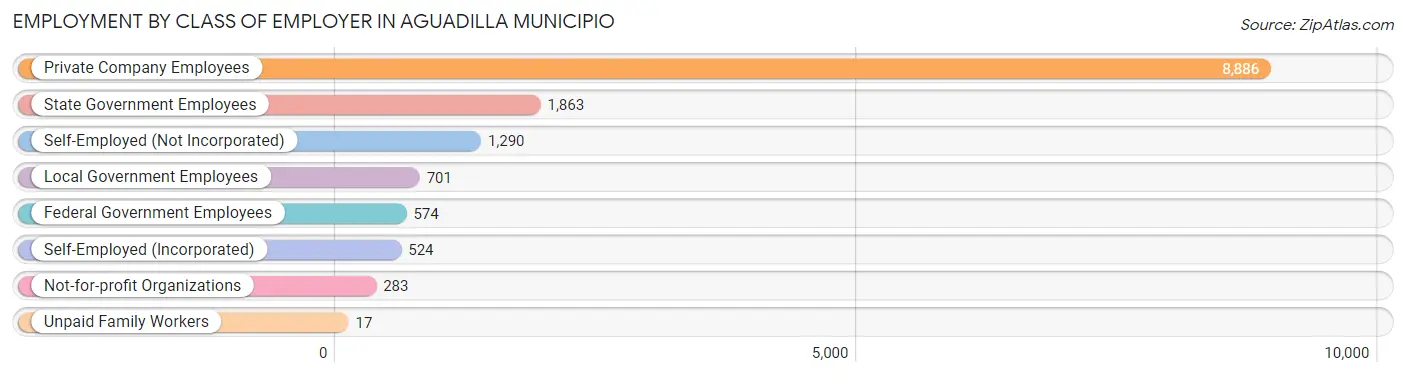
| Employer Class | # Employees | % Employees |
| Private Company Employees | 8,886 | 62.8% |
| Self-Employed (Incorporated) | 524 | 3.7% |
| Self-Employed (Not Incorporated) | 1,290 | 9.1% |
| Not-for-profit Organizations | 283 | 2.0% |
| Local Government Employees | 701 | 5.0% |
| State Government Employees | 1,863 | 13.2% |
| Federal Government Employees | 574 | 4.1% |
| Unpaid Family Workers | 17 | 0.1% |
| Total | 14,138 | 100.0% |
Employment Status by Age in Aguadilla Municipio
According to the labor force statistics for Aguadilla Municipio, out of the total population over 16 years of age (46,544), 38.6% or 17,966 individuals are in the labor force, with 15.5% or 2,785 of them unemployed. The age group with the highest labor force participation rate is 25 to 29 years, with 70.2% or 2,527 individuals in the labor force. Within the labor force, the 16 to 19 years age range has the highest percentage of unemployed individuals, with 48.4% or 290 of them being unemployed.
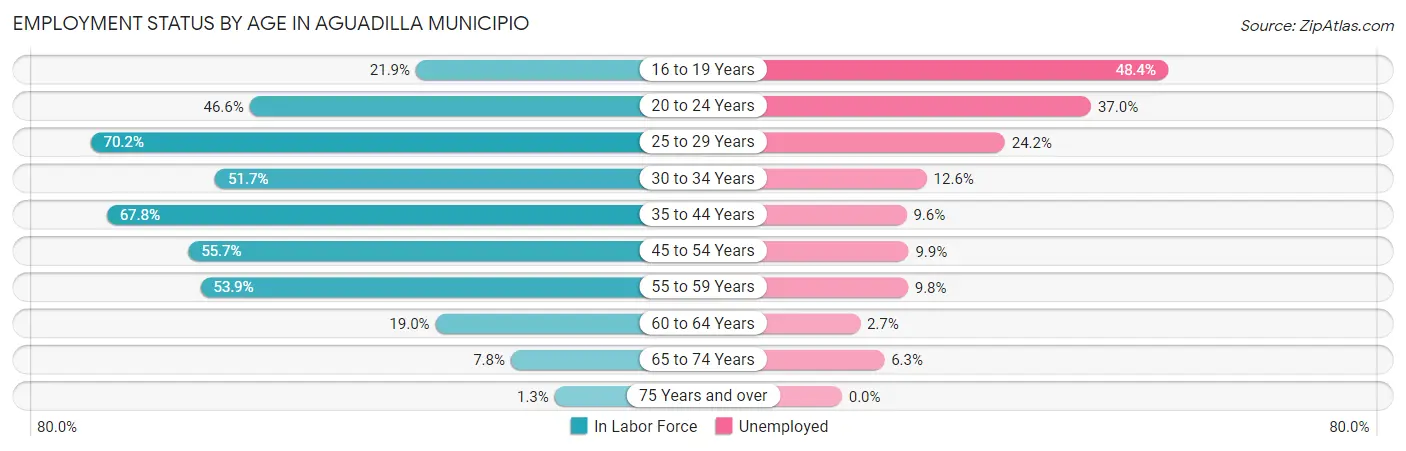
| Age Bracket | In Labor Force | Unemployed |
| 16 to 19 Years | 599 (21.9%) | 290 (48.4%) |
| 20 to 24 Years | 1,707 (46.6%) | 632 (37.0%) |
| 25 to 29 Years | 2,527 (70.2%) | 612 (24.2%) |
| 30 to 34 Years | 1,636 (51.7%) | 206 (12.6%) |
| 35 to 44 Years | 4,443 (67.8%) | 427 (9.6%) |
| 45 to 54 Years | 3,842 (55.7%) | 380 (9.9%) |
| 55 to 59 Years | 1,862 (53.9%) | 182 (9.8%) |
| 60 to 64 Years | 736 (19.0%) | 20 (2.7%) |
| 65 to 74 Years | 537 (7.8%) | 34 (6.3%) |
| 75 Years and over | 74 (1.3%) | 0 (0.0%) |
| Total | 17,966 (38.6%) | 2,785 (15.5%) |
Employment Status by Educational Attainment in Aguadilla Municipio
According to labor force statistics for Aguadilla Municipio, 54.6% of individuals (15,037) out of the total population between 25 and 64 years of age (27,541) are in the labor force, with 12.1% or 1,819 of them being unemployed. The group with the highest labor force participation rate are those with the educational attainment of bachelor's degree or higher, with 74.6% or 5,954 individuals in the labor force. Within the labor force, individuals with less than high school education have the highest percentage of unemployment, with 23.0% or 276 of them being unemployed.
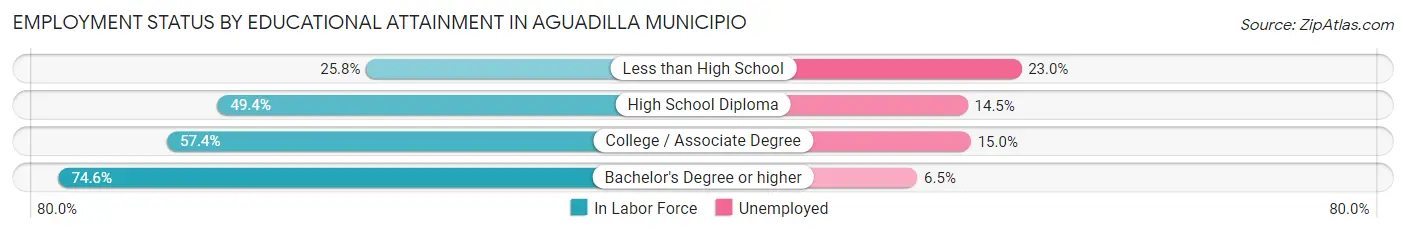
| Educational Attainment | In Labor Force | Unemployed |
| Less than High School | 1,200 (25.8%) | 1,070 (23.0%) |
| High School Diploma | 4,075 (49.4%) | 1,196 (14.5%) |
| College / Associate Degree | 3,823 (57.4%) | 999 (15.0%) |
| Bachelor's Degree or higher | 5,954 (74.6%) | 519 (6.5%) |
| Total | 15,037 (54.6%) | 3,332 (12.1%) |
Employment Occupations by Sex in Aguadilla Municipio
Management, Business, Science and Arts Occupations
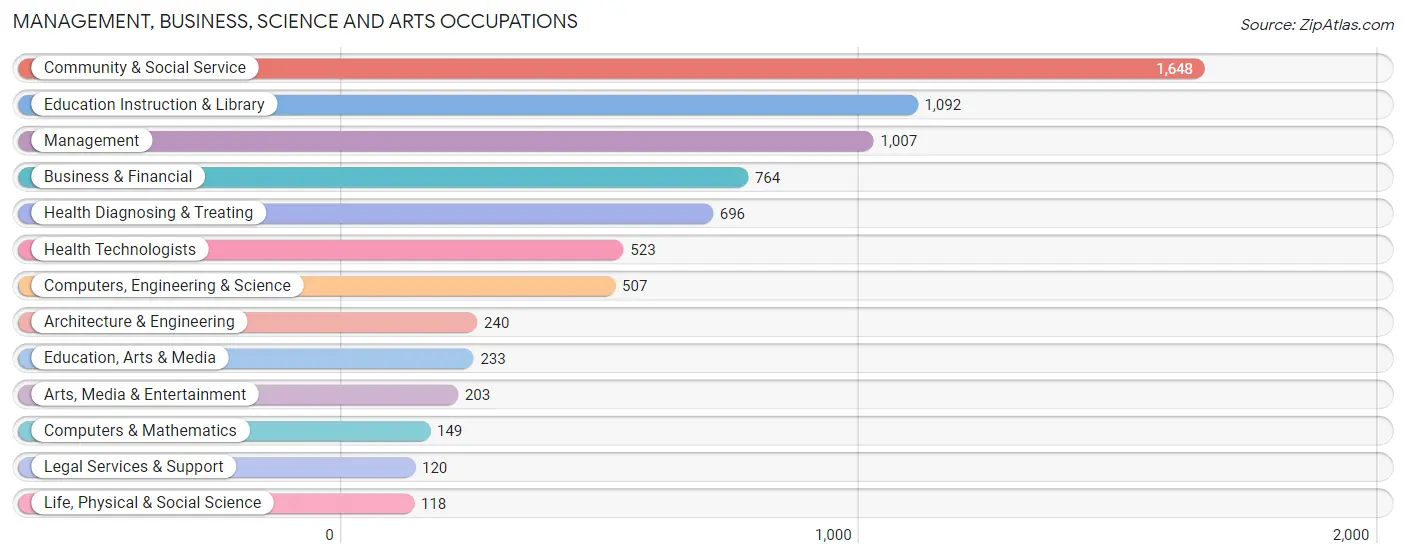
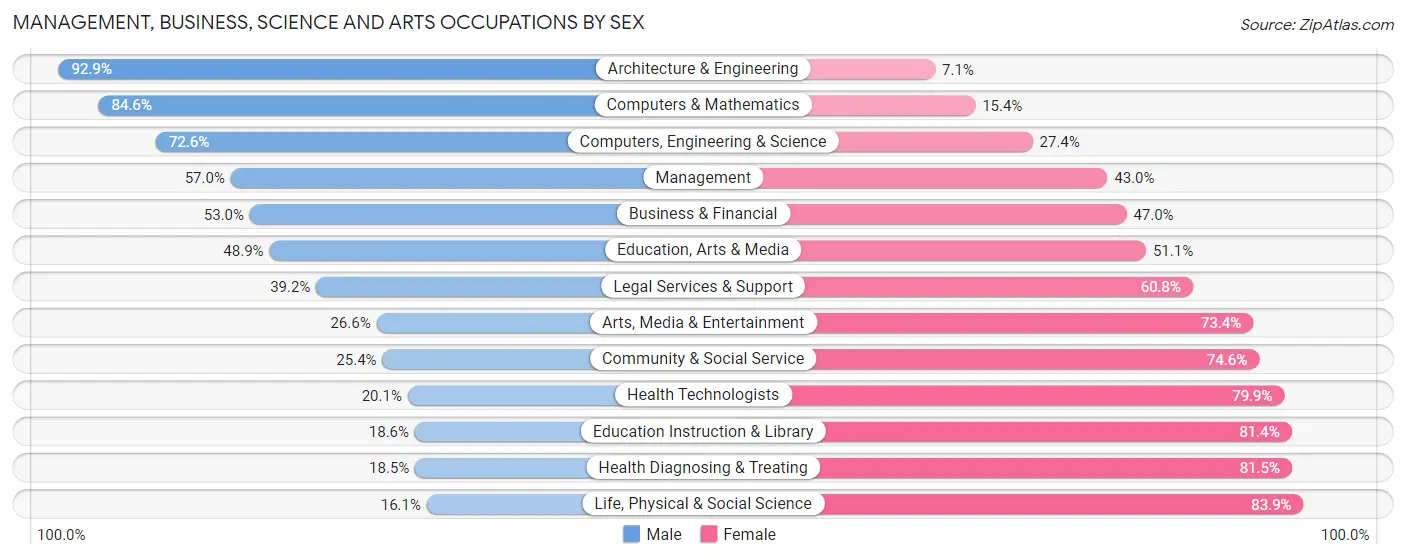
The most common Management, Business, Science and Arts occupations in Aguadilla Municipio are Community & Social Service (1,648 | 10.9%), Education Instruction & Library (1,092 | 7.2%), Management (1,007 | 6.7%), Business & Financial (764 | 5.1%), and Health Diagnosing & Treating (696 | 4.6%).
Management, Business, Science and Arts Occupations by Sex
Within the Management, Business, Science and Arts occupations in Aguadilla Municipio, the most male-oriented occupations are Architecture & Engineering (92.9%), Computers & Mathematics (84.6%), and Computers, Engineering & Science (72.6%), while the most female-oriented occupations are Life, Physical & Social Science (83.9%), Health Diagnosing & Treating (81.5%), and Education Instruction & Library (81.4%).
| Occupation | Male | Female |
| Management | 574 (57.0%) | 433 (43.0%) |
| Business & Financial | 405 (53.0%) | 359 (47.0%) |
| Computers, Engineering & Science | 368 (72.6%) | 139 (27.4%) |
| Computers & Mathematics | 126 (84.6%) | 23 (15.4%) |
| Architecture & Engineering | 223 (92.9%) | 17 (7.1%) |
| Life, Physical & Social Science | 19 (16.1%) | 99 (83.9%) |
| Community & Social Service | 418 (25.4%) | 1,230 (74.6%) |
| Education, Arts & Media | 114 (48.9%) | 119 (51.1%) |
| Legal Services & Support | 47 (39.2%) | 73 (60.8%) |
| Education Instruction & Library | 203 (18.6%) | 889 (81.4%) |
| Arts, Media & Entertainment | 54 (26.6%) | 149 (73.4%) |
| Health Diagnosing & Treating | 129 (18.5%) | 567 (81.5%) |
| Health Technologists | 105 (20.1%) | 418 (79.9%) |
| Total (Category) | 1,894 (41.0%) | 2,728 (59.0%) |
| Total (Overall) | 8,201 (54.2%) | 6,929 (45.8%) |
Services Occupations
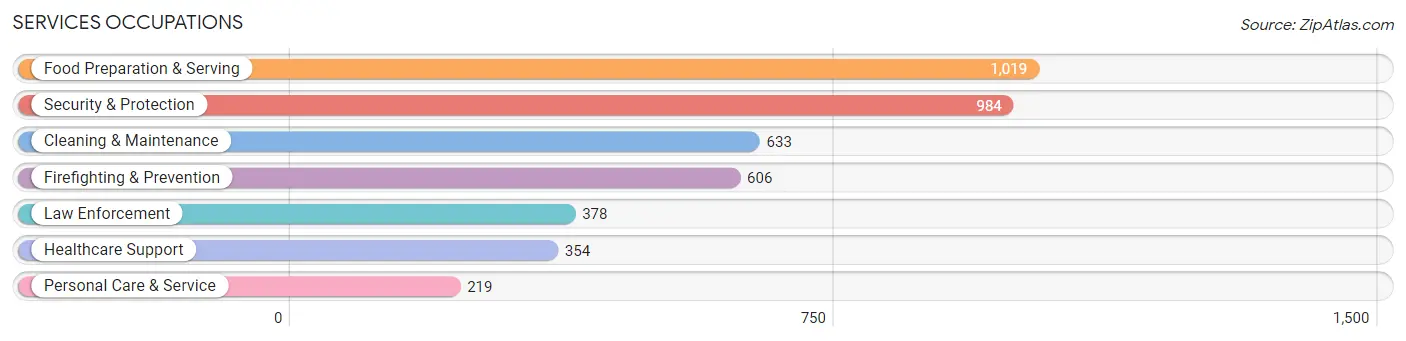
The most common Services occupations in Aguadilla Municipio are Food Preparation & Serving (1,019 | 6.7%), Security & Protection (984 | 6.5%), Cleaning & Maintenance (633 | 4.2%), Firefighting & Prevention (606 | 4.0%), and Law Enforcement (378 | 2.5%).
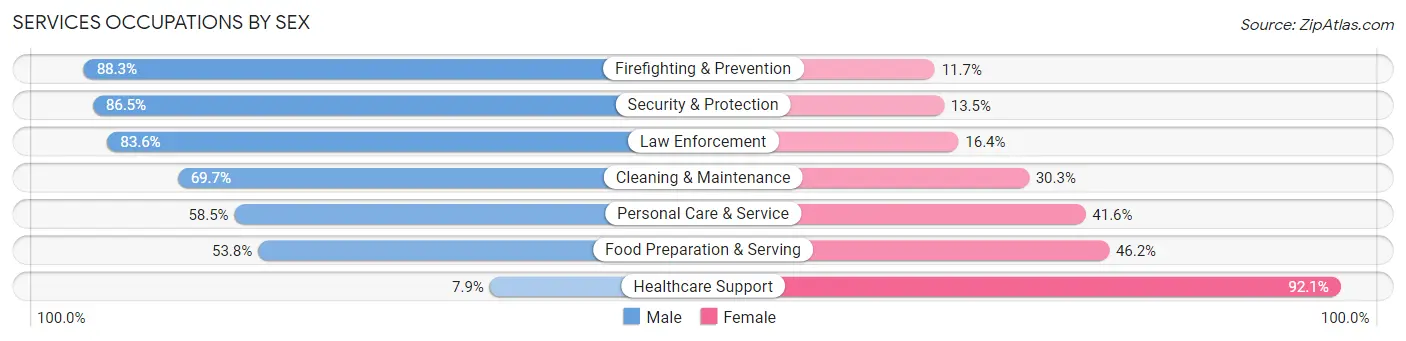
Services Occupations by Sex
Within the Services occupations in Aguadilla Municipio, the most male-oriented occupations are Firefighting & Prevention (88.3%), Security & Protection (86.5%), and Law Enforcement (83.6%), while the most female-oriented occupations are Healthcare Support (92.1%), Food Preparation & Serving (46.2%), and Personal Care & Service (41.5%).
| Occupation | Male | Female |
| Healthcare Support | 28 (7.9%) | 326 (92.1%) |
| Security & Protection | 851 (86.5%) | 133 (13.5%) |
| Firefighting & Prevention | 535 (88.3%) | 71 (11.7%) |
| Law Enforcement | 316 (83.6%) | 62 (16.4%) |
| Food Preparation & Serving | 548 (53.8%) | 471 (46.2%) |
| Cleaning & Maintenance | 441 (69.7%) | 192 (30.3%) |
| Personal Care & Service | 128 (58.5%) | 91 (41.5%) |
| Total (Category) | 1,996 (62.2%) | 1,213 (37.8%) |
| Total (Overall) | 8,201 (54.2%) | 6,929 (45.8%) |
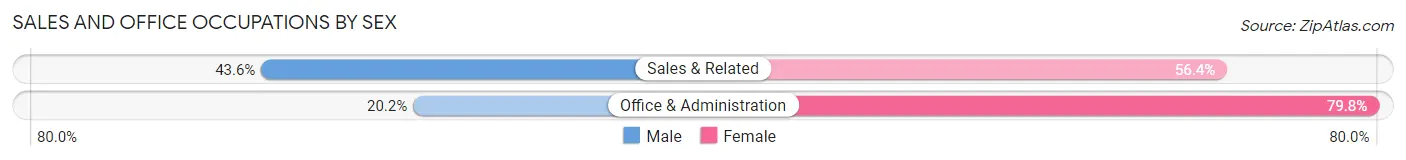
Sales and Office Occupations
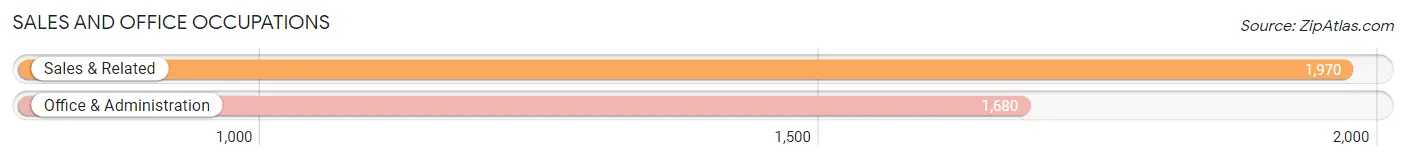
The most common Sales and Office occupations in Aguadilla Municipio are Sales & Related (1,970 | 13.0%), and Office & Administration (1,680 | 11.1%).
Sales and Office Occupations by Sex
| Occupation | Male | Female |
| Sales & Related | 859 (43.6%) | 1,111 (56.4%) |
| Office & Administration | 340 (20.2%) | 1,340 (79.8%) |
| Total (Category) | 1,199 (32.9%) | 2,451 (67.1%) |
| Total (Overall) | 8,201 (54.2%) | 6,929 (45.8%) |
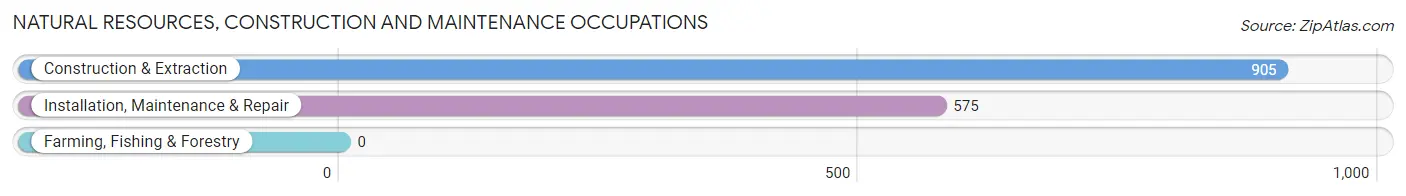
Natural Resources, Construction and Maintenance Occupations
The most common Natural Resources, Construction and Maintenance occupations in Aguadilla Municipio are Construction & Extraction (905 | 6.0%), and Installation, Maintenance & Repair (575 | 3.8%).
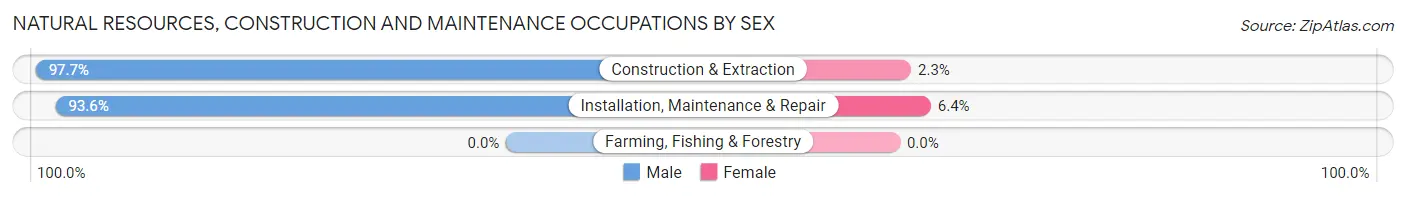
Natural Resources, Construction and Maintenance Occupations by Sex
| Occupation | Male | Female |
| Farming, Fishing & Forestry | 0 (0.0%) | 0 (0.0%) |
| Construction & Extraction | 884 (97.7%) | 21 (2.3%) |
| Installation, Maintenance & Repair | 538 (93.6%) | 37 (6.4%) |
| Total (Category) | 1,422 (96.1%) | 58 (3.9%) |
| Total (Overall) | 8,201 (54.2%) | 6,929 (45.8%) |
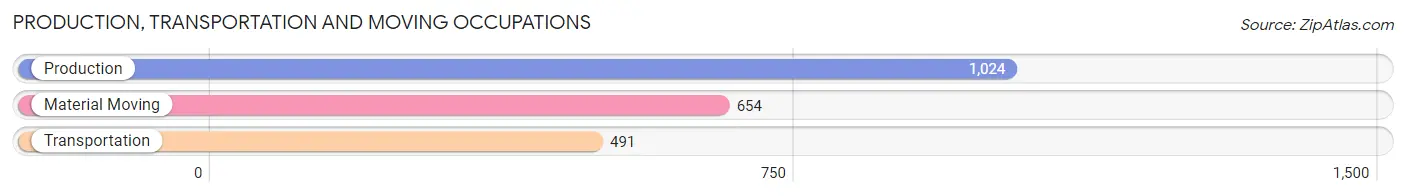
Production, Transportation and Moving Occupations
The most common Production, Transportation and Moving occupations in Aguadilla Municipio are Production (1,024 | 6.8%), Material Moving (654 | 4.3%), and Transportation (491 | 3.3%).
Production, Transportation and Moving Occupations by Sex
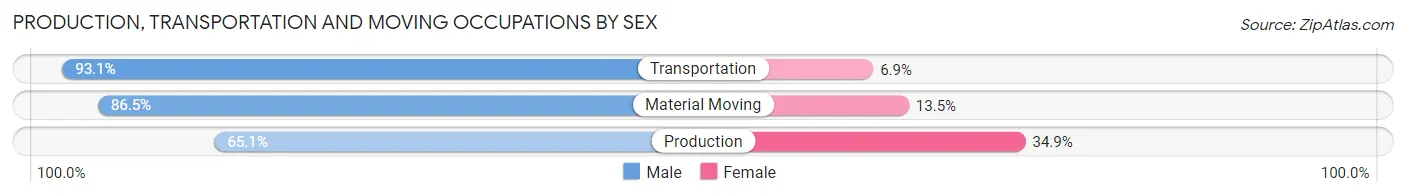
| Occupation | Male | Female |
| Production | 667 (65.1%) | 357 (34.9%) |
| Transportation | 457 (93.1%) | 34 (6.9%) |
| Material Moving | 566 (86.5%) | 88 (13.5%) |
| Total (Category) | 1,690 (77.9%) | 479 (22.1%) |
| Total (Overall) | 8,201 (54.2%) | 6,929 (45.8%) |
Employment Industries by Sex in Aguadilla Municipio
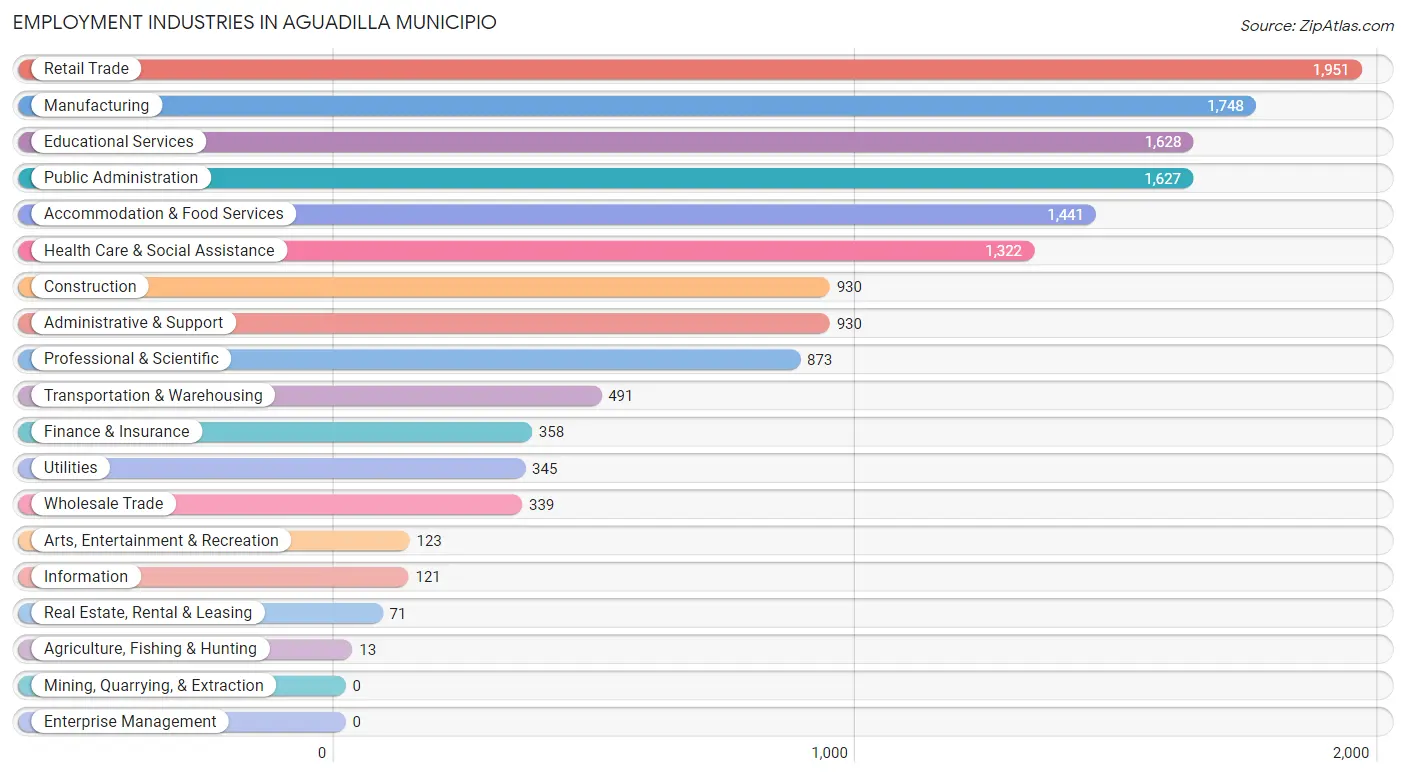
Employment Industries in Aguadilla Municipio
The major employment industries in Aguadilla Municipio include Retail Trade (1,951 | 12.9%), Manufacturing (1,748 | 11.6%), Educational Services (1,628 | 10.8%), Public Administration (1,627 | 10.7%), and Accommodation & Food Services (1,441 | 9.5%).
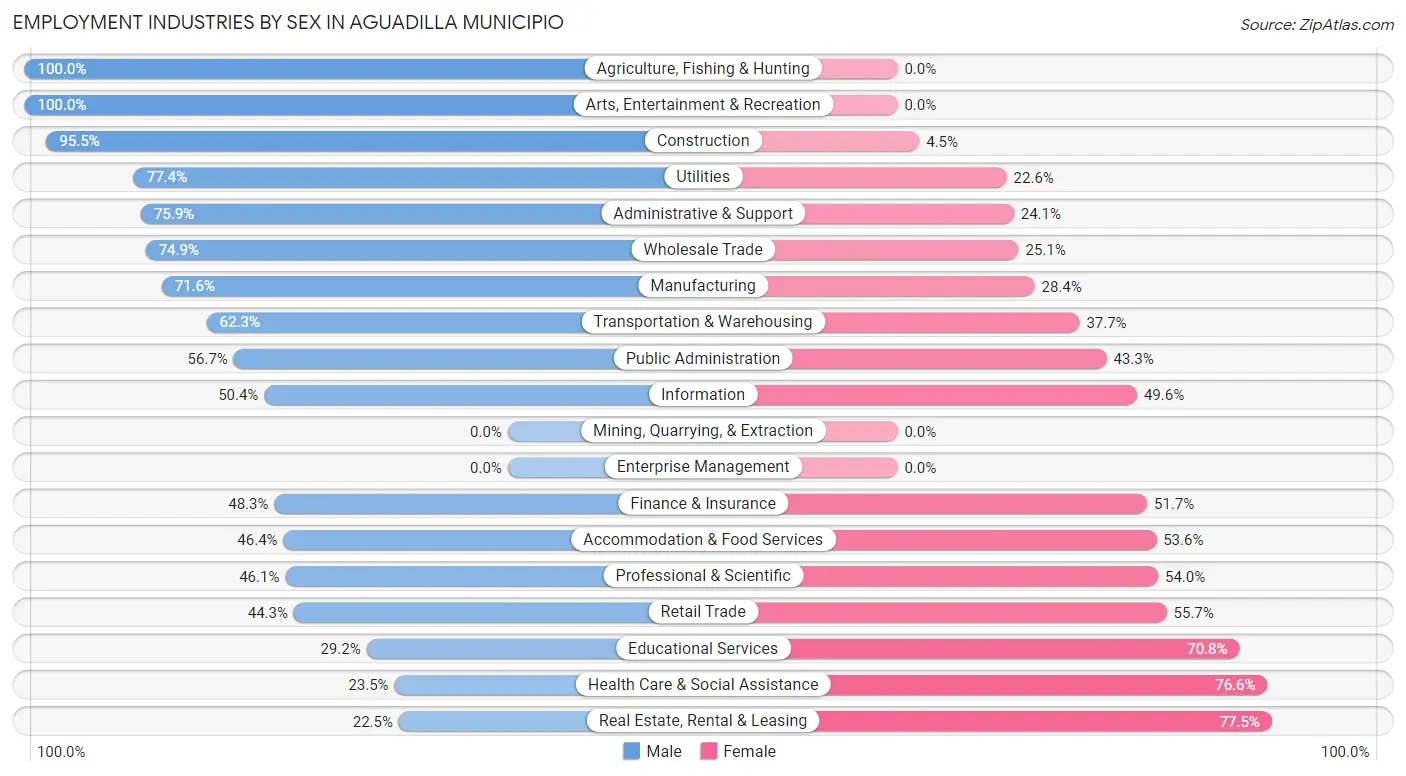
Employment Industries by Sex in Aguadilla Municipio
The Aguadilla Municipio industries that see more men than women are Agriculture, Fishing & Hunting (100.0%), Arts, Entertainment & Recreation (100.0%), and Construction (95.5%), whereas the industries that tend to have a higher number of women are Real Estate, Rental & Leasing (77.5%), Health Care & Social Assistance (76.5%), and Educational Services (70.8%).
| Industry | Male | Female |
| Agriculture, Fishing & Hunting | 13 (100.0%) | 0 (0.0%) |
| Mining, Quarrying, & Extraction | 0 (0.0%) | 0 (0.0%) |
| Construction | 888 (95.5%) | 42 (4.5%) |
| Manufacturing | 1,252 (71.6%) | 496 (28.4%) |
| Wholesale Trade | 254 (74.9%) | 85 (25.1%) |
| Retail Trade | 864 (44.3%) | 1,087 (55.7%) |
| Transportation & Warehousing | 306 (62.3%) | 185 (37.7%) |
| Utilities | 267 (77.4%) | 78 (22.6%) |
| Information | 61 (50.4%) | 60 (49.6%) |
| Finance & Insurance | 173 (48.3%) | 185 (51.7%) |
| Real Estate, Rental & Leasing | 16 (22.5%) | 55 (77.5%) |
| Professional & Scientific | 402 (46.1%) | 471 (53.9%) |
| Enterprise Management | 0 (0.0%) | 0 (0.0%) |
| Administrative & Support | 706 (75.9%) | 224 (24.1%) |
| Educational Services | 476 (29.2%) | 1,152 (70.8%) |
| Health Care & Social Assistance | 310 (23.4%) | 1,012 (76.5%) |
| Arts, Entertainment & Recreation | 123 (100.0%) | 0 (0.0%) |
| Accommodation & Food Services | 669 (46.4%) | 772 (53.6%) |
| Public Administration | 923 (56.7%) | 704 (43.3%) |
| Total | 8,201 (54.2%) | 6,929 (45.8%) |
Education in Aguadilla Municipio
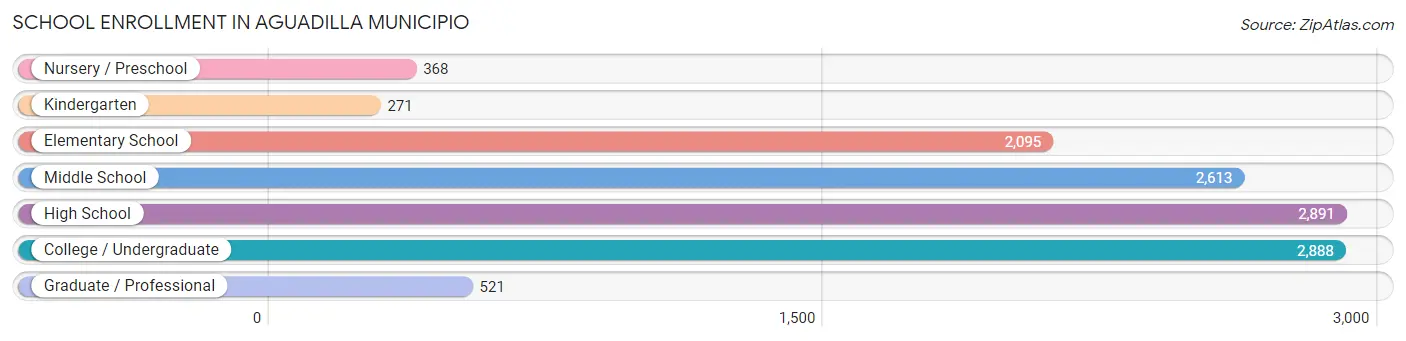
School Enrollment in Aguadilla Municipio
The most common levels of schooling among the 11,647 students in Aguadilla Municipio are high school (2,891 | 24.8%), college / undergraduate (2,888 | 24.8%), and middle school (2,613 | 22.4%).
| School Level | # Students | % Students |
| Nursery / Preschool | 368 | 3.2% |
| Kindergarten | 271 | 2.3% |
| Elementary School | 2,095 | 18.0% |
| Middle School | 2,613 | 22.4% |
| High School | 2,891 | 24.8% |
| College / Undergraduate | 2,888 | 24.8% |
| Graduate / Professional | 521 | 4.5% |
| Total | 11,647 | 100.0% |
School Enrollment by Age by Funding Source in Aguadilla Municipio
Out of a total of 11,647 students who are enrolled in schools in Aguadilla Municipio, 4,566 (39.2%) attend a private institution, while the remaining 7,081 (60.8%) are enrolled in public schools. The age group of 20 to 24 year olds has the highest likelihood of being enrolled in private schools, with 1,164 (65.4% in the age bracket) enrolled. Conversely, the age group of 3 to 4 year olds has the lowest likelihood of being enrolled in a private school, with 282 (81.0% in the age bracket) attending a public institution.
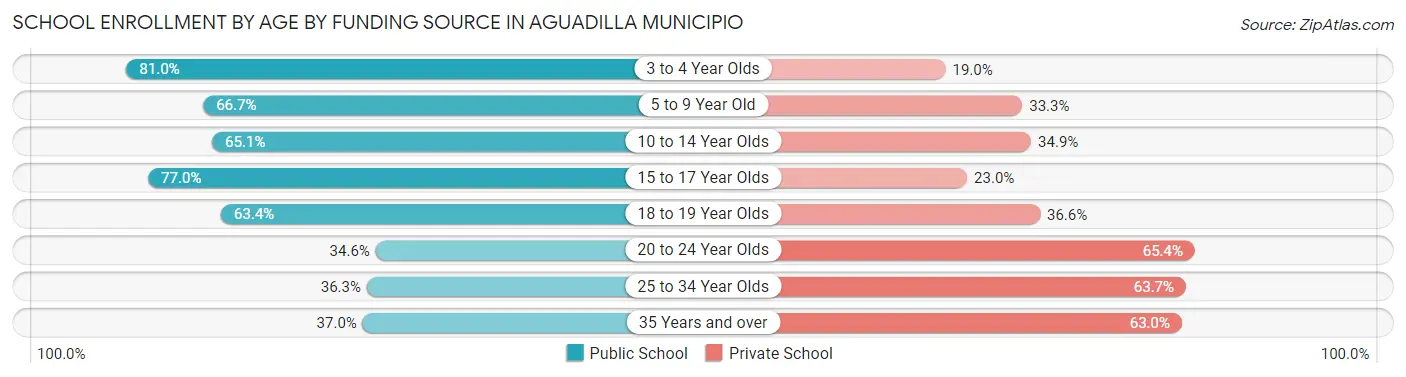
| Age Bracket | Public School | Private School |
| 3 to 4 Year Olds | 282 (81.0%) | 66 (19.0%) |
| 5 to 9 Year Old | 1,504 (66.7%) | 750 (33.3%) |
| 10 to 14 Year Olds | 2,106 (65.1%) | 1,130 (34.9%) |
| 15 to 17 Year Olds | 1,550 (77.0%) | 463 (23.0%) |
| 18 to 19 Year Olds | 680 (63.4%) | 392 (36.6%) |
| 20 to 24 Year Olds | 616 (34.6%) | 1,164 (65.4%) |
| 25 to 34 Year Olds | 218 (36.3%) | 383 (63.7%) |
| 35 Years and over | 127 (37.0%) | 216 (63.0%) |
| Total | 7,081 (60.8%) | 4,566 (39.2%) |
Educational Attainment by Field of Study in Aguadilla Municipio
Business (3,208 | 31.8%), education (1,972 | 19.5%), science & technology (967 | 9.6%), bio, nature & agricultural (739 | 7.3%), and arts & humanities (660 | 6.5%) are the most common fields of study among 10,095 individuals in Aguadilla Municipio who have obtained a bachelor's degree or higher.
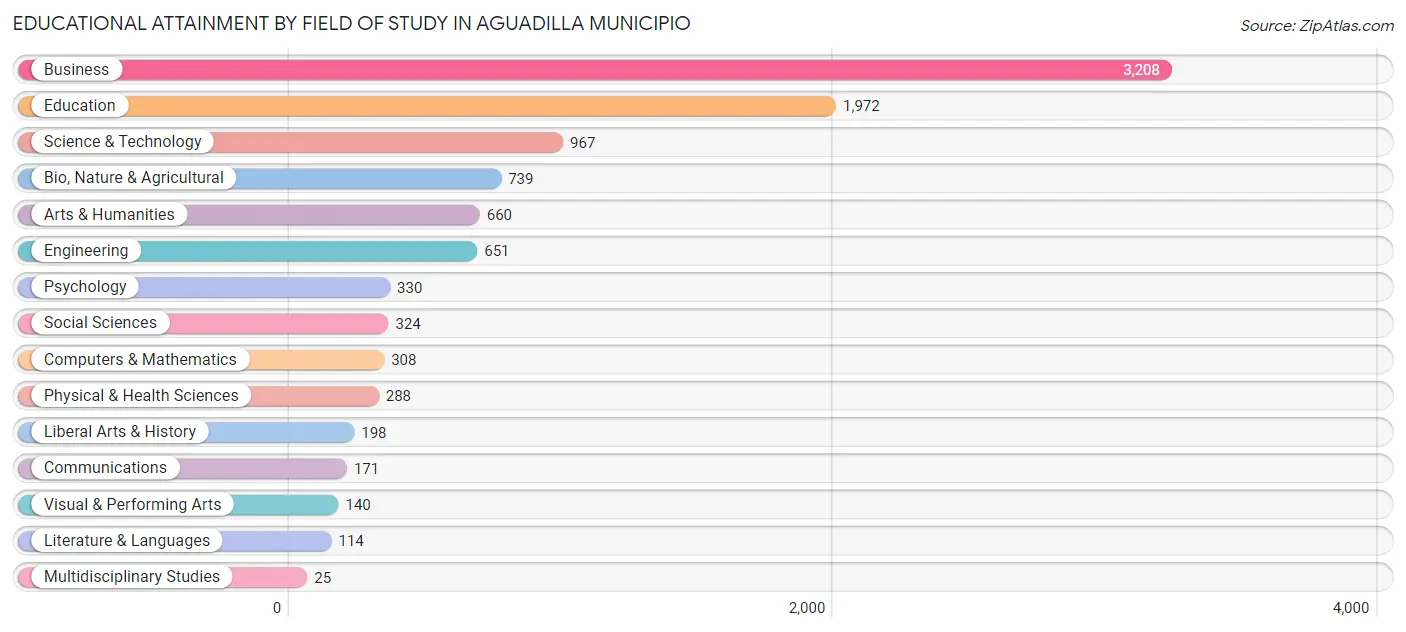
| Field of Study | # Graduates | % Graduates |
| Computers & Mathematics | 308 | 3.0% |
| Bio, Nature & Agricultural | 739 | 7.3% |
| Physical & Health Sciences | 288 | 2.9% |
| Psychology | 330 | 3.3% |
| Social Sciences | 324 | 3.2% |
| Engineering | 651 | 6.5% |
| Multidisciplinary Studies | 25 | 0.3% |
| Science & Technology | 967 | 9.6% |
| Business | 3,208 | 31.8% |
| Education | 1,972 | 19.5% |
| Literature & Languages | 114 | 1.1% |
| Liberal Arts & History | 198 | 2.0% |
| Visual & Performing Arts | 140 | 1.4% |
| Communications | 171 | 1.7% |
| Arts & Humanities | 660 | 6.5% |
| Total | 10,095 | 100.0% |
Transportation & Commute in Aguadilla Municipio
Vehicle Availability by Sex in Aguadilla Municipio
The most prevalent vehicle ownership categories in Aguadilla Municipio are males with 2 vehicles (2,784, accounting for 37.0%) and females with 2 vehicles (2,268, making up 43.1%).
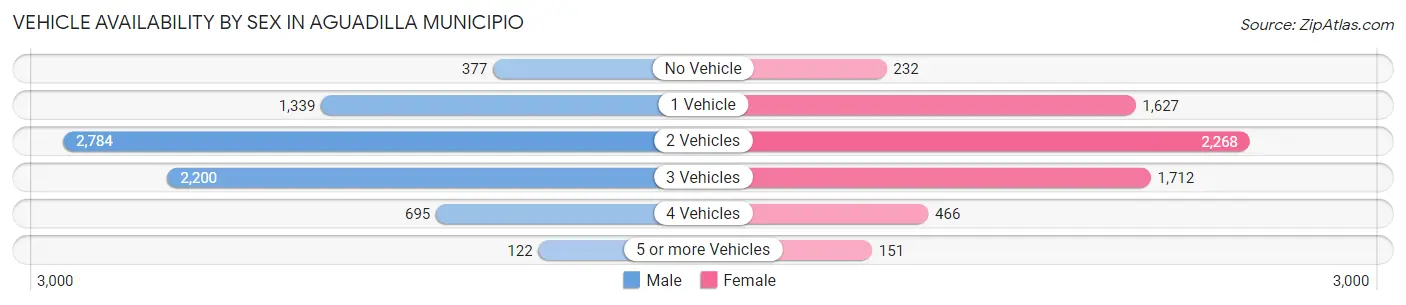
| Vehicles Available | Male | Female |
| No Vehicle | 377 (5.0%) | 232 (3.6%) |
| 1 Vehicle | 1,339 (17.8%) | 1,627 (25.2%) |
| 2 Vehicles | 2,784 (37.0%) | 2,268 (35.1%) |
| 3 Vehicles | 2,200 (29.3%) | 1,712 (26.5%) |
| 4 Vehicles | 695 (9.2%) | 466 (7.2%) |
| 5 or more Vehicles | 122 (1.6%) | 151 (2.3%) |
| Total | 7,517 (100.0%) | 6,456 (100.0%) |
Commute Time in Aguadilla Municipio
The most frequently occuring commute durations in Aguadilla Municipio are 15 to 19 minutes (3,875 commuters, 29.0%), 10 to 14 minutes (2,475 commuters, 18.5%), and 20 to 24 minutes (1,848 commuters, 13.9%).
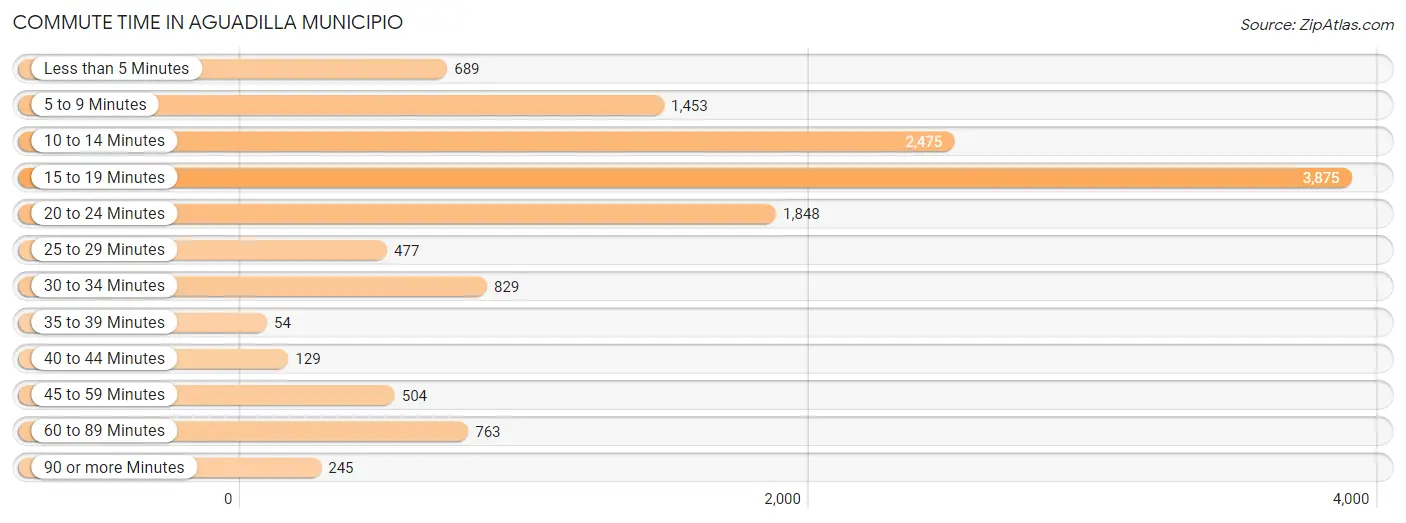
| Commute Time | # Commuters | % Commuters |
| Less than 5 Minutes | 689 | 5.2% |
| 5 to 9 Minutes | 1,453 | 10.9% |
| 10 to 14 Minutes | 2,475 | 18.5% |
| 15 to 19 Minutes | 3,875 | 29.0% |
| 20 to 24 Minutes | 1,848 | 13.9% |
| 25 to 29 Minutes | 477 | 3.6% |
| 30 to 34 Minutes | 829 | 6.2% |
| 35 to 39 Minutes | 54 | 0.4% |
| 40 to 44 Minutes | 129 | 1.0% |
| 45 to 59 Minutes | 504 | 3.8% |
| 60 to 89 Minutes | 763 | 5.7% |
| 90 or more Minutes | 245 | 1.8% |
Commute Time by Sex in Aguadilla Municipio
The most common commute times in Aguadilla Municipio are 15 to 19 minutes (2,001 commuters, 27.1%) for males and 15 to 19 minutes (1,874 commuters, 31.5%) for females.
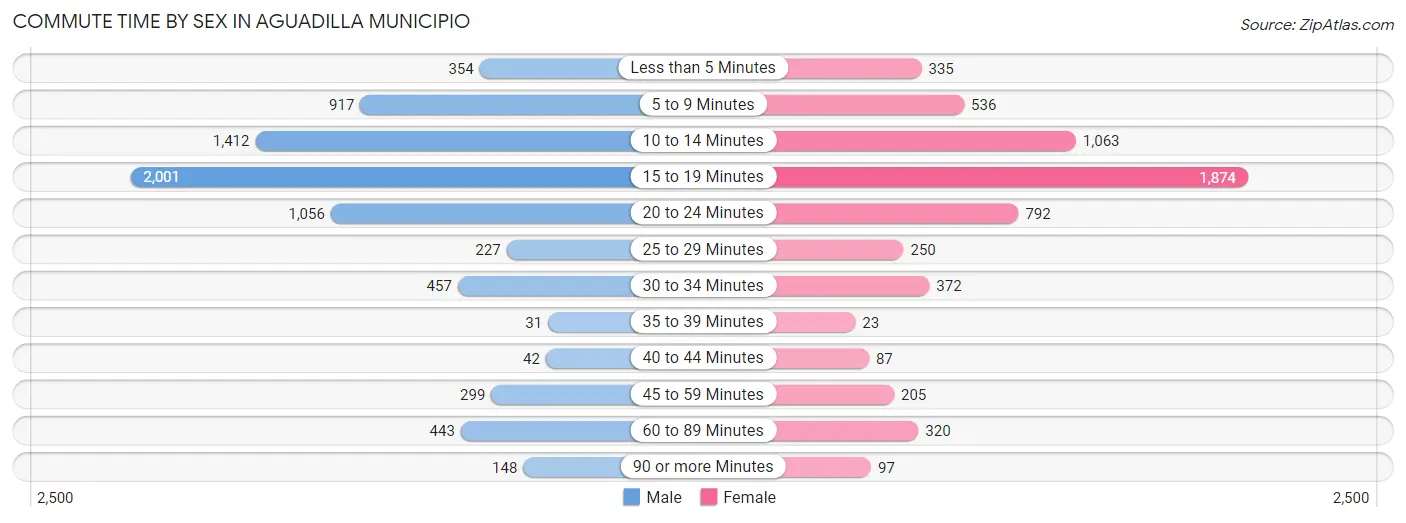
| Commute Time | Male | Female |
| Less than 5 Minutes | 354 (4.8%) | 335 (5.6%) |
| 5 to 9 Minutes | 917 (12.4%) | 536 (9.0%) |
| 10 to 14 Minutes | 1,412 (19.1%) | 1,063 (17.8%) |
| 15 to 19 Minutes | 2,001 (27.1%) | 1,874 (31.5%) |
| 20 to 24 Minutes | 1,056 (14.3%) | 792 (13.3%) |
| 25 to 29 Minutes | 227 (3.1%) | 250 (4.2%) |
| 30 to 34 Minutes | 457 (6.2%) | 372 (6.2%) |
| 35 to 39 Minutes | 31 (0.4%) | 23 (0.4%) |
| 40 to 44 Minutes | 42 (0.6%) | 87 (1.5%) |
| 45 to 59 Minutes | 299 (4.1%) | 205 (3.4%) |
| 60 to 89 Minutes | 443 (6.0%) | 320 (5.4%) |
| 90 or more Minutes | 148 (2.0%) | 97 (1.6%) |
Time of Departure to Work by Sex in Aguadilla Municipio
The most frequent times of departure to work in Aguadilla Municipio are 7:00 AM to 7:29 AM (1,020, 13.8%) for males and 7:00 AM to 7:29 AM (1,296, 21.8%) for females.
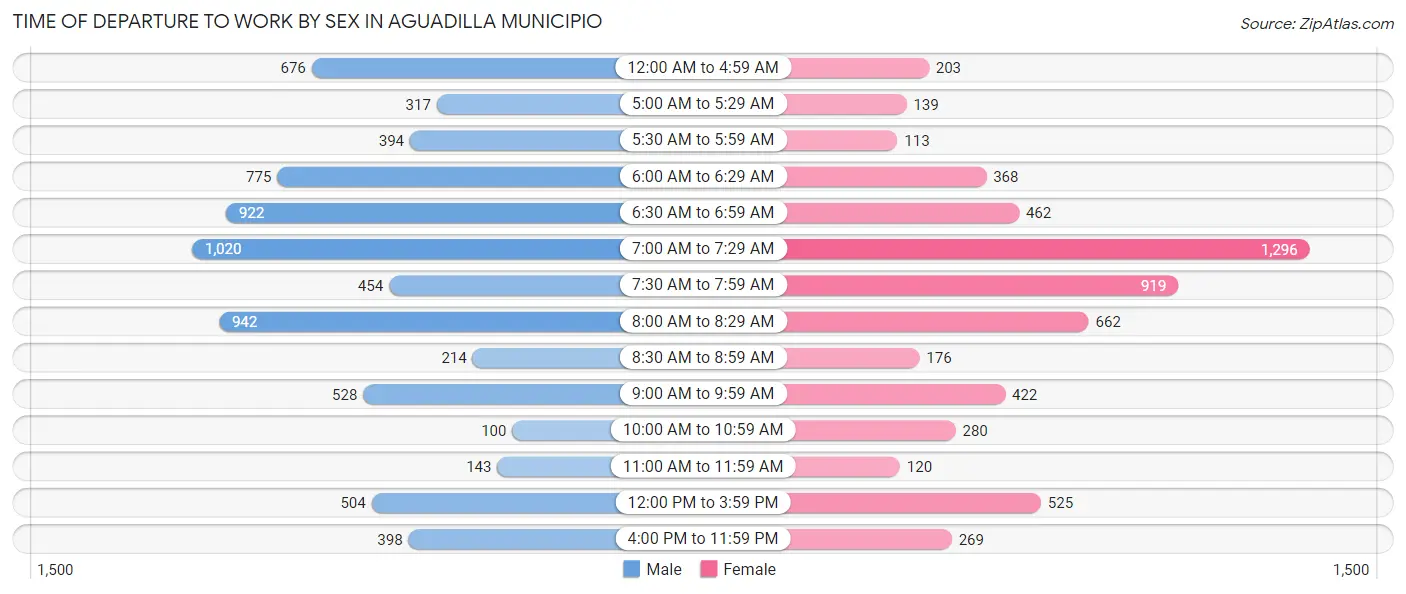
| Time of Departure | Male | Female |
| 12:00 AM to 4:59 AM | 676 (9.1%) | 203 (3.4%) |
| 5:00 AM to 5:29 AM | 317 (4.3%) | 139 (2.3%) |
| 5:30 AM to 5:59 AM | 394 (5.3%) | 113 (1.9%) |
| 6:00 AM to 6:29 AM | 775 (10.5%) | 368 (6.2%) |
| 6:30 AM to 6:59 AM | 922 (12.5%) | 462 (7.8%) |
| 7:00 AM to 7:29 AM | 1,020 (13.8%) | 1,296 (21.8%) |
| 7:30 AM to 7:59 AM | 454 (6.1%) | 919 (15.4%) |
| 8:00 AM to 8:29 AM | 942 (12.8%) | 662 (11.1%) |
| 8:30 AM to 8:59 AM | 214 (2.9%) | 176 (3.0%) |
| 9:00 AM to 9:59 AM | 528 (7.1%) | 422 (7.1%) |
| 10:00 AM to 10:59 AM | 100 (1.3%) | 280 (4.7%) |
| 11:00 AM to 11:59 AM | 143 (1.9%) | 120 (2.0%) |
| 12:00 PM to 3:59 PM | 504 (6.8%) | 525 (8.8%) |
| 4:00 PM to 11:59 PM | 398 (5.4%) | 269 (4.5%) |
| Total | 7,387 (100.0%) | 5,954 (100.0%) |
Housing Occupancy in Aguadilla Municipio
Occupancy by Ownership in Aguadilla Municipio
Of the total 21,650 dwellings in Aguadilla Municipio, owner-occupied units account for 12,591 (58.2%), while renter-occupied units make up 9,059 (41.8%).
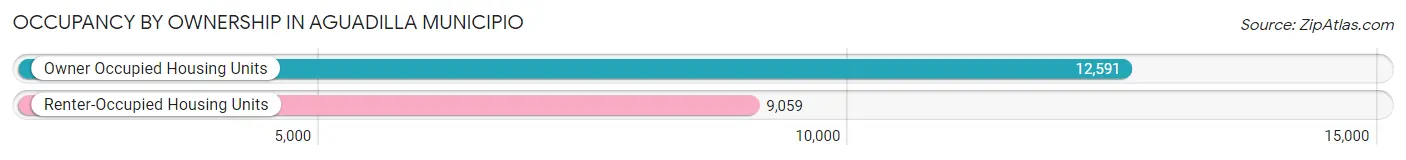
| Occupancy | # Housing Units | % Housing Units |
| Owner Occupied Housing Units | 12,591 | 58.2% |
| Renter-Occupied Housing Units | 9,059 | 41.8% |
| Total Occupied Housing Units | 21,650 | 100.0% |
Occupancy by Household Size in Aguadilla Municipio
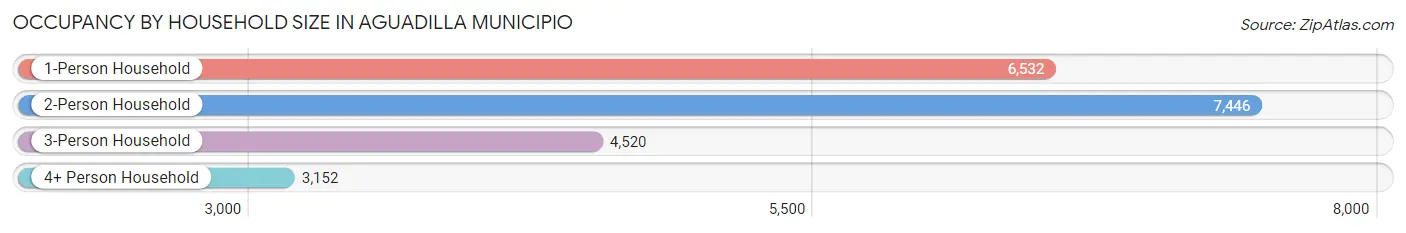
| Household Size | # Housing Units | % Housing Units |
| 1-Person Household | 6,532 | 30.2% |
| 2-Person Household | 7,446 | 34.4% |
| 3-Person Household | 4,520 | 20.9% |
| 4+ Person Household | 3,152 | 14.6% |
| Total Housing Units | 21,650 | 100.0% |
Occupancy by Ownership by Household Size in Aguadilla Municipio
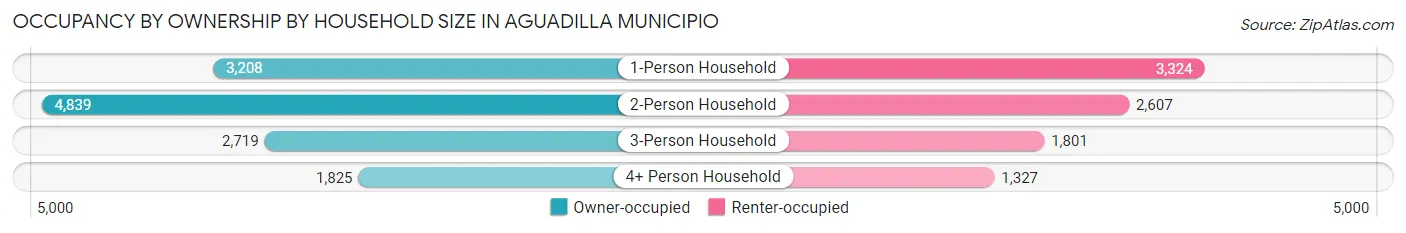
| Household Size | Owner-occupied | Renter-occupied |
| 1-Person Household | 3,208 (49.1%) | 3,324 (50.9%) |
| 2-Person Household | 4,839 (65.0%) | 2,607 (35.0%) |
| 3-Person Household | 2,719 (60.2%) | 1,801 (39.9%) |
| 4+ Person Household | 1,825 (57.9%) | 1,327 (42.1%) |
| Total Housing Units | 12,591 (58.2%) | 9,059 (41.8%) |
Occupancy by Educational Attainment in Aguadilla Municipio
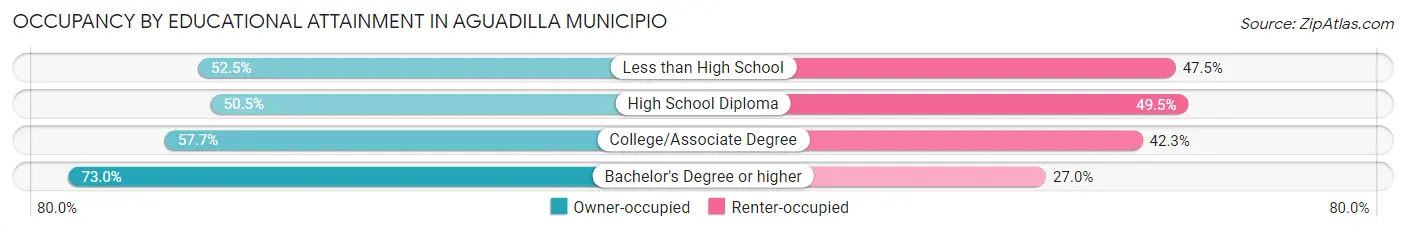
| Household Size | Owner-occupied | Renter-occupied |
| Less than High School | 2,973 (52.5%) | 2,691 (47.5%) |
| High School Diploma | 3,208 (50.5%) | 3,146 (49.5%) |
| College/Associate Degree | 2,358 (57.7%) | 1,726 (42.3%) |
| Bachelor's Degree or higher | 4,052 (73.0%) | 1,496 (27.0%) |
Occupancy by Age of Householder in Aguadilla Municipio
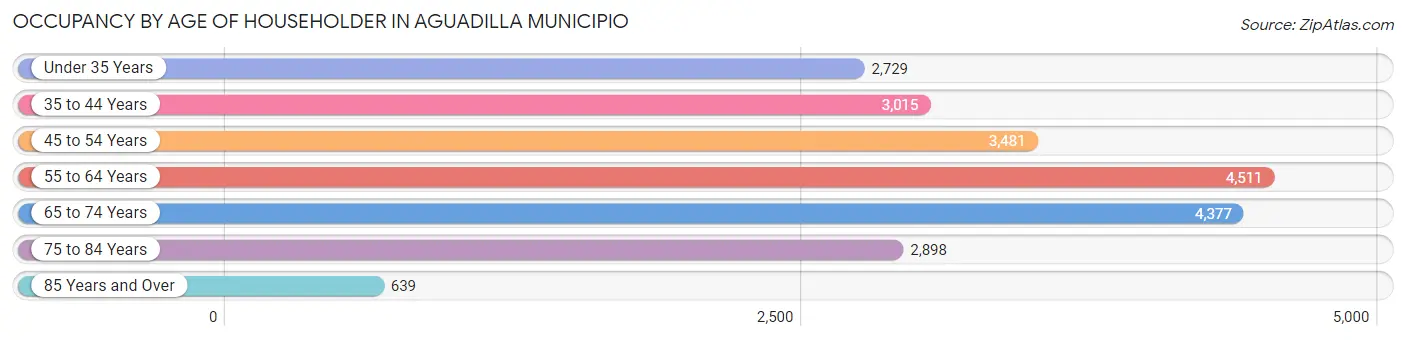
| Age Bracket | # Households | % Households |
| Under 35 Years | 2,729 | 12.6% |
| 35 to 44 Years | 3,015 | 13.9% |
| 45 to 54 Years | 3,481 | 16.1% |
| 55 to 64 Years | 4,511 | 20.8% |
| 65 to 74 Years | 4,377 | 20.2% |
| 75 to 84 Years | 2,898 | 13.4% |
| 85 Years and Over | 639 | 2.9% |
| Total | 21,650 | 100.0% |
Housing Finances in Aguadilla Municipio
Median Income by Occupancy in Aguadilla Municipio
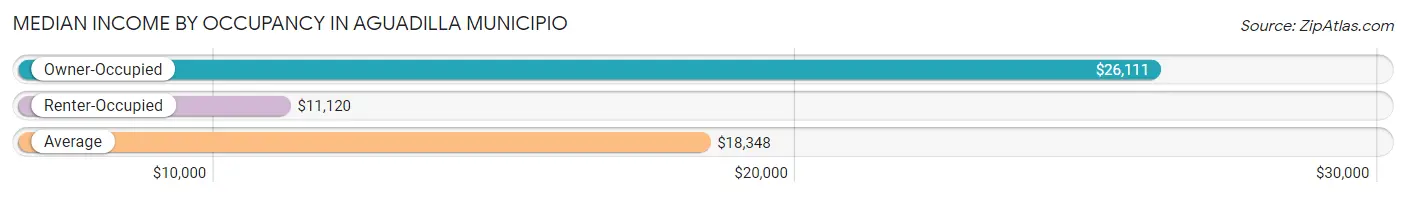
| Occupancy Type | # Households | Median Income |
| Owner-Occupied | 12,591 (58.2%) | $26,111 |
| Renter-Occupied | 9,059 (41.8%) | $11,120 |
| Average | 21,650 (100.0%) | $18,348 |
Occupancy by Householder Income Bracket in Aguadilla Municipio
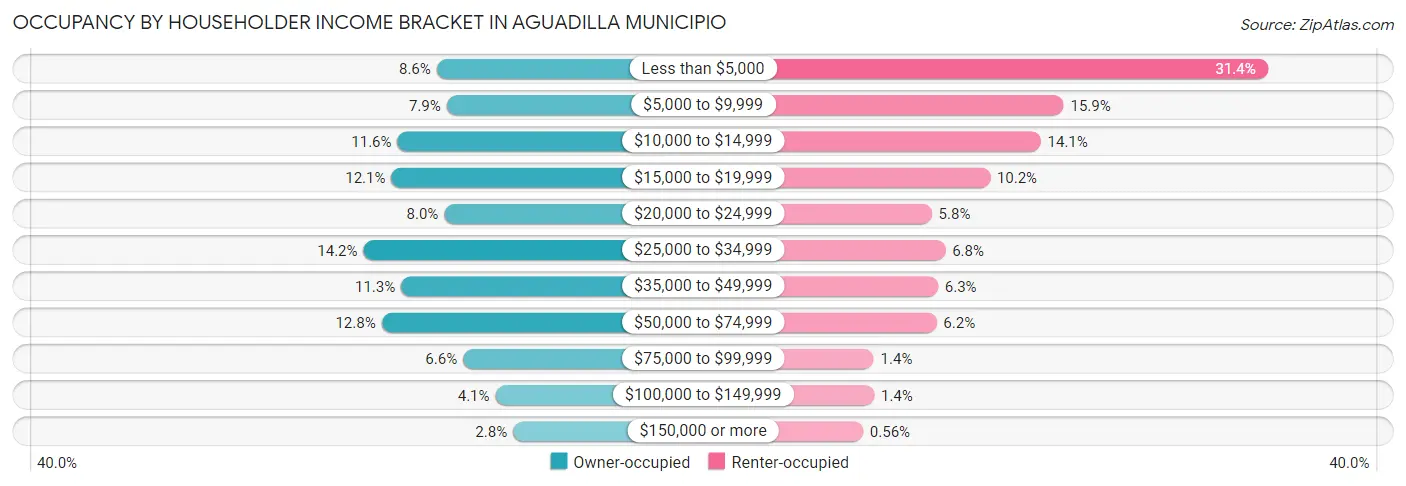
| Income Bracket | Owner-occupied | Renter-occupied |
| Less than $5,000 | 1,084 (8.6%) | 2,844 (31.4%) |
| $5,000 to $9,999 | 989 (7.9%) | 1,436 (15.9%) |
| $10,000 to $14,999 | 1,461 (11.6%) | 1,277 (14.1%) |
| $15,000 to $19,999 | 1,519 (12.1%) | 928 (10.2%) |
| $20,000 to $24,999 | 1,011 (8.0%) | 525 (5.8%) |
| $25,000 to $34,999 | 1,787 (14.2%) | 619 (6.8%) |
| $35,000 to $49,999 | 1,425 (11.3%) | 568 (6.3%) |
| $50,000 to $74,999 | 1,613 (12.8%) | 558 (6.2%) |
| $75,000 to $99,999 | 831 (6.6%) | 125 (1.4%) |
| $100,000 to $149,999 | 520 (4.1%) | 128 (1.4%) |
| $150,000 or more | 351 (2.8%) | 51 (0.6%) |
| Total | 12,591 (100.0%) | 9,059 (100.0%) |
Monthly Housing Cost Tiers in Aguadilla Municipio
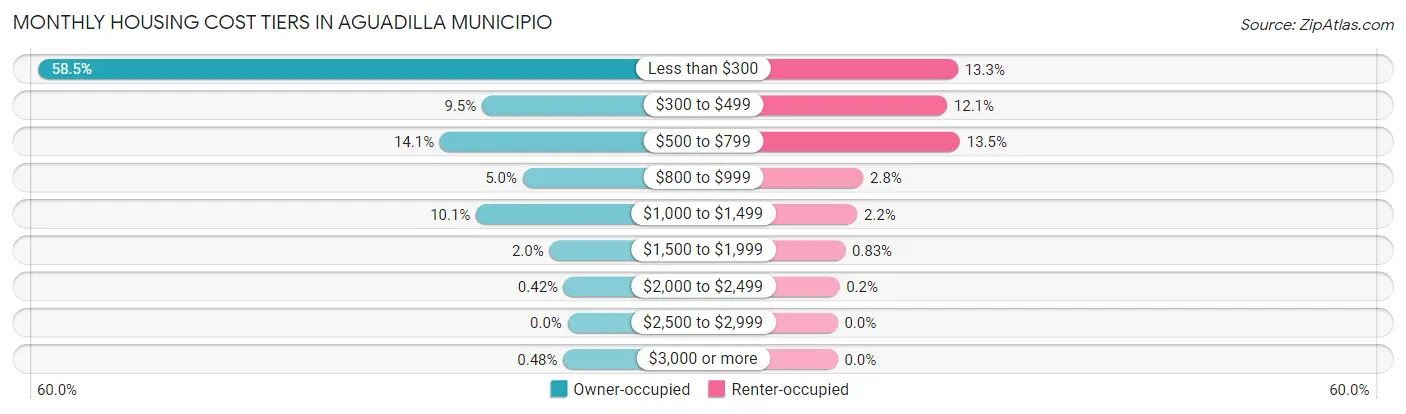
| Monthly Cost | Owner-occupied | Renter-occupied |
| Less than $300 | 7,360 (58.5%) | 1,204 (13.3%) |
| $300 to $499 | 1,191 (9.5%) | 1,095 (12.1%) |
| $500 to $799 | 1,776 (14.1%) | 1,225 (13.5%) |
| $800 to $999 | 624 (5.0%) | 257 (2.8%) |
| $1,000 to $1,499 | 1,273 (10.1%) | 196 (2.2%) |
| $1,500 to $1,999 | 253 (2.0%) | 75 (0.8%) |
| $2,000 to $2,499 | 53 (0.4%) | 18 (0.2%) |
| $2,500 to $2,999 | 0 (0.0%) | 0 (0.0%) |
| $3,000 or more | 61 (0.5%) | 0 (0.0%) |
| Total | 12,591 (100.0%) | 9,059 (100.0%) |
Physical Housing Characteristics in Aguadilla Municipio
Housing Structures in Aguadilla Municipio
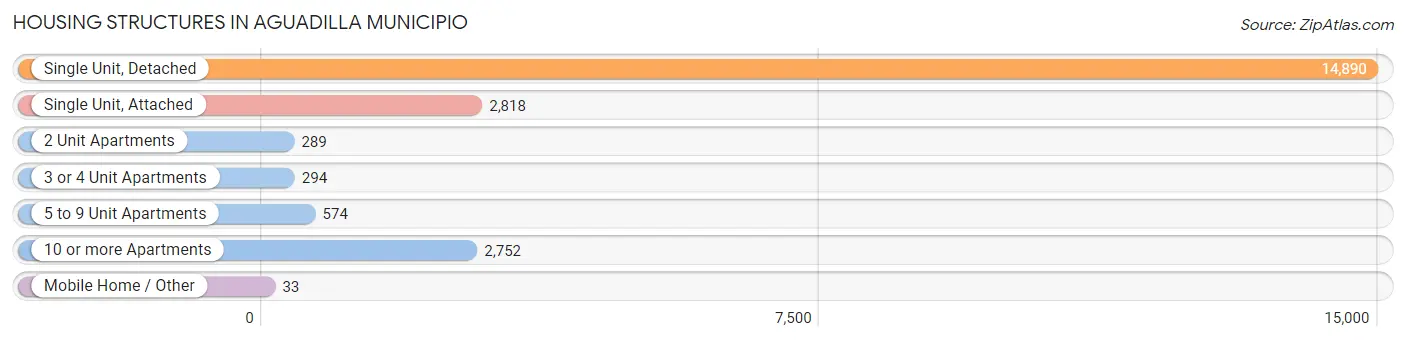
| Structure Type | # Housing Units | % Housing Units |
| Single Unit, Detached | 14,890 | 68.8% |
| Single Unit, Attached | 2,818 | 13.0% |
| 2 Unit Apartments | 289 | 1.3% |
| 3 or 4 Unit Apartments | 294 | 1.4% |
| 5 to 9 Unit Apartments | 574 | 2.6% |
| 10 or more Apartments | 2,752 | 12.7% |
| Mobile Home / Other | 33 | 0.2% |
| Total | 21,650 | 100.0% |
Housing Structures by Occupancy in Aguadilla Municipio
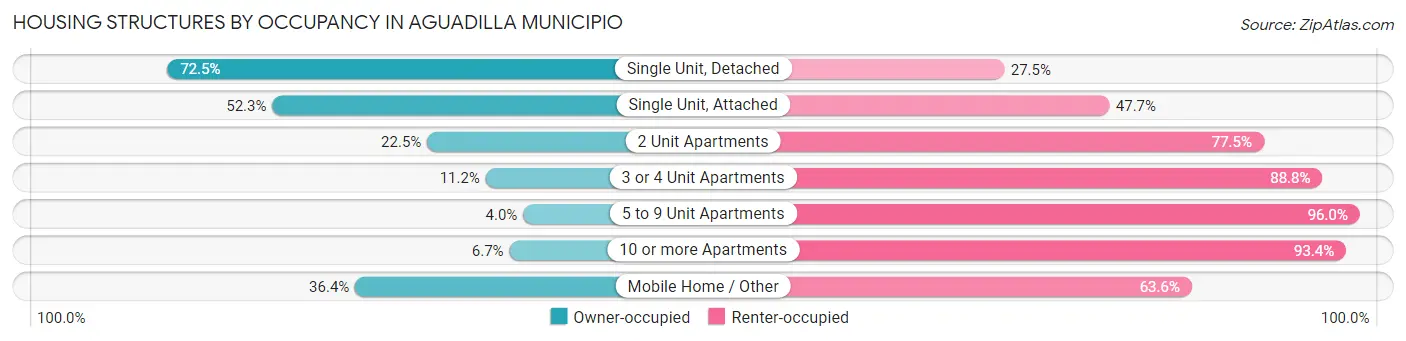
| Structure Type | Owner-occupied | Renter-occupied |
| Single Unit, Detached | 10,801 (72.5%) | 4,089 (27.5%) |
| Single Unit, Attached | 1,474 (52.3%) | 1,344 (47.7%) |
| 2 Unit Apartments | 65 (22.5%) | 224 (77.5%) |
| 3 or 4 Unit Apartments | 33 (11.2%) | 261 (88.8%) |
| 5 to 9 Unit Apartments | 23 (4.0%) | 551 (96.0%) |
| 10 or more Apartments | 183 (6.7%) | 2,569 (93.3%) |
| Mobile Home / Other | 12 (36.4%) | 21 (63.6%) |
| Total | 12,591 (58.2%) | 9,059 (41.8%) |
Housing Structures by Number of Rooms in Aguadilla Municipio
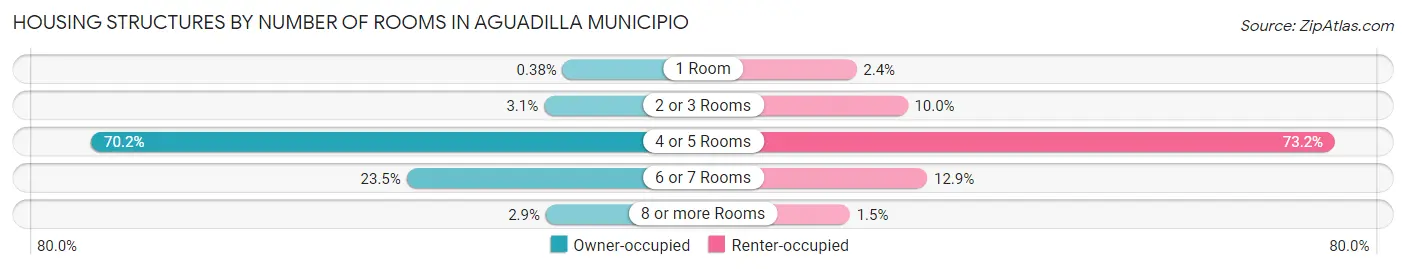
| Number of Rooms | Owner-occupied | Renter-occupied |
| 1 Room | 48 (0.4%) | 220 (2.4%) |
| 2 or 3 Rooms | 394 (3.1%) | 905 (10.0%) |
| 4 or 5 Rooms | 8,833 (70.2%) | 6,635 (73.2%) |
| 6 or 7 Rooms | 2,955 (23.5%) | 1,168 (12.9%) |
| 8 or more Rooms | 361 (2.9%) | 131 (1.5%) |
| Total | 12,591 (100.0%) | 9,059 (100.0%) |
Housing Structure by Heating Type in Aguadilla Municipio
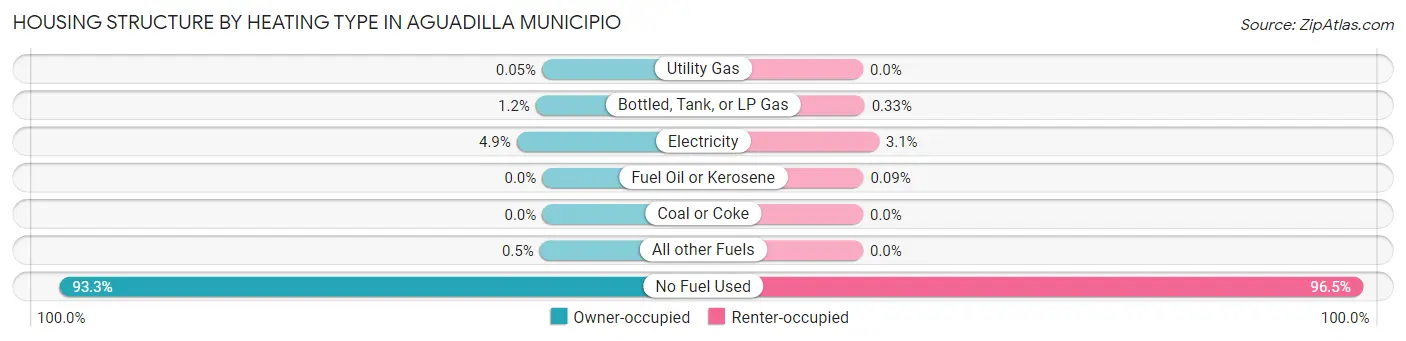
| Heating Type | Owner-occupied | Renter-occupied |
| Utility Gas | 6 (0.1%) | 0 (0.0%) |
| Bottled, Tank, or LP Gas | 156 (1.2%) | 30 (0.3%) |
| Electricity | 620 (4.9%) | 277 (3.1%) |
| Fuel Oil or Kerosene | 0 (0.0%) | 8 (0.1%) |
| Coal or Coke | 0 (0.0%) | 0 (0.0%) |
| All other Fuels | 63 (0.5%) | 0 (0.0%) |
| No Fuel Used | 11,746 (93.3%) | 8,744 (96.5%) |
| Total | 12,591 (100.0%) | 9,059 (100.0%) |
Household Vehicle Usage in Aguadilla Municipio
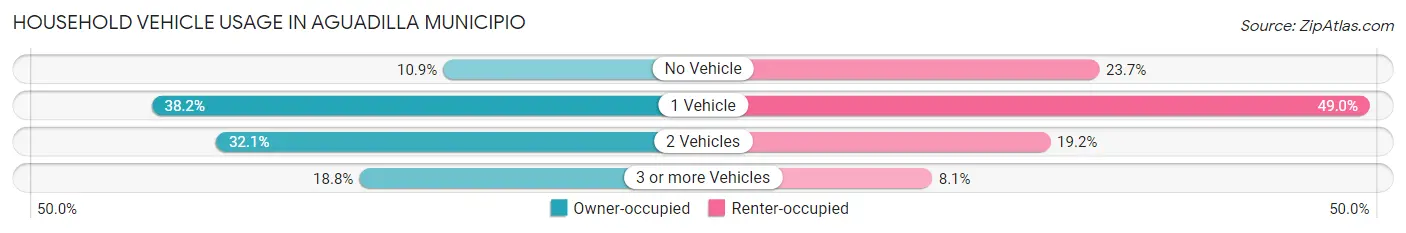
| Vehicles per Household | Owner-occupied | Renter-occupied |
| No Vehicle | 1,378 (10.9%) | 2,149 (23.7%) |
| 1 Vehicle | 4,804 (38.2%) | 4,439 (49.0%) |
| 2 Vehicles | 4,046 (32.1%) | 1,736 (19.2%) |
| 3 or more Vehicles | 2,363 (18.8%) | 735 (8.1%) |
| Total | 12,591 (100.0%) | 9,059 (100.0%) |
Real Estate & Mortgages in Aguadilla Municipio
Real Estate and Mortgage Overview in Aguadilla Municipio
| Characteristic | Without Mortgage | With Mortgage |
| Housing Units | 8,554 | 4,037 |
| Median Property Value | $118,500 | $154,400 |
| Median Household Income | $21,671 | $130 |
| Monthly Housing Costs | $155 | $54 |
| Real Estate Taxes | $537 | $3,288 |
Property Value by Mortgage Status in Aguadilla Municipio
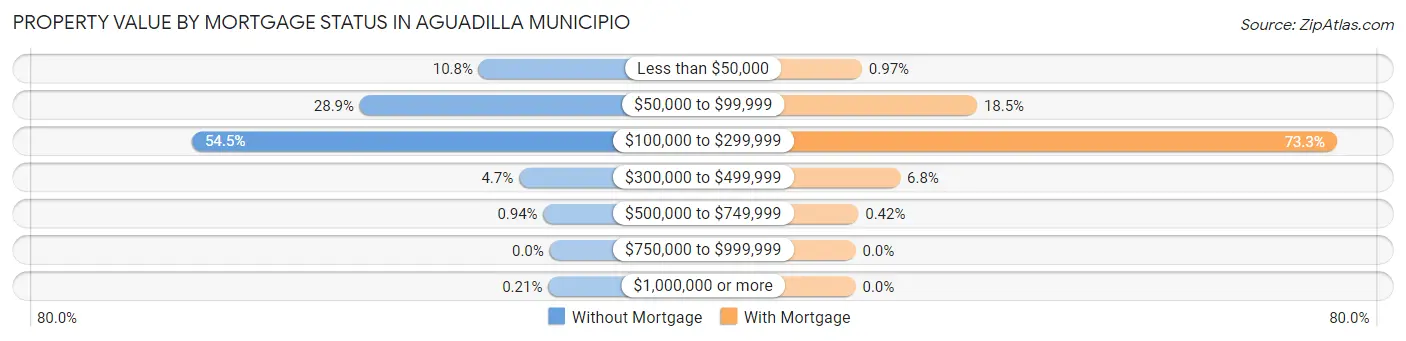
| Property Value | Without Mortgage | With Mortgage |
| Less than $50,000 | 923 (10.8%) | 39 (1.0%) |
| $50,000 to $99,999 | 2,473 (28.9%) | 747 (18.5%) |
| $100,000 to $299,999 | 4,661 (54.5%) | 2,960 (73.3%) |
| $300,000 to $499,999 | 399 (4.7%) | 274 (6.8%) |
| $500,000 to $749,999 | 80 (0.9%) | 17 (0.4%) |
| $750,000 to $999,999 | 0 (0.0%) | 0 (0.0%) |
| $1,000,000 or more | 18 (0.2%) | 0 (0.0%) |
| Total | 8,554 (100.0%) | 4,037 (100.0%) |
Household Income by Mortgage Status in Aguadilla Municipio
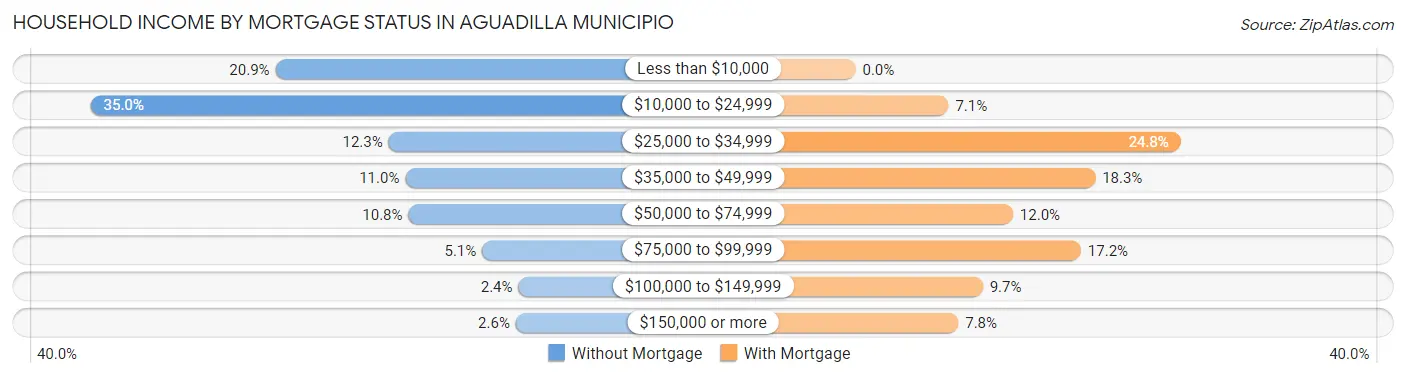
| Household Income | Without Mortgage | With Mortgage |
| Less than $10,000 | 1,787 (20.9%) | 0 (0.0%) |
| $10,000 to $24,999 | 2,991 (35.0%) | 286 (7.1%) |
| $25,000 to $34,999 | 1,050 (12.3%) | 1,000 (24.8%) |
| $35,000 to $49,999 | 941 (11.0%) | 737 (18.3%) |
| $50,000 to $74,999 | 920 (10.8%) | 484 (12.0%) |
| $75,000 to $99,999 | 440 (5.1%) | 693 (17.2%) |
| $100,000 to $149,999 | 204 (2.4%) | 391 (9.7%) |
| $150,000 or more | 221 (2.6%) | 316 (7.8%) |
| Total | 8,554 (100.0%) | 4,037 (100.0%) |
Property Value to Household Income Ratio in Aguadilla Municipio
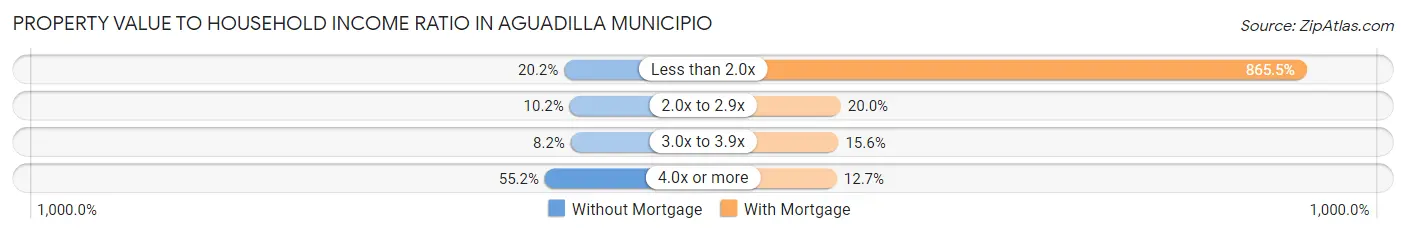
| Value-to-Income Ratio | Without Mortgage | With Mortgage |
| Less than 2.0x | 1,725 (20.2%) | 34,942 (865.5%) |
| 2.0x to 2.9x | 870 (10.2%) | 806 (20.0%) |
| 3.0x to 3.9x | 702 (8.2%) | 629 (15.6%) |
| 4.0x or more | 4,723 (55.2%) | 511 (12.7%) |
| Total | 8,554 (100.0%) | 4,037 (100.0%) |
Real Estate Taxes by Mortgage Status in Aguadilla Municipio
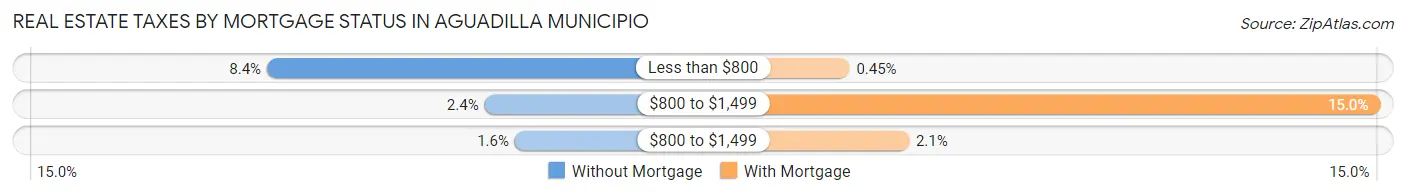
| Property Taxes | Without Mortgage | With Mortgage |
| Less than $800 | 715 (8.4%) | 18 (0.4%) |
| $800 to $1,499 | 205 (2.4%) | 605 (15.0%) |
| $800 to $1,499 | 134 (1.6%) | 84 (2.1%) |
| Total | 8,554 (100.0%) | 4,037 (100.0%) |
Health & Disability in Aguadilla Municipio
Health Insurance Coverage by Age in Aguadilla Municipio
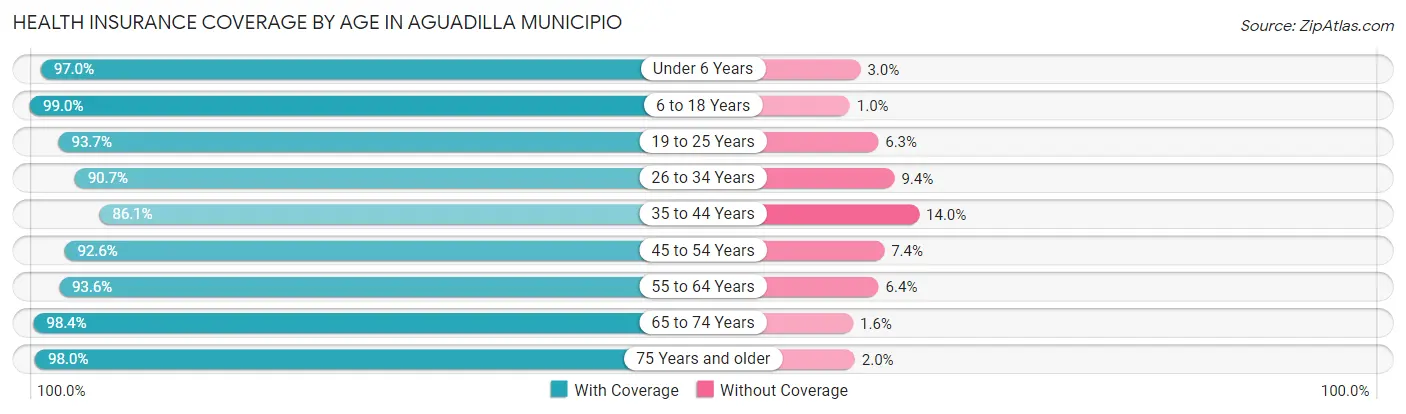
| Age Bracket | With Coverage | Without Coverage |
| Under 6 Years | 2,088 (97.0%) | 65 (3.0%) |
| 6 to 18 Years | 7,973 (99.0%) | 83 (1.0%) |
| 19 to 25 Years | 4,975 (93.7%) | 337 (6.3%) |
| 26 to 34 Years | 5,061 (90.6%) | 522 (9.3%) |
| 35 to 44 Years | 5,515 (86.1%) | 894 (14.0%) |
| 45 to 54 Years | 6,287 (92.6%) | 505 (7.4%) |
| 55 to 64 Years | 6,821 (93.6%) | 467 (6.4%) |
| 65 to 74 Years | 6,708 (98.4%) | 112 (1.6%) |
| 75 Years and older | 5,509 (98.0%) | 110 (2.0%) |
| Total | 50,937 (94.3%) | 3,095 (5.7%) |
Health Insurance Coverage by Citizenship Status in Aguadilla Municipio
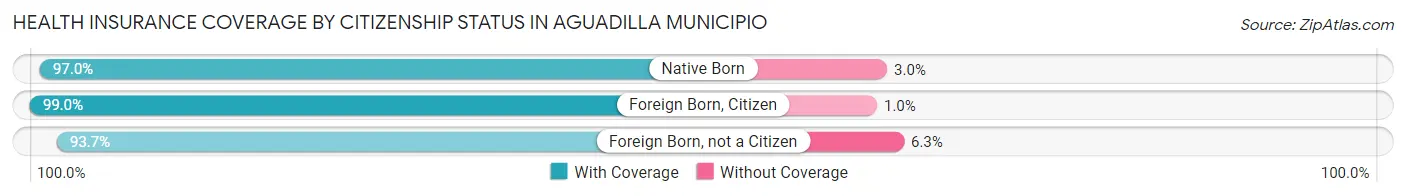
| Citizenship Status | With Coverage | Without Coverage |
| Native Born | 2,088 (97.0%) | 65 (3.0%) |
| Foreign Born, Citizen | 7,973 (99.0%) | 83 (1.0%) |
| Foreign Born, not a Citizen | 4,975 (93.7%) | 337 (6.3%) |
Health Insurance Coverage by Household Income in Aguadilla Municipio
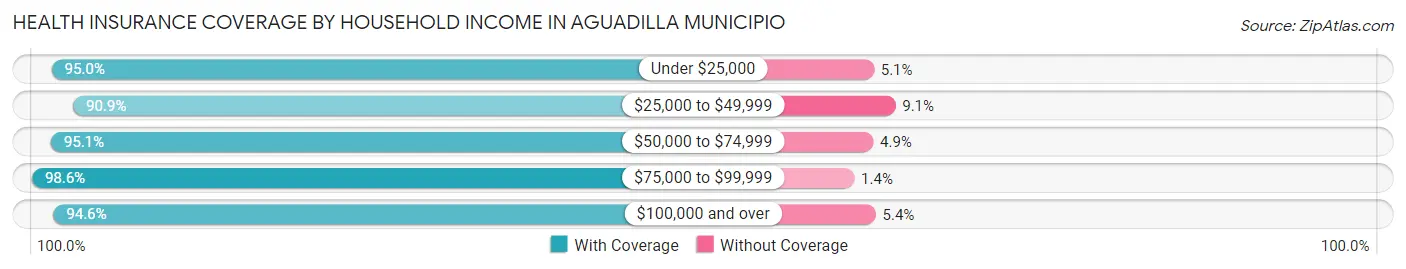
| Household Income | With Coverage | Without Coverage |
| Under $25,000 | 26,164 (95.0%) | 1,393 (5.1%) |
| $25,000 to $49,999 | 11,177 (90.9%) | 1,116 (9.1%) |
| $50,000 to $74,999 | 6,515 (95.1%) | 338 (4.9%) |
| $75,000 to $99,999 | 3,499 (98.6%) | 49 (1.4%) |
| $100,000 and over | 3,291 (94.6%) | 188 (5.4%) |
Public vs Private Health Insurance Coverage by Age in Aguadilla Municipio
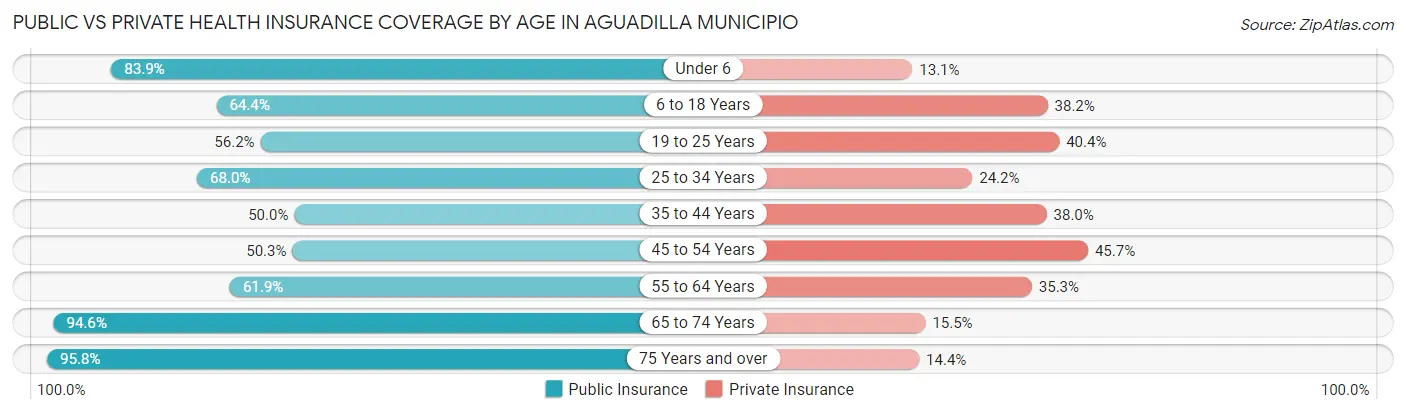
| Age Bracket | Public Insurance | Private Insurance |
| Under 6 | 1,806 (83.9%) | 282 (13.1%) |
| 6 to 18 Years | 5,185 (64.4%) | 3,077 (38.2%) |
| 19 to 25 Years | 2,987 (56.2%) | 2,144 (40.4%) |
| 25 to 34 Years | 3,795 (68.0%) | 1,353 (24.2%) |
| 35 to 44 Years | 3,201 (49.9%) | 2,437 (38.0%) |
| 45 to 54 Years | 3,417 (50.3%) | 3,104 (45.7%) |
| 55 to 64 Years | 4,510 (61.9%) | 2,571 (35.3%) |
| 65 to 74 Years | 6,453 (94.6%) | 1,059 (15.5%) |
| 75 Years and over | 5,384 (95.8%) | 807 (14.4%) |
| Total | 36,738 (68.0%) | 16,834 (31.2%) |
Disability Status by Sex by Age in Aguadilla Municipio
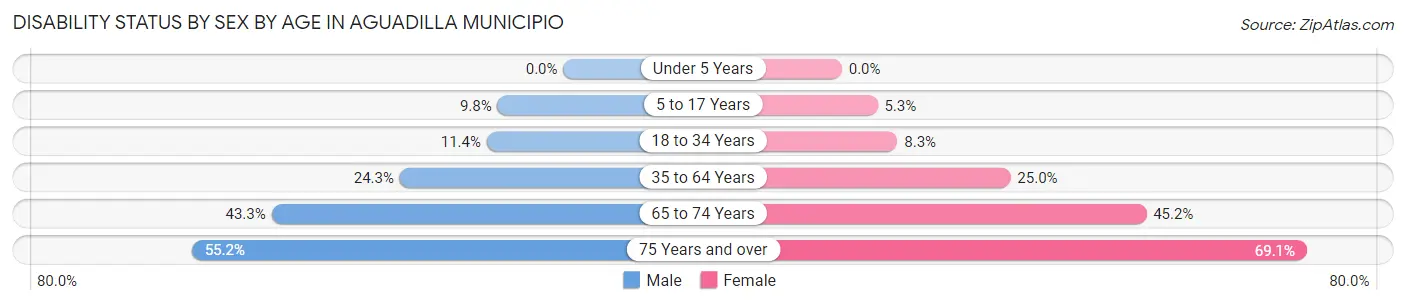
| Age Bracket | Male | Female |
| Under 5 Years | 0 (0.0%) | 0 (0.0%) |
| 5 to 17 Years | 391 (9.8%) | 194 (5.3%) |
| 18 to 34 Years | 678 (11.4%) | 465 (8.3%) |
| 35 to 64 Years | 2,273 (24.3%) | 2,787 (25.0%) |
| 65 to 74 Years | 1,358 (43.3%) | 1,666 (45.2%) |
| 75 Years and over | 1,400 (55.2%) | 2,128 (69.1%) |
Disability Class by Sex by Age in Aguadilla Municipio
Disability Class: Hearing Difficulty
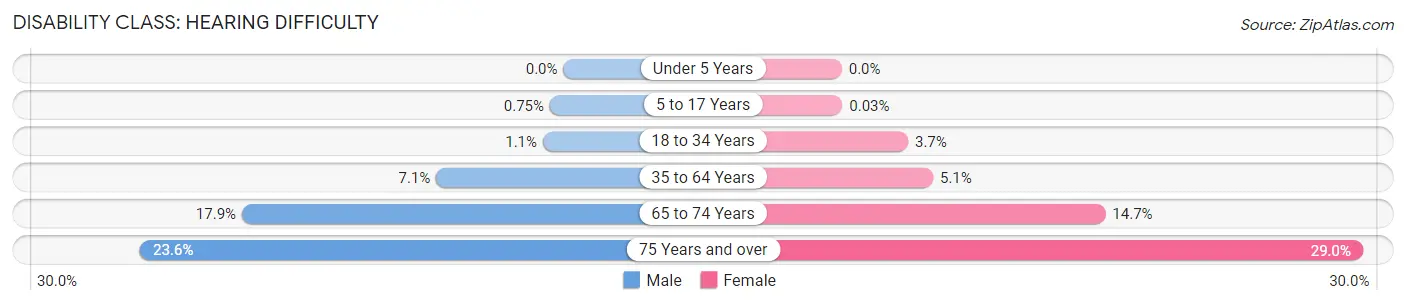
| Age Bracket | Male | Female |
| Under 5 Years | 0 (0.0%) | 0 (0.0%) |
| 5 to 17 Years | 30 (0.7%) | 1 (0.0%) |
| 18 to 34 Years | 68 (1.1%) | 208 (3.7%) |
| 35 to 64 Years | 663 (7.1%) | 565 (5.1%) |
| 65 to 74 Years | 561 (17.9%) | 541 (14.7%) |
| 75 Years and over | 598 (23.6%) | 894 (29.0%) |
Disability Class: Vision Difficulty
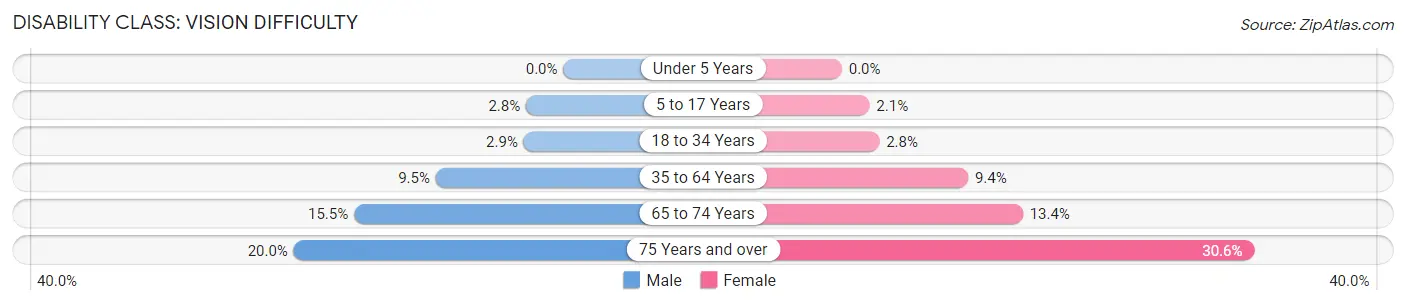
| Age Bracket | Male | Female |
| Under 5 Years | 0 (0.0%) | 0 (0.0%) |
| 5 to 17 Years | 111 (2.8%) | 75 (2.1%) |
| 18 to 34 Years | 175 (2.9%) | 157 (2.8%) |
| 35 to 64 Years | 886 (9.5%) | 1,043 (9.4%) |
| 65 to 74 Years | 487 (15.5%) | 495 (13.4%) |
| 75 Years and over | 508 (20.0%) | 944 (30.6%) |
Disability Class: Cognitive Difficulty
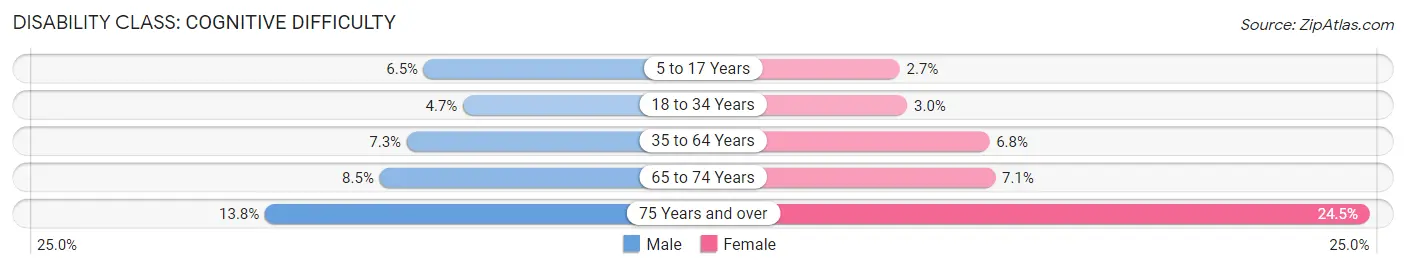
| Age Bracket | Male | Female |
| 5 to 17 Years | 259 (6.5%) | 98 (2.7%) |
| 18 to 34 Years | 277 (4.6%) | 171 (3.0%) |
| 35 to 64 Years | 679 (7.3%) | 761 (6.8%) |
| 65 to 74 Years | 267 (8.5%) | 262 (7.1%) |
| 75 Years and over | 351 (13.8%) | 755 (24.5%) |
Disability Class: Ambulatory Difficulty
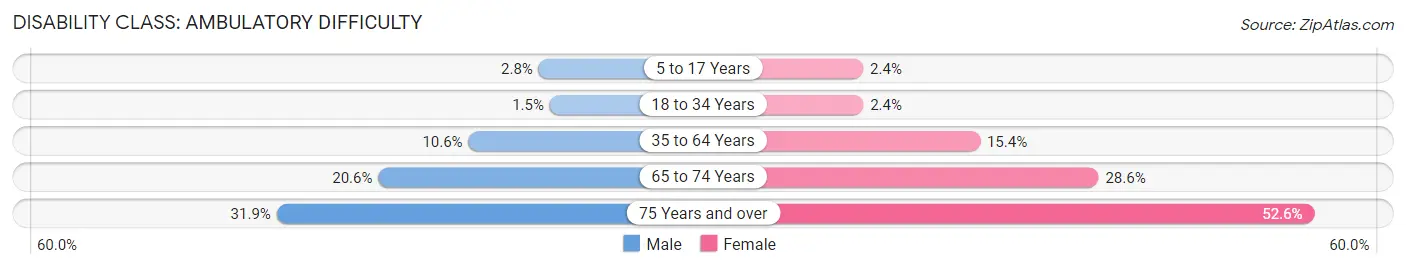
| Age Bracket | Male | Female |
| 5 to 17 Years | 110 (2.8%) | 87 (2.4%) |
| 18 to 34 Years | 90 (1.5%) | 135 (2.4%) |
| 35 to 64 Years | 989 (10.6%) | 1,713 (15.4%) |
| 65 to 74 Years | 646 (20.6%) | 1,054 (28.6%) |
| 75 Years and over | 810 (31.9%) | 1,622 (52.6%) |
Disability Class: Self-Care Difficulty
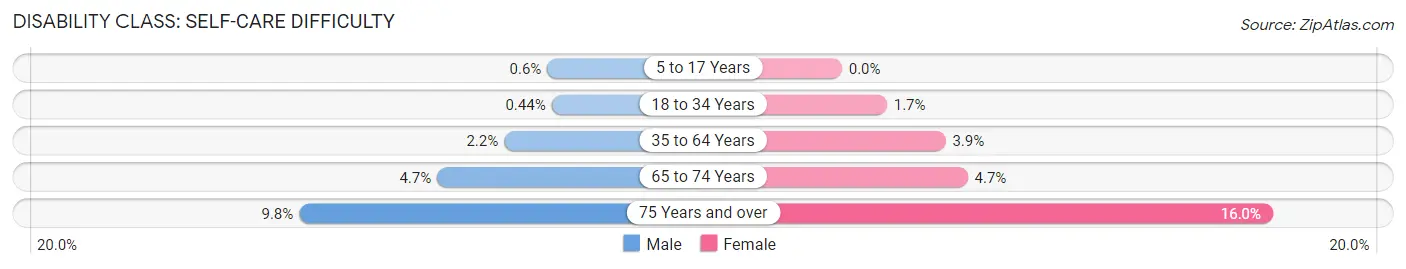
| Age Bracket | Male | Female |
| 5 to 17 Years | 24 (0.6%) | 0 (0.0%) |
| 18 to 34 Years | 26 (0.4%) | 94 (1.7%) |
| 35 to 64 Years | 206 (2.2%) | 429 (3.8%) |
| 65 to 74 Years | 147 (4.7%) | 172 (4.7%) |
| 75 Years and over | 249 (9.8%) | 493 (16.0%) |
Technology Access in Aguadilla Municipio
Computing Device Access in Aguadilla Municipio
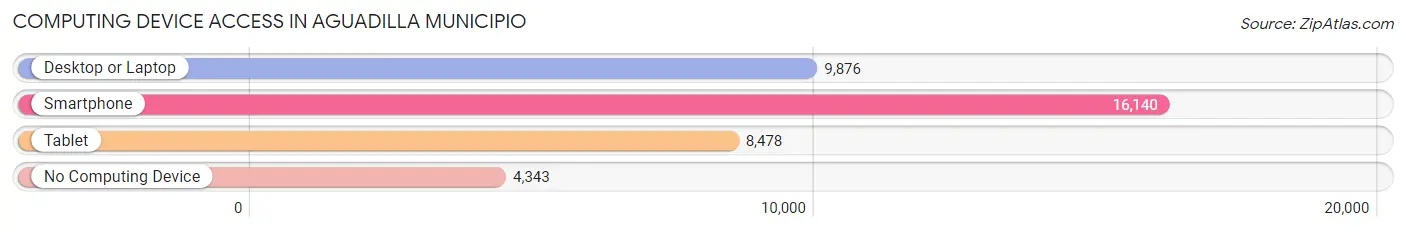
| Device Type | # Households | % Households |
| Desktop or Laptop | 9,876 | 45.6% |
| Smartphone | 16,140 | 74.6% |
| Tablet | 8,478 | 39.2% |
| No Computing Device | 4,343 | 20.1% |
| Total | 21,650 | 100.0% |
Internet Access in Aguadilla Municipio
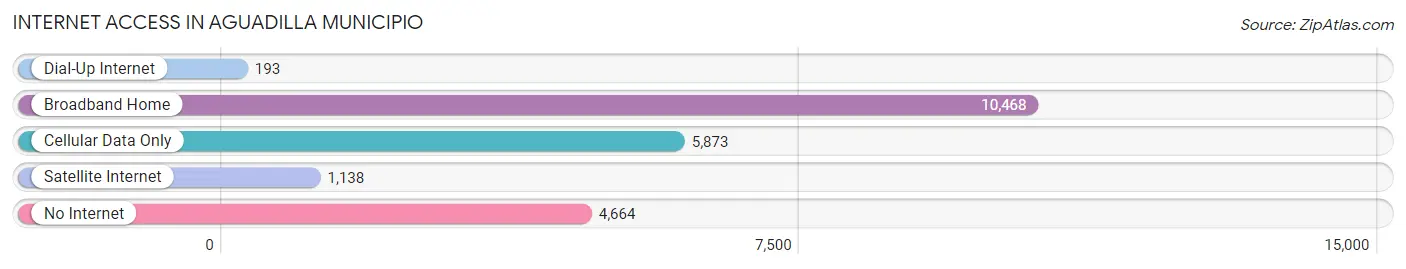
| Internet Type | # Households | % Households |
| Dial-Up Internet | 193 | 0.9% |
| Broadband Home | 10,468 | 48.3% |
| Cellular Data Only | 5,873 | 27.1% |
| Satellite Internet | 1,138 | 5.3% |
| No Internet | 4,664 | 21.5% |
| Total | 21,650 | 100.0% |
Aguadilla Municipio Summary
Aguadilla Municipio, Puerto Rico is located in the northwest corner of the island, and is part of the larger Aguadilla-Isabela-San Sebastián Metropolitan Statistical Area. It is bordered by the municipalities of Isabela to the east, San Sebastián to the south, and Moca to the west. The municipality covers an area of approximately 57 square miles and is home to a population of approximately 70,000 people.
Geography
Aguadilla Municipio is located in the northwest corner of Puerto Rico, and is bordered by the municipalities of Isabela to the east, San Sebastián to the south, and Moca to the west. The municipality covers an area of approximately 57 square miles and is home to a population of approximately 70,000 people. The terrain is mostly flat, with some hills in the northern part of the municipality. The highest point is Cerro La Santa, which is located in the northern part of the municipality and rises to an elevation of 1,067 feet. The municipality is located in a tropical climate zone, with temperatures ranging from the mid-70s to the mid-80s Fahrenheit.
History
Aguadilla Municipio was founded in 1775 by Don Juan de la Cruz, who named it after the nearby Aguadilla River. The area was originally inhabited by the Taíno people, who were later displaced by Spanish settlers. The municipality was part of the Spanish colony of Puerto Rico until 1898, when it became part of the United States following the Spanish-American War. During the 20th century, the municipality experienced rapid growth due to the establishment of the nearby Rafael Hernandez Airport, which is now known as the Rafael Hernandez International Airport.
Economy
Aguadilla Municipio has a diversified economy, with the primary industries being tourism, manufacturing, and agriculture. The municipality is home to several tourist attractions, including the Rafael Hernandez International Airport, the Aguadilla Lighthouse, and the Aguadilla Water Park. The manufacturing sector is dominated by the production of pharmaceuticals, electronics, and textiles. The agricultural sector is primarily focused on the production of coffee, sugarcane, and bananas.
Demographics
As of the 2010 census, the population of Aguadilla Municipio was 70,066, with a population density of 1,223 people per square mile. The racial makeup of the municipality was 79.3% White, 12.2% Black or African American, 0.5% Native American, 0.9% Asian, 0.1% Pacific Islander, and 6.9% from other races. The median household income was $17,845, and the median family income was $20,945. The unemployment rate was 11.3%.
Conclusion
Aguadilla Municipio is a vibrant and diverse municipality located in the northwest corner of Puerto Rico. It is home to a population of approximately 70,000 people, and has a diversified economy that is primarily focused on tourism, manufacturing, and agriculture. The municipality has a tropical climate and is home to several tourist attractions, including the Rafael Hernandez International Airport, the Aguadilla Lighthouse, and the Aguadilla Water Park. The population is primarily of White and Black or African American descent, and the median household income is $17,845.
Common Questions
What is Per Capita Income in Aguadilla Municipio?
Per Capita income in Aguadilla Municipio is $12,887.
What is the Median Family Income in Aguadilla Municipio?
Median Family Income in Aguadilla Municipio is $23,972.
What is the Median Household income in Aguadilla Municipio?
Median Household Income in Aguadilla Municipio is $18,348.
What is Income or Wage Gap in Aguadilla Municipio?
Income or Wage Gap in Aguadilla Municipio is 4.9%.
Women in Aguadilla Municipio earn 95.1 cents for every dollar earned by a man.
What is Family Income Deficit in Aguadilla Municipio?
Family Income Deficit in Aguadilla Municipio is $12,118.
Families that are below poverty line in Aguadilla Municipio earn $12,118 less on average than the poverty threshold level.
What is Inequality or Gini Index in Aguadilla Municipio?
Inequality or Gini Index in Aguadilla Municipio is 0.55.
What is the Total Population of Aguadilla Municipio?
Total Population of Aguadilla Municipio is 54,752.
What is the Total Male Population of Aguadilla Municipio?
Total Male Population of Aguadilla Municipio is 26,561.
What is the Total Female Population of Aguadilla Municipio?
Total Female Population of Aguadilla Municipio is 28,191.
What is the Ratio of Males per 100 Females in Aguadilla Municipio?
There are 94.22 Males per 100 Females in Aguadilla Municipio.
What is the Ratio of Females per 100 Males in Aguadilla Municipio?
There are 106.14 Females per 100 Males in Aguadilla Municipio.
What is the Median Population Age in Aguadilla Municipio?
Median Population Age in Aguadilla Municipio is 44.0 Years.
What is the Average Family Size in Aguadilla Municipio
Average Family Size in Aguadilla Municipio is 3.1 People.
What is the Average Household Size in Aguadilla Municipio
Average Household Size in Aguadilla Municipio is 2.5 People.
How Large is the Labor Force in Aguadilla Municipio?
There are 17,966 People in the Labor Forcein in Aguadilla Municipio.
What is the Percentage of People in the Labor Force in Aguadilla Municipio?
38.6% of People are in the Labor Force in Aguadilla Municipio.
What is the Unemployment Rate in Aguadilla Municipio?
Unemployment Rate in Aguadilla Municipio is 15.5%.