Aguada Municipio, PR Map & Demographics
Aguada Municipio Map
Aguada Municipio Overview
$11,364
PER CAPITA INCOME
$24,091
AVG FAMILY INCOME
$20,301
AVG HOUSEHOLD INCOME
5.5%
WAGE / INCOME GAP [ % ]
94.5¢/ $1
WAGE / INCOME GAP [ $ ]
$9,831
FAMILY INCOME DEFICIT
0.47
INEQUALITY / GINI INDEX
37,998
TOTAL POPULATION
18,528
MALE POPULATION
19,470
FEMALE POPULATION
95.16
MALES / 100 FEMALES
105.08
FEMALES / 100 MALES
45.4
MEDIAN AGE
3.6
AVG FAMILY SIZE
2.9
AVG HOUSEHOLD SIZE
12,317
LABOR FORCE [ PEOPLE ]
37.6%
PERCENT IN LABOR FORCE
7.6%
UNEMPLOYMENT RATE
Income in Aguada Municipio
Income Overview in Aguada Municipio
Per Capita Income in Aguada Municipio is $11,364, while median incomes of families and households are $24,091 and $20,301 respectively.
| Characteristic | Number | Measure |
| Per Capita Income | 37,998 | $11,364 |
| Median Family Income | 8,760 | $24,091 |
| Mean Family Income | 8,760 | $32,840 |
| Median Household Income | 12,904 | $20,301 |
| Mean Household Income | 12,904 | $28,672 |
| Income Deficit | 8,760 | $9,831 |
| Wage / Income Gap (%) | 37,998 | 5.51% |
| Wage / Income Gap ($) | 37,998 | 94.49¢ per $1 |
| Gini / Inequality Index | 37,998 | 0.47 |
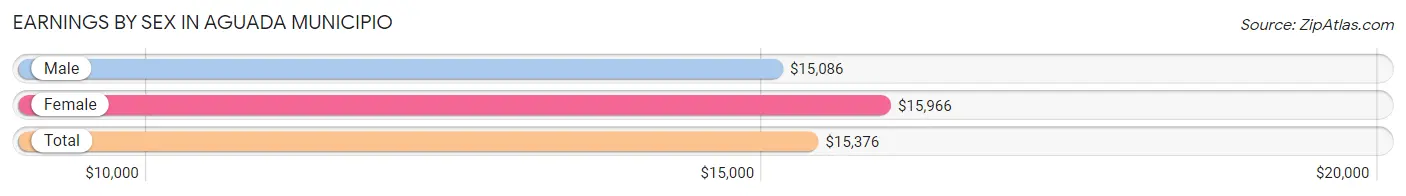
Earnings by Sex in Aguada Municipio
Average Earnings in Aguada Municipio are $15,376, $15,086 for men and $15,966 for women, a difference of 5.5%.
| Sex | Number | Average Earnings |
| Male | 7,192 (59.3%) | $15,086 |
| Female | 4,933 (40.7%) | $15,966 |
| Total | 12,125 (100.0%) | $15,376 |
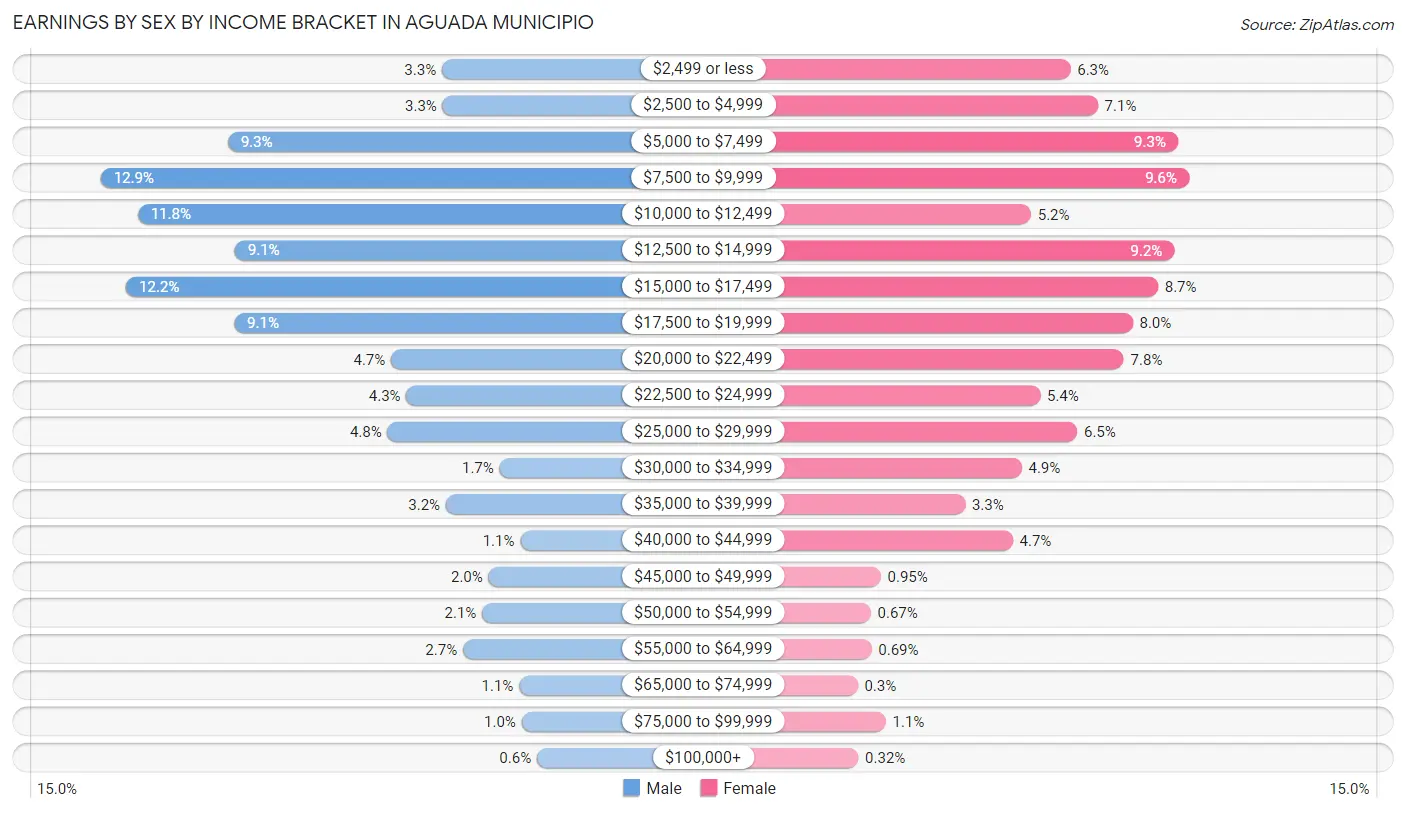
Earnings by Sex by Income Bracket in Aguada Municipio
The most common earnings brackets in Aguada Municipio are $7,500 to $9,999 for men (925 | 12.9%) and $7,500 to $9,999 for women (474 | 9.6%).
| Income | Male | Female |
| $2,499 or less | 235 (3.3%) | 310 (6.3%) |
| $2,500 to $4,999 | 234 (3.3%) | 348 (7.0%) |
| $5,000 to $7,499 | 668 (9.3%) | 459 (9.3%) |
| $7,500 to $9,999 | 925 (12.9%) | 474 (9.6%) |
| $10,000 to $12,499 | 850 (11.8%) | 255 (5.2%) |
| $12,500 to $14,999 | 654 (9.1%) | 454 (9.2%) |
| $15,000 to $17,499 | 874 (12.1%) | 431 (8.7%) |
| $17,500 to $19,999 | 655 (9.1%) | 396 (8.0%) |
| $20,000 to $22,499 | 338 (4.7%) | 384 (7.8%) |
| $22,500 to $24,999 | 307 (4.3%) | 268 (5.4%) |
| $25,000 to $29,999 | 345 (4.8%) | 319 (6.5%) |
| $30,000 to $34,999 | 119 (1.7%) | 242 (4.9%) |
| $35,000 to $39,999 | 227 (3.2%) | 164 (3.3%) |
| $40,000 to $44,999 | 77 (1.1%) | 230 (4.7%) |
| $45,000 to $49,999 | 141 (2.0%) | 47 (0.9%) |
| $50,000 to $54,999 | 154 (2.1%) | 33 (0.7%) |
| $55,000 to $64,999 | 193 (2.7%) | 34 (0.7%) |
| $65,000 to $74,999 | 79 (1.1%) | 15 (0.3%) |
| $75,000 to $99,999 | 74 (1.0%) | 54 (1.1%) |
| $100,000+ | 43 (0.6%) | 16 (0.3%) |
| Total | 7,192 (100.0%) | 4,933 (100.0%) |
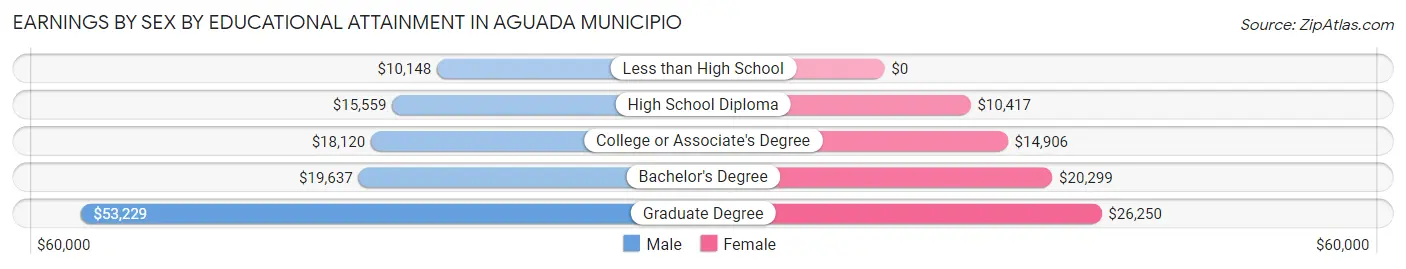
Earnings by Sex by Educational Attainment in Aguada Municipio
Average earnings in Aguada Municipio are $15,320 for men and $17,095 for women, a difference of 10.4%. Men with an educational attainment of graduate degree enjoy the highest average annual earnings of $53,229, while those with less than high school education earn the least with $10,148. Women with an educational attainment of graduate degree earn the most with the average annual earnings of $26,250, while those with high school diploma education have the smallest earnings of $10,417.
| Educational Attainment | Male Income | Female Income |
| Less than High School | $10,148 | $0 |
| High School Diploma | $15,559 | $10,417 |
| College or Associate's Degree | $18,120 | $14,906 |
| Bachelor's Degree | $19,637 | $20,299 |
| Graduate Degree | $53,229 | $26,250 |
| Total | $15,320 | $17,095 |
Family Income in Aguada Municipio
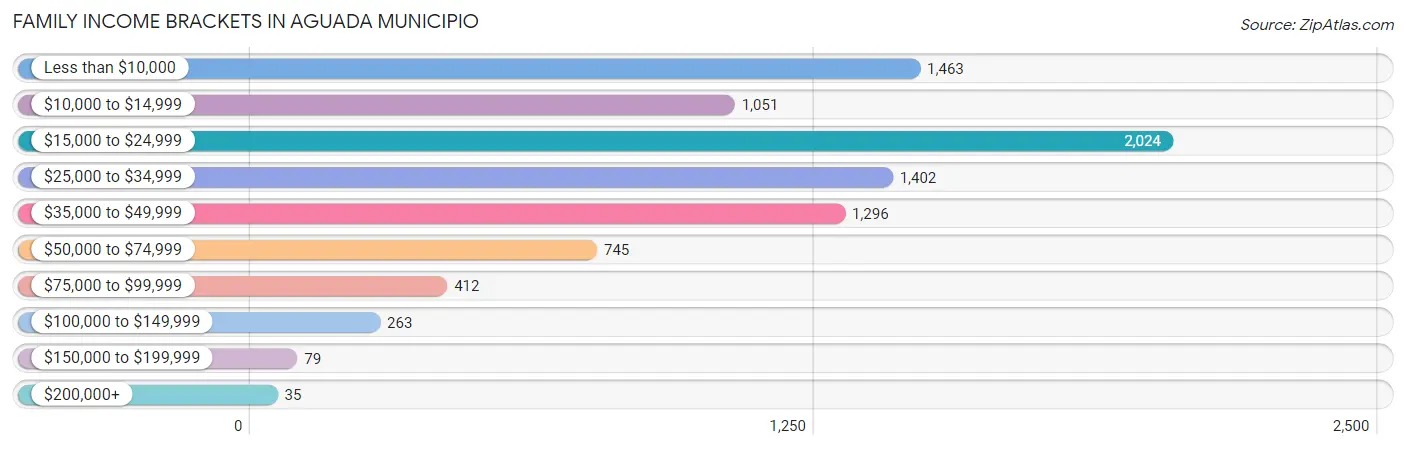
Family Income Brackets in Aguada Municipio
According to the Aguada Municipio family income data, there are 2,024 families falling into the $15,000 to $24,999 income range, which is the most common income bracket and makes up 23.1% of all families. Conversely, the $200,000+ income bracket is the least frequent group with only 35 families (0.4%) belonging to this category.
| Income Bracket | # Families | % Families |
| Less than $10,000 | 1,463 | 16.7% |
| $10,000 to $14,999 | 1,051 | 12.0% |
| $15,000 to $24,999 | 2,024 | 23.1% |
| $25,000 to $34,999 | 1,402 | 16.0% |
| $35,000 to $49,999 | 1,296 | 14.8% |
| $50,000 to $74,999 | 745 | 8.5% |
| $75,000 to $99,999 | 412 | 4.7% |
| $100,000 to $149,999 | 263 | 3.0% |
| $150,000 to $199,999 | 79 | 0.9% |
| $200,000+ | 35 | 0.4% |
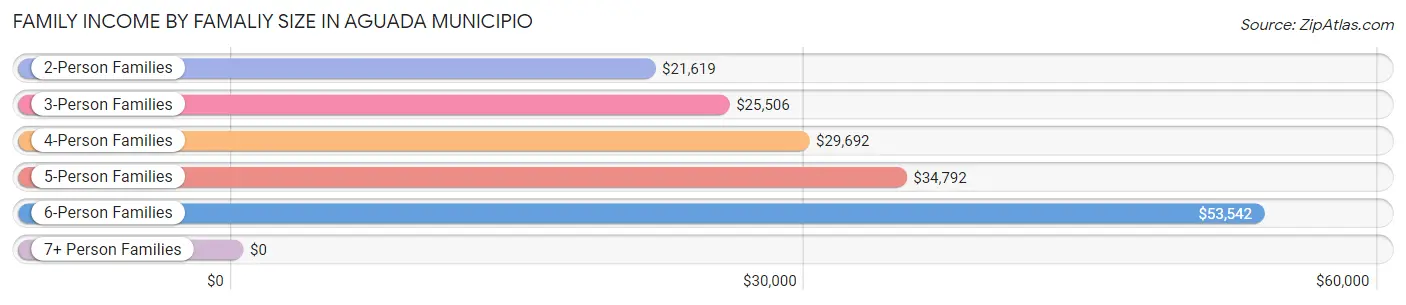
Family Income by Famaliy Size in Aguada Municipio
6-person families (112 | 1.3%) account for the highest median family income in Aguada Municipio with $53,542 per family, while 2-person families (4,466 | 51.0%) have the highest median income of $10,810 per family member.
| Income Bracket | # Families | Median Income |
| 2-Person Families | 4,466 (51.0%) | $21,619 |
| 3-Person Families | 2,319 (26.5%) | $25,506 |
| 4-Person Families | 1,424 (16.3%) | $29,692 |
| 5-Person Families | 439 (5.0%) | $34,792 |
| 6-Person Families | 112 (1.3%) | $53,542 |
| 7+ Person Families | 0 (0.0%) | $0 |
| Total | 8,760 (100.0%) | $24,091 |
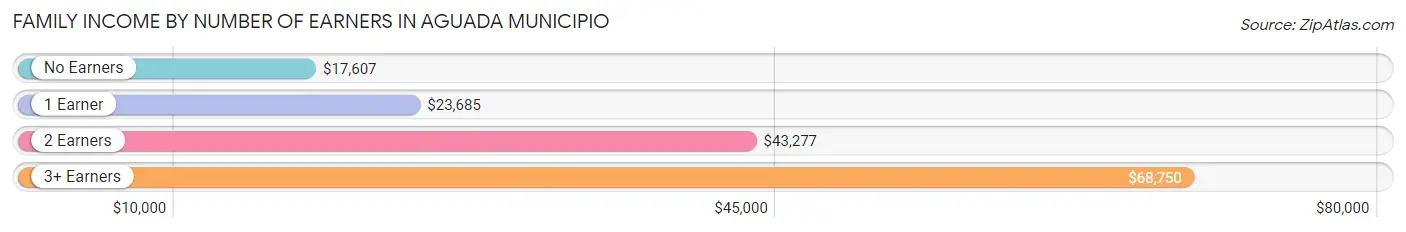
Family Income by Number of Earners in Aguada Municipio
The median family income in Aguada Municipio is $24,091, with families comprising 3+ earners (237) having the highest median family income of $68,750, while families with no earners (3,797) have the lowest median family income of $17,607, accounting for 2.7% and 43.3% of families, respectively.
| Number of Earners | # Families | Median Income |
| No Earners | 3,797 (43.3%) | $17,607 |
| 1 Earner | 2,975 (34.0%) | $23,685 |
| 2 Earners | 1,751 (20.0%) | $43,277 |
| 3+ Earners | 237 (2.7%) | $68,750 |
| Total | 8,760 (100.0%) | $24,091 |
Household Income in Aguada Municipio
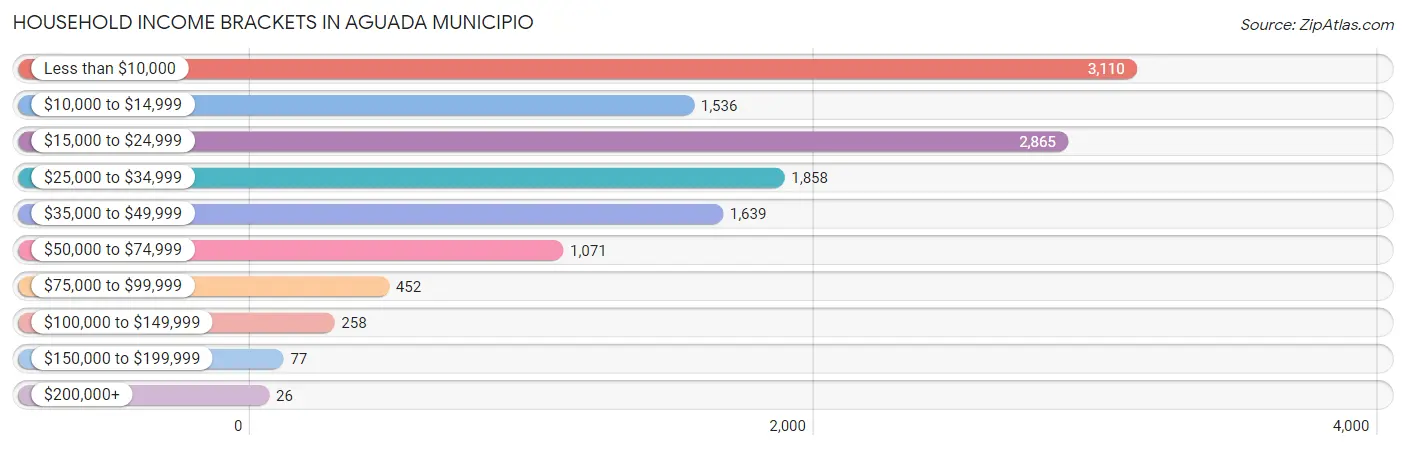
Household Income Brackets in Aguada Municipio
With 3,110 households falling in the category, the less than $10,000 income range is the most frequent in Aguada Municipio, accounting for 24.1% of all households. In contrast, only 26 households (0.2%) fall into the $200,000+ income bracket, making it the least populous group.
| Income Bracket | # Households | % Households |
| Less than $10,000 | 3,110 | 24.1% |
| $10,000 to $14,999 | 1,536 | 11.9% |
| $15,000 to $24,999 | 2,865 | 22.2% |
| $25,000 to $34,999 | 1,858 | 14.4% |
| $35,000 to $49,999 | 1,639 | 12.7% |
| $50,000 to $74,999 | 1,071 | 8.3% |
| $75,000 to $99,999 | 452 | 3.5% |
| $100,000 to $149,999 | 258 | 2.0% |
| $150,000 to $199,999 | 77 | 0.6% |
| $200,000+ | 26 | 0.2% |
Household Income by Householder Age in Aguada Municipio
The median household income in Aguada Municipio is $20,301, with the highest median household income of $21,480 found in the 25 to 44 years age bracket for the primary householder. A total of 2,271 households (17.6%) fall into this category. Meanwhile, the 15 to 24 years age bracket for the primary householder has the lowest median household income of $10,568, with 61 households (0.5%) in this group.
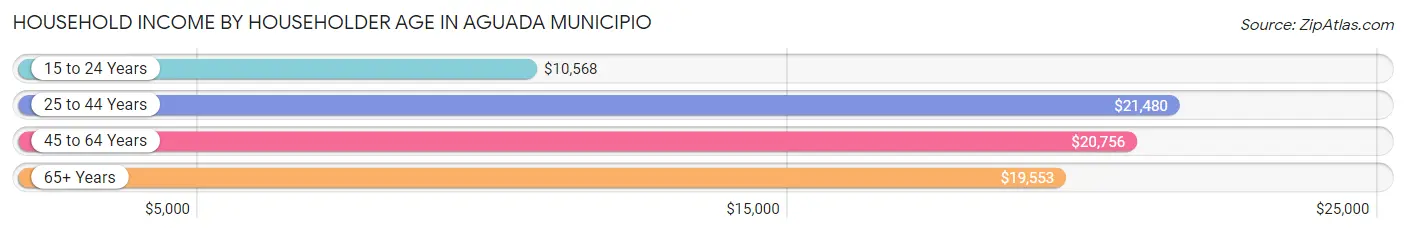
| Income Bracket | # Households | Median Income |
| 15 to 24 Years | 61 (0.5%) | $10,568 |
| 25 to 44 Years | 2,271 (17.6%) | $21,480 |
| 45 to 64 Years | 5,239 (40.6%) | $20,756 |
| 65+ Years | 5,333 (41.3%) | $19,553 |
| Total | 12,904 (100.0%) | $20,301 |
Poverty in Aguada Municipio
Income Below Poverty by Sex and Age in Aguada Municipio
With 45.6% poverty level for males and 48.7% for females among the residents of Aguada Municipio, under 5 year old males and under 5 year old females are the most vulnerable to poverty, with 481 males (79.8%) and 383 females (68.9%) in their respective age groups living below the poverty level.
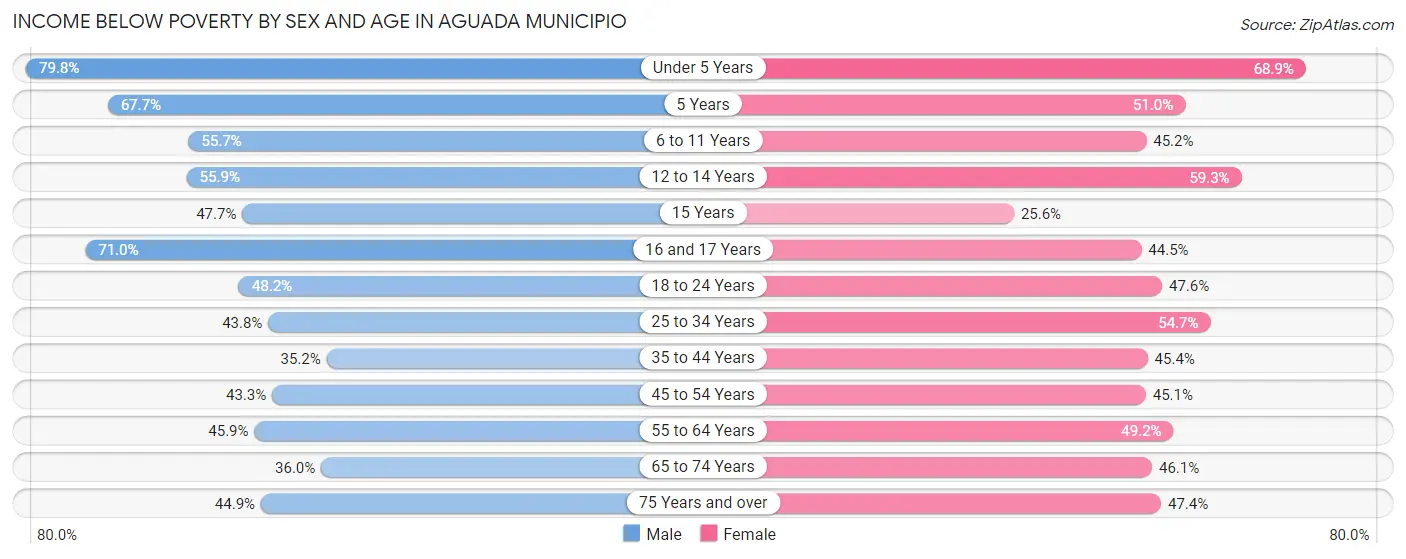
| Age Bracket | Male | Female |
| Under 5 Years | 481 (79.8%) | 383 (68.9%) |
| 5 Years | 138 (67.6%) | 79 (51.0%) |
| 6 to 11 Years | 486 (55.7%) | 407 (45.2%) |
| 12 to 14 Years | 410 (55.9%) | 464 (59.3%) |
| 15 Years | 113 (47.7%) | 34 (25.6%) |
| 16 and 17 Years | 291 (71.0%) | 226 (44.5%) |
| 18 to 24 Years | 805 (48.2%) | 757 (47.5%) |
| 25 to 34 Years | 1,070 (43.8%) | 1,289 (54.7%) |
| 35 to 44 Years | 801 (35.2%) | 1,050 (45.4%) |
| 45 to 54 Years | 1,043 (43.3%) | 1,179 (45.1%) |
| 55 to 64 Years | 1,308 (45.9%) | 1,554 (49.2%) |
| 65 to 74 Years | 822 (36.0%) | 1,121 (46.1%) |
| 75 Years and over | 657 (44.9%) | 906 (47.4%) |
| Total | 8,425 (45.6%) | 9,449 (48.7%) |
Income Above Poverty by Sex and Age in Aguada Municipio
According to the poverty statistics in Aguada Municipio, males aged 35 to 44 years and females aged 15 years are the age groups that are most secure financially, with 64.8% of males and 74.4% of females in these age groups living above the poverty line.
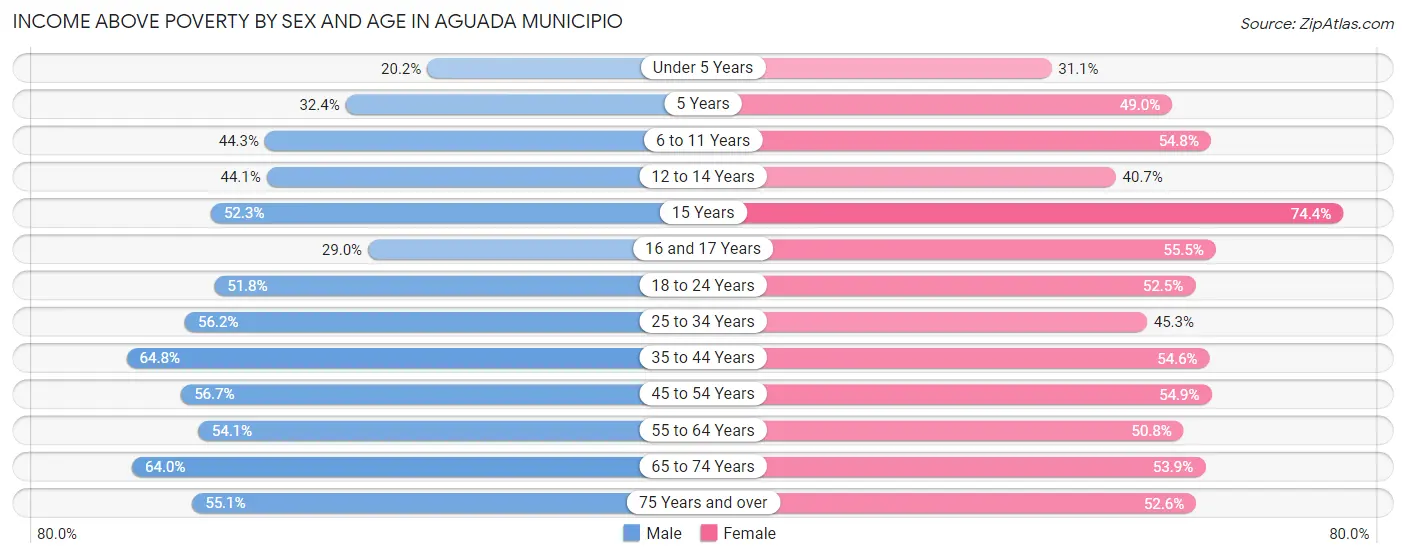
| Age Bracket | Male | Female |
| Under 5 Years | 122 (20.2%) | 173 (31.1%) |
| 5 Years | 66 (32.4%) | 76 (49.0%) |
| 6 to 11 Years | 387 (44.3%) | 493 (54.8%) |
| 12 to 14 Years | 323 (44.1%) | 318 (40.7%) |
| 15 Years | 124 (52.3%) | 99 (74.4%) |
| 16 and 17 Years | 119 (29.0%) | 282 (55.5%) |
| 18 to 24 Years | 866 (51.8%) | 835 (52.4%) |
| 25 to 34 Years | 1,371 (56.2%) | 1,067 (45.3%) |
| 35 to 44 Years | 1,477 (64.8%) | 1,262 (54.6%) |
| 45 to 54 Years | 1,368 (56.7%) | 1,433 (54.9%) |
| 55 to 64 Years | 1,543 (54.1%) | 1,602 (50.8%) |
| 65 to 74 Years | 1,463 (64.0%) | 1,312 (53.9%) |
| 75 Years and over | 806 (55.1%) | 1,005 (52.6%) |
| Total | 10,035 (54.4%) | 9,957 (51.3%) |
Income Below Poverty Among Married-Couple Families in Aguada Municipio
The poverty statistics for married-couple families in Aguada Municipio show that 40.1% or 2,196 of the total 5,477 families live below the poverty line. Families with 3 or 4 children have the highest poverty rate of 47.8%, comprising of 32 families. On the other hand, families with no children have the lowest poverty rate of 38.7%, which includes 1,605 families.
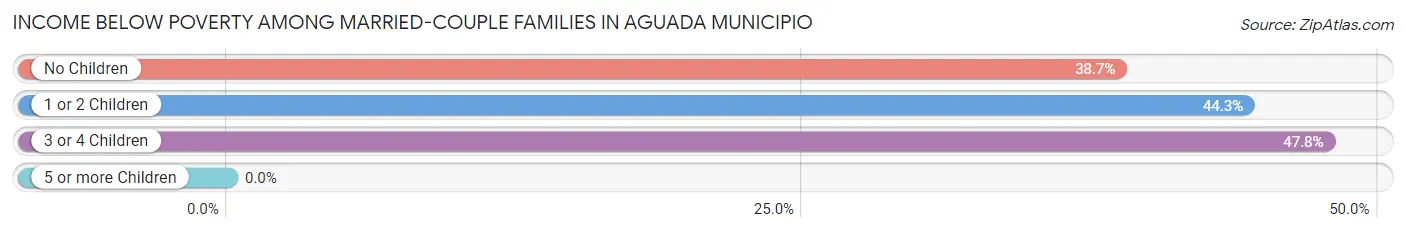
| Children | Above Poverty | Below Poverty |
| No Children | 2,542 (61.3%) | 1,605 (38.7%) |
| 1 or 2 Children | 704 (55.7%) | 559 (44.3%) |
| 3 or 4 Children | 35 (52.2%) | 32 (47.8%) |
| 5 or more Children | 0 (0.0%) | 0 (0.0%) |
| Total | 3,281 (59.9%) | 2,196 (40.1%) |
Income Below Poverty Among Single-Parent Households in Aguada Municipio
According to the poverty data in Aguada Municipio, 52.3% or 428 single-father households and 54.9% or 1,354 single-mother households are living below the poverty line. Among single-father households, those with 3 or 4 children have the highest poverty rate, with 24 households (100.0%) experiencing poverty. Likewise, among single-mother households, those with 3 or 4 children have the highest poverty rate, with 83 households (79.0%) falling below the poverty line.
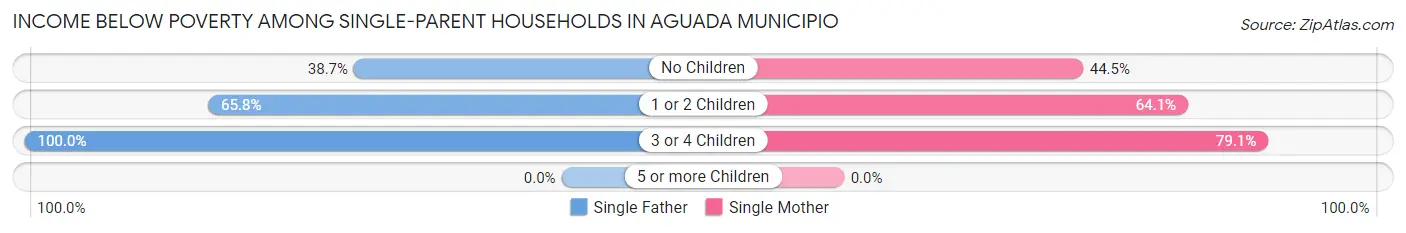
| Children | Single Father | Single Mother |
| No Children | 169 (38.7%) | 551 (44.5%) |
| 1 or 2 Children | 235 (65.8%) | 720 (64.1%) |
| 3 or 4 Children | 24 (100.0%) | 83 (79.0%) |
| 5 or more Children | 0 (0.0%) | 0 (0.0%) |
| Total | 428 (52.3%) | 1,354 (54.9%) |
Income Below Poverty Among Married-Couple vs Single-Parent Households in Aguada Municipio
The poverty data for Aguada Municipio shows that 2,196 of the married-couple family households (40.1%) and 1,782 of the single-parent households (54.3%) are living below the poverty level. Within the married-couple family households, those with 3 or 4 children have the highest poverty rate, with 32 households (47.8%) falling below the poverty line. Among the single-parent households, those with 3 or 4 children have the highest poverty rate, with 107 household (83.0%) living below poverty.
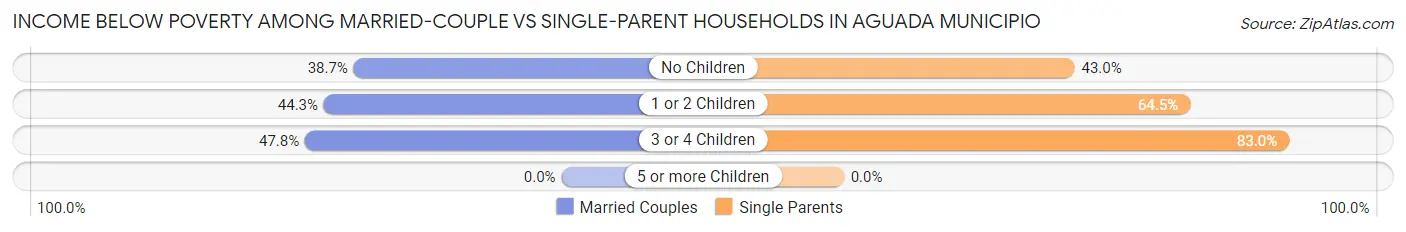
| Children | Married-Couple Families | Single-Parent Households |
| No Children | 1,605 (38.7%) | 720 (43.0%) |
| 1 or 2 Children | 559 (44.3%) | 955 (64.5%) |
| 3 or 4 Children | 32 (47.8%) | 107 (83.0%) |
| 5 or more Children | 0 (0.0%) | 0 (0.0%) |
| Total | 2,196 (40.1%) | 1,782 (54.3%) |
Race in Aguada Municipio
The most populous races in Aguada Municipio are Hispanic or Latino (35,964 | 94.7%), White / Caucasian (18,640 | 49.1%), and Two or more Races (17,232 | 45.4%).
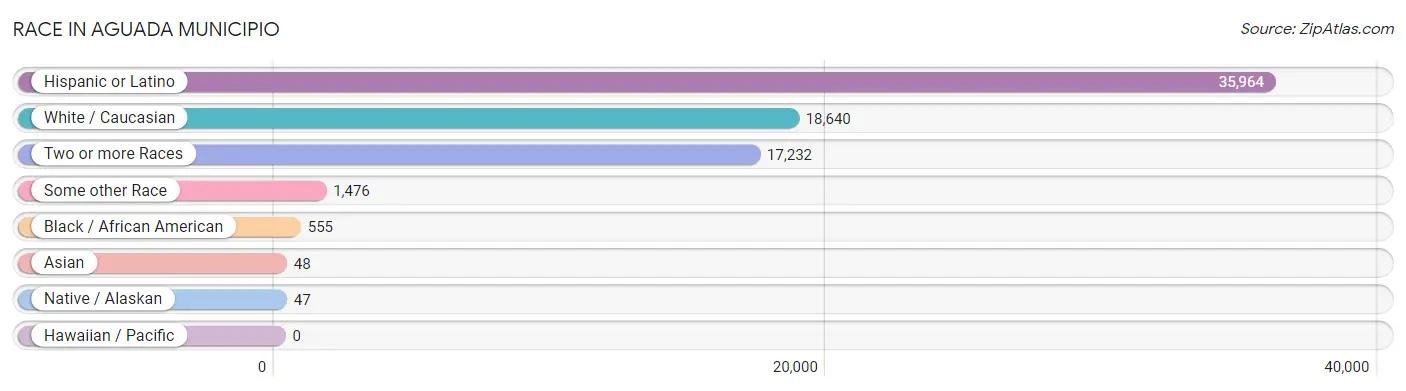
| Race | # Population | % Population |
| Asian | 48 | 0.1% |
| Black / African American | 555 | 1.5% |
| Hawaiian / Pacific | 0 | 0.0% |
| Hispanic or Latino | 35,964 | 94.7% |
| Native / Alaskan | 47 | 0.1% |
| White / Caucasian | 18,640 | 49.1% |
| Two or more Races | 17,232 | 45.4% |
| Some other Race | 1,476 | 3.9% |
| Total | 37,998 | 100.0% |
Ancestry in Aguada Municipio
The most populous ancestries reported in Aguada Municipio are Puerto Rican (33,537 | 88.3%), Central American Indian (13,325 | 35.1%), American (2,185 | 5.8%), Spaniard (1,873 | 4.9%), and Colombian (203 | 0.5%), together accounting for 134.5% of all Aguada Municipio residents.
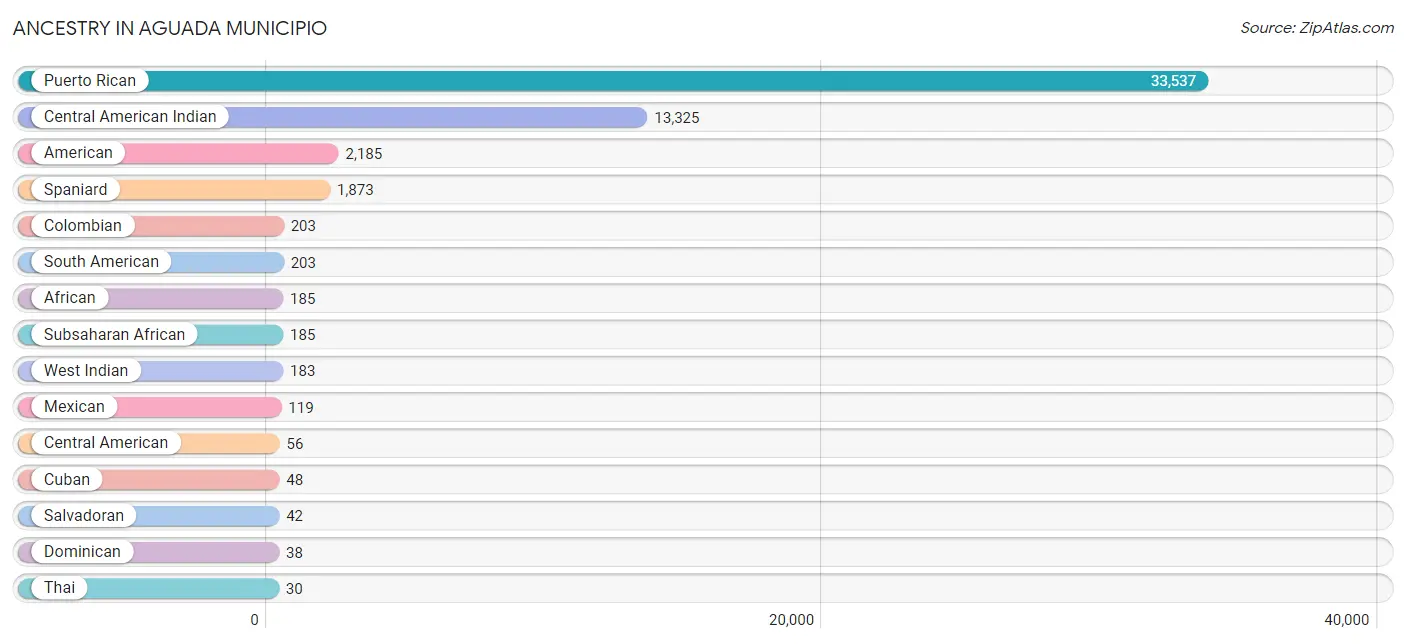
| Ancestry | # Population | % Population |
| African | 185 | 0.5% |
| American | 2,185 | 5.8% |
| Central American | 56 | 0.2% |
| Central American Indian | 13,325 | 35.1% |
| Colombian | 203 | 0.5% |
| Cuban | 48 | 0.1% |
| Dominican | 38 | 0.1% |
| Indian (Asian) | 18 | 0.1% |
| Mexican | 119 | 0.3% |
| Panamanian | 14 | 0.0% |
| Puerto Rican | 33,537 | 88.3% |
| Salvadoran | 42 | 0.1% |
| South American | 203 | 0.5% |
| Spaniard | 1,873 | 4.9% |
| Subsaharan African | 185 | 0.5% |
| Thai | 30 | 0.1% |
| West Indian | 183 | 0.5% | View All 17 Rows |
Immigrants in Aguada Municipio

| Immigration Origin | # Population | % Population | View All 0 Rows |
Sex and Age in Aguada Municipio
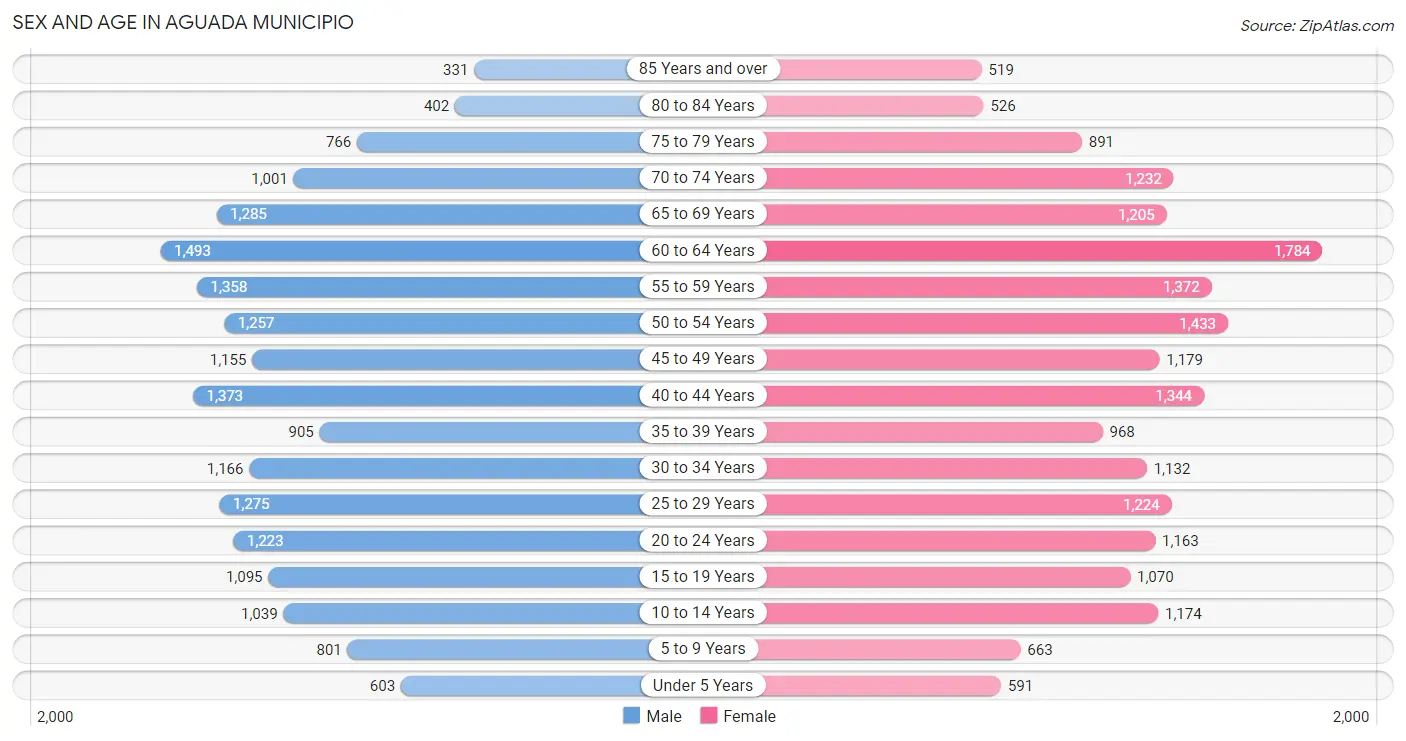
Sex and Age in Aguada Municipio
The most populous age groups in Aguada Municipio are 60 to 64 Years (1,493 | 8.1%) for men and 60 to 64 Years (1,784 | 9.2%) for women.
| Age Bracket | Male | Female |
| Under 5 Years | 603 (3.3%) | 591 (3.0%) |
| 5 to 9 Years | 801 (4.3%) | 663 (3.4%) |
| 10 to 14 Years | 1,039 (5.6%) | 1,174 (6.0%) |
| 15 to 19 Years | 1,095 (5.9%) | 1,070 (5.5%) |
| 20 to 24 Years | 1,223 (6.6%) | 1,163 (6.0%) |
| 25 to 29 Years | 1,275 (6.9%) | 1,224 (6.3%) |
| 30 to 34 Years | 1,166 (6.3%) | 1,132 (5.8%) |
| 35 to 39 Years | 905 (4.9%) | 968 (5.0%) |
| 40 to 44 Years | 1,373 (7.4%) | 1,344 (6.9%) |
| 45 to 49 Years | 1,155 (6.2%) | 1,179 (6.1%) |
| 50 to 54 Years | 1,257 (6.8%) | 1,433 (7.4%) |
| 55 to 59 Years | 1,358 (7.3%) | 1,372 (7.0%) |
| 60 to 64 Years | 1,493 (8.1%) | 1,784 (9.2%) |
| 65 to 69 Years | 1,285 (6.9%) | 1,205 (6.2%) |
| 70 to 74 Years | 1,001 (5.4%) | 1,232 (6.3%) |
| 75 to 79 Years | 766 (4.1%) | 891 (4.6%) |
| 80 to 84 Years | 402 (2.2%) | 526 (2.7%) |
| 85 Years and over | 331 (1.8%) | 519 (2.7%) |
| Total | 18,528 (100.0%) | 19,470 (100.0%) |
Families and Households in Aguada Municipio
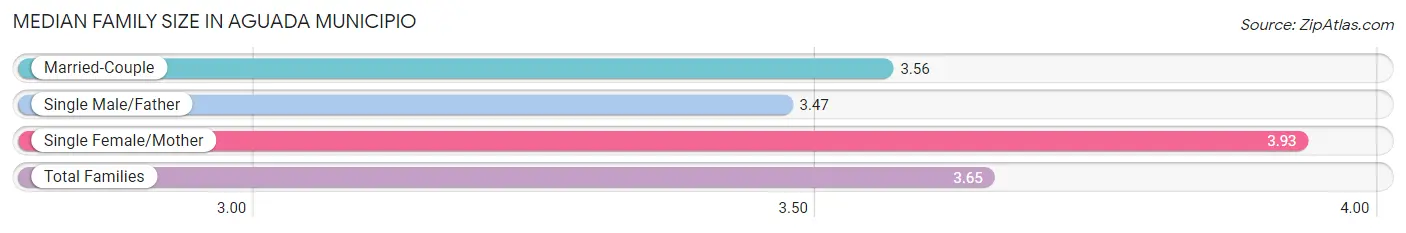
Median Family Size in Aguada Municipio
The median family size in Aguada Municipio is 3.65 persons per family, with single female/mother families (2,465 | 28.1%) accounting for the largest median family size of 3.93 persons per family. On the other hand, single male/father families (818 | 9.3%) represent the smallest median family size with 3.47 persons per family.
| Family Type | # Families | Family Size |
| Married-Couple | 5,477 (62.5%) | 3.56 |
| Single Male/Father | 818 (9.3%) | 3.47 |
| Single Female/Mother | 2,465 (28.1%) | 3.93 |
| Total Families | 8,760 (100.0%) | 3.65 |
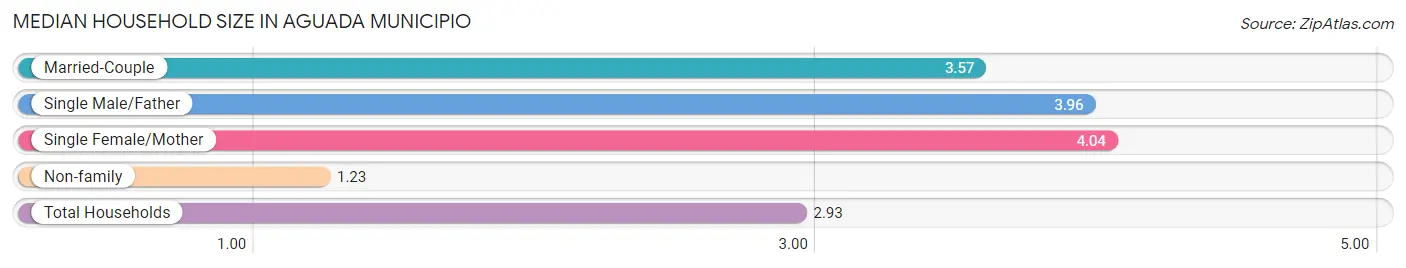
Median Household Size in Aguada Municipio
The median household size in Aguada Municipio is 2.93 persons per household, with single female/mother households (2,465 | 19.1%) accounting for the largest median household size of 4.04 persons per household. non-family households (4,144 | 32.1%) represent the smallest median household size with 1.23 persons per household.
| Household Type | # Households | Household Size |
| Married-Couple | 5,477 (42.4%) | 3.57 |
| Single Male/Father | 818 (6.3%) | 3.96 |
| Single Female/Mother | 2,465 (19.1%) | 4.04 |
| Non-family | 4,144 (32.1%) | 1.23 |
| Total Households | 12,904 (100.0%) | 2.93 |
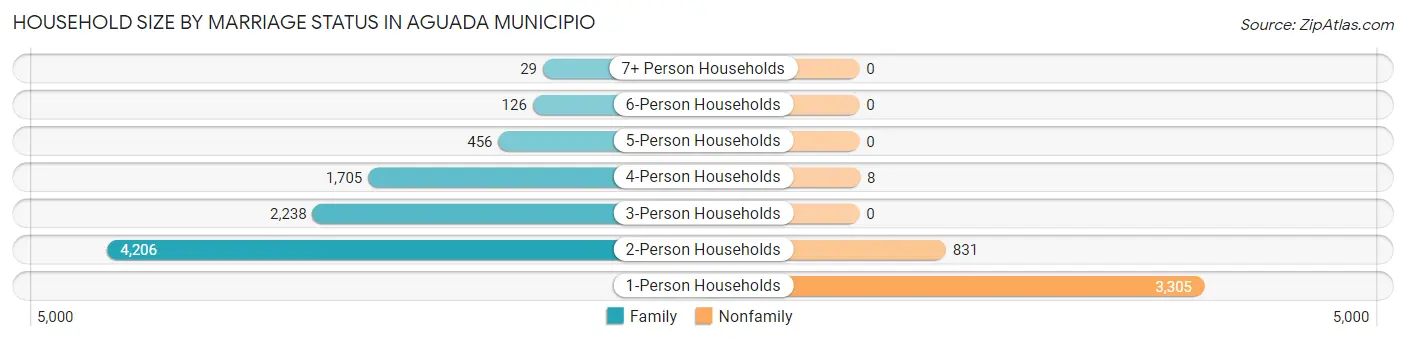
Household Size by Marriage Status in Aguada Municipio
Out of a total of 12,904 households in Aguada Municipio, 8,760 (67.9%) are family households, while 4,144 (32.1%) are nonfamily households. The most numerous type of family households are 2-person households, comprising 4,206, and the most common type of nonfamily households are 1-person households, comprising 3,305.
| Household Size | Family Households | Nonfamily Households |
| 1-Person Households | - | 3,305 (25.6%) |
| 2-Person Households | 4,206 (32.6%) | 831 (6.4%) |
| 3-Person Households | 2,238 (17.3%) | 0 (0.0%) |
| 4-Person Households | 1,705 (13.2%) | 8 (0.1%) |
| 5-Person Households | 456 (3.5%) | 0 (0.0%) |
| 6-Person Households | 126 (1.0%) | 0 (0.0%) |
| 7+ Person Households | 29 (0.2%) | 0 (0.0%) |
| Total | 8,760 (67.9%) | 4,144 (32.1%) |
Female Fertility in Aguada Municipio
Fertility by Age in Aguada Municipio
Average fertility rate in Aguada Municipio is 15.0 births per 1,000 women. Women in the age bracket of 20 to 34 years have the highest fertility rate with 17.0 births per 1,000 women. Women in the age bracket of 35 to 50 years acount for 51.6% of all women with births.
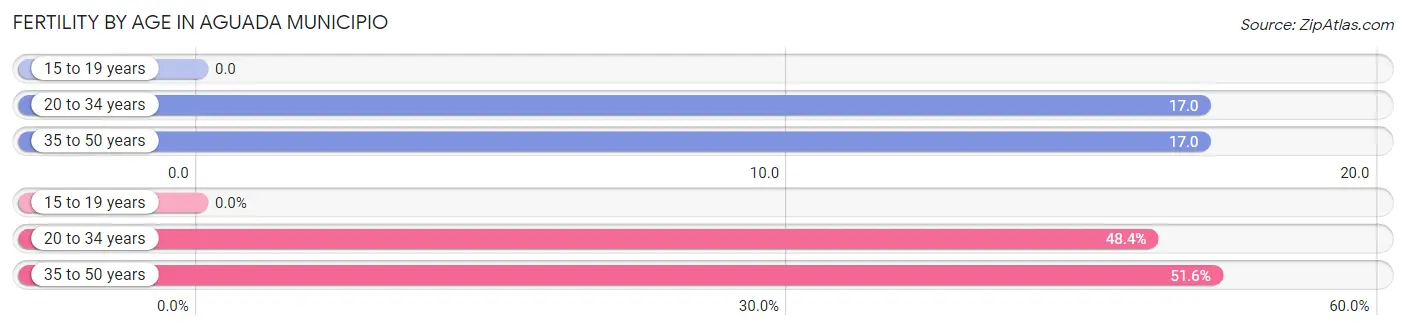
| Age Bracket | Women with Births | Births / 1,000 Women |
| 15 to 19 years | 0 (0.0%) | 0.0 |
| 20 to 34 years | 59 (48.4%) | 17.0 |
| 35 to 50 years | 63 (51.6%) | 17.0 |
| Total | 122 (100.0%) | 15.0 |
Fertility by Age by Marriage Status in Aguada Municipio
17.2% of women with births (122) in Aguada Municipio are married. The highest percentage of unmarried women with births falls into 35 to 50 years age bracket with 100.0% of them unmarried at the time of birth, while the lowest percentage of unmarried women with births belong to 20 to 34 years age bracket with 64.4% of them unmarried.
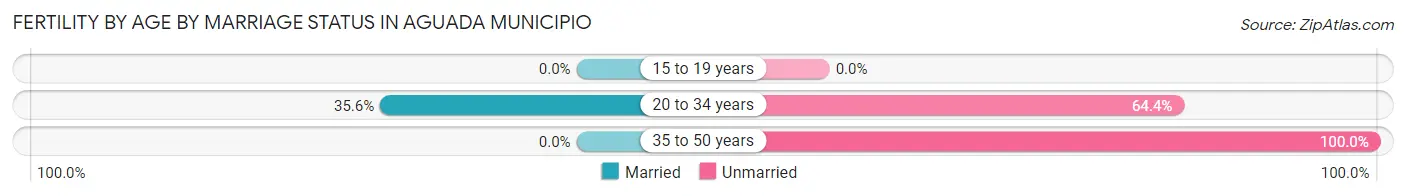
| Age Bracket | Married | Unmarried |
| 15 to 19 years | 0 (0.0%) | 0 (0.0%) |
| 20 to 34 years | 21 (35.6%) | 38 (64.4%) |
| 35 to 50 years | 0 (0.0%) | 63 (100.0%) |
| Total | 21 (17.2%) | 101 (82.8%) |
Fertility by Education in Aguada Municipio
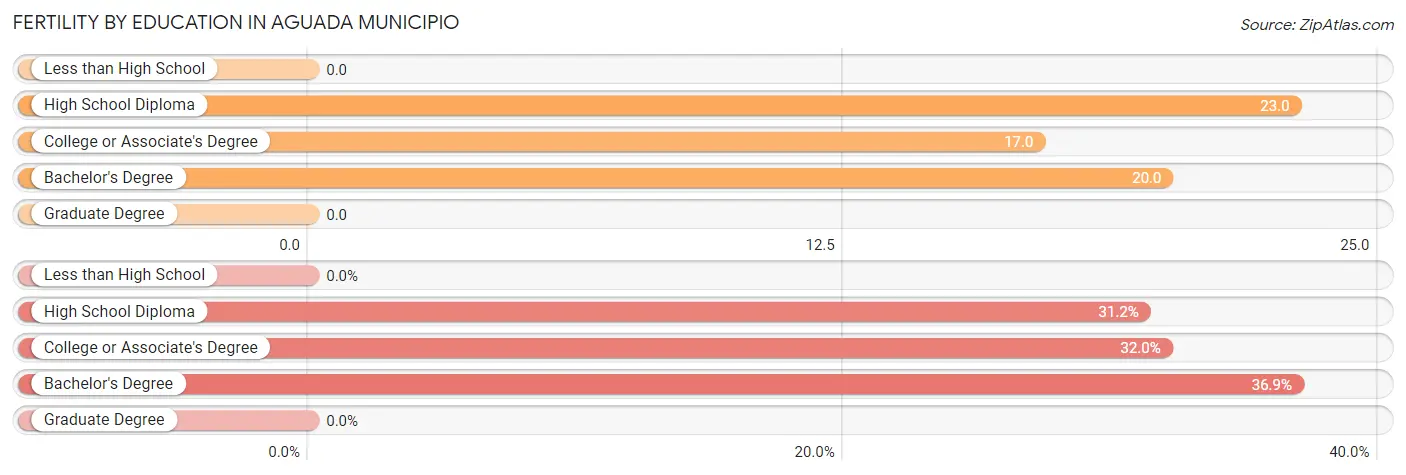
| Educational Attainment | Women with Births | Births / 1,000 Women |
| Less than High School | 0 (0.0%) | 0.0 |
| High School Diploma | 38 (31.1%) | 23.0 |
| College or Associate's Degree | 39 (32.0%) | 17.0 |
| Bachelor's Degree | 45 (36.9%) | 20.0 |
| Graduate Degree | 0 (0.0%) | 0.0 |
| Total | 122 (100.0%) | 15.0 |
Fertility by Education by Marriage Status in Aguada Municipio
82.8% of women with births in Aguada Municipio are unmarried. Women with the educational attainment of college or associate's degree are most likely to be married with 53.8% of them married at childbirth, while women with the educational attainment of high school diploma are least likely to be married with 100.0% of them unmarried at childbirth.
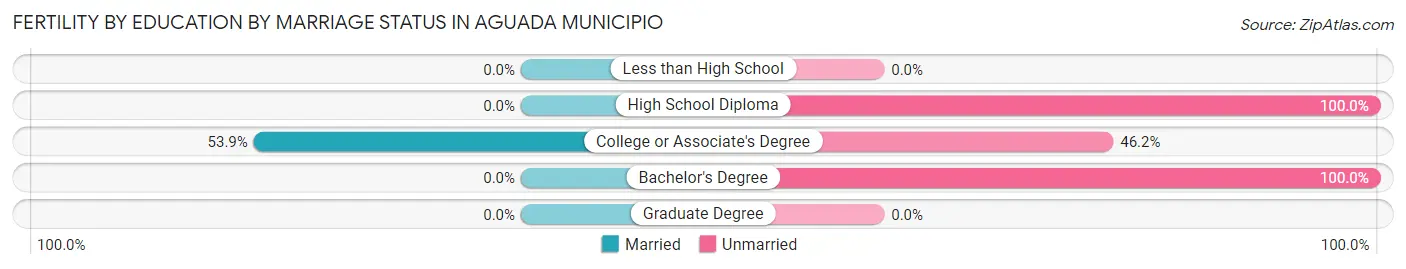
| Educational Attainment | Married | Unmarried |
| Less than High School | 0 (0.0%) | 0 (0.0%) |
| High School Diploma | 0 (0.0%) | 38 (100.0%) |
| College or Associate's Degree | 21 (53.8%) | 18 (46.2%) |
| Bachelor's Degree | 0 (0.0%) | 45 (100.0%) |
| Graduate Degree | 0 (0.0%) | 0 (0.0%) |
| Total | 21 (17.2%) | 101 (82.8%) |
Employment Characteristics in Aguada Municipio
Employment by Class of Employer in Aguada Municipio
Among the 11,249 employed individuals in Aguada Municipio, private company employees (7,306 | 64.9%), self-employed (not incorporated) (1,700 | 15.1%), and state government employees (1,185 | 10.5%) make up the most common classes of employment.
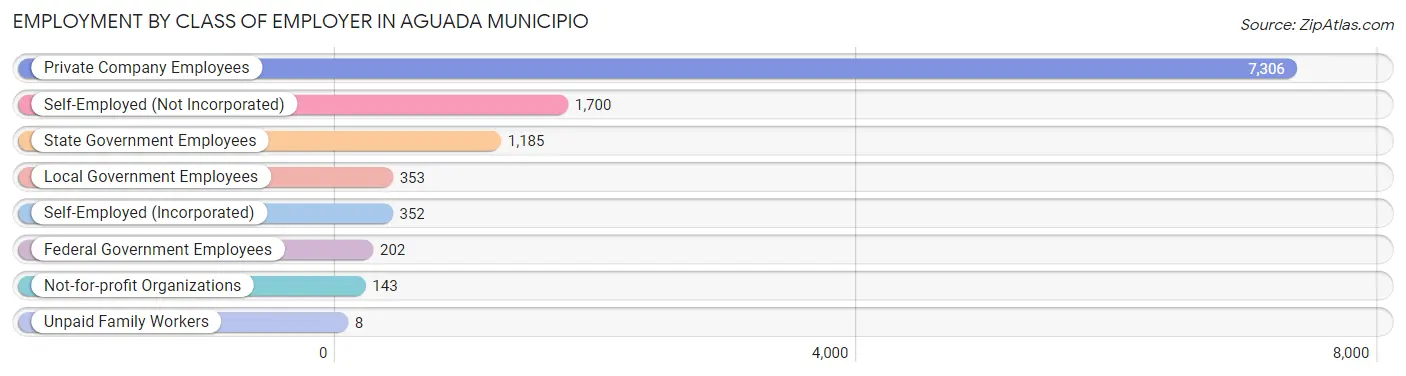
| Employer Class | # Employees | % Employees |
| Private Company Employees | 7,306 | 64.9% |
| Self-Employed (Incorporated) | 352 | 3.1% |
| Self-Employed (Not Incorporated) | 1,700 | 15.1% |
| Not-for-profit Organizations | 143 | 1.3% |
| Local Government Employees | 353 | 3.1% |
| State Government Employees | 1,185 | 10.5% |
| Federal Government Employees | 202 | 1.8% |
| Unpaid Family Workers | 8 | 0.1% |
| Total | 11,249 | 100.0% |
Employment Status by Age in Aguada Municipio
According to the labor force statistics for Aguada Municipio, out of the total population over 16 years of age (32,757), 37.6% or 12,317 individuals are in the labor force, with 7.6% or 936 of them unemployed. The age group with the highest labor force participation rate is 30 to 34 years, with 72.5% or 1,666 individuals in the labor force. Within the labor force, the 20 to 24 years age range has the highest percentage of unemployed individuals, with 20.6% or 154 of them being unemployed.
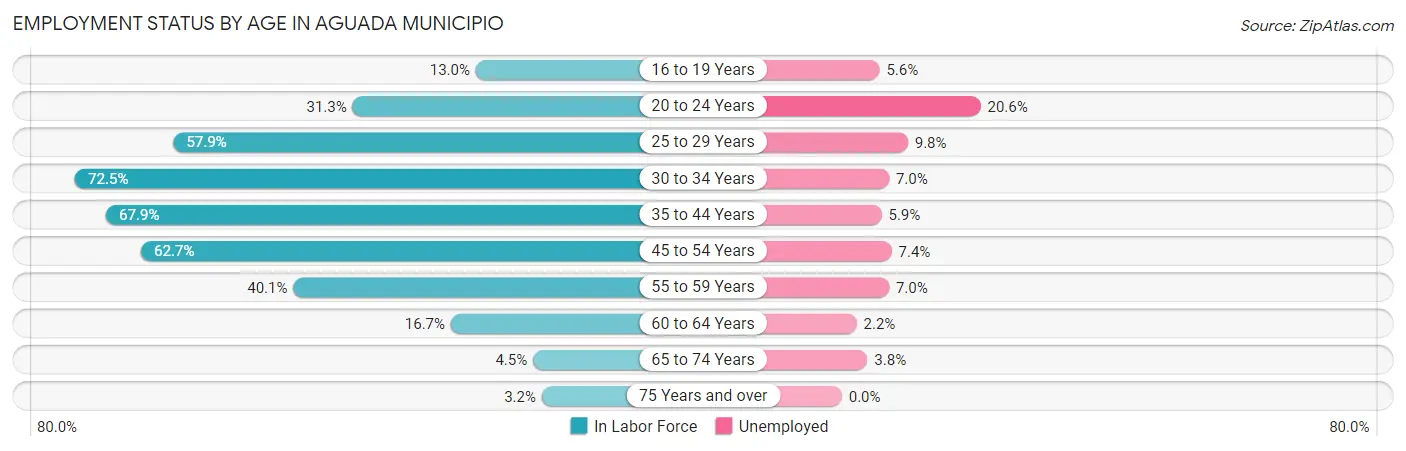
| Age Bracket | In Labor Force | Unemployed |
| 16 to 19 Years | 233 (13.0%) | 13 (5.6%) |
| 20 to 24 Years | 747 (31.3%) | 154 (20.6%) |
| 25 to 29 Years | 1,447 (57.9%) | 142 (9.8%) |
| 30 to 34 Years | 1,666 (72.5%) | 117 (7.0%) |
| 35 to 44 Years | 3,117 (67.9%) | 184 (5.9%) |
| 45 to 54 Years | 3,150 (62.7%) | 233 (7.4%) |
| 55 to 59 Years | 1,095 (40.1%) | 77 (7.0%) |
| 60 to 64 Years | 547 (16.7%) | 12 (2.2%) |
| 65 to 74 Years | 213 (4.5%) | 8 (3.8%) |
| 75 Years and over | 110 (3.2%) | 0 (0.0%) |
| Total | 12,317 (37.6%) | 936 (7.6%) |
Employment Status by Educational Attainment in Aguada Municipio
According to labor force statistics for Aguada Municipio, 54.0% of individuals (11,026) out of the total population between 25 and 64 years of age (20,418) are in the labor force, with 6.9% or 761 of them being unemployed. The group with the highest labor force participation rate are those with the educational attainment of college / associate degree, with 67.2% or 3,359 individuals in the labor force. Within the labor force, individuals with less than high school education have the highest percentage of unemployment, with 11.9% or 212 of them being unemployed.
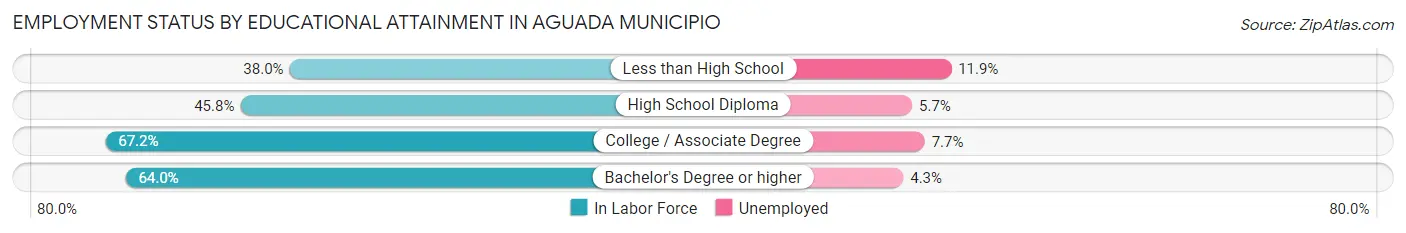
| Educational Attainment | In Labor Force | Unemployed |
| Less than High School | 1,782 (38.0%) | 558 (11.9%) |
| High School Diploma | 2,482 (45.8%) | 309 (5.7%) |
| College / Associate Degree | 3,359 (67.2%) | 385 (7.7%) |
| Bachelor's Degree or higher | 3,399 (64.0%) | 228 (4.3%) |
| Total | 11,026 (54.0%) | 1,409 (6.9%) |
Employment Occupations by Sex in Aguada Municipio
Management, Business, Science and Arts Occupations
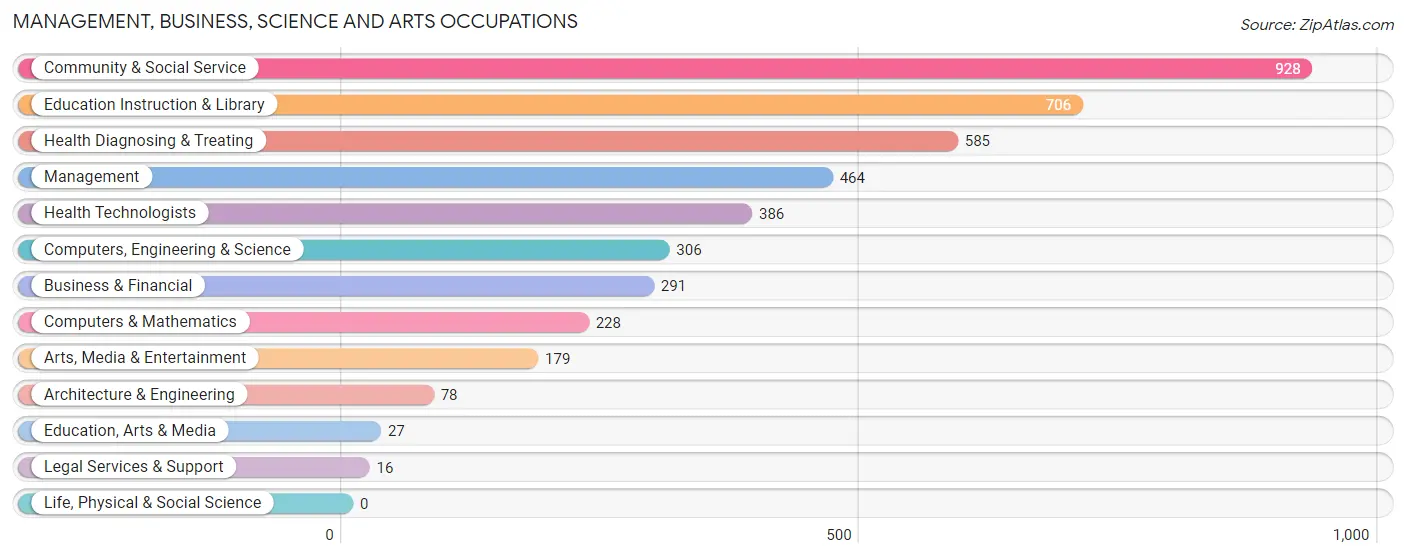
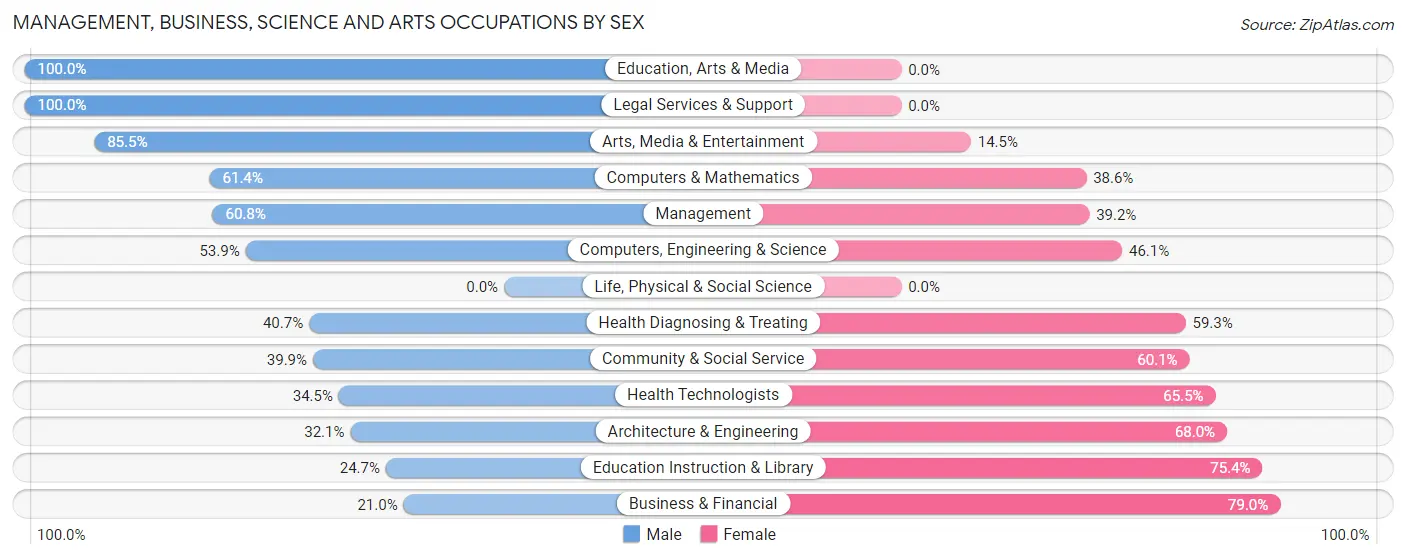
The most common Management, Business, Science and Arts occupations in Aguada Municipio are Community & Social Service (928 | 8.2%), Education Instruction & Library (706 | 6.2%), Health Diagnosing & Treating (585 | 5.1%), Management (464 | 4.1%), and Health Technologists (386 | 3.4%).
Management, Business, Science and Arts Occupations by Sex
Within the Management, Business, Science and Arts occupations in Aguada Municipio, the most male-oriented occupations are Education, Arts & Media (100.0%), Legal Services & Support (100.0%), and Arts, Media & Entertainment (85.5%), while the most female-oriented occupations are Business & Financial (79.0%), Education Instruction & Library (75.3%), and Architecture & Engineering (67.9%).
| Occupation | Male | Female |
| Management | 282 (60.8%) | 182 (39.2%) |
| Business & Financial | 61 (21.0%) | 230 (79.0%) |
| Computers, Engineering & Science | 165 (53.9%) | 141 (46.1%) |
| Computers & Mathematics | 140 (61.4%) | 88 (38.6%) |
| Architecture & Engineering | 25 (32.1%) | 53 (67.9%) |
| Life, Physical & Social Science | 0 (0.0%) | 0 (0.0%) |
| Community & Social Service | 370 (39.9%) | 558 (60.1%) |
| Education, Arts & Media | 27 (100.0%) | 0 (0.0%) |
| Legal Services & Support | 16 (100.0%) | 0 (0.0%) |
| Education Instruction & Library | 174 (24.6%) | 532 (75.3%) |
| Arts, Media & Entertainment | 153 (85.5%) | 26 (14.5%) |
| Health Diagnosing & Treating | 238 (40.7%) | 347 (59.3%) |
| Health Technologists | 133 (34.5%) | 253 (65.5%) |
| Total (Category) | 1,116 (43.4%) | 1,458 (56.6%) |
| Total (Overall) | 6,679 (58.6%) | 4,710 (41.4%) |
Services Occupations
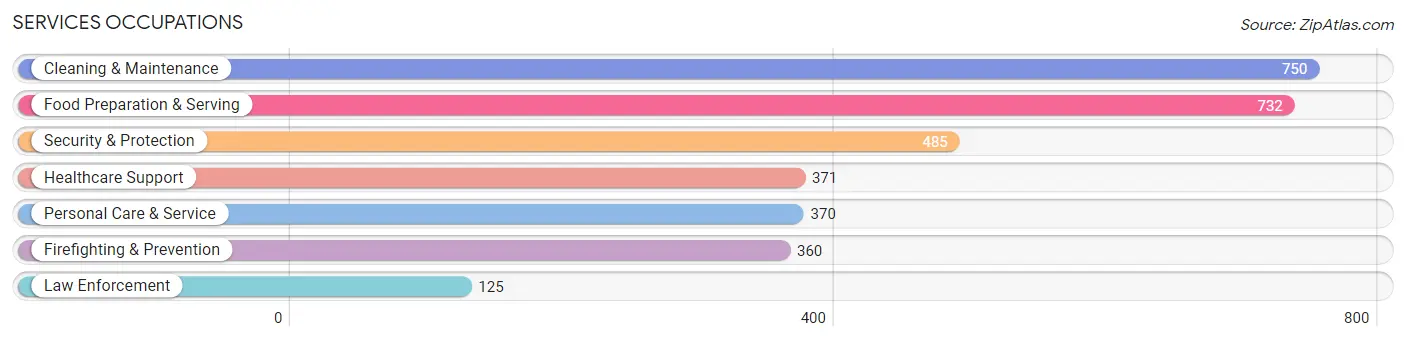
The most common Services occupations in Aguada Municipio are Cleaning & Maintenance (750 | 6.6%), Food Preparation & Serving (732 | 6.4%), Security & Protection (485 | 4.3%), Healthcare Support (371 | 3.3%), and Personal Care & Service (370 | 3.3%).
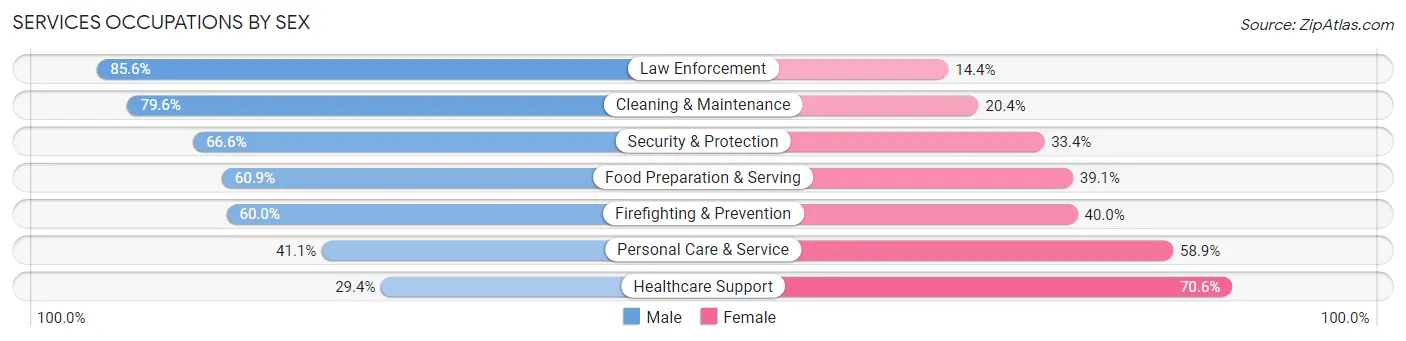
Services Occupations by Sex
Within the Services occupations in Aguada Municipio, the most male-oriented occupations are Law Enforcement (85.6%), Cleaning & Maintenance (79.6%), and Security & Protection (66.6%), while the most female-oriented occupations are Healthcare Support (70.6%), Personal Care & Service (58.9%), and Firefighting & Prevention (40.0%).
| Occupation | Male | Female |
| Healthcare Support | 109 (29.4%) | 262 (70.6%) |
| Security & Protection | 323 (66.6%) | 162 (33.4%) |
| Firefighting & Prevention | 216 (60.0%) | 144 (40.0%) |
| Law Enforcement | 107 (85.6%) | 18 (14.4%) |
| Food Preparation & Serving | 446 (60.9%) | 286 (39.1%) |
| Cleaning & Maintenance | 597 (79.6%) | 153 (20.4%) |
| Personal Care & Service | 152 (41.1%) | 218 (58.9%) |
| Total (Category) | 1,627 (60.1%) | 1,081 (39.9%) |
| Total (Overall) | 6,679 (58.6%) | 4,710 (41.4%) |
Sales and Office Occupations
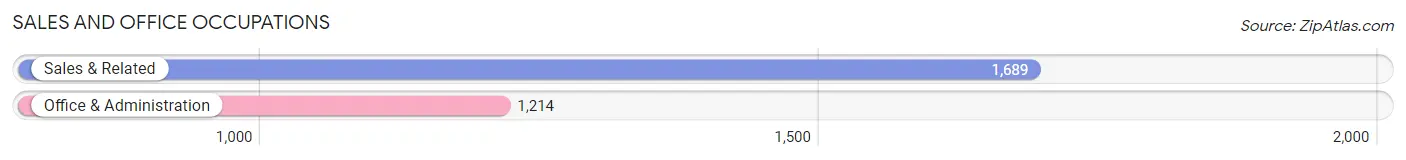
The most common Sales and Office occupations in Aguada Municipio are Sales & Related (1,689 | 14.8%), and Office & Administration (1,214 | 10.7%).
Sales and Office Occupations by Sex
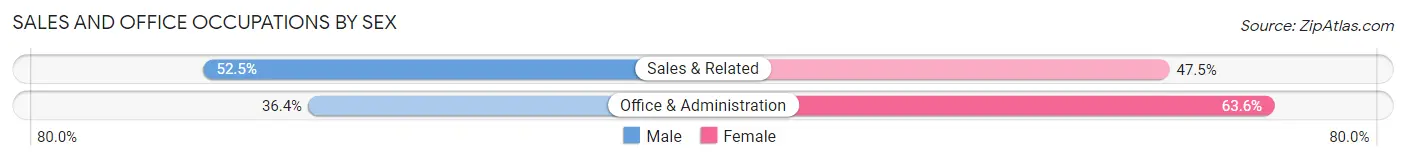
| Occupation | Male | Female |
| Sales & Related | 886 (52.5%) | 803 (47.5%) |
| Office & Administration | 442 (36.4%) | 772 (63.6%) |
| Total (Category) | 1,328 (45.8%) | 1,575 (54.2%) |
| Total (Overall) | 6,679 (58.6%) | 4,710 (41.4%) |
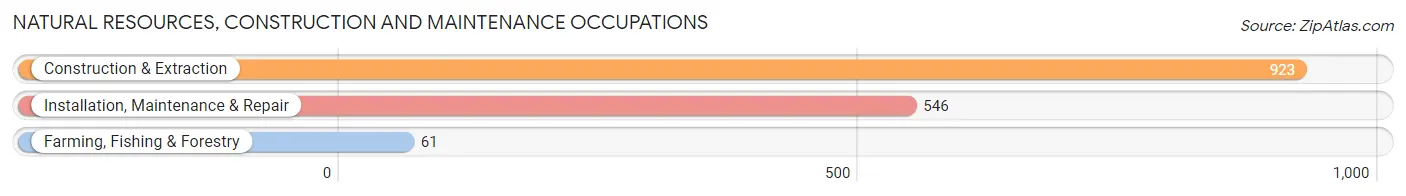
Natural Resources, Construction and Maintenance Occupations
The most common Natural Resources, Construction and Maintenance occupations in Aguada Municipio are Construction & Extraction (923 | 8.1%), Installation, Maintenance & Repair (546 | 4.8%), and Farming, Fishing & Forestry (61 | 0.5%).
Natural Resources, Construction and Maintenance Occupations by Sex
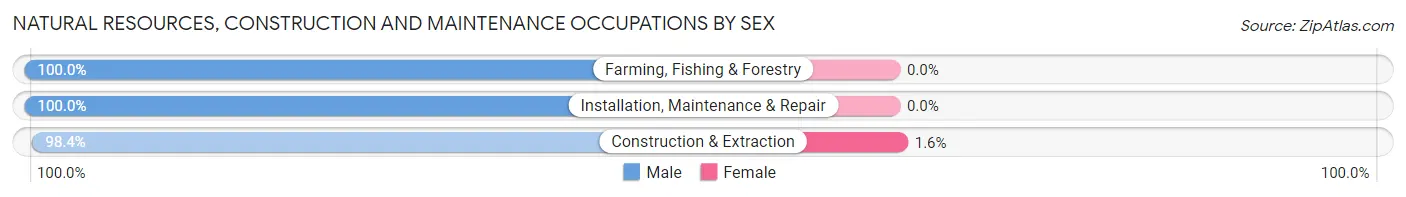
| Occupation | Male | Female |
| Farming, Fishing & Forestry | 61 (100.0%) | 0 (0.0%) |
| Construction & Extraction | 908 (98.4%) | 15 (1.6%) |
| Installation, Maintenance & Repair | 546 (100.0%) | 0 (0.0%) |
| Total (Category) | 1,515 (99.0%) | 15 (1.0%) |
| Total (Overall) | 6,679 (58.6%) | 4,710 (41.4%) |
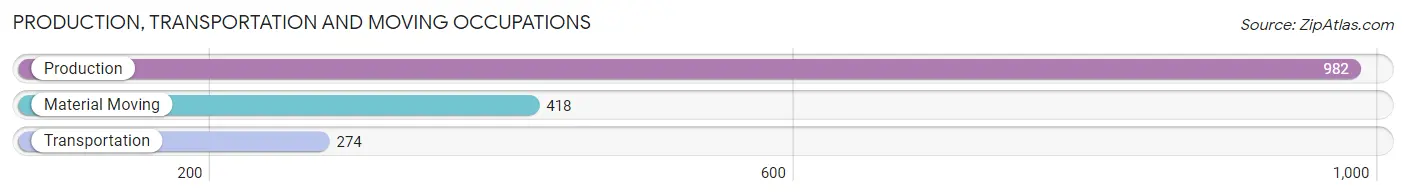
Production, Transportation and Moving Occupations
The most common Production, Transportation and Moving occupations in Aguada Municipio are Production (982 | 8.6%), Material Moving (418 | 3.7%), and Transportation (274 | 2.4%).
Production, Transportation and Moving Occupations by Sex
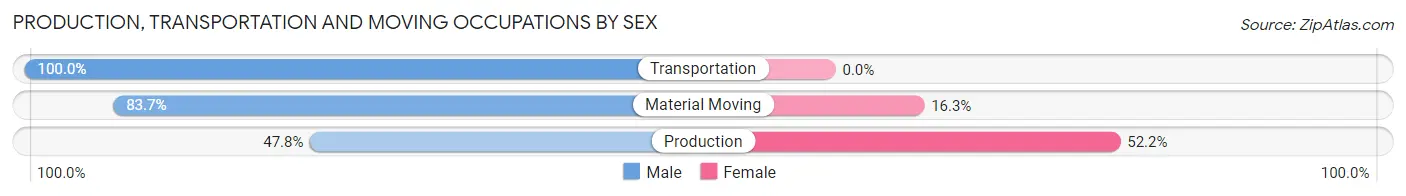
| Occupation | Male | Female |
| Production | 469 (47.8%) | 513 (52.2%) |
| Transportation | 274 (100.0%) | 0 (0.0%) |
| Material Moving | 350 (83.7%) | 68 (16.3%) |
| Total (Category) | 1,093 (65.3%) | 581 (34.7%) |
| Total (Overall) | 6,679 (58.6%) | 4,710 (41.4%) |
Employment Industries by Sex in Aguada Municipio
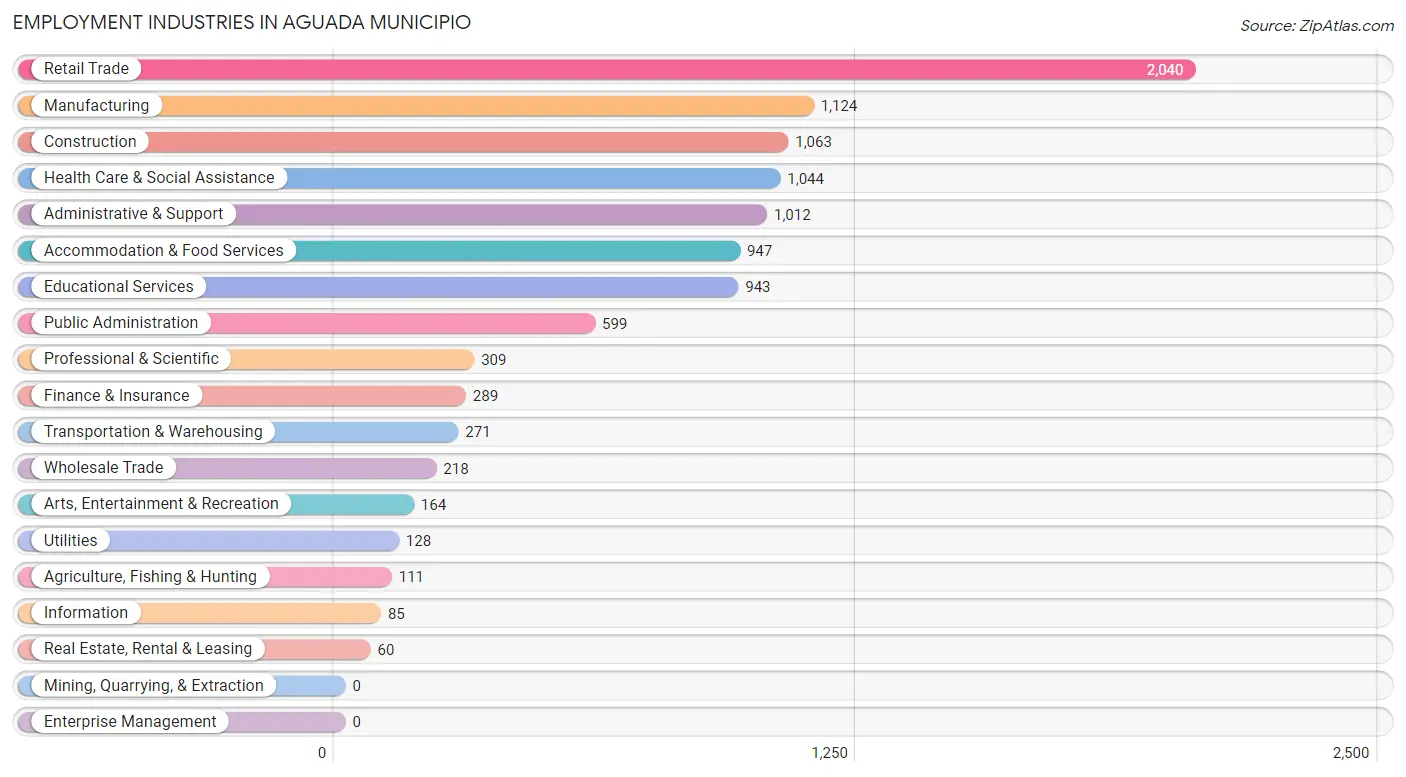
Employment Industries in Aguada Municipio
The major employment industries in Aguada Municipio include Retail Trade (2,040 | 17.9%), Manufacturing (1,124 | 9.9%), Construction (1,063 | 9.3%), Health Care & Social Assistance (1,044 | 9.2%), and Administrative & Support (1,012 | 8.9%).
Employment Industries by Sex in Aguada Municipio
The Aguada Municipio industries that see more men than women are Agriculture, Fishing & Hunting (100.0%), Transportation & Warehousing (100.0%), and Utilities (100.0%), whereas the industries that tend to have a higher number of women are Real Estate, Rental & Leasing (100.0%), Finance & Insurance (80.3%), and Health Care & Social Assistance (75.4%).
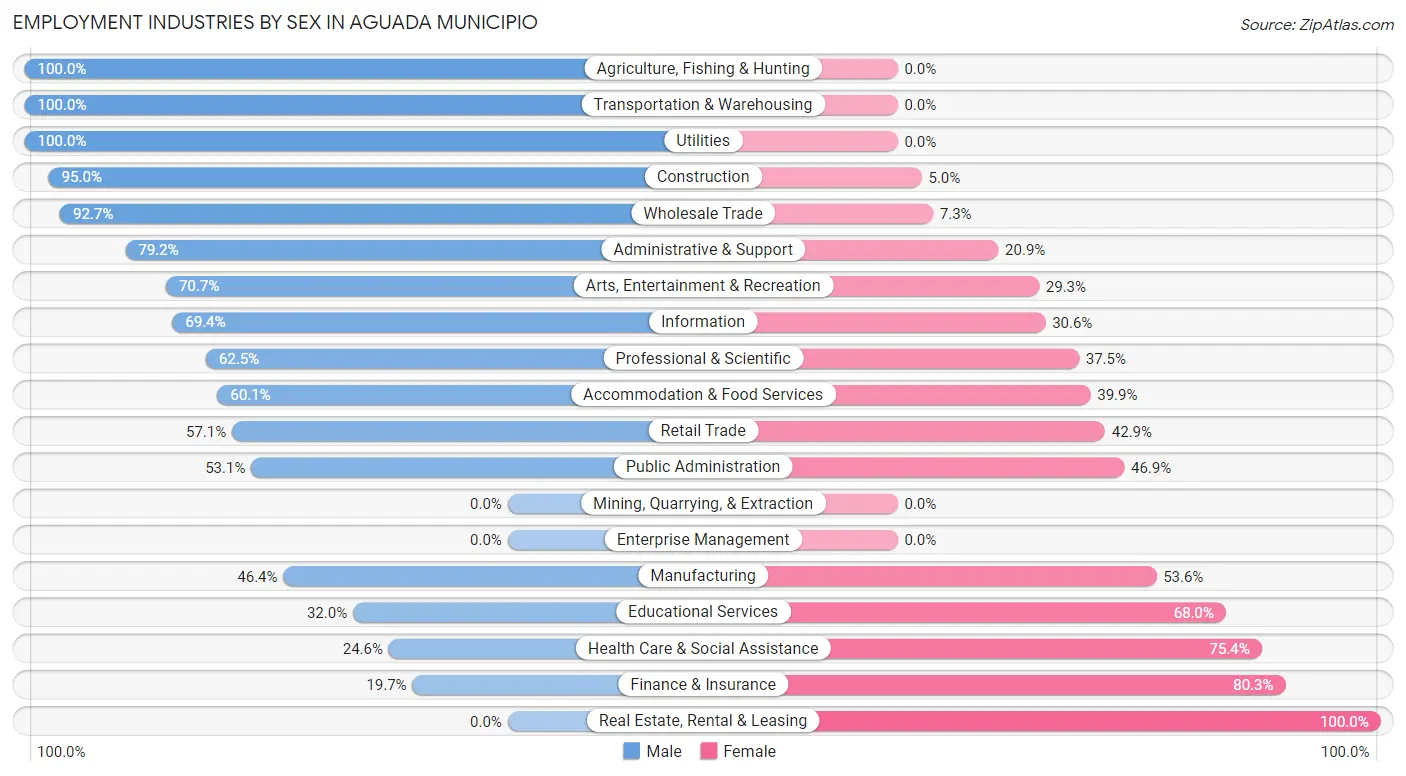
| Industry | Male | Female |
| Agriculture, Fishing & Hunting | 111 (100.0%) | 0 (0.0%) |
| Mining, Quarrying, & Extraction | 0 (0.0%) | 0 (0.0%) |
| Construction | 1,010 (95.0%) | 53 (5.0%) |
| Manufacturing | 522 (46.4%) | 602 (53.6%) |
| Wholesale Trade | 202 (92.7%) | 16 (7.3%) |
| Retail Trade | 1,164 (57.1%) | 876 (42.9%) |
| Transportation & Warehousing | 271 (100.0%) | 0 (0.0%) |
| Utilities | 128 (100.0%) | 0 (0.0%) |
| Information | 59 (69.4%) | 26 (30.6%) |
| Finance & Insurance | 57 (19.7%) | 232 (80.3%) |
| Real Estate, Rental & Leasing | 0 (0.0%) | 60 (100.0%) |
| Professional & Scientific | 193 (62.5%) | 116 (37.5%) |
| Enterprise Management | 0 (0.0%) | 0 (0.0%) |
| Administrative & Support | 801 (79.1%) | 211 (20.8%) |
| Educational Services | 302 (32.0%) | 641 (68.0%) |
| Health Care & Social Assistance | 257 (24.6%) | 787 (75.4%) |
| Arts, Entertainment & Recreation | 116 (70.7%) | 48 (29.3%) |
| Accommodation & Food Services | 569 (60.1%) | 378 (39.9%) |
| Public Administration | 318 (53.1%) | 281 (46.9%) |
| Total | 6,679 (58.6%) | 4,710 (41.4%) |
Education in Aguada Municipio
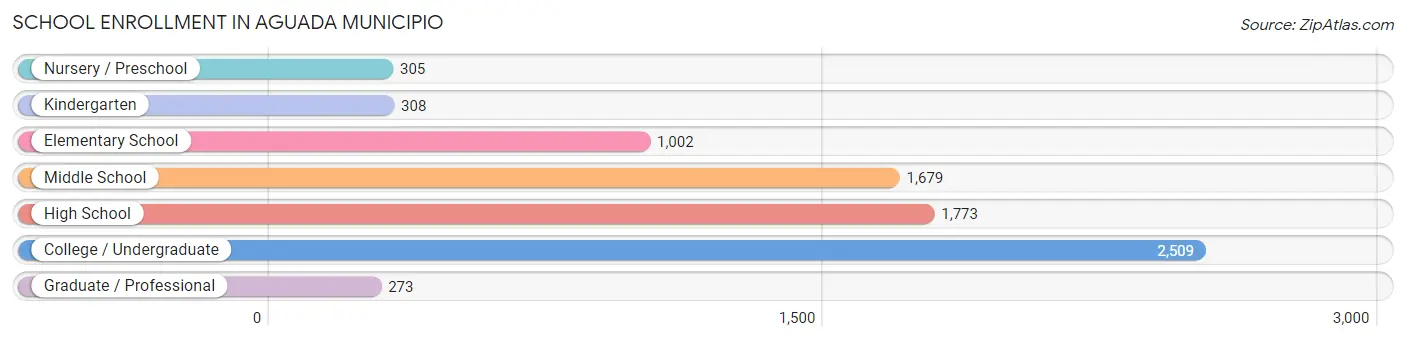
School Enrollment in Aguada Municipio
The most common levels of schooling among the 7,849 students in Aguada Municipio are college / undergraduate (2,509 | 32.0%), high school (1,773 | 22.6%), and middle school (1,679 | 21.4%).
| School Level | # Students | % Students |
| Nursery / Preschool | 305 | 3.9% |
| Kindergarten | 308 | 3.9% |
| Elementary School | 1,002 | 12.8% |
| Middle School | 1,679 | 21.4% |
| High School | 1,773 | 22.6% |
| College / Undergraduate | 2,509 | 32.0% |
| Graduate / Professional | 273 | 3.5% |
| Total | 7,849 | 100.0% |
School Enrollment by Age by Funding Source in Aguada Municipio
Out of a total of 7,849 students who are enrolled in schools in Aguada Municipio, 3,069 (39.1%) attend a private institution, while the remaining 4,780 (60.9%) are enrolled in public schools. The age group of 25 to 34 year olds has the highest likelihood of being enrolled in private schools, with 358 (74.6% in the age bracket) enrolled. Conversely, the age group of 10 to 14 year olds has the lowest likelihood of being enrolled in a private school, with 1,671 (78.4% in the age bracket) attending a public institution.
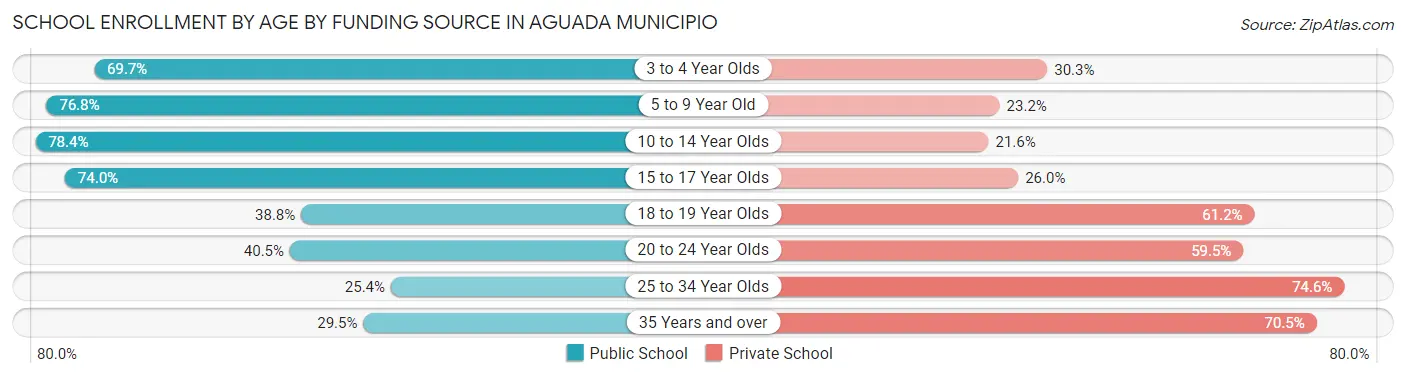
| Age Bracket | Public School | Private School |
| 3 to 4 Year Olds | 163 (69.7%) | 71 (30.3%) |
| 5 to 9 Year Old | 1,024 (76.8%) | 310 (23.2%) |
| 10 to 14 Year Olds | 1,671 (78.4%) | 460 (21.6%) |
| 15 to 17 Year Olds | 842 (74.0%) | 296 (26.0%) |
| 18 to 19 Year Olds | 232 (38.8%) | 366 (61.2%) |
| 20 to 24 Year Olds | 584 (40.5%) | 859 (59.5%) |
| 25 to 34 Year Olds | 122 (25.4%) | 358 (74.6%) |
| 35 Years and over | 145 (29.5%) | 346 (70.5%) |
| Total | 4,780 (60.9%) | 3,069 (39.1%) |
Educational Attainment by Field of Study in Aguada Municipio
Business (1,392 | 21.7%), education (1,327 | 20.7%), science & technology (967 | 15.0%), arts & humanities (567 | 8.8%), and bio, nature & agricultural (403 | 6.3%) are the most common fields of study among 6,424 individuals in Aguada Municipio who have obtained a bachelor's degree or higher.
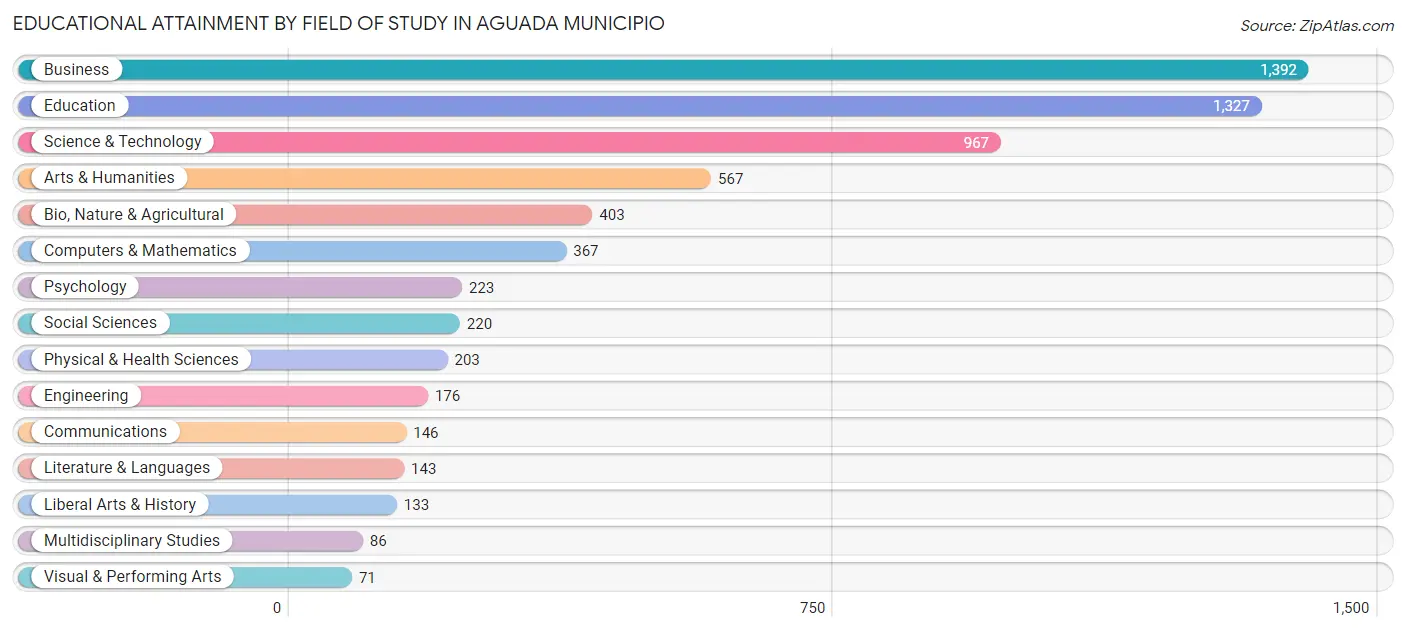
| Field of Study | # Graduates | % Graduates |
| Computers & Mathematics | 367 | 5.7% |
| Bio, Nature & Agricultural | 403 | 6.3% |
| Physical & Health Sciences | 203 | 3.2% |
| Psychology | 223 | 3.5% |
| Social Sciences | 220 | 3.4% |
| Engineering | 176 | 2.7% |
| Multidisciplinary Studies | 86 | 1.3% |
| Science & Technology | 967 | 15.0% |
| Business | 1,392 | 21.7% |
| Education | 1,327 | 20.7% |
| Literature & Languages | 143 | 2.2% |
| Liberal Arts & History | 133 | 2.1% |
| Visual & Performing Arts | 71 | 1.1% |
| Communications | 146 | 2.3% |
| Arts & Humanities | 567 | 8.8% |
| Total | 6,424 | 100.0% |
Transportation & Commute in Aguada Municipio
Vehicle Availability by Sex in Aguada Municipio
The most prevalent vehicle ownership categories in Aguada Municipio are males with 2 vehicles (2,812, accounting for 42.3%) and females with 2 vehicles (1,908, making up 61.2%).
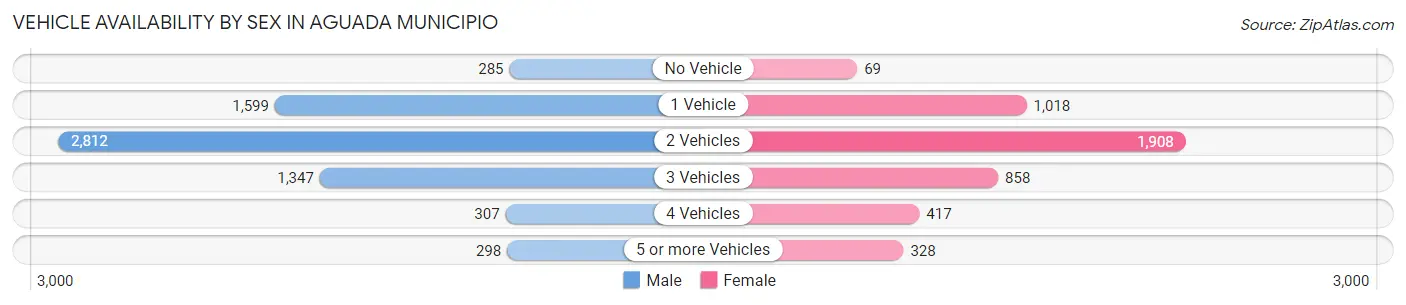
| Vehicles Available | Male | Female |
| No Vehicle | 285 (4.3%) | 69 (1.5%) |
| 1 Vehicle | 1,599 (24.0%) | 1,018 (22.1%) |
| 2 Vehicles | 2,812 (42.3%) | 1,908 (41.5%) |
| 3 Vehicles | 1,347 (20.3%) | 858 (18.7%) |
| 4 Vehicles | 307 (4.6%) | 417 (9.1%) |
| 5 or more Vehicles | 298 (4.5%) | 328 (7.1%) |
| Total | 6,648 (100.0%) | 4,598 (100.0%) |
Commute Time in Aguada Municipio
The most frequently occuring commute durations in Aguada Municipio are 15 to 19 minutes (2,307 commuters, 22.5%), 5 to 9 minutes (1,487 commuters, 14.5%), and 25 to 29 minutes (1,331 commuters, 13.0%).
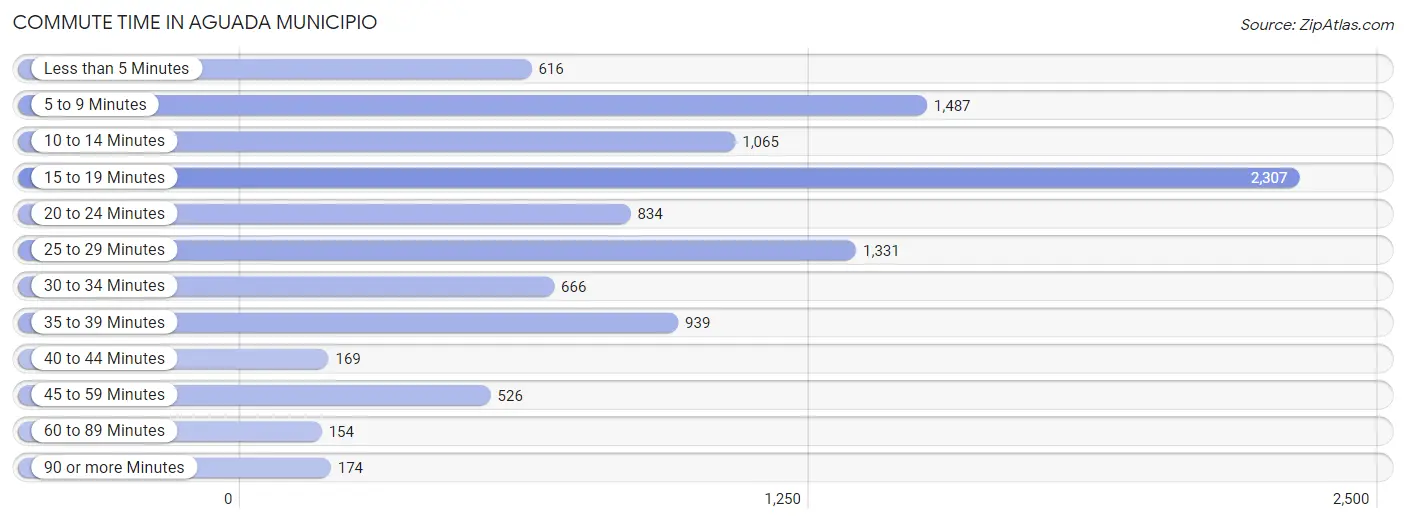
| Commute Time | # Commuters | % Commuters |
| Less than 5 Minutes | 616 | 6.0% |
| 5 to 9 Minutes | 1,487 | 14.5% |
| 10 to 14 Minutes | 1,065 | 10.4% |
| 15 to 19 Minutes | 2,307 | 22.5% |
| 20 to 24 Minutes | 834 | 8.1% |
| 25 to 29 Minutes | 1,331 | 13.0% |
| 30 to 34 Minutes | 666 | 6.5% |
| 35 to 39 Minutes | 939 | 9.1% |
| 40 to 44 Minutes | 169 | 1.7% |
| 45 to 59 Minutes | 526 | 5.1% |
| 60 to 89 Minutes | 154 | 1.5% |
| 90 or more Minutes | 174 | 1.7% |
Commute Time by Sex in Aguada Municipio
The most common commute times in Aguada Municipio are 15 to 19 minutes (1,370 commuters, 22.8%) for males and 15 to 19 minutes (937 commuters, 22.1%) for females.
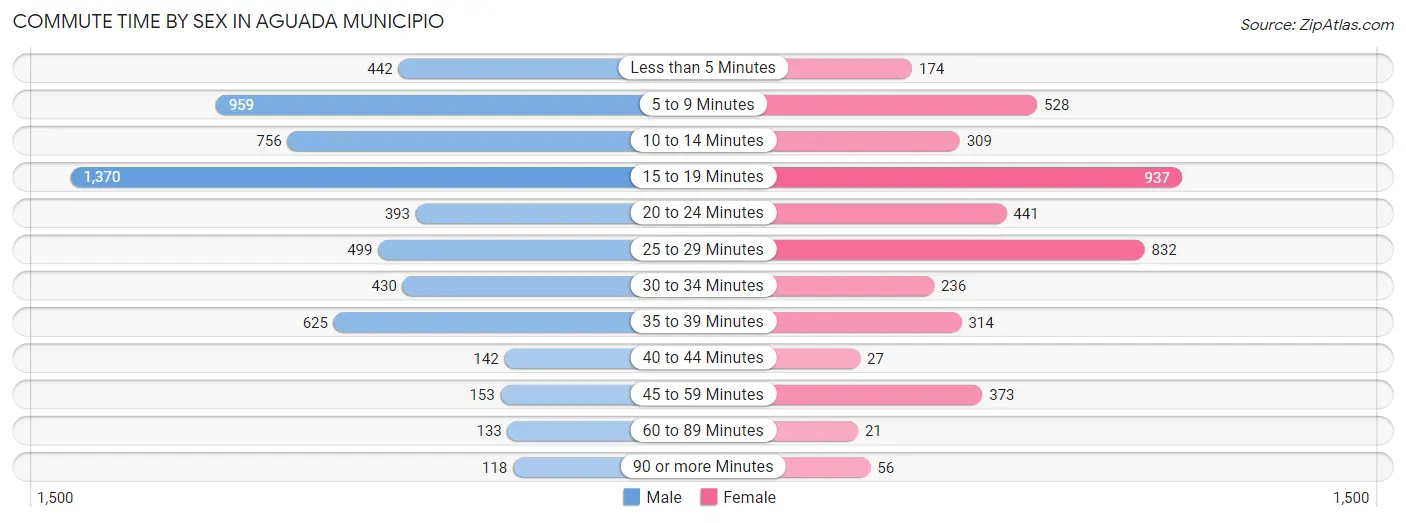
| Commute Time | Male | Female |
| Less than 5 Minutes | 442 (7.3%) | 174 (4.1%) |
| 5 to 9 Minutes | 959 (15.9%) | 528 (12.4%) |
| 10 to 14 Minutes | 756 (12.6%) | 309 (7.3%) |
| 15 to 19 Minutes | 1,370 (22.8%) | 937 (22.1%) |
| 20 to 24 Minutes | 393 (6.5%) | 441 (10.4%) |
| 25 to 29 Minutes | 499 (8.3%) | 832 (19.6%) |
| 30 to 34 Minutes | 430 (7.1%) | 236 (5.6%) |
| 35 to 39 Minutes | 625 (10.4%) | 314 (7.4%) |
| 40 to 44 Minutes | 142 (2.4%) | 27 (0.6%) |
| 45 to 59 Minutes | 153 (2.5%) | 373 (8.8%) |
| 60 to 89 Minutes | 133 (2.2%) | 21 (0.5%) |
| 90 or more Minutes | 118 (2.0%) | 56 (1.3%) |
Time of Departure to Work by Sex in Aguada Municipio
The most frequent times of departure to work in Aguada Municipio are 7:00 AM to 7:29 AM (1,538, 25.6%) for males and 7:00 AM to 7:29 AM (1,355, 31.9%) for females.
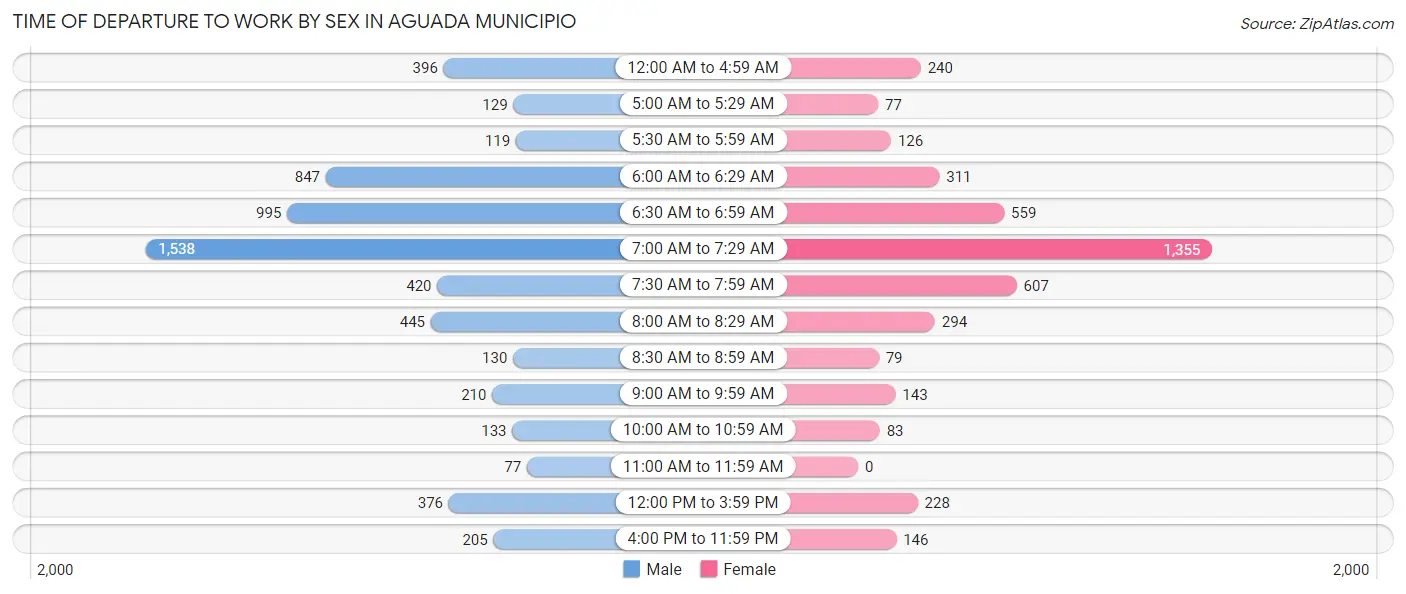
| Time of Departure | Male | Female |
| 12:00 AM to 4:59 AM | 396 (6.6%) | 240 (5.7%) |
| 5:00 AM to 5:29 AM | 129 (2.1%) | 77 (1.8%) |
| 5:30 AM to 5:59 AM | 119 (2.0%) | 126 (3.0%) |
| 6:00 AM to 6:29 AM | 847 (14.1%) | 311 (7.3%) |
| 6:30 AM to 6:59 AM | 995 (16.5%) | 559 (13.2%) |
| 7:00 AM to 7:29 AM | 1,538 (25.6%) | 1,355 (31.9%) |
| 7:30 AM to 7:59 AM | 420 (7.0%) | 607 (14.3%) |
| 8:00 AM to 8:29 AM | 445 (7.4%) | 294 (6.9%) |
| 8:30 AM to 8:59 AM | 130 (2.2%) | 79 (1.9%) |
| 9:00 AM to 9:59 AM | 210 (3.5%) | 143 (3.4%) |
| 10:00 AM to 10:59 AM | 133 (2.2%) | 83 (1.9%) |
| 11:00 AM to 11:59 AM | 77 (1.3%) | 0 (0.0%) |
| 12:00 PM to 3:59 PM | 376 (6.2%) | 228 (5.4%) |
| 4:00 PM to 11:59 PM | 205 (3.4%) | 146 (3.4%) |
| Total | 6,020 (100.0%) | 4,248 (100.0%) |
Housing Occupancy in Aguada Municipio
Occupancy by Ownership in Aguada Municipio
Of the total 12,904 dwellings in Aguada Municipio, owner-occupied units account for 9,744 (75.5%), while renter-occupied units make up 3,160 (24.5%).
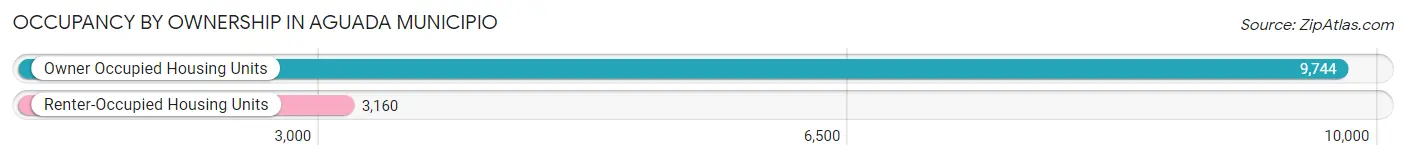
| Occupancy | # Housing Units | % Housing Units |
| Owner Occupied Housing Units | 9,744 | 75.5% |
| Renter-Occupied Housing Units | 3,160 | 24.5% |
| Total Occupied Housing Units | 12,904 | 100.0% |
Occupancy by Household Size in Aguada Municipio
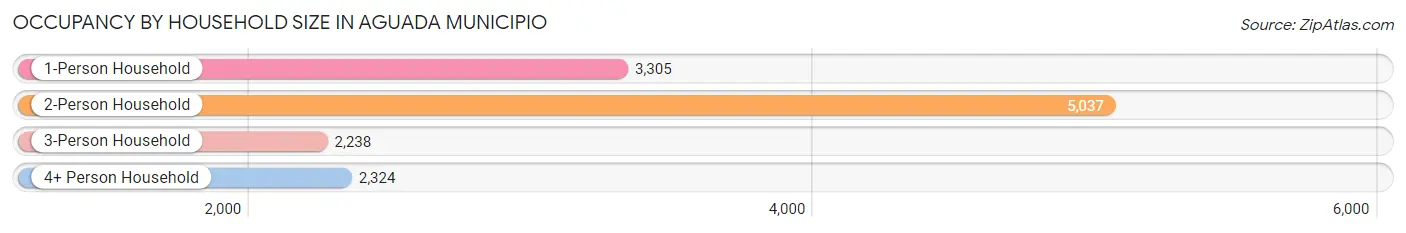
| Household Size | # Housing Units | % Housing Units |
| 1-Person Household | 3,305 | 25.6% |
| 2-Person Household | 5,037 | 39.0% |
| 3-Person Household | 2,238 | 17.3% |
| 4+ Person Household | 2,324 | 18.0% |
| Total Housing Units | 12,904 | 100.0% |
Occupancy by Ownership by Household Size in Aguada Municipio
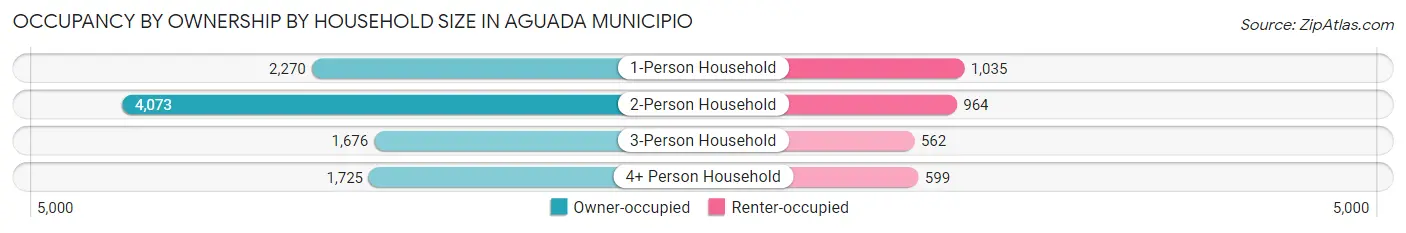
| Household Size | Owner-occupied | Renter-occupied |
| 1-Person Household | 2,270 (68.7%) | 1,035 (31.3%) |
| 2-Person Household | 4,073 (80.9%) | 964 (19.1%) |
| 3-Person Household | 1,676 (74.9%) | 562 (25.1%) |
| 4+ Person Household | 1,725 (74.2%) | 599 (25.8%) |
| Total Housing Units | 9,744 (75.5%) | 3,160 (24.5%) |
Occupancy by Educational Attainment in Aguada Municipio
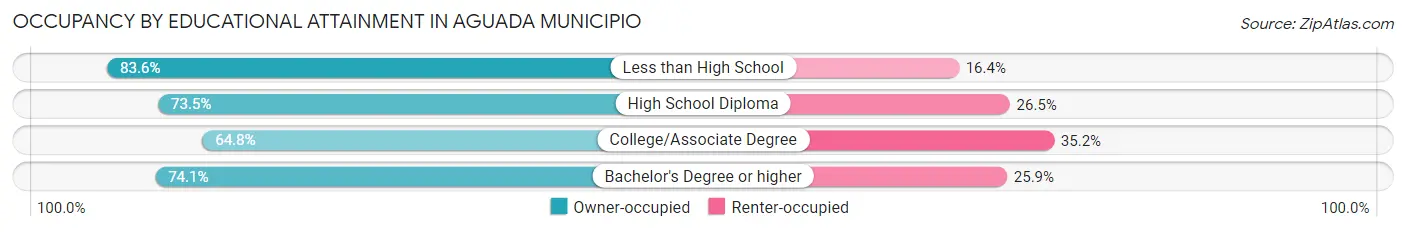
| Household Size | Owner-occupied | Renter-occupied |
| Less than High School | 3,904 (83.6%) | 764 (16.4%) |
| High School Diploma | 2,433 (73.5%) | 876 (26.5%) |
| College/Associate Degree | 1,691 (64.8%) | 920 (35.2%) |
| Bachelor's Degree or higher | 1,716 (74.1%) | 600 (25.9%) |
Occupancy by Age of Householder in Aguada Municipio
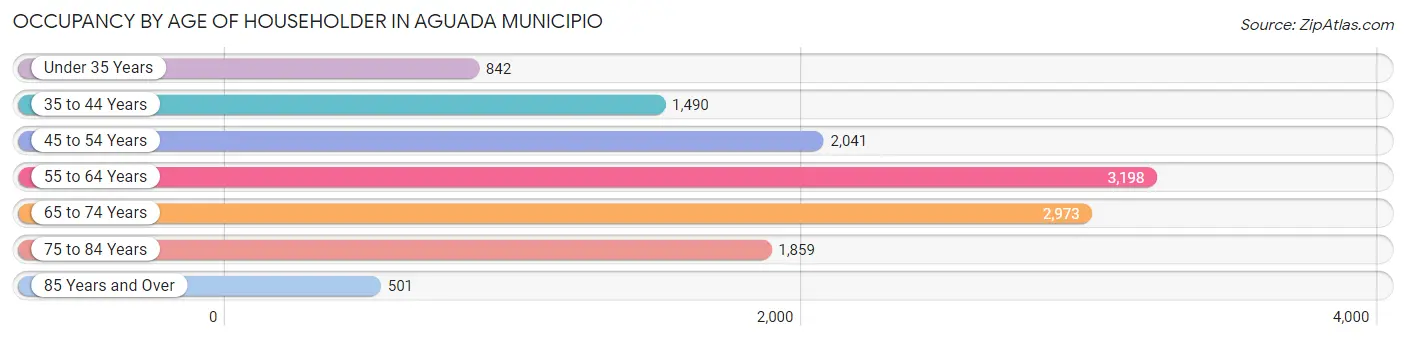
| Age Bracket | # Households | % Households |
| Under 35 Years | 842 | 6.5% |
| 35 to 44 Years | 1,490 | 11.6% |
| 45 to 54 Years | 2,041 | 15.8% |
| 55 to 64 Years | 3,198 | 24.8% |
| 65 to 74 Years | 2,973 | 23.0% |
| 75 to 84 Years | 1,859 | 14.4% |
| 85 Years and Over | 501 | 3.9% |
| Total | 12,904 | 100.0% |
Housing Finances in Aguada Municipio
Median Income by Occupancy in Aguada Municipio
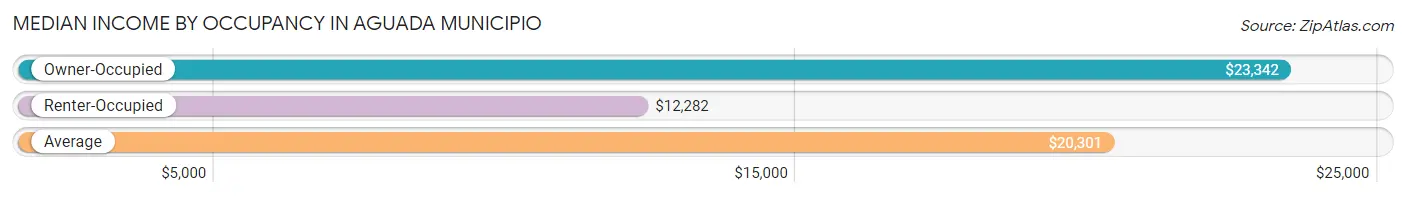
| Occupancy Type | # Households | Median Income |
| Owner-Occupied | 9,744 (75.5%) | $23,342 |
| Renter-Occupied | 3,160 (24.5%) | $12,282 |
| Average | 12,904 (100.0%) | $20,301 |
Occupancy by Householder Income Bracket in Aguada Municipio
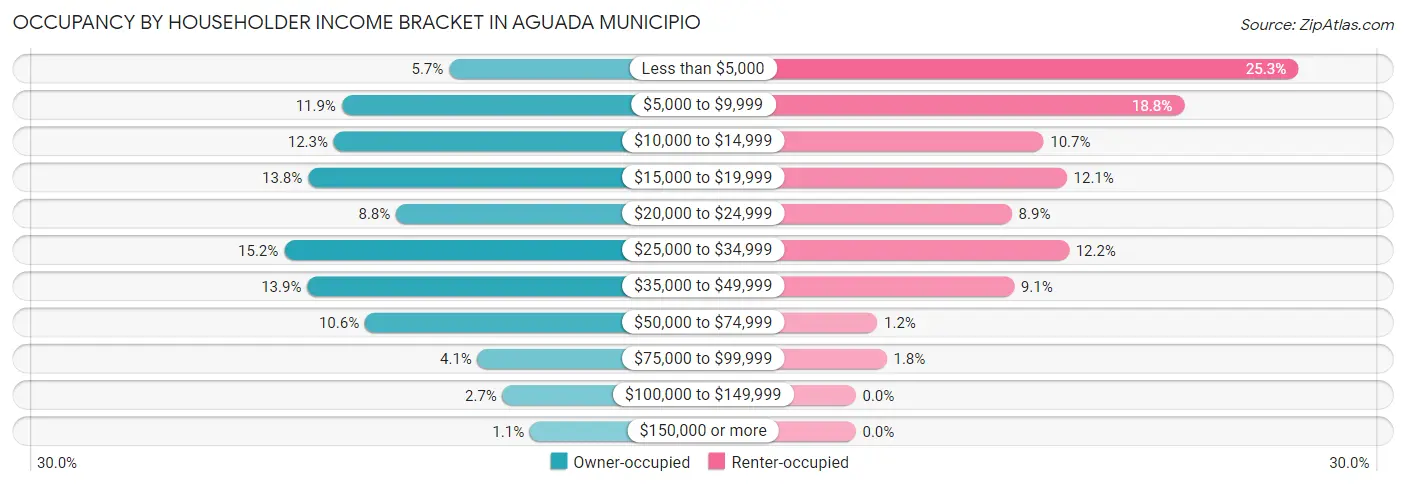
| Income Bracket | Owner-occupied | Renter-occupied |
| Less than $5,000 | 559 (5.7%) | 799 (25.3%) |
| $5,000 to $9,999 | 1,158 (11.9%) | 593 (18.8%) |
| $10,000 to $14,999 | 1,201 (12.3%) | 339 (10.7%) |
| $15,000 to $19,999 | 1,345 (13.8%) | 381 (12.1%) |
| $20,000 to $24,999 | 855 (8.8%) | 282 (8.9%) |
| $25,000 to $34,999 | 1,478 (15.2%) | 385 (12.2%) |
| $35,000 to $49,999 | 1,350 (13.9%) | 286 (9.0%) |
| $50,000 to $74,999 | 1,028 (10.5%) | 39 (1.2%) |
| $75,000 to $99,999 | 400 (4.1%) | 56 (1.8%) |
| $100,000 to $149,999 | 261 (2.7%) | 0 (0.0%) |
| $150,000 or more | 109 (1.1%) | 0 (0.0%) |
| Total | 9,744 (100.0%) | 3,160 (100.0%) |
Monthly Housing Cost Tiers in Aguada Municipio
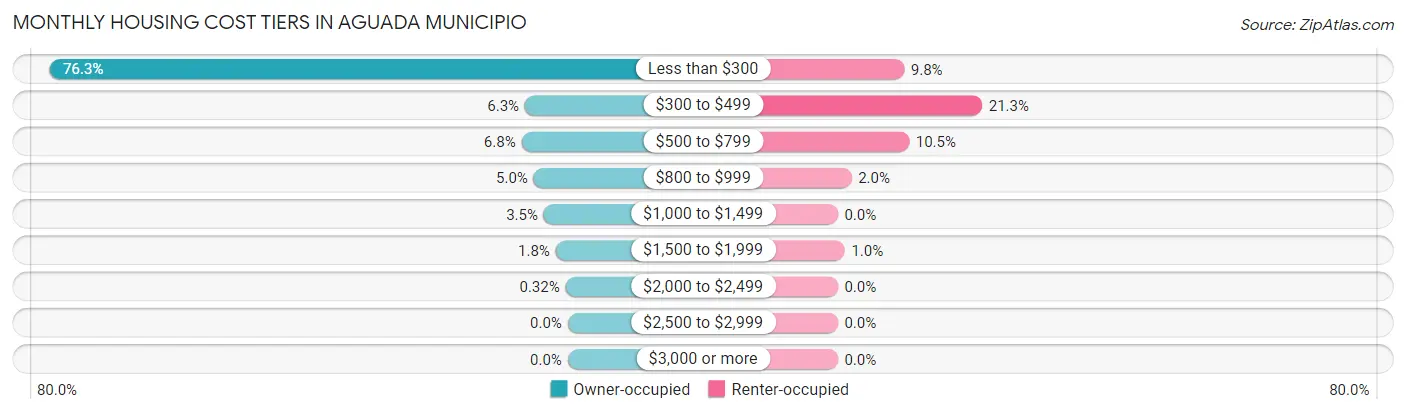
| Monthly Cost | Owner-occupied | Renter-occupied |
| Less than $300 | 7,431 (76.3%) | 309 (9.8%) |
| $300 to $499 | 614 (6.3%) | 672 (21.3%) |
| $500 to $799 | 664 (6.8%) | 332 (10.5%) |
| $800 to $999 | 488 (5.0%) | 64 (2.0%) |
| $1,000 to $1,499 | 343 (3.5%) | 0 (0.0%) |
| $1,500 to $1,999 | 173 (1.8%) | 33 (1.0%) |
| $2,000 to $2,499 | 31 (0.3%) | 0 (0.0%) |
| $2,500 to $2,999 | 0 (0.0%) | 0 (0.0%) |
| $3,000 or more | 0 (0.0%) | 0 (0.0%) |
| Total | 9,744 (100.0%) | 3,160 (100.0%) |
Physical Housing Characteristics in Aguada Municipio
Housing Structures in Aguada Municipio
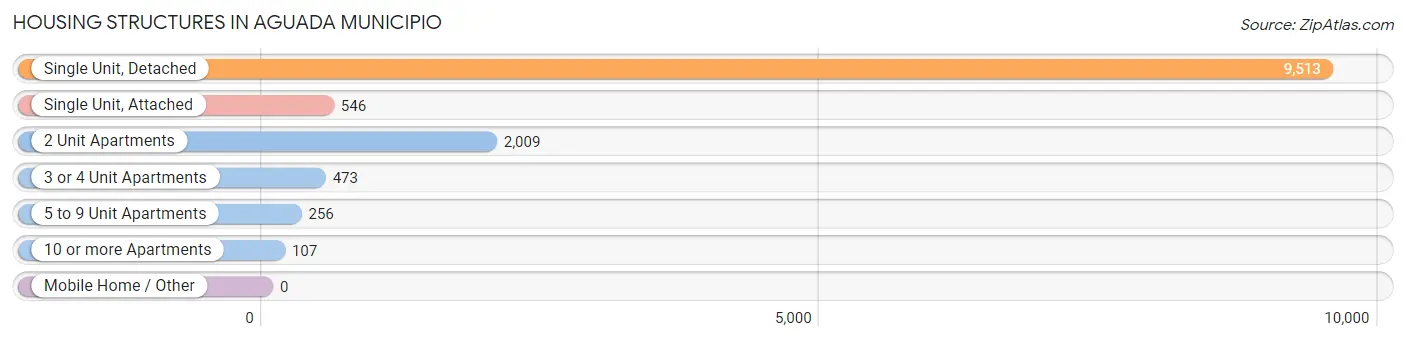
| Structure Type | # Housing Units | % Housing Units |
| Single Unit, Detached | 9,513 | 73.7% |
| Single Unit, Attached | 546 | 4.2% |
| 2 Unit Apartments | 2,009 | 15.6% |
| 3 or 4 Unit Apartments | 473 | 3.7% |
| 5 to 9 Unit Apartments | 256 | 2.0% |
| 10 or more Apartments | 107 | 0.8% |
| Mobile Home / Other | 0 | 0.0% |
| Total | 12,904 | 100.0% |
Housing Structures by Occupancy in Aguada Municipio
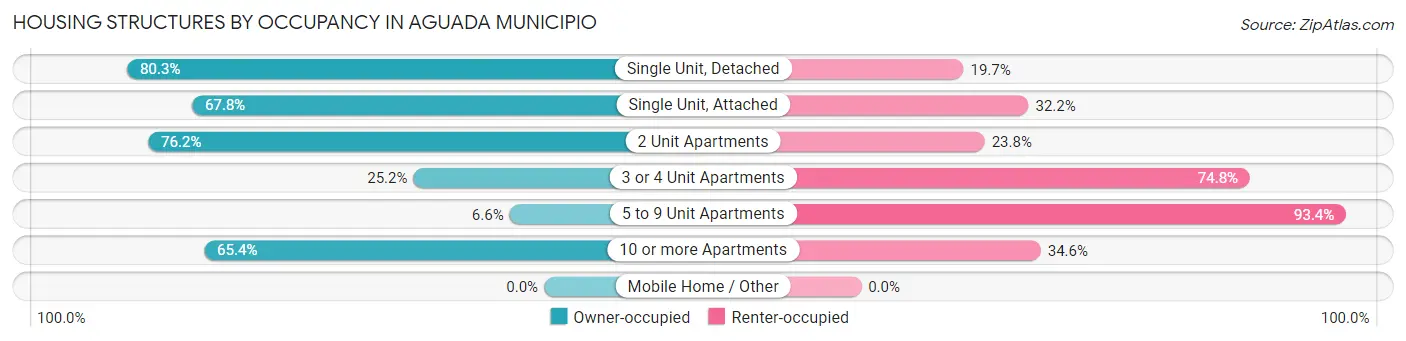
| Structure Type | Owner-occupied | Renter-occupied |
| Single Unit, Detached | 7,637 (80.3%) | 1,876 (19.7%) |
| Single Unit, Attached | 370 (67.8%) | 176 (32.2%) |
| 2 Unit Apartments | 1,531 (76.2%) | 478 (23.8%) |
| 3 or 4 Unit Apartments | 119 (25.2%) | 354 (74.8%) |
| 5 to 9 Unit Apartments | 17 (6.6%) | 239 (93.4%) |
| 10 or more Apartments | 70 (65.4%) | 37 (34.6%) |
| Mobile Home / Other | 0 (0.0%) | 0 (0.0%) |
| Total | 9,744 (75.5%) | 3,160 (24.5%) |
Housing Structures by Number of Rooms in Aguada Municipio
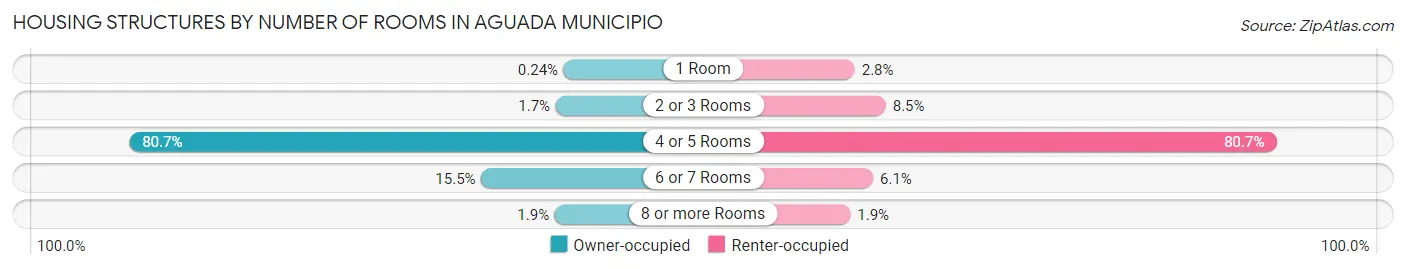
| Number of Rooms | Owner-occupied | Renter-occupied |
| 1 Room | 23 (0.2%) | 87 (2.8%) |
| 2 or 3 Rooms | 168 (1.7%) | 268 (8.5%) |
| 4 or 5 Rooms | 7,859 (80.6%) | 2,550 (80.7%) |
| 6 or 7 Rooms | 1,510 (15.5%) | 194 (6.1%) |
| 8 or more Rooms | 184 (1.9%) | 61 (1.9%) |
| Total | 9,744 (100.0%) | 3,160 (100.0%) |
Housing Structure by Heating Type in Aguada Municipio
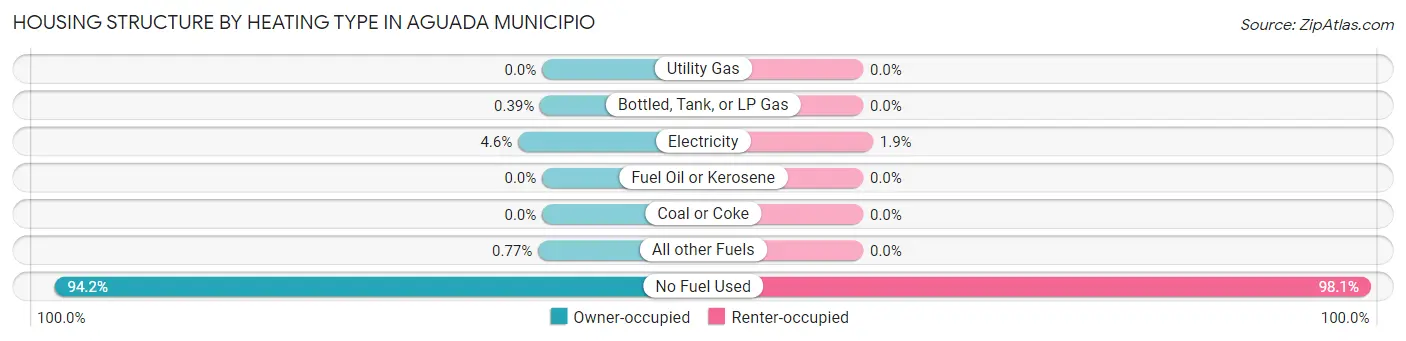
| Heating Type | Owner-occupied | Renter-occupied |
| Utility Gas | 0 (0.0%) | 0 (0.0%) |
| Bottled, Tank, or LP Gas | 38 (0.4%) | 0 (0.0%) |
| Electricity | 452 (4.6%) | 60 (1.9%) |
| Fuel Oil or Kerosene | 0 (0.0%) | 0 (0.0%) |
| Coal or Coke | 0 (0.0%) | 0 (0.0%) |
| All other Fuels | 75 (0.8%) | 0 (0.0%) |
| No Fuel Used | 9,179 (94.2%) | 3,100 (98.1%) |
| Total | 9,744 (100.0%) | 3,160 (100.0%) |
Household Vehicle Usage in Aguada Municipio
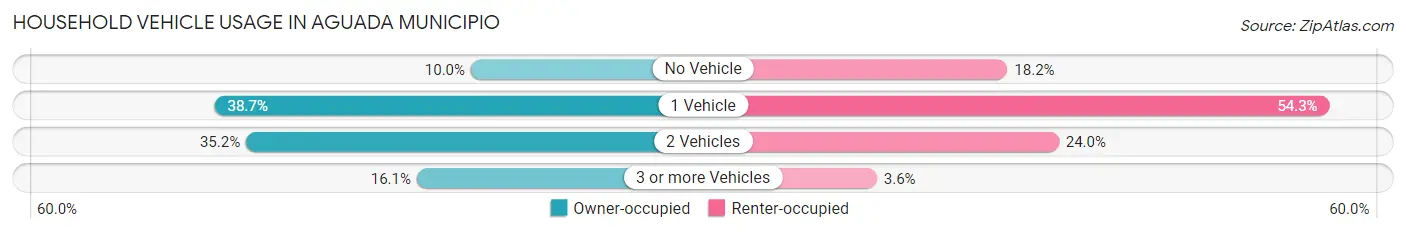
| Vehicles per Household | Owner-occupied | Renter-occupied |
| No Vehicle | 975 (10.0%) | 575 (18.2%) |
| 1 Vehicle | 3,773 (38.7%) | 1,715 (54.3%) |
| 2 Vehicles | 3,430 (35.2%) | 757 (24.0%) |
| 3 or more Vehicles | 1,566 (16.1%) | 113 (3.6%) |
| Total | 9,744 (100.0%) | 3,160 (100.0%) |
Real Estate & Mortgages in Aguada Municipio
Real Estate and Mortgage Overview in Aguada Municipio
| Characteristic | Without Mortgage | With Mortgage |
| Housing Units | 8,106 | 1,638 |
| Median Property Value | $92,700 | $145,100 |
| Median Household Income | $20,781 | $71 |
| Monthly Housing Costs | $138 | $0 |
| Real Estate Taxes | $279 | $1,458 |
Property Value by Mortgage Status in Aguada Municipio
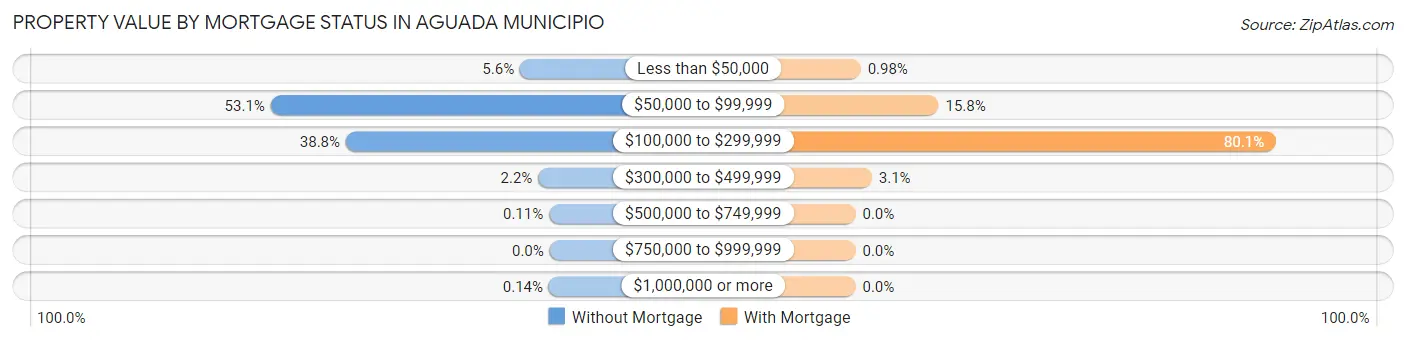
| Property Value | Without Mortgage | With Mortgage |
| Less than $50,000 | 457 (5.6%) | 16 (1.0%) |
| $50,000 to $99,999 | 4,307 (53.1%) | 259 (15.8%) |
| $100,000 to $299,999 | 3,146 (38.8%) | 1,312 (80.1%) |
| $300,000 to $499,999 | 176 (2.2%) | 51 (3.1%) |
| $500,000 to $749,999 | 9 (0.1%) | 0 (0.0%) |
| $750,000 to $999,999 | 0 (0.0%) | 0 (0.0%) |
| $1,000,000 or more | 11 (0.1%) | 0 (0.0%) |
| Total | 8,106 (100.0%) | 1,638 (100.0%) |
Household Income by Mortgage Status in Aguada Municipio
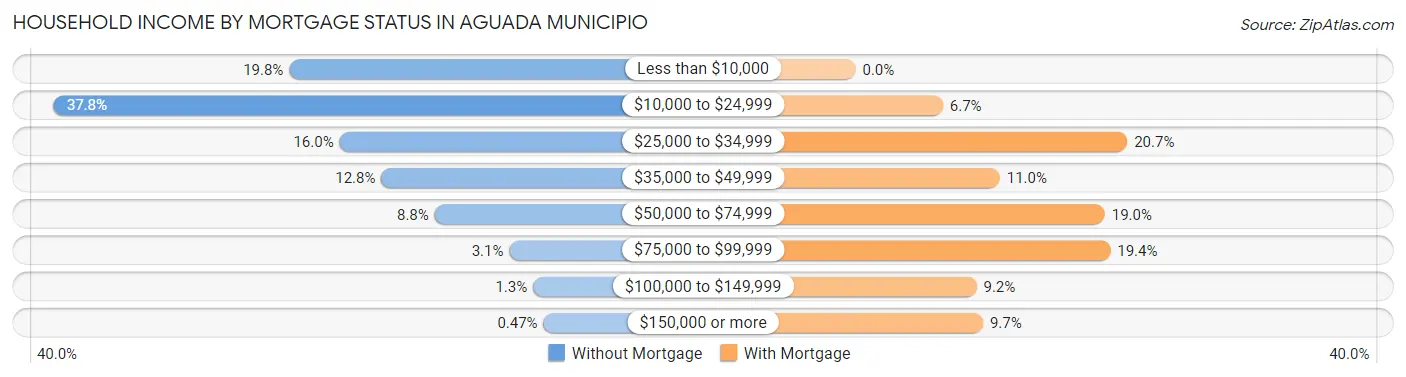
| Household Income | Without Mortgage | With Mortgage |
| Less than $10,000 | 1,608 (19.8%) | 0 (0.0%) |
| $10,000 to $24,999 | 3,062 (37.8%) | 109 (6.7%) |
| $25,000 to $34,999 | 1,298 (16.0%) | 339 (20.7%) |
| $35,000 to $49,999 | 1,039 (12.8%) | 180 (11.0%) |
| $50,000 to $74,999 | 710 (8.8%) | 311 (19.0%) |
| $75,000 to $99,999 | 249 (3.1%) | 318 (19.4%) |
| $100,000 to $149,999 | 102 (1.3%) | 151 (9.2%) |
| $150,000 or more | 38 (0.5%) | 159 (9.7%) |
| Total | 8,106 (100.0%) | 1,638 (100.0%) |
Property Value to Household Income Ratio in Aguada Municipio
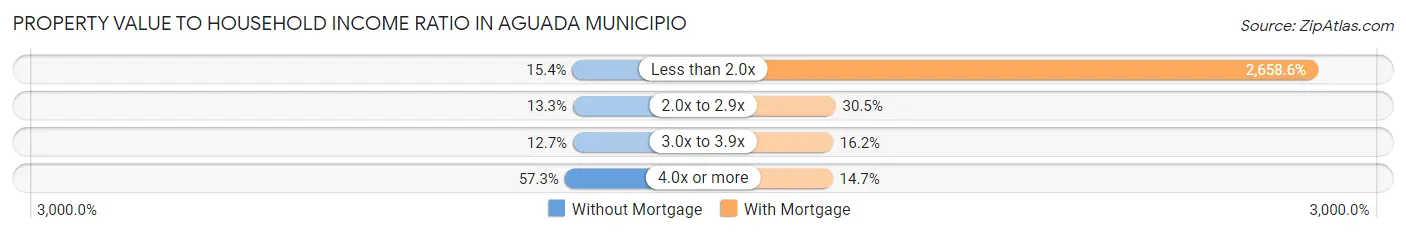
| Value-to-Income Ratio | Without Mortgage | With Mortgage |
| Less than 2.0x | 1,246 (15.4%) | 43,547 (2,658.5%) |
| 2.0x to 2.9x | 1,078 (13.3%) | 500 (30.5%) |
| 3.0x to 3.9x | 1,028 (12.7%) | 265 (16.2%) |
| 4.0x or more | 4,644 (57.3%) | 241 (14.7%) |
| Total | 8,106 (100.0%) | 1,638 (100.0%) |
Real Estate Taxes by Mortgage Status in Aguada Municipio
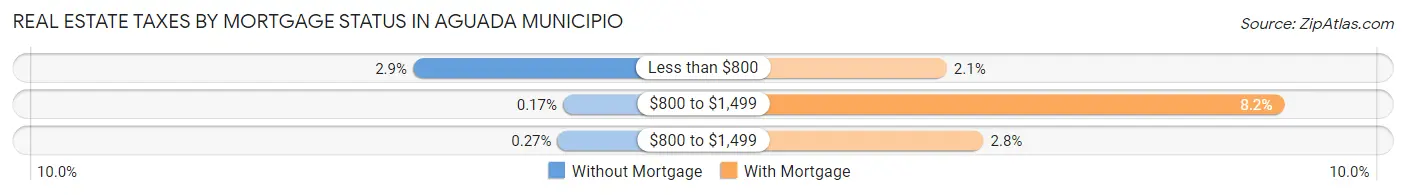
| Property Taxes | Without Mortgage | With Mortgage |
| Less than $800 | 236 (2.9%) | 34 (2.1%) |
| $800 to $1,499 | 14 (0.2%) | 135 (8.2%) |
| $800 to $1,499 | 22 (0.3%) | 45 (2.8%) |
| Total | 8,106 (100.0%) | 1,638 (100.0%) |
Health & Disability in Aguada Municipio
Health Insurance Coverage by Age in Aguada Municipio
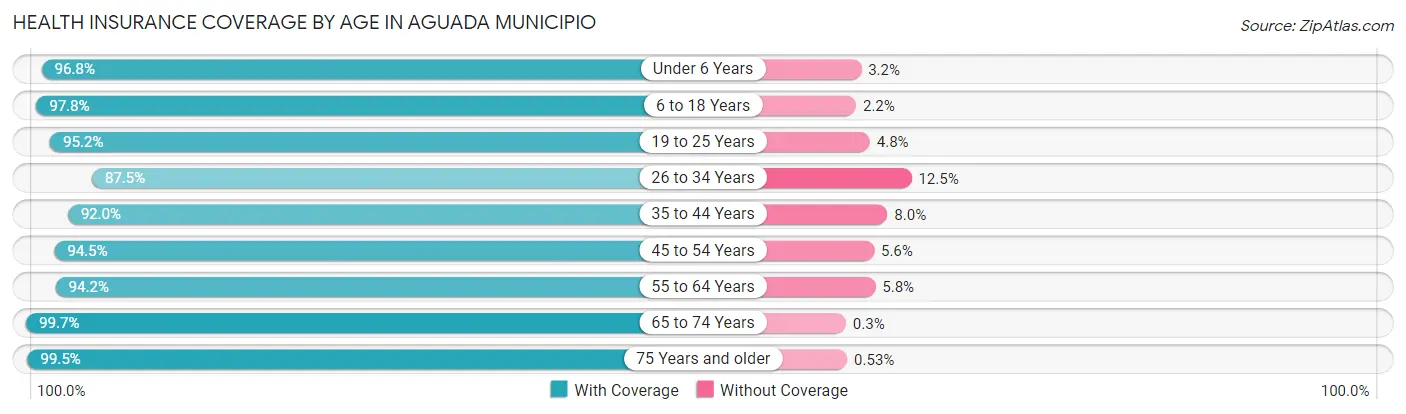
| Age Bracket | With Coverage | Without Coverage |
| Under 6 Years | 1,504 (96.8%) | 49 (3.2%) |
| 6 to 18 Years | 4,869 (97.8%) | 109 (2.2%) |
| 19 to 25 Years | 3,538 (95.2%) | 177 (4.8%) |
| 26 to 34 Years | 3,475 (87.5%) | 498 (12.5%) |
| 35 to 44 Years | 4,221 (92.0%) | 369 (8.0%) |
| 45 to 54 Years | 4,744 (94.5%) | 279 (5.6%) |
| 55 to 64 Years | 5,659 (94.2%) | 348 (5.8%) |
| 65 to 74 Years | 4,704 (99.7%) | 14 (0.3%) |
| 75 Years and older | 3,356 (99.5%) | 18 (0.5%) |
| Total | 36,070 (95.1%) | 1,861 (4.9%) |
Health Insurance Coverage by Citizenship Status in Aguada Municipio
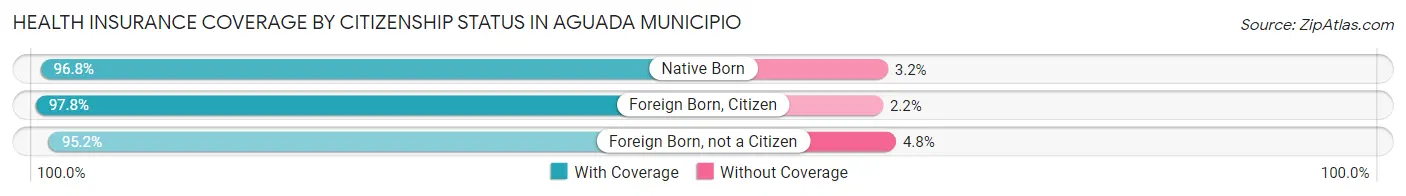
| Citizenship Status | With Coverage | Without Coverage |
| Native Born | 1,504 (96.8%) | 49 (3.2%) |
| Foreign Born, Citizen | 4,869 (97.8%) | 109 (2.2%) |
| Foreign Born, not a Citizen | 3,538 (95.2%) | 177 (4.8%) |
Health Insurance Coverage by Household Income in Aguada Municipio
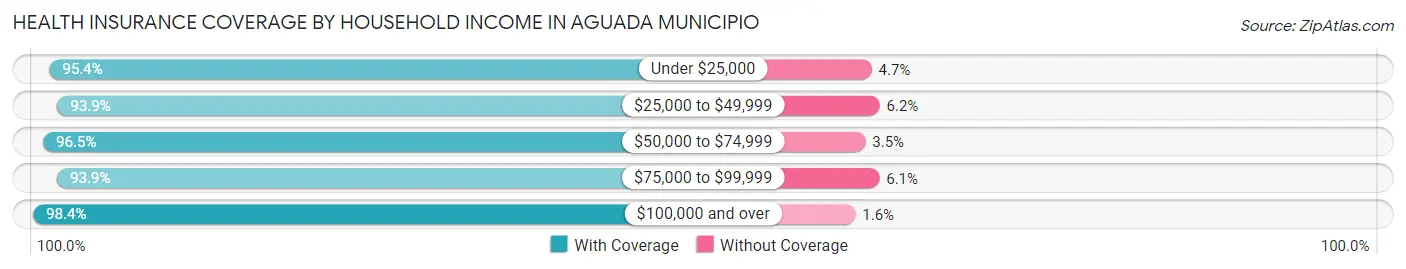
| Household Income | With Coverage | Without Coverage |
| Under $25,000 | 17,829 (95.4%) | 869 (4.6%) |
| $25,000 to $49,999 | 10,505 (93.9%) | 688 (6.1%) |
| $50,000 to $74,999 | 4,232 (96.5%) | 152 (3.5%) |
| $75,000 to $99,999 | 1,957 (93.9%) | 127 (6.1%) |
| $100,000 and over | 1,474 (98.4%) | 24 (1.6%) |
Public vs Private Health Insurance Coverage by Age in Aguada Municipio
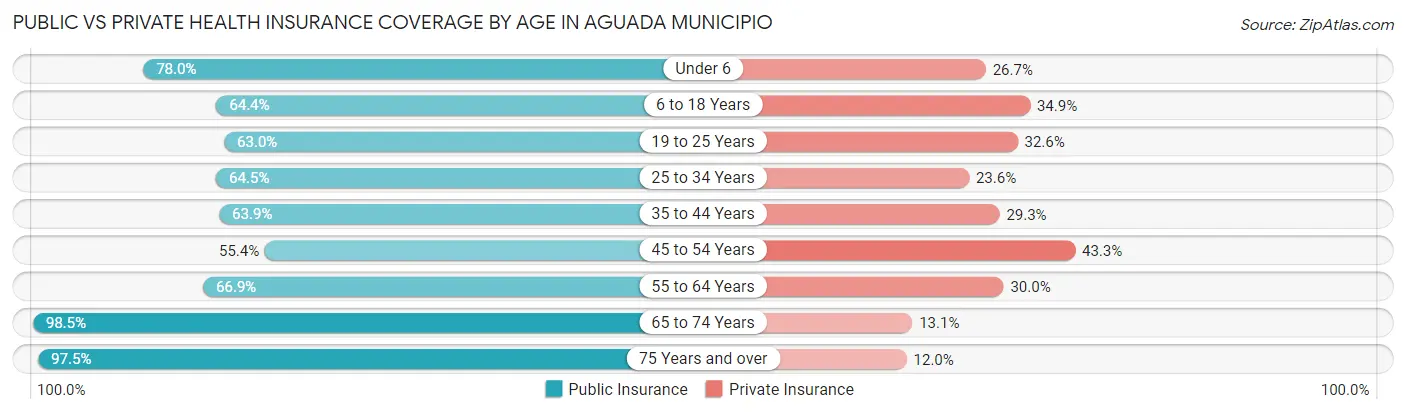
| Age Bracket | Public Insurance | Private Insurance |
| Under 6 | 1,211 (78.0%) | 415 (26.7%) |
| 6 to 18 Years | 3,206 (64.4%) | 1,739 (34.9%) |
| 19 to 25 Years | 2,340 (63.0%) | 1,212 (32.6%) |
| 25 to 34 Years | 2,561 (64.5%) | 938 (23.6%) |
| 35 to 44 Years | 2,933 (63.9%) | 1,343 (29.3%) |
| 45 to 54 Years | 2,781 (55.4%) | 2,175 (43.3%) |
| 55 to 64 Years | 4,018 (66.9%) | 1,803 (30.0%) |
| 65 to 74 Years | 4,646 (98.5%) | 617 (13.1%) |
| 75 Years and over | 3,289 (97.5%) | 406 (12.0%) |
| Total | 26,985 (71.1%) | 10,648 (28.1%) |
Disability Status by Sex by Age in Aguada Municipio
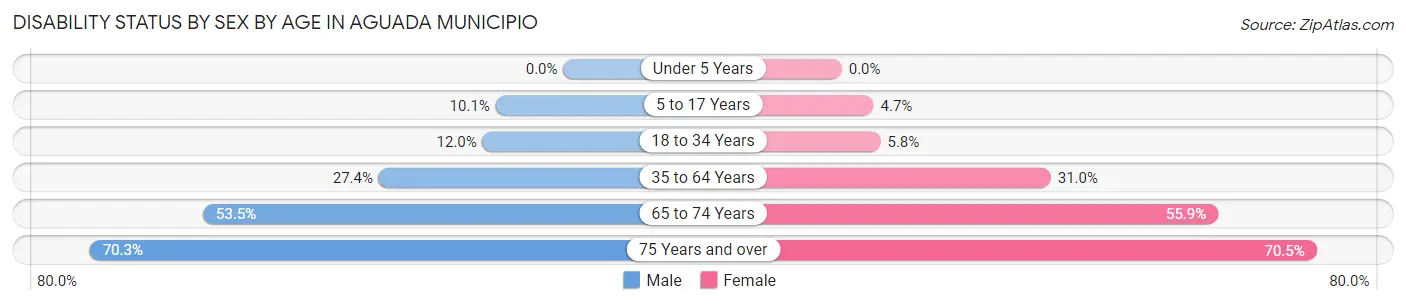
| Age Bracket | Male | Female |
| Under 5 Years | 0 (0.0%) | 0 (0.0%) |
| 5 to 17 Years | 250 (10.1%) | 117 (4.7%) |
| 18 to 34 Years | 493 (12.0%) | 227 (5.8%) |
| 35 to 64 Years | 2,067 (27.4%) | 2,507 (31.0%) |
| 65 to 74 Years | 1,223 (53.5%) | 1,359 (55.9%) |
| 75 Years and over | 1,029 (70.3%) | 1,347 (70.5%) |
Disability Class by Sex by Age in Aguada Municipio
Disability Class: Hearing Difficulty
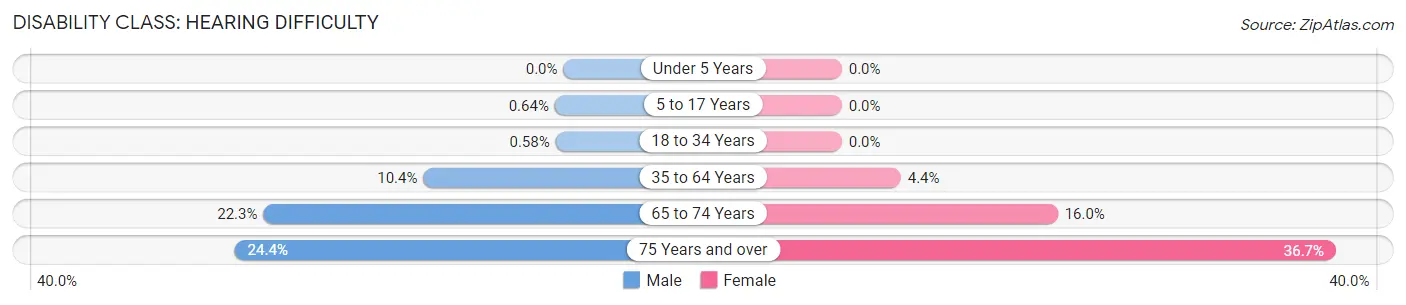
| Age Bracket | Male | Female |
| Under 5 Years | 0 (0.0%) | 0 (0.0%) |
| 5 to 17 Years | 16 (0.6%) | 0 (0.0%) |
| 18 to 34 Years | 24 (0.6%) | 0 (0.0%) |
| 35 to 64 Years | 784 (10.4%) | 354 (4.4%) |
| 65 to 74 Years | 509 (22.3%) | 390 (16.0%) |
| 75 Years and over | 357 (24.4%) | 701 (36.7%) |
Disability Class: Vision Difficulty
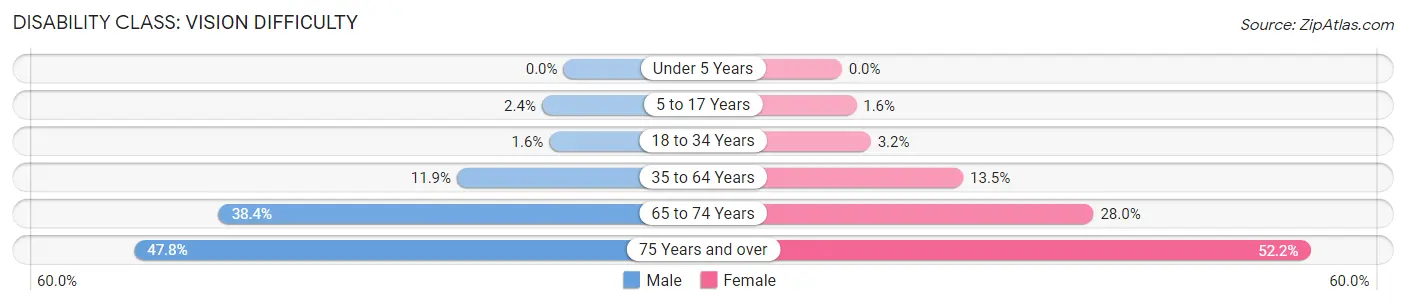
| Age Bracket | Male | Female |
| Under 5 Years | 0 (0.0%) | 0 (0.0%) |
| 5 to 17 Years | 60 (2.4%) | 40 (1.6%) |
| 18 to 34 Years | 65 (1.6%) | 127 (3.2%) |
| 35 to 64 Years | 894 (11.9%) | 1,092 (13.5%) |
| 65 to 74 Years | 877 (38.4%) | 682 (28.0%) |
| 75 Years and over | 699 (47.8%) | 997 (52.2%) |
Disability Class: Cognitive Difficulty
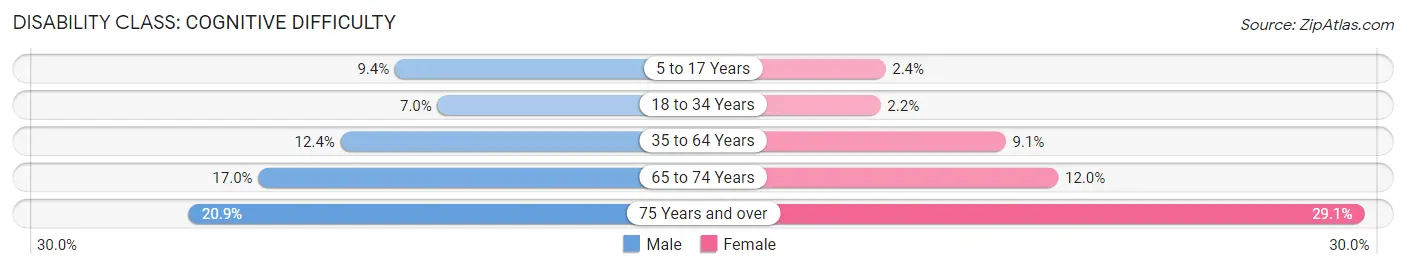
| Age Bracket | Male | Female |
| 5 to 17 Years | 233 (9.4%) | 60 (2.4%) |
| 18 to 34 Years | 288 (7.0%) | 85 (2.1%) |
| 35 to 64 Years | 935 (12.4%) | 737 (9.1%) |
| 65 to 74 Years | 388 (17.0%) | 293 (12.0%) |
| 75 Years and over | 305 (20.8%) | 556 (29.1%) |
Disability Class: Ambulatory Difficulty
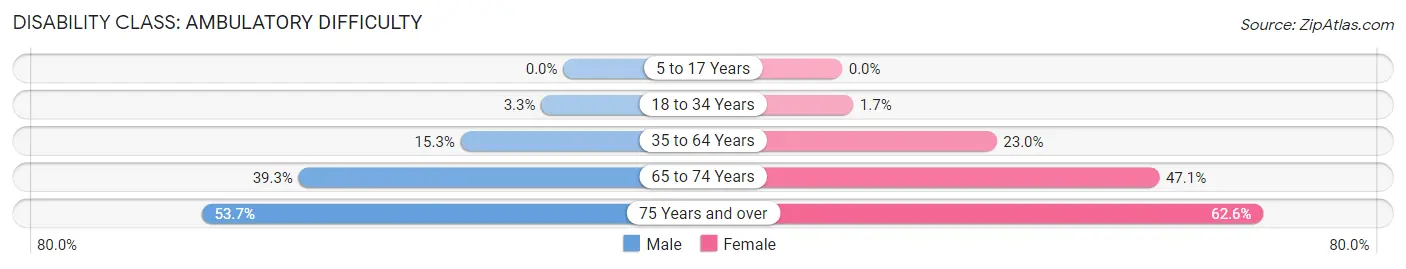
| Age Bracket | Male | Female |
| 5 to 17 Years | 0 (0.0%) | 0 (0.0%) |
| 18 to 34 Years | 135 (3.3%) | 65 (1.7%) |
| 35 to 64 Years | 1,150 (15.2%) | 1,854 (23.0%) |
| 65 to 74 Years | 898 (39.3%) | 1,146 (47.1%) |
| 75 Years and over | 786 (53.7%) | 1,196 (62.6%) |
Disability Class: Self-Care Difficulty
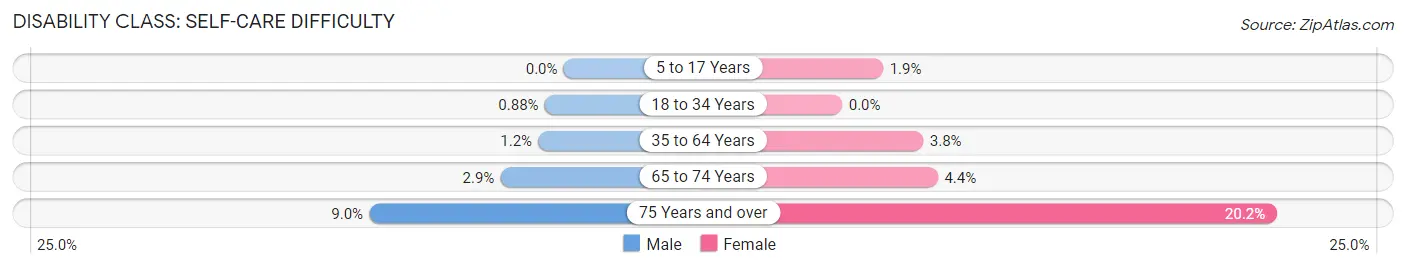
| Age Bracket | Male | Female |
| 5 to 17 Years | 0 (0.0%) | 47 (1.9%) |
| 18 to 34 Years | 36 (0.9%) | 0 (0.0%) |
| 35 to 64 Years | 89 (1.2%) | 304 (3.8%) |
| 65 to 74 Years | 67 (2.9%) | 108 (4.4%) |
| 75 Years and over | 132 (9.0%) | 386 (20.2%) |
Technology Access in Aguada Municipio
Computing Device Access in Aguada Municipio
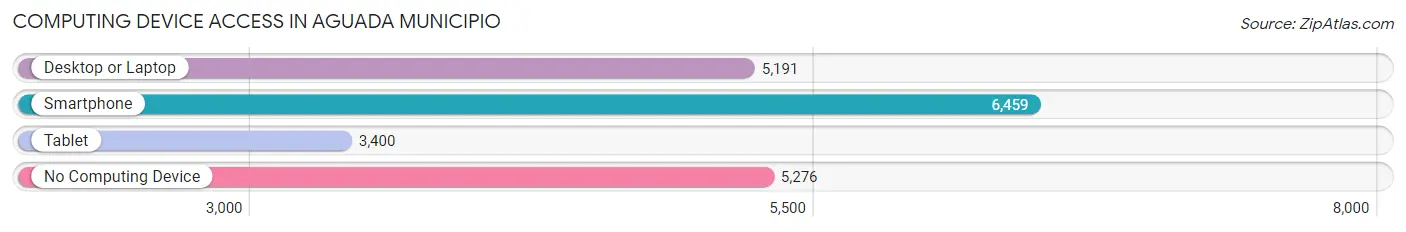
| Device Type | # Households | % Households |
| Desktop or Laptop | 5,191 | 40.2% |
| Smartphone | 6,459 | 50.0% |
| Tablet | 3,400 | 26.4% |
| No Computing Device | 5,276 | 40.9% |
| Total | 12,904 | 100.0% |
Internet Access in Aguada Municipio
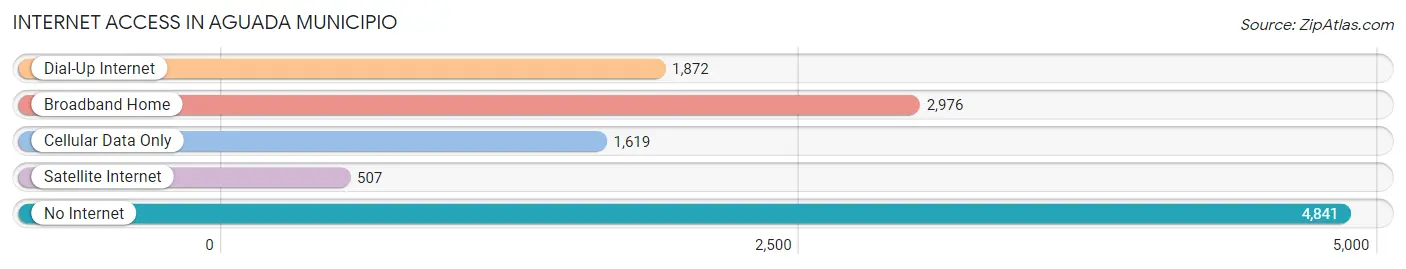
| Internet Type | # Households | % Households |
| Dial-Up Internet | 1,872 | 14.5% |
| Broadband Home | 2,976 | 23.1% |
| Cellular Data Only | 1,619 | 12.6% |
| Satellite Internet | 507 | 3.9% |
| No Internet | 4,841 | 37.5% |
| Total | 12,904 | 100.0% |
Aguada Municipio Summary
Aguada Municipio is a municipality located in the western part of Puerto Rico. It is part of the Aguadilla-Isabela-San Sebastián Metropolitan Statistical Area. As of the 2010 census, the municipality had a population of 33,544.
Geography
Aguada Municipio is located in the western part of Puerto Rico, on the northern coast of the island. It is bordered by the municipalities of Aguadilla, Moca, and San Sebastián. The municipality covers an area of approximately 40 square miles (103 km2). The terrain is mostly flat, with some hills in the northern part of the municipality. The highest point is Cerro de Punta, which rises to an elevation of 1,084 feet (330 m).
The municipality is home to several rivers, including the Río Grande de Aguada, which flows through the center of the municipality. The Río Grande de Aguada is the largest river in the municipality, and is a major source of water for the area.
Climate
Aguada Municipio has a tropical climate, with hot and humid summers and mild winters. The average annual temperature is 79°F (26°C). The average annual precipitation is 64 inches (1,620 mm).
Demographics
As of the 2010 census, the population of Aguada Municipio was 33,544. The population is predominantly of Hispanic or Latino origin, with 95.3% of the population identifying as such. The remaining 4.7% of the population is of other ethnic backgrounds.
The median age of the population is 38.3 years, with a gender ratio of 51.2% male and 48.8% female. The median household income is $19,845, and the poverty rate is 44.3%.
Economy
Aguada Municipio is primarily an agricultural area, with the main crops being sugarcane, coffee, and bananas. The municipality is also home to several manufacturing plants, including a pharmaceutical plant and a plastics factory. Tourism is also an important part of the economy, with the municipality being home to several beaches and resorts.
History
Aguada Municipio was founded in 1775 by Spanish settlers. The municipality was originally part of the municipality of Aguadilla, but was separated in 1831. The municipality was named after the Río Grande de Aguada, which flows through the area.
In the late 19th century, the economy of the municipality was based primarily on the production of sugarcane and coffee. In the early 20th century, the economy shifted to the production of bananas, which remains an important part of the economy today.
In the late 20th century, the municipality began to develop its tourism industry, with the construction of several resorts and beaches. The municipality has also seen an increase in population, as people from other parts of Puerto Rico have moved to the area in search of employment opportunities.
Common Questions
What is Per Capita Income in Aguada Municipio?
Per Capita income in Aguada Municipio is $11,364.
What is the Median Family Income in Aguada Municipio?
Median Family Income in Aguada Municipio is $24,091.
What is the Median Household income in Aguada Municipio?
Median Household Income in Aguada Municipio is $20,301.
What is Income or Wage Gap in Aguada Municipio?
Income or Wage Gap in Aguada Municipio is 5.5%.
Women in Aguada Municipio earn 94.5 cents for every dollar earned by a man.
What is Family Income Deficit in Aguada Municipio?
Family Income Deficit in Aguada Municipio is $9,831.
Families that are below poverty line in Aguada Municipio earn $9,831 less on average than the poverty threshold level.
What is Inequality or Gini Index in Aguada Municipio?
Inequality or Gini Index in Aguada Municipio is 0.47.
What is the Total Population of Aguada Municipio?
Total Population of Aguada Municipio is 37,998.
What is the Total Male Population of Aguada Municipio?
Total Male Population of Aguada Municipio is 18,528.
What is the Total Female Population of Aguada Municipio?
Total Female Population of Aguada Municipio is 19,470.
What is the Ratio of Males per 100 Females in Aguada Municipio?
There are 95.16 Males per 100 Females in Aguada Municipio.
What is the Ratio of Females per 100 Males in Aguada Municipio?
There are 105.08 Females per 100 Males in Aguada Municipio.
What is the Median Population Age in Aguada Municipio?
Median Population Age in Aguada Municipio is 45.4 Years.
What is the Average Family Size in Aguada Municipio
Average Family Size in Aguada Municipio is 3.6 People.
What is the Average Household Size in Aguada Municipio
Average Household Size in Aguada Municipio is 2.9 People.
How Large is the Labor Force in Aguada Municipio?
There are 12,317 People in the Labor Forcein in Aguada Municipio.
What is the Percentage of People in the Labor Force in Aguada Municipio?
37.6% of People are in the Labor Force in Aguada Municipio.
What is the Unemployment Rate in Aguada Municipio?
Unemployment Rate in Aguada Municipio is 7.6%.