Barceloneta, PR Map & Demographics
Barceloneta Map
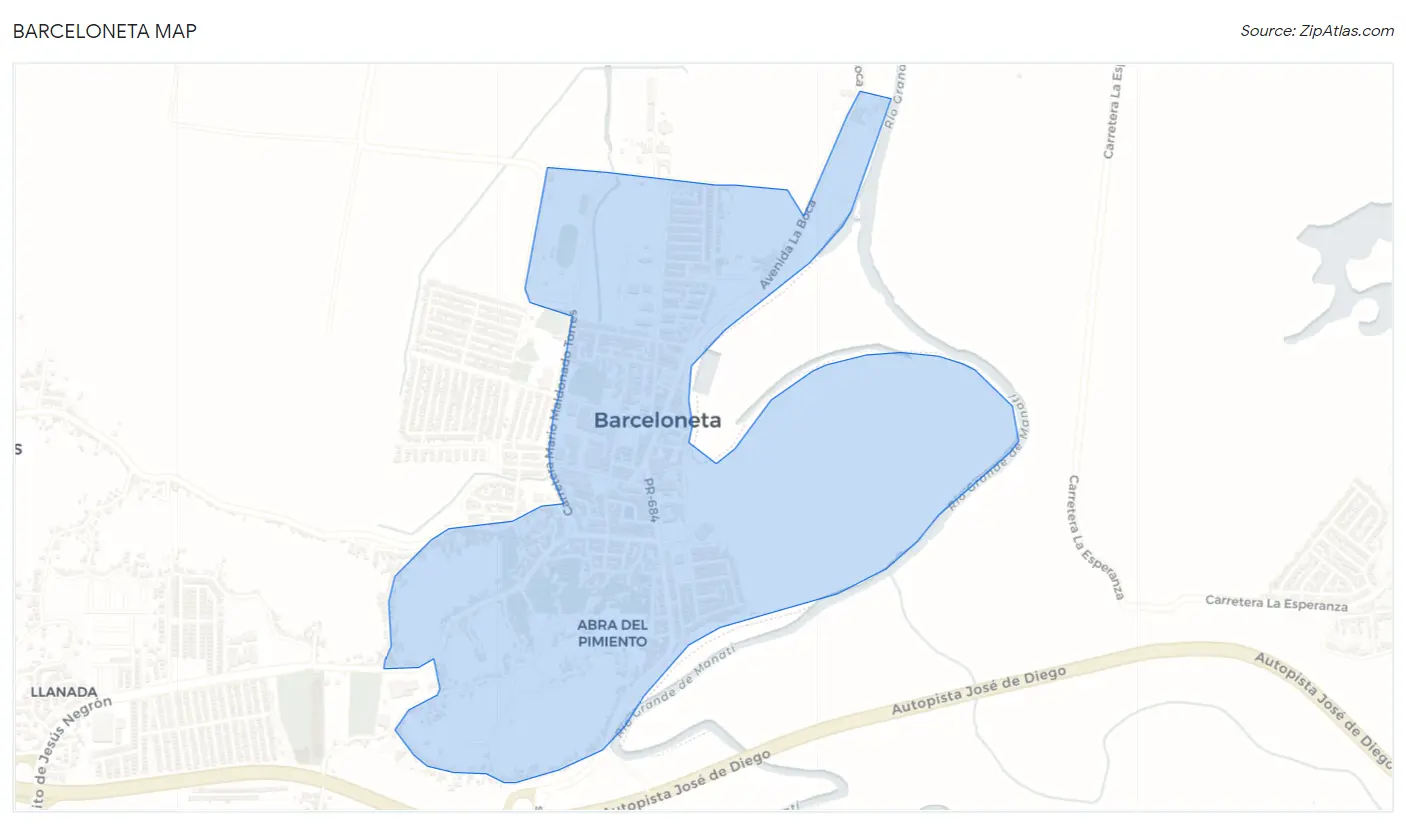
Barceloneta Overview
$11,313
PER CAPITA INCOME
$17,075
AVG FAMILY INCOME
$17,558
AVG HOUSEHOLD INCOME
20.9%
WAGE / INCOME GAP [ % ]
79.1¢/ $1
WAGE / INCOME GAP [ $ ]
$11,171
FAMILY INCOME DEFICIT
0.48
INEQUALITY / GINI INDEX
3,548
TOTAL POPULATION
1,472
MALE POPULATION
2,076
FEMALE POPULATION
70.91
MALES / 100 FEMALES
141.03
FEMALES / 100 MALES
47.1
MEDIAN AGE
3.2
AVG FAMILY SIZE
2.6
AVG HOUSEHOLD SIZE
1,008
LABOR FORCE [ PEOPLE ]
32.7%
PERCENT IN LABOR FORCE
28.9%
UNEMPLOYMENT RATE
Barceloneta Zip Codes
Barceloneta Area Codes
Income in Barceloneta
Income Overview in Barceloneta
Per Capita Income in Barceloneta is $11,313, while median incomes of families and households are $17,075 and $17,558 respectively.
| Characteristic | Number | Measure |
| Per Capita Income | 3,548 | $11,313 |
| Median Family Income | 924 | $17,075 |
| Mean Family Income | 924 | $23,912 |
| Median Household Income | 1,349 | $17,558 |
| Mean Household Income | 1,349 | $24,038 |
| Income Deficit | 924 | $11,171 |
| Wage / Income Gap (%) | 3,548 | 20.87% |
| Wage / Income Gap ($) | 3,548 | 79.13¢ per $1 |
| Gini / Inequality Index | 3,548 | 0.48 |
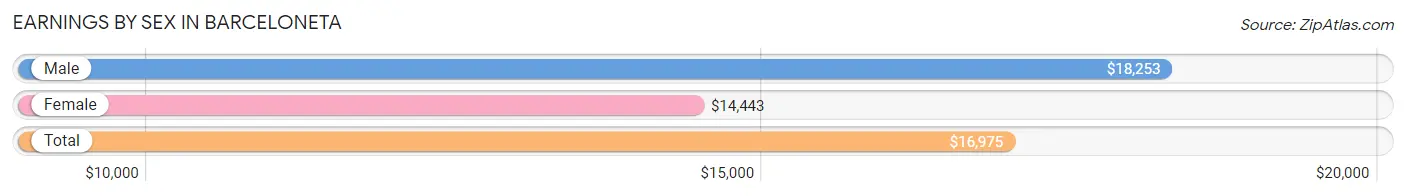
Earnings by Sex in Barceloneta
Average Earnings in Barceloneta are $16,975, $18,253 for men and $14,443 for women, a difference of 20.9%.
| Sex | Number | Average Earnings |
| Male | 401 (46.0%) | $18,253 |
| Female | 471 (54.0%) | $14,443 |
| Total | 872 (100.0%) | $16,975 |
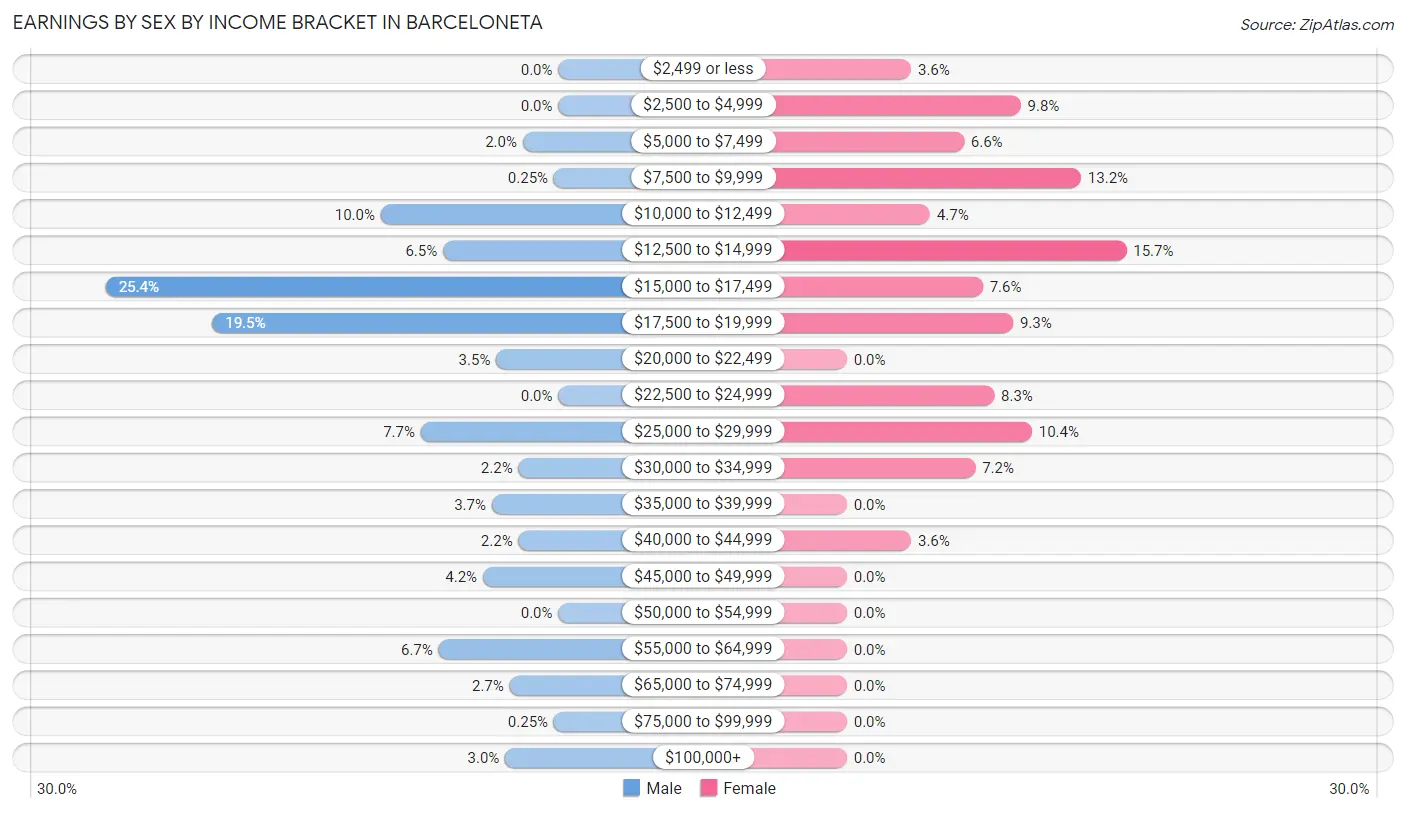
Earnings by Sex by Income Bracket in Barceloneta
The most common earnings brackets in Barceloneta are $15,000 to $17,499 for men (102 | 25.4%) and $12,500 to $14,999 for women (74 | 15.7%).
| Income | Male | Female |
| $2,499 or less | 0 (0.0%) | 17 (3.6%) |
| $2,500 to $4,999 | 0 (0.0%) | 46 (9.8%) |
| $5,000 to $7,499 | 8 (2.0%) | 31 (6.6%) |
| $7,500 to $9,999 | 1 (0.3%) | 62 (13.2%) |
| $10,000 to $12,499 | 40 (10.0%) | 22 (4.7%) |
| $12,500 to $14,999 | 26 (6.5%) | 74 (15.7%) |
| $15,000 to $17,499 | 102 (25.4%) | 36 (7.6%) |
| $17,500 to $19,999 | 78 (19.5%) | 44 (9.3%) |
| $20,000 to $22,499 | 14 (3.5%) | 0 (0.0%) |
| $22,500 to $24,999 | 0 (0.0%) | 39 (8.3%) |
| $25,000 to $29,999 | 31 (7.7%) | 49 (10.4%) |
| $30,000 to $34,999 | 9 (2.2%) | 34 (7.2%) |
| $35,000 to $39,999 | 15 (3.7%) | 0 (0.0%) |
| $40,000 to $44,999 | 9 (2.2%) | 17 (3.6%) |
| $45,000 to $49,999 | 17 (4.2%) | 0 (0.0%) |
| $50,000 to $54,999 | 0 (0.0%) | 0 (0.0%) |
| $55,000 to $64,999 | 27 (6.7%) | 0 (0.0%) |
| $65,000 to $74,999 | 11 (2.7%) | 0 (0.0%) |
| $75,000 to $99,999 | 1 (0.3%) | 0 (0.0%) |
| $100,000+ | 12 (3.0%) | 0 (0.0%) |
| Total | 401 (100.0%) | 471 (100.0%) |
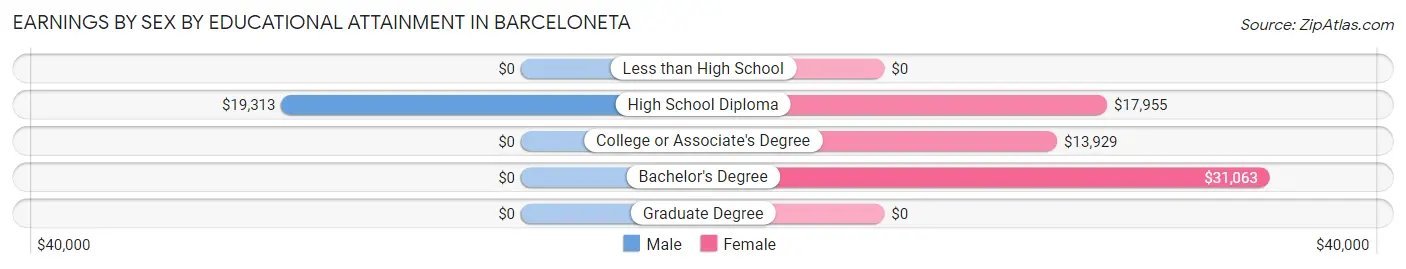
Earnings by Sex by Educational Attainment in Barceloneta
Average earnings in Barceloneta are $19,567 for men and $15,625 for women, a difference of 20.2%. Men with an educational attainment of high school diploma enjoy the highest average annual earnings of $19,313, while those with high school diploma education earn the least with $19,313. Women with an educational attainment of bachelor's degree earn the most with the average annual earnings of $31,063, while those with college or associate's degree education have the smallest earnings of $13,929.
| Educational Attainment | Male Income | Female Income |
| Less than High School | - | - |
| High School Diploma | $19,313 | $17,955 |
| College or Associate's Degree | - | - |
| Bachelor's Degree | - | - |
| Graduate Degree | - | - |
| Total | $19,567 | $15,625 |
Family Income in Barceloneta
Family Income Brackets in Barceloneta
According to the Barceloneta family income data, there are 288 families falling into the $15,000 to $24,999 income range, which is the most common income bracket and makes up 31.2% of all families.
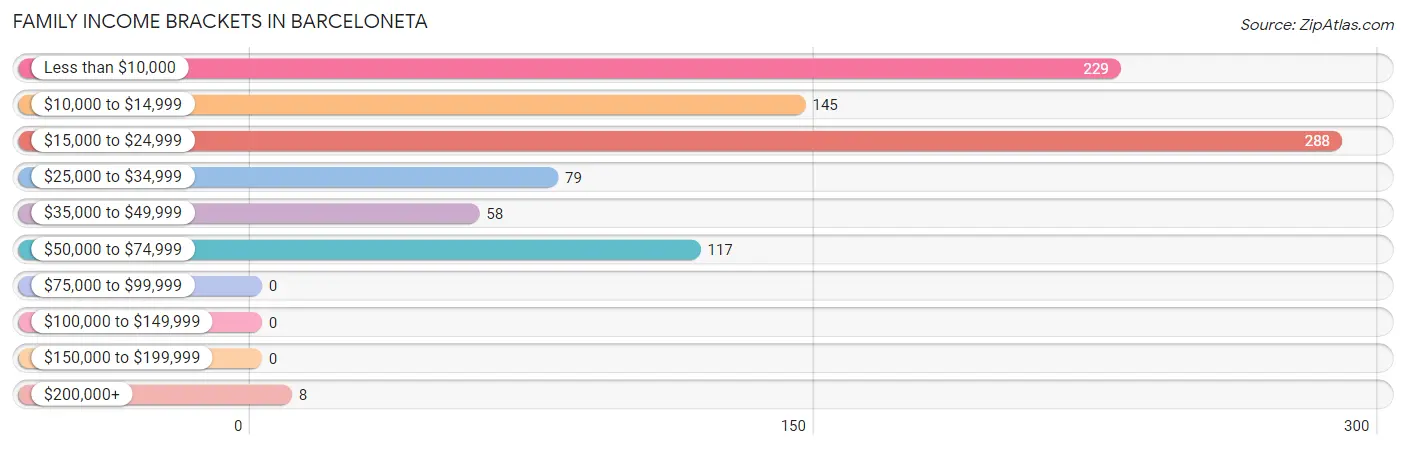
| Income Bracket | # Families | % Families |
| Less than $10,000 | 229 | 24.8% |
| $10,000 to $14,999 | 145 | 15.7% |
| $15,000 to $24,999 | 288 | 31.2% |
| $25,000 to $34,999 | 79 | 8.5% |
| $35,000 to $49,999 | 58 | 6.3% |
| $50,000 to $74,999 | 117 | 12.7% |
| $75,000 to $99,999 | 0 | 0.0% |
| $100,000 to $149,999 | 0 | 0.0% |
| $150,000 to $199,999 | 0 | 0.0% |
| $200,000+ | 8 | 0.9% |
Family Income by Famaliy Size in Barceloneta
5-person families (57 | 6.2%) account for the highest median family income in Barceloneta with $26,250 per family, while 2-person families (585 | 63.3%) have the highest median income of $8,526 per family member.
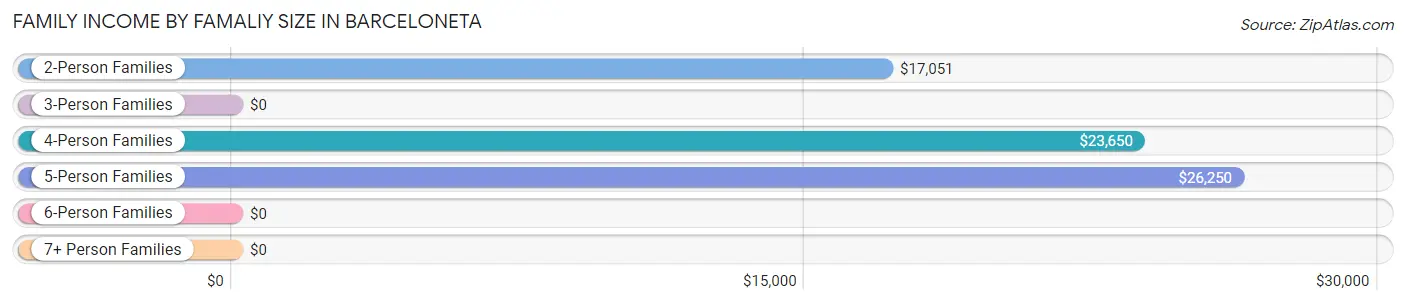
| Income Bracket | # Families | Median Income |
| 2-Person Families | 585 (63.3%) | $17,051 |
| 3-Person Families | 213 (23.1%) | $0 |
| 4-Person Families | 69 (7.5%) | $23,650 |
| 5-Person Families | 57 (6.2%) | $26,250 |
| 6-Person Families | 0 (0.0%) | $0 |
| 7+ Person Families | 0 (0.0%) | $0 |
| Total | 924 (100.0%) | $17,075 |
Family Income by Number of Earners in Barceloneta
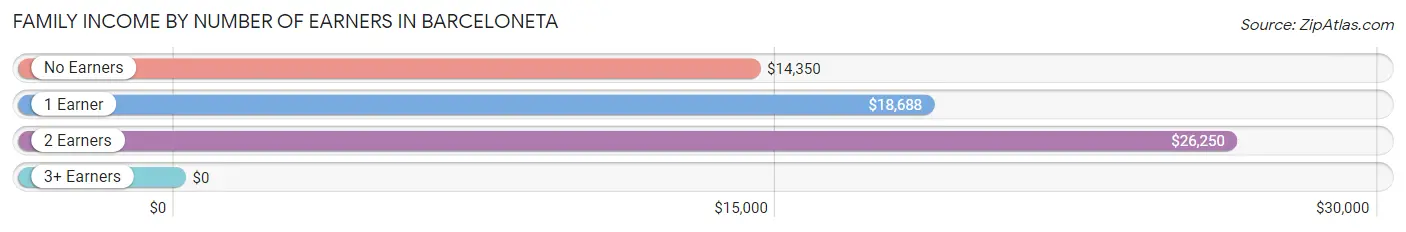
| Number of Earners | # Families | Median Income |
| No Earners | 583 (63.1%) | $14,350 |
| 1 Earner | 263 (28.5%) | $18,688 |
| 2 Earners | 43 (4.6%) | $26,250 |
| 3+ Earners | 35 (3.8%) | $0 |
| Total | 924 (100.0%) | $17,075 |
Household Income in Barceloneta
Household Income Brackets in Barceloneta
With 425 households falling in the category, the $15,000 to $24,999 income range is the most frequent in Barceloneta, accounting for 31.5% of all households.
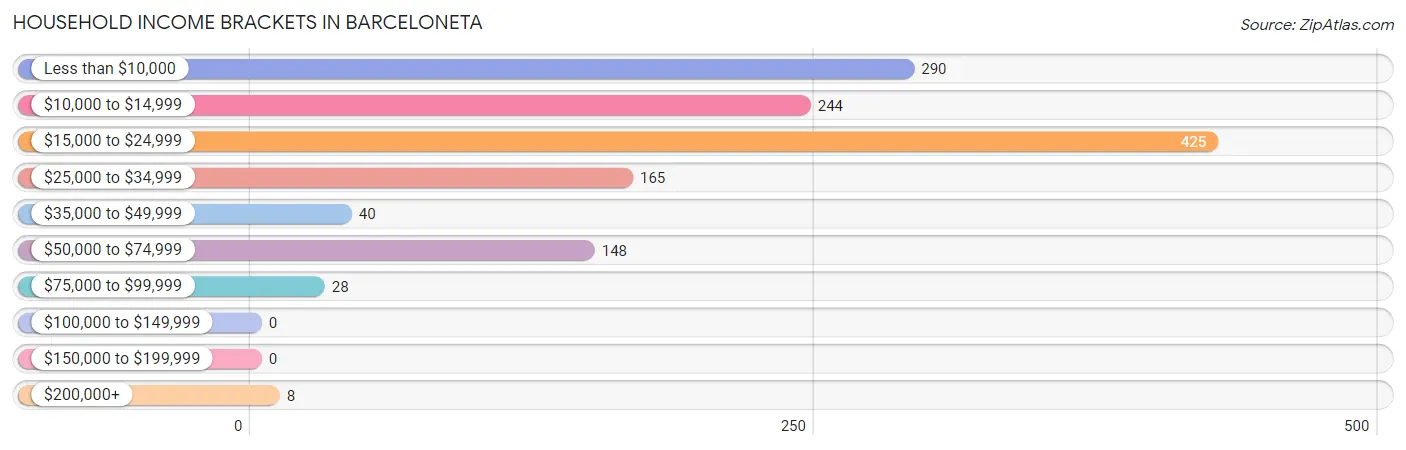
| Income Bracket | # Households | % Households |
| Less than $10,000 | 290 | 21.5% |
| $10,000 to $14,999 | 244 | 18.1% |
| $15,000 to $24,999 | 425 | 31.5% |
| $25,000 to $34,999 | 165 | 12.2% |
| $35,000 to $49,999 | 40 | 3.0% |
| $50,000 to $74,999 | 148 | 11.0% |
| $75,000 to $99,999 | 28 | 2.1% |
| $100,000 to $149,999 | 0 | 0.0% |
| $150,000 to $199,999 | 0 | 0.0% |
| $200,000+ | 8 | 0.6% |
Household Income by Householder Age in Barceloneta
The median household income in Barceloneta is $17,558, with the highest median household income of $19,299 found in the 45 to 64 years age bracket for the primary householder. A total of 401 households (29.7%) fall into this category.
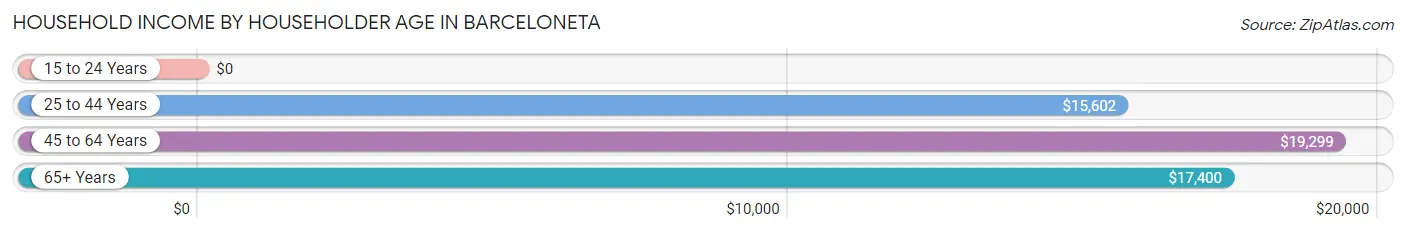
| Income Bracket | # Households | Median Income |
| 15 to 24 Years | 0 (0.0%) | $0 |
| 25 to 44 Years | 372 (27.6%) | $15,602 |
| 45 to 64 Years | 401 (29.7%) | $19,299 |
| 65+ Years | 576 (42.7%) | $17,400 |
| Total | 1,349 (100.0%) | $17,558 |
Poverty in Barceloneta
Income Below Poverty by Sex and Age in Barceloneta
With 52.0% poverty level for males and 56.5% for females among the residents of Barceloneta, under 5 year old males and 5 year old females are the most vulnerable to poverty, with 70 males (100.0%) and 26 females (100.0%) in their respective age groups living below the poverty level.
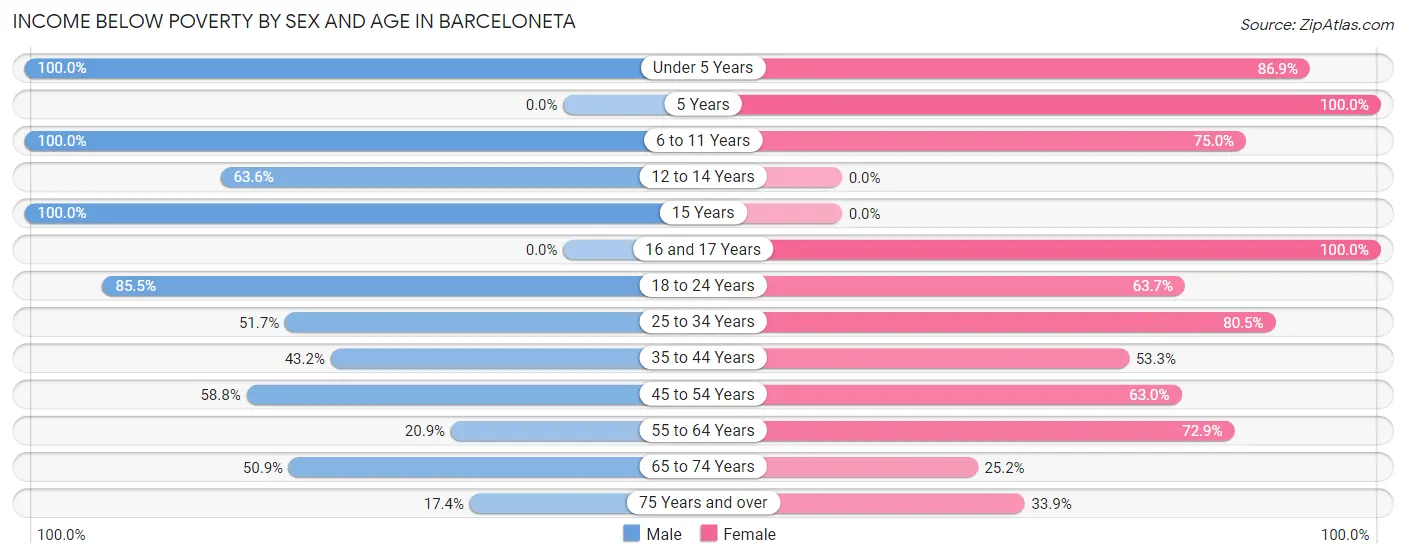
| Age Bracket | Male | Female |
| Under 5 Years | 70 (100.0%) | 86 (86.9%) |
| 5 Years | 0 (0.0%) | 26 (100.0%) |
| 6 to 11 Years | 24 (100.0%) | 54 (75.0%) |
| 12 to 14 Years | 49 (63.6%) | 0 (0.0%) |
| 15 Years | 50 (100.0%) | 0 (0.0%) |
| 16 and 17 Years | 0 (0.0%) | 31 (100.0%) |
| 18 to 24 Years | 130 (85.5%) | 177 (63.7%) |
| 25 to 34 Years | 93 (51.7%) | 272 (80.5%) |
| 35 to 44 Years | 38 (43.2%) | 98 (53.3%) |
| 45 to 54 Years | 100 (58.8%) | 92 (63.0%) |
| 55 to 64 Years | 43 (20.9%) | 153 (72.9%) |
| 65 to 74 Years | 135 (50.9%) | 104 (25.2%) |
| 75 Years and over | 33 (17.4%) | 79 (33.9%) |
| Total | 765 (52.0%) | 1,172 (56.5%) |
Income Above Poverty by Sex and Age in Barceloneta
According to the poverty statistics in Barceloneta, males aged 75 years and over and females aged 12 to 14 years are the age groups that are most secure financially, with 82.6% of males and 100.0% of females in these age groups living above the poverty line.
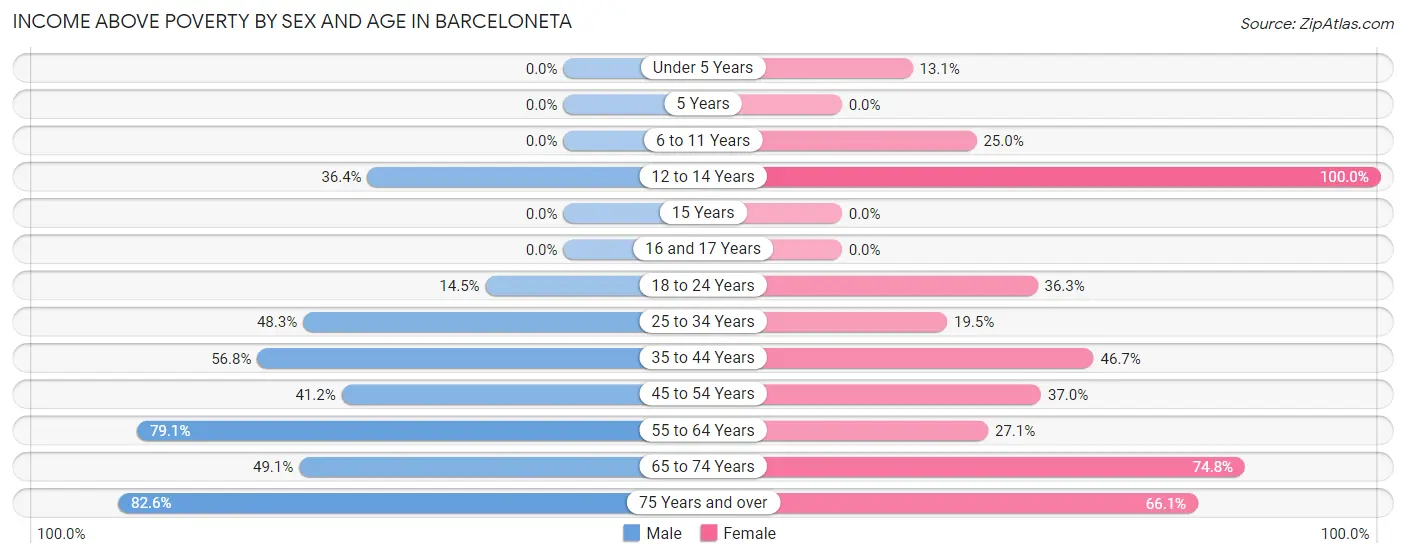
| Age Bracket | Male | Female |
| Under 5 Years | 0 (0.0%) | 13 (13.1%) |
| 5 Years | 0 (0.0%) | 0 (0.0%) |
| 6 to 11 Years | 0 (0.0%) | 18 (25.0%) |
| 12 to 14 Years | 28 (36.4%) | 46 (100.0%) |
| 15 Years | 0 (0.0%) | 0 (0.0%) |
| 16 and 17 Years | 0 (0.0%) | 0 (0.0%) |
| 18 to 24 Years | 22 (14.5%) | 101 (36.3%) |
| 25 to 34 Years | 87 (48.3%) | 66 (19.5%) |
| 35 to 44 Years | 50 (56.8%) | 86 (46.7%) |
| 45 to 54 Years | 70 (41.2%) | 54 (37.0%) |
| 55 to 64 Years | 163 (79.1%) | 57 (27.1%) |
| 65 to 74 Years | 130 (49.1%) | 309 (74.8%) |
| 75 Years and over | 157 (82.6%) | 154 (66.1%) |
| Total | 707 (48.0%) | 904 (43.5%) |
Income Below Poverty Among Married-Couple Families in Barceloneta
The poverty statistics for married-couple families in Barceloneta show that 52.9% or 111 of the total 210 families live below the poverty line. Families with 1 or 2 children have the highest poverty rate of 70.3%, comprising of 45 families. On the other hand, families with no children have the lowest poverty rate of 45.2%, which includes 66 families.
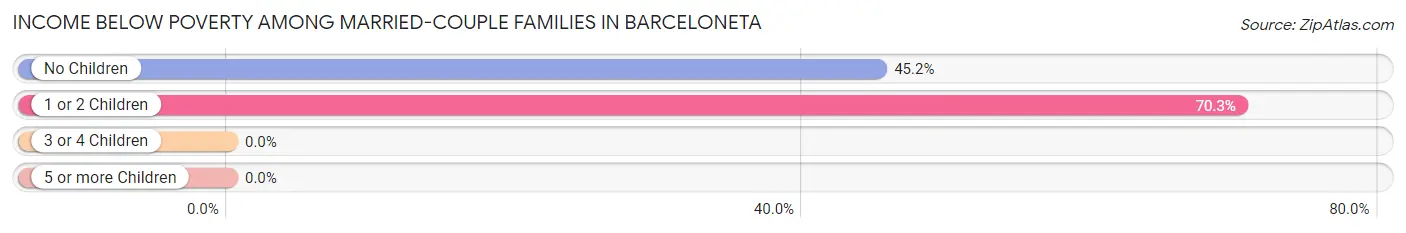
| Children | Above Poverty | Below Poverty |
| No Children | 80 (54.8%) | 66 (45.2%) |
| 1 or 2 Children | 19 (29.7%) | 45 (70.3%) |
| 3 or 4 Children | 0 (0.0%) | 0 (0.0%) |
| 5 or more Children | 0 (0.0%) | 0 (0.0%) |
| Total | 99 (47.1%) | 111 (52.9%) |
Income Below Poverty Among Single-Parent Households in Barceloneta
According to the poverty data in Barceloneta, 77.1% or 91 single-father households and 57.4% or 342 single-mother households are living below the poverty line. Among single-father households, those with 1 or 2 children have the highest poverty rate, with 50 households (100.0%) experiencing poverty. Likewise, among single-mother households, those with 1 or 2 children have the highest poverty rate, with 210 households (83.0%) falling below the poverty line.
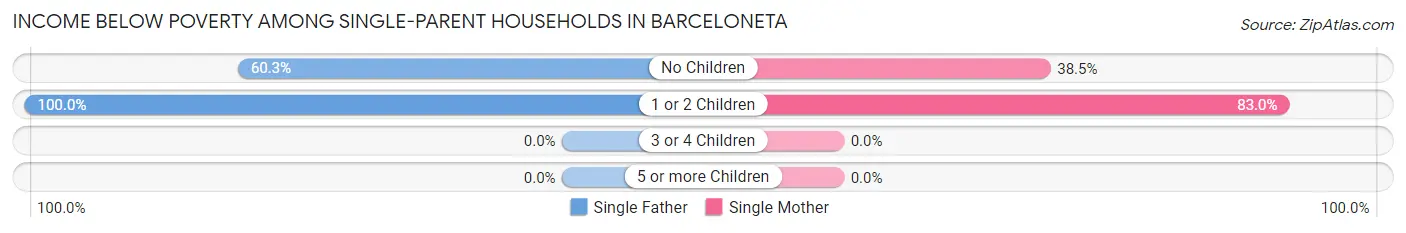
| Children | Single Father | Single Mother |
| No Children | 41 (60.3%) | 132 (38.5%) |
| 1 or 2 Children | 50 (100.0%) | 210 (83.0%) |
| 3 or 4 Children | 0 (0.0%) | 0 (0.0%) |
| 5 or more Children | 0 (0.0%) | 0 (0.0%) |
| Total | 91 (77.1%) | 342 (57.4%) |
Income Below Poverty Among Married-Couple vs Single-Parent Households in Barceloneta
The poverty data for Barceloneta shows that 111 of the married-couple family households (52.9%) and 433 of the single-parent households (60.6%) are living below the poverty level. Within the married-couple family households, those with 1 or 2 children have the highest poverty rate, with 45 households (70.3%) falling below the poverty line. Among the single-parent households, those with 1 or 2 children have the highest poverty rate, with 260 household (85.8%) living below poverty.
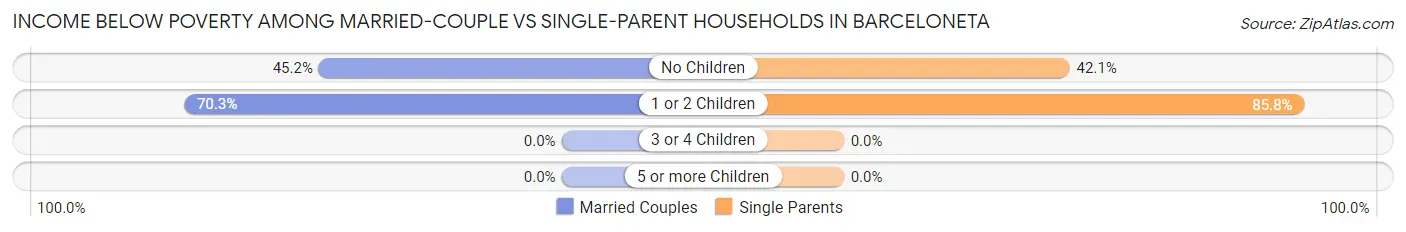
| Children | Married-Couple Families | Single-Parent Households |
| No Children | 66 (45.2%) | 173 (42.1%) |
| 1 or 2 Children | 45 (70.3%) | 260 (85.8%) |
| 3 or 4 Children | 0 (0.0%) | 0 (0.0%) |
| 5 or more Children | 0 (0.0%) | 0 (0.0%) |
| Total | 111 (52.9%) | 433 (60.6%) |
Race in Barceloneta
The most populous races in Barceloneta are Hispanic or Latino (3,485 | 98.2%), Two or more Races (1,431 | 40.3%), and White / Caucasian (1,307 | 36.8%).
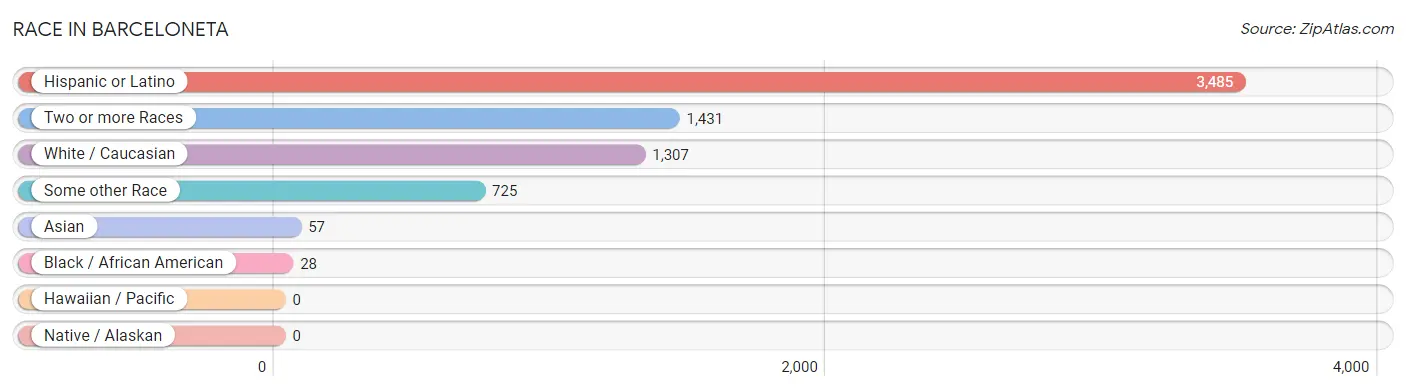
| Race | # Population | % Population |
| Asian | 57 | 1.6% |
| Black / African American | 28 | 0.8% |
| Hawaiian / Pacific | 0 | 0.0% |
| Hispanic or Latino | 3,485 | 98.2% |
| Native / Alaskan | 0 | 0.0% |
| White / Caucasian | 1,307 | 36.8% |
| Two or more Races | 1,431 | 40.3% |
| Some other Race | 725 | 20.4% |
| Total | 3,548 | 100.0% |
Ancestry in Barceloneta
The most populous ancestries reported in Barceloneta are Puerto Rican (3,420 | 96.4%), Peruvian (65 | 1.8%), South American (65 | 1.8%), South American Indian (65 | 1.8%), and American (58 | 1.6%), together accounting for 103.5% of all Barceloneta residents.
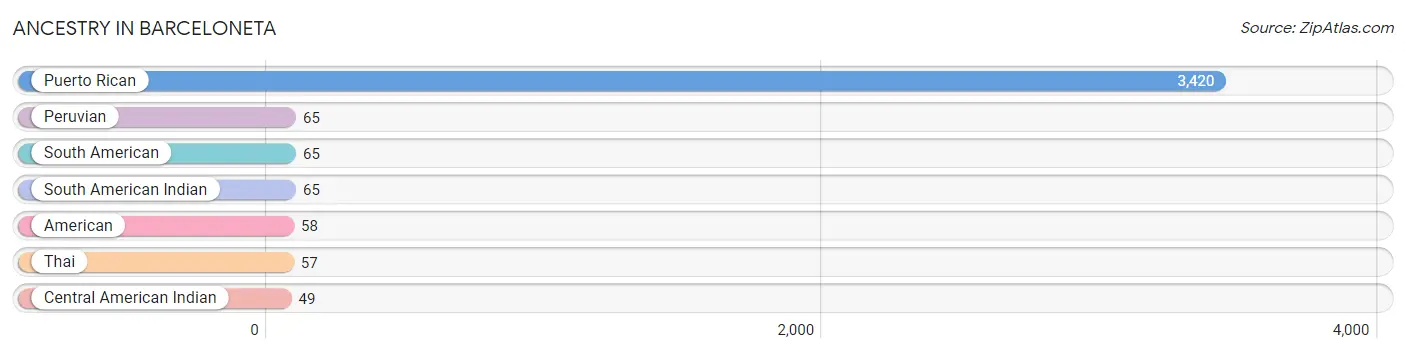
| Ancestry | # Population | % Population |
| American | 58 | 1.6% |
| Central American Indian | 49 | 1.4% |
| Peruvian | 65 | 1.8% |
| Puerto Rican | 3,420 | 96.4% |
| South American | 65 | 1.8% |
| South American Indian | 65 | 1.8% |
| Thai | 57 | 1.6% | View All 7 Rows |
Immigrants in Barceloneta

| Immigration Origin | # Population | % Population | View All 0 Rows |
Sex and Age in Barceloneta
Sex and Age in Barceloneta
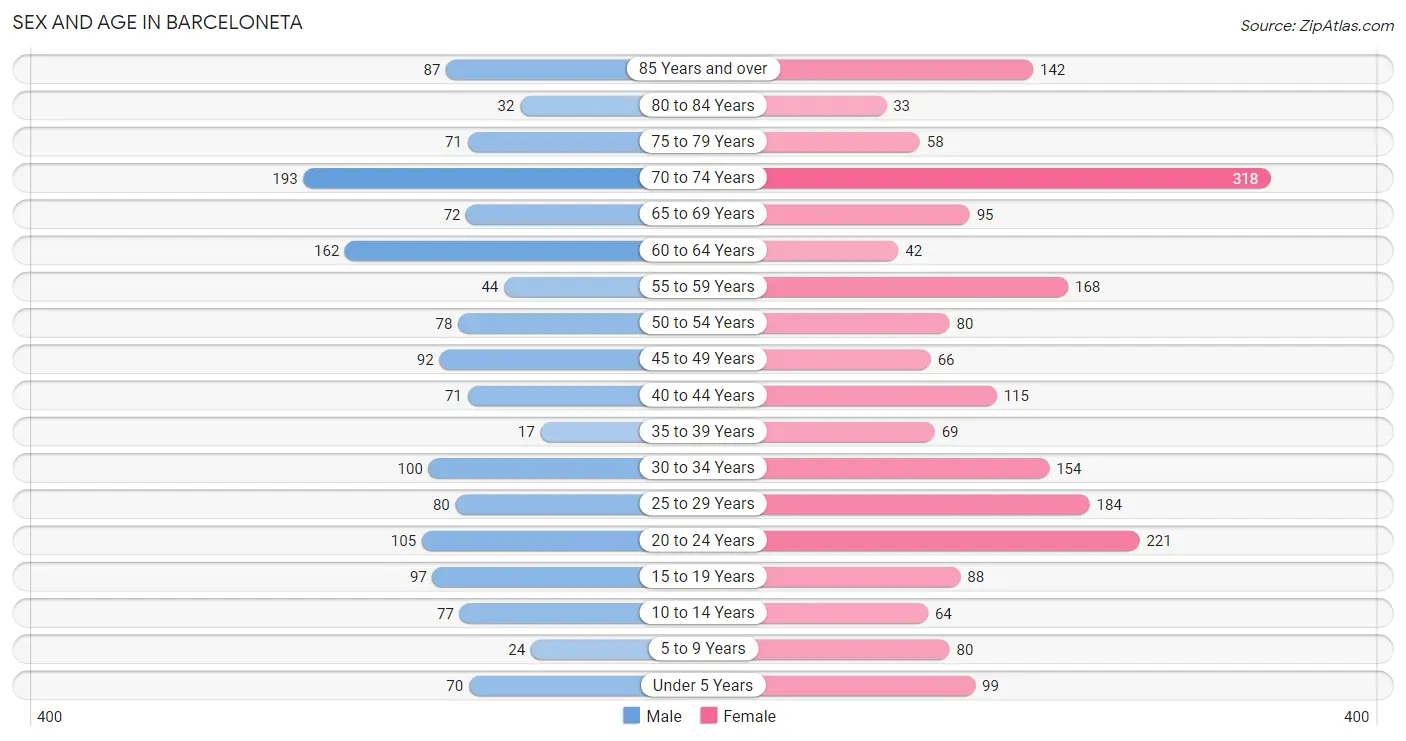
The most populous age groups in Barceloneta are 70 to 74 Years (193 | 13.1%) for men and 70 to 74 Years (318 | 15.3%) for women.
| Age Bracket | Male | Female |
| Under 5 Years | 70 (4.8%) | 99 (4.8%) |
| 5 to 9 Years | 24 (1.6%) | 80 (3.8%) |
| 10 to 14 Years | 77 (5.2%) | 64 (3.1%) |
| 15 to 19 Years | 97 (6.6%) | 88 (4.2%) |
| 20 to 24 Years | 105 (7.1%) | 221 (10.6%) |
| 25 to 29 Years | 80 (5.4%) | 184 (8.9%) |
| 30 to 34 Years | 100 (6.8%) | 154 (7.4%) |
| 35 to 39 Years | 17 (1.1%) | 69 (3.3%) |
| 40 to 44 Years | 71 (4.8%) | 115 (5.5%) |
| 45 to 49 Years | 92 (6.2%) | 66 (3.2%) |
| 50 to 54 Years | 78 (5.3%) | 80 (3.8%) |
| 55 to 59 Years | 44 (3.0%) | 168 (8.1%) |
| 60 to 64 Years | 162 (11.0%) | 42 (2.0%) |
| 65 to 69 Years | 72 (4.9%) | 95 (4.6%) |
| 70 to 74 Years | 193 (13.1%) | 318 (15.3%) |
| 75 to 79 Years | 71 (4.8%) | 58 (2.8%) |
| 80 to 84 Years | 32 (2.2%) | 33 (1.6%) |
| 85 Years and over | 87 (5.9%) | 142 (6.8%) |
| Total | 1,472 (100.0%) | 2,076 (100.0%) |
Families and Households in Barceloneta
Median Family Size in Barceloneta
The median family size in Barceloneta is 3.19 persons per family, with married-couple families (210 | 22.7%) accounting for the largest median family size of 3.64 persons per family. On the other hand, single female/mother families (596 | 64.5%) represent the smallest median family size with 3.05 persons per family.
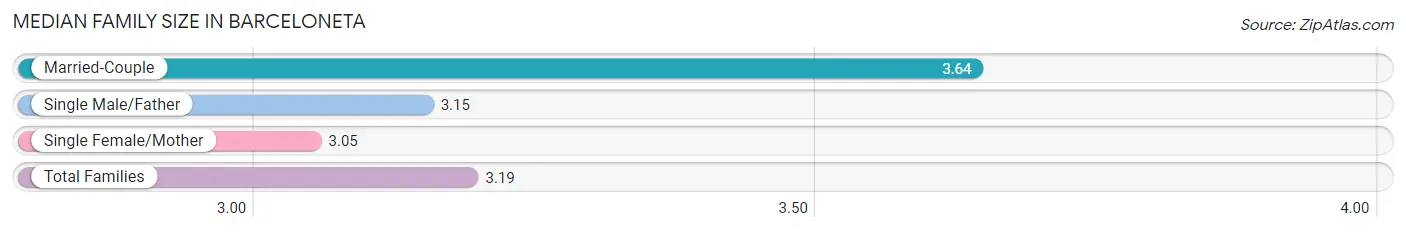
| Family Type | # Families | Family Size |
| Married-Couple | 210 (22.7%) | 3.64 |
| Single Male/Father | 118 (12.8%) | 3.15 |
| Single Female/Mother | 596 (64.5%) | 3.05 |
| Total Families | 924 (100.0%) | 3.19 |
Median Household Size in Barceloneta
The median household size in Barceloneta is 2.62 persons per household, with married-couple households (210 | 15.6%) accounting for the largest median household size of 3.64 persons per household. non-family households (425 | 31.5%) represent the smallest median household size with 1.20 persons per household.
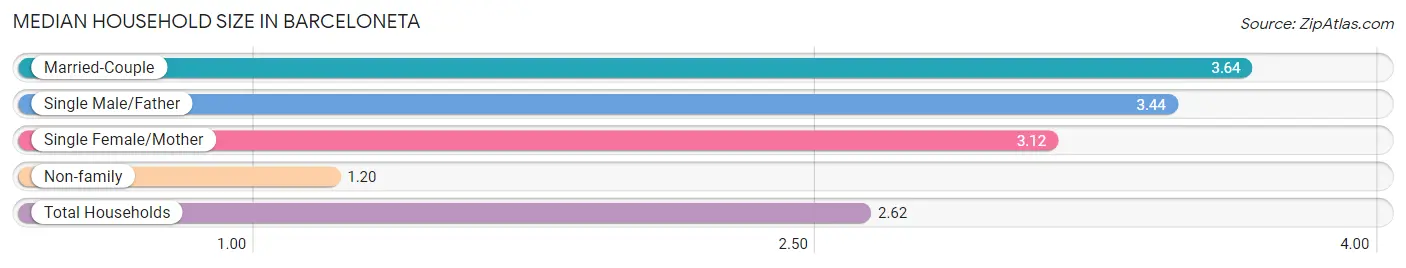
| Household Type | # Households | Household Size |
| Married-Couple | 210 (15.6%) | 3.64 |
| Single Male/Father | 118 (8.7%) | 3.44 |
| Single Female/Mother | 596 (44.2%) | 3.12 |
| Non-family | 425 (31.5%) | 1.20 |
| Total Households | 1,349 (100.0%) | 2.62 |
Household Size by Marriage Status in Barceloneta
Out of a total of 1,349 households in Barceloneta, 924 (68.5%) are family households, while 425 (31.5%) are nonfamily households. The most numerous type of family households are 2-person households, comprising 550, and the most common type of nonfamily households are 1-person households, comprising 357.
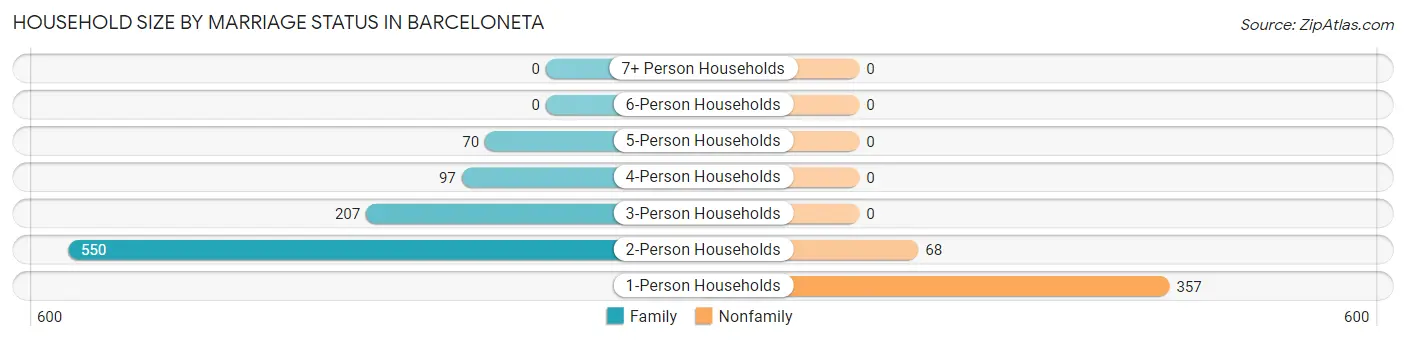
| Household Size | Family Households | Nonfamily Households |
| 1-Person Households | - | 357 (26.5%) |
| 2-Person Households | 550 (40.8%) | 68 (5.0%) |
| 3-Person Households | 207 (15.3%) | 0 (0.0%) |
| 4-Person Households | 97 (7.2%) | 0 (0.0%) |
| 5-Person Households | 70 (5.2%) | 0 (0.0%) |
| 6-Person Households | 0 (0.0%) | 0 (0.0%) |
| 7+ Person Households | 0 (0.0%) | 0 (0.0%) |
| Total | 924 (68.5%) | 425 (31.5%) |
Female Fertility in Barceloneta
Fertility by Age in Barceloneta
Average fertility rate in Barceloneta is 52.0 births per 1,000 women. Women in the age bracket of 15 to 19 years have the highest fertility rate with 352.0 births per 1,000 women. Women in the age bracket of 15 to 19 years acount for 64.6% of all women with births.
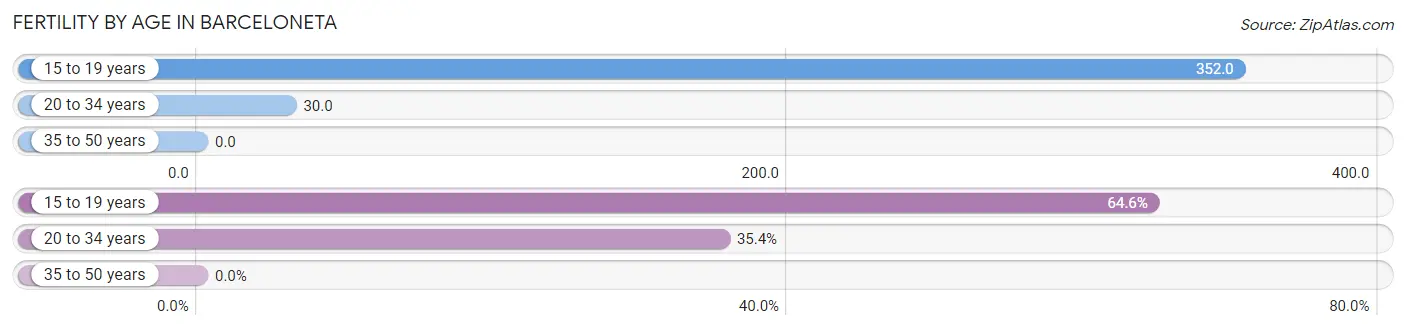
| Age Bracket | Women with Births | Births / 1,000 Women |
| 15 to 19 years | 31 (64.6%) | 352.0 |
| 20 to 34 years | 17 (35.4%) | 30.0 |
| 35 to 50 years | 0 (0.0%) | 0.0 |
| Total | 48 (100.0%) | 52.0 |
Fertility by Age by Marriage Status in Barceloneta
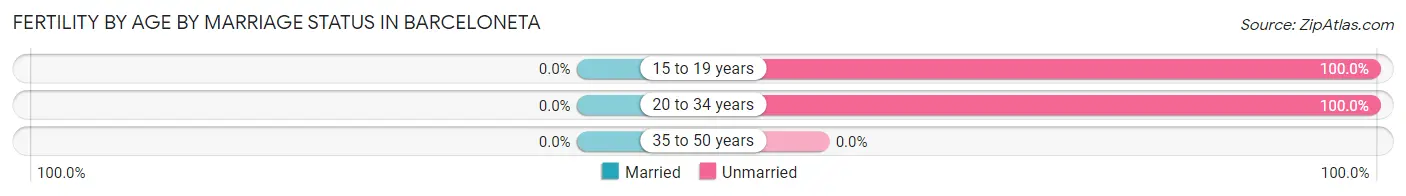
| Age Bracket | Married | Unmarried |
| 15 to 19 years | 0 (0.0%) | 31 (100.0%) |
| 20 to 34 years | 0 (0.0%) | 17 (100.0%) |
| 35 to 50 years | 0 (0.0%) | 0 (0.0%) |
| Total | 0 (0.0%) | 48 (100.0%) |
Fertility by Education in Barceloneta
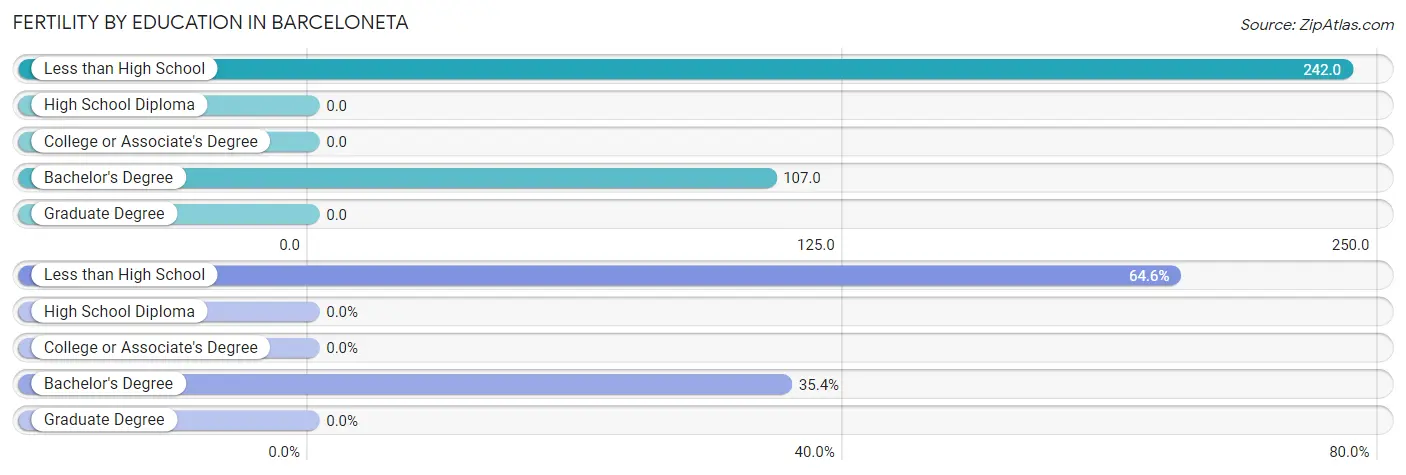
| Educational Attainment | Women with Births | Births / 1,000 Women |
| Less than High School | 31 (64.6%) | 242.0 |
| High School Diploma | 0 (0.0%) | 0.0 |
| College or Associate's Degree | 0 (0.0%) | 0.0 |
| Bachelor's Degree | 17 (35.4%) | 107.0 |
| Graduate Degree | 0 (0.0%) | 0.0 |
| Total | 48 (100.0%) | 52.0 |
Fertility by Education by Marriage Status in Barceloneta
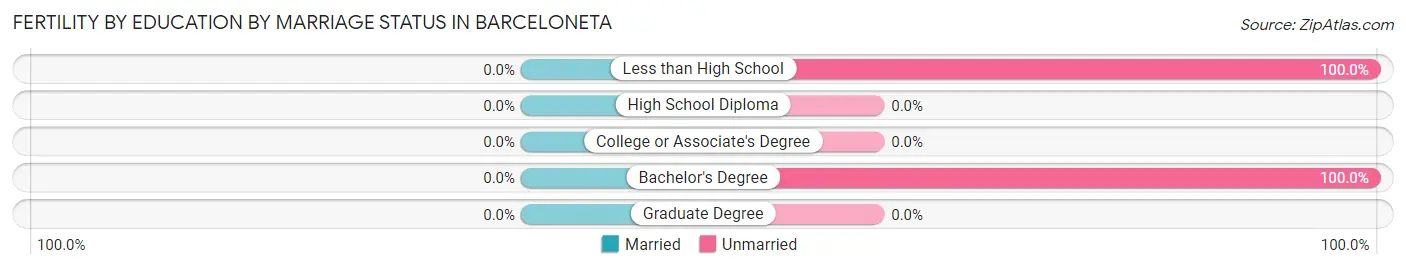
| Educational Attainment | Married | Unmarried |
| Less than High School | 0 (0.0%) | 31 (100.0%) |
| High School Diploma | 0 (0.0%) | 0 (0.0%) |
| College or Associate's Degree | 0 (0.0%) | 0 (0.0%) |
| Bachelor's Degree | 0 (0.0%) | 17 (100.0%) |
| Graduate Degree | 0 (0.0%) | 0 (0.0%) |
| Total | 0 (0.0%) | 48 (100.0%) |
Employment Characteristics in Barceloneta
Employment by Class of Employer in Barceloneta
Among the 670 employed individuals in Barceloneta, private company employees (361 | 53.9%), local government employees (134 | 20.0%), and self-employed (not incorporated) (57 | 8.5%) make up the most common classes of employment.
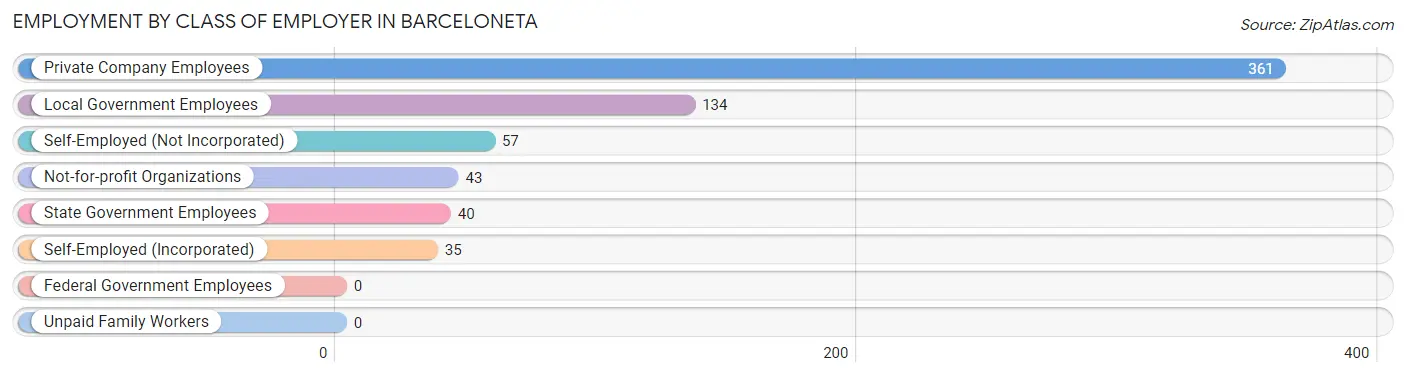
| Employer Class | # Employees | % Employees |
| Private Company Employees | 361 | 53.9% |
| Self-Employed (Incorporated) | 35 | 5.2% |
| Self-Employed (Not Incorporated) | 57 | 8.5% |
| Not-for-profit Organizations | 43 | 6.4% |
| Local Government Employees | 134 | 20.0% |
| State Government Employees | 40 | 6.0% |
| Federal Government Employees | 0 | 0.0% |
| Unpaid Family Workers | 0 | 0.0% |
| Total | 670 | 100.0% |
Employment Status by Age in Barceloneta
According to the labor force statistics for Barceloneta, out of the total population over 16 years of age (3,084), 32.7% or 1,008 individuals are in the labor force, with 28.9% or 291 of them unemployed. The age group with the highest labor force participation rate is 35 to 44 years, with 75.4% or 205 individuals in the labor force. Within the labor force, the 16 to 19 years age range has the highest percentage of unemployed individuals, with 100.0% or 47 of them being unemployed.
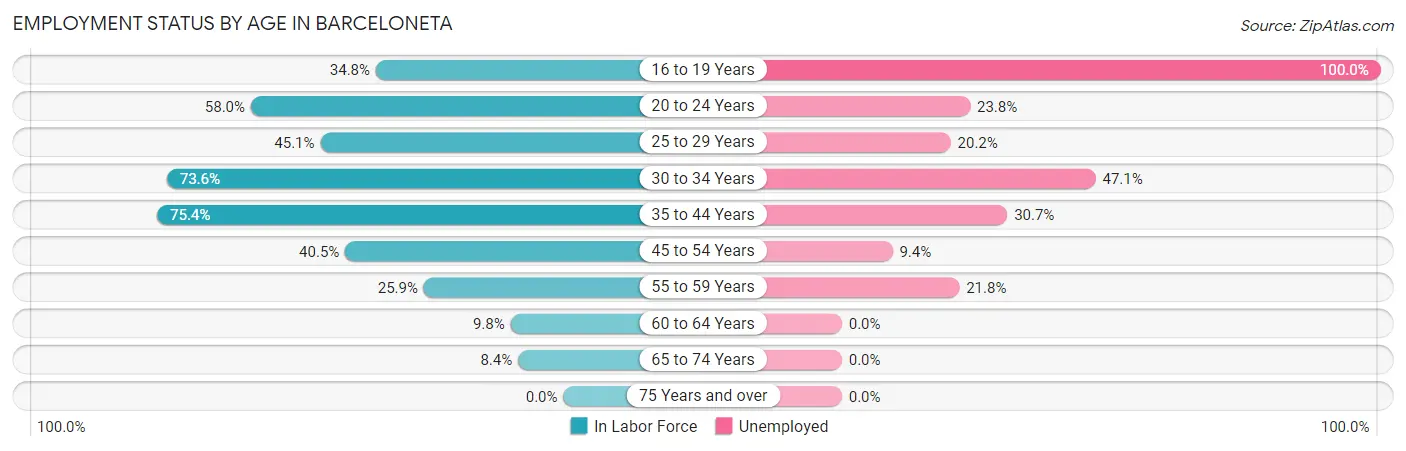
| Age Bracket | In Labor Force | Unemployed |
| 16 to 19 Years | 47 (34.8%) | 47 (100.0%) |
| 20 to 24 Years | 189 (58.0%) | 45 (23.8%) |
| 25 to 29 Years | 119 (45.1%) | 24 (20.2%) |
| 30 to 34 Years | 187 (73.6%) | 88 (47.1%) |
| 35 to 44 Years | 205 (75.4%) | 63 (30.7%) |
| 45 to 54 Years | 128 (40.5%) | 12 (9.4%) |
| 55 to 59 Years | 55 (25.9%) | 12 (21.8%) |
| 60 to 64 Years | 20 (9.8%) | 0 (0.0%) |
| 65 to 74 Years | 57 (8.4%) | 0 (0.0%) |
| 75 Years and over | 0 (0.0%) | 0 (0.0%) |
| Total | 1,008 (32.7%) | 291 (28.9%) |
Employment Status by Educational Attainment in Barceloneta
According to labor force statistics for Barceloneta, 46.9% of individuals (714) out of the total population between 25 and 64 years of age (1,522) are in the labor force, with 27.9% or 199 of them being unemployed. The group with the highest labor force participation rate are those with the educational attainment of college / associate degree, with 78.5% or 215 individuals in the labor force. Within the labor force, individuals with college / associate degree education have the highest percentage of unemployment, with 37.2% or 80 of them being unemployed.
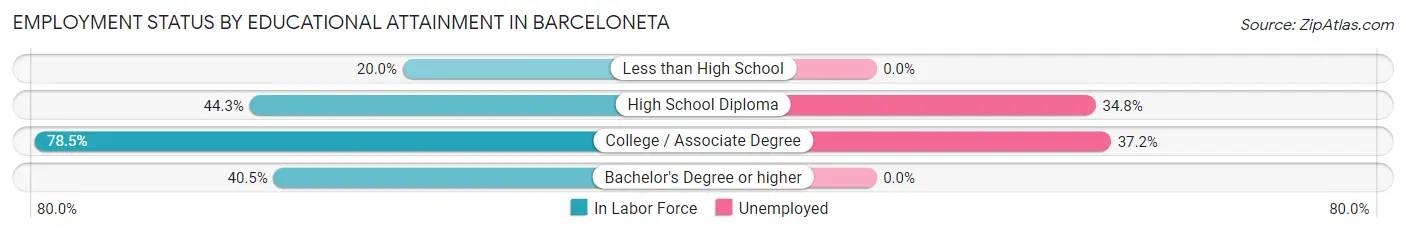
| Educational Attainment | In Labor Force | Unemployed |
| Less than High School | 35 (20.0%) | 0 (0.0%) |
| High School Diploma | 342 (44.3%) | 269 (34.8%) |
| College / Associate Degree | 215 (78.5%) | 102 (37.2%) |
| Bachelor's Degree or higher | 122 (40.5%) | 0 (0.0%) |
| Total | 714 (46.9%) | 425 (27.9%) |
Employment Occupations by Sex in Barceloneta
Management, Business, Science and Arts Occupations
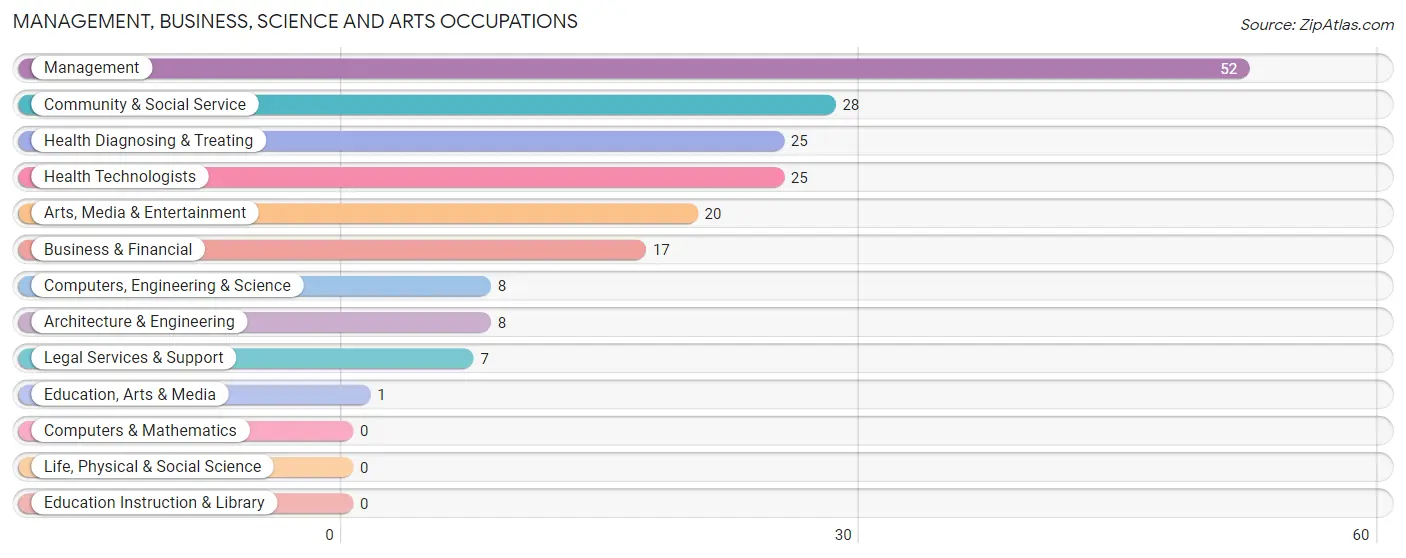
The most common Management, Business, Science and Arts occupations in Barceloneta are Management (52 | 7.3%), Community & Social Service (28 | 3.9%), Health Diagnosing & Treating (25 | 3.5%), Health Technologists (25 | 3.5%), and Arts, Media & Entertainment (20 | 2.8%).
Management, Business, Science and Arts Occupations by Sex
Within the Management, Business, Science and Arts occupations in Barceloneta, the most male-oriented occupations are Computers, Engineering & Science (100.0%), Architecture & Engineering (100.0%), and Education, Arts & Media (100.0%), while the most female-oriented occupations are Business & Financial (100.0%), Arts, Media & Entertainment (100.0%), and Health Diagnosing & Treating (100.0%).
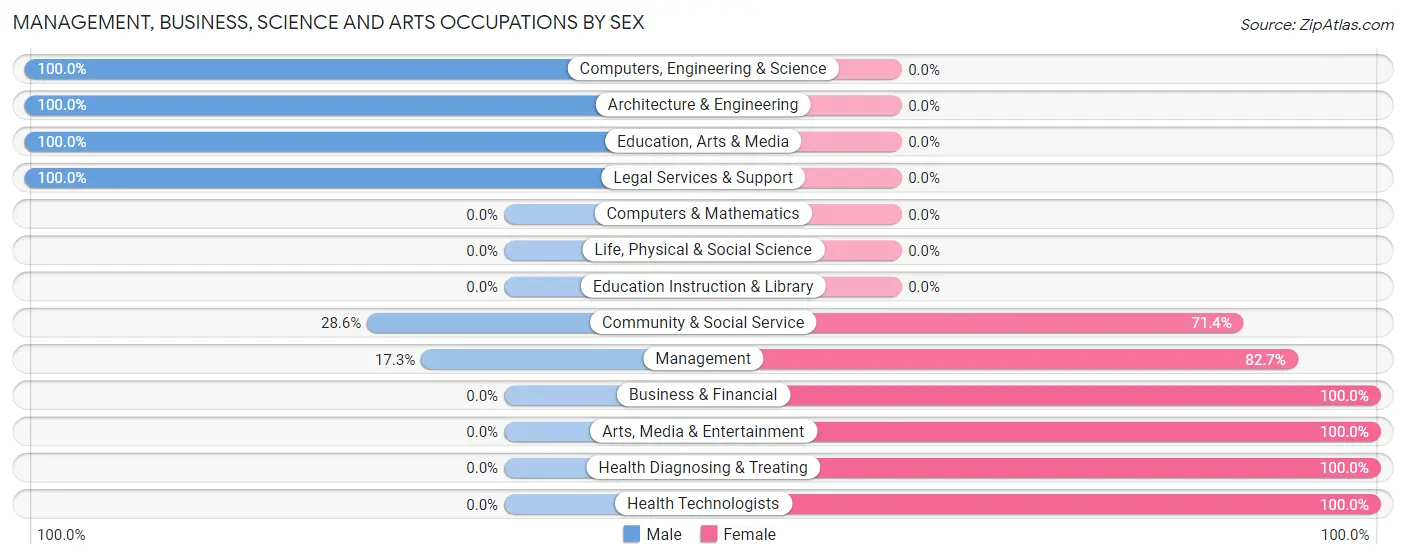
| Occupation | Male | Female |
| Management | 9 (17.3%) | 43 (82.7%) |
| Business & Financial | 0 (0.0%) | 17 (100.0%) |
| Computers, Engineering & Science | 8 (100.0%) | 0 (0.0%) |
| Computers & Mathematics | 0 (0.0%) | 0 (0.0%) |
| Architecture & Engineering | 8 (100.0%) | 0 (0.0%) |
| Life, Physical & Social Science | 0 (0.0%) | 0 (0.0%) |
| Community & Social Service | 8 (28.6%) | 20 (71.4%) |
| Education, Arts & Media | 1 (100.0%) | 0 (0.0%) |
| Legal Services & Support | 7 (100.0%) | 0 (0.0%) |
| Education Instruction & Library | 0 (0.0%) | 0 (0.0%) |
| Arts, Media & Entertainment | 0 (0.0%) | 20 (100.0%) |
| Health Diagnosing & Treating | 0 (0.0%) | 25 (100.0%) |
| Health Technologists | 0 (0.0%) | 25 (100.0%) |
| Total (Category) | 25 (19.2%) | 105 (80.8%) |
| Total (Overall) | 360 (50.3%) | 356 (49.7%) |
Services Occupations
The most common Services occupations in Barceloneta are Food Preparation & Serving (58 | 8.1%), Healthcare Support (22 | 3.1%), and Cleaning & Maintenance (16 | 2.2%).
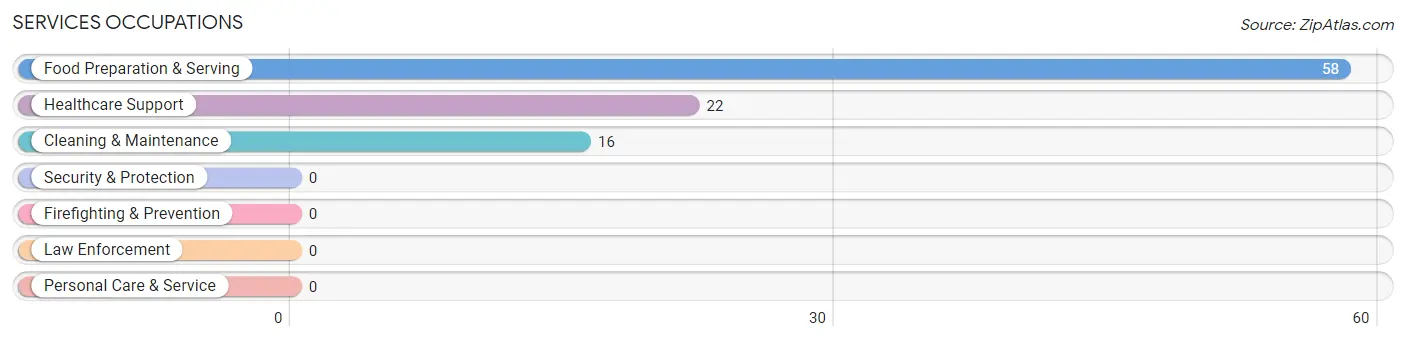
Services Occupations by Sex
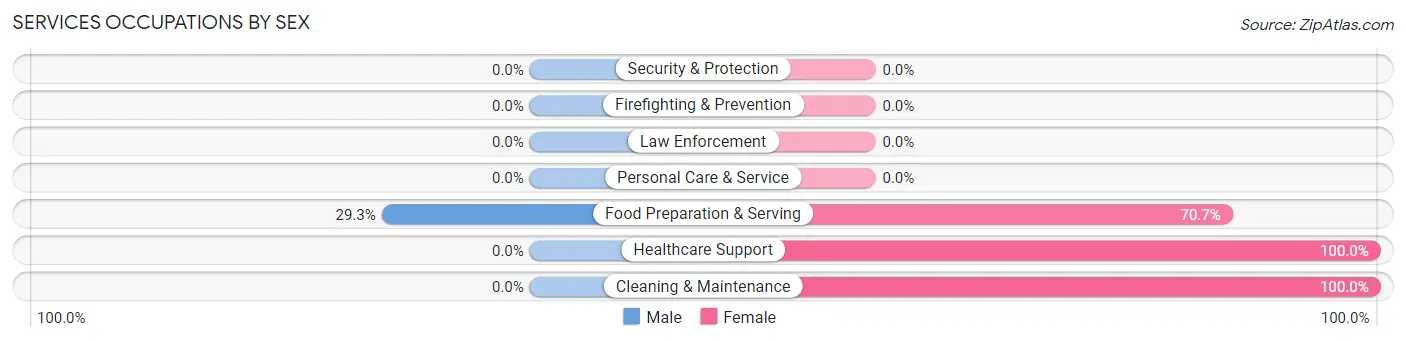
| Occupation | Male | Female |
| Healthcare Support | 0 (0.0%) | 22 (100.0%) |
| Security & Protection | 0 (0.0%) | 0 (0.0%) |
| Firefighting & Prevention | 0 (0.0%) | 0 (0.0%) |
| Law Enforcement | 0 (0.0%) | 0 (0.0%) |
| Food Preparation & Serving | 17 (29.3%) | 41 (70.7%) |
| Cleaning & Maintenance | 0 (0.0%) | 16 (100.0%) |
| Personal Care & Service | 0 (0.0%) | 0 (0.0%) |
| Total (Category) | 17 (17.7%) | 79 (82.3%) |
| Total (Overall) | 360 (50.3%) | 356 (49.7%) |
Sales and Office Occupations
The most common Sales and Office occupations in Barceloneta are Sales & Related (121 | 16.9%), and Office & Administration (22 | 3.1%).
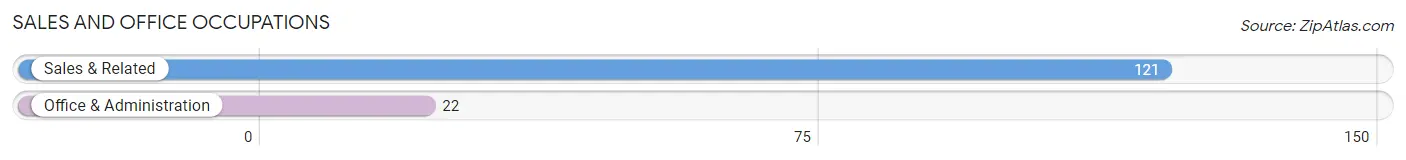
Sales and Office Occupations by Sex
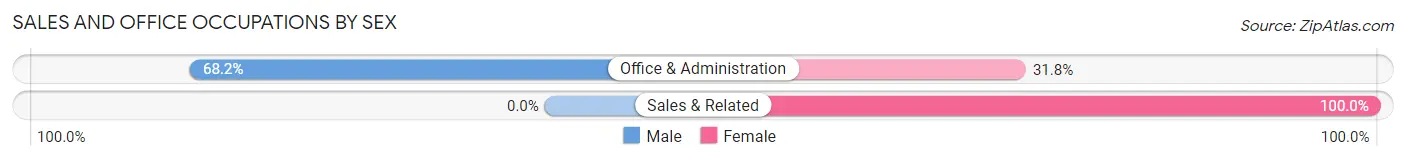
| Occupation | Male | Female |
| Sales & Related | 0 (0.0%) | 121 (100.0%) |
| Office & Administration | 15 (68.2%) | 7 (31.8%) |
| Total (Category) | 15 (10.5%) | 128 (89.5%) |
| Total (Overall) | 360 (50.3%) | 356 (49.7%) |
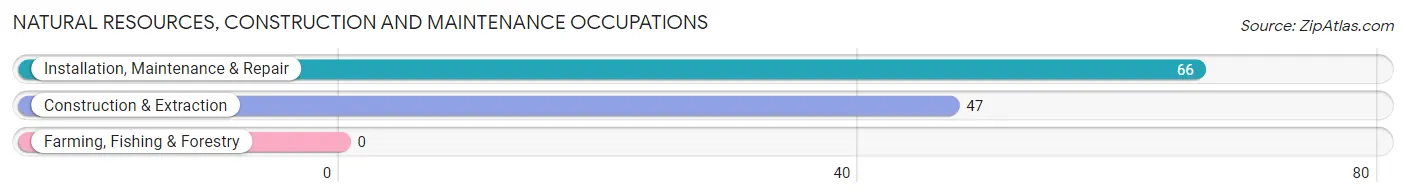
Natural Resources, Construction and Maintenance Occupations
The most common Natural Resources, Construction and Maintenance occupations in Barceloneta are Installation, Maintenance & Repair (66 | 9.2%), and Construction & Extraction (47 | 6.6%).
Natural Resources, Construction and Maintenance Occupations by Sex
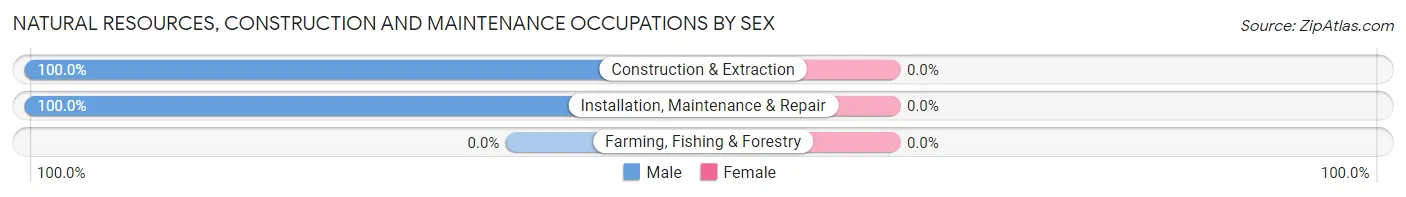
| Occupation | Male | Female |
| Farming, Fishing & Forestry | 0 (0.0%) | 0 (0.0%) |
| Construction & Extraction | 47 (100.0%) | 0 (0.0%) |
| Installation, Maintenance & Repair | 66 (100.0%) | 0 (0.0%) |
| Total (Category) | 113 (100.0%) | 0 (0.0%) |
| Total (Overall) | 360 (50.3%) | 356 (49.7%) |
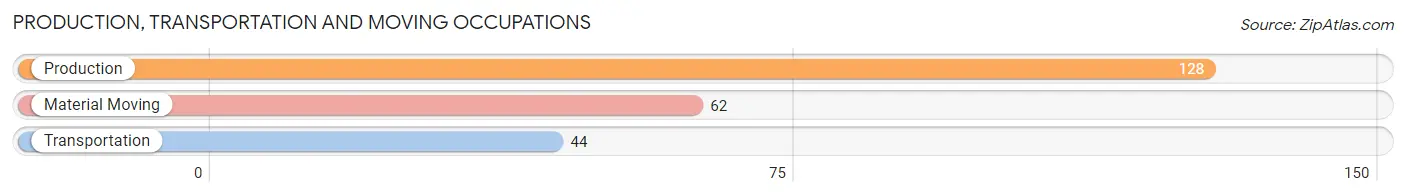
Production, Transportation and Moving Occupations
The most common Production, Transportation and Moving occupations in Barceloneta are Production (128 | 17.9%), Material Moving (62 | 8.7%), and Transportation (44 | 6.1%).
Production, Transportation and Moving Occupations by Sex
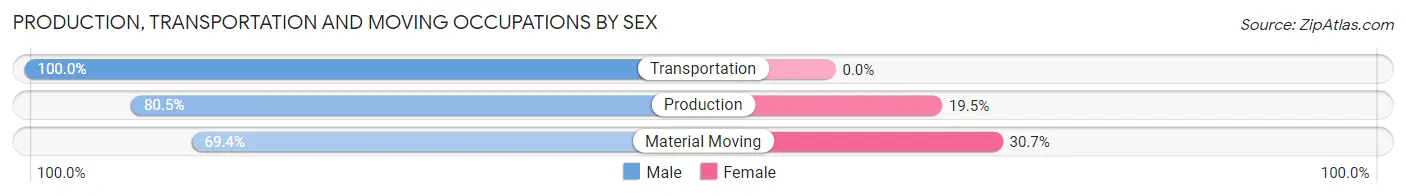
| Occupation | Male | Female |
| Production | 103 (80.5%) | 25 (19.5%) |
| Transportation | 44 (100.0%) | 0 (0.0%) |
| Material Moving | 43 (69.4%) | 19 (30.6%) |
| Total (Category) | 190 (81.2%) | 44 (18.8%) |
| Total (Overall) | 360 (50.3%) | 356 (49.7%) |
Employment Industries by Sex in Barceloneta
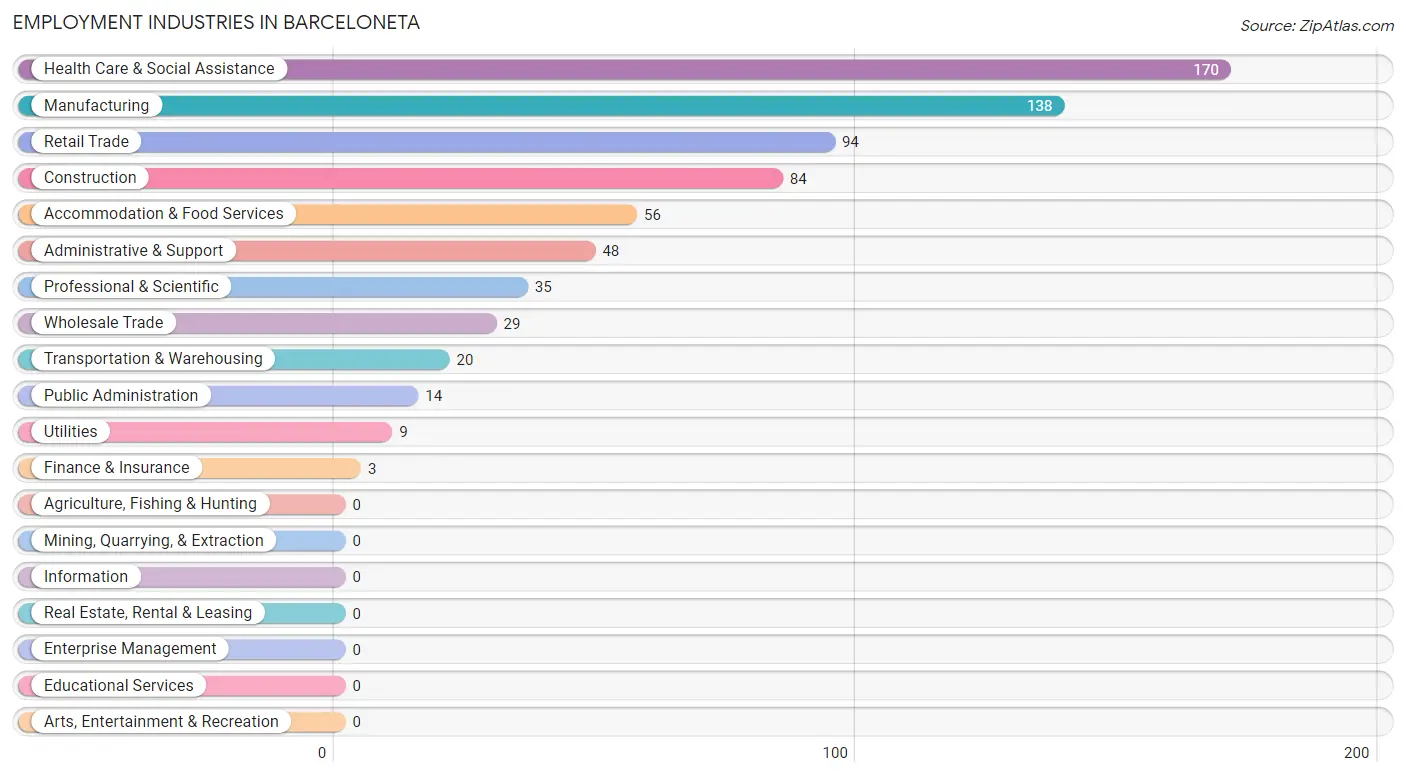
Employment Industries in Barceloneta
The major employment industries in Barceloneta include Health Care & Social Assistance (170 | 23.7%), Manufacturing (138 | 19.3%), Retail Trade (94 | 13.1%), Construction (84 | 11.7%), and Accommodation & Food Services (56 | 7.8%).
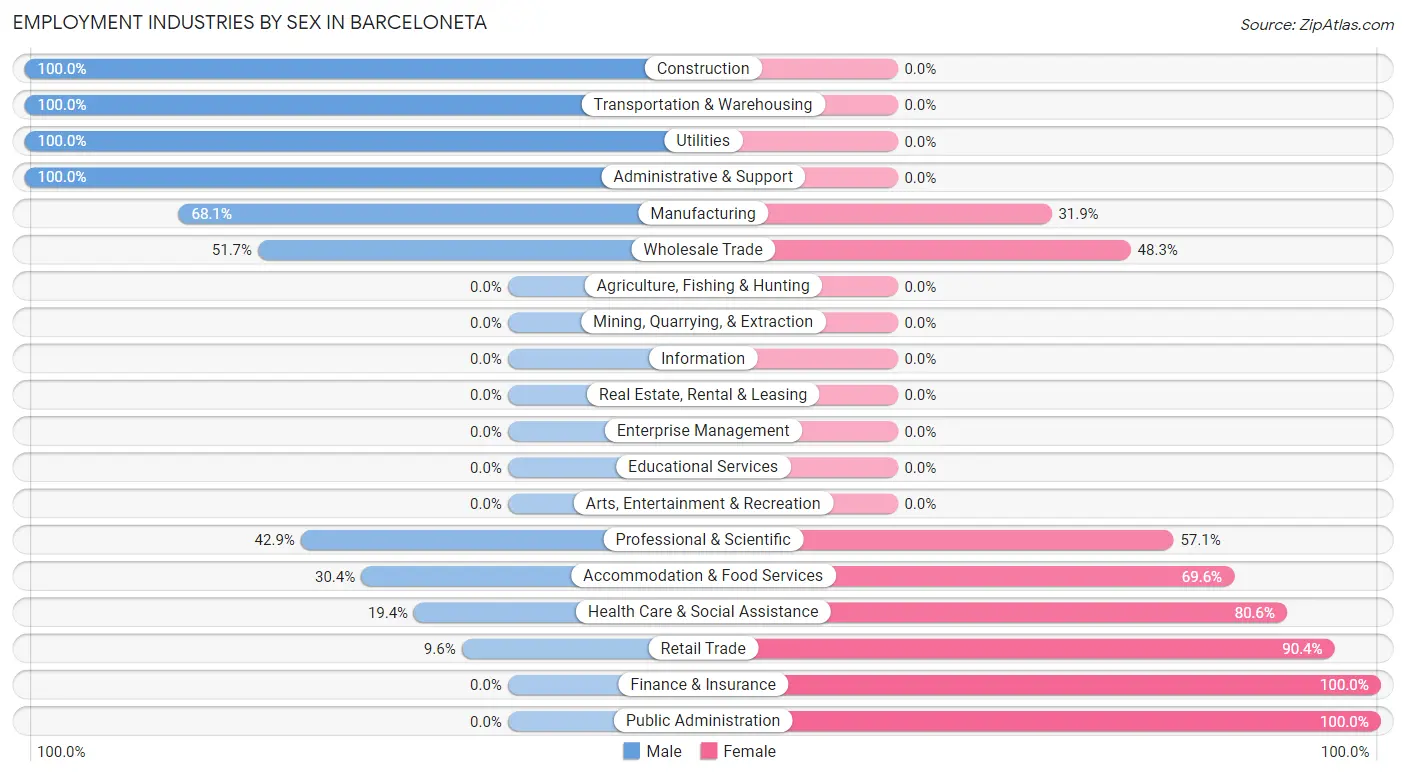
Employment Industries by Sex in Barceloneta
The Barceloneta industries that see more men than women are Construction (100.0%), Transportation & Warehousing (100.0%), and Utilities (100.0%), whereas the industries that tend to have a higher number of women are Finance & Insurance (100.0%), Public Administration (100.0%), and Retail Trade (90.4%).
| Industry | Male | Female |
| Agriculture, Fishing & Hunting | 0 (0.0%) | 0 (0.0%) |
| Mining, Quarrying, & Extraction | 0 (0.0%) | 0 (0.0%) |
| Construction | 84 (100.0%) | 0 (0.0%) |
| Manufacturing | 94 (68.1%) | 44 (31.9%) |
| Wholesale Trade | 15 (51.7%) | 14 (48.3%) |
| Retail Trade | 9 (9.6%) | 85 (90.4%) |
| Transportation & Warehousing | 20 (100.0%) | 0 (0.0%) |
| Utilities | 9 (100.0%) | 0 (0.0%) |
| Information | 0 (0.0%) | 0 (0.0%) |
| Finance & Insurance | 0 (0.0%) | 3 (100.0%) |
| Real Estate, Rental & Leasing | 0 (0.0%) | 0 (0.0%) |
| Professional & Scientific | 15 (42.9%) | 20 (57.1%) |
| Enterprise Management | 0 (0.0%) | 0 (0.0%) |
| Administrative & Support | 48 (100.0%) | 0 (0.0%) |
| Educational Services | 0 (0.0%) | 0 (0.0%) |
| Health Care & Social Assistance | 33 (19.4%) | 137 (80.6%) |
| Arts, Entertainment & Recreation | 0 (0.0%) | 0 (0.0%) |
| Accommodation & Food Services | 17 (30.4%) | 39 (69.6%) |
| Public Administration | 0 (0.0%) | 14 (100.0%) |
| Total | 360 (50.3%) | 356 (49.7%) |
Education in Barceloneta
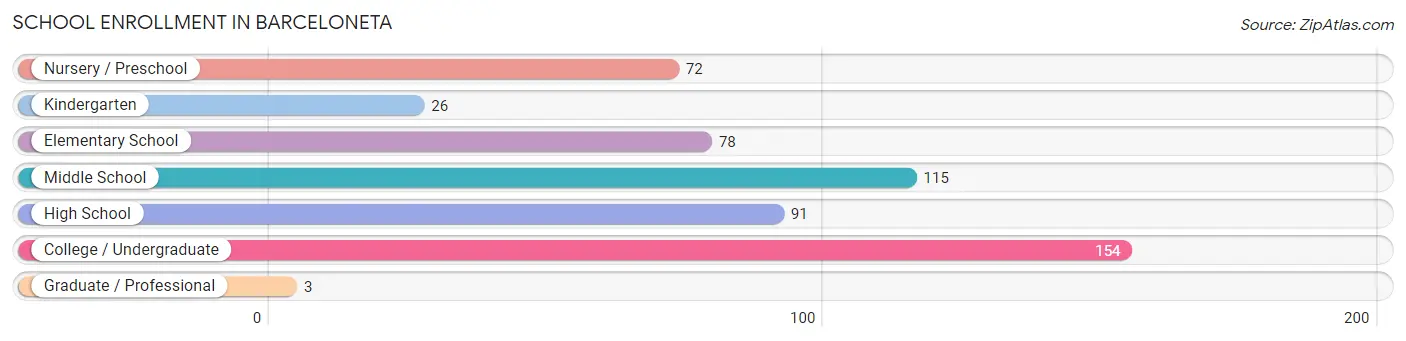
School Enrollment in Barceloneta
The most common levels of schooling among the 539 students in Barceloneta are college / undergraduate (154 | 28.6%), middle school (115 | 21.3%), and high school (91 | 16.9%).
| School Level | # Students | % Students |
| Nursery / Preschool | 72 | 13.4% |
| Kindergarten | 26 | 4.8% |
| Elementary School | 78 | 14.5% |
| Middle School | 115 | 21.3% |
| High School | 91 | 16.9% |
| College / Undergraduate | 154 | 28.6% |
| Graduate / Professional | 3 | 0.6% |
| Total | 539 | 100.0% |
School Enrollment by Age by Funding Source in Barceloneta
Out of a total of 539 students who are enrolled in schools in Barceloneta, 141 (26.2%) attend a private institution, while the remaining 398 (73.8%) are enrolled in public schools. The age group of 25 to 34 year olds has the highest likelihood of being enrolled in private schools, with 32 (100.0% in the age bracket) enrolled. Conversely, the age group of 3 to 4 year olds has the lowest likelihood of being enrolled in a private school, with 72 (100.0% in the age bracket) attending a public institution.
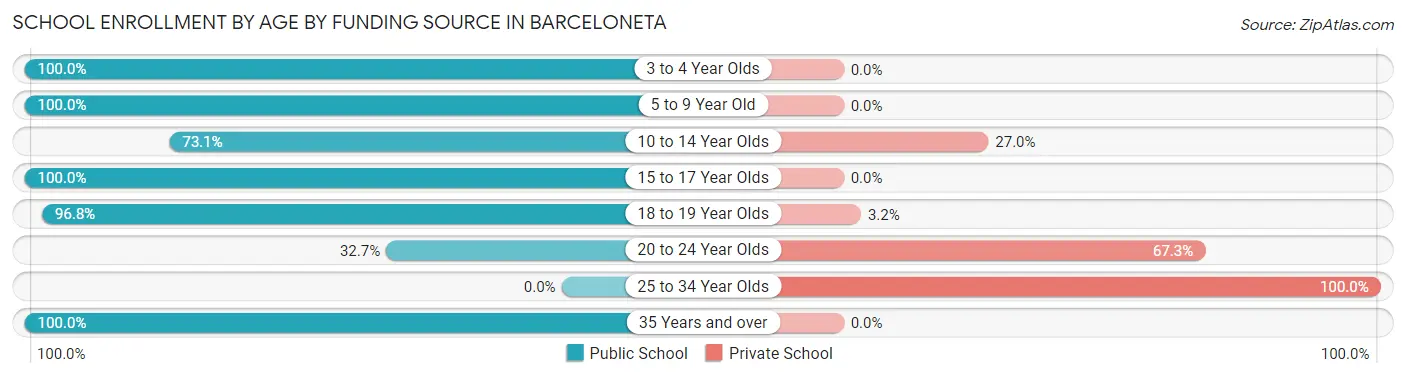
| Age Bracket | Public School | Private School |
| 3 to 4 Year Olds | 72 (100.0%) | 0 (0.0%) |
| 5 to 9 Year Old | 104 (100.0%) | 0 (0.0%) |
| 10 to 14 Year Olds | 103 (73.1%) | 38 (27.0%) |
| 15 to 17 Year Olds | 52 (100.0%) | 0 (0.0%) |
| 18 to 19 Year Olds | 30 (96.8%) | 1 (3.2%) |
| 20 to 24 Year Olds | 34 (32.7%) | 70 (67.3%) |
| 25 to 34 Year Olds | 0 (0.0%) | 32 (100.0%) |
| 35 Years and over | 3 (100.0%) | 0 (0.0%) |
| Total | 398 (73.8%) | 141 (26.2%) |
Educational Attainment by Field of Study in Barceloneta
Business (162 | 28.9%), arts & humanities (129 | 23.0%), education (64 | 11.4%), science & technology (54 | 9.6%), and psychology (49 | 8.7%) are the most common fields of study among 561 individuals in Barceloneta who have obtained a bachelor's degree or higher.
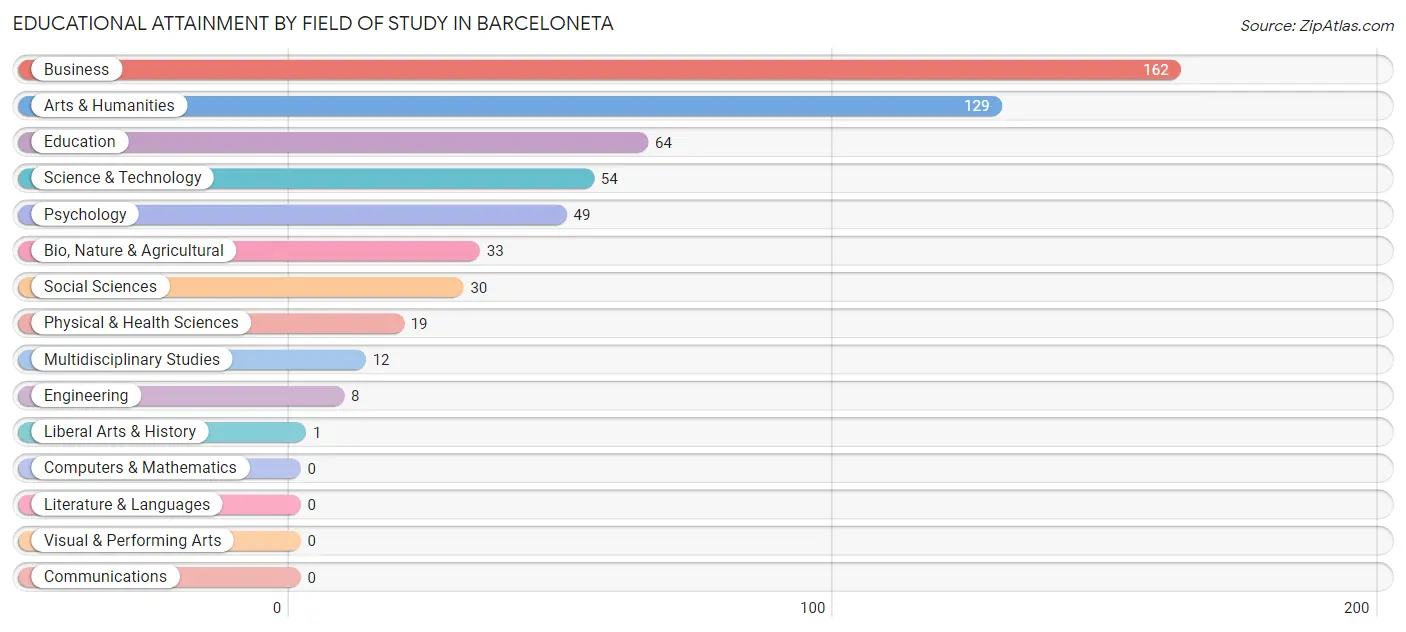
| Field of Study | # Graduates | % Graduates |
| Computers & Mathematics | 0 | 0.0% |
| Bio, Nature & Agricultural | 33 | 5.9% |
| Physical & Health Sciences | 19 | 3.4% |
| Psychology | 49 | 8.7% |
| Social Sciences | 30 | 5.3% |
| Engineering | 8 | 1.4% |
| Multidisciplinary Studies | 12 | 2.1% |
| Science & Technology | 54 | 9.6% |
| Business | 162 | 28.9% |
| Education | 64 | 11.4% |
| Literature & Languages | 0 | 0.0% |
| Liberal Arts & History | 1 | 0.2% |
| Visual & Performing Arts | 0 | 0.0% |
| Communications | 0 | 0.0% |
| Arts & Humanities | 129 | 23.0% |
| Total | 561 | 100.0% |
Transportation & Commute in Barceloneta
Vehicle Availability by Sex in Barceloneta
The most prevalent vehicle ownership categories in Barceloneta are males with 2 vehicles (197, accounting for 55.0%) and females with 2 vehicles (132, making up 64.2%).
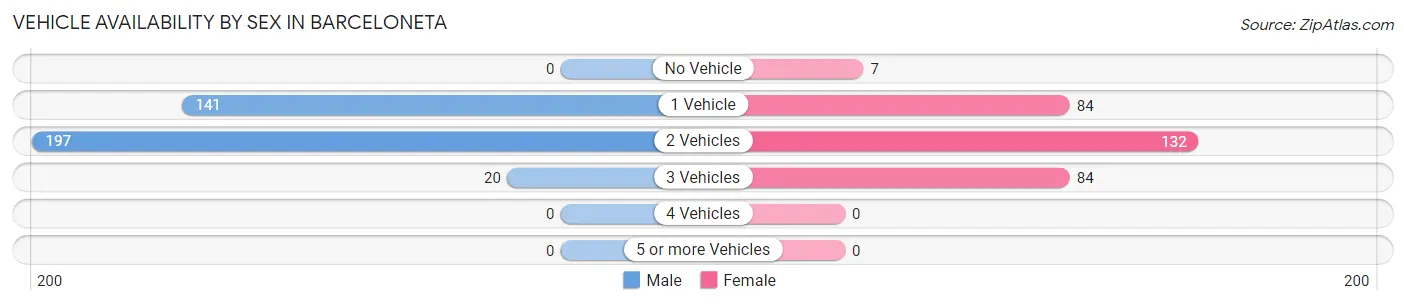
| Vehicles Available | Male | Female |
| No Vehicle | 0 (0.0%) | 7 (2.3%) |
| 1 Vehicle | 141 (39.4%) | 84 (27.4%) |
| 2 Vehicles | 197 (55.0%) | 132 (43.0%) |
| 3 Vehicles | 20 (5.6%) | 84 (27.4%) |
| 4 Vehicles | 0 (0.0%) | 0 (0.0%) |
| 5 or more Vehicles | 0 (0.0%) | 0 (0.0%) |
| Total | 358 (100.0%) | 307 (100.0%) |
Commute Time in Barceloneta
The most frequently occuring commute durations in Barceloneta are 15 to 19 minutes (132 commuters, 20.2%), 10 to 14 minutes (111 commuters, 17.0%), and 20 to 24 minutes (103 commuters, 15.7%).
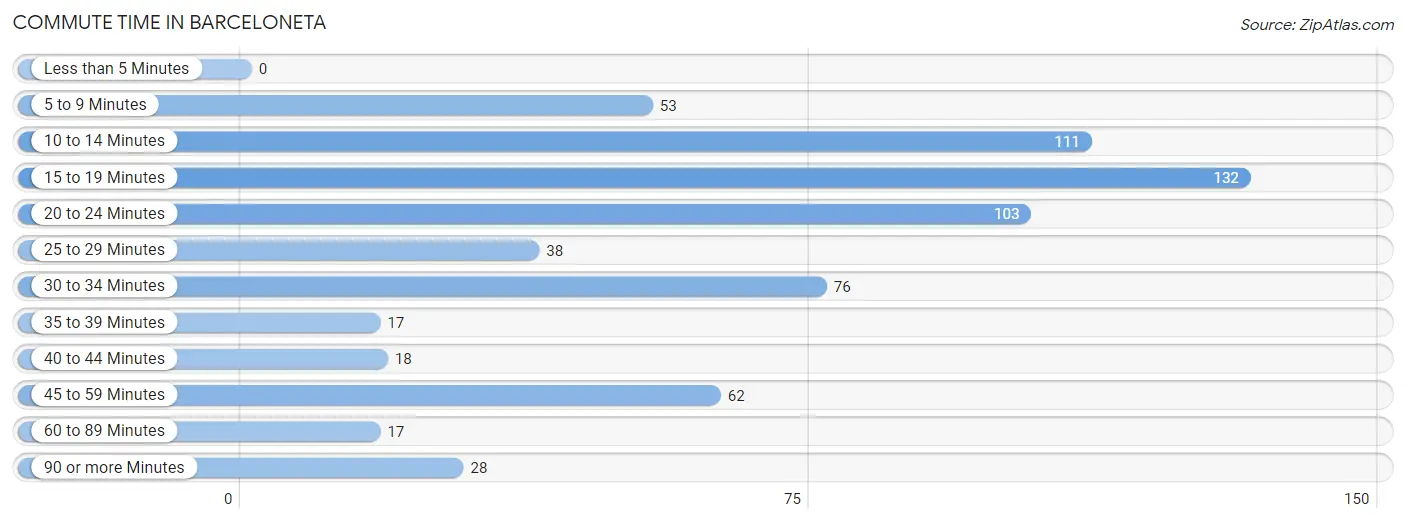
| Commute Time | # Commuters | % Commuters |
| Less than 5 Minutes | 0 | 0.0% |
| 5 to 9 Minutes | 53 | 8.1% |
| 10 to 14 Minutes | 111 | 17.0% |
| 15 to 19 Minutes | 132 | 20.2% |
| 20 to 24 Minutes | 103 | 15.7% |
| 25 to 29 Minutes | 38 | 5.8% |
| 30 to 34 Minutes | 76 | 11.6% |
| 35 to 39 Minutes | 17 | 2.6% |
| 40 to 44 Minutes | 18 | 2.8% |
| 45 to 59 Minutes | 62 | 9.5% |
| 60 to 89 Minutes | 17 | 2.6% |
| 90 or more Minutes | 28 | 4.3% |
Commute Time by Sex in Barceloneta
The most common commute times in Barceloneta are 45 to 59 minutes (62 commuters, 17.3%) for males and 15 to 19 minutes (99 commuters, 33.5%) for females.
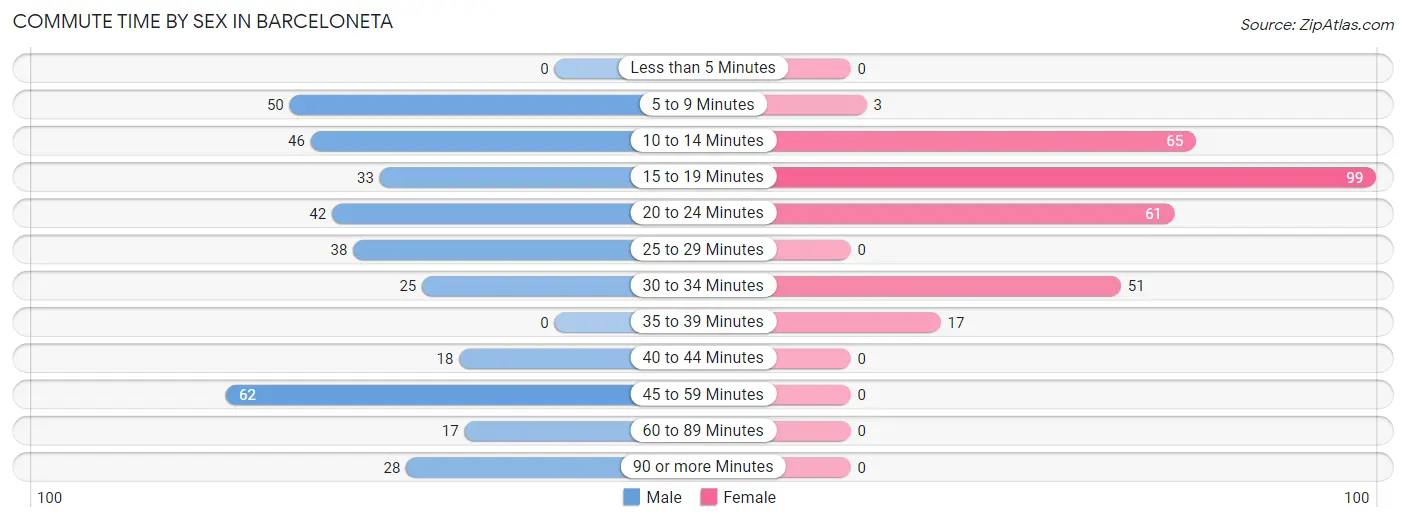
| Commute Time | Male | Female |
| Less than 5 Minutes | 0 (0.0%) | 0 (0.0%) |
| 5 to 9 Minutes | 50 (13.9%) | 3 (1.0%) |
| 10 to 14 Minutes | 46 (12.8%) | 65 (22.0%) |
| 15 to 19 Minutes | 33 (9.2%) | 99 (33.5%) |
| 20 to 24 Minutes | 42 (11.7%) | 61 (20.6%) |
| 25 to 29 Minutes | 38 (10.6%) | 0 (0.0%) |
| 30 to 34 Minutes | 25 (7.0%) | 51 (17.2%) |
| 35 to 39 Minutes | 0 (0.0%) | 17 (5.7%) |
| 40 to 44 Minutes | 18 (5.0%) | 0 (0.0%) |
| 45 to 59 Minutes | 62 (17.3%) | 0 (0.0%) |
| 60 to 89 Minutes | 17 (4.7%) | 0 (0.0%) |
| 90 or more Minutes | 28 (7.8%) | 0 (0.0%) |
Time of Departure to Work by Sex in Barceloneta
The most frequent times of departure to work in Barceloneta are 5:30 AM to 5:59 AM (70, 19.5%) for males and 4:00 PM to 11:59 PM (65, 22.0%) for females.
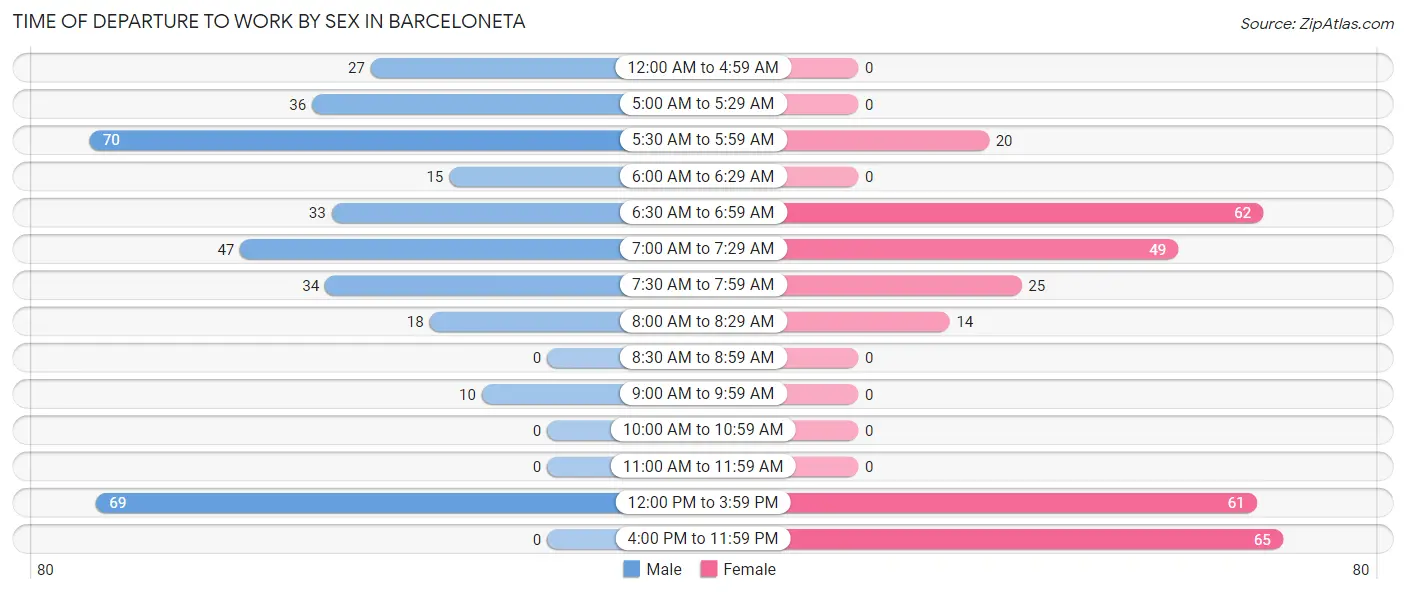
| Time of Departure | Male | Female |
| 12:00 AM to 4:59 AM | 27 (7.5%) | 0 (0.0%) |
| 5:00 AM to 5:29 AM | 36 (10.0%) | 0 (0.0%) |
| 5:30 AM to 5:59 AM | 70 (19.5%) | 20 (6.8%) |
| 6:00 AM to 6:29 AM | 15 (4.2%) | 0 (0.0%) |
| 6:30 AM to 6:59 AM | 33 (9.2%) | 62 (20.9%) |
| 7:00 AM to 7:29 AM | 47 (13.1%) | 49 (16.6%) |
| 7:30 AM to 7:59 AM | 34 (9.5%) | 25 (8.5%) |
| 8:00 AM to 8:29 AM | 18 (5.0%) | 14 (4.7%) |
| 8:30 AM to 8:59 AM | 0 (0.0%) | 0 (0.0%) |
| 9:00 AM to 9:59 AM | 10 (2.8%) | 0 (0.0%) |
| 10:00 AM to 10:59 AM | 0 (0.0%) | 0 (0.0%) |
| 11:00 AM to 11:59 AM | 0 (0.0%) | 0 (0.0%) |
| 12:00 PM to 3:59 PM | 69 (19.2%) | 61 (20.6%) |
| 4:00 PM to 11:59 PM | 0 (0.0%) | 65 (22.0%) |
| Total | 359 (100.0%) | 296 (100.0%) |
Housing Occupancy in Barceloneta
Occupancy by Ownership in Barceloneta
Of the total 1,349 dwellings in Barceloneta, owner-occupied units account for 740 (54.9%), while renter-occupied units make up 609 (45.1%).
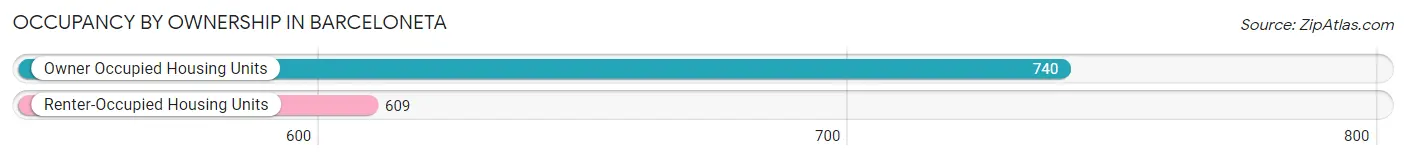
| Occupancy | # Housing Units | % Housing Units |
| Owner Occupied Housing Units | 740 | 54.9% |
| Renter-Occupied Housing Units | 609 | 45.1% |
| Total Occupied Housing Units | 1,349 | 100.0% |
Occupancy by Household Size in Barceloneta
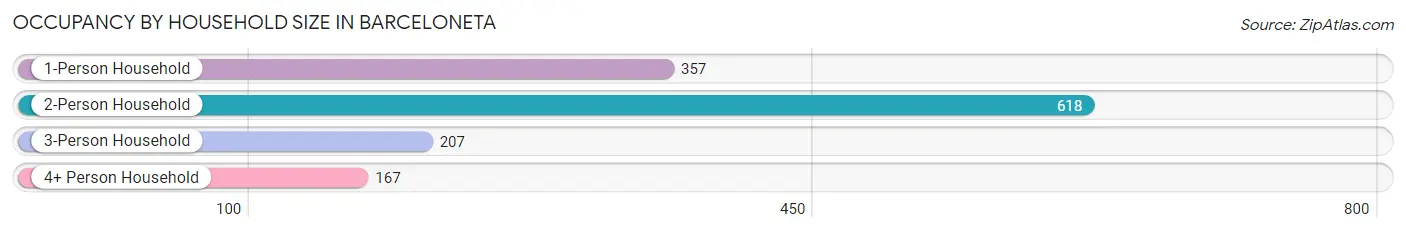
| Household Size | # Housing Units | % Housing Units |
| 1-Person Household | 357 | 26.5% |
| 2-Person Household | 618 | 45.8% |
| 3-Person Household | 207 | 15.3% |
| 4+ Person Household | 167 | 12.4% |
| Total Housing Units | 1,349 | 100.0% |
Occupancy by Ownership by Household Size in Barceloneta
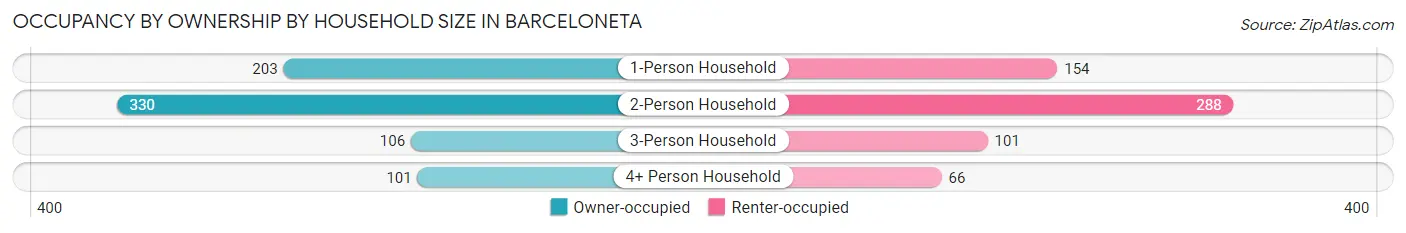
| Household Size | Owner-occupied | Renter-occupied |
| 1-Person Household | 203 (56.9%) | 154 (43.1%) |
| 2-Person Household | 330 (53.4%) | 288 (46.6%) |
| 3-Person Household | 106 (51.2%) | 101 (48.8%) |
| 4+ Person Household | 101 (60.5%) | 66 (39.5%) |
| Total Housing Units | 740 (54.9%) | 609 (45.1%) |
Occupancy by Educational Attainment in Barceloneta
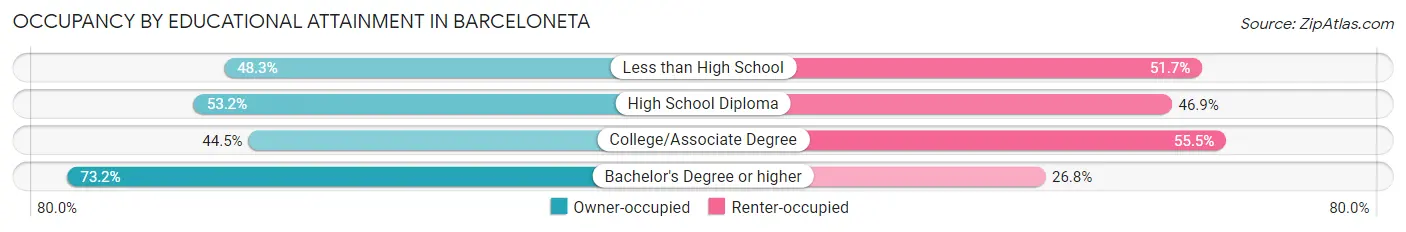
| Household Size | Owner-occupied | Renter-occupied |
| Less than High School | 159 (48.3%) | 170 (51.7%) |
| High School Diploma | 287 (53.1%) | 253 (46.9%) |
| College/Associate Degree | 89 (44.5%) | 111 (55.5%) |
| Bachelor's Degree or higher | 205 (73.2%) | 75 (26.8%) |
Occupancy by Age of Householder in Barceloneta
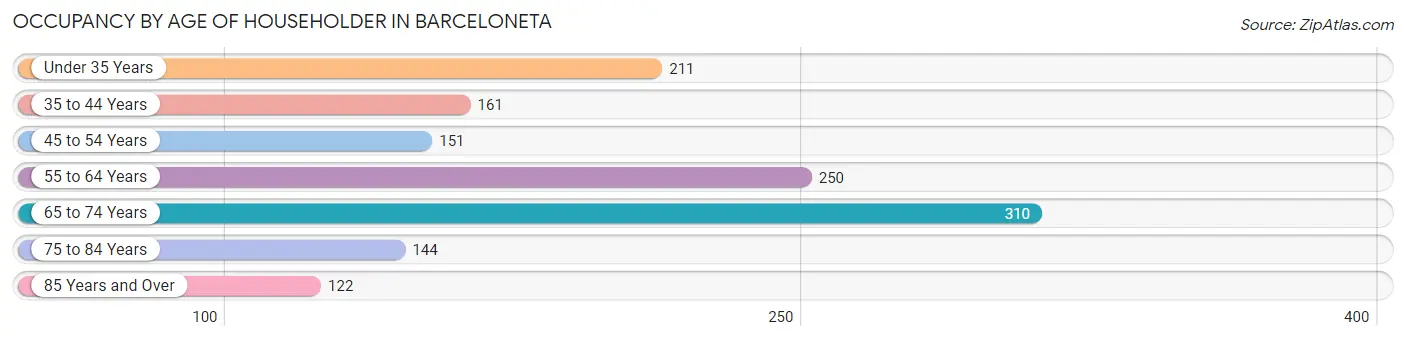
| Age Bracket | # Households | % Households |
| Under 35 Years | 211 | 15.6% |
| 35 to 44 Years | 161 | 11.9% |
| 45 to 54 Years | 151 | 11.2% |
| 55 to 64 Years | 250 | 18.5% |
| 65 to 74 Years | 310 | 23.0% |
| 75 to 84 Years | 144 | 10.7% |
| 85 Years and Over | 122 | 9.0% |
| Total | 1,349 | 100.0% |
Housing Finances in Barceloneta
Median Income by Occupancy in Barceloneta
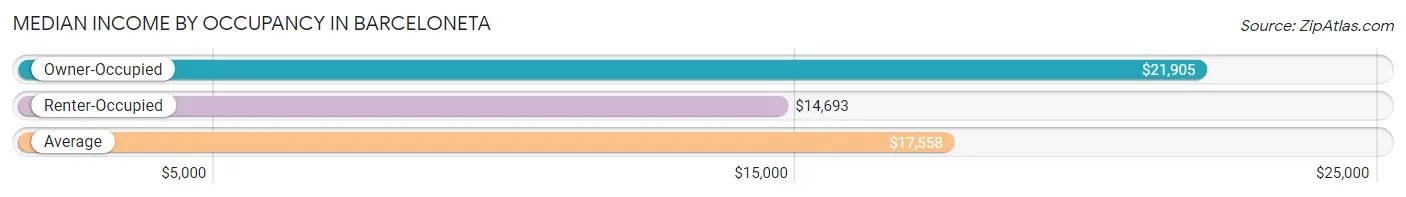
| Occupancy Type | # Households | Median Income |
| Owner-Occupied | 740 (54.9%) | $21,905 |
| Renter-Occupied | 609 (45.1%) | $14,693 |
| Average | 1,349 (100.0%) | $17,558 |
Occupancy by Householder Income Bracket in Barceloneta
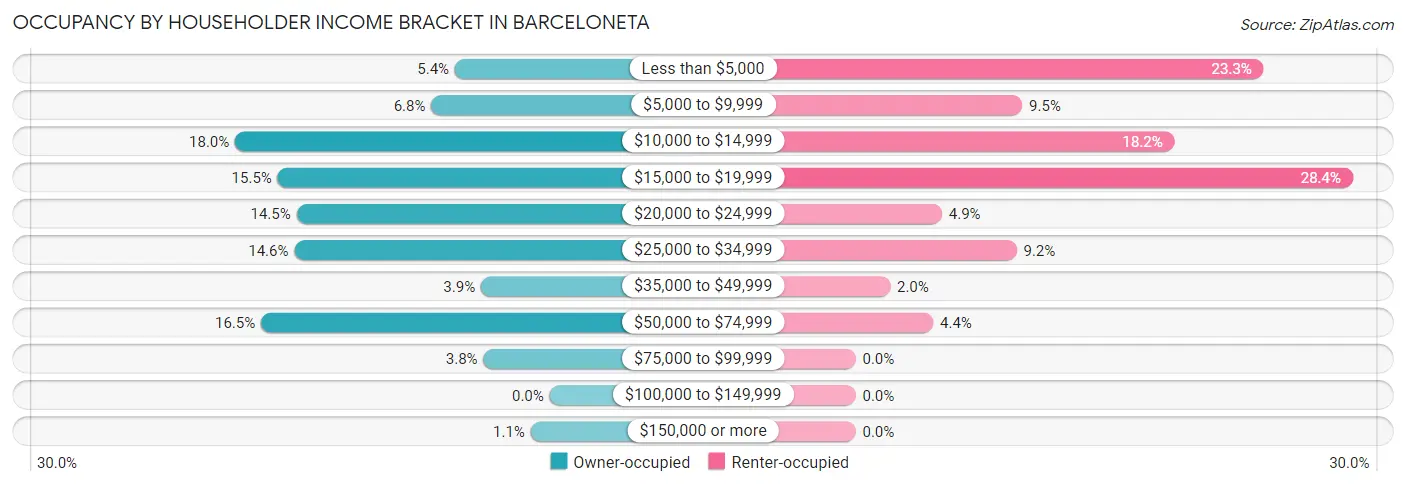
| Income Bracket | Owner-occupied | Renter-occupied |
| Less than $5,000 | 40 (5.4%) | 142 (23.3%) |
| $5,000 to $9,999 | 50 (6.8%) | 58 (9.5%) |
| $10,000 to $14,999 | 133 (18.0%) | 111 (18.2%) |
| $15,000 to $19,999 | 115 (15.5%) | 173 (28.4%) |
| $20,000 to $24,999 | 107 (14.5%) | 30 (4.9%) |
| $25,000 to $34,999 | 108 (14.6%) | 56 (9.2%) |
| $35,000 to $49,999 | 29 (3.9%) | 12 (2.0%) |
| $50,000 to $74,999 | 122 (16.5%) | 27 (4.4%) |
| $75,000 to $99,999 | 28 (3.8%) | 0 (0.0%) |
| $100,000 to $149,999 | 0 (0.0%) | 0 (0.0%) |
| $150,000 or more | 8 (1.1%) | 0 (0.0%) |
| Total | 740 (100.0%) | 609 (100.0%) |
Monthly Housing Cost Tiers in Barceloneta
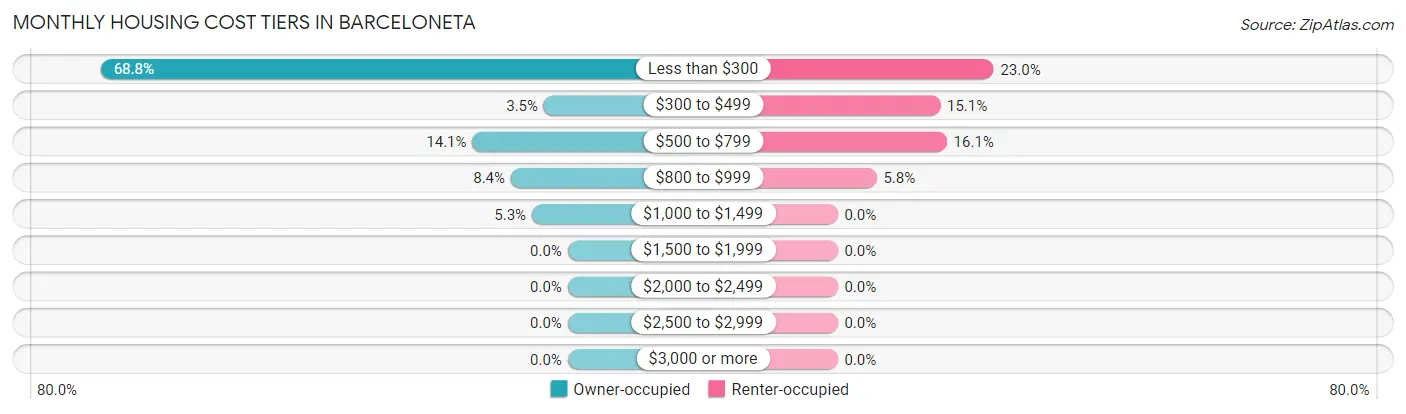
| Monthly Cost | Owner-occupied | Renter-occupied |
| Less than $300 | 509 (68.8%) | 140 (23.0%) |
| $300 to $499 | 26 (3.5%) | 92 (15.1%) |
| $500 to $799 | 104 (14.1%) | 98 (16.1%) |
| $800 to $999 | 62 (8.4%) | 35 (5.8%) |
| $1,000 to $1,499 | 39 (5.3%) | 0 (0.0%) |
| $1,500 to $1,999 | 0 (0.0%) | 0 (0.0%) |
| $2,000 to $2,499 | 0 (0.0%) | 0 (0.0%) |
| $2,500 to $2,999 | 0 (0.0%) | 0 (0.0%) |
| $3,000 or more | 0 (0.0%) | 0 (0.0%) |
| Total | 740 (100.0%) | 609 (100.0%) |
Physical Housing Characteristics in Barceloneta
Housing Structures in Barceloneta
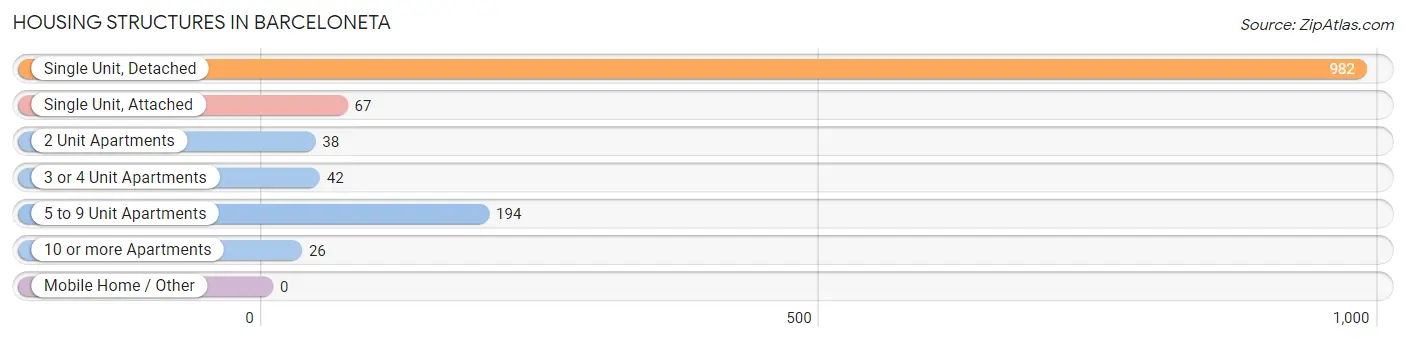
| Structure Type | # Housing Units | % Housing Units |
| Single Unit, Detached | 982 | 72.8% |
| Single Unit, Attached | 67 | 5.0% |
| 2 Unit Apartments | 38 | 2.8% |
| 3 or 4 Unit Apartments | 42 | 3.1% |
| 5 to 9 Unit Apartments | 194 | 14.4% |
| 10 or more Apartments | 26 | 1.9% |
| Mobile Home / Other | 0 | 0.0% |
| Total | 1,349 | 100.0% |
Housing Structures by Occupancy in Barceloneta
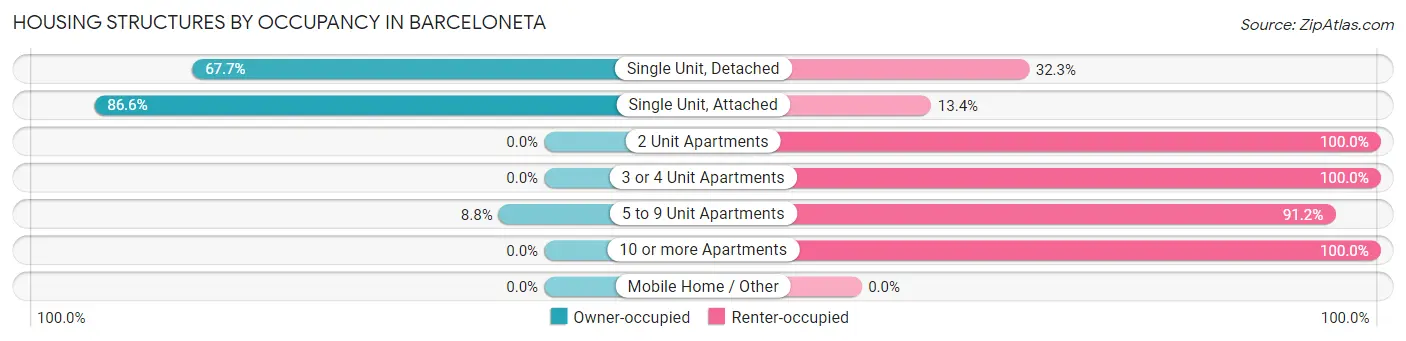
| Structure Type | Owner-occupied | Renter-occupied |
| Single Unit, Detached | 665 (67.7%) | 317 (32.3%) |
| Single Unit, Attached | 58 (86.6%) | 9 (13.4%) |
| 2 Unit Apartments | 0 (0.0%) | 38 (100.0%) |
| 3 or 4 Unit Apartments | 0 (0.0%) | 42 (100.0%) |
| 5 to 9 Unit Apartments | 17 (8.8%) | 177 (91.2%) |
| 10 or more Apartments | 0 (0.0%) | 26 (100.0%) |
| Mobile Home / Other | 0 (0.0%) | 0 (0.0%) |
| Total | 740 (54.9%) | 609 (45.1%) |
Housing Structures by Number of Rooms in Barceloneta
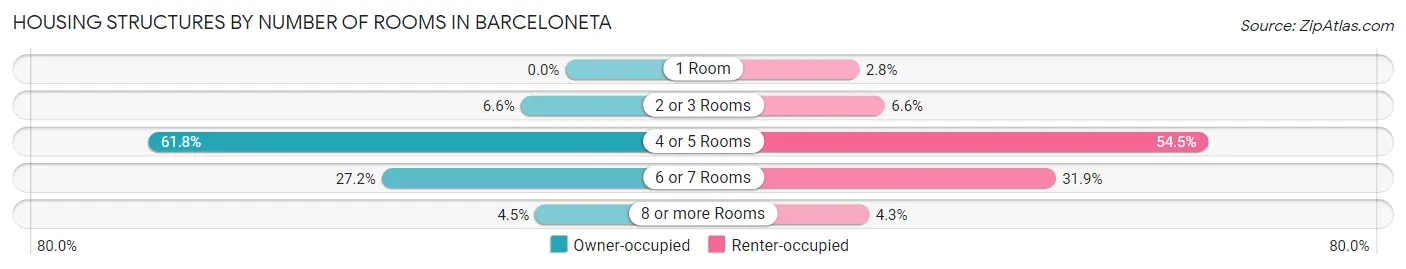
| Number of Rooms | Owner-occupied | Renter-occupied |
| 1 Room | 0 (0.0%) | 17 (2.8%) |
| 2 or 3 Rooms | 49 (6.6%) | 40 (6.6%) |
| 4 or 5 Rooms | 457 (61.8%) | 332 (54.5%) |
| 6 or 7 Rooms | 201 (27.2%) | 194 (31.9%) |
| 8 or more Rooms | 33 (4.5%) | 26 (4.3%) |
| Total | 740 (100.0%) | 609 (100.0%) |
Housing Structure by Heating Type in Barceloneta
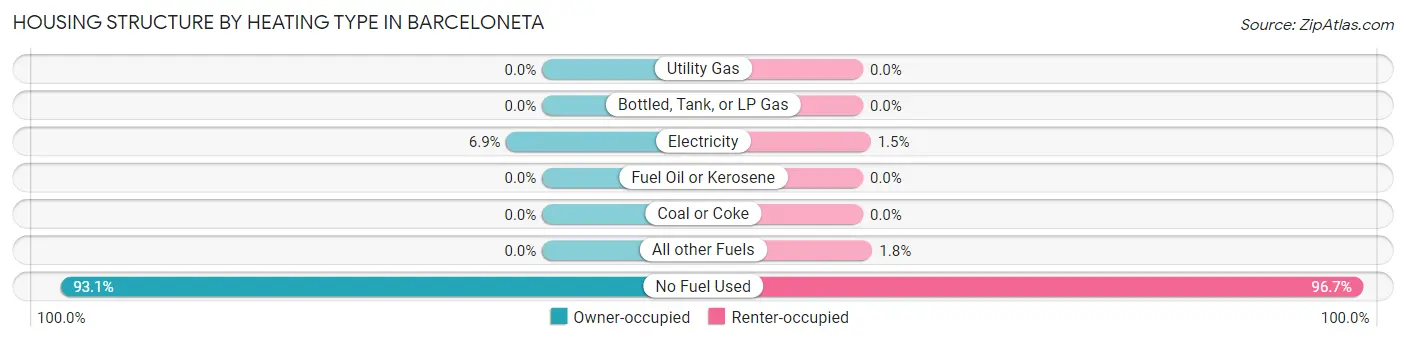
| Heating Type | Owner-occupied | Renter-occupied |
| Utility Gas | 0 (0.0%) | 0 (0.0%) |
| Bottled, Tank, or LP Gas | 0 (0.0%) | 0 (0.0%) |
| Electricity | 51 (6.9%) | 9 (1.5%) |
| Fuel Oil or Kerosene | 0 (0.0%) | 0 (0.0%) |
| Coal or Coke | 0 (0.0%) | 0 (0.0%) |
| All other Fuels | 0 (0.0%) | 11 (1.8%) |
| No Fuel Used | 689 (93.1%) | 589 (96.7%) |
| Total | 740 (100.0%) | 609 (100.0%) |
Household Vehicle Usage in Barceloneta
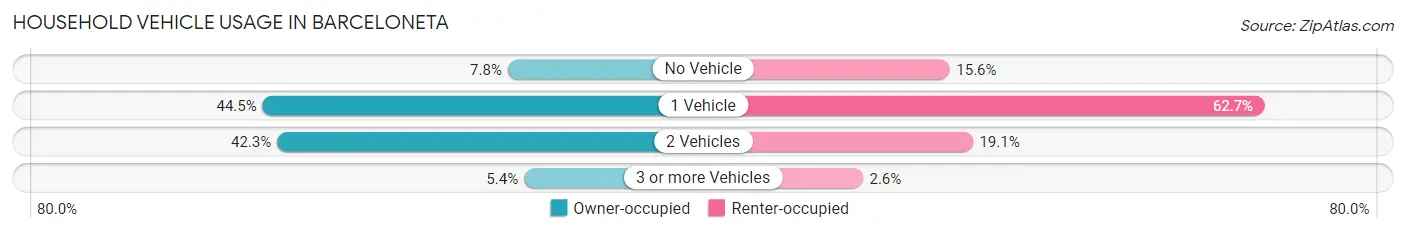
| Vehicles per Household | Owner-occupied | Renter-occupied |
| No Vehicle | 58 (7.8%) | 95 (15.6%) |
| 1 Vehicle | 329 (44.5%) | 382 (62.7%) |
| 2 Vehicles | 313 (42.3%) | 116 (19.1%) |
| 3 or more Vehicles | 40 (5.4%) | 16 (2.6%) |
| Total | 740 (100.0%) | 609 (100.0%) |
Real Estate & Mortgages in Barceloneta
Real Estate and Mortgage Overview in Barceloneta
| Characteristic | Without Mortgage | With Mortgage |
| Housing Units | 547 | 193 |
| Median Property Value | $95,600 | $132,500 |
| Median Household Income | $19,710 | $0 |
| Monthly Housing Costs | $147 | $0 |
| Real Estate Taxes | - | - |
Property Value by Mortgage Status in Barceloneta
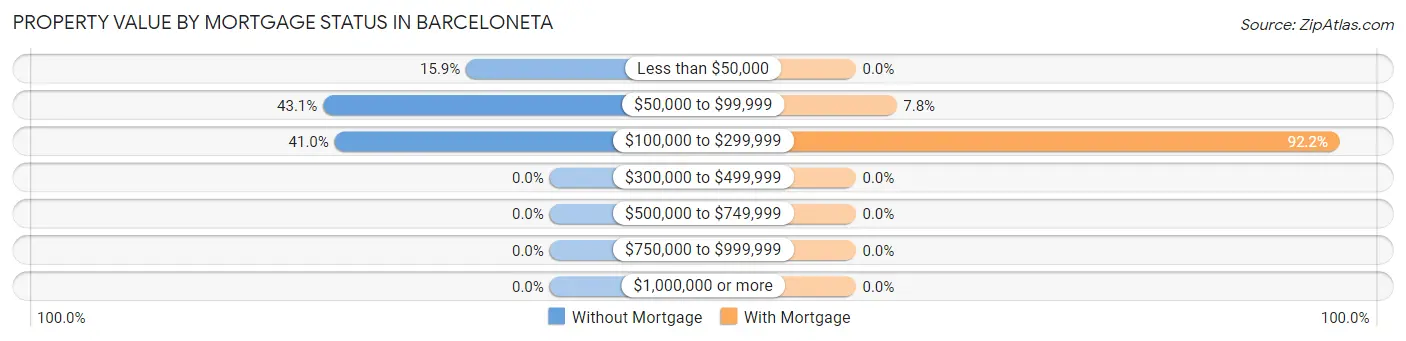
| Property Value | Without Mortgage | With Mortgage |
| Less than $50,000 | 87 (15.9%) | 0 (0.0%) |
| $50,000 to $99,999 | 236 (43.1%) | 15 (7.8%) |
| $100,000 to $299,999 | 224 (40.9%) | 178 (92.2%) |
| $300,000 to $499,999 | 0 (0.0%) | 0 (0.0%) |
| $500,000 to $749,999 | 0 (0.0%) | 0 (0.0%) |
| $750,000 to $999,999 | 0 (0.0%) | 0 (0.0%) |
| $1,000,000 or more | 0 (0.0%) | 0 (0.0%) |
| Total | 547 (100.0%) | 193 (100.0%) |
Household Income by Mortgage Status in Barceloneta
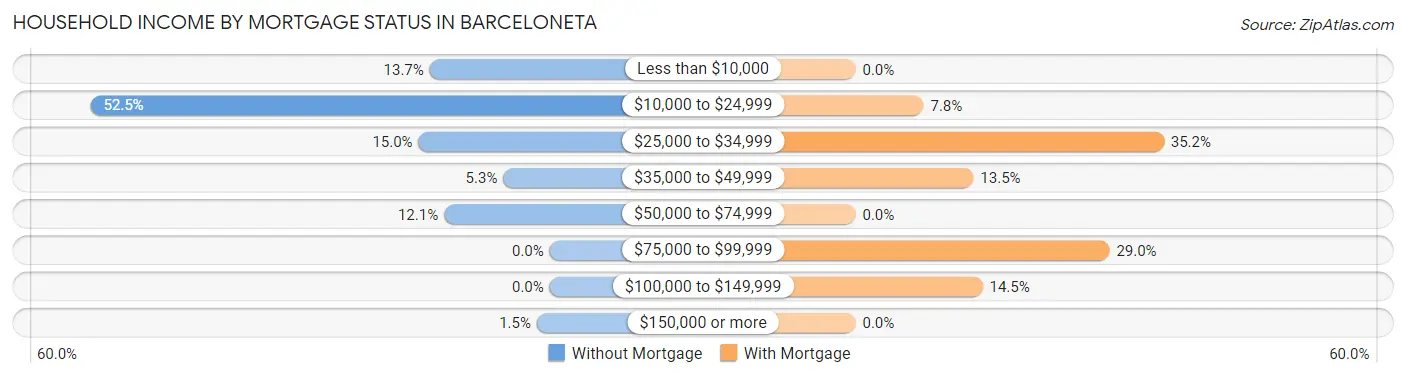
| Household Income | Without Mortgage | With Mortgage |
| Less than $10,000 | 75 (13.7%) | 0 (0.0%) |
| $10,000 to $24,999 | 287 (52.5%) | 15 (7.8%) |
| $25,000 to $34,999 | 82 (15.0%) | 68 (35.2%) |
| $35,000 to $49,999 | 29 (5.3%) | 26 (13.5%) |
| $50,000 to $74,999 | 66 (12.1%) | 0 (0.0%) |
| $75,000 to $99,999 | 0 (0.0%) | 56 (29.0%) |
| $100,000 to $149,999 | 0 (0.0%) | 28 (14.5%) |
| $150,000 or more | 8 (1.5%) | 0 (0.0%) |
| Total | 547 (100.0%) | 193 (100.0%) |
Property Value to Household Income Ratio in Barceloneta
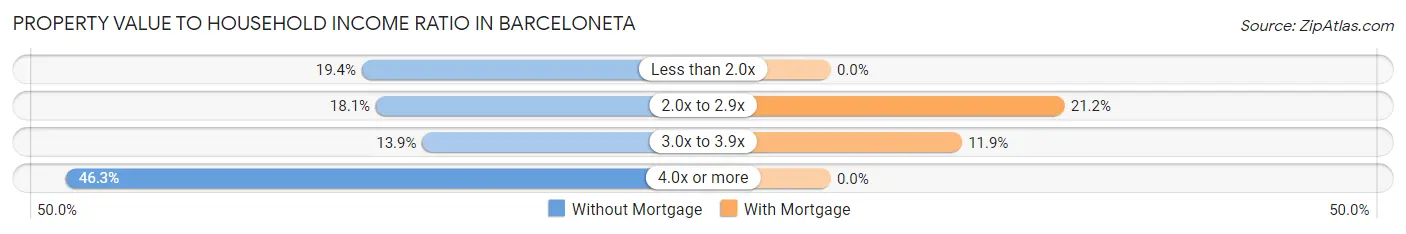
| Value-to-Income Ratio | Without Mortgage | With Mortgage |
| Less than 2.0x | 106 (19.4%) | 0 (0.0%) |
| 2.0x to 2.9x | 99 (18.1%) | 41 (21.2%) |
| 3.0x to 3.9x | 76 (13.9%) | 23 (11.9%) |
| 4.0x or more | 253 (46.3%) | 0 (0.0%) |
| Total | 547 (100.0%) | 193 (100.0%) |
Real Estate Taxes by Mortgage Status in Barceloneta
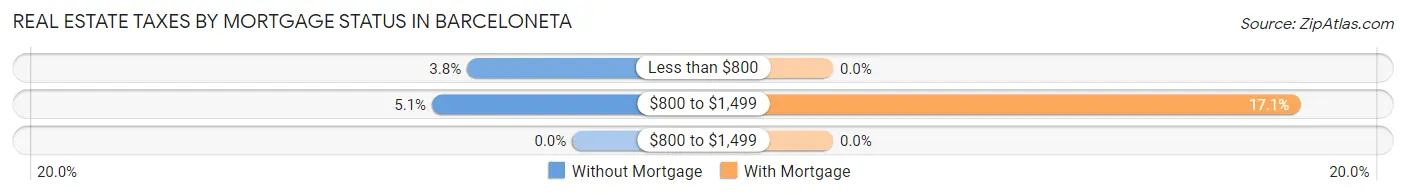
| Property Taxes | Without Mortgage | With Mortgage |
| Less than $800 | 21 (3.8%) | 0 (0.0%) |
| $800 to $1,499 | 28 (5.1%) | 33 (17.1%) |
| $800 to $1,499 | 0 (0.0%) | 0 (0.0%) |
| Total | 547 (100.0%) | 193 (100.0%) |
Health & Disability in Barceloneta
Health Insurance Coverage by Age in Barceloneta
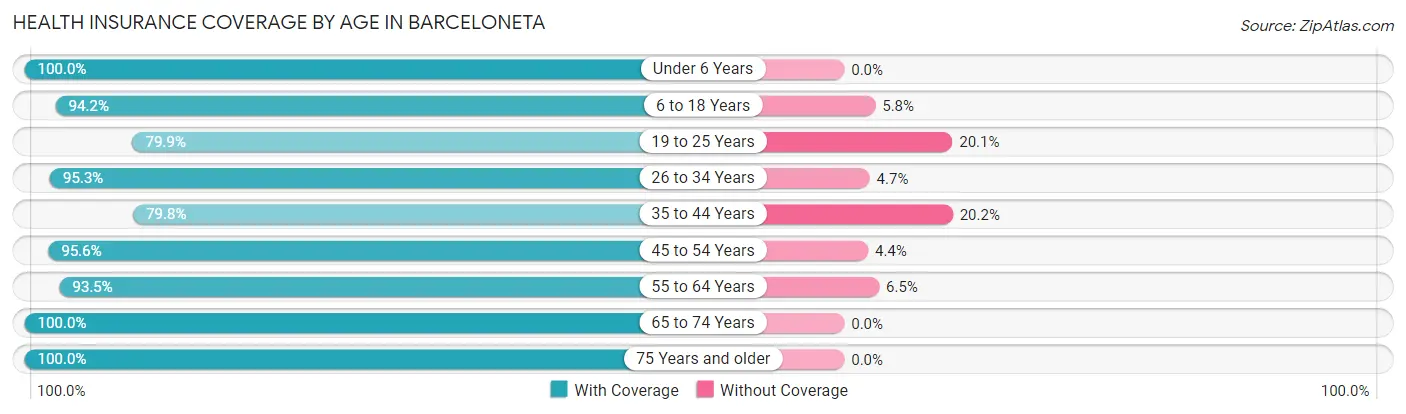
| Age Bracket | With Coverage | Without Coverage |
| Under 6 Years | 195 (100.0%) | 0 (0.0%) |
| 6 to 18 Years | 326 (94.2%) | 20 (5.8%) |
| 19 to 25 Years | 349 (79.9%) | 88 (20.1%) |
| 26 to 34 Years | 443 (95.3%) | 22 (4.7%) |
| 35 to 44 Years | 217 (79.8%) | 55 (20.2%) |
| 45 to 54 Years | 302 (95.6%) | 14 (4.4%) |
| 55 to 64 Years | 389 (93.5%) | 27 (6.5%) |
| 65 to 74 Years | 678 (100.0%) | 0 (0.0%) |
| 75 Years and older | 423 (100.0%) | 0 (0.0%) |
| Total | 3,322 (93.6%) | 226 (6.4%) |
Health Insurance Coverage by Citizenship Status in Barceloneta
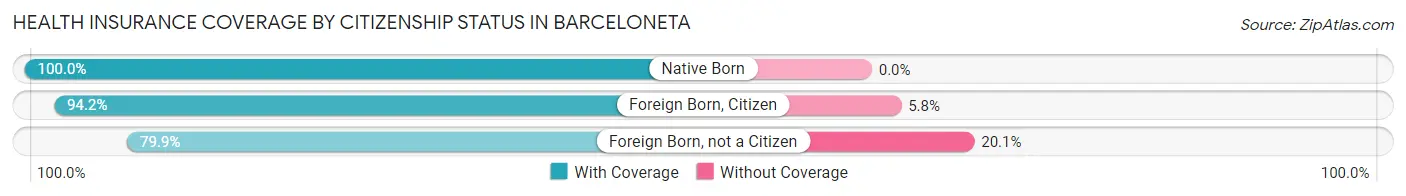
| Citizenship Status | With Coverage | Without Coverage |
| Native Born | 195 (100.0%) | 0 (0.0%) |
| Foreign Born, Citizen | 326 (94.2%) | 20 (5.8%) |
| Foreign Born, not a Citizen | 349 (79.9%) | 88 (20.1%) |
Health Insurance Coverage by Household Income in Barceloneta
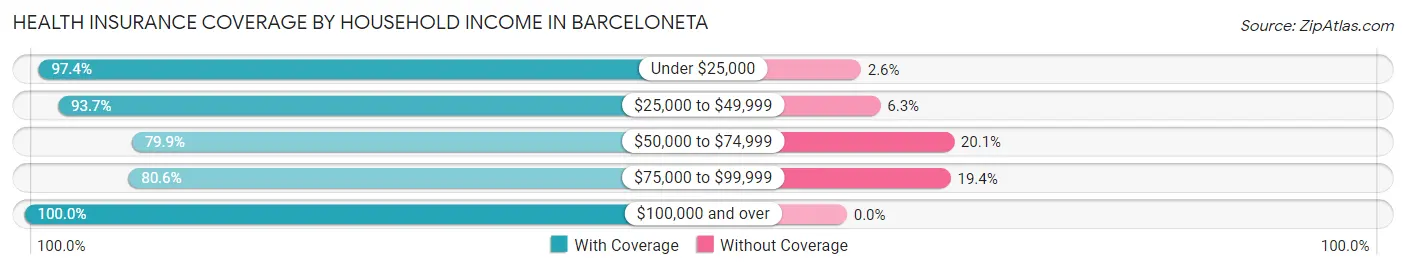
| Household Income | With Coverage | Without Coverage |
| Under $25,000 | 2,227 (97.4%) | 60 (2.6%) |
| $25,000 to $49,999 | 552 (93.7%) | 37 (6.3%) |
| $50,000 to $74,999 | 458 (79.9%) | 115 (20.1%) |
| $75,000 to $99,999 | 58 (80.6%) | 14 (19.4%) |
| $100,000 and over | 20 (100.0%) | 0 (0.0%) |
Public vs Private Health Insurance Coverage by Age in Barceloneta
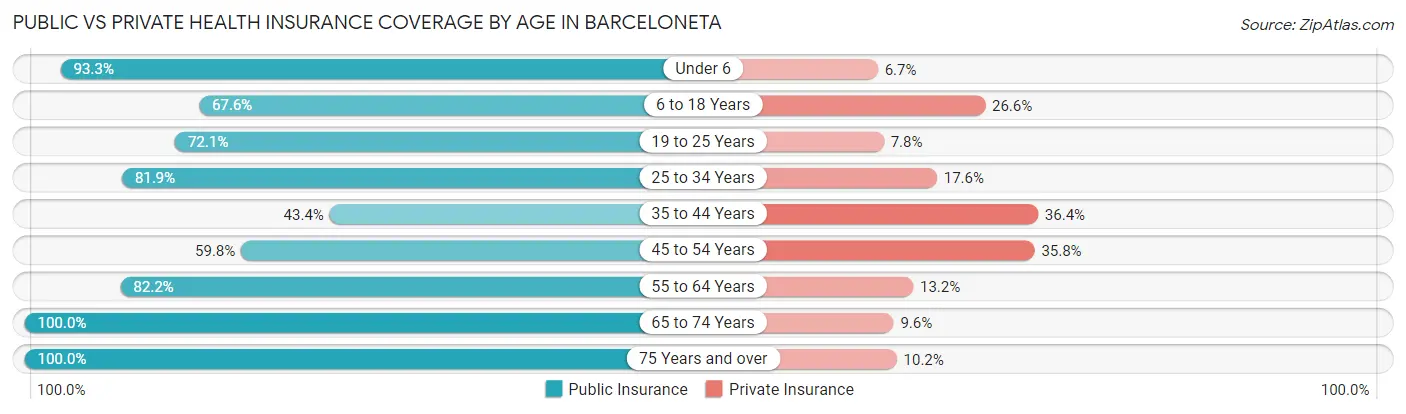
| Age Bracket | Public Insurance | Private Insurance |
| Under 6 | 182 (93.3%) | 13 (6.7%) |
| 6 to 18 Years | 234 (67.6%) | 92 (26.6%) |
| 19 to 25 Years | 315 (72.1%) | 34 (7.8%) |
| 25 to 34 Years | 381 (81.9%) | 82 (17.6%) |
| 35 to 44 Years | 118 (43.4%) | 99 (36.4%) |
| 45 to 54 Years | 189 (59.8%) | 113 (35.8%) |
| 55 to 64 Years | 342 (82.2%) | 55 (13.2%) |
| 65 to 74 Years | 678 (100.0%) | 65 (9.6%) |
| 75 Years and over | 423 (100.0%) | 43 (10.2%) |
| Total | 2,862 (80.7%) | 596 (16.8%) |
Disability Status by Sex by Age in Barceloneta
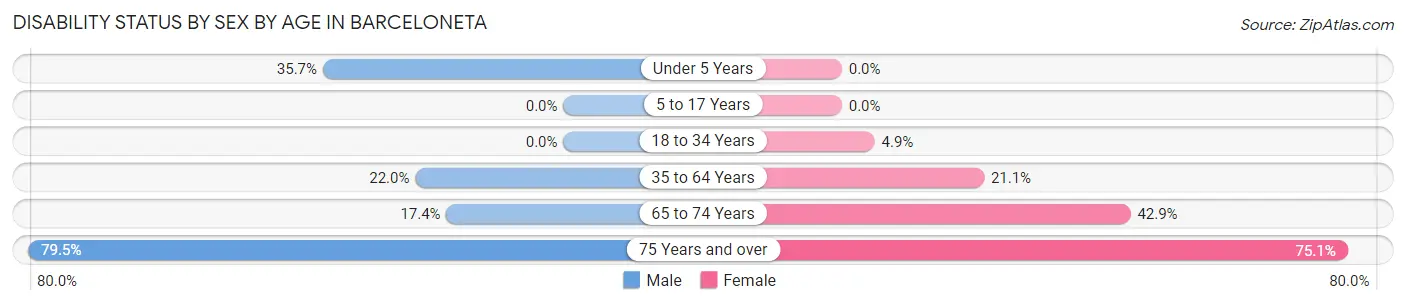
| Age Bracket | Male | Female |
| Under 5 Years | 25 (35.7%) | 0 (0.0%) |
| 5 to 17 Years | 0 (0.0%) | 0 (0.0%) |
| 18 to 34 Years | 0 (0.0%) | 30 (4.9%) |
| 35 to 64 Years | 102 (22.0%) | 114 (21.1%) |
| 65 to 74 Years | 46 (17.4%) | 177 (42.9%) |
| 75 Years and over | 151 (79.5%) | 175 (75.1%) |
Disability Class by Sex by Age in Barceloneta
Disability Class: Hearing Difficulty
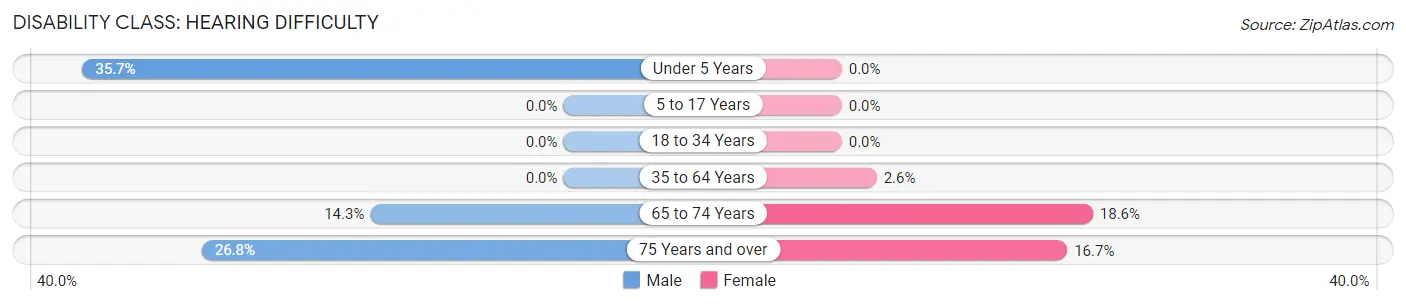
| Age Bracket | Male | Female |
| Under 5 Years | 25 (35.7%) | 0 (0.0%) |
| 5 to 17 Years | 0 (0.0%) | 0 (0.0%) |
| 18 to 34 Years | 0 (0.0%) | 0 (0.0%) |
| 35 to 64 Years | 0 (0.0%) | 14 (2.6%) |
| 65 to 74 Years | 38 (14.3%) | 77 (18.6%) |
| 75 Years and over | 51 (26.8%) | 39 (16.7%) |
Disability Class: Vision Difficulty
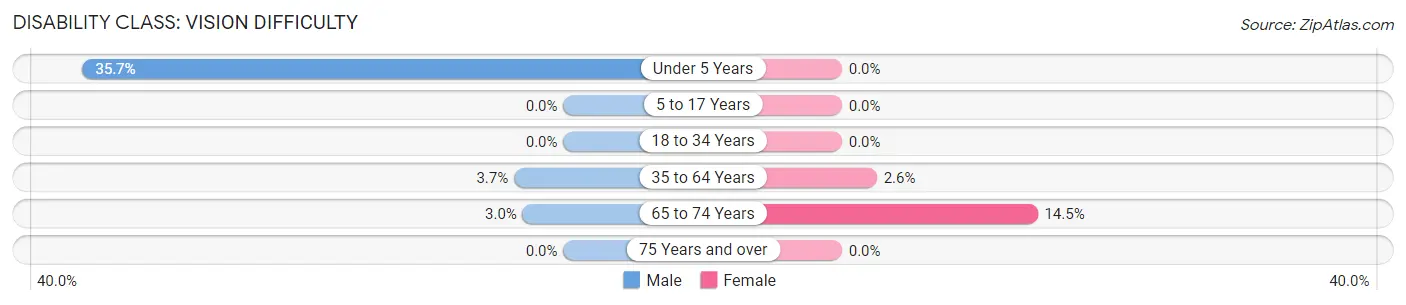
| Age Bracket | Male | Female |
| Under 5 Years | 25 (35.7%) | 0 (0.0%) |
| 5 to 17 Years | 0 (0.0%) | 0 (0.0%) |
| 18 to 34 Years | 0 (0.0%) | 0 (0.0%) |
| 35 to 64 Years | 17 (3.7%) | 14 (2.6%) |
| 65 to 74 Years | 8 (3.0%) | 60 (14.5%) |
| 75 Years and over | 0 (0.0%) | 0 (0.0%) |
Disability Class: Cognitive Difficulty
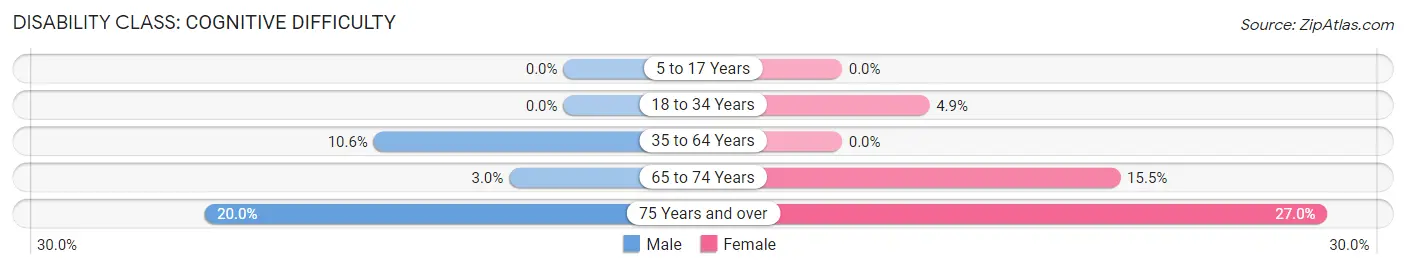
| Age Bracket | Male | Female |
| 5 to 17 Years | 0 (0.0%) | 0 (0.0%) |
| 18 to 34 Years | 0 (0.0%) | 30 (4.9%) |
| 35 to 64 Years | 49 (10.6%) | 0 (0.0%) |
| 65 to 74 Years | 8 (3.0%) | 64 (15.5%) |
| 75 Years and over | 38 (20.0%) | 63 (27.0%) |
Disability Class: Ambulatory Difficulty
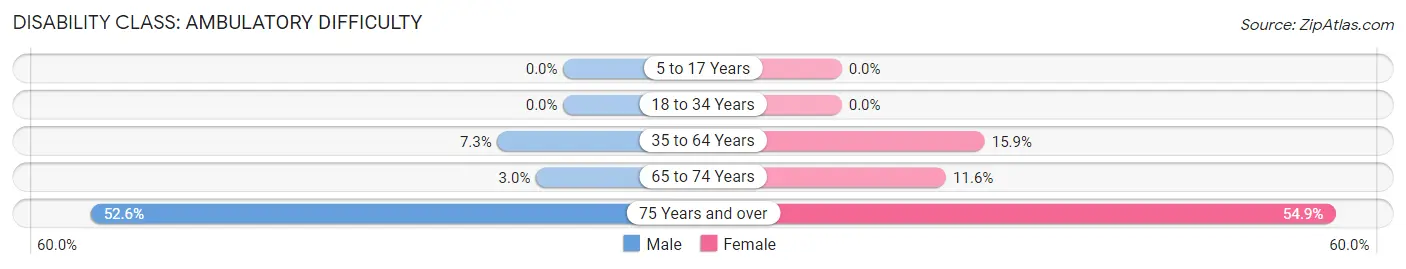
| Age Bracket | Male | Female |
| 5 to 17 Years | 0 (0.0%) | 0 (0.0%) |
| 18 to 34 Years | 0 (0.0%) | 0 (0.0%) |
| 35 to 64 Years | 34 (7.3%) | 86 (15.9%) |
| 65 to 74 Years | 8 (3.0%) | 48 (11.6%) |
| 75 Years and over | 100 (52.6%) | 128 (54.9%) |
Disability Class: Self-Care Difficulty
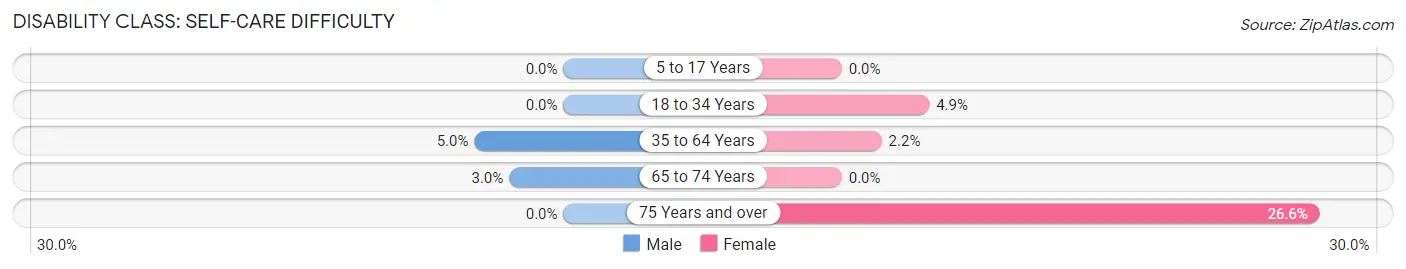
| Age Bracket | Male | Female |
| 5 to 17 Years | 0 (0.0%) | 0 (0.0%) |
| 18 to 34 Years | 0 (0.0%) | 30 (4.9%) |
| 35 to 64 Years | 23 (5.0%) | 12 (2.2%) |
| 65 to 74 Years | 8 (3.0%) | 0 (0.0%) |
| 75 Years and over | 0 (0.0%) | 62 (26.6%) |
Technology Access in Barceloneta
Computing Device Access in Barceloneta
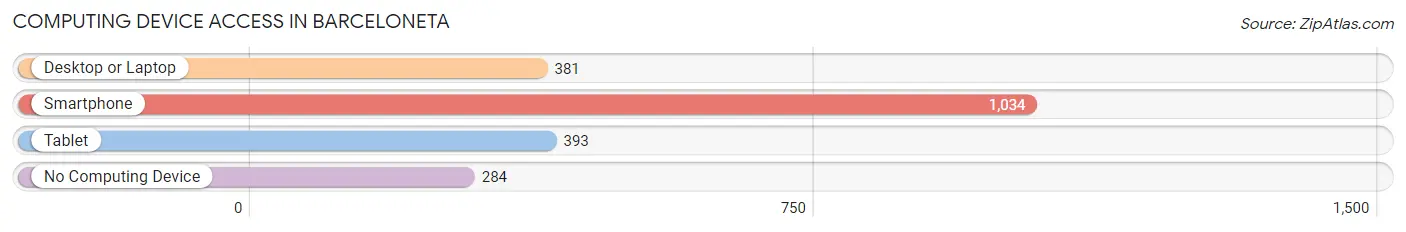
| Device Type | # Households | % Households |
| Desktop or Laptop | 381 | 28.2% |
| Smartphone | 1,034 | 76.6% |
| Tablet | 393 | 29.1% |
| No Computing Device | 284 | 21.0% |
| Total | 1,349 | 100.0% |
Internet Access in Barceloneta
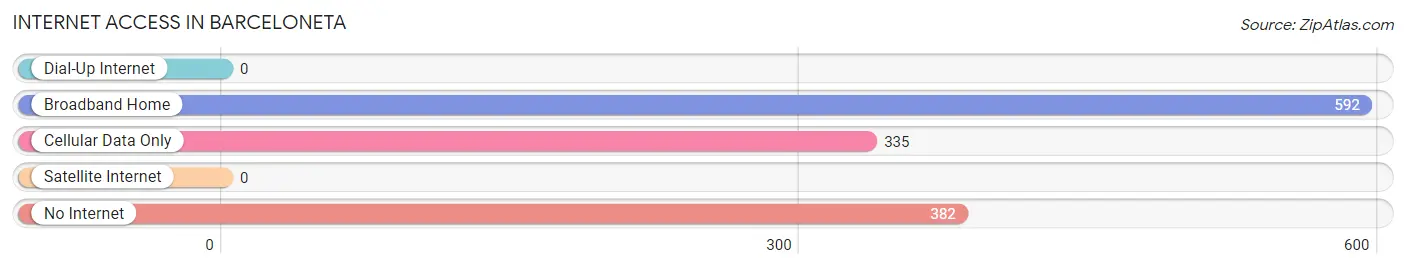
| Internet Type | # Households | % Households |
| Dial-Up Internet | 0 | 0.0% |
| Broadband Home | 592 | 43.9% |
| Cellular Data Only | 335 | 24.8% |
| Satellite Internet | 0 | 0.0% |
| No Internet | 382 | 28.3% |
| Total | 1,349 | 100.0% |
Barceloneta Summary
Barceloneta is a municipality located in the northern coast of Puerto Rico. It is part of the San Juan-Caguas-Guaynabo Metropolitan Statistical Area. As of the 2010 census, the population of Barceloneta was 17,272.
History
Barceloneta was founded in 1881 by Don Francisco de Asís González. The town was named after the Spanish city of Barcelona. The first settlers of the town were mostly farmers and fishermen. In the early 20th century, the town experienced a period of growth due to the arrival of immigrants from the Dominican Republic and other Caribbean islands.
Geography
Barceloneta is located in the northern coast of Puerto Rico, in the northern part of the island. It is bordered by the municipalities of Arecibo, Manatí, Vega Baja, and Vega Alta. The town is located in the karst region of the island, and is characterized by its limestone hills and caves. The town is also home to the Barceloneta State Forest, which is a protected area of over 1,000 acres of land.
Economy
The economy of Barceloneta is mainly based on agriculture and tourism. The town is home to several agricultural businesses, such as the Barceloneta Fruit Company, which produces tropical fruits such as mangoes, papayas, and avocados. The town is also home to several industrial parks, such as the Barceloneta Industrial Park, which is home to several manufacturing companies.
Tourism is also an important part of the economy of Barceloneta. The town is home to several beaches, such as Playa de la Punta, Playa de la Cruz, and Playa de la Piedra. The town is also home to several tourist attractions, such as the Barceloneta Aquarium, the Barceloneta Zoo, and the Barceloneta Historical Museum.
Demographics
As of the 2010 census, the population of Barceloneta was 17,272. The population is mostly of Hispanic origin, with a small percentage of African and Asian descent. The median household income in Barceloneta is $17,845, which is lower than the median household income of Puerto Rico as a whole. The unemployment rate in Barceloneta is also higher than the national average, at 11.2%.
Conclusion
Barceloneta is a municipality located in the northern coast of Puerto Rico. It is part of the San Juan-Caguas-Guaynabo Metropolitan Statistical Area. The town was founded in 1881 and is characterized by its limestone hills and caves. The economy of Barceloneta is mainly based on agriculture and tourism. As of the 2010 census, the population of Barceloneta was 17,272, and the median household income is $17,845.
Common Questions
What is Per Capita Income in Barceloneta?
Per Capita income in Barceloneta is $11,313.
What is the Median Family Income in Barceloneta?
Median Family Income in Barceloneta is $17,075.
What is the Median Household income in Barceloneta?
Median Household Income in Barceloneta is $17,558.
What is Income or Wage Gap in Barceloneta?
Income or Wage Gap in Barceloneta is 20.9%.
Women in Barceloneta earn 79.1 cents for every dollar earned by a man.
What is Family Income Deficit in Barceloneta?
Family Income Deficit in Barceloneta is $11,171.
Families that are below poverty line in Barceloneta earn $11,171 less on average than the poverty threshold level.
What is Inequality or Gini Index in Barceloneta?
Inequality or Gini Index in Barceloneta is 0.48.
What is the Total Population of Barceloneta?
Total Population of Barceloneta is 3,548.
What is the Total Male Population of Barceloneta?
Total Male Population of Barceloneta is 1,472.
What is the Total Female Population of Barceloneta?
Total Female Population of Barceloneta is 2,076.
What is the Ratio of Males per 100 Females in Barceloneta?
There are 70.91 Males per 100 Females in Barceloneta.
What is the Ratio of Females per 100 Males in Barceloneta?
There are 141.03 Females per 100 Males in Barceloneta.
What is the Median Population Age in Barceloneta?
Median Population Age in Barceloneta is 47.1 Years.
What is the Average Family Size in Barceloneta
Average Family Size in Barceloneta is 3.2 People.
What is the Average Household Size in Barceloneta
Average Household Size in Barceloneta is 2.6 People.
How Large is the Labor Force in Barceloneta?
There are 1,008 People in the Labor Forcein in Barceloneta.
What is the Percentage of People in the Labor Force in Barceloneta?
32.7% of People are in the Labor Force in Barceloneta.
What is the Unemployment Rate in Barceloneta?
Unemployment Rate in Barceloneta is 28.9%.