Zip Codes with the Highest Percentage of Population Employed in Arts, Entertainment & Recreation in Easton, PA
RELATED REPORTS & OPTIONS
Arts, Entertainment & Recreation
Easton
Compare Zip Codes
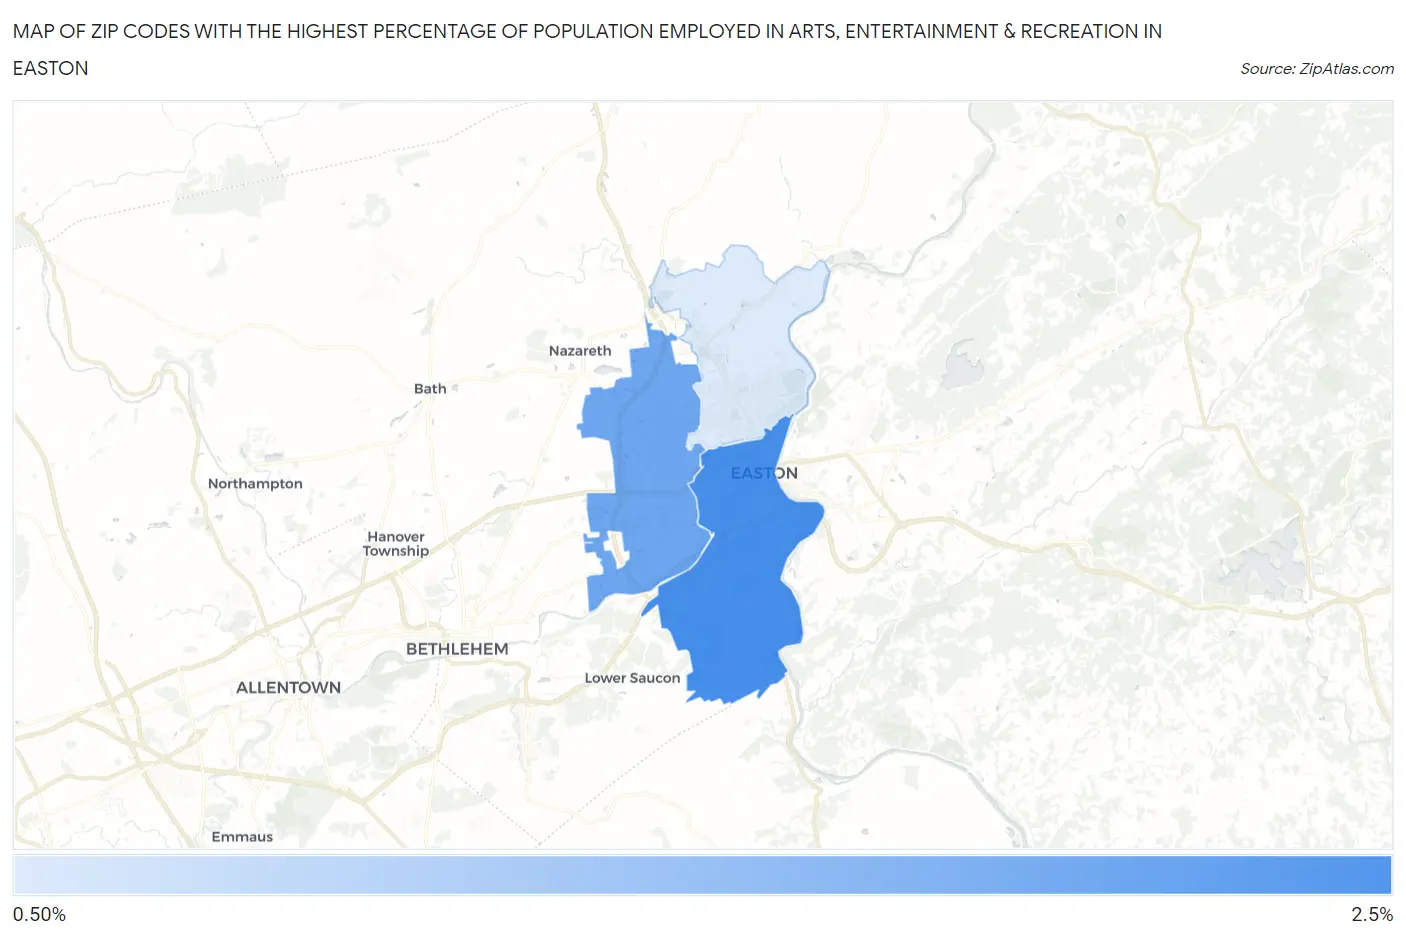
Map of Zip Codes with the Highest Percentage of Population Employed in Arts, Entertainment & Recreation in Easton
0.0%
2.5%
Zip Codes with the Highest Percentage of Population Employed in Arts, Entertainment & Recreation in Easton, PA
| Zip Code | % Employed | vs State | vs National | |
| 1. | 18042 | 2.2% | 1.8%(+0.382)#383 | 2.1%(+0.098)#8,751 |
| 2. | 18045 | 1.8% | 1.8%(+0.045)#490 | 2.1%(-0.238)#10,726 |
| 3. | 18040 | 0.92% | 1.8%(-0.879)#867 | 2.1%(-1.16)#17,544 |
1
Common Questions
What are the Top Zip Codes with the Highest Percentage of Population Employed in Arts, Entertainment & Recreation in Easton, PA?
Top Zip Codes with the Highest Percentage of Population Employed in Arts, Entertainment & Recreation in Easton, PA are:
What zip code has the Highest Percentage of Population Employed in Arts, Entertainment & Recreation in Easton, PA?
18042 has the Highest Percentage of Population Employed in Arts, Entertainment & Recreation in Easton, PA with 2.2%.
What is the Percentage of Population Employed in Arts, Entertainment & Recreation in Easton, PA?
Percentage of Population Employed in Arts, Entertainment & Recreation in Easton is 1.8%.
What is the Percentage of Population Employed in Arts, Entertainment & Recreation in Pennsylvania?
Percentage of Population Employed in Arts, Entertainment & Recreation in Pennsylvania is 1.8%.
What is the Percentage of Population Employed in Arts, Entertainment & Recreation in the United States?
Percentage of Population Employed in Arts, Entertainment & Recreation in the United States is 2.1%.