Zip Codes with the Highest Percentage of Population Employed in Arts, Entertainment & Recreation in Oregon
RELATED REPORTS & OPTIONS
Arts, Entertainment & Recreation
Oregon
Compare Zip Codes
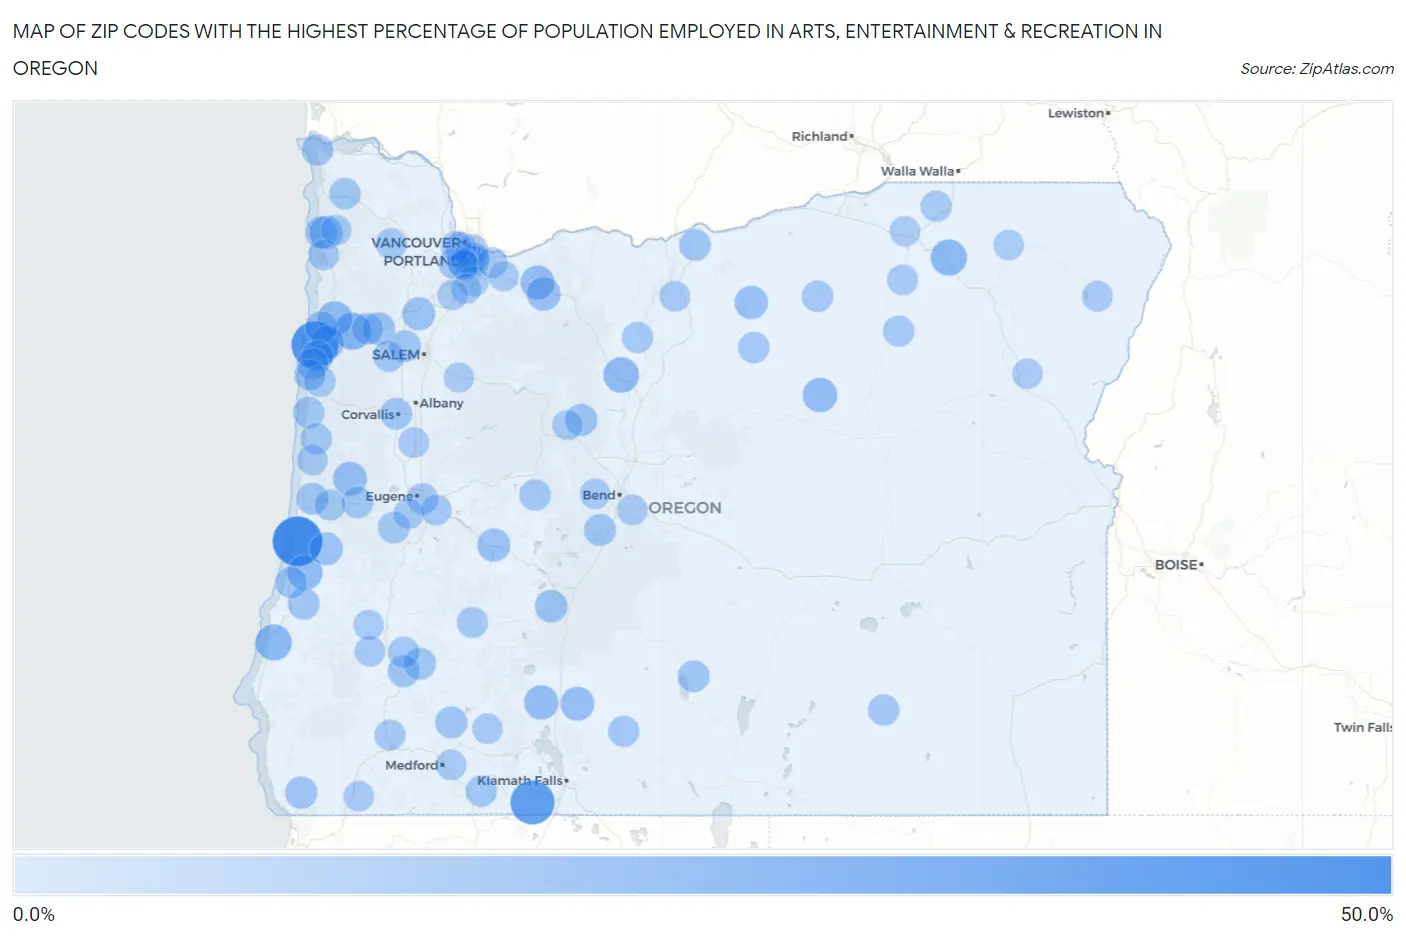
Map of Zip Codes with the Highest Percentage of Population Employed in Arts, Entertainment & Recreation in Oregon
0.0%
50.0%
Zip Codes with the Highest Percentage of Population Employed in Arts, Entertainment & Recreation in Oregon
| Zip Code | % Employed | vs State | vs National | |
| 1. | 97441 | 41.2% | 2.1%(+39.1)#1 | 2.1%(+39.1)#51 |
| 2. | 97364 | 36.0% | 2.1%(+33.9)#2 | 2.1%(+33.9)#61 |
| 3. | 97627 | 30.0% | 2.1%(+27.9)#3 | 2.1%(+27.9)#76 |
| 4. | 97347 | 15.5% | 2.1%(+13.4)#4 | 2.1%(+13.4)#315 |
| 5. | 97859 | 14.0% | 2.1%(+11.9)#5 | 2.1%(+12.0)#386 |
| 6. | 97411 | 13.9% | 2.1%(+11.8)#6 | 2.1%(+11.8)#398 |
| 7. | 97761 | 12.9% | 2.1%(+10.9)#7 | 2.1%(+10.9)#453 |
| 8. | 97122 | 11.8% | 2.1%(+9.67)#8 | 2.1%(+9.68)#529 |
| 9. | 97449 | 11.7% | 2.1%(+9.64)#9 | 2.1%(+9.66)#532 |
| 10. | 97848 | 10.8% | 2.1%(+8.69)#10 | 2.1%(+8.70)#617 |
| 11. | 97626 | 10.4% | 2.1%(+8.35)#11 | 2.1%(+8.37)#654 |
| 12. | 97430 | 9.8% | 2.1%(+7.71)#12 | 2.1%(+7.72)#734 |
| 13. | 97011 | 9.6% | 2.1%(+7.54)#13 | 2.1%(+7.56)#757 |
| 14. | 97067 | 9.6% | 2.1%(+7.49)#14 | 2.1%(+7.51)#767 |
| 15. | 97624 | 9.5% | 2.1%(+7.45)#15 | 2.1%(+7.47)#772 |
| 16. | 97823 | 8.7% | 2.1%(+6.57)#16 | 2.1%(+6.58)#918 |
| 17. | 97463 | 8.3% | 2.1%(+6.19)#17 | 2.1%(+6.20)#989 |
| 18. | 97147 | 8.3% | 2.1%(+6.19)#18 | 2.1%(+6.20)#990 |
| 19. | 97368 | 8.2% | 2.1%(+6.08)#19 | 2.1%(+6.10)#1,009 |
| 20. | 97467 | 8.2% | 2.1%(+6.07)#20 | 2.1%(+6.08)#1,011 |
| 21. | 97114 | 7.8% | 2.1%(+5.68)#21 | 2.1%(+5.69)#1,116 |
| 22. | 97378 | 7.6% | 2.1%(+5.54)#22 | 2.1%(+5.56)#1,145 |
| 23. | 97733 | 7.0% | 2.1%(+4.95)#23 | 2.1%(+4.96)#1,314 |
| 24. | 97415 | 6.6% | 2.1%(+4.48)#24 | 2.1%(+4.50)#1,459 |
| 25. | 97730 | 6.5% | 2.1%(+4.40)#25 | 2.1%(+4.41)#1,506 |
| 26. | 97130 | 6.5% | 2.1%(+4.37)#26 | 2.1%(+4.39)#1,514 |
| 27. | 97539 | 6.3% | 2.1%(+4.22)#27 | 2.1%(+4.23)#1,580 |
| 28. | 97149 | 6.0% | 2.1%(+3.93)#28 | 2.1%(+3.94)#1,690 |
| 29. | 97371 | 5.9% | 2.1%(+3.81)#29 | 2.1%(+3.82)#1,744 |
| 30. | 97429 | 5.8% | 2.1%(+3.73)#30 | 2.1%(+3.74)#1,793 |
| 31. | 97439 | 5.8% | 2.1%(+3.70)#31 | 2.1%(+3.71)#1,809 |
| 32. | 97417 | 5.7% | 2.1%(+3.62)#32 | 2.1%(+3.63)#1,850 |
| 33. | 97707 | 5.7% | 2.1%(+3.60)#33 | 2.1%(+3.61)#1,861 |
| 34. | 97640 | 5.7% | 2.1%(+3.57)#34 | 2.1%(+3.58)#1,882 |
| 35. | 97420 | 5.5% | 2.1%(+3.40)#35 | 2.1%(+3.41)#1,972 |
| 36. | 97367 | 5.5% | 2.1%(+3.37)#36 | 2.1%(+3.38)#1,988 |
| 37. | 97331 | 5.5% | 2.1%(+3.36)#37 | 2.1%(+3.37)#1,990 |
| 38. | 97388 | 5.4% | 2.1%(+3.30)#38 | 2.1%(+3.31)#2,022 |
| 39. | 97065 | 5.3% | 2.1%(+3.19)#39 | 2.1%(+3.20)#2,089 |
| 40. | 97457 | 5.2% | 2.1%(+3.14)#40 | 2.1%(+3.15)#2,130 |
| 41. | 97490 | 5.1% | 2.1%(+3.03)#41 | 2.1%(+3.05)#2,193 |
| 42. | 97451 | 5.1% | 2.1%(+3.00)#42 | 2.1%(+3.01)#2,217 |
| 43. | 97836 | 5.0% | 2.1%(+2.93)#43 | 2.1%(+2.94)#2,275 |
| 44. | 97121 | 4.9% | 2.1%(+2.81)#44 | 2.1%(+2.82)#2,357 |
| 45. | 97459 | 4.8% | 2.1%(+2.74)#45 | 2.1%(+2.75)#2,411 |
| 46. | 97413 | 4.8% | 2.1%(+2.72)#46 | 2.1%(+2.73)#2,426 |
| 47. | 97366 | 4.8% | 2.1%(+2.71)#47 | 2.1%(+2.72)#2,441 |
| 48. | 97621 | 4.5% | 2.1%(+2.45)#48 | 2.1%(+2.46)#2,685 |
| 49. | 97736 | 4.5% | 2.1%(+2.45)#49 | 2.1%(+2.46)#2,686 |
| 50. | 97138 | 4.5% | 2.1%(+2.43)#50 | 2.1%(+2.44)#2,712 |
| 51. | 97396 | 4.5% | 2.1%(+2.43)#51 | 2.1%(+2.44)#2,714 |
| 52. | 97520 | 4.5% | 2.1%(+2.42)#52 | 2.1%(+2.44)#2,717 |
| 53. | 97830 | 4.5% | 2.1%(+2.41)#53 | 2.1%(+2.42)#2,734 |
| 54. | 97403 | 4.5% | 2.1%(+2.37)#54 | 2.1%(+2.38)#2,785 |
| 55. | 97380 | 4.5% | 2.1%(+2.36)#55 | 2.1%(+2.38)#2,792 |
| 56. | 97215 | 4.5% | 2.1%(+2.36)#56 | 2.1%(+2.37)#2,797 |
| 57. | 97214 | 4.4% | 2.1%(+2.35)#57 | 2.1%(+2.36)#2,802 |
| 58. | 97394 | 4.4% | 2.1%(+2.26)#58 | 2.1%(+2.27)#2,894 |
| 59. | 97341 | 4.3% | 2.1%(+2.24)#59 | 2.1%(+2.26)#2,919 |
| 60. | 97037 | 4.3% | 2.1%(+2.24)#60 | 2.1%(+2.25)#2,921 |
| 61. | 97338 | 4.2% | 2.1%(+2.15)#61 | 2.1%(+2.17)#3,019 |
| 62. | 97117 | 4.2% | 2.1%(+2.14)#62 | 2.1%(+2.16)#3,031 |
| 63. | 97880 | 4.1% | 2.1%(+2.00)#63 | 2.1%(+2.02)#3,203 |
| 64. | 97813 | 4.1% | 2.1%(+1.99)#64 | 2.1%(+2.00)#3,213 |
| 65. | 97447 | 4.1% | 2.1%(+1.99)#65 | 2.1%(+2.00)#3,220 |
| 66. | 97211 | 3.9% | 2.1%(+1.84)#66 | 2.1%(+1.86)#3,419 |
| 67. | 97453 | 3.9% | 2.1%(+1.82)#67 | 2.1%(+1.83)#3,459 |
| 68. | 97526 | 3.9% | 2.1%(+1.81)#68 | 2.1%(+1.82)#3,483 |
| 69. | 97118 | 3.7% | 2.1%(+1.61)#69 | 2.1%(+1.62)#3,768 |
| 70. | 97846 | 3.7% | 2.1%(+1.57)#70 | 2.1%(+1.58)#3,831 |
| 71. | 97213 | 3.6% | 2.1%(+1.55)#71 | 2.1%(+1.56)#3,865 |
| 72. | 97868 | 3.6% | 2.1%(+1.51)#72 | 2.1%(+1.53)#3,934 |
| 73. | 97029 | 3.4% | 2.1%(+1.35)#73 | 2.1%(+1.37)#4,243 |
| 74. | 97348 | 3.4% | 2.1%(+1.31)#74 | 2.1%(+1.33)#4,333 |
| 75. | 97498 | 3.3% | 2.1%(+1.25)#75 | 2.1%(+1.26)#4,472 |
| 76. | 97217 | 3.3% | 2.1%(+1.20)#76 | 2.1%(+1.22)#4,571 |
| 77. | 97523 | 3.3% | 2.1%(+1.20)#77 | 2.1%(+1.22)#4,572 |
| 78. | 97405 | 3.2% | 2.1%(+1.13)#78 | 2.1%(+1.14)#4,724 |
| 79. | 97225 | 3.2% | 2.1%(+1.09)#79 | 2.1%(+1.10)#4,841 |
| 80. | 97203 | 3.2% | 2.1%(+1.06)#80 | 2.1%(+1.08)#4,906 |
| 81. | 97455 | 3.1% | 2.1%(+1.05)#81 | 2.1%(+1.06)#4,953 |
| 82. | 97702 | 3.1% | 2.1%(+0.993)#82 | 2.1%(+1.00)#5,100 |
| 83. | 97504 | 3.0% | 2.1%(+0.951)#83 | 2.1%(+0.963)#5,231 |
| 84. | 97522 | 3.0% | 2.1%(+0.936)#84 | 2.1%(+0.948)#5,267 |
| 85. | 97496 | 3.0% | 2.1%(+0.876)#85 | 2.1%(+0.888)#5,446 |
| 86. | 97201 | 3.0% | 2.1%(+0.864)#86 | 2.1%(+0.876)#5,481 |
| 87. | 97027 | 3.0% | 2.1%(+0.861)#87 | 2.1%(+0.873)#5,491 |
| 88. | 97239 | 2.9% | 2.1%(+0.829)#88 | 2.1%(+0.841)#5,584 |
| 89. | 97827 | 2.9% | 2.1%(+0.824)#89 | 2.1%(+0.836)#5,601 |
| 90. | 97801 | 2.8% | 2.1%(+0.749)#90 | 2.1%(+0.761)#5,841 |
| 91. | 97030 | 2.8% | 2.1%(+0.737)#91 | 2.1%(+0.750)#5,880 |
| 92. | 97068 | 2.8% | 2.1%(+0.701)#92 | 2.1%(+0.713)#6,015 |
| 93. | 97814 | 2.8% | 2.1%(+0.685)#93 | 2.1%(+0.697)#6,067 |
| 94. | 97131 | 2.8% | 2.1%(+0.678)#94 | 2.1%(+0.690)#6,091 |
| 95. | 97703 | 2.8% | 2.1%(+0.676)#95 | 2.1%(+0.688)#6,100 |
| 96. | 97009 | 2.6% | 2.1%(+0.524)#96 | 2.1%(+0.536)#6,677 |
| 97. | 97471 | 2.6% | 2.1%(+0.522)#97 | 2.1%(+0.534)#6,684 |
| 98. | 97070 | 2.6% | 2.1%(+0.515)#98 | 2.1%(+0.527)#6,715 |
| 99. | 97383 | 2.6% | 2.1%(+0.485)#99 | 2.1%(+0.497)#6,840 |
| 100. | 97759 | 2.6% | 2.1%(+0.461)#100 | 2.1%(+0.473)#6,930 |
Common Questions
What are the Top 10 Zip Codes with the Highest Percentage of Population Employed in Arts, Entertainment & Recreation in Oregon?
Top 10 Zip Codes with the Highest Percentage of Population Employed in Arts, Entertainment & Recreation in Oregon are:
What zip code has the Highest Percentage of Population Employed in Arts, Entertainment & Recreation in Oregon?
97441 has the Highest Percentage of Population Employed in Arts, Entertainment & Recreation in Oregon with 41.2%.
What is the Percentage of Population Employed in Arts, Entertainment & Recreation in the State of Oregon?
Percentage of Population Employed in Arts, Entertainment & Recreation in Oregon is 2.1%.
What is the Percentage of Population Employed in Arts, Entertainment & Recreation in the United States?
Percentage of Population Employed in Arts, Entertainment & Recreation in the United States is 2.1%.