Zip Codes with the Highest Percentage of Single Fathers in Oregon
RELATED REPORTS & OPTIONS
Most Single Fathers
Oregon
Compare Zip Codes
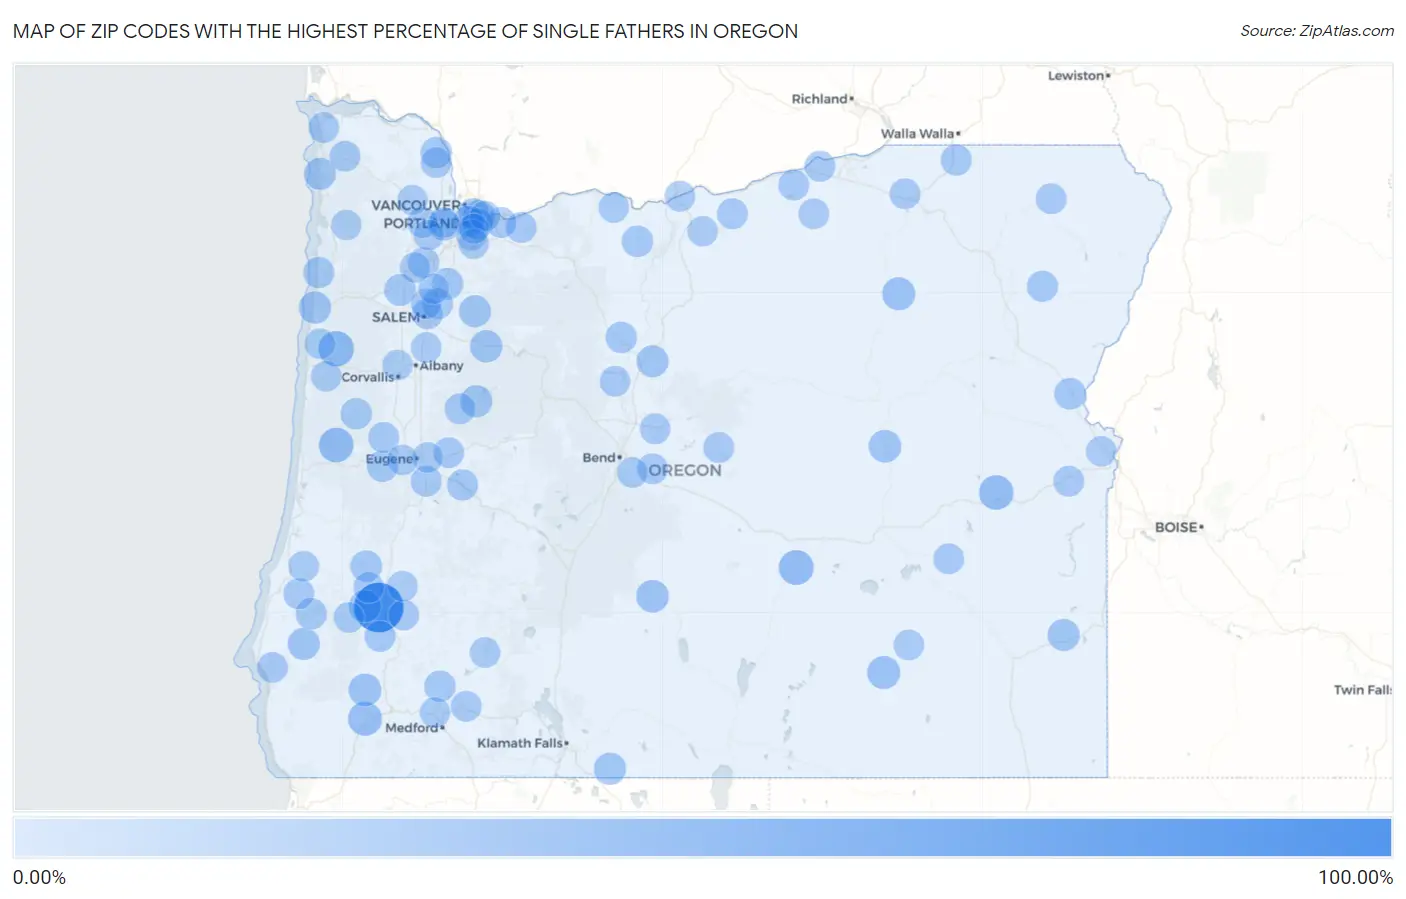
Map of Zip Codes with the Highest Percentage of Single Fathers in Oregon
0.00%
100.00%
Zip Codes with the Highest Percentage of Single Fathers in Oregon
| Zip Code | % Single Fathers | vs State | vs National | |
| 1. | 97432 | 100.00% | 4.41%(+95.6)#1 | 4.16%(+95.8)#2 |
| 2. | 97357 | 29.63% | 4.41%(+25.2)#2 | 4.16%(+25.5)#203 |
| 3. | 97758 | 26.67% | 4.41%(+22.3)#3 | 4.16%(+22.5)#275 |
| 4. | 97480 | 25.74% | 4.41%(+21.3)#4 | 4.16%(+21.6)#303 |
| 5. | 97911 | 25.00% | 4.41%(+20.6)#5 | 4.16%(+20.8)#324 |
| 6. | 97543 | 22.22% | 4.41%(+17.8)#6 | 4.16%(+18.1)#396 |
| 7. | 97736 | 17.86% | 4.41%(+13.4)#7 | 4.16%(+13.7)#619 |
| 8. | 97880 | 17.81% | 4.41%(+13.4)#8 | 4.16%(+13.7)#621 |
| 9. | 97532 | 16.56% | 4.41%(+12.2)#9 | 4.16%(+12.4)#732 |
| 10. | 97638 | 16.00% | 4.41%(+11.6)#10 | 4.16%(+11.8)#783 |
| 11. | 97873 | 15.56% | 4.41%(+11.1)#11 | 4.16%(+11.4)#831 |
| 12. | 97360 | 15.03% | 4.41%(+10.6)#12 | 4.16%(+10.9)#887 |
| 13. | 97364 | 14.41% | 4.41%(+10.00)#13 | 4.16%(+10.2)#964 |
| 14. | 97466 | 14.24% | 4.41%(+9.83)#14 | 4.16%(+10.1)#993 |
| 15. | 97481 | 14.02% | 4.41%(+9.62)#15 | 4.16%(+9.87)#1,021 |
| 16. | 97910 | 13.64% | 4.41%(+9.23)#16 | 4.16%(+9.48)#1,101 |
| 17. | 97632 | 13.56% | 4.41%(+9.16)#17 | 4.16%(+9.41)#1,118 |
| 18. | 97345 | 13.42% | 4.41%(+9.02)#18 | 4.16%(+9.27)#1,144 |
| 19. | 97741 | 13.25% | 4.41%(+8.84)#19 | 4.16%(+9.09)#1,184 |
| 20. | 97375 | 13.19% | 4.41%(+8.78)#20 | 4.16%(+9.03)#1,194 |
| 21. | 97102 | 12.74% | 4.41%(+8.33)#21 | 4.16%(+8.58)#1,301 |
| 22. | 97220 | 12.35% | 4.41%(+7.95)#22 | 4.16%(+8.20)#1,394 |
| 23. | 97101 | 11.82% | 4.41%(+7.41)#23 | 4.16%(+7.66)#1,552 |
| 24. | 97071 | 11.54% | 4.41%(+7.13)#24 | 4.16%(+7.38)#1,634 |
| 25. | 97486 | 11.16% | 4.41%(+6.75)#25 | 4.16%(+7.00)#1,762 |
| 26. | 97907 | 10.98% | 4.41%(+6.57)#26 | 4.16%(+6.82)#1,827 |
| 27. | 97761 | 10.15% | 4.41%(+5.75)#27 | 4.16%(+6.00)#2,125 |
| 28. | 97021 | 10.10% | 4.41%(+5.70)#28 | 4.16%(+5.95)#2,146 |
| 29. | 97324 | 10.07% | 4.41%(+5.66)#29 | 4.16%(+5.91)#2,165 |
| 30. | 97503 | 9.85% | 4.41%(+5.44)#30 | 4.16%(+5.69)#2,298 |
| 31. | 97054 | 9.72% | 4.41%(+5.31)#31 | 4.16%(+5.56)#2,382 |
| 32. | 97487 | 9.28% | 4.41%(+4.88)#32 | 4.16%(+5.13)#2,618 |
| 33. | 97218 | 9.26% | 4.41%(+4.86)#33 | 4.16%(+5.11)#2,632 |
| 34. | 97458 | 9.12% | 4.41%(+4.71)#34 | 4.16%(+4.96)#2,731 |
| 35. | 97135 | 9.11% | 4.41%(+4.70)#35 | 4.16%(+4.95)#2,742 |
| 36. | 97862 | 8.85% | 4.41%(+4.44)#36 | 4.16%(+4.69)#2,928 |
| 37. | 97883 | 8.57% | 4.41%(+4.16)#37 | 4.16%(+4.41)#3,159 |
| 38. | 97469 | 8.56% | 4.41%(+4.15)#38 | 4.16%(+4.40)#3,179 |
| 39. | 97452 | 8.51% | 4.41%(+4.10)#39 | 4.16%(+4.35)#3,214 |
| 40. | 97003 | 8.34% | 4.41%(+3.93)#40 | 4.16%(+4.18)#3,363 |
| 41. | 97305 | 8.24% | 4.41%(+3.84)#41 | 4.16%(+4.09)#3,449 |
| 42. | 97216 | 8.14% | 4.41%(+3.73)#42 | 4.16%(+3.98)#3,552 |
| 43. | 97426 | 8.13% | 4.41%(+3.72)#43 | 4.16%(+3.97)#3,559 |
| 44. | 97754 | 8.03% | 4.41%(+3.63)#44 | 4.16%(+3.88)#3,659 |
| 45. | 97232 | 7.98% | 4.41%(+3.57)#45 | 4.16%(+3.82)#3,746 |
| 46. | 97115 | 7.94% | 4.41%(+3.54)#46 | 4.16%(+3.79)#3,777 |
| 47. | 97301 | 7.68% | 4.41%(+3.28)#47 | 4.16%(+3.53)#4,066 |
| 48. | 97386 | 7.64% | 4.41%(+3.23)#48 | 4.16%(+3.48)#4,119 |
| 49. | 97818 | 7.48% | 4.41%(+3.08)#49 | 4.16%(+3.33)#4,312 |
| 50. | 97918 | 7.28% | 4.41%(+2.87)#50 | 4.16%(+3.12)#4,575 |
| 51. | 97844 | 7.27% | 4.41%(+2.87)#51 | 4.16%(+3.12)#4,584 |
| 52. | 97471 | 7.24% | 4.41%(+2.83)#52 | 4.16%(+3.08)#4,642 |
| 53. | 97423 | 7.24% | 4.41%(+2.83)#53 | 4.16%(+3.08)#4,644 |
| 54. | 97701 | 7.16% | 4.41%(+2.75)#54 | 4.16%(+3.00)#4,743 |
| 55. | 97885 | 7.14% | 4.41%(+2.74)#55 | 4.16%(+2.99)#4,761 |
| 56. | 97732 | 7.14% | 4.41%(+2.74)#56 | 4.16%(+2.99)#4,779 |
| 57. | 97051 | 7.13% | 4.41%(+2.72)#57 | 4.16%(+2.97)#4,796 |
| 58. | 97419 | 7.11% | 4.41%(+2.71)#58 | 4.16%(+2.96)#4,813 |
| 59. | 97812 | 7.11% | 4.41%(+2.70)#59 | 4.16%(+2.95)#4,830 |
| 60. | 97524 | 7.06% | 4.41%(+2.65)#60 | 4.16%(+2.90)#4,912 |
| 61. | 97146 | 7.05% | 4.41%(+2.64)#61 | 4.16%(+2.89)#4,924 |
| 62. | 97465 | 6.90% | 4.41%(+2.50)#62 | 4.16%(+2.75)#5,146 |
| 63. | 97019 | 6.81% | 4.41%(+2.40)#63 | 4.16%(+2.66)#5,286 |
| 64. | 97457 | 6.79% | 4.41%(+2.39)#64 | 4.16%(+2.64)#5,313 |
| 65. | 97801 | 6.75% | 4.41%(+2.35)#65 | 4.16%(+2.60)#5,373 |
| 66. | 97478 | 6.70% | 4.41%(+2.29)#66 | 4.16%(+2.54)#5,453 |
| 67. | 97060 | 6.70% | 4.41%(+2.29)#67 | 4.16%(+2.54)#5,454 |
| 68. | 97753 | 6.67% | 4.41%(+2.26)#68 | 4.16%(+2.51)#5,517 |
| 69. | 97050 | 6.67% | 4.41%(+2.26)#69 | 4.16%(+2.51)#5,528 |
| 70. | 97721 | 6.67% | 4.41%(+2.26)#70 | 4.16%(+2.51)#5,529 |
| 71. | 97138 | 6.66% | 4.41%(+2.25)#71 | 4.16%(+2.50)#5,546 |
| 72. | 97420 | 6.58% | 4.41%(+2.18)#72 | 4.16%(+2.43)#5,665 |
| 73. | 97303 | 6.46% | 4.41%(+2.06)#73 | 4.16%(+2.31)#5,863 |
| 74. | 97113 | 6.46% | 4.41%(+2.05)#74 | 4.16%(+2.30)#5,866 |
| 75. | 97734 | 6.41% | 4.41%(+2.00)#75 | 4.16%(+2.25)#5,978 |
| 76. | 97536 | 6.40% | 4.41%(+1.99)#76 | 4.16%(+2.24)#6,004 |
| 77. | 97391 | 6.35% | 4.41%(+1.94)#77 | 4.16%(+2.19)#6,092 |
| 78. | 97026 | 6.30% | 4.41%(+1.89)#78 | 4.16%(+2.14)#6,195 |
| 79. | 97470 | 6.25% | 4.41%(+1.84)#79 | 4.16%(+2.09)#6,299 |
| 80. | 97222 | 6.24% | 4.41%(+1.83)#80 | 4.16%(+2.08)#6,323 |
| 81. | 97380 | 6.21% | 4.41%(+1.80)#81 | 4.16%(+2.05)#6,371 |
| 82. | 97416 | 6.15% | 4.41%(+1.75)#82 | 4.16%(+2.00)#6,486 |
| 83. | 97477 | 6.14% | 4.41%(+1.74)#83 | 4.16%(+1.99)#6,505 |
| 84. | 97839 | 6.10% | 4.41%(+1.69)#84 | 4.16%(+1.94)#6,611 |
| 85. | 97702 | 6.08% | 4.41%(+1.67)#85 | 4.16%(+1.92)#6,649 |
| 86. | 97330 | 6.04% | 4.41%(+1.63)#86 | 4.16%(+1.88)#6,734 |
| 87. | 97352 | 6.03% | 4.41%(+1.62)#87 | 4.16%(+1.87)#6,753 |
| 88. | 97006 | 6.00% | 4.41%(+1.60)#88 | 4.16%(+1.85)#6,810 |
| 89. | 97230 | 6.00% | 4.41%(+1.59)#89 | 4.16%(+1.85)#6,814 |
| 90. | 97040 | 5.96% | 4.41%(+1.56)#90 | 4.16%(+1.81)#6,909 |
| 91. | 97914 | 5.95% | 4.41%(+1.55)#91 | 4.16%(+1.80)#6,930 |
| 92. | 97141 | 5.81% | 4.41%(+1.40)#92 | 4.16%(+1.65)#7,287 |
| 93. | 97123 | 5.77% | 4.41%(+1.36)#93 | 4.16%(+1.61)#7,380 |
| 94. | 97027 | 5.70% | 4.41%(+1.29)#94 | 4.16%(+1.54)#7,534 |
| 95. | 97106 | 5.66% | 4.41%(+1.25)#95 | 4.16%(+1.50)#7,618 |
| 96. | 97127 | 5.57% | 4.41%(+1.16)#96 | 4.16%(+1.41)#7,836 |
| 97. | 97402 | 5.53% | 4.41%(+1.12)#97 | 4.16%(+1.37)#7,939 |
| 98. | 97206 | 5.52% | 4.41%(+1.11)#98 | 4.16%(+1.36)#7,956 |
| 99. | 97502 | 5.48% | 4.41%(+1.08)#99 | 4.16%(+1.33)#8,041 |
| 100. | 97039 | 5.45% | 4.41%(+1.05)#100 | 4.16%(+1.30)#8,127 |
Common Questions
What are the Top 10 Zip Codes with the Highest Percentage of Single Fathers in Oregon?
Top 10 Zip Codes with the Highest Percentage of Single Fathers in Oregon are:
What zip code has the Highest Percentage of Single Fathers in Oregon?
97432 has the Highest Percentage of Single Fathers in Oregon with 100.00%.
What is the Percentage of Single Fathers in the State of Oregon?
Percentage of Single Fathers in Oregon is 4.41%.
What is the Percentage of Single Fathers in the United States?
Percentage of Single Fathers in the United States is 4.16%.