Zip Codes with the Highest Percentage of Population Employed in Farming, Fishing & Forestry in Grants Pass, OR
RELATED REPORTS & OPTIONS
Farming, Fishing & Forestry
Grants Pass
Compare Zip Codes
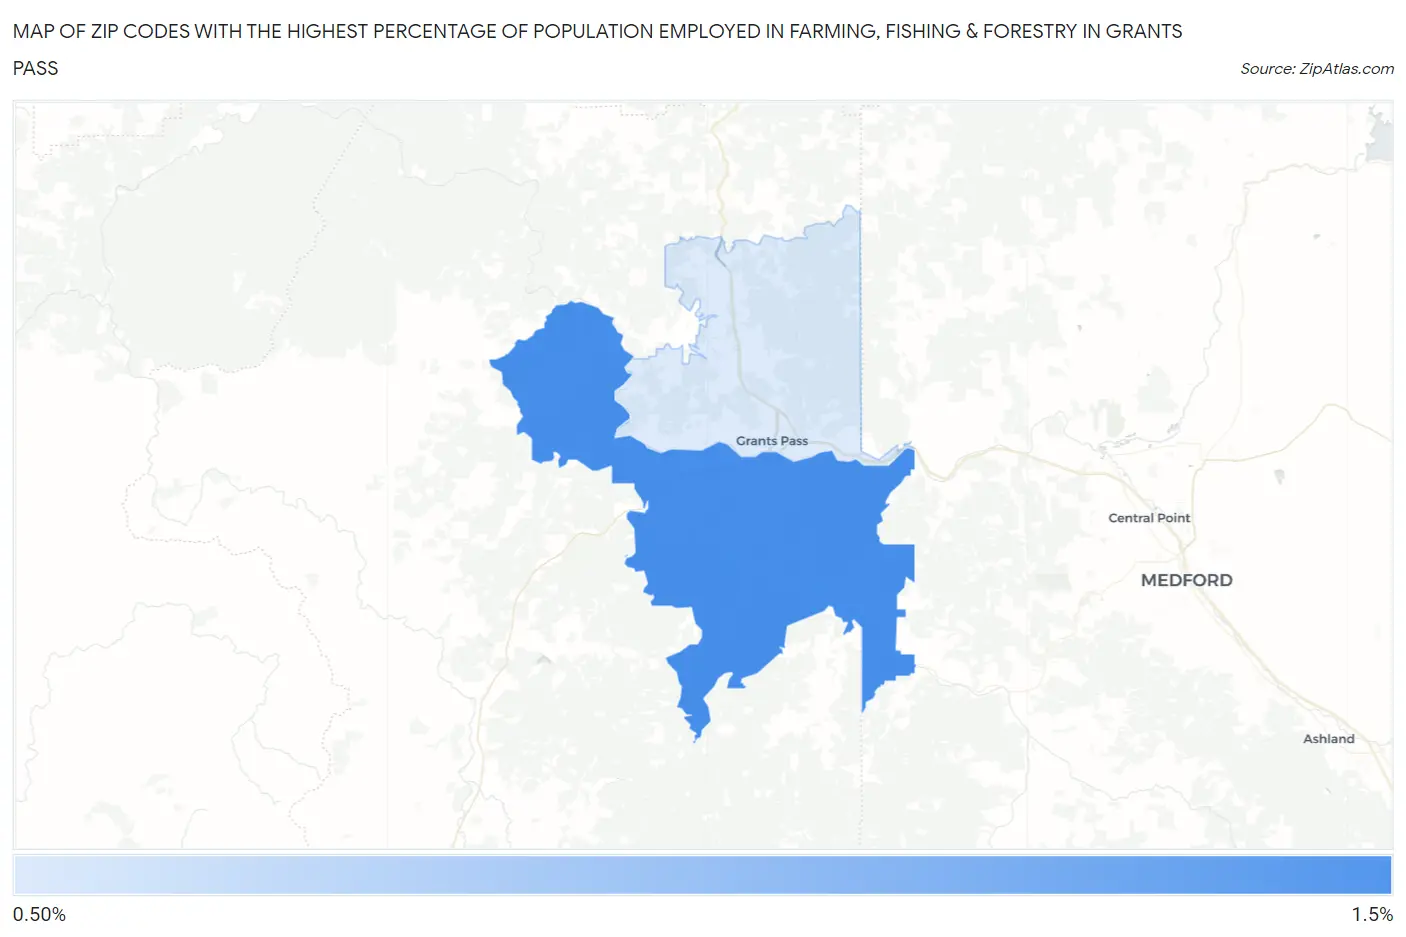
Map of Zip Codes with the Highest Percentage of Population Employed in Farming, Fishing & Forestry in Grants Pass
0.0%
1.5%
Zip Codes with the Highest Percentage of Population Employed in Farming, Fishing & Forestry in Grants Pass, OR
| Zip Code | % Employed | vs State | vs National | |
| 1. | 97527 | 1.4% | 1.4%(-0.013)#200 | 0.61%(+0.789)#8,228 |
| 2. | 97526 | 1.3% | 1.4%(-0.094)#203 | 0.61%(+0.708)#8,518 |
1
Common Questions
What are the Top Zip Codes with the Highest Percentage of Population Employed in Farming, Fishing & Forestry in Grants Pass, OR?
Top Zip Codes with the Highest Percentage of Population Employed in Farming, Fishing & Forestry in Grants Pass, OR are:
What zip code has the Highest Percentage of Population Employed in Farming, Fishing & Forestry in Grants Pass, OR?
97527 has the Highest Percentage of Population Employed in Farming, Fishing & Forestry in Grants Pass, OR with 1.4%.
What is the Percentage of Population Employed in Farming, Fishing & Forestry in Grants Pass, OR?
Percentage of Population Employed in Farming, Fishing & Forestry in Grants Pass is 0.57%.
What is the Percentage of Population Employed in Farming, Fishing & Forestry in Oregon?
Percentage of Population Employed in Farming, Fishing & Forestry in Oregon is 1.4%.
What is the Percentage of Population Employed in Farming, Fishing & Forestry in the United States?
Percentage of Population Employed in Farming, Fishing & Forestry in the United States is 0.61%.