Zip Codes with the Highest Percentage of Population Employed in Farming, Fishing & Forestry in Stillwater, OK
RELATED REPORTS & OPTIONS
Farming, Fishing & Forestry
Stillwater
Compare Zip Codes
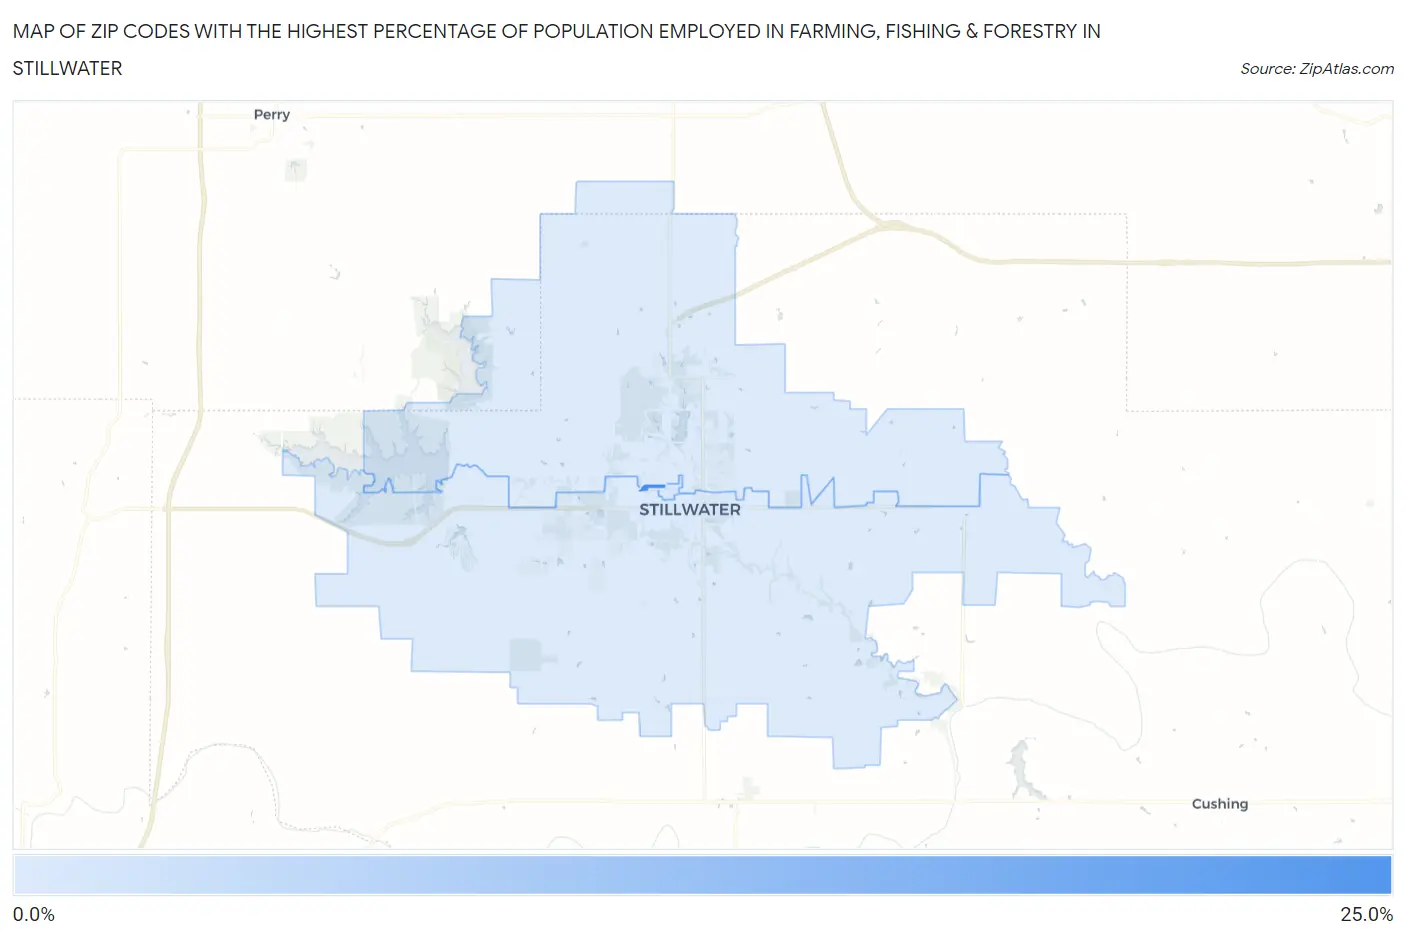
Map of Zip Codes with the Highest Percentage of Population Employed in Farming, Fishing & Forestry in Stillwater
0.0%
25.0%
Zip Codes with the Highest Percentage of Population Employed in Farming, Fishing & Forestry in Stillwater, OK
| Zip Code | % Employed | vs State | vs National | |
| 1. | 74078 | 21.1% | 0.66%(+20.5)#8 | 0.61%(+20.5)#367 |
| 2. | 74077 | 1.7% | 0.66%(+1.04)#215 | 0.61%(+1.09)#7,295 |
| 3. | 74075 | 1.0% | 0.66%(+0.350)#281 | 0.61%(+0.410)#9,677 |
| 4. | 74074 | 0.88% | 0.66%(+0.214)#301 | 0.61%(+0.273)#10,343 |
1
Common Questions
What are the Top 3 Zip Codes with the Highest Percentage of Population Employed in Farming, Fishing & Forestry in Stillwater, OK?
Top 3 Zip Codes with the Highest Percentage of Population Employed in Farming, Fishing & Forestry in Stillwater, OK are:
What zip code has the Highest Percentage of Population Employed in Farming, Fishing & Forestry in Stillwater, OK?
74078 has the Highest Percentage of Population Employed in Farming, Fishing & Forestry in Stillwater, OK with 21.1%.
What is the Percentage of Population Employed in Farming, Fishing & Forestry in Stillwater, OK?
Percentage of Population Employed in Farming, Fishing & Forestry in Stillwater is 1.0%.
What is the Percentage of Population Employed in Farming, Fishing & Forestry in Oklahoma?
Percentage of Population Employed in Farming, Fishing & Forestry in Oklahoma is 0.66%.
What is the Percentage of Population Employed in Farming, Fishing & Forestry in the United States?
Percentage of Population Employed in Farming, Fishing & Forestry in the United States is 0.61%.