Zip Codes with the Highest Percentage of Population Walking to Work in Ponca City, OK
RELATED REPORTS & OPTIONS
Walk to Work
Ponca City
Compare Zip Codes
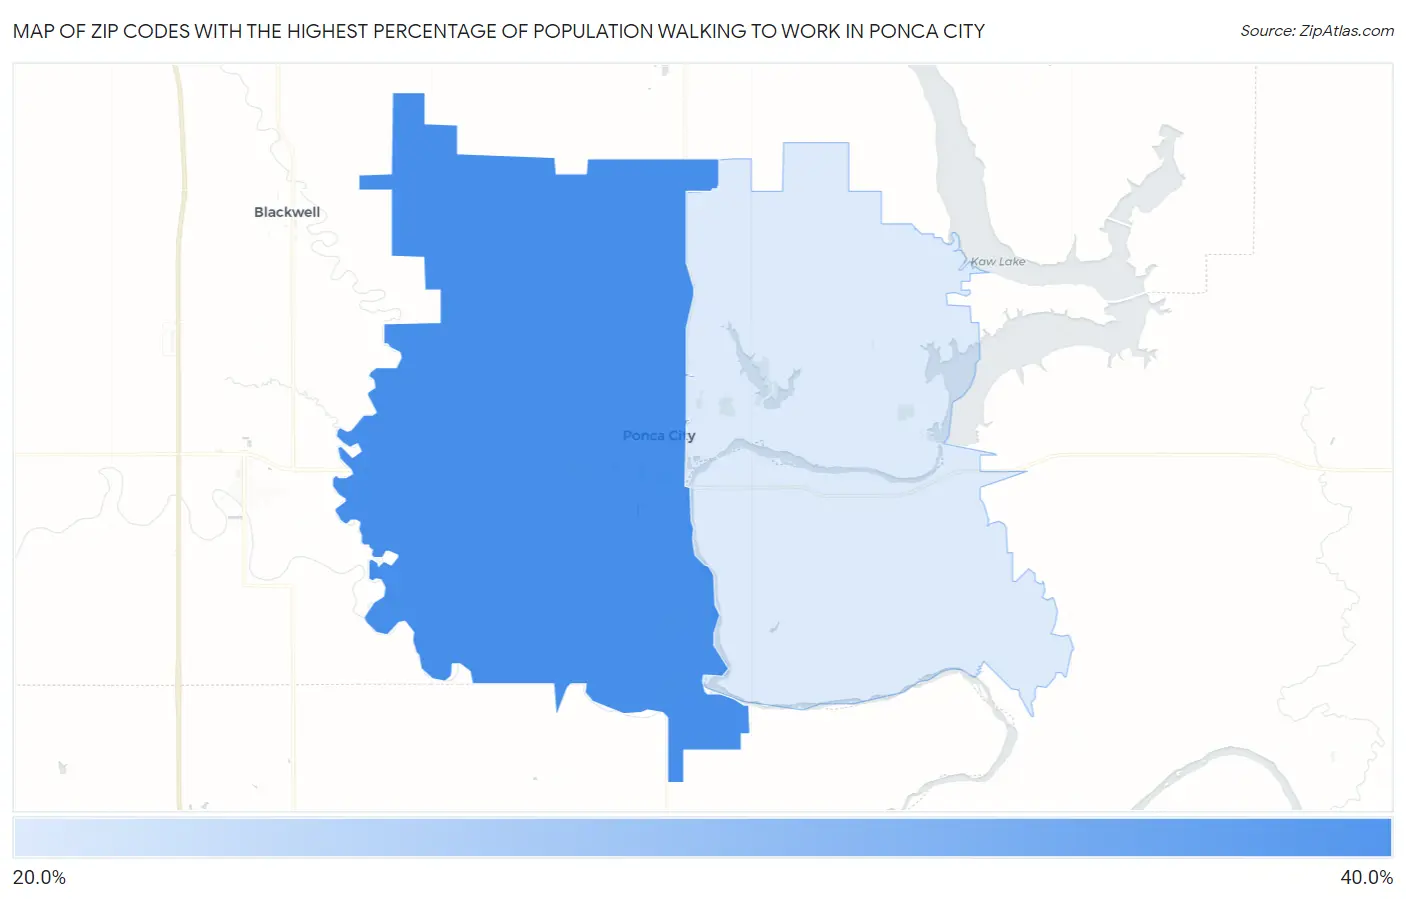
Map of Zip Codes with the Highest Percentage of Population Walking to Work in Ponca City
25.9%
36.7%
Zip Codes with the Highest Percentage of Population Walking to Work in Ponca City, OK
| Zip Code | % Walk to Work | vs State | vs National | |
| 1. | 74601 | 36.7% | 33.5%(+3.20)#151 | 33.4%(+3.30)#9,801 |
| 2. | 74604 | 25.9% | 33.5%(-7.60)#248 | 33.4%(-7.50)#14,027 |
1
Common Questions
What are the Top Zip Codes with the Highest Percentage of Population Walking to Work in Ponca City, OK?
Top Zip Codes with the Highest Percentage of Population Walking to Work in Ponca City, OK are:
What zip code has the Highest Percentage of Population Walking to Work in Ponca City, OK?
74601 has the Highest Percentage of Population Walking to Work in Ponca City, OK with 36.7%.
What is the Percentage of Population Walking to Work in Ponca City, OK?
Percentage of Population Walking to Work in Ponca City is 33.9%.
What is the Percentage of Population Walking to Work in Oklahoma?
Percentage of Population Walking to Work in Oklahoma is 33.5%.
What is the Percentage of Population Walking to Work in the United States?
Percentage of Population Walking to Work in the United States is 33.4%.