Zip Codes with the Lowest Percentage of Renter-Occupied Units in Ponca City, OK
RELATED REPORTS & OPTIONS
Lowest Renter-Occupied
Ponca City
Compare Zip Codes
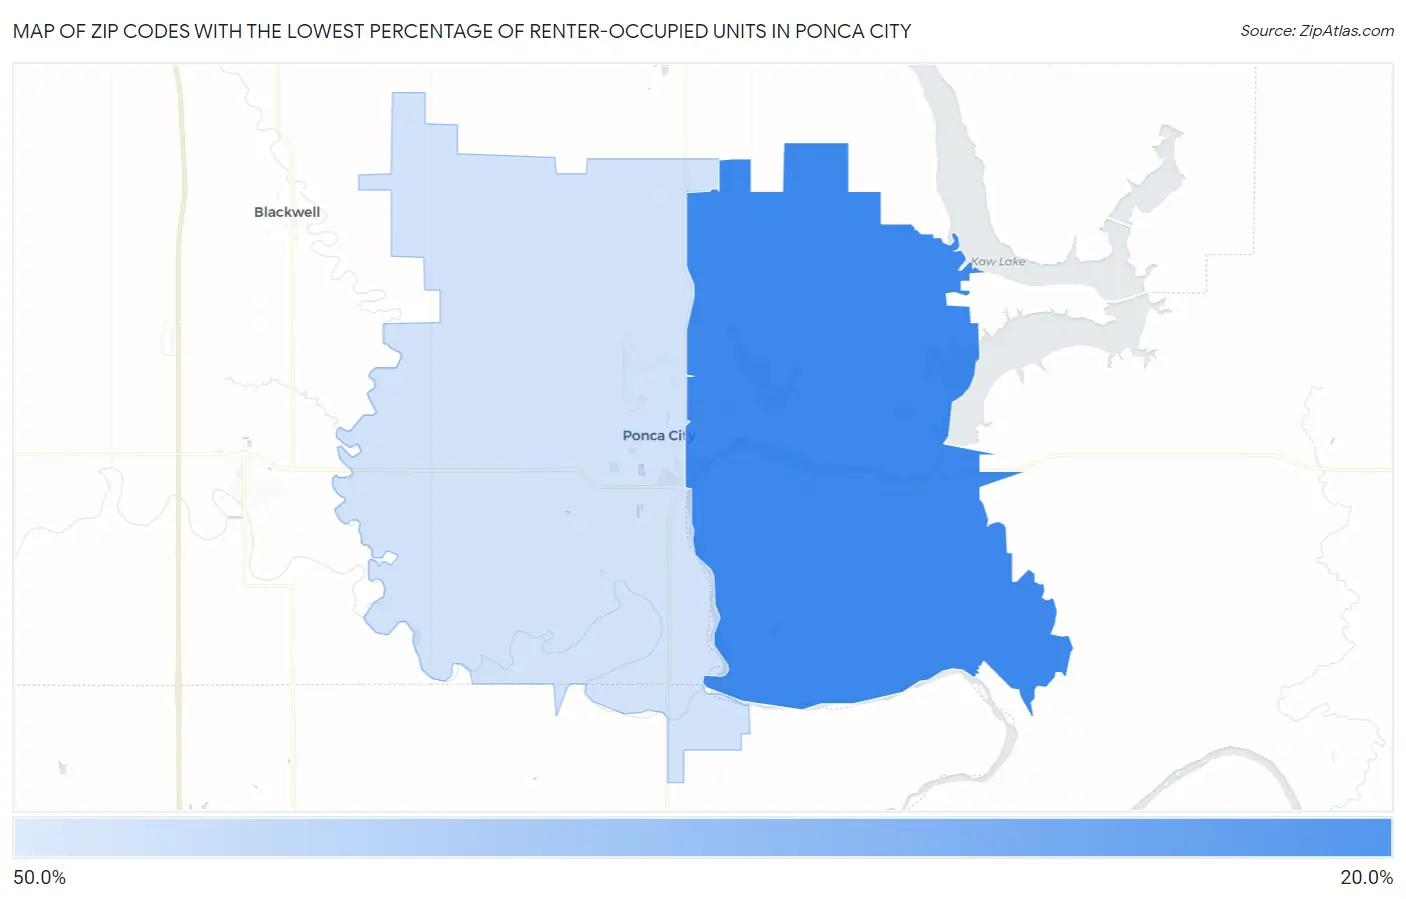
Map of Zip Codes with the Lowest Percentage of Renter-Occupied Units in Ponca City
41.5%
21.6%
Zip Codes with the Lowest Percentage of Renter-Occupied Units in Ponca City, OK
| Zip Code | % Renter-Occupied | vs State | vs National | |
| 1. | 74604 | 21.6% | 34.1%(-12.4)#276 | 35.2%(-13.5)#14,428 |
| 2. | 74601 | 41.5% | 34.1%(+7.40)#556 | 35.2%(+6.27)#26,129 |
1
Common Questions
What are the Top Zip Codes with the Lowest Percentage of Renter-Occupied Units in Ponca City, OK?
Top Zip Codes with the Lowest Percentage of Renter-Occupied Units in Ponca City, OK are:
What zip code has the Lowest Percentage of Renter-Occupied Units in Ponca City, OK?
74604 has the Lowest Percentage of Renter-Occupied Units in Ponca City, OK with 21.6%.
What is the Percentage of Renter-Occupied Units in Ponca City, OK?
Percentage of Renter-Occupied Units in Ponca City is 38.4%.
What is the Percentage of Renter-Occupied Units in Oklahoma?
Percentage of Renter-Occupied Units in Oklahoma is 34.1%.
What is the Percentage of Renter-Occupied Units in the United States?
Percentage of Renter-Occupied Units in the United States is 35.2%.