Zip Codes with the Highest Percentage of Population Employed in Arts, Entertainment & Recreation in Ohio
RELATED REPORTS & OPTIONS
Arts, Entertainment & Recreation
Ohio
Compare Zip Codes
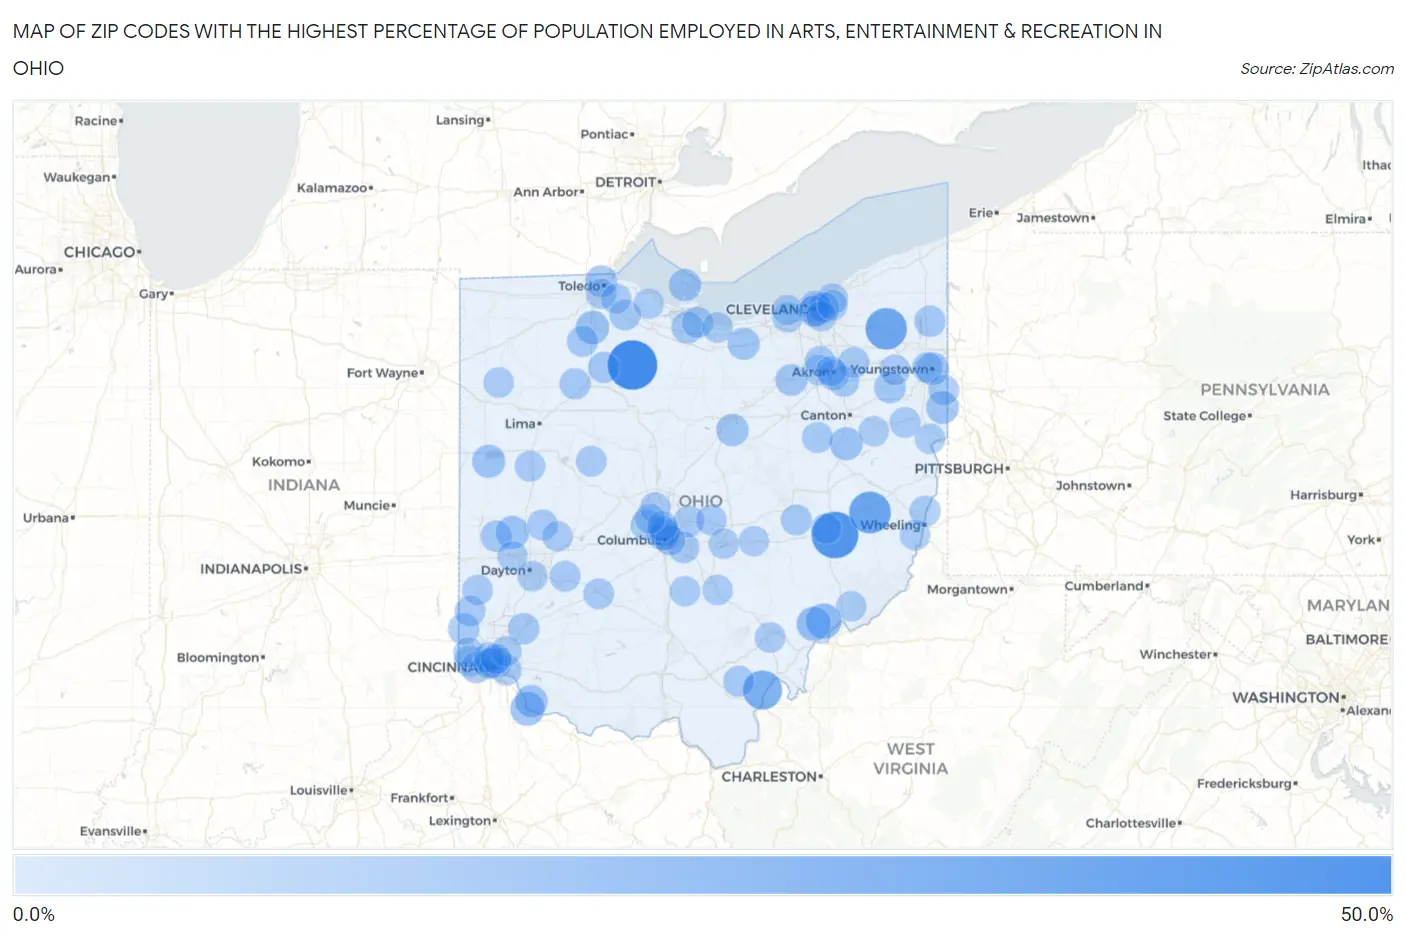
Map of Zip Codes with the Highest Percentage of Population Employed in Arts, Entertainment & Recreation in Ohio
0.0%
50.0%
Zip Codes with the Highest Percentage of Population Employed in Arts, Entertainment & Recreation in Ohio
| Zip Code | % Employed | vs State | vs National | |
| 1. | 44809 | 45.7% | 1.7%(+44.0)#1 | 2.1%(+43.6)#42 |
| 2. | 43750 | 39.1% | 1.7%(+37.5)#2 | 2.1%(+37.0)#53 |
| 3. | 43983 | 28.3% | 1.7%(+26.7)#3 | 2.1%(+26.3)#89 |
| 4. | 44080 | 27.5% | 1.7%(+25.8)#4 | 2.1%(+25.4)#97 |
| 5. | 45620 | 22.3% | 1.7%(+20.6)#5 | 2.1%(+20.2)#147 |
| 6. | 45729 | 14.4% | 1.7%(+12.8)#6 | 2.1%(+12.4)#366 |
| 7. | 45784 | 11.6% | 1.7%(+9.91)#7 | 2.1%(+9.51)#548 |
| 8. | 45156 | 11.1% | 1.7%(+9.43)#8 | 2.1%(+9.03)#594 |
| 9. | 43403 | 9.9% | 1.7%(+8.23)#9 | 2.1%(+7.83)#718 |
| 10. | 45339 | 9.3% | 1.7%(+7.61)#10 | 2.1%(+7.21)#808 |
| 11. | 44697 | 9.2% | 1.7%(+7.50)#11 | 2.1%(+7.09)#825 |
| 12. | 45866 | 9.1% | 1.7%(+7.41)#12 | 2.1%(+7.01)#839 |
| 13. | 44413 | 8.3% | 1.7%(+6.61)#13 | 2.1%(+6.21)#988 |
| 14. | 44555 | 8.2% | 1.7%(+6.57)#14 | 2.1%(+6.16)#994 |
| 15. | 45153 | 8.1% | 1.7%(+6.37)#15 | 2.1%(+5.97)#1,046 |
| 16. | 44843 | 7.8% | 1.7%(+6.10)#16 | 2.1%(+5.69)#1,114 |
| 17. | 44115 | 7.6% | 1.7%(+5.89)#17 | 2.1%(+5.49)#1,165 |
| 18. | 43456 | 7.3% | 1.7%(+5.57)#18 | 2.1%(+5.17)#1,252 |
| 19. | 44049 | 7.0% | 1.7%(+5.30)#19 | 2.1%(+4.89)#1,343 |
| 20. | 44824 | 7.0% | 1.7%(+5.28)#20 | 2.1%(+4.87)#1,348 |
| 21. | 43210 | 6.6% | 1.7%(+4.93)#21 | 2.1%(+4.52)#1,455 |
| 22. | 43610 | 6.4% | 1.7%(+4.68)#22 | 2.1%(+4.28)#1,556 |
| 23. | 44273 | 6.3% | 1.7%(+4.61)#23 | 2.1%(+4.21)#1,593 |
| 24. | 44449 | 5.9% | 1.7%(+4.23)#24 | 2.1%(+3.82)#1,745 |
| 25. | 45358 | 5.7% | 1.7%(+4.05)#25 | 2.1%(+3.65)#1,833 |
| 26. | 44804 | 5.5% | 1.7%(+3.80)#26 | 2.1%(+3.40)#1,978 |
| 27. | 45206 | 5.4% | 1.7%(+3.75)#27 | 2.1%(+3.35)#2,004 |
| 28. | 45034 | 5.3% | 1.7%(+3.66)#28 | 2.1%(+3.26)#2,058 |
| 29. | 45001 | 5.3% | 1.7%(+3.60)#29 | 2.1%(+3.19)#2,093 |
| 30. | 45053 | 5.3% | 1.7%(+3.59)#30 | 2.1%(+3.19)#2,094 |
| 31. | 43109 | 5.3% | 1.7%(+3.58)#31 | 2.1%(+3.18)#2,106 |
| 32. | 44417 | 5.2% | 1.7%(+3.54)#32 | 2.1%(+3.13)#2,143 |
| 33. | 45816 | 5.0% | 1.7%(+3.36)#33 | 2.1%(+2.96)#2,259 |
| 34. | 43971 | 5.0% | 1.7%(+3.27)#34 | 2.1%(+2.87)#2,320 |
| 35. | 44870 | 4.8% | 1.7%(+3.17)#35 | 2.1%(+2.76)#2,400 |
| 36. | 43469 | 4.8% | 1.7%(+3.08)#36 | 2.1%(+2.67)#2,480 |
| 37. | 44250 | 4.7% | 1.7%(+3.03)#37 | 2.1%(+2.63)#2,515 |
| 38. | 43462 | 4.7% | 1.7%(+3.02)#38 | 2.1%(+2.62)#2,530 |
| 39. | 45051 | 4.7% | 1.7%(+3.01)#39 | 2.1%(+2.60)#2,542 |
| 40. | 44243 | 4.7% | 1.7%(+3.00)#40 | 2.1%(+2.60)#2,547 |
| 41. | 43802 | 4.7% | 1.7%(+2.98)#41 | 2.1%(+2.57)#2,570 |
| 42. | 43002 | 4.6% | 1.7%(+2.91)#42 | 2.1%(+2.51)#2,634 |
| 43. | 44689 | 4.5% | 1.7%(+2.83)#43 | 2.1%(+2.42)#2,735 |
| 44. | 45686 | 4.5% | 1.7%(+2.77)#44 | 2.1%(+2.37)#2,796 |
| 45. | 44114 | 4.4% | 1.7%(+2.75)#45 | 2.1%(+2.34)#2,820 |
| 46. | 45312 | 4.4% | 1.7%(+2.73)#46 | 2.1%(+2.32)#2,845 |
| 47. | 45384 | 4.3% | 1.7%(+2.66)#47 | 2.1%(+2.26)#2,912 |
| 48. | 45056 | 4.3% | 1.7%(+2.63)#48 | 2.1%(+2.23)#2,953 |
| 49. | 44509 | 4.3% | 1.7%(+2.62)#49 | 2.1%(+2.22)#2,964 |
| 50. | 43347 | 4.2% | 1.7%(+2.55)#50 | 2.1%(+2.15)#3,039 |
| 51. | 44117 | 4.2% | 1.7%(+2.53)#51 | 2.1%(+2.12)#3,073 |
| 52. | 44423 | 4.2% | 1.7%(+2.49)#52 | 2.1%(+2.08)#3,119 |
| 53. | 44321 | 4.2% | 1.7%(+2.48)#53 | 2.1%(+2.08)#3,128 |
| 54. | 45230 | 4.1% | 1.7%(+2.46)#54 | 2.1%(+2.05)#3,167 |
| 55. | 44113 | 4.1% | 1.7%(+2.42)#55 | 2.1%(+2.02)#3,204 |
| 56. | 45219 | 4.0% | 1.7%(+2.33)#56 | 2.1%(+1.93)#3,319 |
| 57. | 43142 | 4.0% | 1.7%(+2.32)#57 | 2.1%(+1.92)#3,344 |
| 58. | 44311 | 4.0% | 1.7%(+2.32)#58 | 2.1%(+1.92)#3,346 |
| 59. | 44442 | 4.0% | 1.7%(+2.30)#59 | 2.1%(+1.89)#3,372 |
| 60. | 43054 | 3.9% | 1.7%(+2.25)#60 | 2.1%(+1.85)#3,438 |
| 61. | 43065 | 3.9% | 1.7%(+2.20)#61 | 2.1%(+1.79)#3,516 |
| 62. | 45306 | 3.9% | 1.7%(+2.19)#62 | 2.1%(+1.79)#3,524 |
| 63. | 44839 | 3.9% | 1.7%(+2.18)#63 | 2.1%(+1.77)#3,544 |
| 64. | 44106 | 3.8% | 1.7%(+2.15)#64 | 2.1%(+1.74)#3,593 |
| 65. | 45701 | 3.7% | 1.7%(+2.00)#65 | 2.1%(+1.60)#3,805 |
| 66. | 44429 | 3.7% | 1.7%(+2.00)#66 | 2.1%(+1.60)#3,808 |
| 67. | 43202 | 3.7% | 1.7%(+2.00)#67 | 2.1%(+1.60)#3,809 |
| 68. | 43001 | 3.7% | 1.7%(+1.99)#68 | 2.1%(+1.59)#3,822 |
| 69. | 43201 | 3.6% | 1.7%(+1.94)#69 | 2.1%(+1.54)#3,914 |
| 70. | 45002 | 3.6% | 1.7%(+1.92)#70 | 2.1%(+1.52)#3,947 |
| 71. | 45311 | 3.6% | 1.7%(+1.92)#71 | 2.1%(+1.52)#3,956 |
| 72. | 43205 | 3.6% | 1.7%(+1.90)#72 | 2.1%(+1.50)#3,985 |
| 73. | 45223 | 3.6% | 1.7%(+1.89)#73 | 2.1%(+1.49)#3,996 |
| 74. | 45214 | 3.6% | 1.7%(+1.89)#74 | 2.1%(+1.49)#4,006 |
| 75. | 43725 | 3.6% | 1.7%(+1.89)#75 | 2.1%(+1.48)#4,013 |
| 76. | 43214 | 3.6% | 1.7%(+1.88)#76 | 2.1%(+1.48)#4,017 |
| 77. | 45349 | 3.5% | 1.7%(+1.86)#77 | 2.1%(+1.46)#4,049 |
| 78. | 43906 | 3.5% | 1.7%(+1.86)#78 | 2.1%(+1.45)#4,056 |
| 79. | 43008 | 3.5% | 1.7%(+1.84)#79 | 2.1%(+1.44)#4,088 |
| 80. | 44644 | 3.5% | 1.7%(+1.84)#80 | 2.1%(+1.43)#4,098 |
| 81. | 45788 | 3.5% | 1.7%(+1.82)#81 | 2.1%(+1.41)#4,143 |
| 82. | 43449 | 3.5% | 1.7%(+1.81)#82 | 2.1%(+1.41)#4,153 |
| 83. | 44333 | 3.5% | 1.7%(+1.80)#83 | 2.1%(+1.40)#4,176 |
| 84. | 43155 | 3.5% | 1.7%(+1.80)#84 | 2.1%(+1.39)#4,189 |
| 85. | 43460 | 3.4% | 1.7%(+1.70)#85 | 2.1%(+1.30)#4,403 |
| 86. | 45849 | 3.4% | 1.7%(+1.69)#86 | 2.1%(+1.29)#4,418 |
| 87. | 44105 | 3.3% | 1.7%(+1.67)#87 | 2.1%(+1.26)#4,477 |
| 88. | 44145 | 3.3% | 1.7%(+1.67)#88 | 2.1%(+1.26)#4,480 |
| 89. | 43154 | 3.3% | 1.7%(+1.66)#89 | 2.1%(+1.25)#4,494 |
| 90. | 45315 | 3.3% | 1.7%(+1.62)#90 | 2.1%(+1.22)#4,569 |
| 91. | 44302 | 3.3% | 1.7%(+1.60)#91 | 2.1%(+1.19)#4,627 |
| 92. | 43016 | 3.3% | 1.7%(+1.58)#92 | 2.1%(+1.18)#4,661 |
| 93. | 44121 | 3.2% | 1.7%(+1.56)#93 | 2.1%(+1.15)#4,714 |
| 94. | 43968 | 3.2% | 1.7%(+1.52)#94 | 2.1%(+1.12)#4,804 |
| 95. | 45236 | 3.2% | 1.7%(+1.52)#95 | 2.1%(+1.11)#4,813 |
| 96. | 44140 | 3.2% | 1.7%(+1.51)#96 | 2.1%(+1.10)#4,842 |
| 97. | 45229 | 3.2% | 1.7%(+1.50)#97 | 2.1%(+1.10)#4,858 |
| 98. | 43447 | 3.2% | 1.7%(+1.49)#98 | 2.1%(+1.08)#4,891 |
| 99. | 43740 | 3.1% | 1.7%(+1.47)#99 | 2.1%(+1.07)#4,928 |
| 100. | 45419 | 3.1% | 1.7%(+1.46)#100 | 2.1%(+1.06)#4,950 |
Common Questions
What are the Top 10 Zip Codes with the Highest Percentage of Population Employed in Arts, Entertainment & Recreation in Ohio?
Top 10 Zip Codes with the Highest Percentage of Population Employed in Arts, Entertainment & Recreation in Ohio are:
What zip code has the Highest Percentage of Population Employed in Arts, Entertainment & Recreation in Ohio?
44809 has the Highest Percentage of Population Employed in Arts, Entertainment & Recreation in Ohio with 45.7%.
What is the Percentage of Population Employed in Arts, Entertainment & Recreation in the State of Ohio?
Percentage of Population Employed in Arts, Entertainment & Recreation in Ohio is 1.7%.
What is the Percentage of Population Employed in Arts, Entertainment & Recreation in the United States?
Percentage of Population Employed in Arts, Entertainment & Recreation in the United States is 2.1%.