Zip Codes with the Highest Percentage of Population Employed in Farming, Fishing & Forestry in Hamilton, OH
RELATED REPORTS & OPTIONS
Farming, Fishing & Forestry
Hamilton
Compare Zip Codes
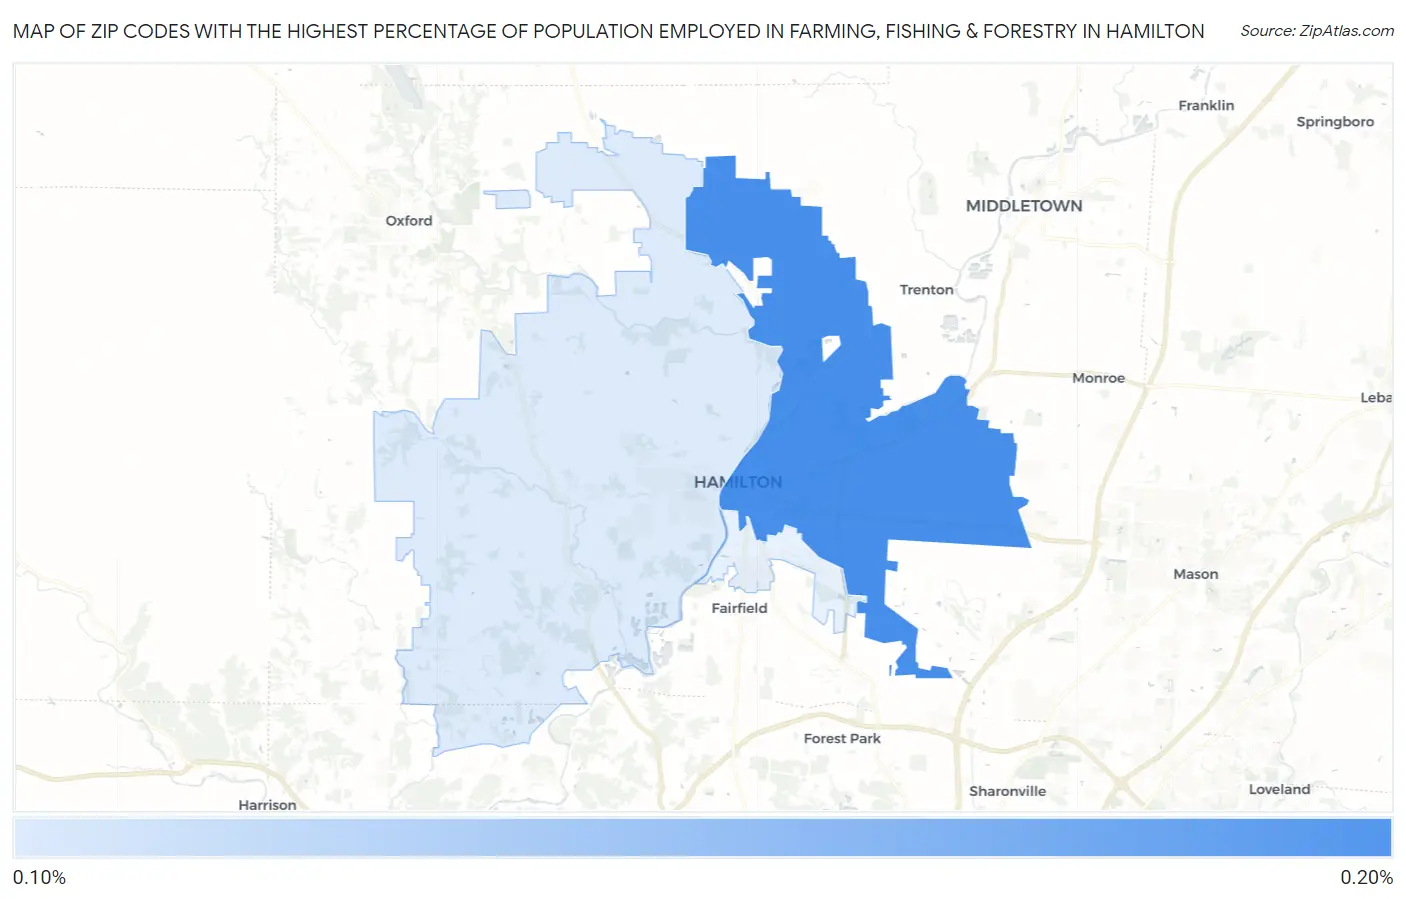
Map of Zip Codes with the Highest Percentage of Population Employed in Farming, Fishing & Forestry in Hamilton
0.0%
0.20%
Zip Codes with the Highest Percentage of Population Employed in Farming, Fishing & Forestry in Hamilton, OH
| Zip Code | % Employed | vs State | vs National | |
| 1. | 45011 | 0.16% | 0.29%(-0.131)#453 | 0.61%(-0.448)#16,794 |
| 2. | 45013 | 0.15% | 0.29%(-0.135)#455 | 0.61%(-0.452)#16,858 |
1
Common Questions
What are the Top Zip Codes with the Highest Percentage of Population Employed in Farming, Fishing & Forestry in Hamilton, OH?
Top Zip Codes with the Highest Percentage of Population Employed in Farming, Fishing & Forestry in Hamilton, OH are:
What zip code has the Highest Percentage of Population Employed in Farming, Fishing & Forestry in Hamilton, OH?
45011 has the Highest Percentage of Population Employed in Farming, Fishing & Forestry in Hamilton, OH with 0.16%.
What is the Percentage of Population Employed in Farming, Fishing & Forestry in Ohio?
Percentage of Population Employed in Farming, Fishing & Forestry in Ohio is 0.29%.
What is the Percentage of Population Employed in Farming, Fishing & Forestry in the United States?
Percentage of Population Employed in Farming, Fishing & Forestry in the United States is 0.61%.