Zip Codes with the Highest Percentage of Households Without a Vehicle in Reno, NV
RELATED REPORTS & OPTIONS
Households without a Cars
Reno
Compare Zip Codes
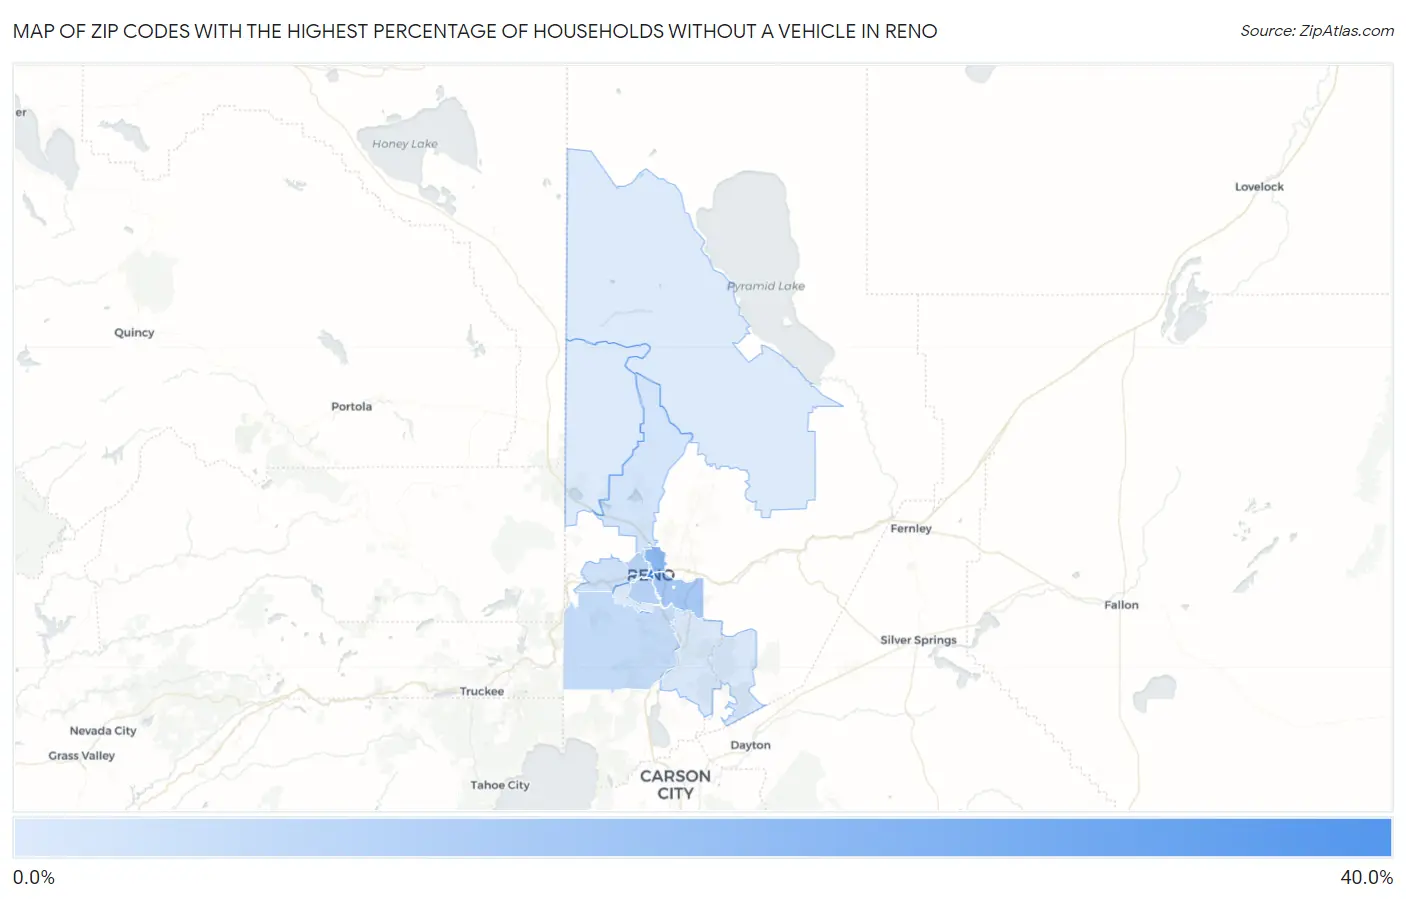
Map of Zip Codes with the Highest Percentage of Households Without a Vehicle in Reno
0.90%
35.1%
Zip Codes with the Highest Percentage of Households Without a Vehicle in Reno, NV
| Zip Code | Housholds Without a Car | vs State | vs National | |
| 1. | 89501 | 35.1% | 7.1%(+28.0)#2 | 8.3%(+26.8)#634 |
| 2. | 89512 | 17.9% | 7.1%(+10.8)#14 | 8.3%(+9.60)#1,795 |
| 3. | 89502 | 12.2% | 7.1%(+5.10)#25 | 8.3%(+3.90)#3,453 |
| 4. | 89509 | 8.3% | 7.1%(+1.20)#34 | 8.3%(=0.000)#6,534 |
| 5. | 89503 | 8.0% | 7.1%(+0.900)#36 | 8.3%(-0.300)#6,916 |
| 6. | 89511 | 6.2% | 7.1%(-0.900)#51 | 8.3%(-2.10)#10,001 |
| 7. | 89523 | 3.5% | 7.1%(-3.60)#79 | 8.3%(-4.80)#17,319 |
| 8. | 89506 | 2.6% | 7.1%(-4.50)#99 | 8.3%(-5.70)#20,395 |
| 9. | 89521 | 1.6% | 7.1%(-5.50)#119 | 8.3%(-6.70)#23,764 |
| 10. | 89508 | 0.90% | 7.1%(-6.20)#125 | 8.3%(-7.40)#25,878 |
| 11. | 89519 | 0.90% | 7.1%(-6.20)#126 | 8.3%(-7.40)#25,894 |
| 12. | 89510 | 0.90% | 7.1%(-6.20)#127 | 8.3%(-7.40)#26,002 |
1
Common Questions
What are the Top 10 Zip Codes with the Highest Percentage of Households Without a Vehicle in Reno, NV?
Top 10 Zip Codes with the Highest Percentage of Households Without a Vehicle in Reno, NV are:
What zip code has the Highest Percentage of Households Without a Vehicle in Reno, NV?
89501 has the Highest Percentage of Households Without a Vehicle in Reno, NV with 35.1%.
What is the Percentage of Households Without a Vehicle in Reno, NV?
Percentage of Households Without a Vehicle in Reno is 8.5%.
What is the Percentage of Households Without a Vehicle in Nevada?
Percentage of Households Without a Vehicle in Nevada is 7.1%.
What is the Percentage of Households Without a Vehicle in the United States?
Percentage of Households Without a Vehicle in the United States is 8.3%.