Zip Codes with the Highest Percentage of Renter-Occupied Units in Hobbs, NM
RELATED REPORTS & OPTIONS
Highest Renter-Occupied
Hobbs
Compare Zip Codes
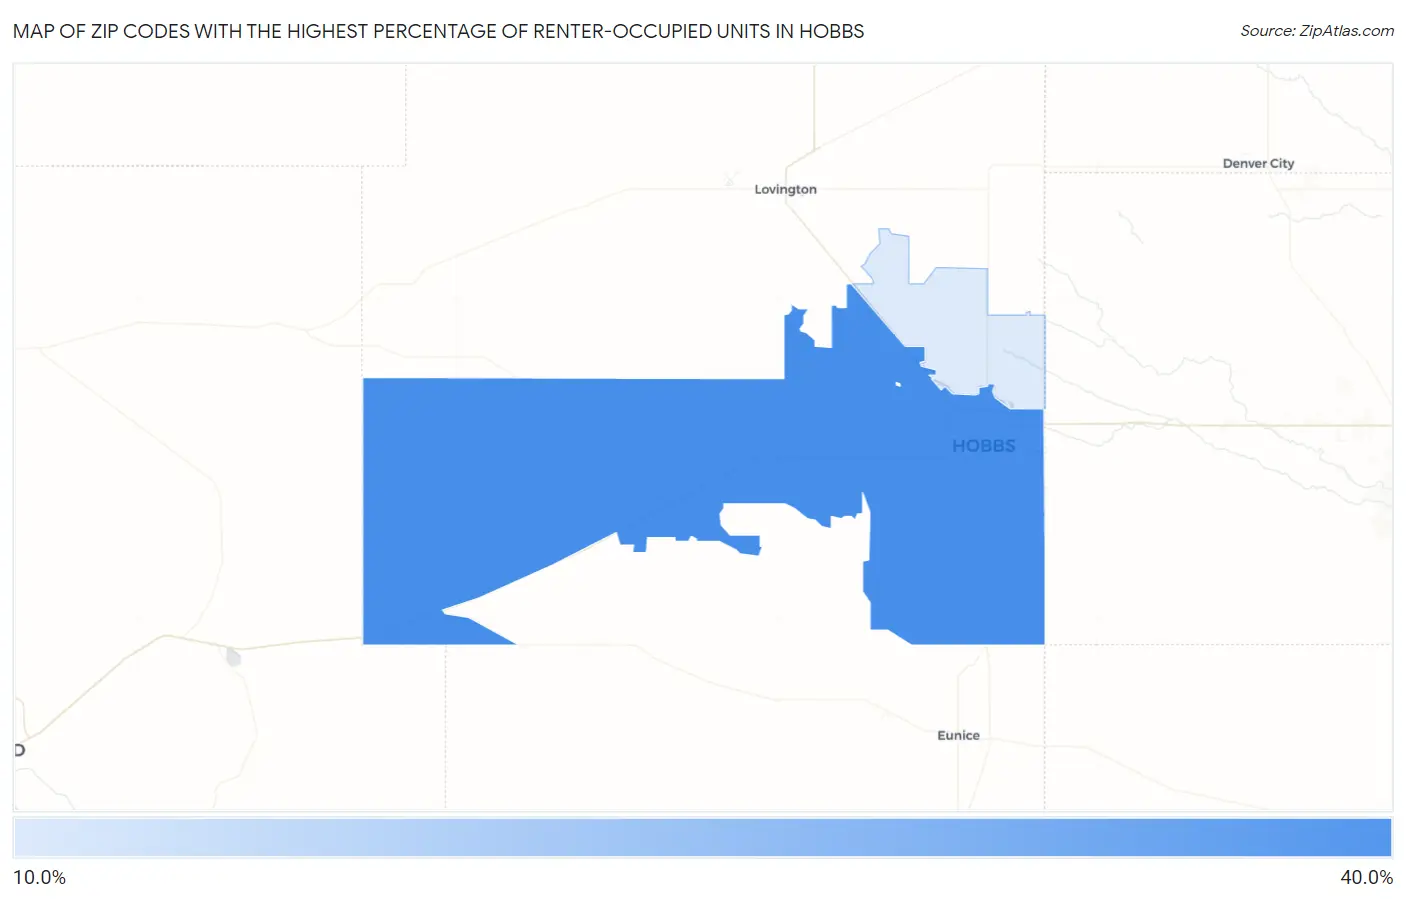
Map of Zip Codes with the Highest Percentage of Renter-Occupied Units in Hobbs
18.2%
37.1%
Zip Codes with the Highest Percentage of Renter-Occupied Units in Hobbs, NM
| Zip Code | % Renter-Occupied | vs State | vs National | |
| 1. | 88240 | 37.1% | 31.3%(+5.80)#56 | 35.2%(+1.95)#6,428 |
| 2. | 88242 | 18.2% | 31.3%(-13.1)#174 | 35.2%(-16.9)#19,914 |
1
Common Questions
What are the Top Zip Codes with the Highest Percentage of Renter-Occupied Units in Hobbs, NM?
Top Zip Codes with the Highest Percentage of Renter-Occupied Units in Hobbs, NM are:
What zip code has the Highest Percentage of Renter-Occupied Units in Hobbs, NM?
88240 has the Highest Percentage of Renter-Occupied Units in Hobbs, NM with 37.1%.
What is the Percentage of Renter-Occupied Units in Hobbs, NM?
Percentage of Renter-Occupied Units in Hobbs is 38.6%.
What is the Percentage of Renter-Occupied Units in New Mexico?
Percentage of Renter-Occupied Units in New Mexico is 31.3%.
What is the Percentage of Renter-Occupied Units in the United States?
Percentage of Renter-Occupied Units in the United States is 35.2%.