Zip Codes with the Highest Percentage of Population Employed in Installation, Maintenance & Repair in Hobbs, NM
RELATED REPORTS & OPTIONS
Installation, Maintenance & Repair
Hobbs
Compare Zip Codes
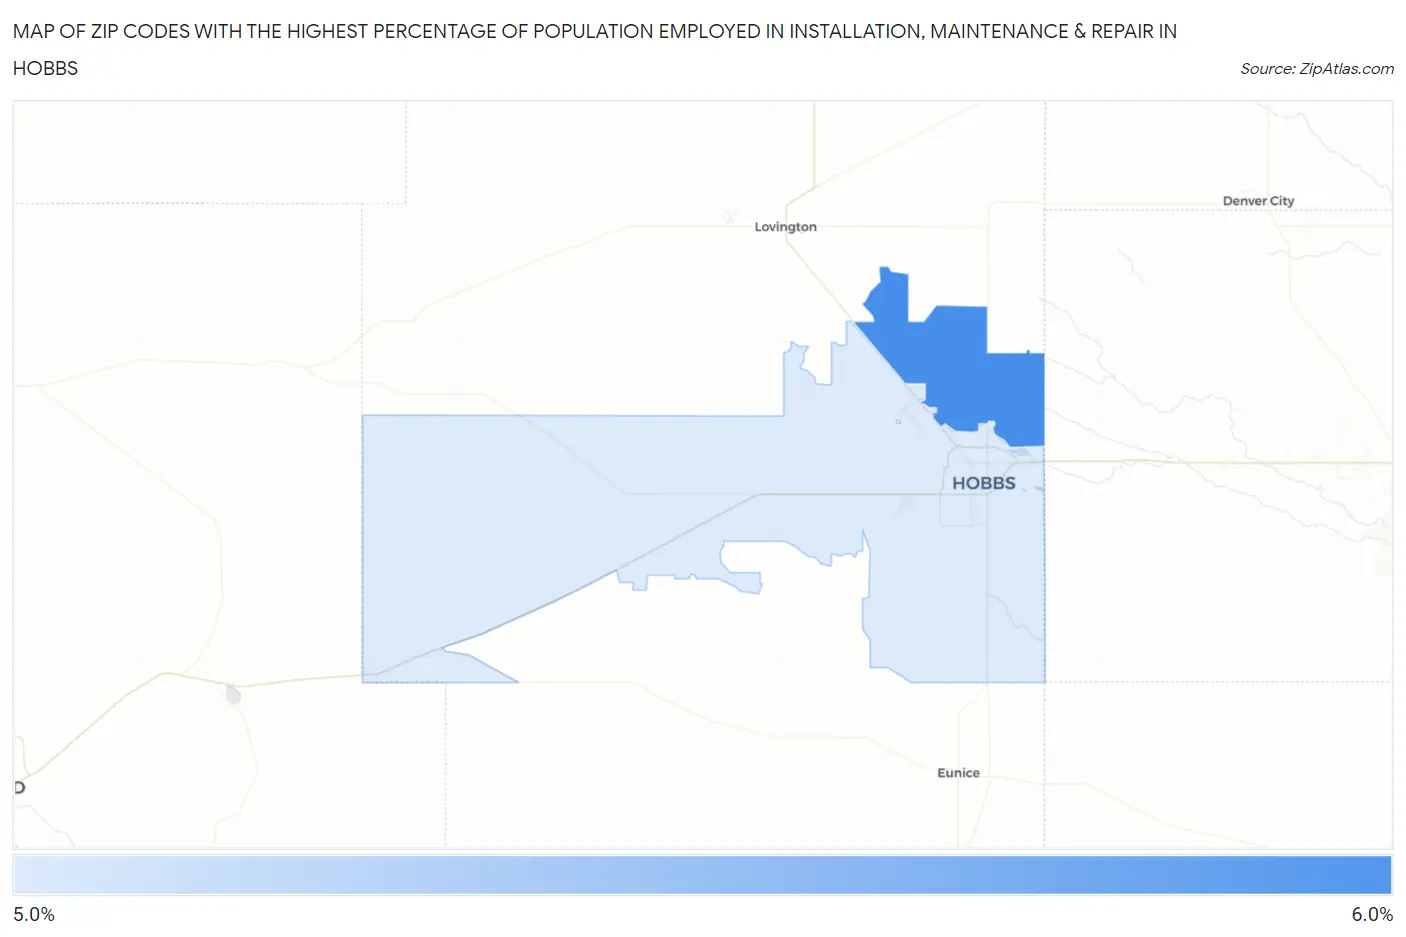
Map of Zip Codes with the Highest Percentage of Population Employed in Installation, Maintenance & Repair in Hobbs
5.1%
5.5%
Zip Codes with the Highest Percentage of Population Employed in Installation, Maintenance & Repair in Hobbs, NM
| Zip Code | % Employed | vs State | vs National | |
| 1. | 88242 | 5.5% | 3.7%(+1.84)#61 | 3.1%(+2.47)#7,181 |
| 2. | 88240 | 5.1% | 3.7%(+1.44)#67 | 3.1%(+2.06)#8,296 |
1
Common Questions
What are the Top Zip Codes with the Highest Percentage of Population Employed in Installation, Maintenance & Repair in Hobbs, NM?
Top Zip Codes with the Highest Percentage of Population Employed in Installation, Maintenance & Repair in Hobbs, NM are:
What zip code has the Highest Percentage of Population Employed in Installation, Maintenance & Repair in Hobbs, NM?
88242 has the Highest Percentage of Population Employed in Installation, Maintenance & Repair in Hobbs, NM with 5.5%.
What is the Percentage of Population Employed in Installation, Maintenance & Repair in Hobbs, NM?
Percentage of Population Employed in Installation, Maintenance & Repair in Hobbs is 4.8%.
What is the Percentage of Population Employed in Installation, Maintenance & Repair in New Mexico?
Percentage of Population Employed in Installation, Maintenance & Repair in New Mexico is 3.7%.
What is the Percentage of Population Employed in Installation, Maintenance & Repair in the United States?
Percentage of Population Employed in Installation, Maintenance & Repair in the United States is 3.1%.