Zip Codes with the Highest Percentage of Population Employed in Food Preparation & Serving in Hobbs, NM
RELATED REPORTS & OPTIONS
Food Preparation & Serving
Hobbs
Compare Zip Codes
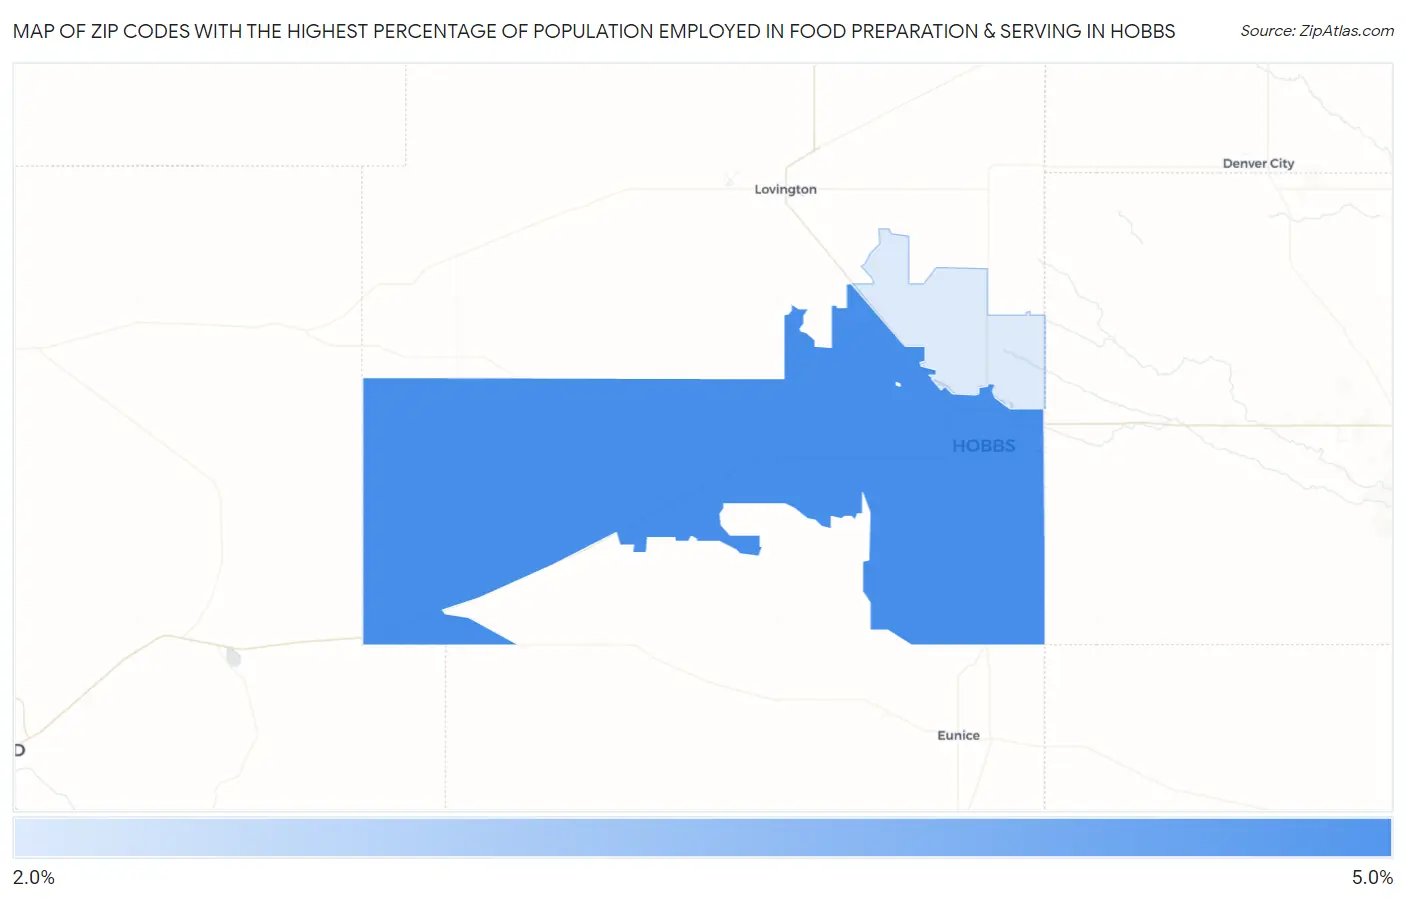
Map of Zip Codes with the Highest Percentage of Population Employed in Food Preparation & Serving in Hobbs
2.9%
4.7%
Zip Codes with the Highest Percentage of Population Employed in Food Preparation & Serving in Hobbs, NM
| Zip Code | % Employed | vs State | vs National | |
| 1. | 88240 | 4.7% | 5.8%(-1.03)#141 | 5.3%(-0.563)#14,072 |
| 2. | 88242 | 2.9% | 5.8%(-2.88)#177 | 5.3%(-2.41)#21,752 |
1
Common Questions
What are the Top Zip Codes with the Highest Percentage of Population Employed in Food Preparation & Serving in Hobbs, NM?
Top Zip Codes with the Highest Percentage of Population Employed in Food Preparation & Serving in Hobbs, NM are:
What zip code has the Highest Percentage of Population Employed in Food Preparation & Serving in Hobbs, NM?
88240 has the Highest Percentage of Population Employed in Food Preparation & Serving in Hobbs, NM with 4.7%.
What is the Percentage of Population Employed in Food Preparation & Serving in Hobbs, NM?
Percentage of Population Employed in Food Preparation & Serving in Hobbs is 3.9%.
What is the Percentage of Population Employed in Food Preparation & Serving in New Mexico?
Percentage of Population Employed in Food Preparation & Serving in New Mexico is 5.8%.
What is the Percentage of Population Employed in Food Preparation & Serving in the United States?
Percentage of Population Employed in Food Preparation & Serving in the United States is 5.3%.