Zip Codes with the Highest Percentage of Population with a Degree in Visual and Performing Arts in Fargo, ND

RELATED REPORTS & OPTIONS

Visual and Performing Arts
Population
Families and Households
Female Fertility
Female Fertility (Unmarried)
Race (Community Size)
Race (Percentage)
Ancestry (Community Size)
AfghanAfricanAlbanianAmericanArabAustrianBangladeshiBelgianBhutaneseBlackfeetBrazilianBritishBurmeseCanadianCentral AmericanCentral American IndianCherokeeChippewaColombianCroatianCubanCzechCzechoslovakianDanishDominicanDutchEastern EuropeanEgyptianEnglishEuropeanFilipinoFinnishFrenchFrench American IndianFrench CanadianGermanGerman RussianGhanaianGreekGuatemalanHonduranHungarianIcelanderIndian (Asian)IranianIrishIroquoisItalianJamaicanJapaneseKenyanKoreanLatvianLebaneseLiberianLuxembourgerMalaysianMexicanMexican American IndianNative HawaiianNigerianNorthern EuropeanNorwegianPakistaniPolishPortuguesePuerto RicanRomanianRussianSalvadoranScandinavianScotch-IrishScottishSiouxSlovakSloveneSomaliSouth AmericanSpaniardSpanishSri LankanSubsaharan AfricanSudaneseSwedishSwissThaiUkrainianWelshYugoslavian
Ancestry (Percentage)
AfghanAfricanAlbanianAmericanArabAustrianBangladeshiBelgianBhutaneseBlackfeetBrazilianBritishBurmeseCanadianCentral AmericanCentral American IndianCherokeeChippewaColombianCroatianCubanCzechCzechoslovakianDanishDominicanDutchEastern EuropeanEgyptianEnglishEuropeanFilipinoFinnishFrenchFrench American IndianFrench CanadianGermanGerman RussianGhanaianGreekGuatemalanHonduranHungarianIcelanderIndian (Asian)IranianIrishIroquoisItalianJamaicanJapaneseKenyanKoreanLatvianLebaneseLiberianLuxembourgerMalaysianMexicanMexican American IndianNative HawaiianNigerianNorthern EuropeanNorwegianPakistaniPolishPortuguesePuerto RicanRomanianRussianSalvadoranScandinavianScotch-IrishScottishSiouxSlovakSloveneSomaliSouth AmericanSpaniardSpanishSri LankanSubsaharan AfricanSudaneseSwedishSwissThaiUkrainianWelshYugoslavian
Immigrant Origin (Total)
Immigrant Origin (Percentage)
Income
Income (Families)
Income (Households)
Poverty
Poverty (Families)
Unemployment
Employment Occupations
Employment Industries
Employer Class
Commute Time
Commute Means
School Enrollment
Education by Degree Field
Occupancy
Finances
Physical Characteristics
Fargo
Compare Zip Codes
Comparison Subject

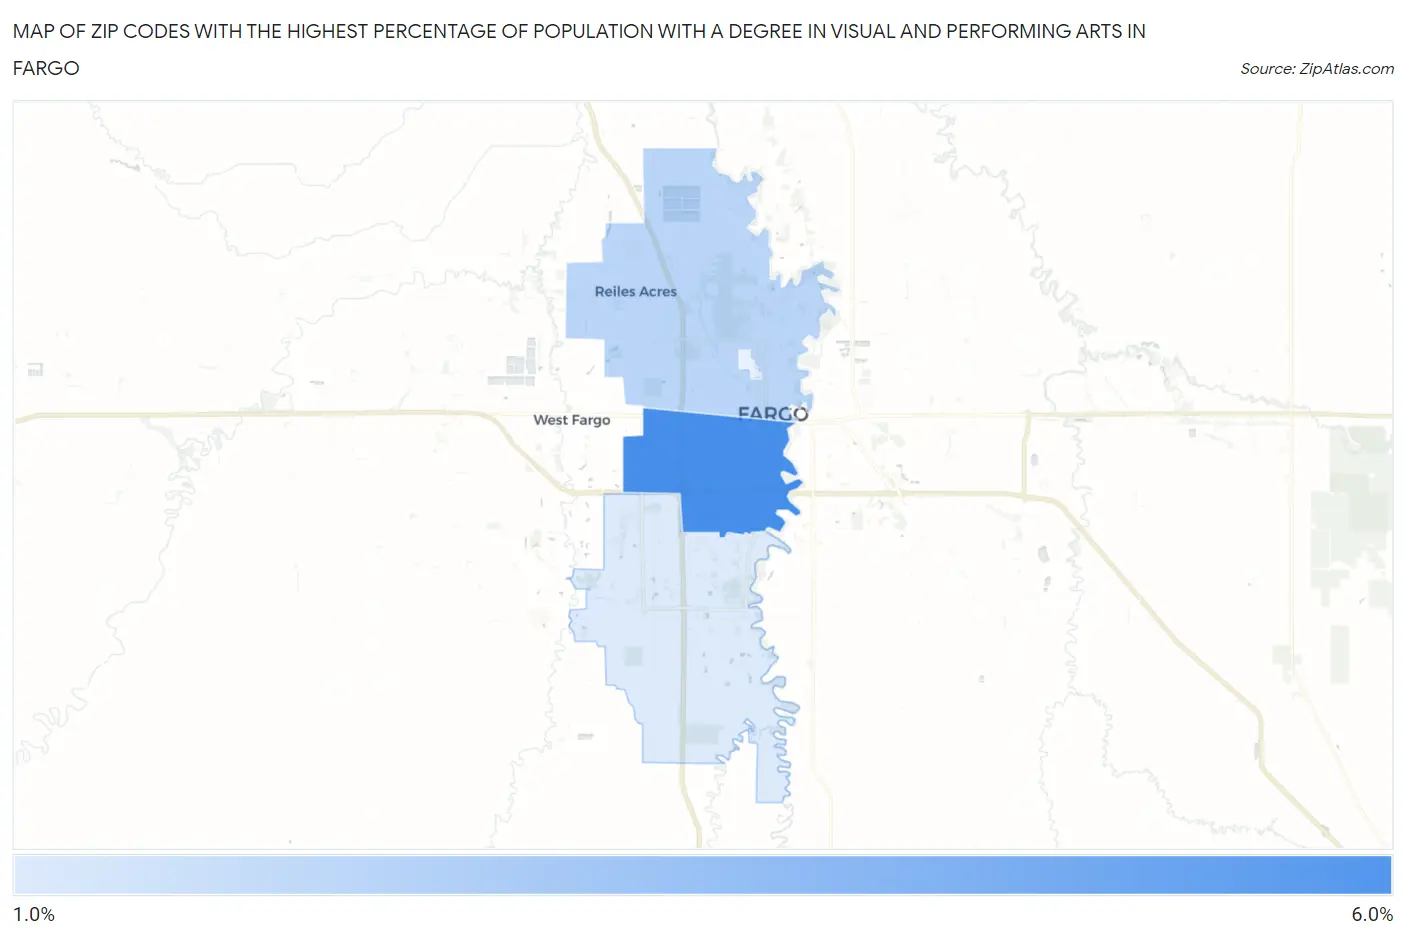
Map of Zip Codes with the Highest Percentage of Population with a Degree in Visual and Performing Arts in Fargo

0.0%
6.0%
Zip Codes with the Highest Percentage of Population with a Degree in Visual and Performing Arts in Fargo Map

Zip Codes with the Highest Percentage of Population with a Degree in Visual and Performing Arts in Fargo, ND

Zip Code % Graduates vs State vs National
1.581035.9%2.3%(+3.59)#334.3%(+1.60)#5,089
2.581022.7%2.3%(+0.464)#654.3%(-1.52)#13,760
3.581041.8%2.3%(-0.447)#774.3%(-2.43)#17,064

Common Questions

What are the Top 3 Zip Codes with the Highest Percentage of Population with a Degree in Visual and Performing Arts in Fargo, ND?
Top 3 Zip Codes with the Highest Percentage of Population with a Degree in Visual and Performing Arts in Fargo, ND are:
#1
5.9%
#2
2.7%
#3
1.8%
What zip code has the Highest Percentage of Population with a Degree in Visual and Performing Arts in Fargo, ND?
58103 has the Highest Percentage of Population with a Degree in Visual and Performing Arts in Fargo, ND with 5.9%.
What is the Percentage of Population with a Degree in Visual and Performing Arts in Fargo, ND?
Percentage of Population with a Degree in Visual and Performing Arts in Fargo is 3.3%.
What is the Percentage of Population with a Degree in Visual and Performing Arts in North Dakota?
Percentage of Population with a Degree in Visual and Performing Arts in North Dakota is 2.3%.
What is the Percentage of Population with a Degree in Visual and Performing Arts in the United States?
Percentage of Population with a Degree in Visual and Performing Arts in the United States is 4.3%.