Zip Codes with the Highest Percentage of Population Employed in Arts, Entertainment & Recreation in Montana
RELATED REPORTS & OPTIONS
Arts, Entertainment & Recreation
Montana
Compare Zip Codes
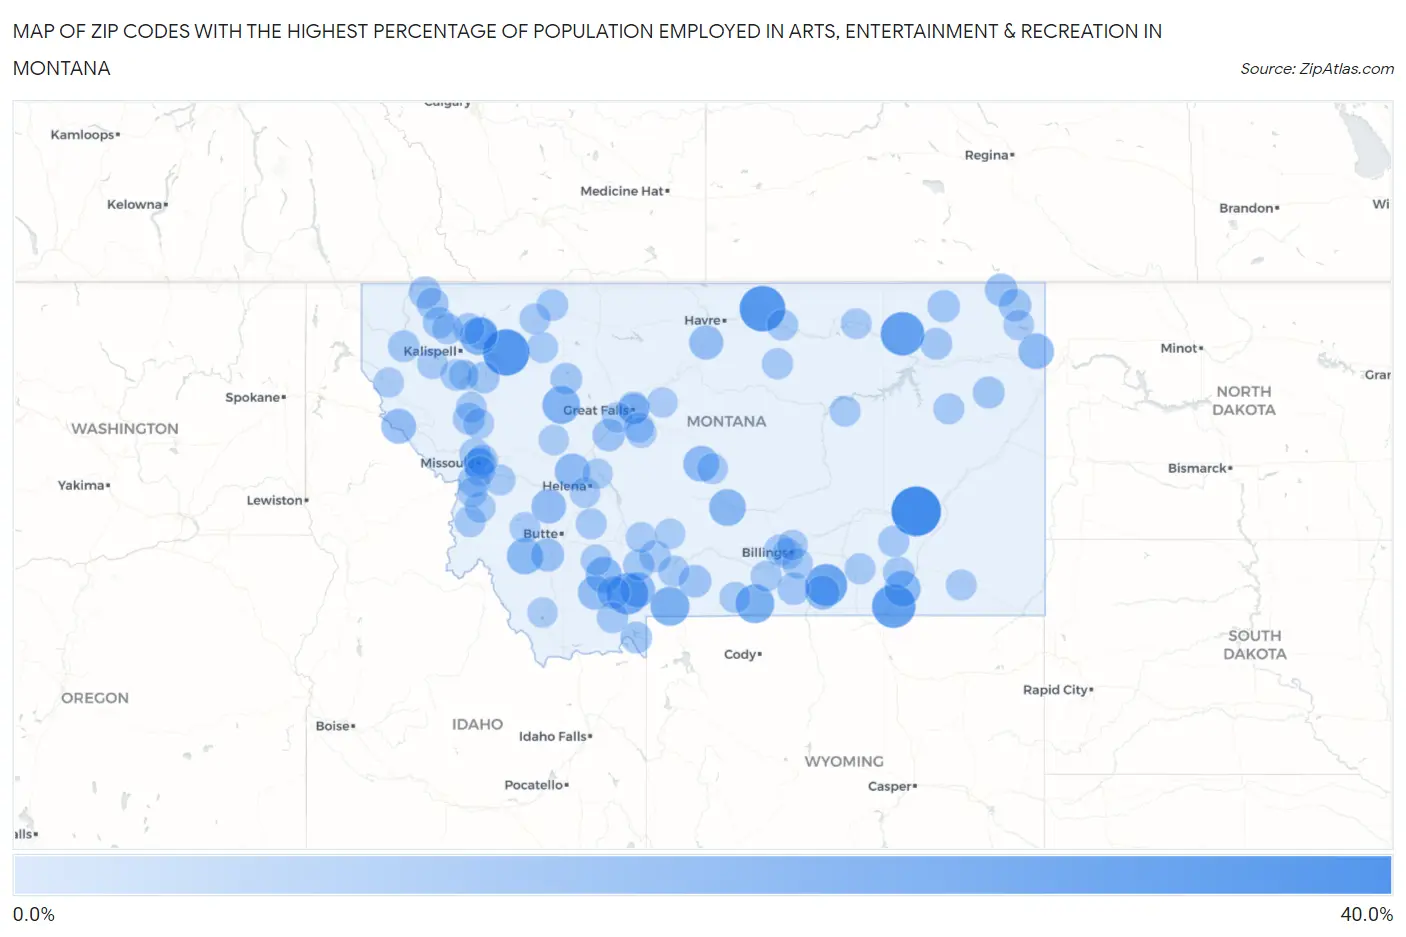
Map of Zip Codes with the Highest Percentage of Population Employed in Arts, Entertainment & Recreation in Montana
0.0%
40.0%
Zip Codes with the Highest Percentage of Population Employed in Arts, Entertainment & Recreation in Montana
| Zip Code | % Employed | vs State | vs National | |
| 1. | 59333 | 31.8% | 2.5%(+29.3)#1 | 2.1%(+29.7)#70 |
| 2. | 59936 | 26.7% | 2.5%(+24.2)#2 | 2.1%(+24.6)#104 |
| 3. | 59547 | 25.8% | 2.5%(+23.3)#3 | 2.1%(+23.7)#108 |
| 4. | 59231 | 22.4% | 2.5%(+19.9)#4 | 2.1%(+20.3)#146 |
| 5. | 59025 | 22.2% | 2.5%(+19.7)#5 | 2.1%(+20.1)#148 |
| 6. | 59075 | 19.7% | 2.5%(+17.2)#6 | 2.1%(+17.7)#190 |
| 7. | 59716 | 18.7% | 2.5%(+16.2)#7 | 2.1%(+16.6)#217 |
| 8. | 59030 | 15.2% | 2.5%(+12.7)#8 | 2.1%(+13.1)#327 |
| 9. | 59007 | 14.9% | 2.5%(+12.4)#9 | 2.1%(+12.8)#343 |
| 10. | 59926 | 13.3% | 2.5%(+10.8)#10 | 2.1%(+11.3)#430 |
| 11. | 59410 | 13.3% | 2.5%(+10.8)#11 | 2.1%(+11.2)#434 |
| 12. | 59078 | 11.7% | 2.5%(+9.17)#12 | 2.1%(+9.58)#542 |
| 13. | 59762 | 10.9% | 2.5%(+8.41)#13 | 2.1%(+8.83)#610 |
| 14. | 59740 | 10.8% | 2.5%(+8.32)#14 | 2.1%(+8.74)#614 |
| 15. | 59012 | 10.7% | 2.5%(+8.21)#15 | 2.1%(+8.63)#624 |
| 16. | 59452 | 10.2% | 2.5%(+7.70)#16 | 2.1%(+8.12)#679 |
| 17. | 59212 | 9.9% | 2.5%(+7.41)#17 | 2.1%(+7.83)#720 |
| 18. | 59640 | 9.8% | 2.5%(+7.26)#18 | 2.1%(+7.67)#740 |
| 19. | 59730 | 9.6% | 2.5%(+7.13)#19 | 2.1%(+7.55)#759 |
| 20. | 59842 | 8.8% | 2.5%(+6.32)#20 | 2.1%(+6.74)#883 |
| 21. | 59722 | 8.4% | 2.5%(+5.95)#21 | 2.1%(+6.36)#955 |
| 22. | 59755 | 8.2% | 2.5%(+5.70)#22 | 2.1%(+6.11)#1,005 |
| 23. | 59035 | 8.2% | 2.5%(+5.66)#23 | 2.1%(+6.08)#1,013 |
| 24. | 59521 | 7.9% | 2.5%(+5.38)#24 | 2.1%(+5.80)#1,090 |
| 25. | 59727 | 6.5% | 2.5%(+3.99)#25 | 2.1%(+4.41)#1,505 |
| 26. | 59913 | 6.1% | 2.5%(+3.58)#26 | 2.1%(+4.00)#1,660 |
| 27. | 59729 | 6.0% | 2.5%(+3.53)#27 | 2.1%(+3.95)#1,685 |
| 28. | 59252 | 5.9% | 2.5%(+3.38)#28 | 2.1%(+3.80)#1,767 |
| 29. | 59052 | 5.6% | 2.5%(+3.13)#29 | 2.1%(+3.55)#1,893 |
| 30. | 59254 | 5.5% | 2.5%(+3.00)#30 | 2.1%(+3.42)#1,961 |
| 31. | 59421 | 5.5% | 2.5%(+2.99)#31 | 2.1%(+3.41)#1,971 |
| 32. | 59253 | 5.3% | 2.5%(+2.76)#32 | 2.1%(+3.18)#2,108 |
| 33. | 59066 | 5.2% | 2.5%(+2.72)#33 | 2.1%(+3.13)#2,144 |
| 34. | 59917 | 5.0% | 2.5%(+2.51)#34 | 2.1%(+2.93)#2,279 |
| 35. | 59918 | 4.8% | 2.5%(+2.35)#35 | 2.1%(+2.76)#2,401 |
| 36. | 59812 | 4.8% | 2.5%(+2.26)#36 | 2.1%(+2.68)#2,469 |
| 37. | 59259 | 4.7% | 2.5%(+2.16)#37 | 2.1%(+2.58)#2,563 |
| 38. | 59824 | 4.5% | 2.5%(+1.96)#38 | 2.1%(+2.38)#2,787 |
| 39. | 59414 | 4.4% | 2.5%(+1.94)#39 | 2.1%(+2.35)#2,811 |
| 40. | 59225 | 4.3% | 2.5%(+1.82)#40 | 2.1%(+2.24)#2,933 |
| 41. | 59927 | 4.3% | 2.5%(+1.80)#41 | 2.1%(+2.22)#2,962 |
| 42. | 59923 | 4.3% | 2.5%(+1.76)#42 | 2.1%(+2.17)#3,009 |
| 43. | 59833 | 4.2% | 2.5%(+1.74)#43 | 2.1%(+2.16)#3,028 |
| 44. | 59422 | 4.2% | 2.5%(+1.72)#44 | 2.1%(+2.14)#3,054 |
| 45. | 59911 | 4.2% | 2.5%(+1.69)#45 | 2.1%(+2.11)#3,097 |
| 46. | 59758 | 4.1% | 2.5%(+1.59)#46 | 2.1%(+2.01)#3,210 |
| 47. | 59715 | 4.1% | 2.5%(+1.58)#47 | 2.1%(+1.99)#3,225 |
| 48. | 59043 | 4.1% | 2.5%(+1.56)#48 | 2.1%(+1.98)#3,249 |
| 49. | 59427 | 4.0% | 2.5%(+1.53)#49 | 2.1%(+1.95)#3,285 |
| 50. | 59929 | 4.0% | 2.5%(+1.50)#50 | 2.1%(+1.92)#3,340 |
| 51. | 59720 | 3.7% | 2.5%(+1.25)#51 | 2.1%(+1.67)#3,703 |
| 52. | 59718 | 3.7% | 2.5%(+1.23)#52 | 2.1%(+1.64)#3,738 |
| 53. | 59106 | 3.7% | 2.5%(+1.20)#53 | 2.1%(+1.62)#3,779 |
| 54. | 59912 | 3.6% | 2.5%(+1.11)#54 | 2.1%(+1.53)#3,923 |
| 55. | 59526 | 3.5% | 2.5%(+1.05)#55 | 2.1%(+1.47)#4,033 |
| 56. | 59323 | 3.5% | 2.5%(+1.01)#56 | 2.1%(+1.43)#4,108 |
| 57. | 59527 | 3.5% | 2.5%(+0.985)#57 | 2.1%(+1.40)#4,166 |
| 58. | 59808 | 3.5% | 2.5%(+0.964)#58 | 2.1%(+1.38)#4,212 |
| 59. | 59937 | 3.4% | 2.5%(+0.898)#59 | 2.1%(+1.32)#4,360 |
| 60. | 59041 | 3.4% | 2.5%(+0.851)#60 | 2.1%(+1.27)#4,463 |
| 61. | 59047 | 3.3% | 2.5%(+0.846)#61 | 2.1%(+1.26)#4,473 |
| 62. | 59825 | 3.3% | 2.5%(+0.830)#62 | 2.1%(+1.25)#4,511 |
| 63. | 59068 | 3.3% | 2.5%(+0.757)#63 | 2.1%(+1.17)#4,665 |
| 64. | 59840 | 3.3% | 2.5%(+0.754)#64 | 2.1%(+1.17)#4,672 |
| 65. | 59801 | 3.2% | 2.5%(+0.727)#65 | 2.1%(+1.14)#4,726 |
| 66. | 59747 | 3.2% | 2.5%(+0.726)#66 | 2.1%(+1.14)#4,736 |
| 67. | 59802 | 3.1% | 2.5%(+0.645)#67 | 2.1%(+1.06)#4,939 |
| 68. | 59215 | 3.1% | 2.5%(+0.631)#68 | 2.1%(+1.05)#4,984 |
| 69. | 59448 | 3.1% | 2.5%(+0.597)#69 | 2.1%(+1.01)#5,077 |
| 70. | 59418 | 3.0% | 2.5%(+0.530)#70 | 2.1%(+0.948)#5,272 |
| 71. | 59417 | 3.0% | 2.5%(+0.518)#71 | 2.1%(+0.936)#5,310 |
| 72. | 59022 | 3.0% | 2.5%(+0.485)#72 | 2.1%(+0.903)#5,397 |
| 73. | 59632 | 3.0% | 2.5%(+0.479)#73 | 2.1%(+0.897)#5,419 |
| 74. | 59318 | 2.9% | 2.5%(+0.441)#74 | 2.1%(+0.859)#5,539 |
| 75. | 59864 | 2.9% | 2.5%(+0.434)#75 | 2.1%(+0.851)#5,555 |
| 76. | 59102 | 2.9% | 2.5%(+0.432)#76 | 2.1%(+0.850)#5,561 |
| 77. | 59828 | 2.9% | 2.5%(+0.397)#77 | 2.1%(+0.814)#5,654 |
| 78. | 59925 | 2.9% | 2.5%(+0.369)#78 | 2.1%(+0.786)#5,750 |
| 79. | 59711 | 2.8% | 2.5%(+0.345)#79 | 2.1%(+0.763)#5,836 |
| 80. | 59401 | 2.8% | 2.5%(+0.328)#80 | 2.1%(+0.745)#5,894 |
| 81. | 59317 | 2.8% | 2.5%(+0.327)#81 | 2.1%(+0.744)#5,897 |
| 82. | 59485 | 2.8% | 2.5%(+0.321)#82 | 2.1%(+0.739)#5,911 |
| 83. | 59865 | 2.8% | 2.5%(+0.319)#83 | 2.1%(+0.736)#5,922 |
| 84. | 59714 | 2.8% | 2.5%(+0.309)#84 | 2.1%(+0.726)#5,956 |
| 85. | 59261 | 2.7% | 2.5%(+0.247)#85 | 2.1%(+0.665)#6,198 |
| 86. | 59480 | 2.6% | 2.5%(+0.132)#86 | 2.1%(+0.549)#6,641 |
| 87. | 59601 | 2.6% | 2.5%(+0.108)#87 | 2.1%(+0.526)#6,725 |
| 88. | 59101 | 2.5% | 2.5%(-0.031)#88 | 2.1%(+0.386)#7,316 |
| 89. | 59803 | 2.4% | 2.5%(-0.064)#89 | 2.1%(+0.353)#7,486 |
| 90. | 59405 | 2.4% | 2.5%(-0.068)#90 | 2.1%(+0.350)#7,496 |
| 91. | 59247 | 2.4% | 2.5%(-0.076)#91 | 2.1%(+0.342)#7,535 |
| 92. | 59105 | 2.4% | 2.5%(-0.111)#92 | 2.1%(+0.306)#7,690 |
| 93. | 59086 | 2.3% | 2.5%(-0.221)#93 | 2.1%(+0.197)#8,227 |
| 94. | 59602 | 2.2% | 2.5%(-0.283)#94 | 2.1%(+0.134)#8,532 |
| 95. | 59639 | 2.2% | 2.5%(-0.286)#95 | 2.1%(+0.131)#8,552 |
| 96. | 59931 | 2.2% | 2.5%(-0.294)#96 | 2.1%(+0.123)#8,608 |
| 97. | 59874 | 2.1% | 2.5%(-0.387)#97 | 2.1%(+0.030)#9,146 |
| 98. | 59725 | 2.1% | 2.5%(-0.443)#98 | 2.1%(-0.025)#9,445 |
| 99. | 59450 | 2.0% | 2.5%(-0.500)#99 | 2.1%(-0.083)#9,780 |
| 100. | 59870 | 2.0% | 2.5%(-0.502)#100 | 2.1%(-0.084)#9,789 |
Common Questions
What are the Top 10 Zip Codes with the Highest Percentage of Population Employed in Arts, Entertainment & Recreation in Montana?
Top 10 Zip Codes with the Highest Percentage of Population Employed in Arts, Entertainment & Recreation in Montana are:
What zip code has the Highest Percentage of Population Employed in Arts, Entertainment & Recreation in Montana?
59333 has the Highest Percentage of Population Employed in Arts, Entertainment & Recreation in Montana with 31.8%.
What is the Percentage of Population Employed in Arts, Entertainment & Recreation in the State of Montana?
Percentage of Population Employed in Arts, Entertainment & Recreation in Montana is 2.5%.
What is the Percentage of Population Employed in Arts, Entertainment & Recreation in the United States?
Percentage of Population Employed in Arts, Entertainment & Recreation in the United States is 2.1%.