West Point, MS Map & Demographics
West Point Map
West Point Overview
$23,605
PER CAPITA INCOME
$40,694
AVG FAMILY INCOME
$32,846
AVG HOUSEHOLD INCOME
32.8%
WAGE / INCOME GAP [ % ]
67.2¢/ $1
WAGE / INCOME GAP [ $ ]
0.53
INEQUALITY / GINI INDEX
10,063
TOTAL POPULATION
4,427
MALE POPULATION
5,636
FEMALE POPULATION
78.55
MALES / 100 FEMALES
127.31
FEMALES / 100 MALES
37.7
MEDIAN AGE
3.1
AVG FAMILY SIZE
2.4
AVG HOUSEHOLD SIZE
4,126
LABOR FORCE [ PEOPLE ]
51.6%
PERCENT IN LABOR FORCE
11.0%
UNEMPLOYMENT RATE
West Point Zip Codes
West Point Area Codes
Income in West Point
Income Overview in West Point
Per Capita Income in West Point is $23,605, while median incomes of families and households are $40,694 and $32,846 respectively.
| Characteristic | Number | Measure |
| Per Capita Income | 10,063 | $23,605 |
| Median Family Income | 2,575 | $40,694 |
| Mean Family Income | 2,575 | $54,956 |
| Median Household Income | 4,076 | $32,846 |
| Mean Household Income | 4,076 | $53,494 |
| Income Deficit | 2,575 | $0 |
| Wage / Income Gap (%) | 10,063 | 32.83% |
| Wage / Income Gap ($) | 10,063 | 67.17¢ per $1 |
| Gini / Inequality Index | 10,063 | 0.53 |
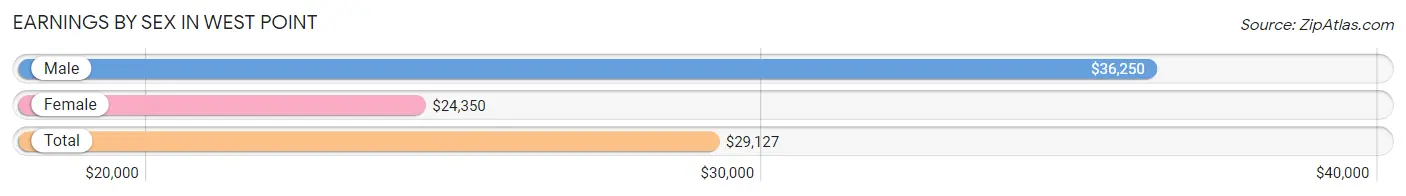
Earnings by Sex in West Point
Average Earnings in West Point are $29,127, $36,250 for men and $24,350 for women, a difference of 32.8%.
| Sex | Number | Average Earnings |
| Male | 1,860 (44.1%) | $36,250 |
| Female | 2,355 (55.9%) | $24,350 |
| Total | 4,215 (100.0%) | $29,127 |
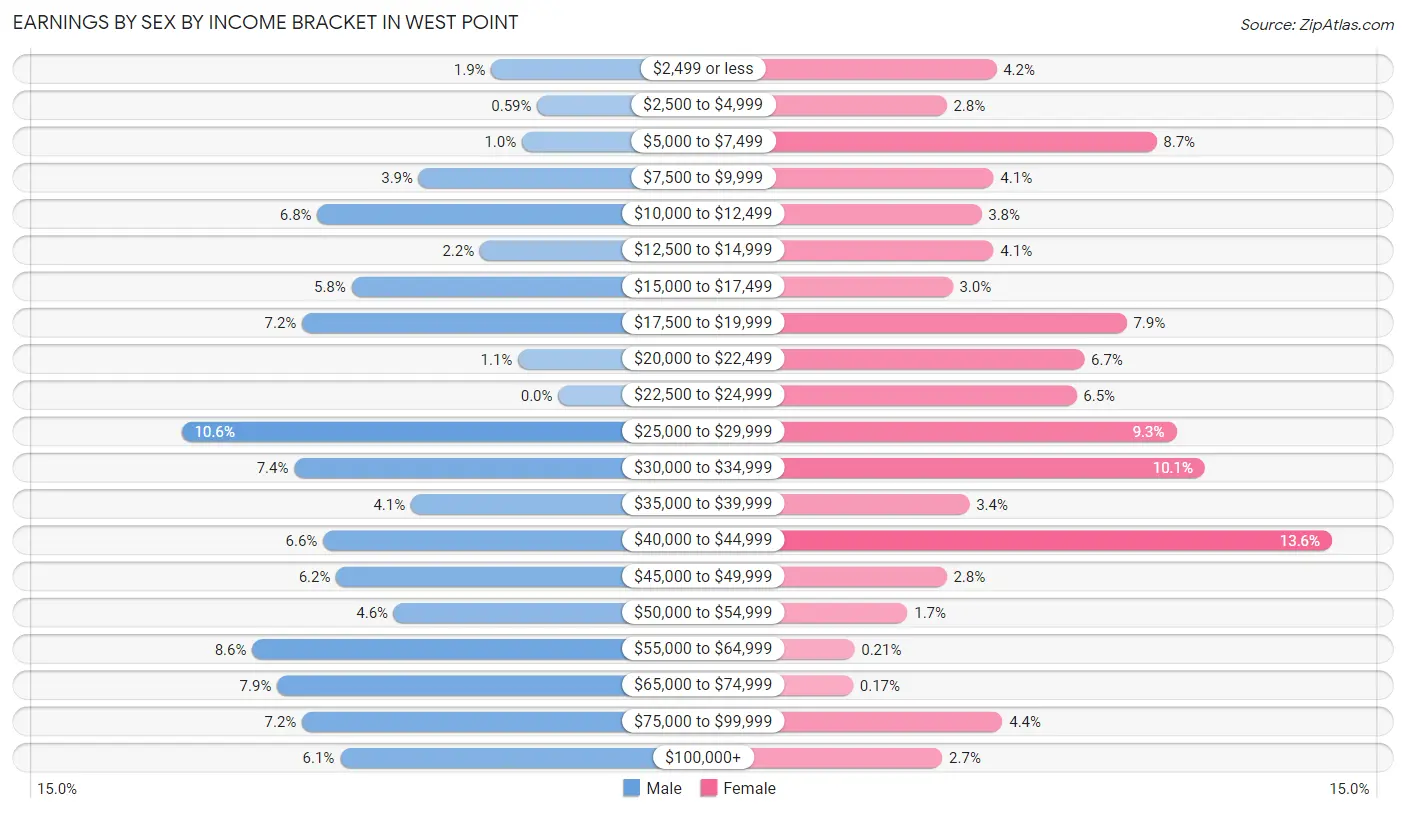
Earnings by Sex by Income Bracket in West Point
The most common earnings brackets in West Point are $25,000 to $29,999 for men (197 | 10.6%) and $40,000 to $44,999 for women (321 | 13.6%).
| Income | Male | Female |
| $2,499 or less | 35 (1.9%) | 99 (4.2%) |
| $2,500 to $4,999 | 11 (0.6%) | 66 (2.8%) |
| $5,000 to $7,499 | 19 (1.0%) | 205 (8.7%) |
| $7,500 to $9,999 | 73 (3.9%) | 97 (4.1%) |
| $10,000 to $12,499 | 126 (6.8%) | 89 (3.8%) |
| $12,500 to $14,999 | 41 (2.2%) | 97 (4.1%) |
| $15,000 to $17,499 | 108 (5.8%) | 70 (3.0%) |
| $17,500 to $19,999 | 134 (7.2%) | 185 (7.9%) |
| $20,000 to $22,499 | 21 (1.1%) | 157 (6.7%) |
| $22,500 to $24,999 | 0 (0.0%) | 152 (6.5%) |
| $25,000 to $29,999 | 197 (10.6%) | 218 (9.3%) |
| $30,000 to $34,999 | 138 (7.4%) | 237 (10.1%) |
| $35,000 to $39,999 | 77 (4.1%) | 81 (3.4%) |
| $40,000 to $44,999 | 123 (6.6%) | 321 (13.6%) |
| $45,000 to $49,999 | 116 (6.2%) | 66 (2.8%) |
| $50,000 to $54,999 | 86 (4.6%) | 40 (1.7%) |
| $55,000 to $64,999 | 160 (8.6%) | 5 (0.2%) |
| $65,000 to $74,999 | 147 (7.9%) | 4 (0.2%) |
| $75,000 to $99,999 | 134 (7.2%) | 103 (4.4%) |
| $100,000+ | 114 (6.1%) | 63 (2.7%) |
| Total | 1,860 (100.0%) | 2,355 (100.0%) |
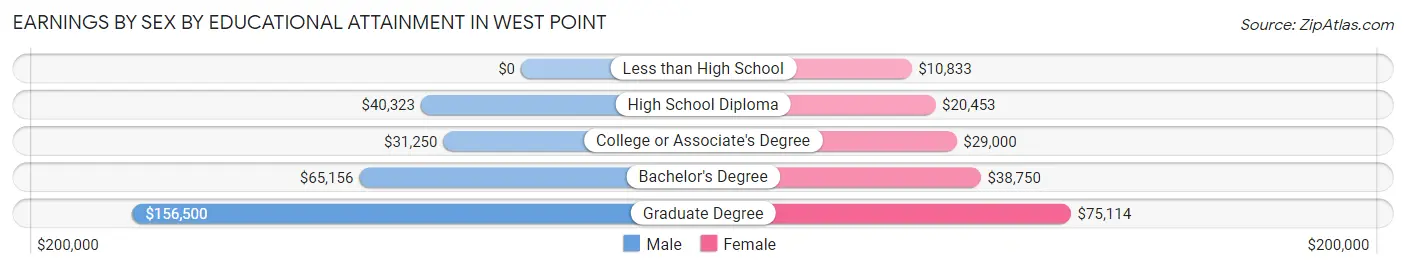
Earnings by Sex by Educational Attainment in West Point
Average earnings in West Point are $41,352 for men and $25,793 for women, a difference of 37.6%. Men with an educational attainment of graduate degree enjoy the highest average annual earnings of $156,500, while those with college or associate's degree education earn the least with $31,250. Women with an educational attainment of graduate degree earn the most with the average annual earnings of $75,114, while those with less than high school education have the smallest earnings of $10,833.
| Educational Attainment | Male Income | Female Income |
| Less than High School | - | - |
| High School Diploma | $40,323 | $20,453 |
| College or Associate's Degree | $31,250 | $29,000 |
| Bachelor's Degree | $65,156 | $38,750 |
| Graduate Degree | $156,500 | $75,114 |
| Total | $41,352 | $25,793 |
Family Income in West Point
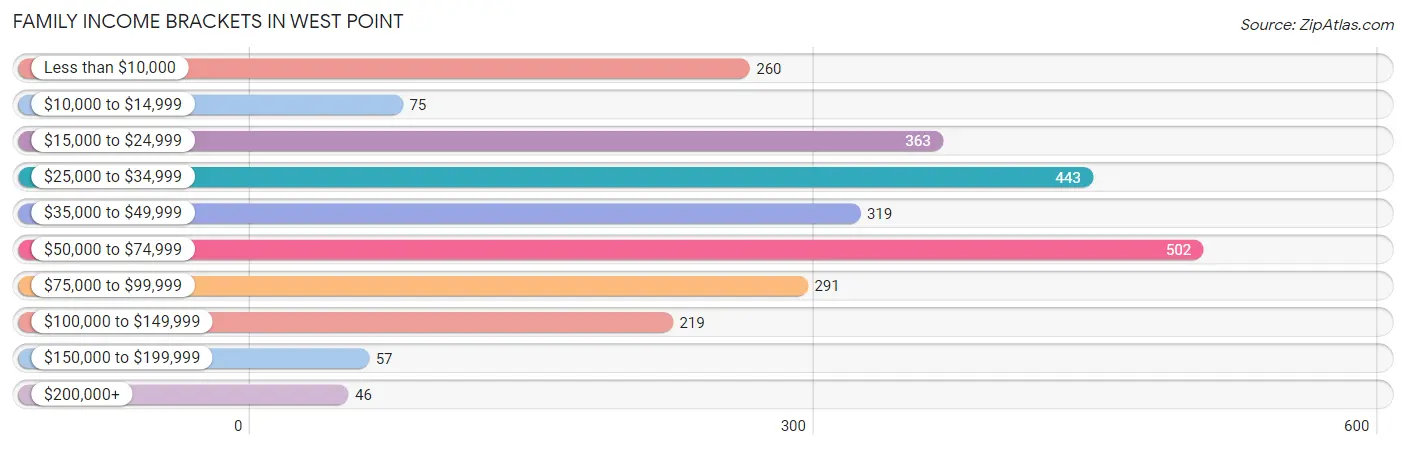
Family Income Brackets in West Point
According to the West Point family income data, there are 502 families falling into the $50,000 to $74,999 income range, which is the most common income bracket and makes up 19.5% of all families. Conversely, the $200,000+ income bracket is the least frequent group with only 46 families (1.8%) belonging to this category.
| Income Bracket | # Families | % Families |
| Less than $10,000 | 260 | 10.1% |
| $10,000 to $14,999 | 75 | 2.9% |
| $15,000 to $24,999 | 363 | 14.1% |
| $25,000 to $34,999 | 443 | 17.2% |
| $35,000 to $49,999 | 319 | 12.4% |
| $50,000 to $74,999 | 502 | 19.5% |
| $75,000 to $99,999 | 291 | 11.3% |
| $100,000 to $149,999 | 219 | 8.5% |
| $150,000 to $199,999 | 57 | 2.2% |
| $200,000+ | 46 | 1.8% |
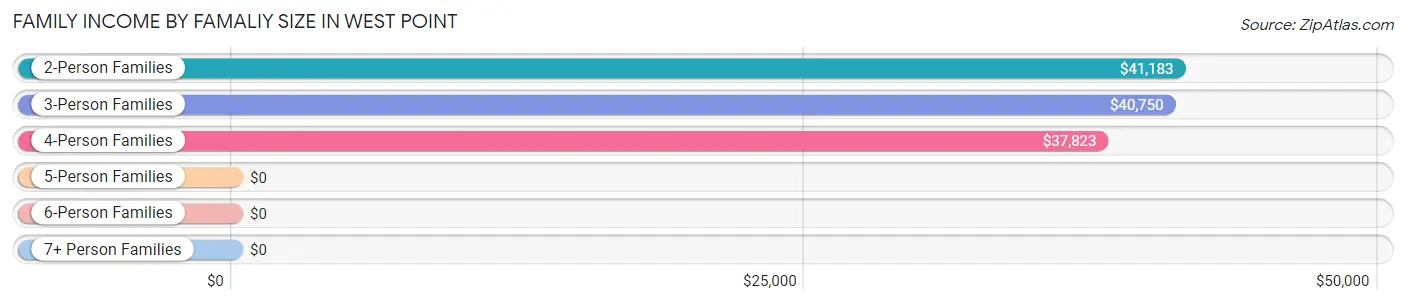
Family Income by Famaliy Size in West Point
2-person families (1,545 | 60.0%) account for the highest median family income in West Point with $41,183 per family, while 2-person families (1,545 | 60.0%) have the highest median income of $20,592 per family member.
| Income Bracket | # Families | Median Income |
| 2-Person Families | 1,545 (60.0%) | $41,183 |
| 3-Person Families | 439 (17.1%) | $40,750 |
| 4-Person Families | 434 (16.9%) | $37,823 |
| 5-Person Families | 105 (4.1%) | $0 |
| 6-Person Families | 37 (1.4%) | $0 |
| 7+ Person Families | 15 (0.6%) | $0 |
| Total | 2,575 (100.0%) | $40,694 |
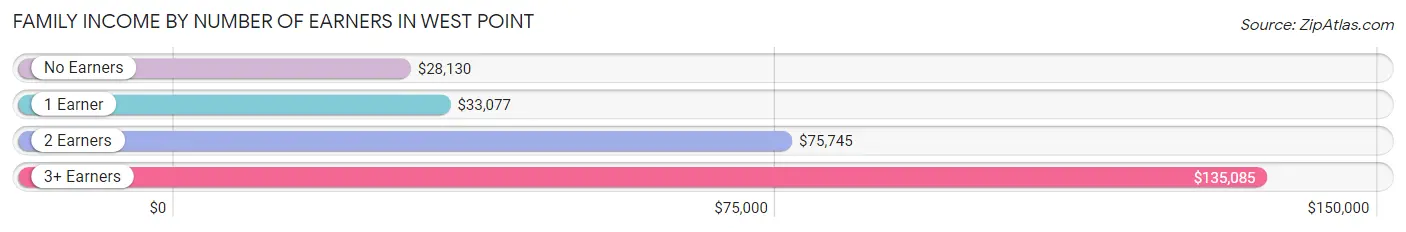
Family Income by Number of Earners in West Point
The median family income in West Point is $40,694, with families comprising 3+ earners (135) having the highest median family income of $135,085, while families with no earners (721) have the lowest median family income of $28,130, accounting for 5.2% and 28.0% of families, respectively.
| Number of Earners | # Families | Median Income |
| No Earners | 721 (28.0%) | $28,130 |
| 1 Earner | 994 (38.6%) | $33,077 |
| 2 Earners | 725 (28.2%) | $75,745 |
| 3+ Earners | 135 (5.2%) | $135,085 |
| Total | 2,575 (100.0%) | $40,694 |
Household Income in West Point
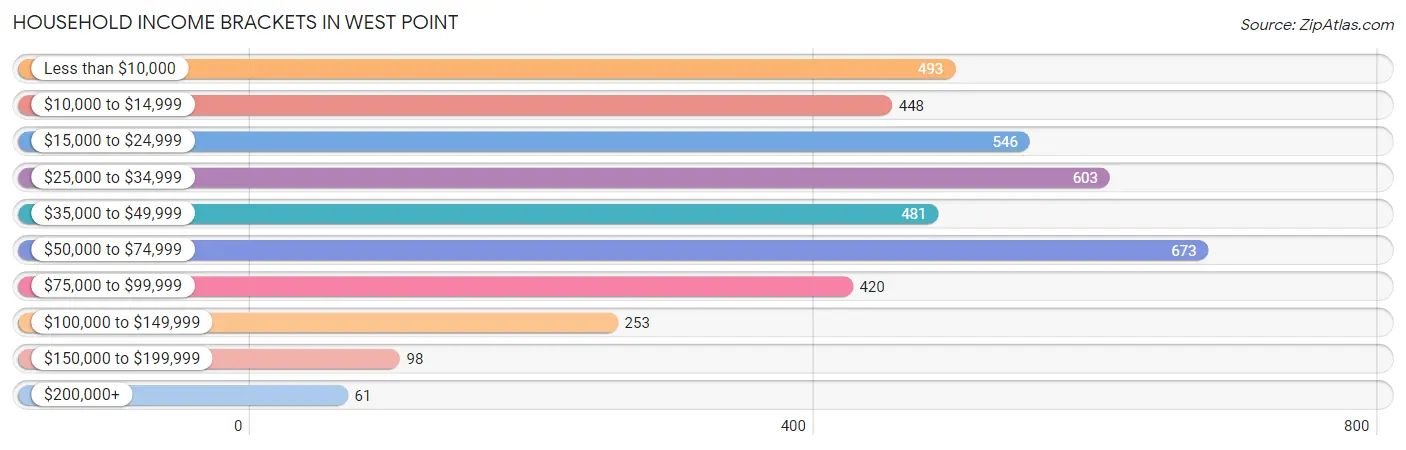
Household Income Brackets in West Point
With 673 households falling in the category, the $50,000 to $74,999 income range is the most frequent in West Point, accounting for 16.5% of all households. In contrast, only 61 households (1.5%) fall into the $200,000+ income bracket, making it the least populous group.
| Income Bracket | # Households | % Households |
| Less than $10,000 | 493 | 12.1% |
| $10,000 to $14,999 | 448 | 11.0% |
| $15,000 to $24,999 | 546 | 13.4% |
| $25,000 to $34,999 | 603 | 14.8% |
| $35,000 to $49,999 | 481 | 11.8% |
| $50,000 to $74,999 | 673 | 16.5% |
| $75,000 to $99,999 | 420 | 10.3% |
| $100,000 to $149,999 | 253 | 6.2% |
| $150,000 to $199,999 | 98 | 2.4% |
| $200,000+ | 61 | 1.5% |
Household Income by Householder Age in West Point
The median household income in West Point is $32,846, with the highest median household income of $47,727 found in the 45 to 64 years age bracket for the primary householder. A total of 1,332 households (32.7%) fall into this category. Meanwhile, the 15 to 24 years age bracket for the primary householder has the lowest median household income of $0, with 97 households (2.4%) in this group.
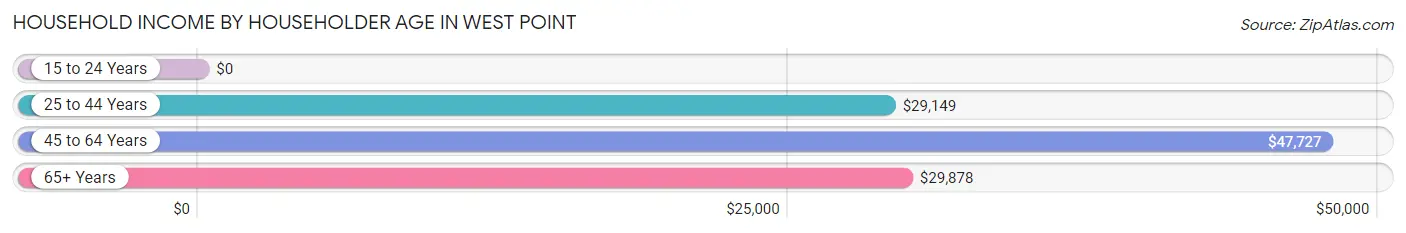
| Income Bracket | # Households | Median Income |
| 15 to 24 Years | 97 (2.4%) | $0 |
| 25 to 44 Years | 1,394 (34.2%) | $29,149 |
| 45 to 64 Years | 1,332 (32.7%) | $47,727 |
| 65+ Years | 1,253 (30.7%) | $29,878 |
| Total | 4,076 (100.0%) | $32,846 |
Poverty in West Point
Income Below Poverty by Sex and Age in West Point
With 22.7% poverty level for males and 33.3% for females among the residents of West Point, 5 year old males and 5 year old females are the most vulnerable to poverty, with 57 males (76.0%) and 13 females (100.0%) in their respective age groups living below the poverty level.
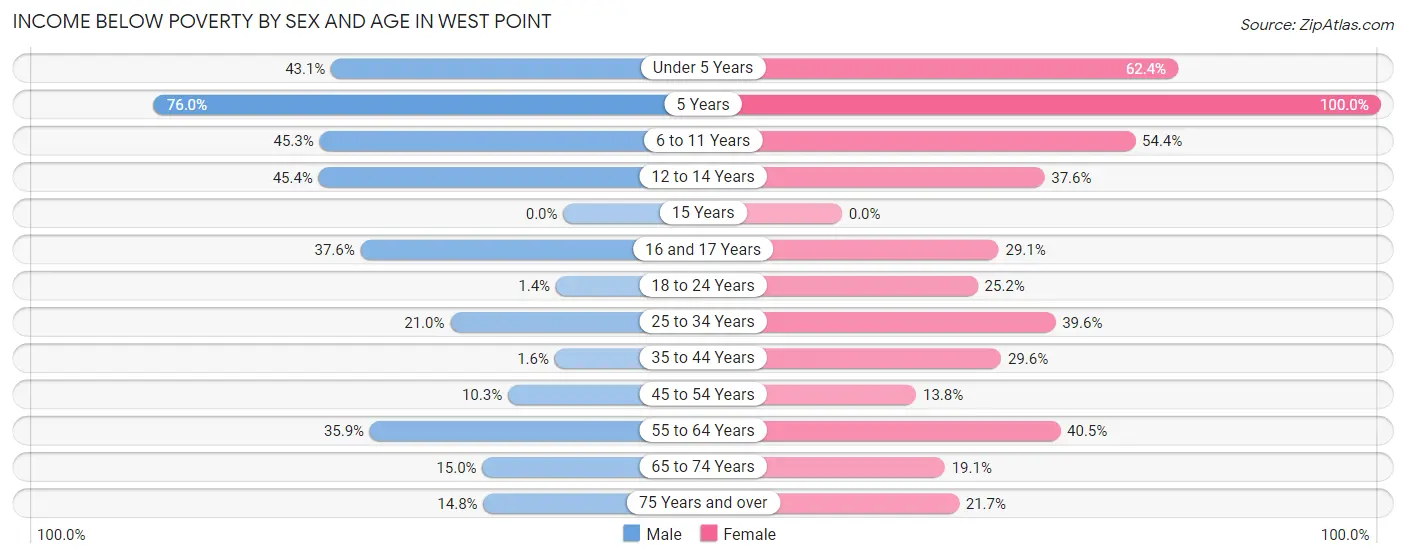
| Age Bracket | Male | Female |
| Under 5 Years | 156 (43.1%) | 209 (62.4%) |
| 5 Years | 57 (76.0%) | 13 (100.0%) |
| 6 to 11 Years | 138 (45.3%) | 294 (54.4%) |
| 12 to 14 Years | 84 (45.4%) | 50 (37.6%) |
| 15 Years | 0 (0.0%) | 0 (0.0%) |
| 16 and 17 Years | 67 (37.6%) | 39 (29.1%) |
| 18 to 24 Years | 6 (1.4%) | 120 (25.2%) |
| 25 to 34 Years | 107 (21.0%) | 317 (39.6%) |
| 35 to 44 Years | 7 (1.6%) | 177 (29.5%) |
| 45 to 54 Years | 47 (10.3%) | 63 (13.8%) |
| 55 to 64 Years | 196 (35.9%) | 295 (40.5%) |
| 65 to 74 Years | 61 (15.0%) | 124 (19.1%) |
| 75 Years and over | 42 (14.8%) | 134 (21.7%) |
| Total | 968 (22.7%) | 1,835 (33.3%) |
Income Above Poverty by Sex and Age in West Point
According to the poverty statistics in West Point, males aged 15 years and females aged 15 years are the age groups that are most secure financially, with 100.0% of males and 100.0% of females in these age groups living above the poverty line.
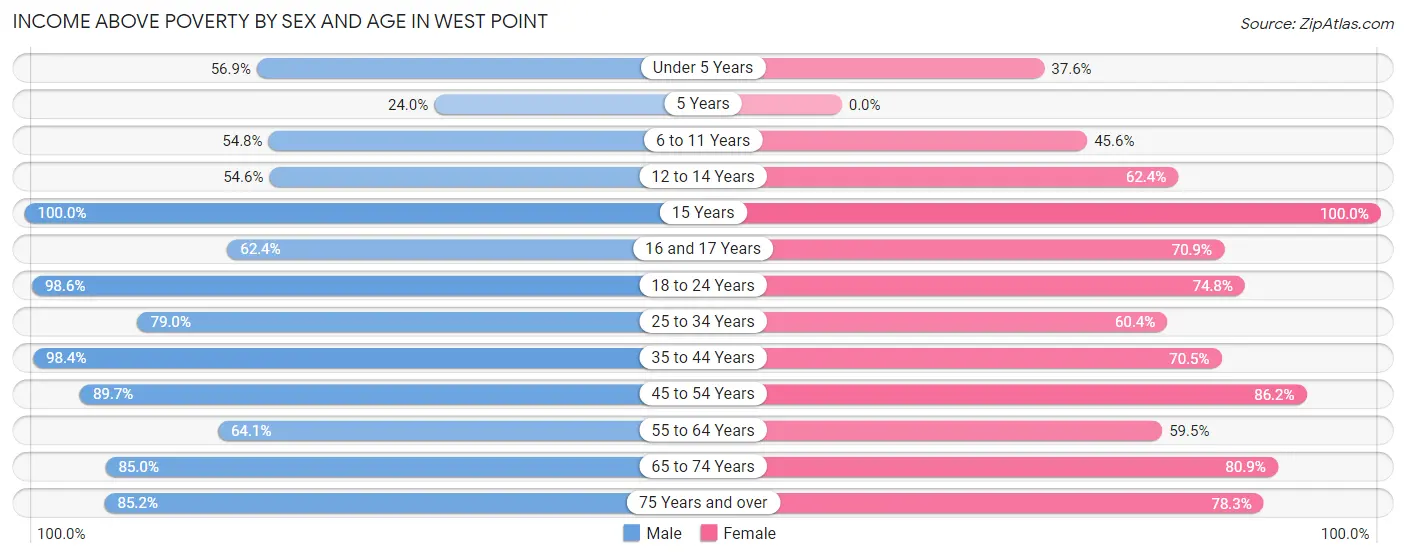
| Age Bracket | Male | Female |
| Under 5 Years | 206 (56.9%) | 126 (37.6%) |
| 5 Years | 18 (24.0%) | 0 (0.0%) |
| 6 to 11 Years | 167 (54.7%) | 246 (45.6%) |
| 12 to 14 Years | 101 (54.6%) | 83 (62.4%) |
| 15 Years | 83 (100.0%) | 36 (100.0%) |
| 16 and 17 Years | 111 (62.4%) | 95 (70.9%) |
| 18 to 24 Years | 428 (98.6%) | 356 (74.8%) |
| 25 to 34 Years | 403 (79.0%) | 483 (60.4%) |
| 35 to 44 Years | 434 (98.4%) | 422 (70.5%) |
| 45 to 54 Years | 410 (89.7%) | 394 (86.2%) |
| 55 to 64 Years | 350 (64.1%) | 433 (59.5%) |
| 65 to 74 Years | 345 (85.0%) | 525 (80.9%) |
| 75 Years and over | 241 (85.2%) | 483 (78.3%) |
| Total | 3,297 (77.3%) | 3,682 (66.7%) |
Income Below Poverty Among Married-Couple Families in West Point
The poverty statistics for married-couple families in West Point show that 5.9% or 82 of the total 1,387 families live below the poverty line. Families with 3 or 4 children have the highest poverty rate of 21.3%, comprising of 10 families. On the other hand, families with 5 or more children have the lowest poverty rate of 0.0%, which includes 0 families.
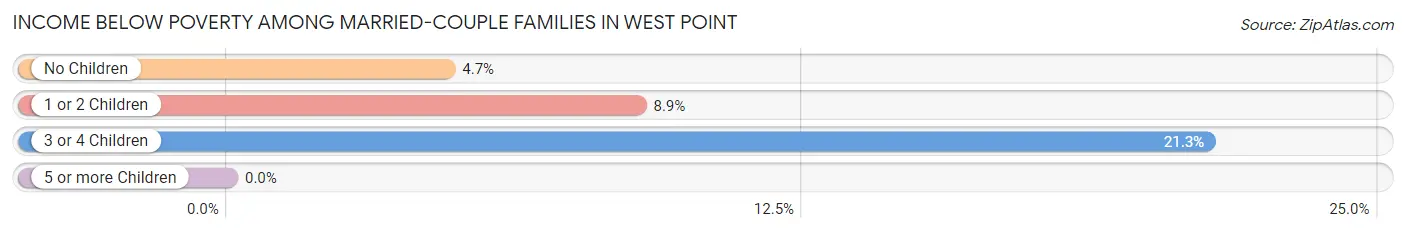
| Children | Above Poverty | Below Poverty |
| No Children | 1,048 (95.3%) | 52 (4.7%) |
| 1 or 2 Children | 205 (91.1%) | 20 (8.9%) |
| 3 or 4 Children | 37 (78.7%) | 10 (21.3%) |
| 5 or more Children | 15 (100.0%) | 0 (0.0%) |
| Total | 1,305 (94.1%) | 82 (5.9%) |
Income Below Poverty Among Single-Parent Households in West Point
According to the poverty data in West Point, 21.6% or 43 single-father households and 48.5% or 480 single-mother households are living below the poverty line. Among single-father households, those with no children have the highest poverty rate, with 43 households (32.3%) experiencing poverty. Likewise, among single-mother households, those with 3 or 4 children have the highest poverty rate, with 183 households (80.6%) falling below the poverty line.
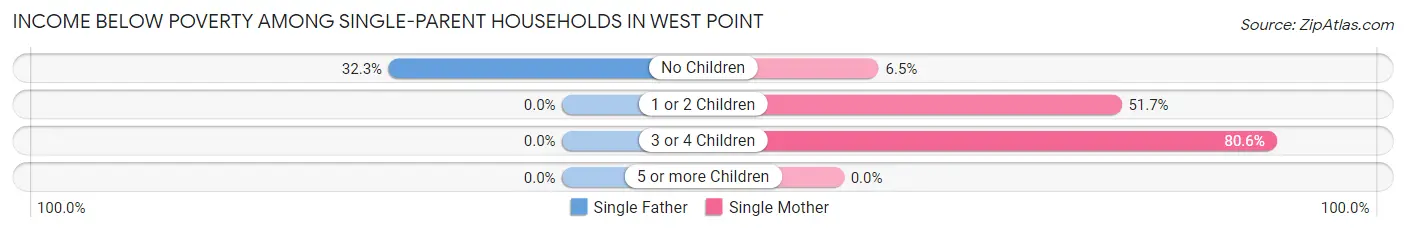
| Children | Single Father | Single Mother |
| No Children | 43 (32.3%) | 14 (6.5%) |
| 1 or 2 Children | 0 (0.0%) | 283 (51.7%) |
| 3 or 4 Children | 0 (0.0%) | 183 (80.6%) |
| 5 or more Children | 0 (0.0%) | 0 (0.0%) |
| Total | 43 (21.6%) | 480 (48.5%) |
Income Below Poverty Among Married-Couple vs Single-Parent Households in West Point
The poverty data for West Point shows that 82 of the married-couple family households (5.9%) and 523 of the single-parent households (44.0%) are living below the poverty level. Within the married-couple family households, those with 3 or 4 children have the highest poverty rate, with 10 households (21.3%) falling below the poverty line. Among the single-parent households, those with 3 or 4 children have the highest poverty rate, with 183 household (80.6%) living below poverty.
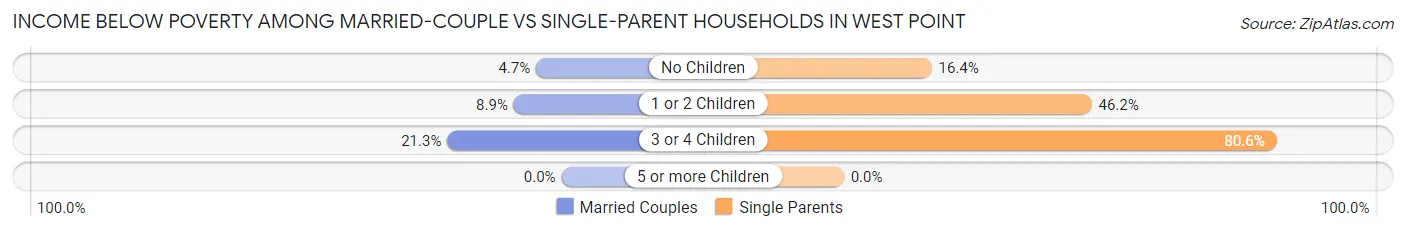
| Children | Married-Couple Families | Single-Parent Households |
| No Children | 52 (4.7%) | 57 (16.4%) |
| 1 or 2 Children | 20 (8.9%) | 283 (46.2%) |
| 3 or 4 Children | 10 (21.3%) | 183 (80.6%) |
| 5 or more Children | 0 (0.0%) | 0 (0.0%) |
| Total | 82 (5.9%) | 523 (44.0%) |
Race in West Point
The most populous races in West Point are Black / African American (6,522 | 64.8%), White / Caucasian (3,459 | 34.4%), and Two or more Races (75 | 0.7%).
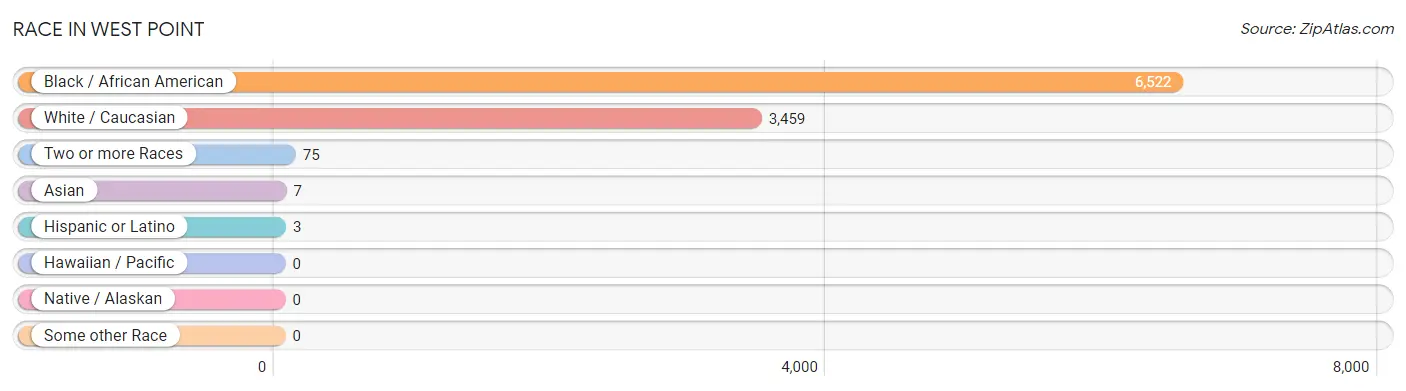
| Race | # Population | % Population |
| Asian | 7 | 0.1% |
| Black / African American | 6,522 | 64.8% |
| Hawaiian / Pacific | 0 | 0.0% |
| Hispanic or Latino | 3 | 0.0% |
| Native / Alaskan | 0 | 0.0% |
| White / Caucasian | 3,459 | 34.4% |
| Two or more Races | 75 | 0.7% |
| Some other Race | 0 | 0.0% |
| Total | 10,063 | 100.0% |
Ancestry in West Point
The most populous ancestries reported in West Point are English (768 | 7.6%), Irish (383 | 3.8%), American (274 | 2.7%), German (189 | 1.9%), and Italian (114 | 1.1%), together accounting for 17.2% of all West Point residents.
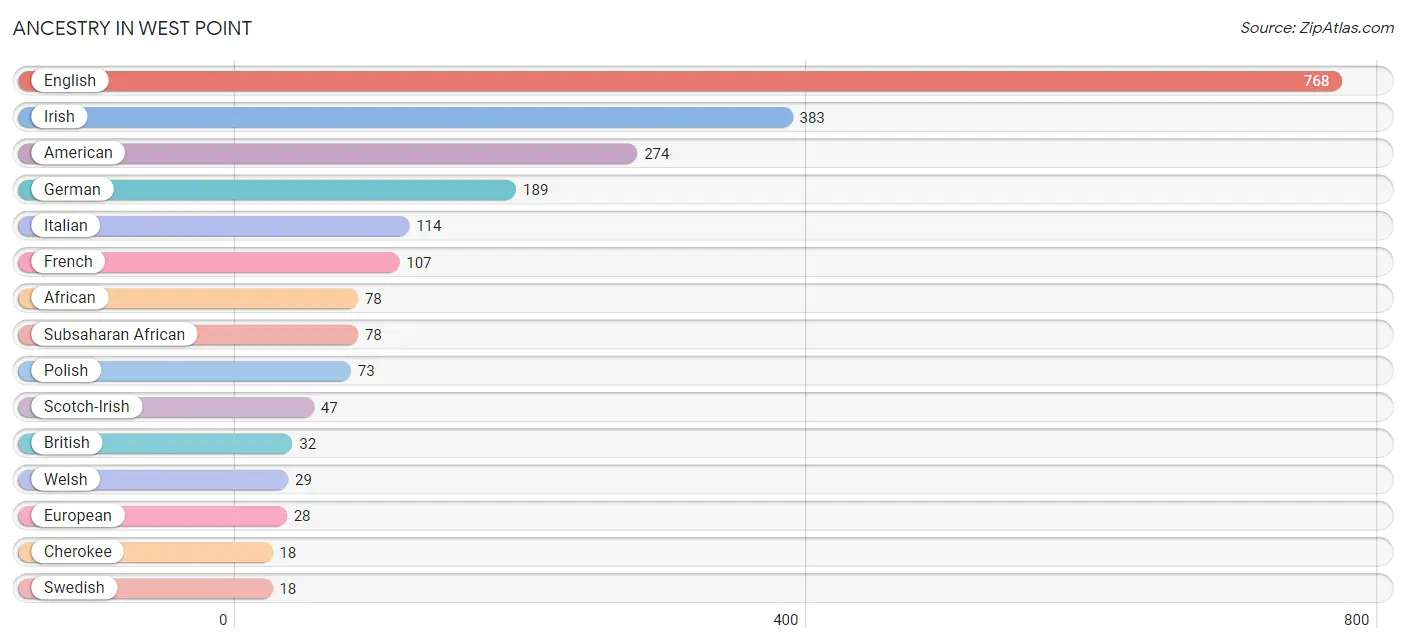
| Ancestry | # Population | % Population |
| African | 78 | 0.8% |
| American | 274 | 2.7% |
| Australian | 7 | 0.1% |
| British | 32 | 0.3% |
| Cherokee | 18 | 0.2% |
| Dutch | 5 | 0.1% |
| English | 768 | 7.6% |
| European | 28 | 0.3% |
| French | 107 | 1.1% |
| German | 189 | 1.9% |
| Irish | 383 | 3.8% |
| Italian | 114 | 1.1% |
| Mexican | 3 | 0.0% |
| Polish | 73 | 0.7% |
| Scotch-Irish | 47 | 0.5% |
| Scottish | 5 | 0.1% |
| Subsaharan African | 78 | 0.8% |
| Swedish | 18 | 0.2% |
| Thai | 7 | 0.1% |
| Welsh | 29 | 0.3% | View All 20 Rows |
Immigrants in West Point
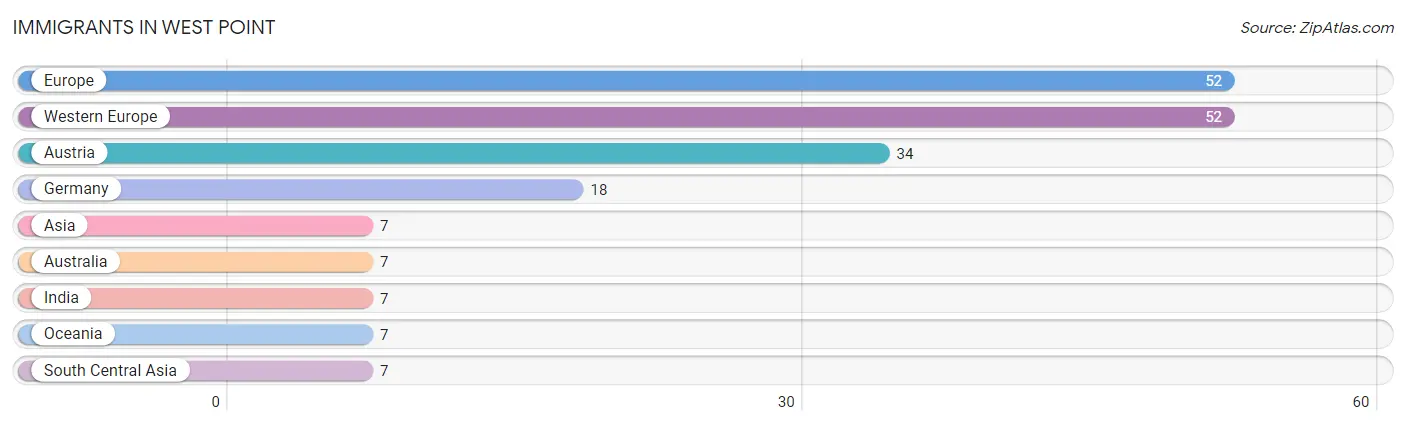
The most numerous immigrant groups reported in West Point came from Europe (52 | 0.5%), Western Europe (52 | 0.5%), Austria (34 | 0.3%), Germany (18 | 0.2%), and Asia (7 | 0.1%), together accounting for 1.6% of all West Point residents.
| Immigration Origin | # Population | % Population |
| Asia | 7 | 0.1% |
| Australia | 7 | 0.1% |
| Austria | 34 | 0.3% |
| Europe | 52 | 0.5% |
| Germany | 18 | 0.2% |
| India | 7 | 0.1% |
| Oceania | 7 | 0.1% |
| South Central Asia | 7 | 0.1% |
| Western Europe | 52 | 0.5% | View All 9 Rows |
Sex and Age in West Point
Sex and Age in West Point
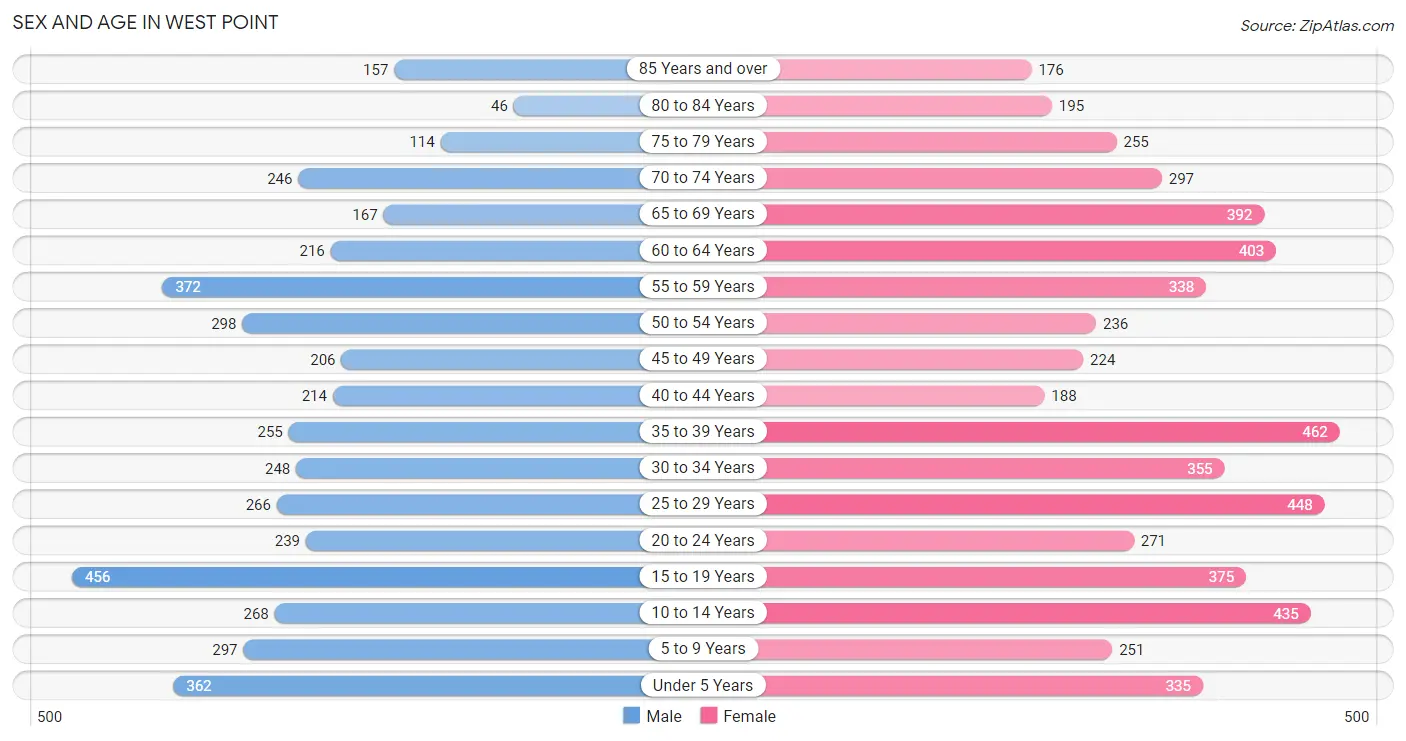
The most populous age groups in West Point are 15 to 19 Years (456 | 10.3%) for men and 35 to 39 Years (462 | 8.2%) for women.
| Age Bracket | Male | Female |
| Under 5 Years | 362 (8.2%) | 335 (5.9%) |
| 5 to 9 Years | 297 (6.7%) | 251 (4.4%) |
| 10 to 14 Years | 268 (6.0%) | 435 (7.7%) |
| 15 to 19 Years | 456 (10.3%) | 375 (6.7%) |
| 20 to 24 Years | 239 (5.4%) | 271 (4.8%) |
| 25 to 29 Years | 266 (6.0%) | 448 (8.0%) |
| 30 to 34 Years | 248 (5.6%) | 355 (6.3%) |
| 35 to 39 Years | 255 (5.8%) | 462 (8.2%) |
| 40 to 44 Years | 214 (4.8%) | 188 (3.3%) |
| 45 to 49 Years | 206 (4.6%) | 224 (4.0%) |
| 50 to 54 Years | 298 (6.7%) | 236 (4.2%) |
| 55 to 59 Years | 372 (8.4%) | 338 (6.0%) |
| 60 to 64 Years | 216 (4.9%) | 403 (7.1%) |
| 65 to 69 Years | 167 (3.8%) | 392 (7.0%) |
| 70 to 74 Years | 246 (5.6%) | 297 (5.3%) |
| 75 to 79 Years | 114 (2.6%) | 255 (4.5%) |
| 80 to 84 Years | 46 (1.0%) | 195 (3.5%) |
| 85 Years and over | 157 (3.5%) | 176 (3.1%) |
| Total | 4,427 (100.0%) | 5,636 (100.0%) |
Families and Households in West Point
Median Family Size in West Point
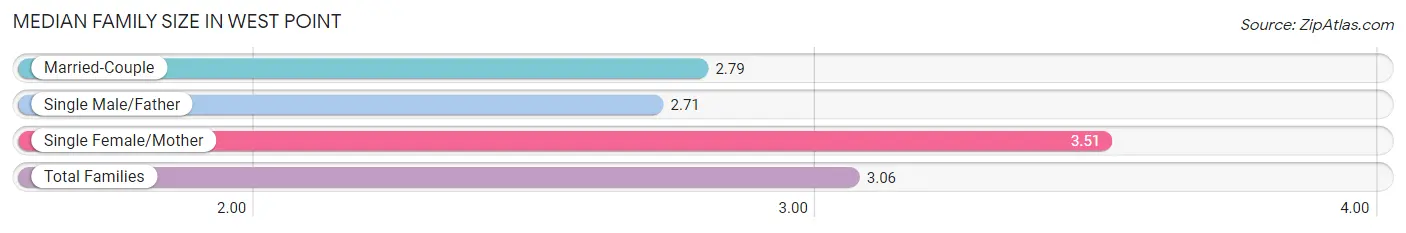
The median family size in West Point is 3.06 persons per family, with single female/mother families (989 | 38.4%) accounting for the largest median family size of 3.51 persons per family. On the other hand, single male/father families (199 | 7.7%) represent the smallest median family size with 2.71 persons per family.
| Family Type | # Families | Family Size |
| Married-Couple | 1,387 (53.9%) | 2.79 |
| Single Male/Father | 199 (7.7%) | 2.71 |
| Single Female/Mother | 989 (38.4%) | 3.51 |
| Total Families | 2,575 (100.0%) | 3.06 |
Median Household Size in West Point
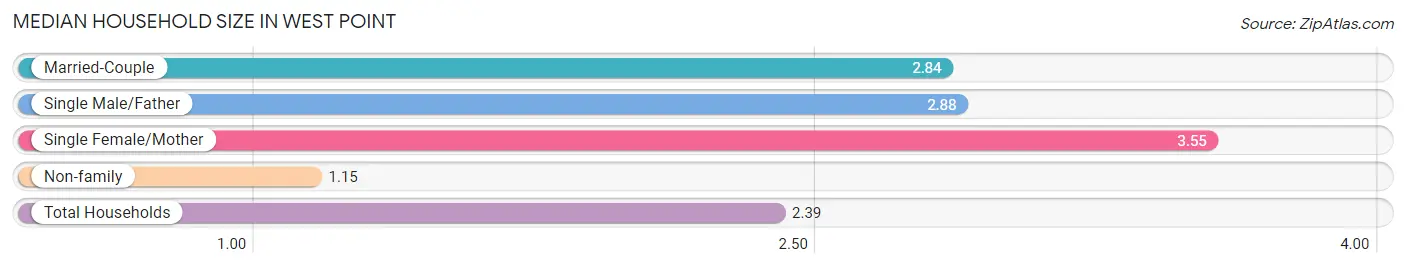
The median household size in West Point is 2.39 persons per household, with single female/mother households (989 | 24.3%) accounting for the largest median household size of 3.55 persons per household. non-family households (1,501 | 36.8%) represent the smallest median household size with 1.15 persons per household.
| Household Type | # Households | Household Size |
| Married-Couple | 1,387 (34.0%) | 2.84 |
| Single Male/Father | 199 (4.9%) | 2.88 |
| Single Female/Mother | 989 (24.3%) | 3.55 |
| Non-family | 1,501 (36.8%) | 1.15 |
| Total Households | 4,076 (100.0%) | 2.39 |
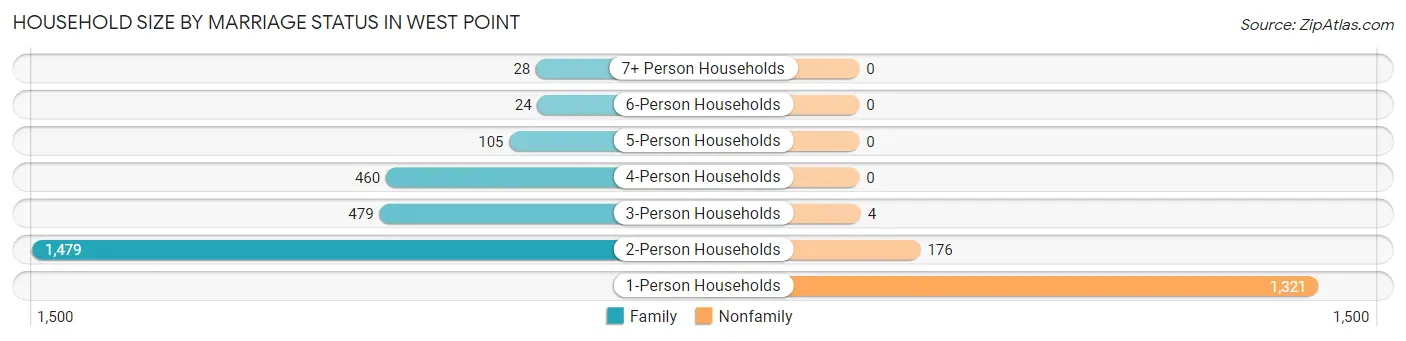
Household Size by Marriage Status in West Point
Out of a total of 4,076 households in West Point, 2,575 (63.2%) are family households, while 1,501 (36.8%) are nonfamily households. The most numerous type of family households are 2-person households, comprising 1,479, and the most common type of nonfamily households are 1-person households, comprising 1,321.
| Household Size | Family Households | Nonfamily Households |
| 1-Person Households | - | 1,321 (32.4%) |
| 2-Person Households | 1,479 (36.3%) | 176 (4.3%) |
| 3-Person Households | 479 (11.7%) | 4 (0.1%) |
| 4-Person Households | 460 (11.3%) | 0 (0.0%) |
| 5-Person Households | 105 (2.6%) | 0 (0.0%) |
| 6-Person Households | 24 (0.6%) | 0 (0.0%) |
| 7+ Person Households | 28 (0.7%) | 0 (0.0%) |
| Total | 2,575 (63.2%) | 1,501 (36.8%) |
Female Fertility in West Point
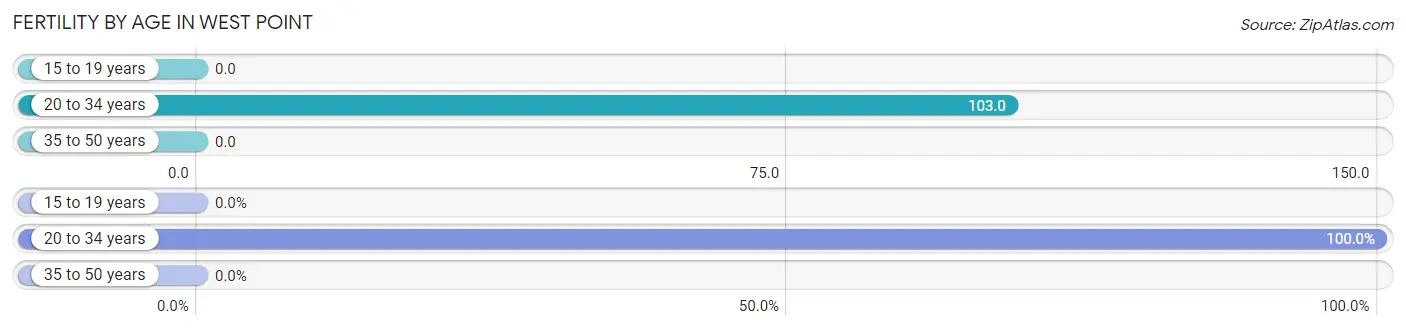
Fertility by Age in West Point
Average fertility rate in West Point is 46.0 births per 1,000 women. Women in the age bracket of 20 to 34 years have the highest fertility rate with 103.0 births per 1,000 women. Women in the age bracket of 20 to 34 years acount for 100.0% of all women with births.
| Age Bracket | Women with Births | Births / 1,000 Women |
| 15 to 19 years | 0 (0.0%) | 0.0 |
| 20 to 34 years | 111 (100.0%) | 103.0 |
| 35 to 50 years | 0 (0.0%) | 0.0 |
| Total | 111 (100.0%) | 46.0 |
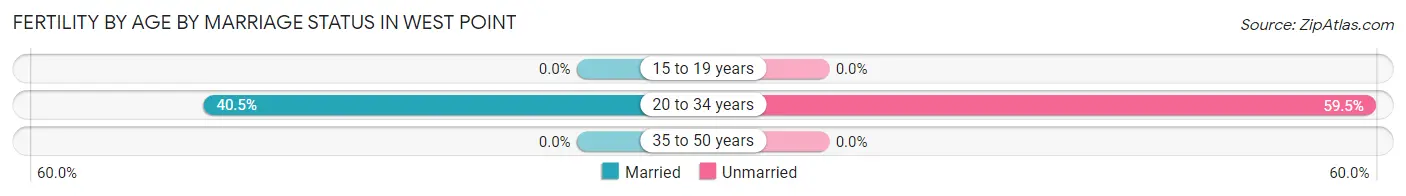
Fertility by Age by Marriage Status in West Point
40.5% of women with births (111) in West Point are married. The highest percentage of unmarried women with births falls into 20 to 34 years age bracket with 59.5% of them unmarried at the time of birth, while the lowest percentage of unmarried women with births belong to 20 to 34 years age bracket with 59.5% of them unmarried.
| Age Bracket | Married | Unmarried |
| 15 to 19 years | 0 (0.0%) | 0 (0.0%) |
| 20 to 34 years | 45 (40.5%) | 66 (59.5%) |
| 35 to 50 years | 0 (0.0%) | 0 (0.0%) |
| Total | 45 (40.5%) | 66 (59.5%) |
Fertility by Education in West Point
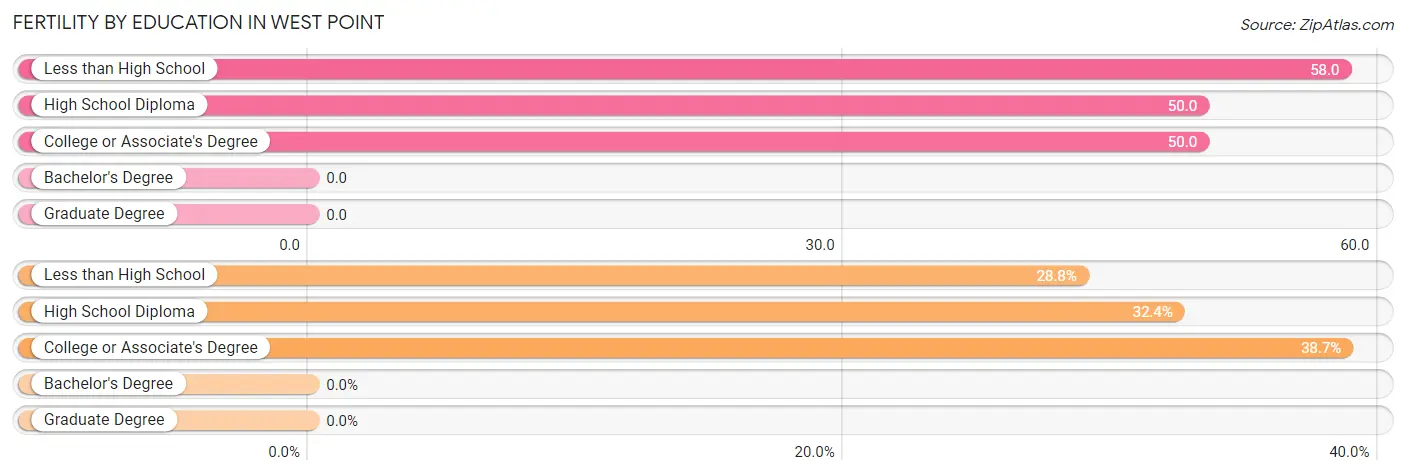
| Educational Attainment | Women with Births | Births / 1,000 Women |
| Less than High School | 32 (28.8%) | 58.0 |
| High School Diploma | 36 (32.4%) | 50.0 |
| College or Associate's Degree | 43 (38.7%) | 50.0 |
| Bachelor's Degree | 0 (0.0%) | 0.0 |
| Graduate Degree | 0 (0.0%) | 0.0 |
| Total | 111 (100.0%) | 46.0 |
Fertility by Education by Marriage Status in West Point
59.5% of women with births in West Point are unmarried. Women with the educational attainment of less than high school are most likely to be married with 100.0% of them married at childbirth, while women with the educational attainment of high school diploma are least likely to be married with 100.0% of them unmarried at childbirth.
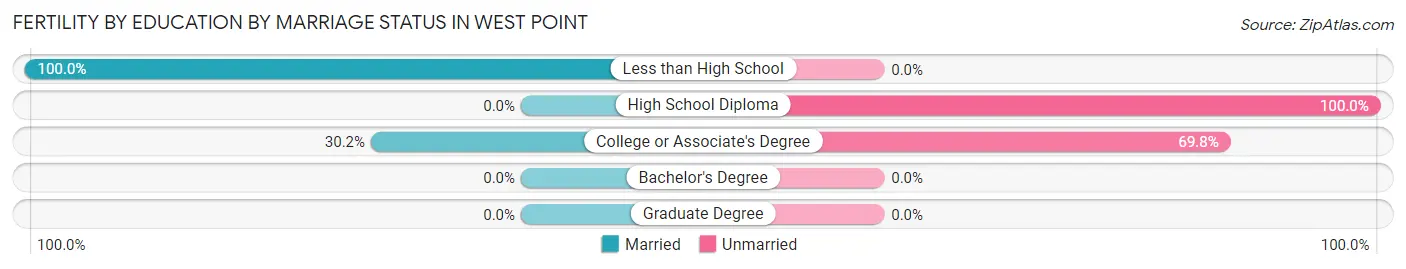
| Educational Attainment | Married | Unmarried |
| Less than High School | 32 (100.0%) | 0 (0.0%) |
| High School Diploma | 0 (0.0%) | 36 (100.0%) |
| College or Associate's Degree | 13 (30.2%) | 30 (69.8%) |
| Bachelor's Degree | 0 (0.0%) | 0 (0.0%) |
| Graduate Degree | 0 (0.0%) | 0 (0.0%) |
| Total | 45 (40.5%) | 66 (59.5%) |
Employment Characteristics in West Point
Employment by Class of Employer in West Point
Among the 3,617 employed individuals in West Point, private company employees (2,825 | 78.1%), local government employees (215 | 5.9%), and not-for-profit organizations (211 | 5.8%) make up the most common classes of employment.
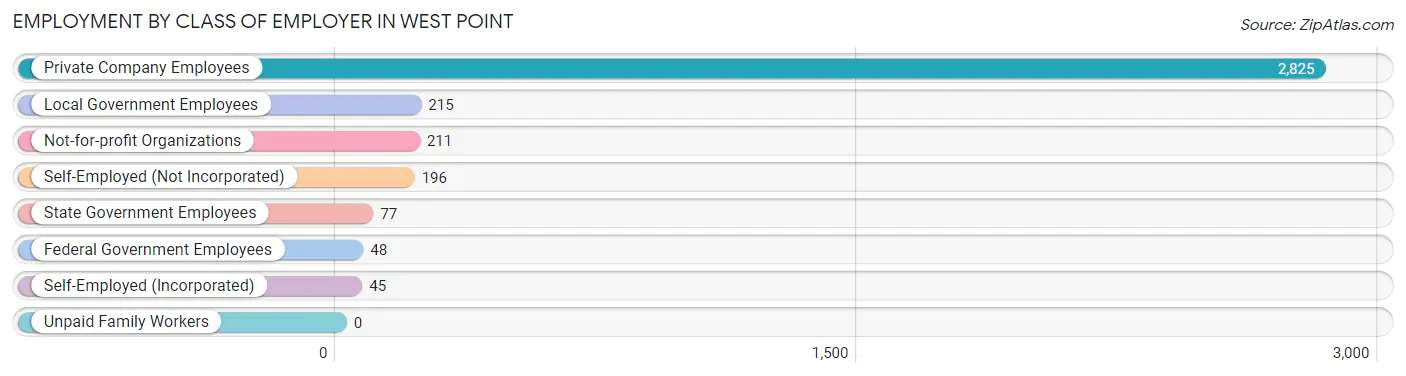
| Employer Class | # Employees | % Employees |
| Private Company Employees | 2,825 | 78.1% |
| Self-Employed (Incorporated) | 45 | 1.2% |
| Self-Employed (Not Incorporated) | 196 | 5.4% |
| Not-for-profit Organizations | 211 | 5.8% |
| Local Government Employees | 215 | 5.9% |
| State Government Employees | 77 | 2.1% |
| Federal Government Employees | 48 | 1.3% |
| Unpaid Family Workers | 0 | 0.0% |
| Total | 3,617 | 100.0% |
Employment Status by Age in West Point
According to the labor force statistics for West Point, out of the total population over 16 years of age (7,996), 51.6% or 4,126 individuals are in the labor force, with 11.0% or 454 of them unemployed. The age group with the highest labor force participation rate is 25 to 29 years, with 93.6% or 668 individuals in the labor force. Within the labor force, the 20 to 24 years age range has the highest percentage of unemployed individuals, with 22.4% or 91 of them being unemployed.
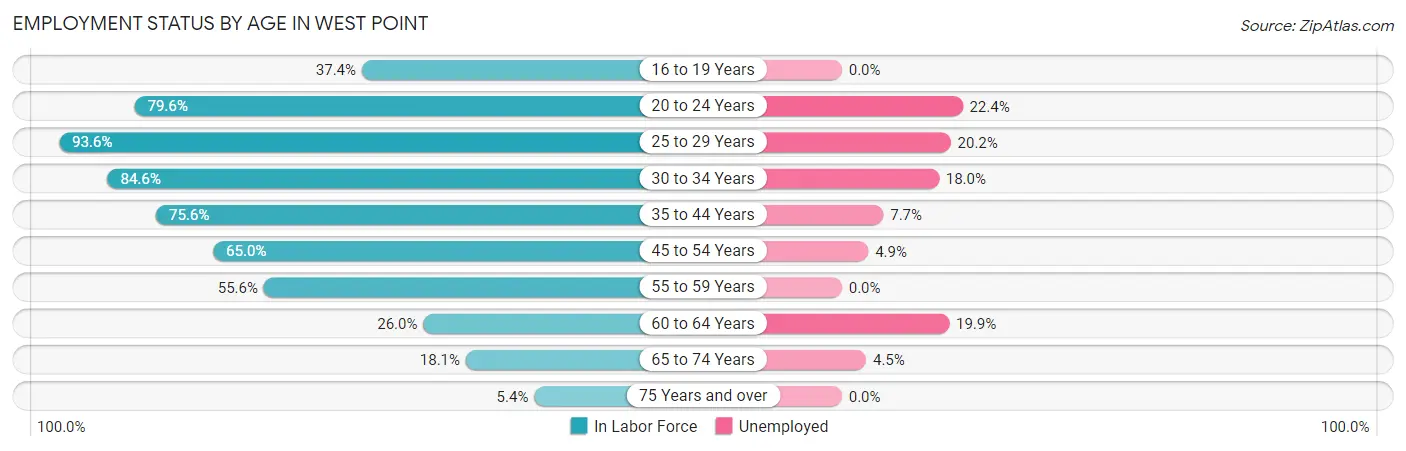
| Age Bracket | In Labor Force | Unemployed |
| 16 to 19 Years | 266 (37.4%) | 0 (0.0%) |
| 20 to 24 Years | 406 (79.6%) | 91 (22.4%) |
| 25 to 29 Years | 668 (93.6%) | 135 (20.2%) |
| 30 to 34 Years | 510 (84.6%) | 92 (18.0%) |
| 35 to 44 Years | 846 (75.6%) | 65 (7.7%) |
| 45 to 54 Years | 627 (65.0%) | 31 (4.9%) |
| 55 to 59 Years | 395 (55.6%) | 0 (0.0%) |
| 60 to 64 Years | 161 (26.0%) | 32 (19.9%) |
| 65 to 74 Years | 199 (18.1%) | 9 (4.5%) |
| 75 Years and over | 51 (5.4%) | 0 (0.0%) |
| Total | 4,126 (51.6%) | 454 (11.0%) |
Employment Status by Educational Attainment in West Point
According to labor force statistics for West Point, 67.8% of individuals (3,206) out of the total population between 25 and 64 years of age (4,729) are in the labor force, with 11.1% or 356 of them being unemployed. The group with the highest labor force participation rate are those with the educational attainment of bachelor's degree or higher, with 94.5% or 569 individuals in the labor force. Within the labor force, individuals with high school diploma education have the highest percentage of unemployment, with 18.7% or 171 of them being unemployed.
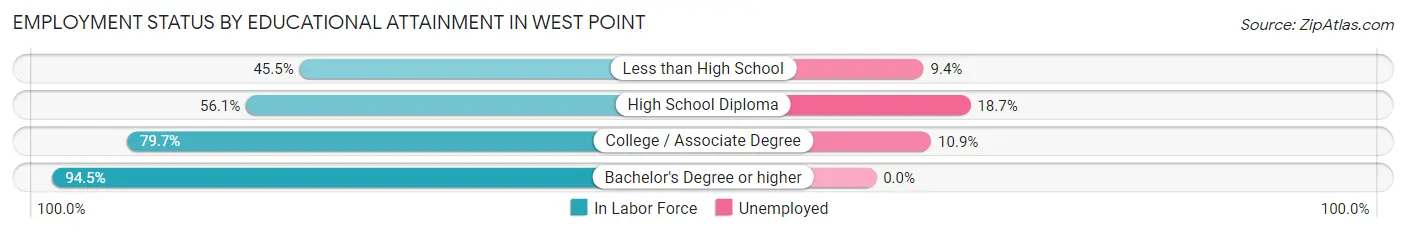
| Educational Attainment | In Labor Force | Unemployed |
| Less than High School | 352 (45.5%) | 73 (9.4%) |
| High School Diploma | 917 (56.1%) | 306 (18.7%) |
| College / Associate Degree | 1,371 (79.7%) | 187 (10.9%) |
| Bachelor's Degree or higher | 569 (94.5%) | 0 (0.0%) |
| Total | 3,206 (67.8%) | 525 (11.1%) |
Employment Occupations by Sex in West Point
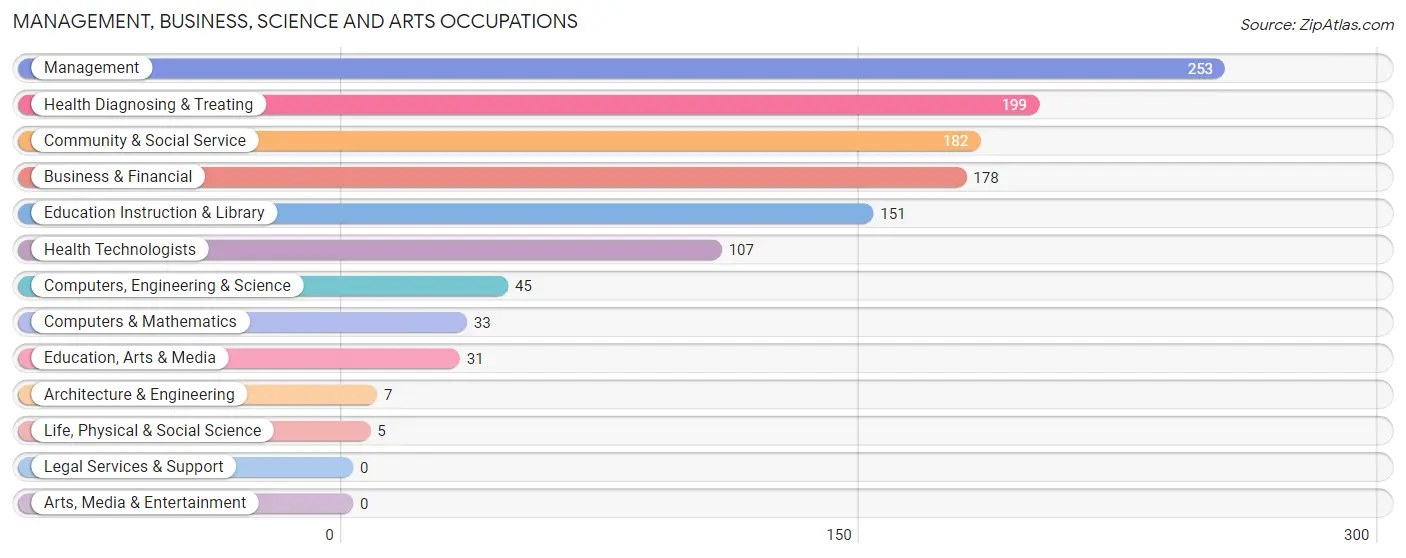
Management, Business, Science and Arts Occupations
The most common Management, Business, Science and Arts occupations in West Point are Management (253 | 6.9%), Health Diagnosing & Treating (199 | 5.4%), Community & Social Service (182 | 5.0%), Business & Financial (178 | 4.9%), and Education Instruction & Library (151 | 4.1%).
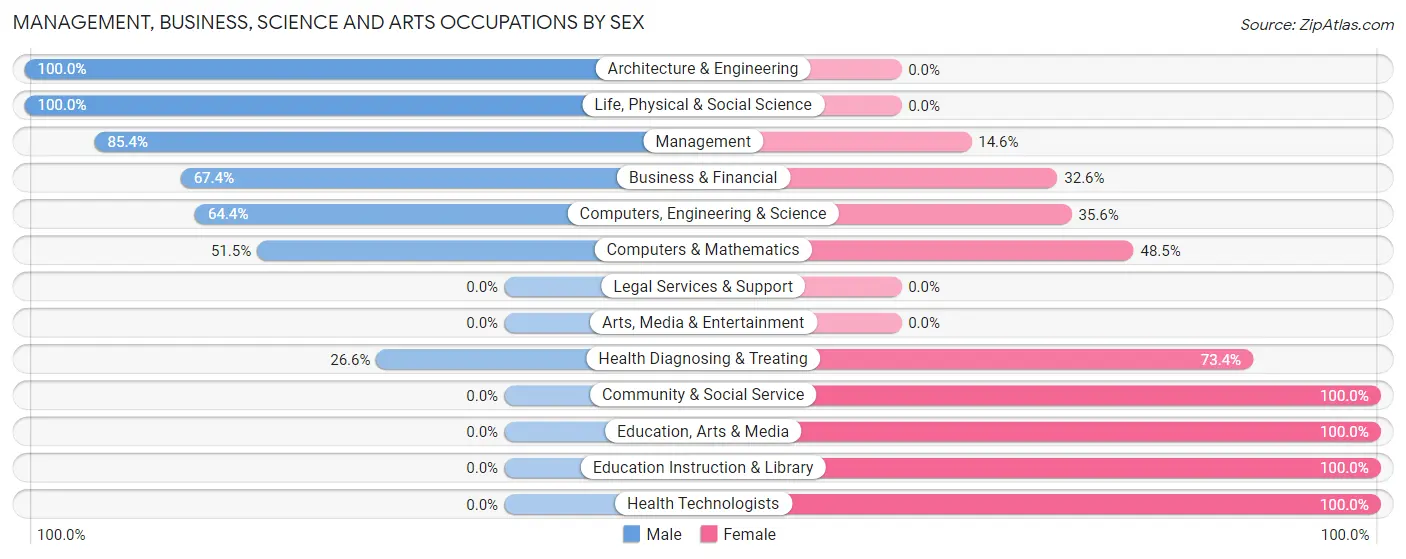
Management, Business, Science and Arts Occupations by Sex
Within the Management, Business, Science and Arts occupations in West Point, the most male-oriented occupations are Architecture & Engineering (100.0%), Life, Physical & Social Science (100.0%), and Management (85.4%), while the most female-oriented occupations are Community & Social Service (100.0%), Education, Arts & Media (100.0%), and Education Instruction & Library (100.0%).
| Occupation | Male | Female |
| Management | 216 (85.4%) | 37 (14.6%) |
| Business & Financial | 120 (67.4%) | 58 (32.6%) |
| Computers, Engineering & Science | 29 (64.4%) | 16 (35.6%) |
| Computers & Mathematics | 17 (51.5%) | 16 (48.5%) |
| Architecture & Engineering | 7 (100.0%) | 0 (0.0%) |
| Life, Physical & Social Science | 5 (100.0%) | 0 (0.0%) |
| Community & Social Service | 0 (0.0%) | 182 (100.0%) |
| Education, Arts & Media | 0 (0.0%) | 31 (100.0%) |
| Legal Services & Support | 0 (0.0%) | 0 (0.0%) |
| Education Instruction & Library | 0 (0.0%) | 151 (100.0%) |
| Arts, Media & Entertainment | 0 (0.0%) | 0 (0.0%) |
| Health Diagnosing & Treating | 53 (26.6%) | 146 (73.4%) |
| Health Technologists | 0 (0.0%) | 107 (100.0%) |
| Total (Category) | 418 (48.8%) | 439 (51.2%) |
| Total (Overall) | 1,676 (45.9%) | 1,976 (54.1%) |
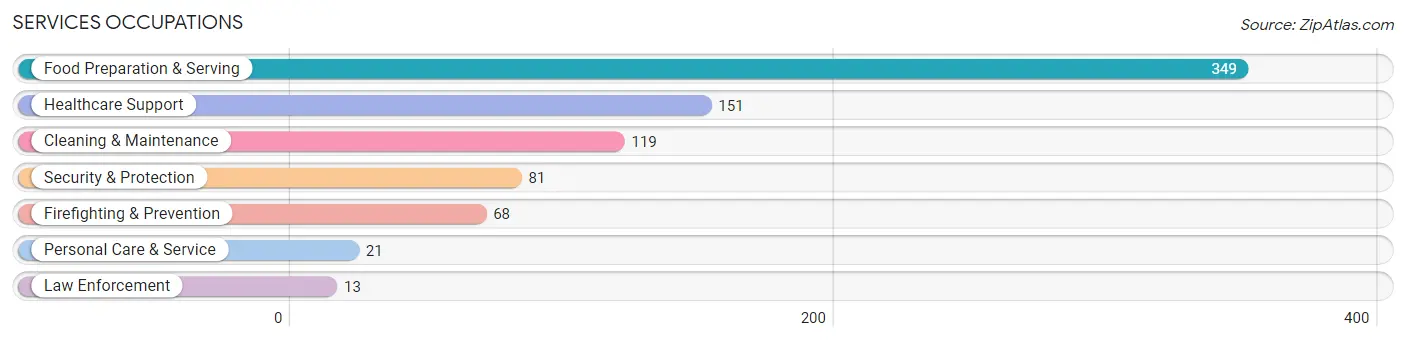
Services Occupations
The most common Services occupations in West Point are Food Preparation & Serving (349 | 9.6%), Healthcare Support (151 | 4.1%), Cleaning & Maintenance (119 | 3.3%), Security & Protection (81 | 2.2%), and Firefighting & Prevention (68 | 1.9%).
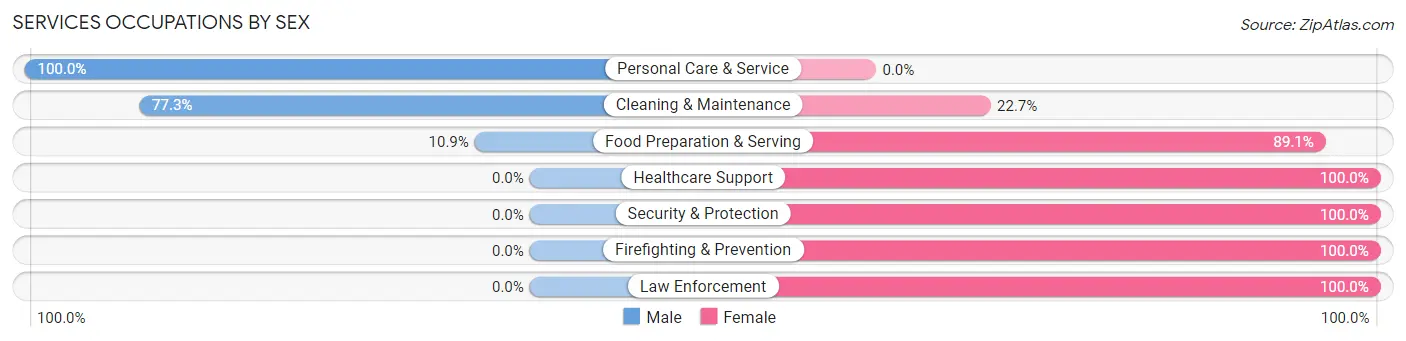
Services Occupations by Sex
Within the Services occupations in West Point, the most male-oriented occupations are Personal Care & Service (100.0%), Cleaning & Maintenance (77.3%), and Food Preparation & Serving (10.9%), while the most female-oriented occupations are Healthcare Support (100.0%), Security & Protection (100.0%), and Firefighting & Prevention (100.0%).
| Occupation | Male | Female |
| Healthcare Support | 0 (0.0%) | 151 (100.0%) |
| Security & Protection | 0 (0.0%) | 81 (100.0%) |
| Firefighting & Prevention | 0 (0.0%) | 68 (100.0%) |
| Law Enforcement | 0 (0.0%) | 13 (100.0%) |
| Food Preparation & Serving | 38 (10.9%) | 311 (89.1%) |
| Cleaning & Maintenance | 92 (77.3%) | 27 (22.7%) |
| Personal Care & Service | 21 (100.0%) | 0 (0.0%) |
| Total (Category) | 151 (20.9%) | 570 (79.1%) |
| Total (Overall) | 1,676 (45.9%) | 1,976 (54.1%) |
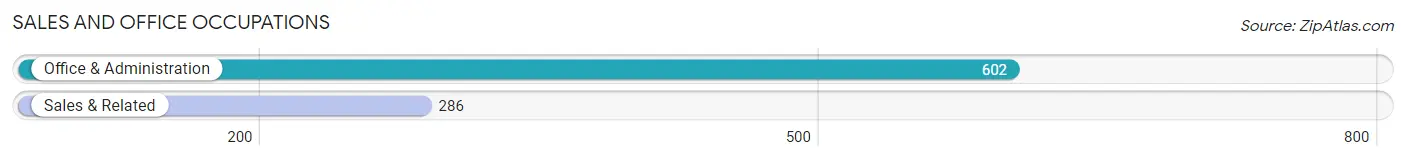
Sales and Office Occupations
The most common Sales and Office occupations in West Point are Office & Administration (602 | 16.5%), and Sales & Related (286 | 7.8%).
Sales and Office Occupations by Sex
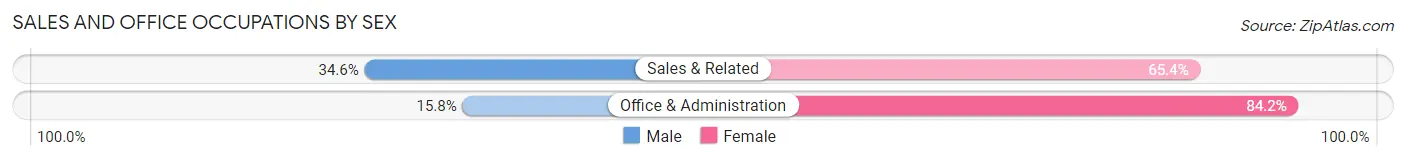
| Occupation | Male | Female |
| Sales & Related | 99 (34.6%) | 187 (65.4%) |
| Office & Administration | 95 (15.8%) | 507 (84.2%) |
| Total (Category) | 194 (21.8%) | 694 (78.1%) |
| Total (Overall) | 1,676 (45.9%) | 1,976 (54.1%) |
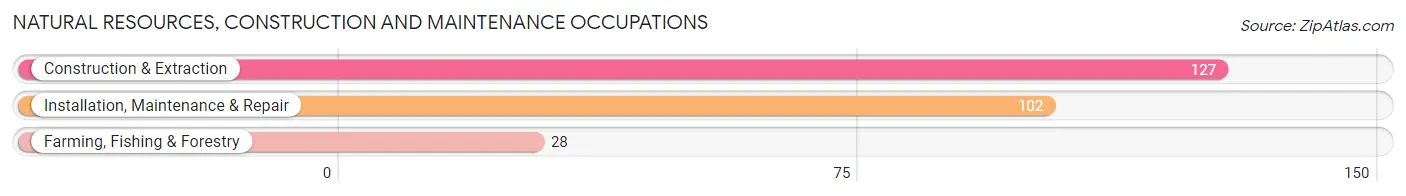
Natural Resources, Construction and Maintenance Occupations
The most common Natural Resources, Construction and Maintenance occupations in West Point are Construction & Extraction (127 | 3.5%), Installation, Maintenance & Repair (102 | 2.8%), and Farming, Fishing & Forestry (28 | 0.8%).
Natural Resources, Construction and Maintenance Occupations by Sex
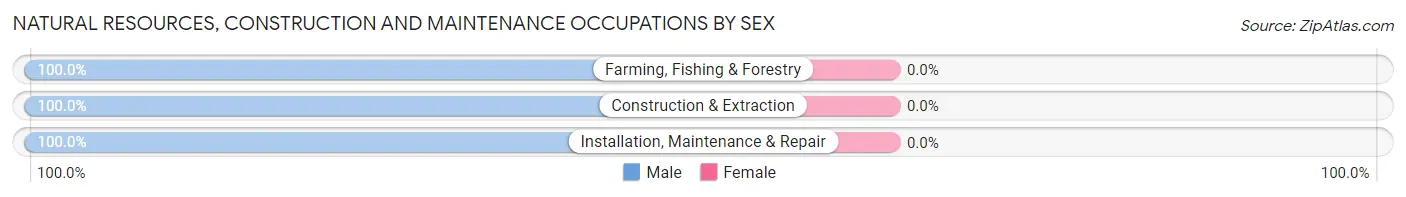
| Occupation | Male | Female |
| Farming, Fishing & Forestry | 28 (100.0%) | 0 (0.0%) |
| Construction & Extraction | 127 (100.0%) | 0 (0.0%) |
| Installation, Maintenance & Repair | 102 (100.0%) | 0 (0.0%) |
| Total (Category) | 257 (100.0%) | 0 (0.0%) |
| Total (Overall) | 1,676 (45.9%) | 1,976 (54.1%) |
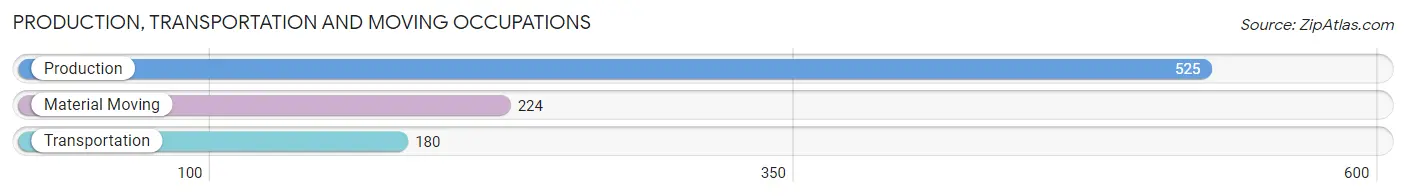
Production, Transportation and Moving Occupations
The most common Production, Transportation and Moving occupations in West Point are Production (525 | 14.4%), Material Moving (224 | 6.1%), and Transportation (180 | 4.9%).
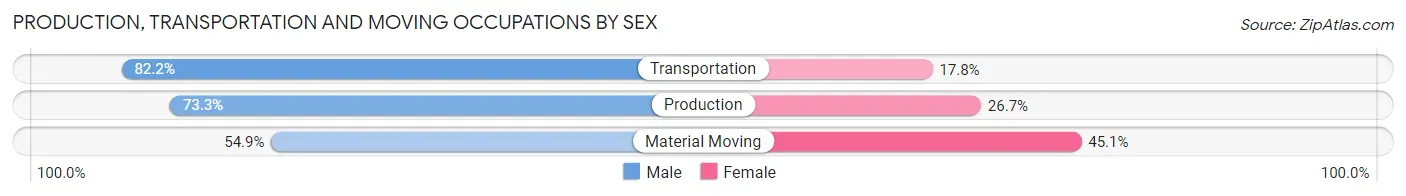
Production, Transportation and Moving Occupations by Sex
| Occupation | Male | Female |
| Production | 385 (73.3%) | 140 (26.7%) |
| Transportation | 148 (82.2%) | 32 (17.8%) |
| Material Moving | 123 (54.9%) | 101 (45.1%) |
| Total (Category) | 656 (70.6%) | 273 (29.4%) |
| Total (Overall) | 1,676 (45.9%) | 1,976 (54.1%) |
Employment Industries by Sex in West Point
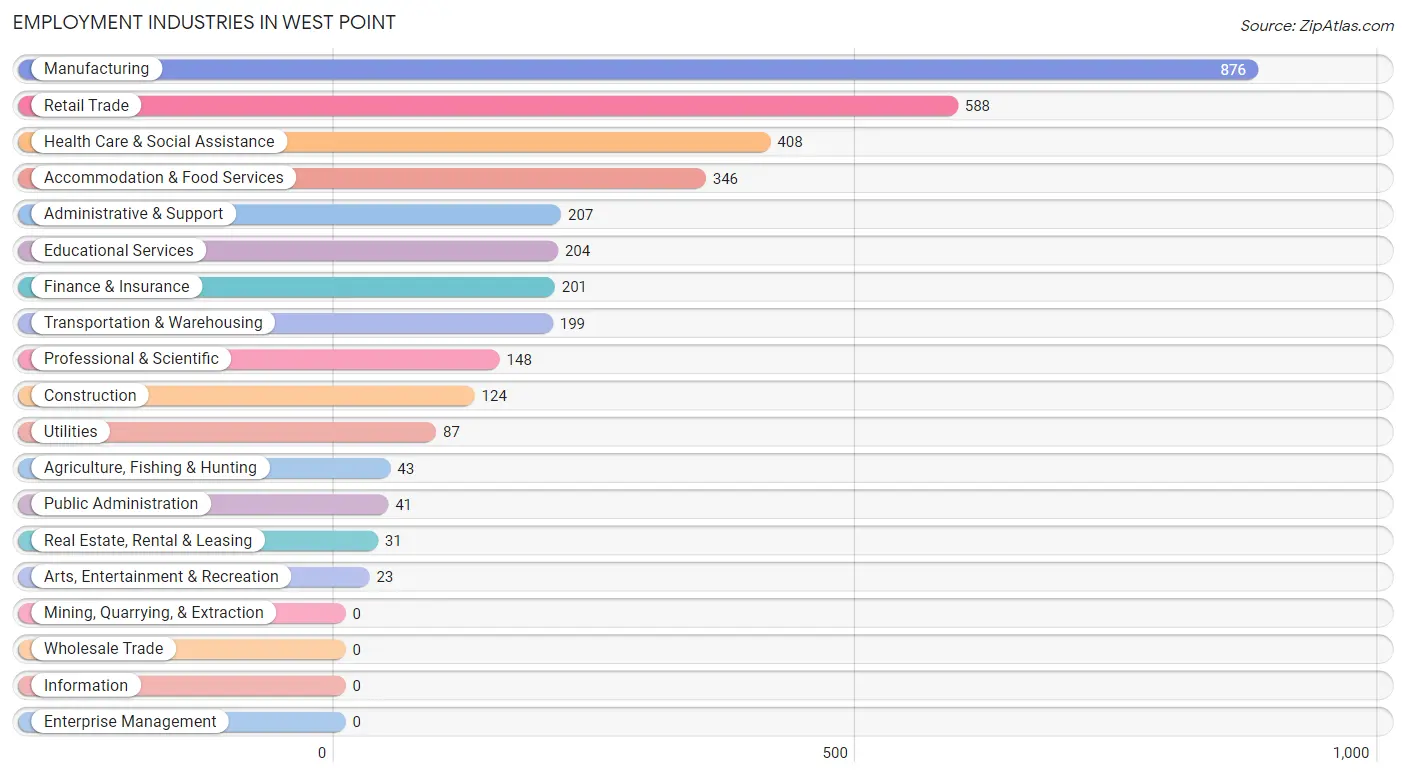
Employment Industries in West Point
The major employment industries in West Point include Manufacturing (876 | 24.0%), Retail Trade (588 | 16.1%), Health Care & Social Assistance (408 | 11.2%), Accommodation & Food Services (346 | 9.5%), and Administrative & Support (207 | 5.7%).
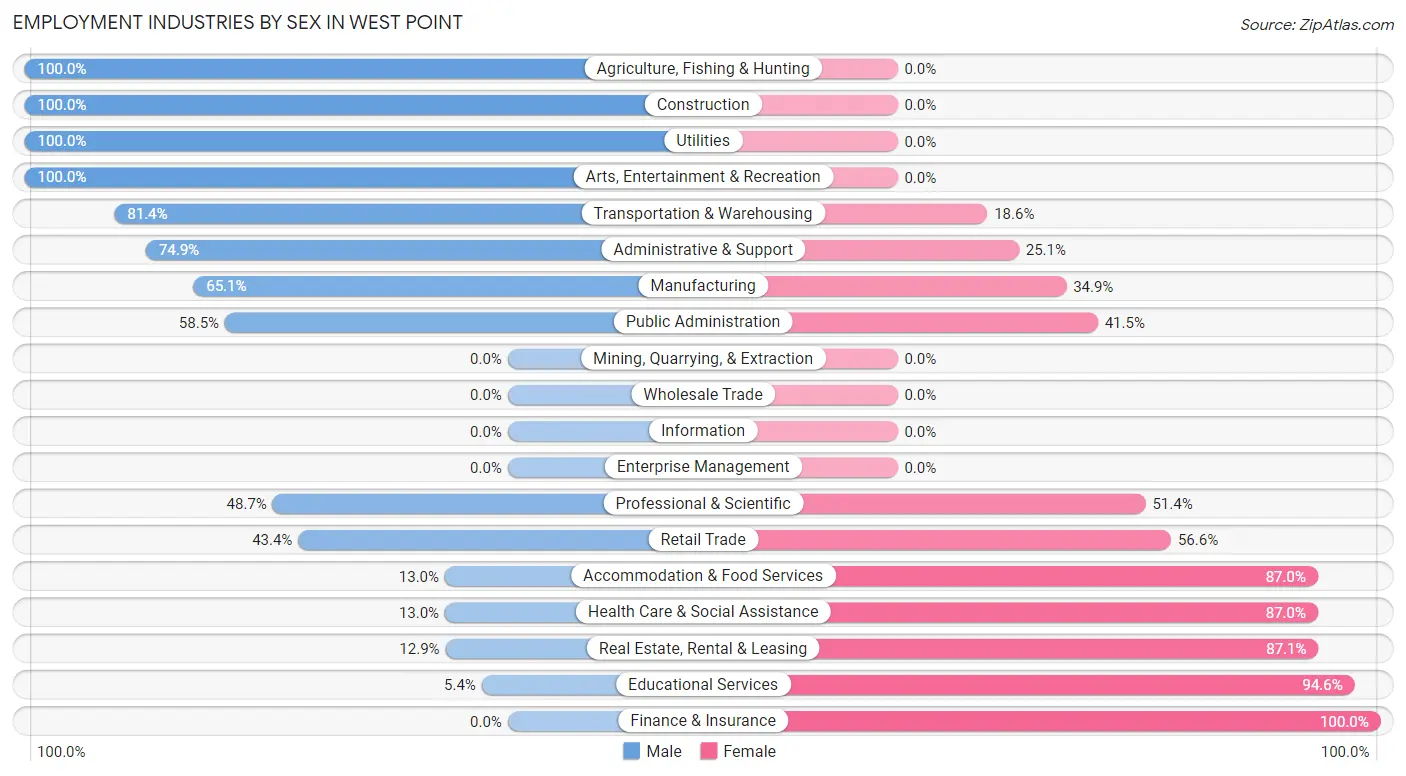
Employment Industries by Sex in West Point
The West Point industries that see more men than women are Agriculture, Fishing & Hunting (100.0%), Construction (100.0%), and Utilities (100.0%), whereas the industries that tend to have a higher number of women are Finance & Insurance (100.0%), Educational Services (94.6%), and Real Estate, Rental & Leasing (87.1%).
| Industry | Male | Female |
| Agriculture, Fishing & Hunting | 43 (100.0%) | 0 (0.0%) |
| Mining, Quarrying, & Extraction | 0 (0.0%) | 0 (0.0%) |
| Construction | 124 (100.0%) | 0 (0.0%) |
| Manufacturing | 570 (65.1%) | 306 (34.9%) |
| Wholesale Trade | 0 (0.0%) | 0 (0.0%) |
| Retail Trade | 255 (43.4%) | 333 (56.6%) |
| Transportation & Warehousing | 162 (81.4%) | 37 (18.6%) |
| Utilities | 87 (100.0%) | 0 (0.0%) |
| Information | 0 (0.0%) | 0 (0.0%) |
| Finance & Insurance | 0 (0.0%) | 201 (100.0%) |
| Real Estate, Rental & Leasing | 4 (12.9%) | 27 (87.1%) |
| Professional & Scientific | 72 (48.6%) | 76 (51.3%) |
| Enterprise Management | 0 (0.0%) | 0 (0.0%) |
| Administrative & Support | 155 (74.9%) | 52 (25.1%) |
| Educational Services | 11 (5.4%) | 193 (94.6%) |
| Health Care & Social Assistance | 53 (13.0%) | 355 (87.0%) |
| Arts, Entertainment & Recreation | 23 (100.0%) | 0 (0.0%) |
| Accommodation & Food Services | 45 (13.0%) | 301 (87.0%) |
| Public Administration | 24 (58.5%) | 17 (41.5%) |
| Total | 1,676 (45.9%) | 1,976 (54.1%) |
Education in West Point
School Enrollment in West Point
The most common levels of schooling among the 2,164 students in West Point are elementary school (633 | 29.2%), high school (498 | 23.0%), and middle school (478 | 22.1%).
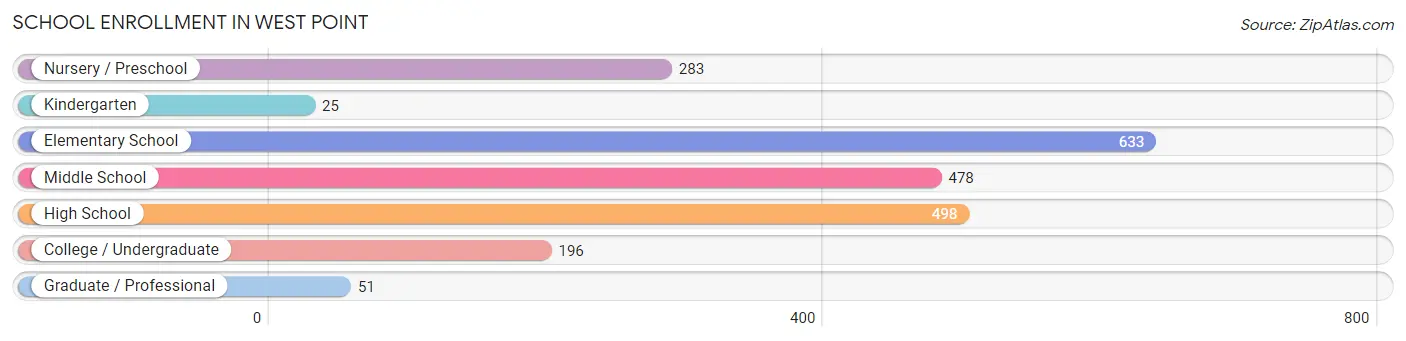
| School Level | # Students | % Students |
| Nursery / Preschool | 283 | 13.1% |
| Kindergarten | 25 | 1.2% |
| Elementary School | 633 | 29.2% |
| Middle School | 478 | 22.1% |
| High School | 498 | 23.0% |
| College / Undergraduate | 196 | 9.1% |
| Graduate / Professional | 51 | 2.4% |
| Total | 2,164 | 100.0% |
School Enrollment by Age by Funding Source in West Point
Out of a total of 2,164 students who are enrolled in schools in West Point, 307 (14.2%) attend a private institution, while the remaining 1,857 (85.8%) are enrolled in public schools. The age group of 5 to 9 year old has the highest likelihood of being enrolled in private schools, with 123 (22.9% in the age bracket) enrolled. Conversely, the age group of 18 to 19 year olds has the lowest likelihood of being enrolled in a private school, with 125 (100.0% in the age bracket) attending a public institution.
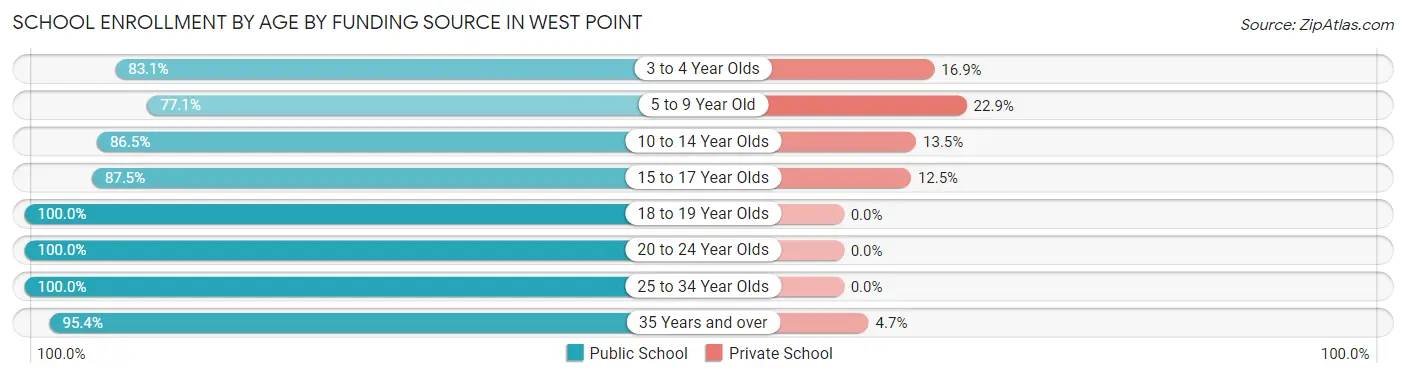
| Age Bracket | Public School | Private School |
| 3 to 4 Year Olds | 177 (83.1%) | 36 (16.9%) |
| 5 to 9 Year Old | 414 (77.1%) | 123 (22.9%) |
| 10 to 14 Year Olds | 590 (86.5%) | 92 (13.5%) |
| 15 to 17 Year Olds | 377 (87.5%) | 54 (12.5%) |
| 18 to 19 Year Olds | 125 (100.0%) | 0 (0.0%) |
| 20 to 24 Year Olds | 79 (100.0%) | 0 (0.0%) |
| 25 to 34 Year Olds | 54 (100.0%) | 0 (0.0%) |
| 35 Years and over | 41 (95.4%) | 2 (4.6%) |
| Total | 1,857 (85.8%) | 307 (14.2%) |
Educational Attainment by Field of Study in West Point
Education (294 | 27.8%), business (184 | 17.4%), science & technology (144 | 13.6%), arts & humanities (140 | 13.2%), and bio, nature & agricultural (105 | 9.9%) are the most common fields of study among 1,059 individuals in West Point who have obtained a bachelor's degree or higher.
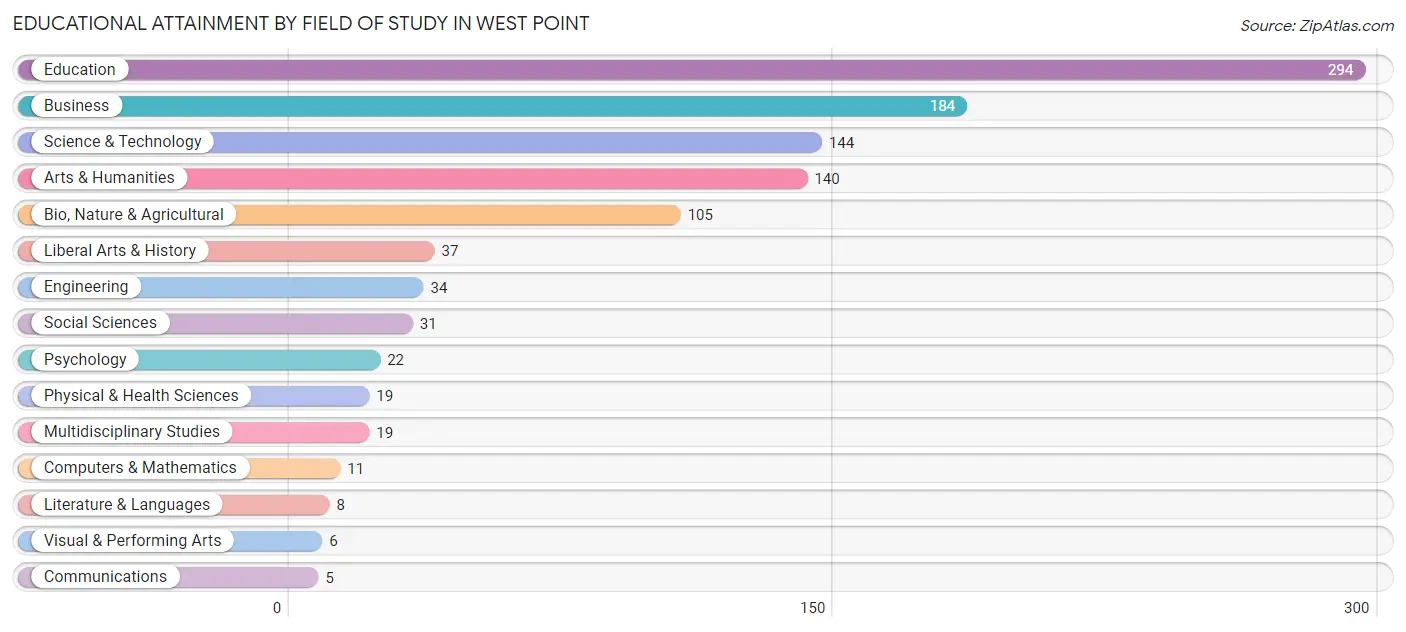
| Field of Study | # Graduates | % Graduates |
| Computers & Mathematics | 11 | 1.0% |
| Bio, Nature & Agricultural | 105 | 9.9% |
| Physical & Health Sciences | 19 | 1.8% |
| Psychology | 22 | 2.1% |
| Social Sciences | 31 | 2.9% |
| Engineering | 34 | 3.2% |
| Multidisciplinary Studies | 19 | 1.8% |
| Science & Technology | 144 | 13.6% |
| Business | 184 | 17.4% |
| Education | 294 | 27.8% |
| Literature & Languages | 8 | 0.8% |
| Liberal Arts & History | 37 | 3.5% |
| Visual & Performing Arts | 6 | 0.6% |
| Communications | 5 | 0.5% |
| Arts & Humanities | 140 | 13.2% |
| Total | 1,059 | 100.0% |
Transportation & Commute in West Point
Vehicle Availability by Sex in West Point
The most prevalent vehicle ownership categories in West Point are males with 2 vehicles (578, accounting for 34.1%) and females with 2 vehicles (718, making up 30.1%).
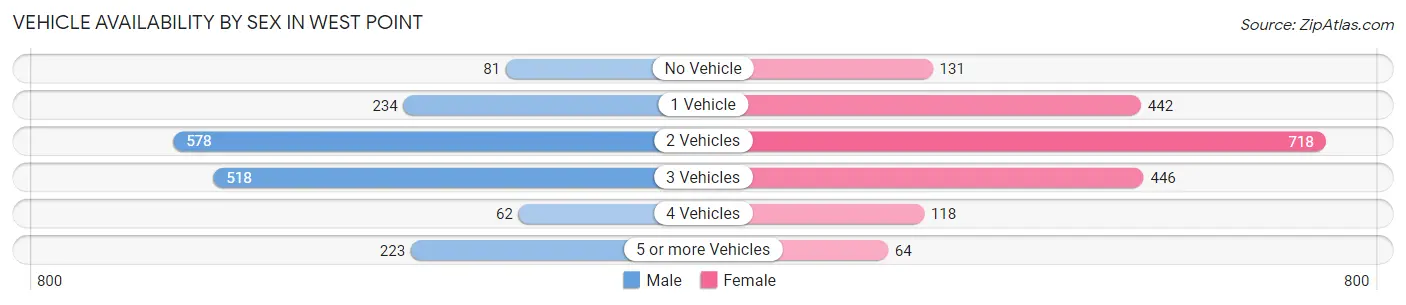
| Vehicles Available | Male | Female |
| No Vehicle | 81 (4.8%) | 131 (6.8%) |
| 1 Vehicle | 234 (13.8%) | 442 (23.0%) |
| 2 Vehicles | 578 (34.1%) | 718 (37.4%) |
| 3 Vehicles | 518 (30.5%) | 446 (23.2%) |
| 4 Vehicles | 62 (3.7%) | 118 (6.1%) |
| 5 or more Vehicles | 223 (13.2%) | 64 (3.3%) |
| Total | 1,696 (100.0%) | 1,919 (100.0%) |
Commute Time in West Point
The most frequently occuring commute durations in West Point are 10 to 14 minutes (1,015 commuters, 29.9%), 5 to 9 minutes (722 commuters, 21.3%), and 20 to 24 minutes (474 commuters, 14.0%).
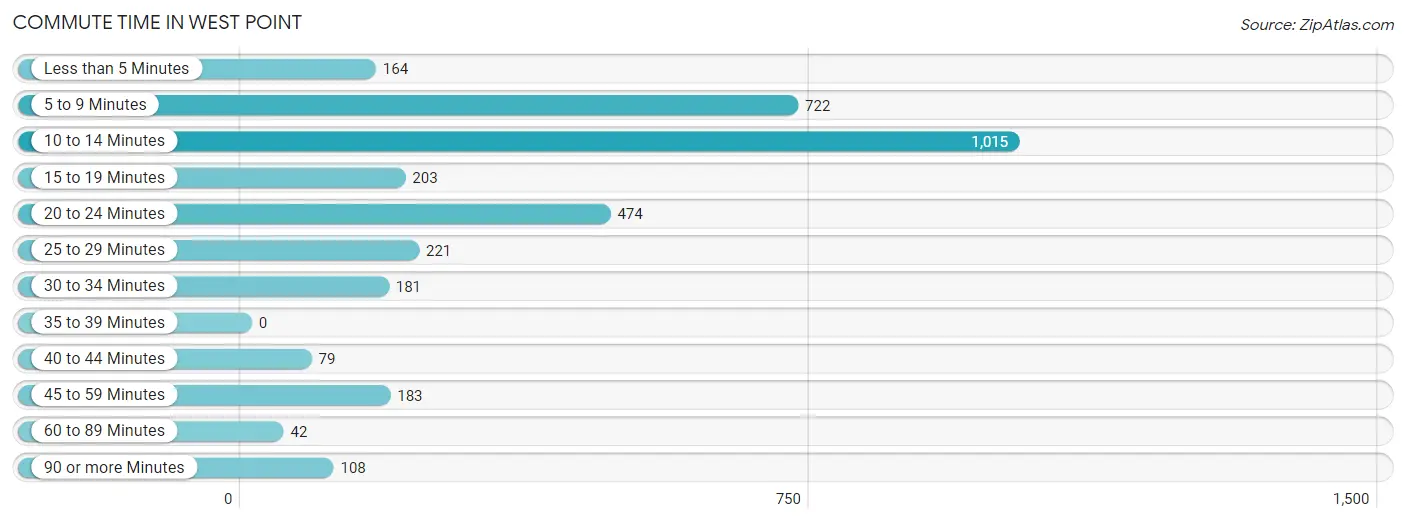
| Commute Time | # Commuters | % Commuters |
| Less than 5 Minutes | 164 | 4.8% |
| 5 to 9 Minutes | 722 | 21.3% |
| 10 to 14 Minutes | 1,015 | 29.9% |
| 15 to 19 Minutes | 203 | 6.0% |
| 20 to 24 Minutes | 474 | 14.0% |
| 25 to 29 Minutes | 221 | 6.5% |
| 30 to 34 Minutes | 181 | 5.3% |
| 35 to 39 Minutes | 0 | 0.0% |
| 40 to 44 Minutes | 79 | 2.3% |
| 45 to 59 Minutes | 183 | 5.4% |
| 60 to 89 Minutes | 42 | 1.2% |
| 90 or more Minutes | 108 | 3.2% |
Commute Time by Sex in West Point
The most common commute times in West Point are 10 to 14 minutes (493 commuters, 32.4%) for males and 5 to 9 minutes (537 commuters, 28.7%) for females.
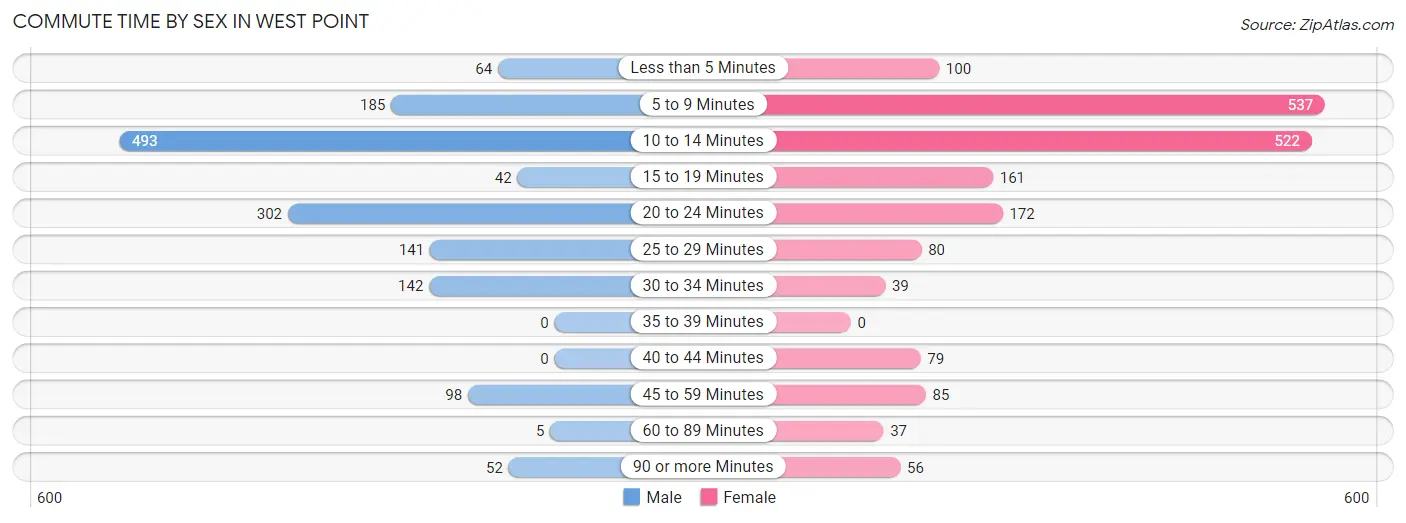
| Commute Time | Male | Female |
| Less than 5 Minutes | 64 (4.2%) | 100 (5.3%) |
| 5 to 9 Minutes | 185 (12.1%) | 537 (28.7%) |
| 10 to 14 Minutes | 493 (32.4%) | 522 (27.9%) |
| 15 to 19 Minutes | 42 (2.8%) | 161 (8.6%) |
| 20 to 24 Minutes | 302 (19.8%) | 172 (9.2%) |
| 25 to 29 Minutes | 141 (9.2%) | 80 (4.3%) |
| 30 to 34 Minutes | 142 (9.3%) | 39 (2.1%) |
| 35 to 39 Minutes | 0 (0.0%) | 0 (0.0%) |
| 40 to 44 Minutes | 0 (0.0%) | 79 (4.2%) |
| 45 to 59 Minutes | 98 (6.4%) | 85 (4.5%) |
| 60 to 89 Minutes | 5 (0.3%) | 37 (2.0%) |
| 90 or more Minutes | 52 (3.4%) | 56 (3.0%) |
Time of Departure to Work by Sex in West Point
The most frequent times of departure to work in West Point are 7:00 AM to 7:29 AM (363, 23.8%) for males and 8:00 AM to 8:29 AM (363, 19.4%) for females.
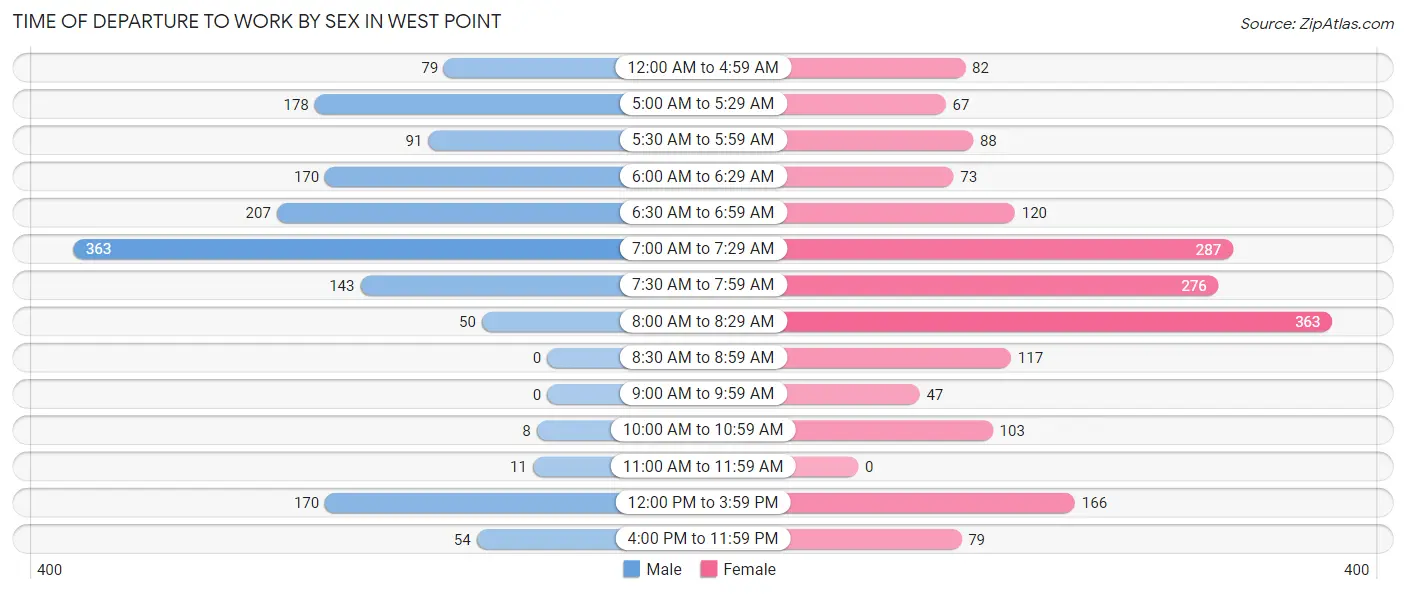
| Time of Departure | Male | Female |
| 12:00 AM to 4:59 AM | 79 (5.2%) | 82 (4.4%) |
| 5:00 AM to 5:29 AM | 178 (11.7%) | 67 (3.6%) |
| 5:30 AM to 5:59 AM | 91 (6.0%) | 88 (4.7%) |
| 6:00 AM to 6:29 AM | 170 (11.2%) | 73 (3.9%) |
| 6:30 AM to 6:59 AM | 207 (13.6%) | 120 (6.4%) |
| 7:00 AM to 7:29 AM | 363 (23.8%) | 287 (15.4%) |
| 7:30 AM to 7:59 AM | 143 (9.4%) | 276 (14.8%) |
| 8:00 AM to 8:29 AM | 50 (3.3%) | 363 (19.4%) |
| 8:30 AM to 8:59 AM | 0 (0.0%) | 117 (6.3%) |
| 9:00 AM to 9:59 AM | 0 (0.0%) | 47 (2.5%) |
| 10:00 AM to 10:59 AM | 8 (0.5%) | 103 (5.5%) |
| 11:00 AM to 11:59 AM | 11 (0.7%) | 0 (0.0%) |
| 12:00 PM to 3:59 PM | 170 (11.2%) | 166 (8.9%) |
| 4:00 PM to 11:59 PM | 54 (3.5%) | 79 (4.2%) |
| Total | 1,524 (100.0%) | 1,868 (100.0%) |
Housing Occupancy in West Point
Occupancy by Ownership in West Point
Of the total 4,076 dwellings in West Point, owner-occupied units account for 2,439 (59.8%), while renter-occupied units make up 1,637 (40.2%).
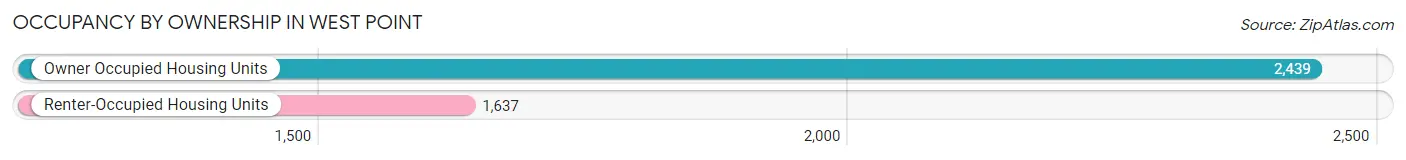
| Occupancy | # Housing Units | % Housing Units |
| Owner Occupied Housing Units | 2,439 | 59.8% |
| Renter-Occupied Housing Units | 1,637 | 40.2% |
| Total Occupied Housing Units | 4,076 | 100.0% |
Occupancy by Household Size in West Point
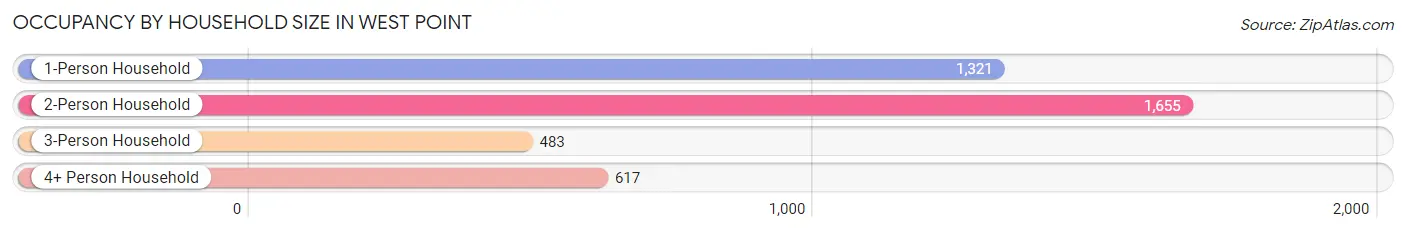
| Household Size | # Housing Units | % Housing Units |
| 1-Person Household | 1,321 | 32.4% |
| 2-Person Household | 1,655 | 40.6% |
| 3-Person Household | 483 | 11.8% |
| 4+ Person Household | 617 | 15.1% |
| Total Housing Units | 4,076 | 100.0% |
Occupancy by Ownership by Household Size in West Point
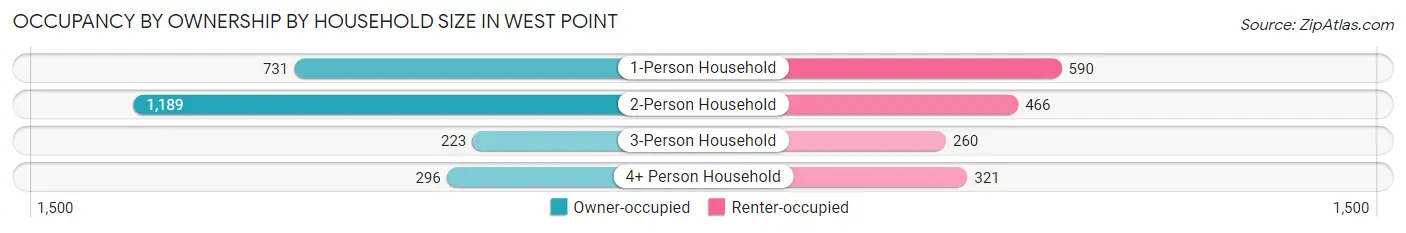
| Household Size | Owner-occupied | Renter-occupied |
| 1-Person Household | 731 (55.3%) | 590 (44.7%) |
| 2-Person Household | 1,189 (71.8%) | 466 (28.2%) |
| 3-Person Household | 223 (46.2%) | 260 (53.8%) |
| 4+ Person Household | 296 (48.0%) | 321 (52.0%) |
| Total Housing Units | 2,439 (59.8%) | 1,637 (40.2%) |
Occupancy by Educational Attainment in West Point
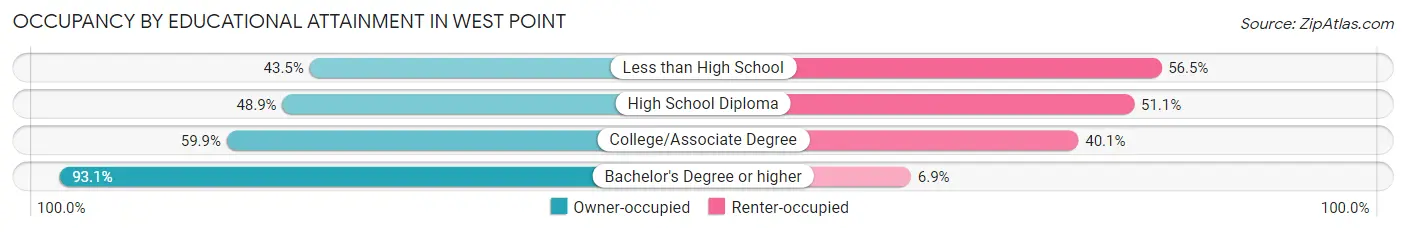
| Household Size | Owner-occupied | Renter-occupied |
| Less than High School | 284 (43.5%) | 369 (56.5%) |
| High School Diploma | 653 (48.9%) | 683 (51.1%) |
| College/Associate Degree | 797 (59.9%) | 533 (40.1%) |
| Bachelor's Degree or higher | 705 (93.1%) | 52 (6.9%) |
Occupancy by Age of Householder in West Point
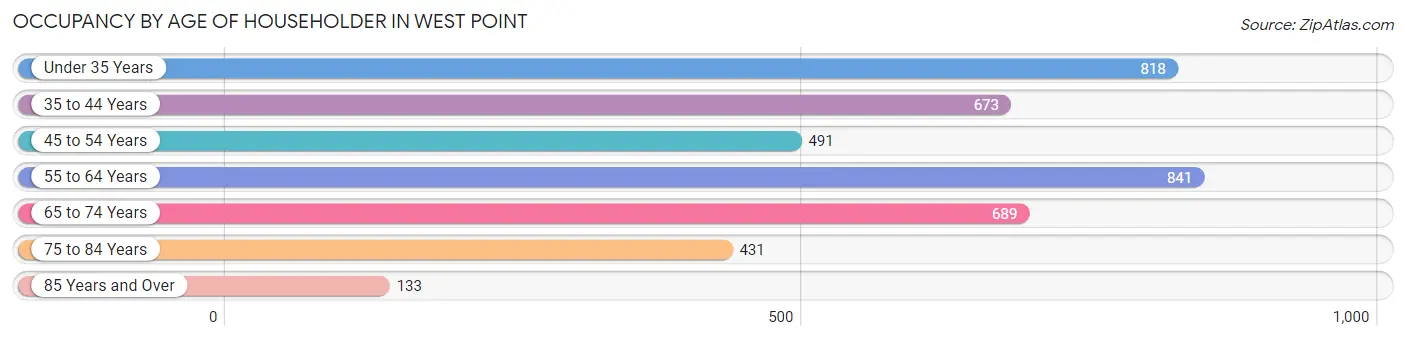
| Age Bracket | # Households | % Households |
| Under 35 Years | 818 | 20.1% |
| 35 to 44 Years | 673 | 16.5% |
| 45 to 54 Years | 491 | 12.0% |
| 55 to 64 Years | 841 | 20.6% |
| 65 to 74 Years | 689 | 16.9% |
| 75 to 84 Years | 431 | 10.6% |
| 85 Years and Over | 133 | 3.3% |
| Total | 4,076 | 100.0% |
Housing Finances in West Point
Median Income by Occupancy in West Point
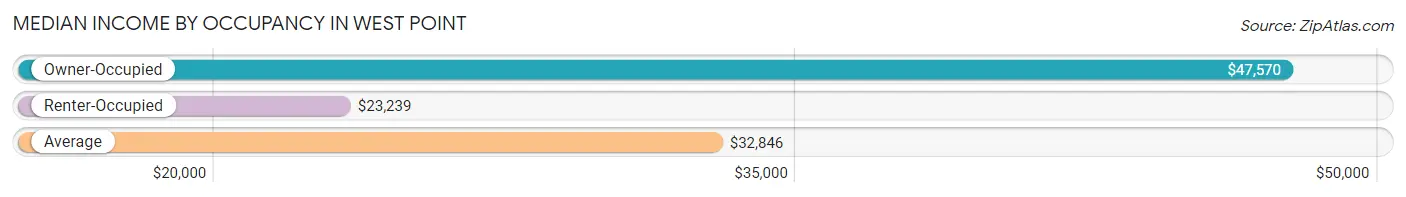
| Occupancy Type | # Households | Median Income |
| Owner-Occupied | 2,439 (59.8%) | $47,570 |
| Renter-Occupied | 1,637 (40.2%) | $23,239 |
| Average | 4,076 (100.0%) | $32,846 |
Occupancy by Householder Income Bracket in West Point
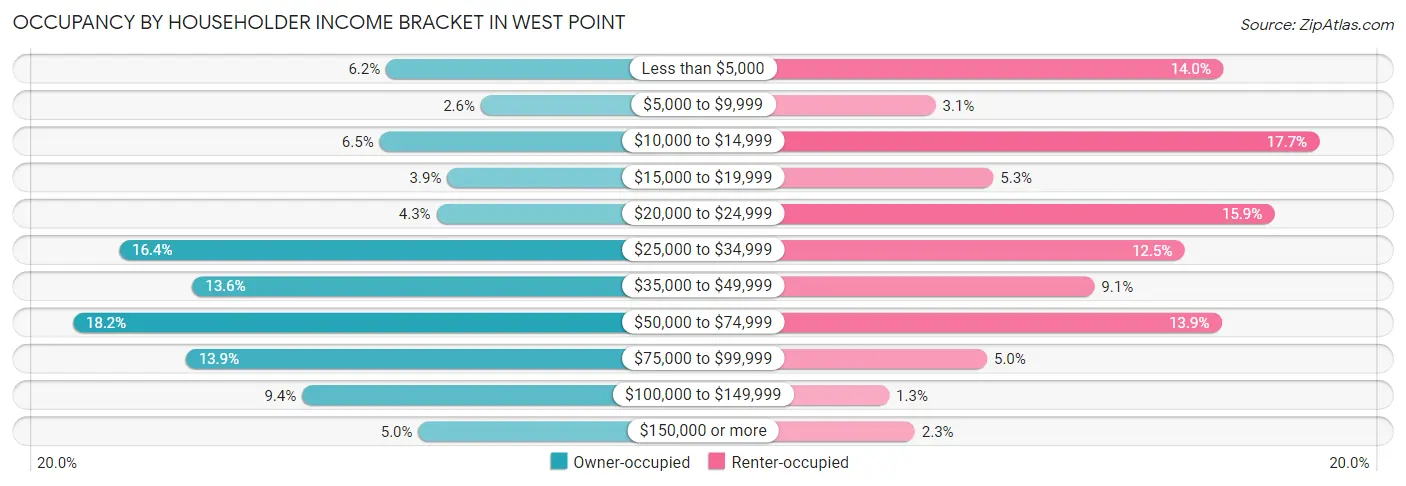
| Income Bracket | Owner-occupied | Renter-occupied |
| Less than $5,000 | 152 (6.2%) | 229 (14.0%) |
| $5,000 to $9,999 | 64 (2.6%) | 50 (3.0%) |
| $10,000 to $14,999 | 158 (6.5%) | 289 (17.6%) |
| $15,000 to $19,999 | 95 (3.9%) | 86 (5.2%) |
| $20,000 to $24,999 | 105 (4.3%) | 261 (15.9%) |
| $25,000 to $34,999 | 400 (16.4%) | 205 (12.5%) |
| $35,000 to $49,999 | 332 (13.6%) | 149 (9.1%) |
| $50,000 to $74,999 | 443 (18.2%) | 228 (13.9%) |
| $75,000 to $99,999 | 338 (13.9%) | 82 (5.0%) |
| $100,000 to $149,999 | 230 (9.4%) | 21 (1.3%) |
| $150,000 or more | 122 (5.0%) | 37 (2.3%) |
| Total | 2,439 (100.0%) | 1,637 (100.0%) |
Monthly Housing Cost Tiers in West Point
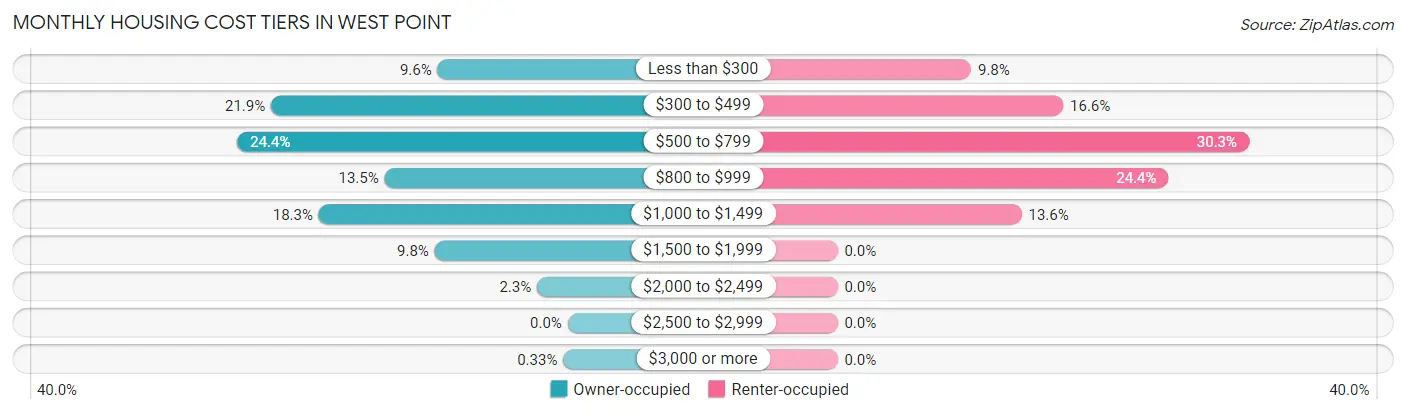
| Monthly Cost | Owner-occupied | Renter-occupied |
| Less than $300 | 234 (9.6%) | 161 (9.8%) |
| $300 to $499 | 533 (21.8%) | 272 (16.6%) |
| $500 to $799 | 594 (24.3%) | 496 (30.3%) |
| $800 to $999 | 329 (13.5%) | 399 (24.4%) |
| $1,000 to $1,499 | 447 (18.3%) | 222 (13.6%) |
| $1,500 to $1,999 | 239 (9.8%) | 0 (0.0%) |
| $2,000 to $2,499 | 55 (2.3%) | 0 (0.0%) |
| $2,500 to $2,999 | 0 (0.0%) | 0 (0.0%) |
| $3,000 or more | 8 (0.3%) | 0 (0.0%) |
| Total | 2,439 (100.0%) | 1,637 (100.0%) |
Physical Housing Characteristics in West Point
Housing Structures in West Point
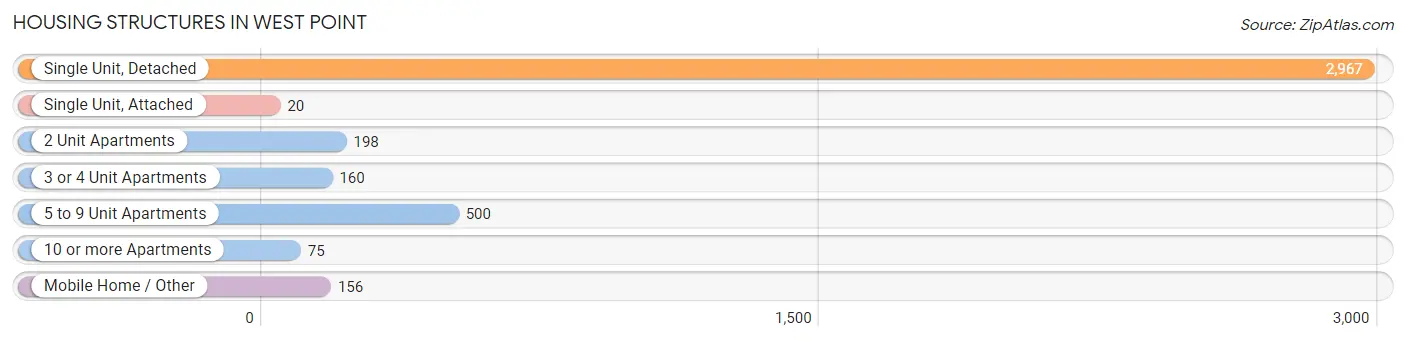
| Structure Type | # Housing Units | % Housing Units |
| Single Unit, Detached | 2,967 | 72.8% |
| Single Unit, Attached | 20 | 0.5% |
| 2 Unit Apartments | 198 | 4.9% |
| 3 or 4 Unit Apartments | 160 | 3.9% |
| 5 to 9 Unit Apartments | 500 | 12.3% |
| 10 or more Apartments | 75 | 1.8% |
| Mobile Home / Other | 156 | 3.8% |
| Total | 4,076 | 100.0% |
Housing Structures by Occupancy in West Point
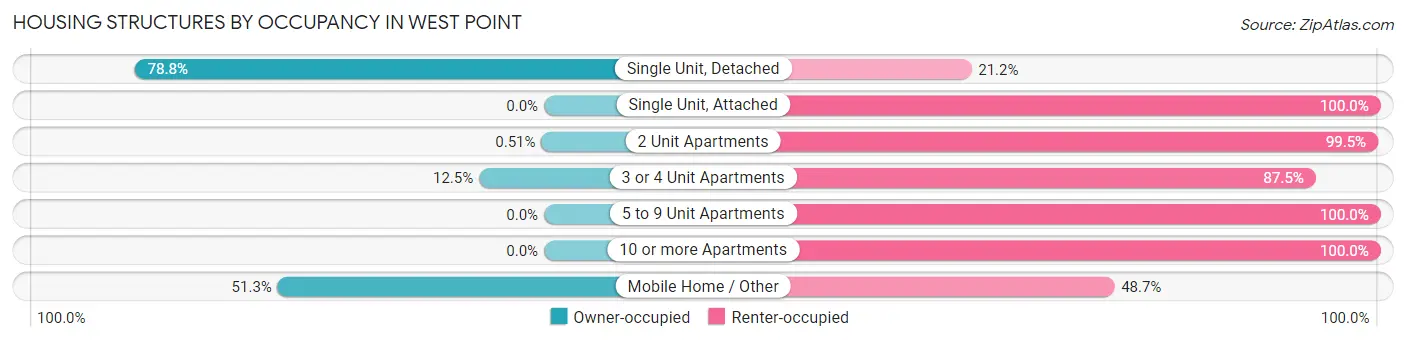
| Structure Type | Owner-occupied | Renter-occupied |
| Single Unit, Detached | 2,338 (78.8%) | 629 (21.2%) |
| Single Unit, Attached | 0 (0.0%) | 20 (100.0%) |
| 2 Unit Apartments | 1 (0.5%) | 197 (99.5%) |
| 3 or 4 Unit Apartments | 20 (12.5%) | 140 (87.5%) |
| 5 to 9 Unit Apartments | 0 (0.0%) | 500 (100.0%) |
| 10 or more Apartments | 0 (0.0%) | 75 (100.0%) |
| Mobile Home / Other | 80 (51.3%) | 76 (48.7%) |
| Total | 2,439 (59.8%) | 1,637 (40.2%) |
Housing Structures by Number of Rooms in West Point
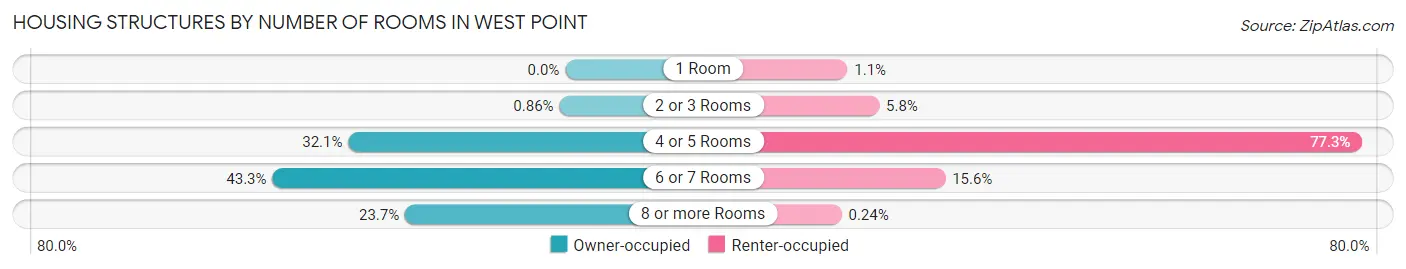
| Number of Rooms | Owner-occupied | Renter-occupied |
| 1 Room | 0 (0.0%) | 18 (1.1%) |
| 2 or 3 Rooms | 21 (0.9%) | 95 (5.8%) |
| 4 or 5 Rooms | 783 (32.1%) | 1,265 (77.3%) |
| 6 or 7 Rooms | 1,057 (43.3%) | 255 (15.6%) |
| 8 or more Rooms | 578 (23.7%) | 4 (0.2%) |
| Total | 2,439 (100.0%) | 1,637 (100.0%) |
Housing Structure by Heating Type in West Point
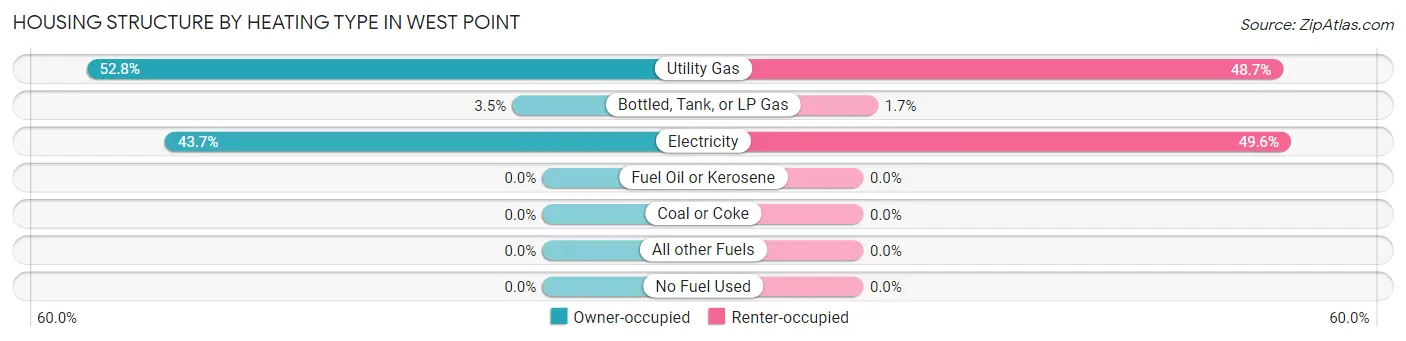
| Heating Type | Owner-occupied | Renter-occupied |
| Utility Gas | 1,288 (52.8%) | 797 (48.7%) |
| Bottled, Tank, or LP Gas | 85 (3.5%) | 28 (1.7%) |
| Electricity | 1,066 (43.7%) | 812 (49.6%) |
| Fuel Oil or Kerosene | 0 (0.0%) | 0 (0.0%) |
| Coal or Coke | 0 (0.0%) | 0 (0.0%) |
| All other Fuels | 0 (0.0%) | 0 (0.0%) |
| No Fuel Used | 0 (0.0%) | 0 (0.0%) |
| Total | 2,439 (100.0%) | 1,637 (100.0%) |
Household Vehicle Usage in West Point
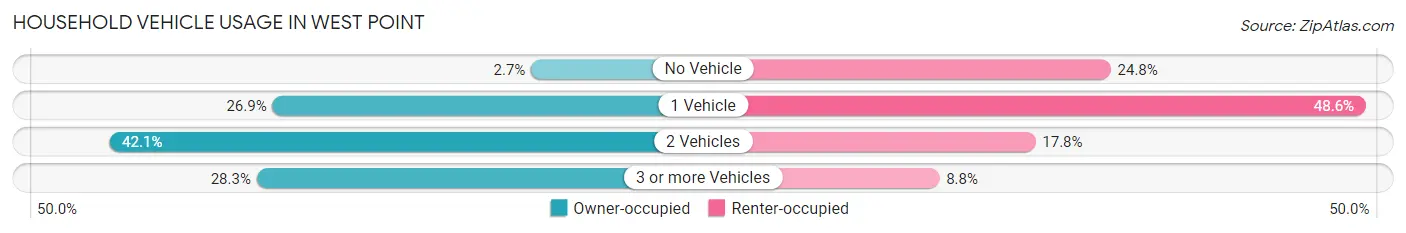
| Vehicles per Household | Owner-occupied | Renter-occupied |
| No Vehicle | 66 (2.7%) | 406 (24.8%) |
| 1 Vehicle | 655 (26.9%) | 796 (48.6%) |
| 2 Vehicles | 1,027 (42.1%) | 291 (17.8%) |
| 3 or more Vehicles | 691 (28.3%) | 144 (8.8%) |
| Total | 2,439 (100.0%) | 1,637 (100.0%) |
Real Estate & Mortgages in West Point
Real Estate and Mortgage Overview in West Point
| Characteristic | Without Mortgage | With Mortgage |
| Housing Units | 1,296 | 1,143 |
| Median Property Value | $105,800 | $135,400 |
| Median Household Income | $32,946 | $81 |
| Monthly Housing Costs | $463 | $0 |
| Real Estate Taxes | $760 | $235 |
Property Value by Mortgage Status in West Point
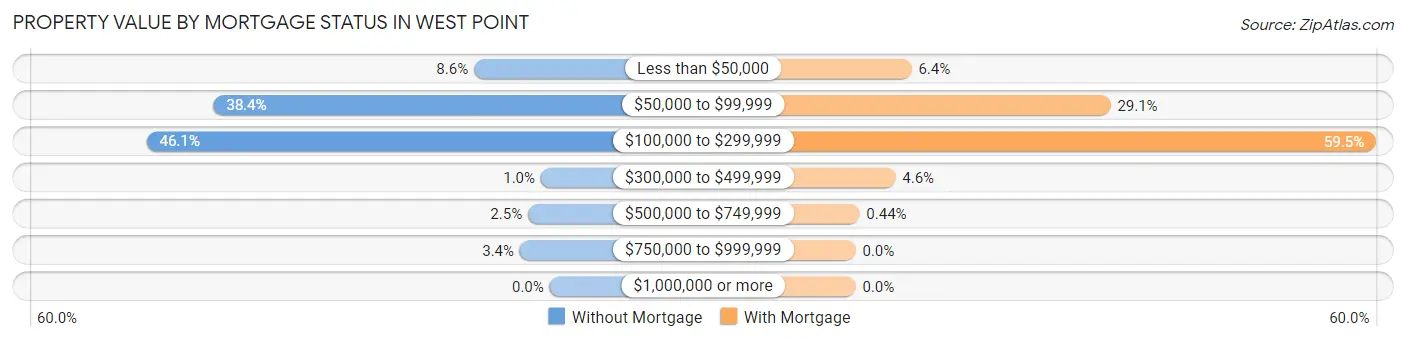
| Property Value | Without Mortgage | With Mortgage |
| Less than $50,000 | 112 (8.6%) | 73 (6.4%) |
| $50,000 to $99,999 | 498 (38.4%) | 333 (29.1%) |
| $100,000 to $299,999 | 597 (46.1%) | 680 (59.5%) |
| $300,000 to $499,999 | 13 (1.0%) | 52 (4.5%) |
| $500,000 to $749,999 | 32 (2.5%) | 5 (0.4%) |
| $750,000 to $999,999 | 44 (3.4%) | 0 (0.0%) |
| $1,000,000 or more | 0 (0.0%) | 0 (0.0%) |
| Total | 1,296 (100.0%) | 1,143 (100.0%) |
Household Income by Mortgage Status in West Point
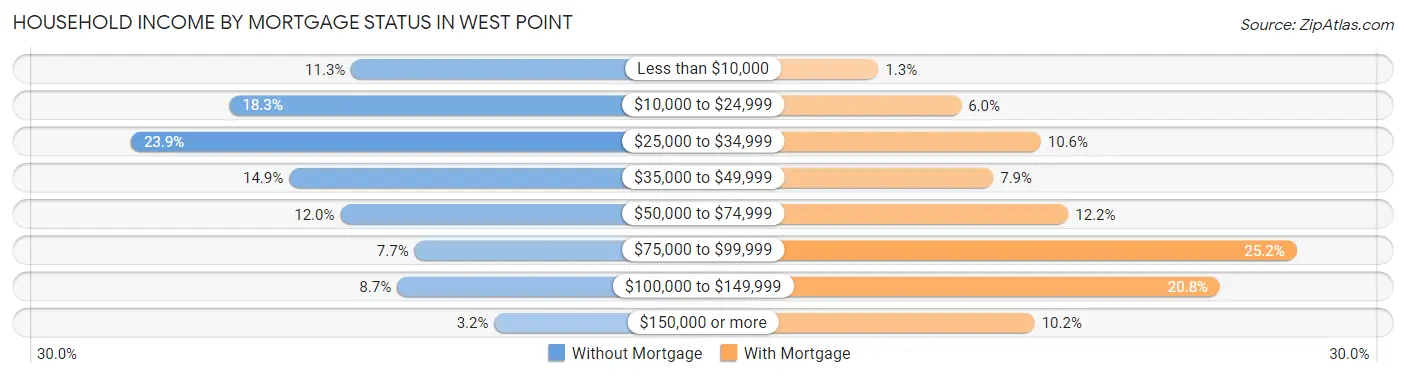
| Household Income | Without Mortgage | With Mortgage |
| Less than $10,000 | 147 (11.3%) | 15 (1.3%) |
| $10,000 to $24,999 | 237 (18.3%) | 69 (6.0%) |
| $25,000 to $34,999 | 310 (23.9%) | 121 (10.6%) |
| $35,000 to $49,999 | 193 (14.9%) | 90 (7.9%) |
| $50,000 to $74,999 | 155 (12.0%) | 139 (12.2%) |
| $75,000 to $99,999 | 100 (7.7%) | 288 (25.2%) |
| $100,000 to $149,999 | 113 (8.7%) | 238 (20.8%) |
| $150,000 or more | 41 (3.2%) | 117 (10.2%) |
| Total | 1,296 (100.0%) | 1,143 (100.0%) |
Property Value to Household Income Ratio in West Point
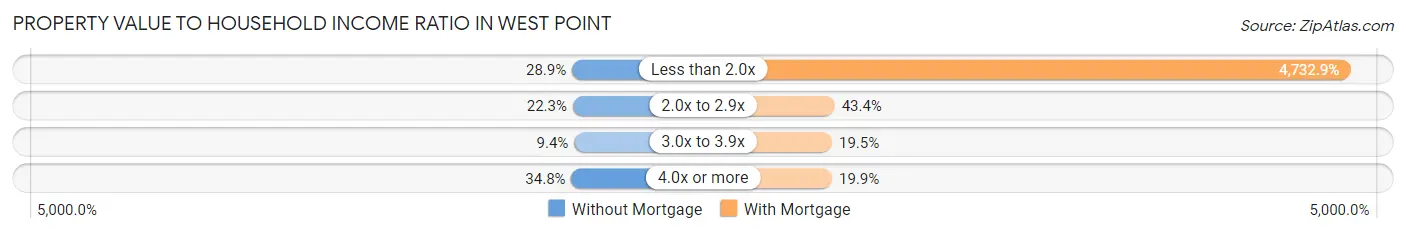
| Value-to-Income Ratio | Without Mortgage | With Mortgage |
| Less than 2.0x | 375 (28.9%) | 54,097 (4,732.9%) |
| 2.0x to 2.9x | 289 (22.3%) | 496 (43.4%) |
| 3.0x to 3.9x | 122 (9.4%) | 223 (19.5%) |
| 4.0x or more | 451 (34.8%) | 227 (19.9%) |
| Total | 1,296 (100.0%) | 1,143 (100.0%) |
Real Estate Taxes by Mortgage Status in West Point
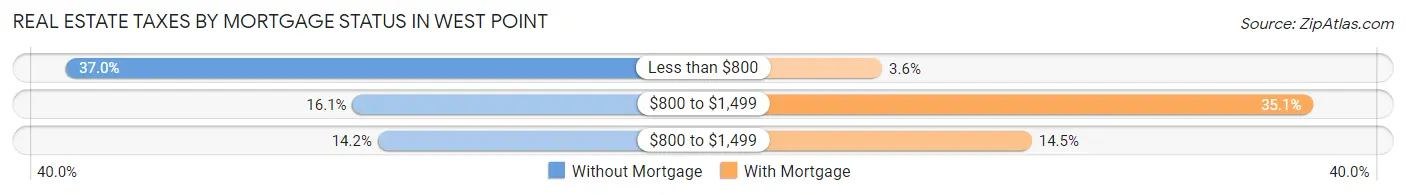
| Property Taxes | Without Mortgage | With Mortgage |
| Less than $800 | 479 (37.0%) | 41 (3.6%) |
| $800 to $1,499 | 208 (16.1%) | 401 (35.1%) |
| $800 to $1,499 | 184 (14.2%) | 166 (14.5%) |
| Total | 1,296 (100.0%) | 1,143 (100.0%) |
Health & Disability in West Point
Health Insurance Coverage by Age in West Point
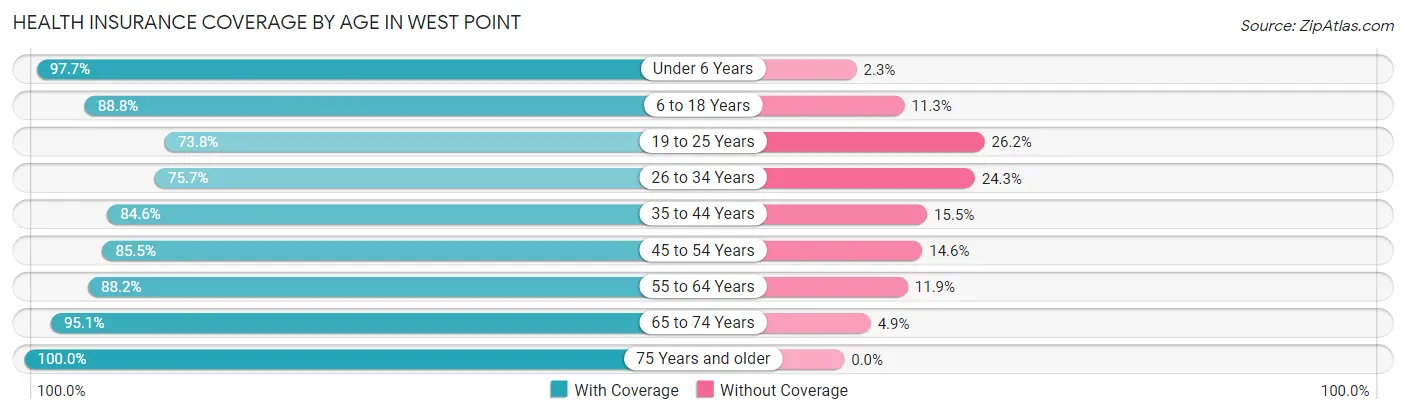
| Age Bracket | With Coverage | Without Coverage |
| Under 6 Years | 767 (97.7%) | 18 (2.3%) |
| 6 to 18 Years | 1,530 (88.7%) | 194 (11.3%) |
| 19 to 25 Years | 657 (73.8%) | 233 (26.2%) |
| 26 to 34 Years | 908 (75.7%) | 292 (24.3%) |
| 35 to 44 Years | 859 (84.6%) | 157 (15.4%) |
| 45 to 54 Years | 781 (85.5%) | 133 (14.5%) |
| 55 to 64 Years | 1,123 (88.1%) | 151 (11.8%) |
| 65 to 74 Years | 1,003 (95.1%) | 52 (4.9%) |
| 75 Years and older | 900 (100.0%) | 0 (0.0%) |
| Total | 8,528 (87.4%) | 1,230 (12.6%) |
Health Insurance Coverage by Citizenship Status in West Point
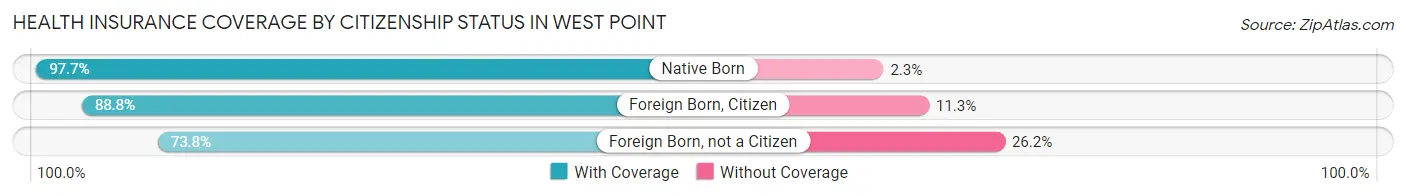
| Citizenship Status | With Coverage | Without Coverage |
| Native Born | 767 (97.7%) | 18 (2.3%) |
| Foreign Born, Citizen | 1,530 (88.7%) | 194 (11.3%) |
| Foreign Born, not a Citizen | 657 (73.8%) | 233 (26.2%) |
Health Insurance Coverage by Household Income in West Point
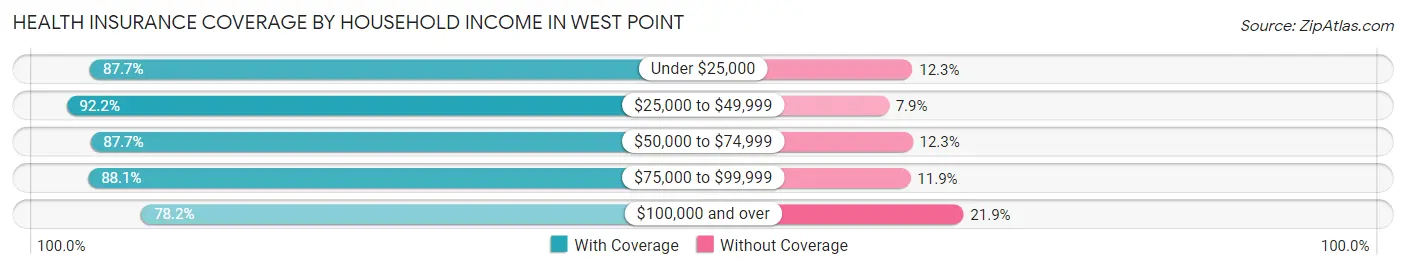
| Household Income | With Coverage | Without Coverage |
| Under $25,000 | 2,618 (87.7%) | 366 (12.3%) |
| $25,000 to $49,999 | 2,137 (92.1%) | 182 (7.9%) |
| $50,000 to $74,999 | 1,730 (87.7%) | 243 (12.3%) |
| $75,000 to $99,999 | 857 (88.1%) | 116 (11.9%) |
| $100,000 and over | 1,155 (78.1%) | 323 (21.8%) |
Public vs Private Health Insurance Coverage by Age in West Point
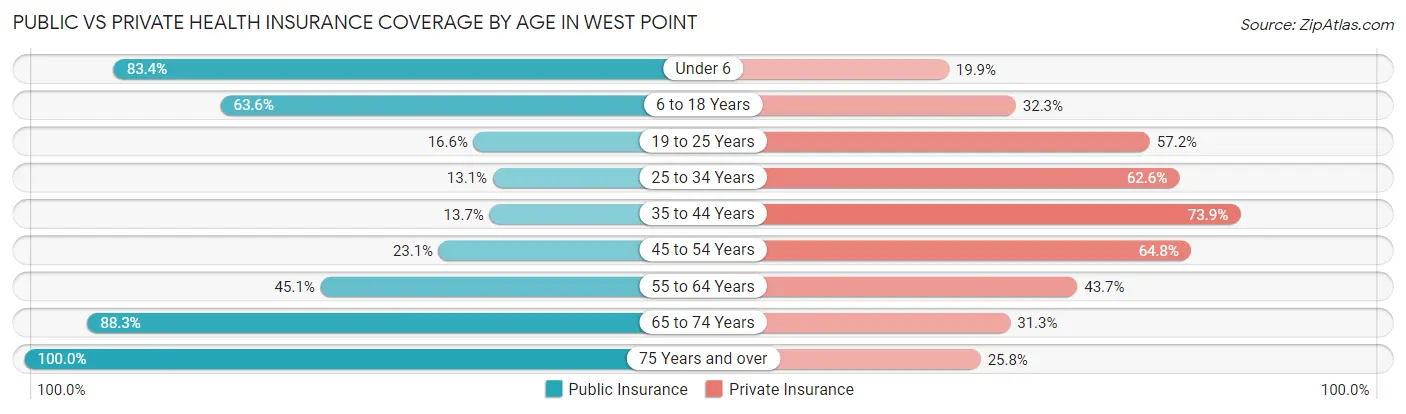
| Age Bracket | Public Insurance | Private Insurance |
| Under 6 | 655 (83.4%) | 156 (19.9%) |
| 6 to 18 Years | 1,097 (63.6%) | 557 (32.3%) |
| 19 to 25 Years | 148 (16.6%) | 509 (57.2%) |
| 25 to 34 Years | 157 (13.1%) | 751 (62.6%) |
| 35 to 44 Years | 139 (13.7%) | 751 (73.9%) |
| 45 to 54 Years | 211 (23.1%) | 592 (64.8%) |
| 55 to 64 Years | 574 (45.1%) | 557 (43.7%) |
| 65 to 74 Years | 932 (88.3%) | 330 (31.3%) |
| 75 Years and over | 900 (100.0%) | 232 (25.8%) |
| Total | 4,813 (49.3%) | 4,435 (45.5%) |
Disability Status by Sex by Age in West Point
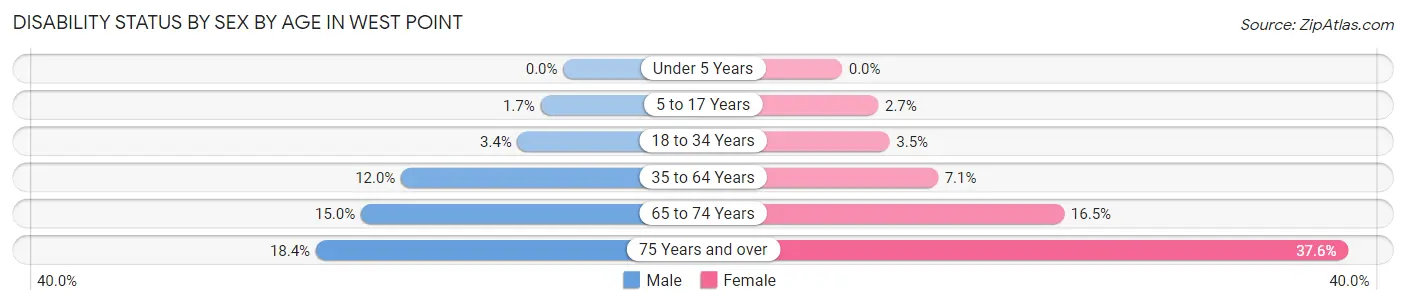
| Age Bracket | Male | Female |
| Under 5 Years | 0 (0.0%) | 0 (0.0%) |
| 5 to 17 Years | 14 (1.7%) | 23 (2.7%) |
| 18 to 34 Years | 32 (3.4%) | 45 (3.5%) |
| 35 to 64 Years | 171 (12.0%) | 127 (7.1%) |
| 65 to 74 Years | 61 (15.0%) | 107 (16.5%) |
| 75 Years and over | 52 (18.4%) | 232 (37.6%) |
Disability Class by Sex by Age in West Point
Disability Class: Hearing Difficulty
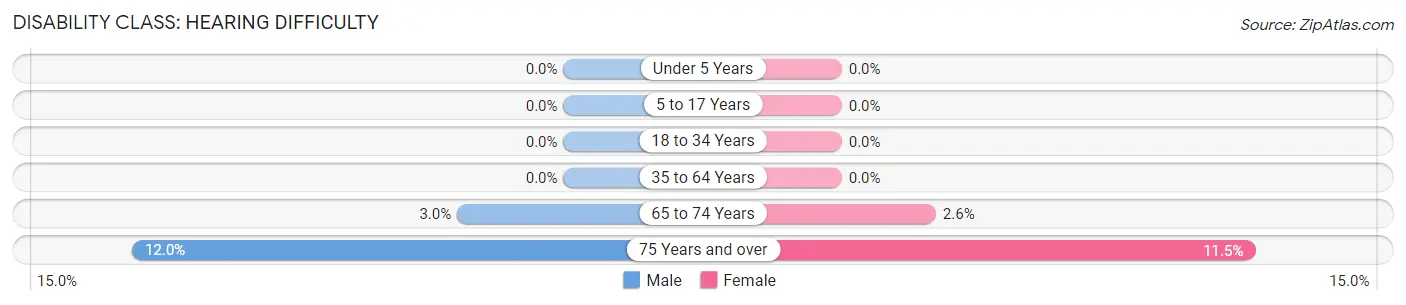
| Age Bracket | Male | Female |
| Under 5 Years | 0 (0.0%) | 0 (0.0%) |
| 5 to 17 Years | 0 (0.0%) | 0 (0.0%) |
| 18 to 34 Years | 0 (0.0%) | 0 (0.0%) |
| 35 to 64 Years | 0 (0.0%) | 0 (0.0%) |
| 65 to 74 Years | 12 (3.0%) | 17 (2.6%) |
| 75 Years and over | 34 (12.0%) | 71 (11.5%) |
Disability Class: Vision Difficulty
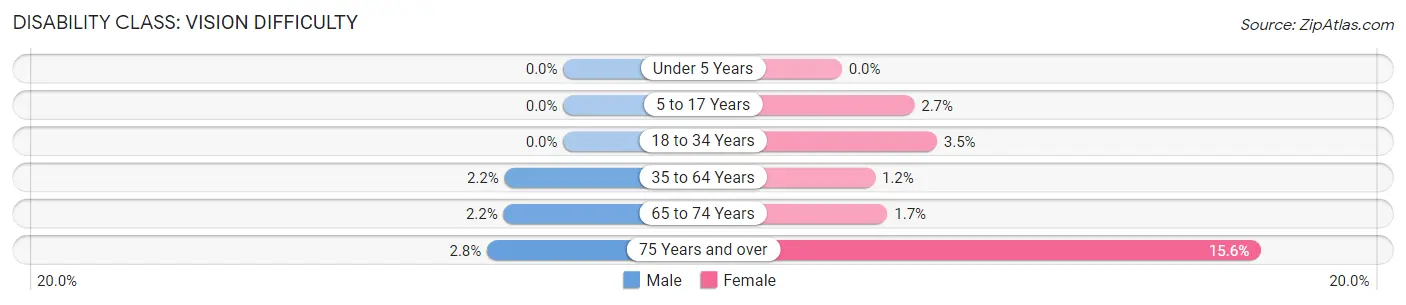
| Age Bracket | Male | Female |
| Under 5 Years | 0 (0.0%) | 0 (0.0%) |
| 5 to 17 Years | 0 (0.0%) | 23 (2.7%) |
| 18 to 34 Years | 0 (0.0%) | 45 (3.5%) |
| 35 to 64 Years | 31 (2.2%) | 22 (1.2%) |
| 65 to 74 Years | 9 (2.2%) | 11 (1.7%) |
| 75 Years and over | 8 (2.8%) | 96 (15.6%) |
Disability Class: Cognitive Difficulty
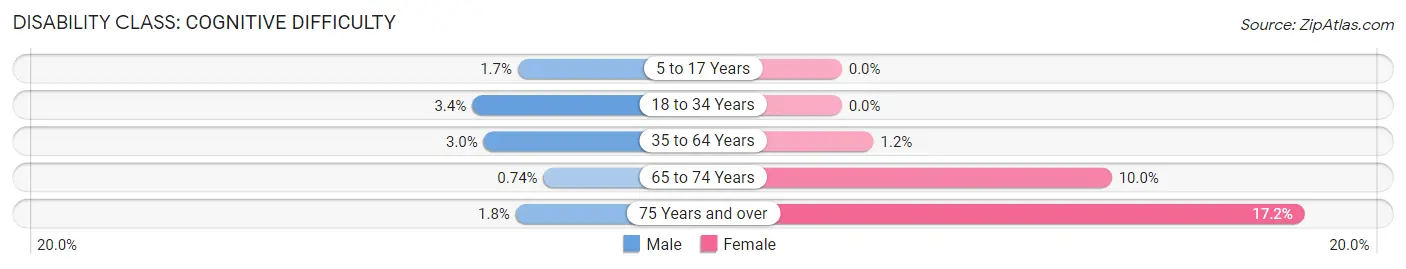
| Age Bracket | Male | Female |
| 5 to 17 Years | 14 (1.7%) | 0 (0.0%) |
| 18 to 34 Years | 32 (3.4%) | 0 (0.0%) |
| 35 to 64 Years | 42 (3.0%) | 21 (1.2%) |
| 65 to 74 Years | 3 (0.7%) | 65 (10.0%) |
| 75 Years and over | 5 (1.8%) | 106 (17.2%) |
Disability Class: Ambulatory Difficulty
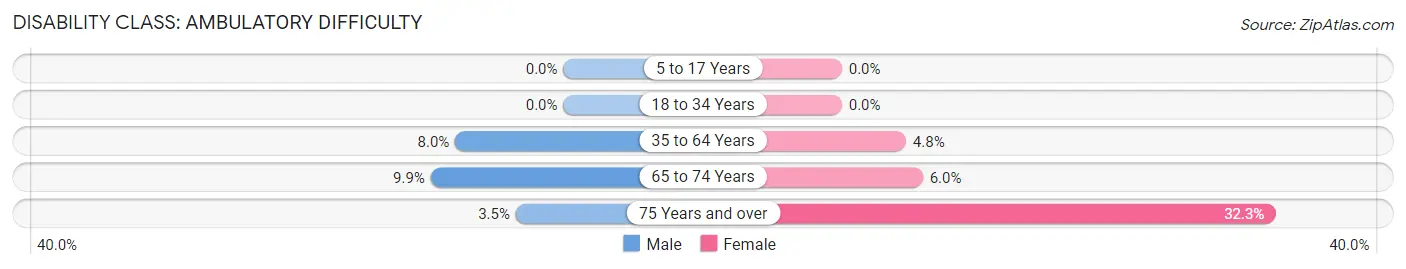
| Age Bracket | Male | Female |
| 5 to 17 Years | 0 (0.0%) | 0 (0.0%) |
| 18 to 34 Years | 0 (0.0%) | 0 (0.0%) |
| 35 to 64 Years | 114 (8.0%) | 85 (4.8%) |
| 65 to 74 Years | 40 (9.9%) | 39 (6.0%) |
| 75 Years and over | 10 (3.5%) | 199 (32.3%) |
Disability Class: Self-Care Difficulty
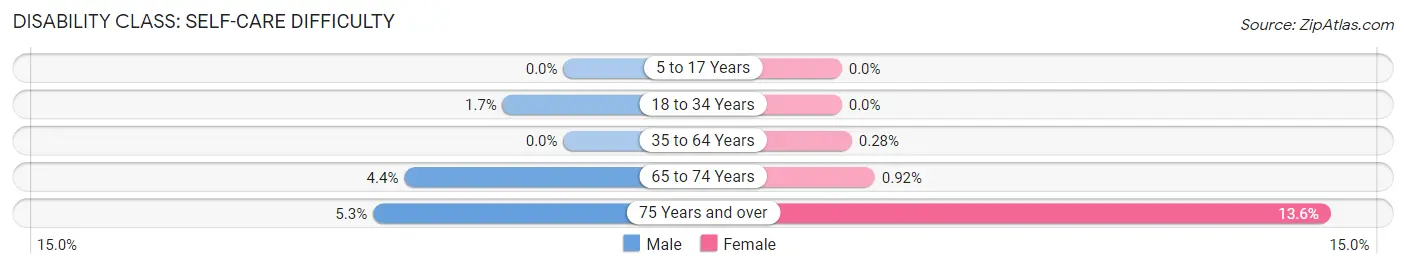
| Age Bracket | Male | Female |
| 5 to 17 Years | 0 (0.0%) | 0 (0.0%) |
| 18 to 34 Years | 16 (1.7%) | 0 (0.0%) |
| 35 to 64 Years | 0 (0.0%) | 5 (0.3%) |
| 65 to 74 Years | 18 (4.4%) | 6 (0.9%) |
| 75 Years and over | 15 (5.3%) | 84 (13.6%) |
Technology Access in West Point
Computing Device Access in West Point
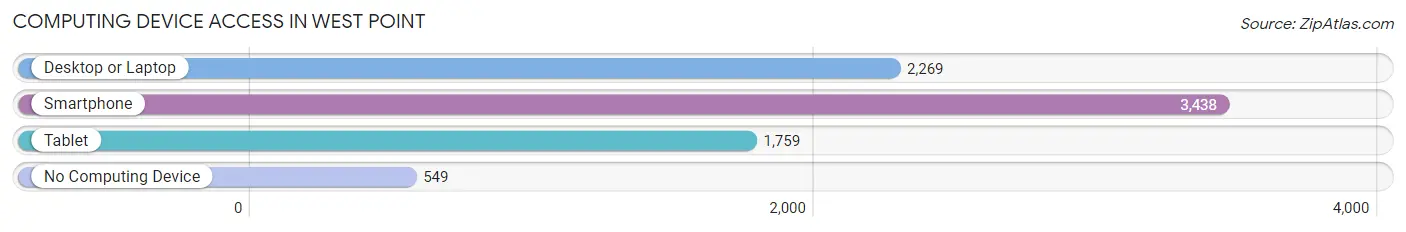
| Device Type | # Households | % Households |
| Desktop or Laptop | 2,269 | 55.7% |
| Smartphone | 3,438 | 84.4% |
| Tablet | 1,759 | 43.2% |
| No Computing Device | 549 | 13.5% |
| Total | 4,076 | 100.0% |
Internet Access in West Point
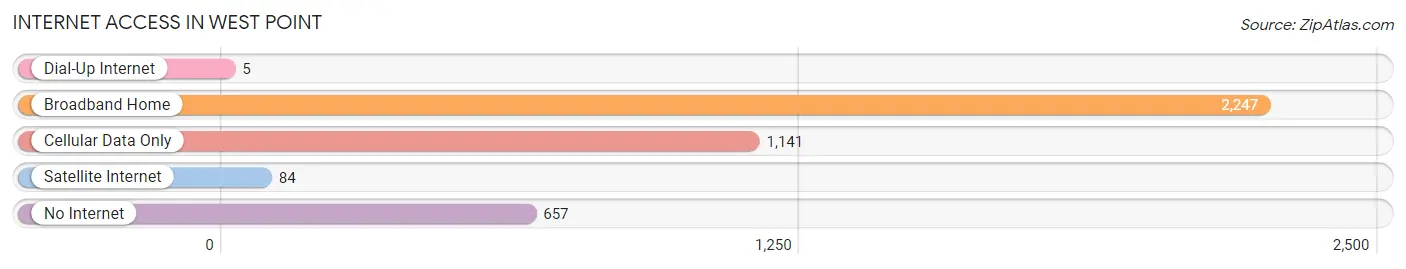
| Internet Type | # Households | % Households |
| Dial-Up Internet | 5 | 0.1% |
| Broadband Home | 2,247 | 55.1% |
| Cellular Data Only | 1,141 | 28.0% |
| Satellite Internet | 84 | 2.1% |
| No Internet | 657 | 16.1% |
| Total | 4,076 | 100.0% |
West Point Summary
West Point, Mississippi is a small city located in Clay County, Mississippi. It is situated on the banks of the Tombigbee River, and is the county seat of Clay County. The city has a population of 11,307 as of the 2010 census, and is part of the Golden Triangle region of Mississippi, which includes the cities of Starkville, Columbus, and West Point.
History
West Point was founded in 1836, and was originally known as “Gunn’s Point”. The city was named after the nearby West Point Plantation, which was owned by the Gunn family. The city was incorporated in 1838, and was the first city in Clay County.
During the Civil War, West Point was the site of a major battle between Union and Confederate forces. The Battle of West Point was fought on May 7, 1863, and resulted in a Confederate victory.
Geography
West Point is located at 33°35'N 88°37'W (33.5833, -88.6167). The city is situated on the banks of the Tombigbee River, and is part of the Golden Triangle region of Mississippi. The city has a total area of 11.2 square miles, of which 11.1 square miles is land and 0.1 square miles is water.
Economy
West Point is home to several major employers, including the West Point-Clay County Industrial Park, which is home to several manufacturing and distribution companies. The city is also home to the West Point-Clay County Airport, which serves the area with general aviation services.
West Point is also home to several educational institutions, including Mississippi State University-West Point, East Mississippi Community College, and the West Point School District.
Demographics
As of the 2010 census, West Point had a population of 11,307. The racial makeup of the city was 57.3% African American, 40.2% White, 0.3% Native American, 0.7% Asian, 0.1% Pacific Islander, 0.5% from other races, and 1.0% from two or more races. Hispanic or Latino of any race were 1.3% of the population.
The median income for a household in West Point was $30,945, and the median income for a family was $37,917. The per capita income for the city was $15,945. About 22.2% of families and 25.7% of the population were below the poverty line, including 36.2% of those under age 18 and 18.2% of those age 65 or over.
Common Questions
What is Per Capita Income in West Point?
Per Capita income in West Point is $23,605.
What is the Median Family Income in West Point?
Median Family Income in West Point is $40,694.
What is the Median Household income in West Point?
Median Household Income in West Point is $32,846.
What is Income or Wage Gap in West Point?
Income or Wage Gap in West Point is 32.8%.
Women in West Point earn 67.2 cents for every dollar earned by a man.
What is Inequality or Gini Index in West Point?
Inequality or Gini Index in West Point is 0.53.
What is the Total Population of West Point?
Total Population of West Point is 10,063.
What is the Total Male Population of West Point?
Total Male Population of West Point is 4,427.
What is the Total Female Population of West Point?
Total Female Population of West Point is 5,636.
What is the Ratio of Males per 100 Females in West Point?
There are 78.55 Males per 100 Females in West Point.
What is the Ratio of Females per 100 Males in West Point?
There are 127.31 Females per 100 Males in West Point.
What is the Median Population Age in West Point?
Median Population Age in West Point is 37.7 Years.
What is the Average Family Size in West Point
Average Family Size in West Point is 3.1 People.
What is the Average Household Size in West Point
Average Household Size in West Point is 2.4 People.
How Large is the Labor Force in West Point?
There are 4,126 People in the Labor Forcein in West Point.
What is the Percentage of People in the Labor Force in West Point?
51.6% of People are in the Labor Force in West Point.
What is the Unemployment Rate in West Point?
Unemployment Rate in West Point is 11.0%.