Webb, MS Map & Demographics
Webb Map
Webb Overview
$14,000
PER CAPITA INCOME
$32,813
AVG FAMILY INCOME
$23,950
AVG HOUSEHOLD INCOME
$2,525
FAMILY INCOME DEFICIT
0.27
INEQUALITY / GINI INDEX
489
TOTAL POPULATION
260
MALE POPULATION
229
FEMALE POPULATION
113.54
MALES / 100 FEMALES
88.08
FEMALES / 100 MALES
34.9
MEDIAN AGE
3.5
AVG FAMILY SIZE
2.2
AVG HOUSEHOLD SIZE
160
LABOR FORCE [ PEOPLE ]
44.7%
PERCENT IN LABOR FORCE
12.5%
UNEMPLOYMENT RATE
Webb Zip Codes
Webb Area Codes
Income in Webb
Income Overview in Webb
Per Capita Income in Webb is $14,000, while median incomes of families and households are $32,813 and $23,950 respectively.
| Characteristic | Number | Measure |
| Per Capita Income | 489 | $14,000 |
| Median Family Income | 95 | $32,813 |
| Mean Family Income | 95 | $34,426 |
| Median Household Income | 226 | $23,950 |
| Mean Household Income | 226 | $29,358 |
| Income Deficit | 95 | $2,525 |
| Wage / Income Gap (%) | 489 | 0.00% |
| Wage / Income Gap ($) | 489 | 100.00¢ per $1 |
| Gini / Inequality Index | 489 | 0.27 |
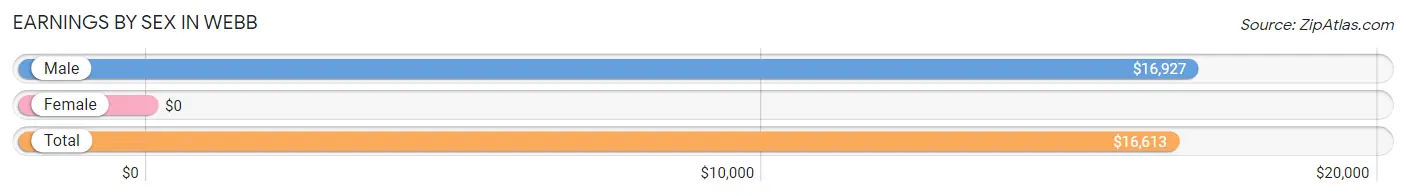
Earnings by Sex in Webb
| Sex | Number | Average Earnings |
| Male | 79 (40.7%) | $16,927 |
| Female | 115 (59.3%) | $0 |
| Total | 194 (100.0%) | $16,613 |
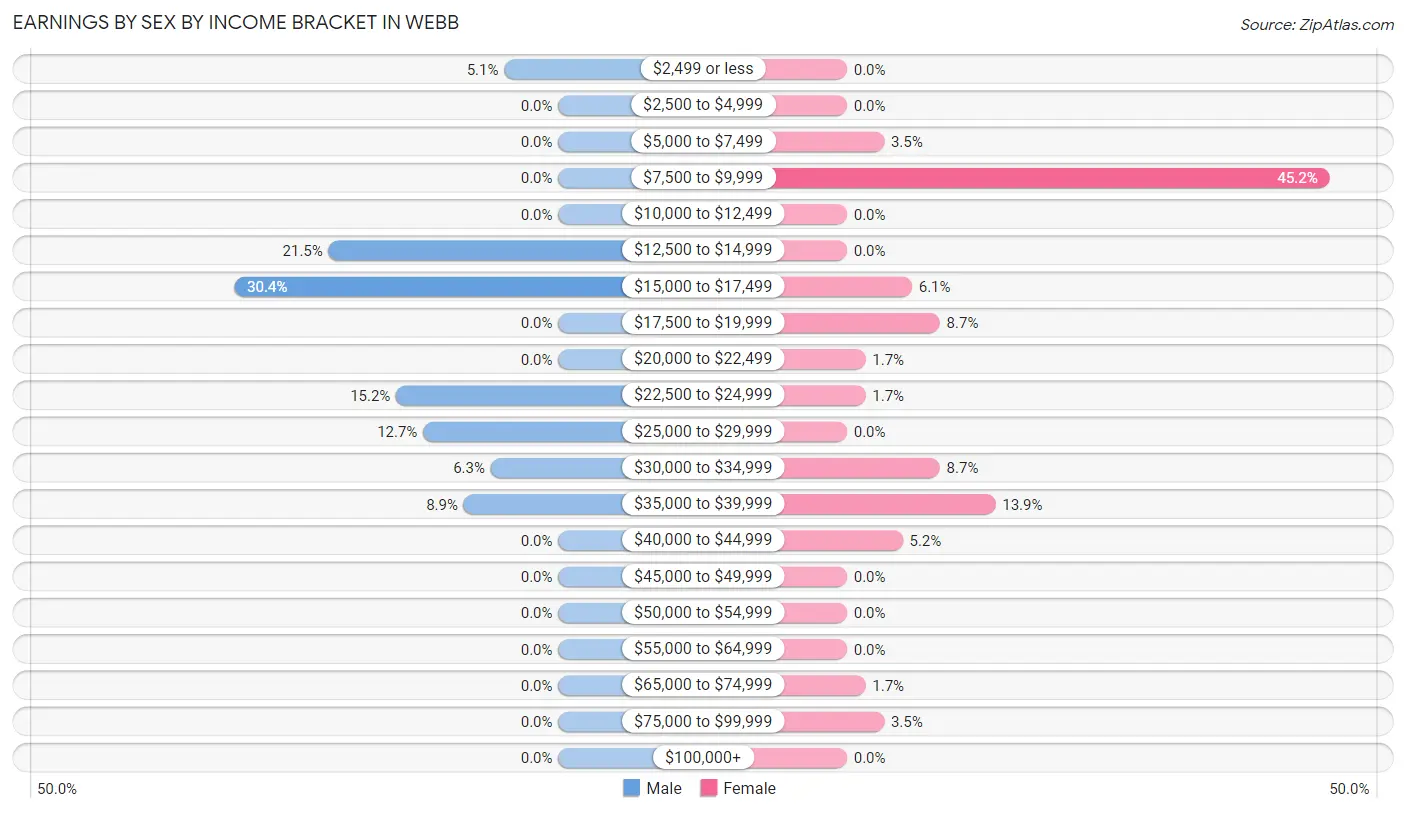
Earnings by Sex by Income Bracket in Webb
The most common earnings brackets in Webb are $15,000 to $17,499 for men (24 | 30.4%) and $7,500 to $9,999 for women (52 | 45.2%).
| Income | Male | Female |
| $2,499 or less | 4 (5.1%) | 0 (0.0%) |
| $2,500 to $4,999 | 0 (0.0%) | 0 (0.0%) |
| $5,000 to $7,499 | 0 (0.0%) | 4 (3.5%) |
| $7,500 to $9,999 | 0 (0.0%) | 52 (45.2%) |
| $10,000 to $12,499 | 0 (0.0%) | 0 (0.0%) |
| $12,500 to $14,999 | 17 (21.5%) | 0 (0.0%) |
| $15,000 to $17,499 | 24 (30.4%) | 7 (6.1%) |
| $17,500 to $19,999 | 0 (0.0%) | 10 (8.7%) |
| $20,000 to $22,499 | 0 (0.0%) | 2 (1.7%) |
| $22,500 to $24,999 | 12 (15.2%) | 2 (1.7%) |
| $25,000 to $29,999 | 10 (12.7%) | 0 (0.0%) |
| $30,000 to $34,999 | 5 (6.3%) | 10 (8.7%) |
| $35,000 to $39,999 | 7 (8.9%) | 16 (13.9%) |
| $40,000 to $44,999 | 0 (0.0%) | 6 (5.2%) |
| $45,000 to $49,999 | 0 (0.0%) | 0 (0.0%) |
| $50,000 to $54,999 | 0 (0.0%) | 0 (0.0%) |
| $55,000 to $64,999 | 0 (0.0%) | 0 (0.0%) |
| $65,000 to $74,999 | 0 (0.0%) | 2 (1.7%) |
| $75,000 to $99,999 | 0 (0.0%) | 4 (3.5%) |
| $100,000+ | 0 (0.0%) | 0 (0.0%) |
| Total | 79 (100.0%) | 115 (100.0%) |
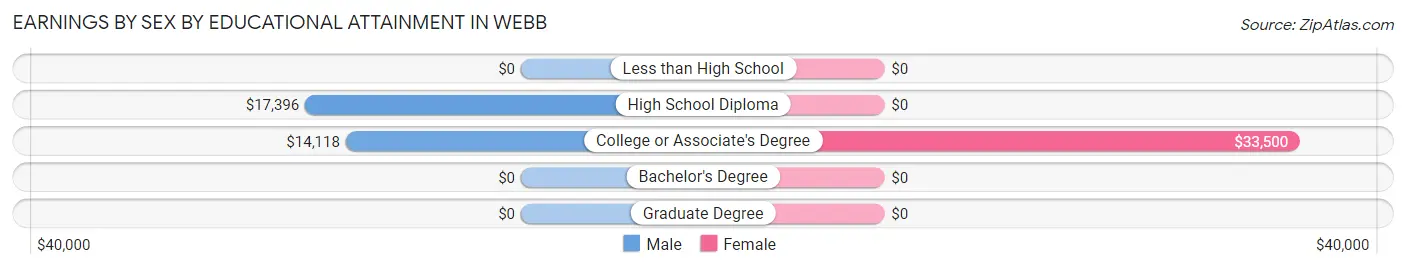
Earnings by Sex by Educational Attainment in Webb
| Educational Attainment | Male Income | Female Income |
| Less than High School | - | - |
| High School Diploma | $17,396 | $0 |
| College or Associate's Degree | $14,118 | $33,500 |
| Bachelor's Degree | - | - |
| Graduate Degree | - | - |
| Total | $17,135 | $0 |
Family Income in Webb
Family Income Brackets in Webb
According to the Webb family income data, there are 46 families falling into the $15,000 to $24,999 income range, which is the most common income bracket and makes up 48.4% of all families.
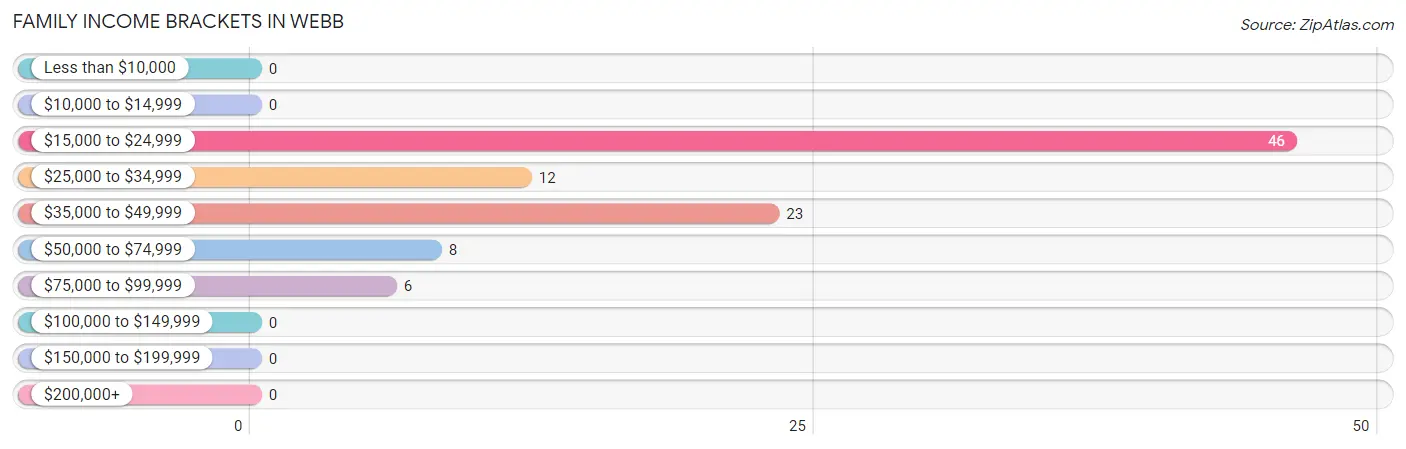
| Income Bracket | # Families | % Families |
| Less than $10,000 | 0 | 0.0% |
| $10,000 to $14,999 | 0 | 0.0% |
| $15,000 to $24,999 | 46 | 48.4% |
| $25,000 to $34,999 | 12 | 12.6% |
| $35,000 to $49,999 | 23 | 24.2% |
| $50,000 to $74,999 | 8 | 8.4% |
| $75,000 to $99,999 | 6 | 6.3% |
| $100,000 to $149,999 | 0 | 0.0% |
| $150,000 to $199,999 | 0 | 0.0% |
| $200,000+ | 0 | 0.0% |
Family Income by Famaliy Size in Webb
3-person families (36 | 37.9%) account for the highest median family income in Webb with $38,636 per family, while 3-person families (36 | 37.9%) have the highest median income of $12,879 per family member.
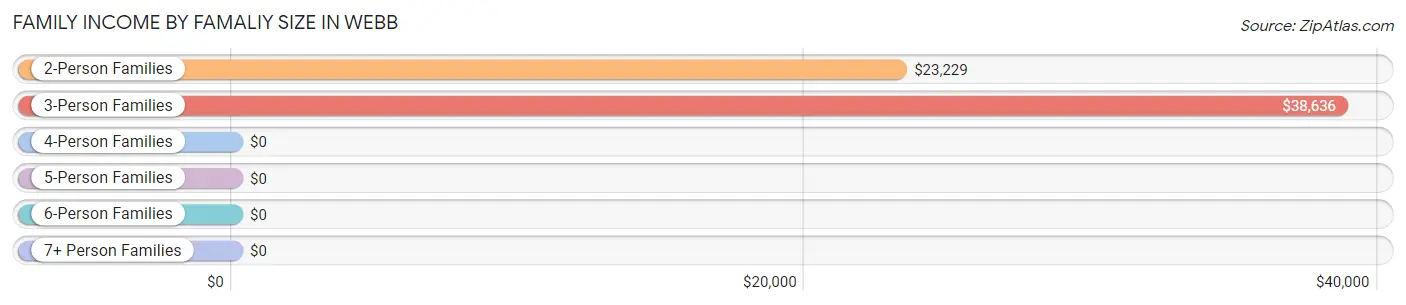
| Income Bracket | # Families | Median Income |
| 2-Person Families | 49 (51.6%) | $23,229 |
| 3-Person Families | 36 (37.9%) | $38,636 |
| 4-Person Families | 0 (0.0%) | $0 |
| 5-Person Families | 10 (10.5%) | $0 |
| 6-Person Families | 0 (0.0%) | $0 |
| 7+ Person Families | 0 (0.0%) | $0 |
| Total | 95 (100.0%) | $32,813 |
Family Income by Number of Earners in Webb
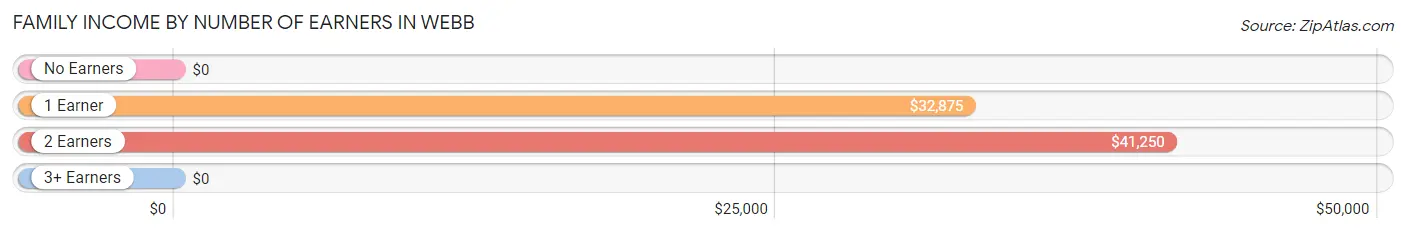
| Number of Earners | # Families | Median Income |
| No Earners | 26 (27.4%) | $0 |
| 1 Earner | 59 (62.1%) | $32,875 |
| 2 Earners | 10 (10.5%) | $41,250 |
| 3+ Earners | 0 (0.0%) | $0 |
| Total | 95 (100.0%) | $32,813 |
Household Income in Webb
Household Income Brackets in Webb
With 126 households falling in the category, the $15,000 to $24,999 income range is the most frequent in Webb, accounting for 55.7% of all households.
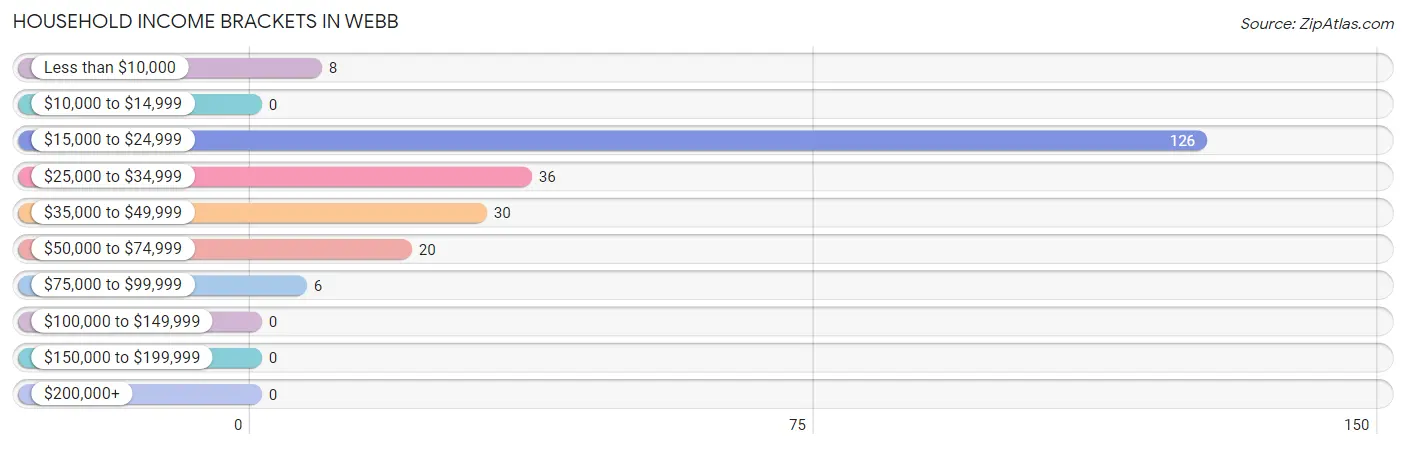
| Income Bracket | # Households | % Households |
| Less than $10,000 | 8 | 3.5% |
| $10,000 to $14,999 | 0 | 0.0% |
| $15,000 to $24,999 | 126 | 55.8% |
| $25,000 to $34,999 | 36 | 15.9% |
| $35,000 to $49,999 | 30 | 13.3% |
| $50,000 to $74,999 | 20 | 8.8% |
| $75,000 to $99,999 | 6 | 2.7% |
| $100,000 to $149,999 | 0 | 0.0% |
| $150,000 to $199,999 | 0 | 0.0% |
| $200,000+ | 0 | 0.0% |
Household Income by Householder Age in Webb
The median household income in Webb is $23,950, with the highest median household income of $24,688 found in the 65+ years age bracket for the primary householder. A total of 58 households (25.7%) fall into this category.
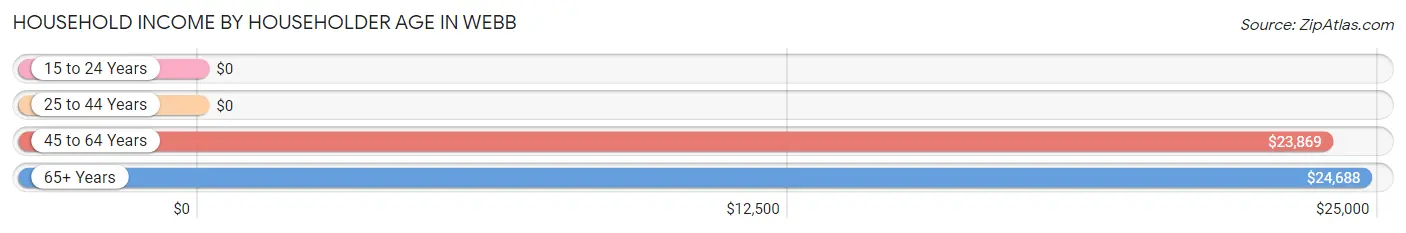
| Income Bracket | # Households | Median Income |
| 15 to 24 Years | 0 (0.0%) | $0 |
| 25 to 44 Years | 72 (31.9%) | $0 |
| 45 to 64 Years | 96 (42.5%) | $23,869 |
| 65+ Years | 58 (25.7%) | $24,688 |
| Total | 226 (100.0%) | $23,950 |
Poverty in Webb
Income Below Poverty by Sex and Age in Webb
With 29.7% poverty level for males and 29.7% for females among the residents of Webb, 12 to 14 year old males and 6 to 11 year old females are the most vulnerable to poverty, with 18 males (100.0%) and 8 females (100.0%) in their respective age groups living below the poverty level.
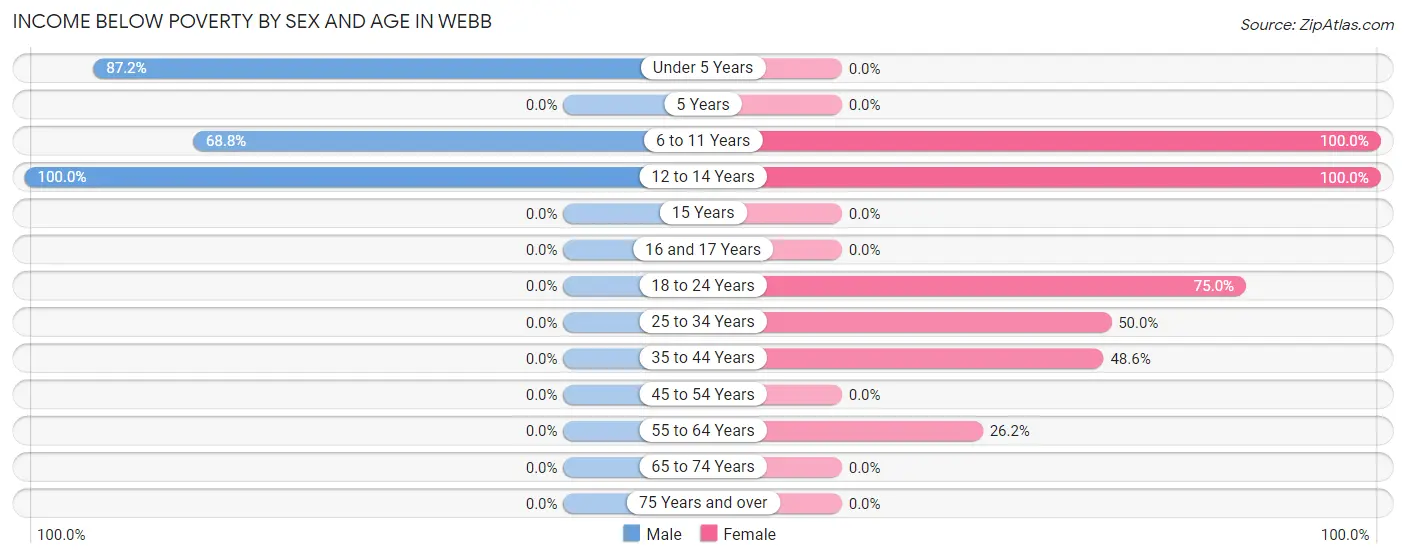
| Age Bracket | Male | Female |
| Under 5 Years | 41 (87.2%) | 0 (0.0%) |
| 5 Years | 0 (0.0%) | 0 (0.0%) |
| 6 to 11 Years | 11 (68.8%) | 8 (100.0%) |
| 12 to 14 Years | 18 (100.0%) | 8 (100.0%) |
| 15 Years | 0 (0.0%) | 0 (0.0%) |
| 16 and 17 Years | 0 (0.0%) | 0 (0.0%) |
| 18 to 24 Years | 0 (0.0%) | 12 (75.0%) |
| 25 to 34 Years | 0 (0.0%) | 6 (50.0%) |
| 35 to 44 Years | 0 (0.0%) | 17 (48.6%) |
| 45 to 54 Years | 0 (0.0%) | 0 (0.0%) |
| 55 to 64 Years | 0 (0.0%) | 17 (26.2%) |
| 65 to 74 Years | 0 (0.0%) | 0 (0.0%) |
| 75 Years and over | 0 (0.0%) | 0 (0.0%) |
| Total | 70 (29.7%) | 68 (29.7%) |
Income Above Poverty by Sex and Age in Webb
According to the poverty statistics in Webb, males aged 16 and 17 years and females aged 5 years are the age groups that are most secure financially, with 100.0% of males and 100.0% of females in these age groups living above the poverty line.
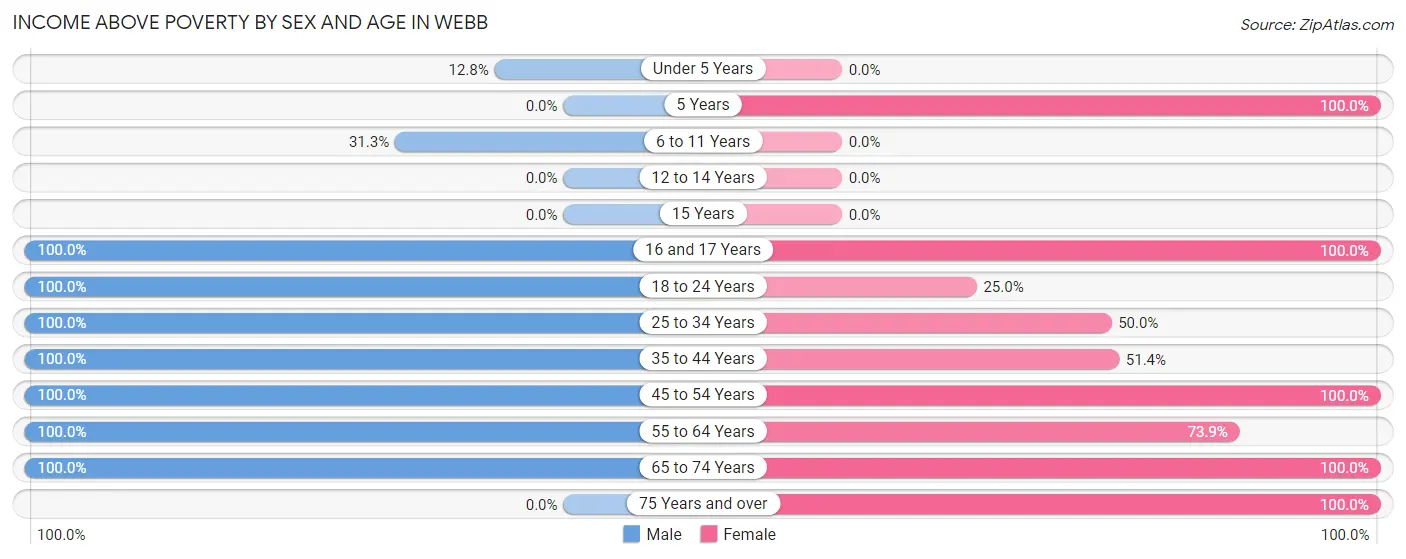
| Age Bracket | Male | Female |
| Under 5 Years | 6 (12.8%) | 0 (0.0%) |
| 5 Years | 0 (0.0%) | 10 (100.0%) |
| 6 to 11 Years | 5 (31.2%) | 0 (0.0%) |
| 12 to 14 Years | 0 (0.0%) | 0 (0.0%) |
| 15 Years | 0 (0.0%) | 0 (0.0%) |
| 16 and 17 Years | 6 (100.0%) | 11 (100.0%) |
| 18 to 24 Years | 24 (100.0%) | 4 (25.0%) |
| 25 to 34 Years | 49 (100.0%) | 6 (50.0%) |
| 35 to 44 Years | 36 (100.0%) | 18 (51.4%) |
| 45 to 54 Years | 10 (100.0%) | 14 (100.0%) |
| 55 to 64 Years | 7 (100.0%) | 48 (73.9%) |
| 65 to 74 Years | 23 (100.0%) | 25 (100.0%) |
| 75 Years and over | 0 (0.0%) | 25 (100.0%) |
| Total | 166 (70.3%) | 161 (70.3%) |
Income Below Poverty Among Married-Couple Families in Webb
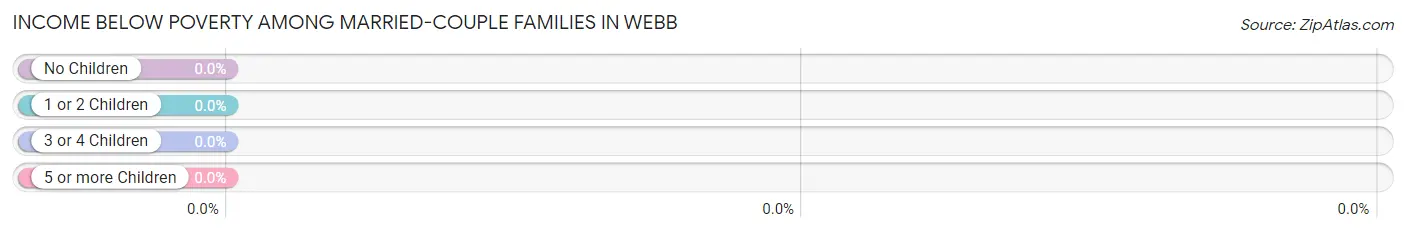
| Children | Above Poverty | Below Poverty |
| No Children | 6 (100.0%) | 0 (0.0%) |
| 1 or 2 Children | 0 (0.0%) | 0 (0.0%) |
| 3 or 4 Children | 0 (0.0%) | 0 (0.0%) |
| 5 or more Children | 0 (0.0%) | 0 (0.0%) |
| Total | 6 (100.0%) | 0 (0.0%) |
Income Below Poverty Among Single-Parent Households in Webb
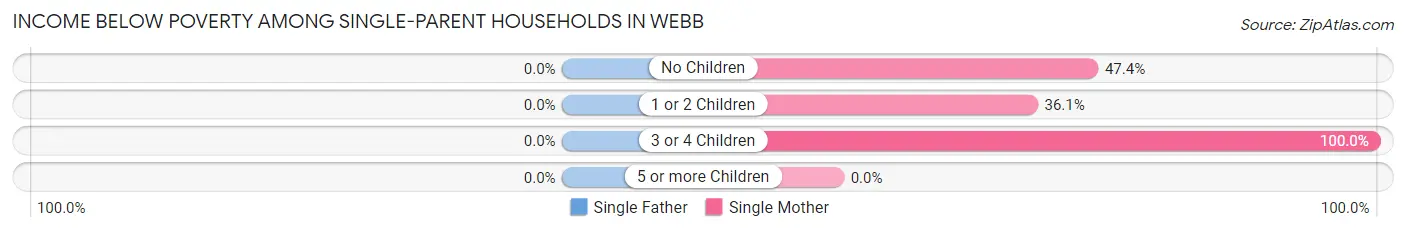
| Children | Single Father | Single Mother |
| No Children | 0 (0.0%) | 9 (47.4%) |
| 1 or 2 Children | 0 (0.0%) | 13 (36.1%) |
| 3 or 4 Children | 0 (0.0%) | 10 (100.0%) |
| 5 or more Children | 0 (0.0%) | 0 (0.0%) |
| Total | 0 (0.0%) | 32 (49.2%) |
Income Below Poverty Among Married-Couple vs Single-Parent Households in Webb
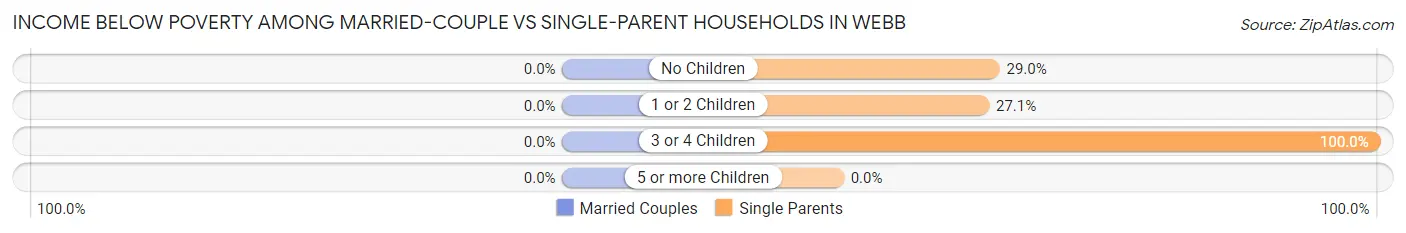
| Children | Married-Couple Families | Single-Parent Households |
| No Children | 0 (0.0%) | 9 (29.0%) |
| 1 or 2 Children | 0 (0.0%) | 13 (27.1%) |
| 3 or 4 Children | 0 (0.0%) | 10 (100.0%) |
| 5 or more Children | 0 (0.0%) | 0 (0.0%) |
| Total | 0 (0.0%) | 32 (36.0%) |
Race in Webb
The most populous races in Webb are Black / African American (476 | 97.3%), and White / Caucasian (13 | 2.7%).
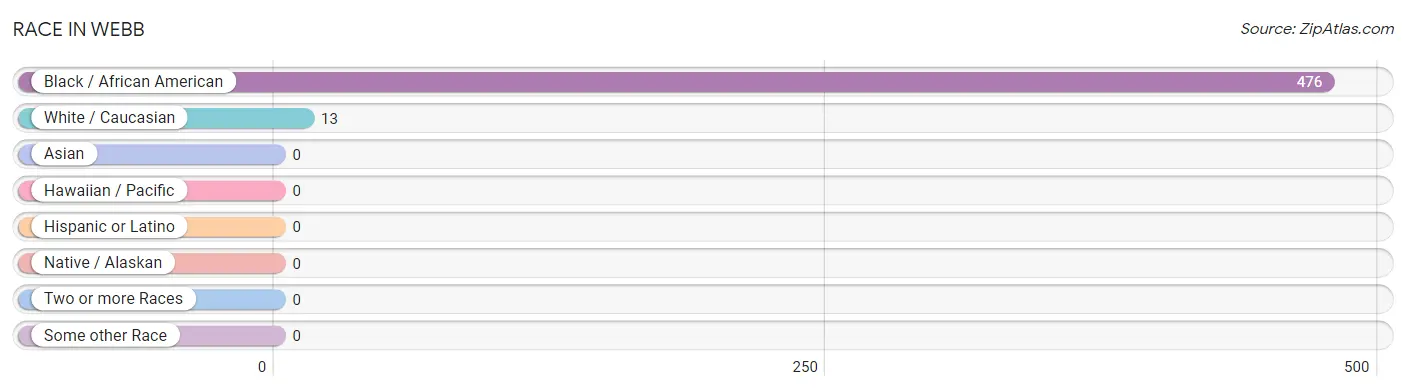
| Race | # Population | % Population |
| Asian | 0 | 0.0% |
| Black / African American | 476 | 97.3% |
| Hawaiian / Pacific | 0 | 0.0% |
| Hispanic or Latino | 0 | 0.0% |
| Native / Alaskan | 0 | 0.0% |
| White / Caucasian | 13 | 2.7% |
| Two or more Races | 0 | 0.0% |
| Some other Race | 0 | 0.0% |
| Total | 489 | 100.0% |
Ancestry in Webb
The most populous ancestries reported in Webb are African (28 | 5.7%), Subsaharan African (28 | 5.7%), and English (13 | 2.7%), together accounting for 14.1% of all Webb residents.
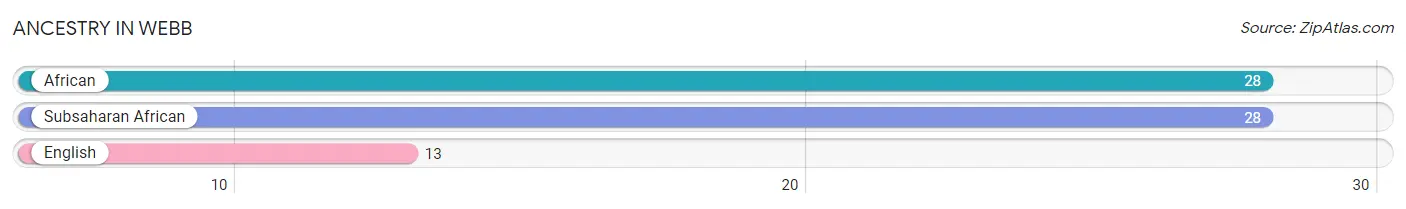
| Ancestry | # Population | % Population |
| African | 28 | 5.7% |
| English | 13 | 2.7% |
| Subsaharan African | 28 | 5.7% | View All 3 Rows |
Immigrants in Webb

| Immigration Origin | # Population | % Population | View All 0 Rows |
Sex and Age in Webb
Sex and Age in Webb
The most populous age groups in Webb are Under 5 Years (71 | 27.3%) for men and 60 to 64 Years (56 | 24.4%) for women.
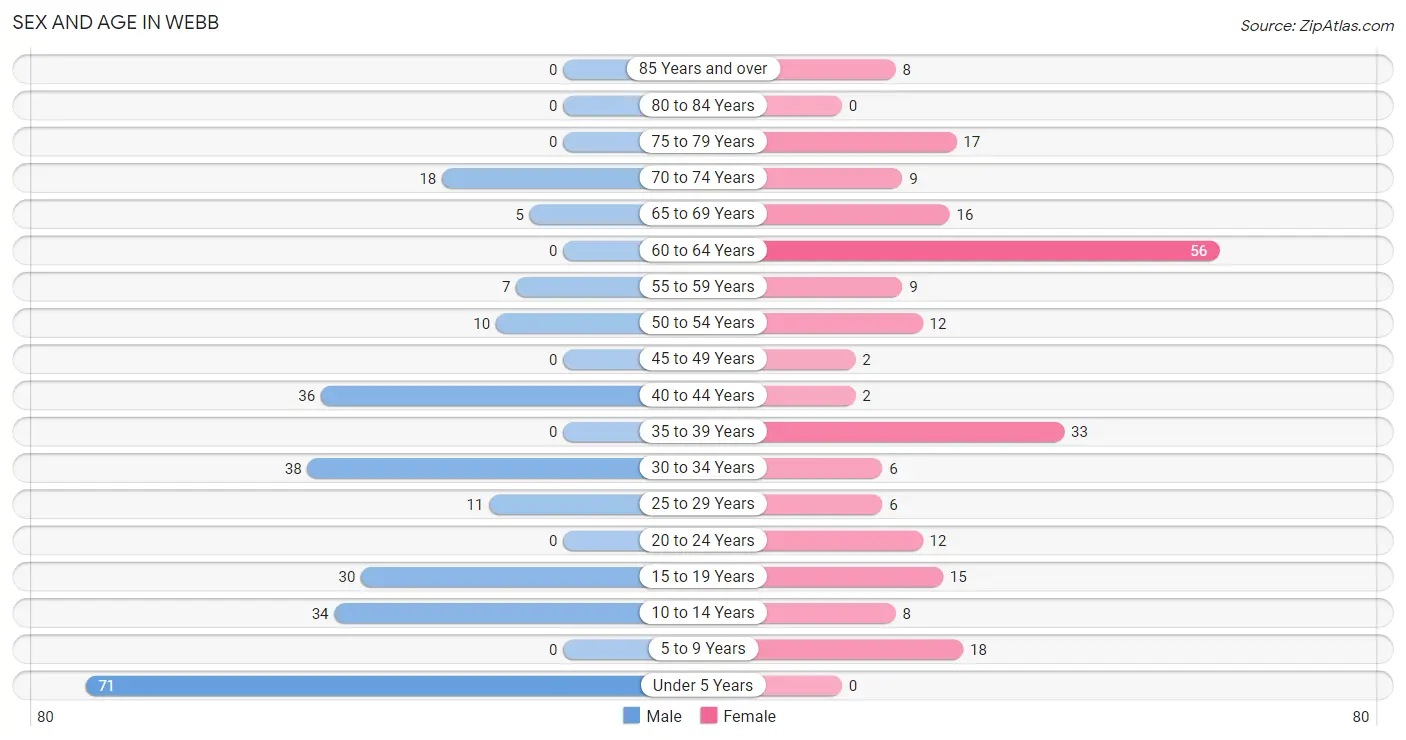
| Age Bracket | Male | Female |
| Under 5 Years | 71 (27.3%) | 0 (0.0%) |
| 5 to 9 Years | 0 (0.0%) | 18 (7.9%) |
| 10 to 14 Years | 34 (13.1%) | 8 (3.5%) |
| 15 to 19 Years | 30 (11.5%) | 15 (6.6%) |
| 20 to 24 Years | 0 (0.0%) | 12 (5.2%) |
| 25 to 29 Years | 11 (4.2%) | 6 (2.6%) |
| 30 to 34 Years | 38 (14.6%) | 6 (2.6%) |
| 35 to 39 Years | 0 (0.0%) | 33 (14.4%) |
| 40 to 44 Years | 36 (13.9%) | 2 (0.9%) |
| 45 to 49 Years | 0 (0.0%) | 2 (0.9%) |
| 50 to 54 Years | 10 (3.8%) | 12 (5.2%) |
| 55 to 59 Years | 7 (2.7%) | 9 (3.9%) |
| 60 to 64 Years | 0 (0.0%) | 56 (24.4%) |
| 65 to 69 Years | 5 (1.9%) | 16 (7.0%) |
| 70 to 74 Years | 18 (6.9%) | 9 (3.9%) |
| 75 to 79 Years | 0 (0.0%) | 17 (7.4%) |
| 80 to 84 Years | 0 (0.0%) | 0 (0.0%) |
| 85 Years and over | 0 (0.0%) | 8 (3.5%) |
| Total | 260 (100.0%) | 229 (100.0%) |
Families and Households in Webb
Median Family Size in Webb
The median family size in Webb is 3.46 persons per family, with single female/mother families (65 | 68.4%) accounting for the largest median family size of 3.85 persons per family. On the other hand, married-couple families (6 | 6.3%) represent the smallest median family size with 2.00 persons per family.
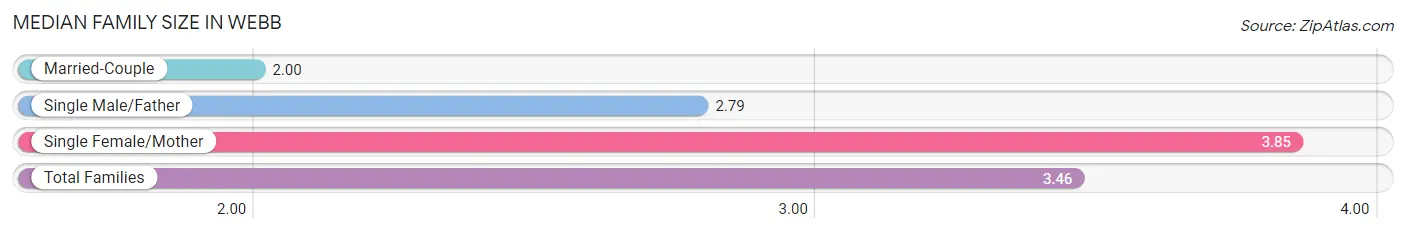
| Family Type | # Families | Family Size |
| Married-Couple | 6 (6.3%) | 2.00 |
| Single Male/Father | 24 (25.3%) | 2.79 |
| Single Female/Mother | 65 (68.4%) | 3.85 |
| Total Families | 95 (100.0%) | 3.46 |
Median Household Size in Webb
The median household size in Webb is 2.16 persons per household, with single female/mother households (65 | 28.8%) accounting for the largest median household size of 3.85 persons per household. non-family households (131 | 58.0%) represent the smallest median household size with 1.18 persons per household.
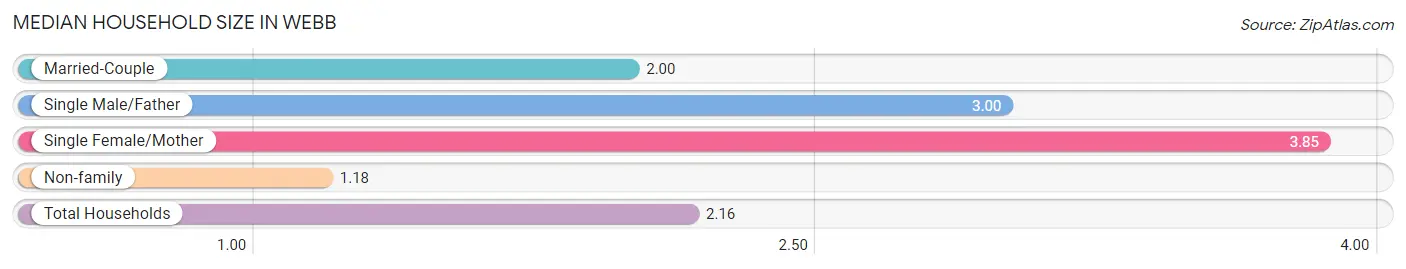
| Household Type | # Households | Household Size |
| Married-Couple | 6 (2.6%) | 2.00 |
| Single Male/Father | 24 (10.6%) | 3.00 |
| Single Female/Mother | 65 (28.8%) | 3.85 |
| Non-family | 131 (58.0%) | 1.18 |
| Total Households | 226 (100.0%) | 2.16 |
Household Size by Marriage Status in Webb
Out of a total of 226 households in Webb, 95 (42.0%) are family households, while 131 (58.0%) are nonfamily households. The most numerous type of family households are 3-person households, comprising 48, and the most common type of nonfamily households are 1-person households, comprising 91.
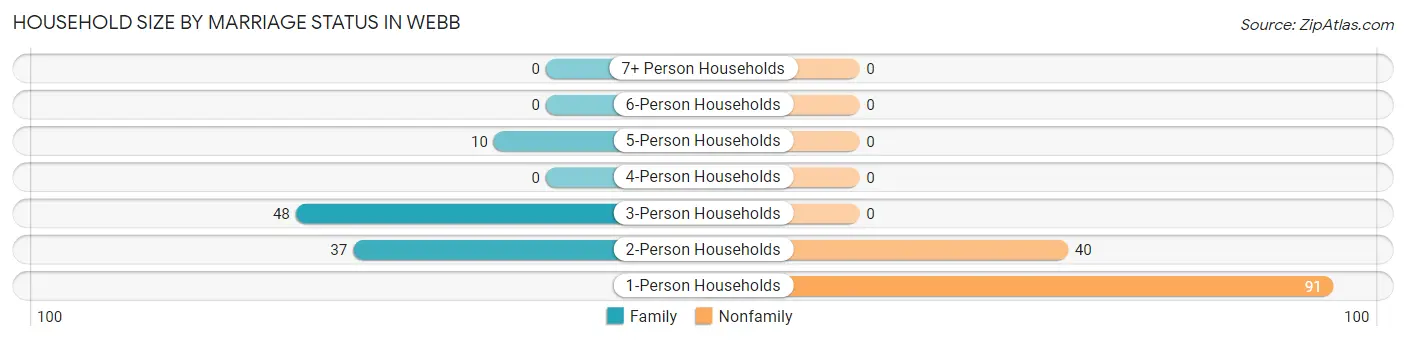
| Household Size | Family Households | Nonfamily Households |
| 1-Person Households | - | 91 (40.3%) |
| 2-Person Households | 37 (16.4%) | 40 (17.7%) |
| 3-Person Households | 48 (21.2%) | 0 (0.0%) |
| 4-Person Households | 0 (0.0%) | 0 (0.0%) |
| 5-Person Households | 10 (4.4%) | 0 (0.0%) |
| 6-Person Households | 0 (0.0%) | 0 (0.0%) |
| 7+ Person Households | 0 (0.0%) | 0 (0.0%) |
| Total | 95 (42.0%) | 131 (58.0%) |
Female Fertility in Webb
Fertility by Age in Webb
| Age Bracket | Women with Births | Births / 1,000 Women |
| 15 to 19 years | 0 (0.0%) | 0.0 |
| 20 to 34 years | 0 (0.0%) | 0.0 |
| 35 to 50 years | 0 (0.0%) | 0.0 |
| Total | 0 (0.0%) | 0.0 |
Fertility by Age by Marriage Status in Webb
| Age Bracket | Married | Unmarried |
| 15 to 19 years | 0 (0.0%) | 0 (0.0%) |
| 20 to 34 years | 0 (0.0%) | 0 (0.0%) |
| 35 to 50 years | 0 (0.0%) | 0 (0.0%) |
| Total | 0 (0.0%) | 0 (0.0%) |
Fertility by Education in Webb
| Educational Attainment | Women with Births | Births / 1,000 Women |
| Less than High School | 0 (0.0%) | 0.0 |
| High School Diploma | 0 (0.0%) | 0.0 |
| College or Associate's Degree | 0 (0.0%) | 0.0 |
| Bachelor's Degree | 0 (0.0%) | 0.0 |
| Graduate Degree | 0 (0.0%) | 0.0 |
| Total | 0 (0.0%) | 0.0 |
Fertility by Education by Marriage Status in Webb
| Educational Attainment | Married | Unmarried |
| Less than High School | 0 (0.0%) | 0 (0.0%) |
| High School Diploma | 0 (0.0%) | 0 (0.0%) |
| College or Associate's Degree | 0 (0.0%) | 0 (0.0%) |
| Bachelor's Degree | 0 (0.0%) | 0 (0.0%) |
| Graduate Degree | 0 (0.0%) | 0 (0.0%) |
| Total | 0 (0.0%) | 0 (0.0%) |
Employment Characteristics in Webb
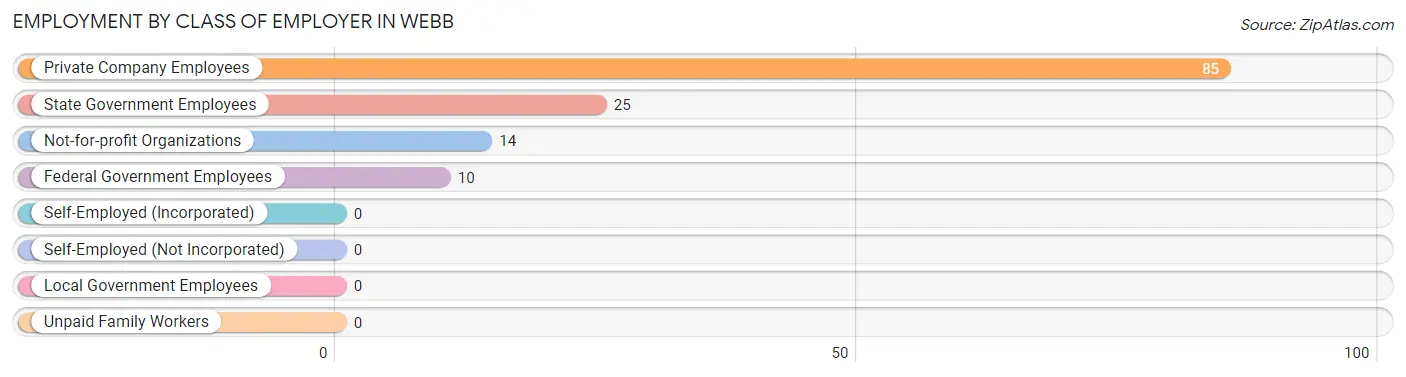
Employment by Class of Employer in Webb
Among the 134 employed individuals in Webb, private company employees (85 | 63.4%), state government employees (25 | 18.7%), and not-for-profit organizations (14 | 10.4%) make up the most common classes of employment.
| Employer Class | # Employees | % Employees |
| Private Company Employees | 85 | 63.4% |
| Self-Employed (Incorporated) | 0 | 0.0% |
| Self-Employed (Not Incorporated) | 0 | 0.0% |
| Not-for-profit Organizations | 14 | 10.4% |
| Local Government Employees | 0 | 0.0% |
| State Government Employees | 25 | 18.7% |
| Federal Government Employees | 10 | 7.5% |
| Unpaid Family Workers | 0 | 0.0% |
| Total | 134 | 100.0% |
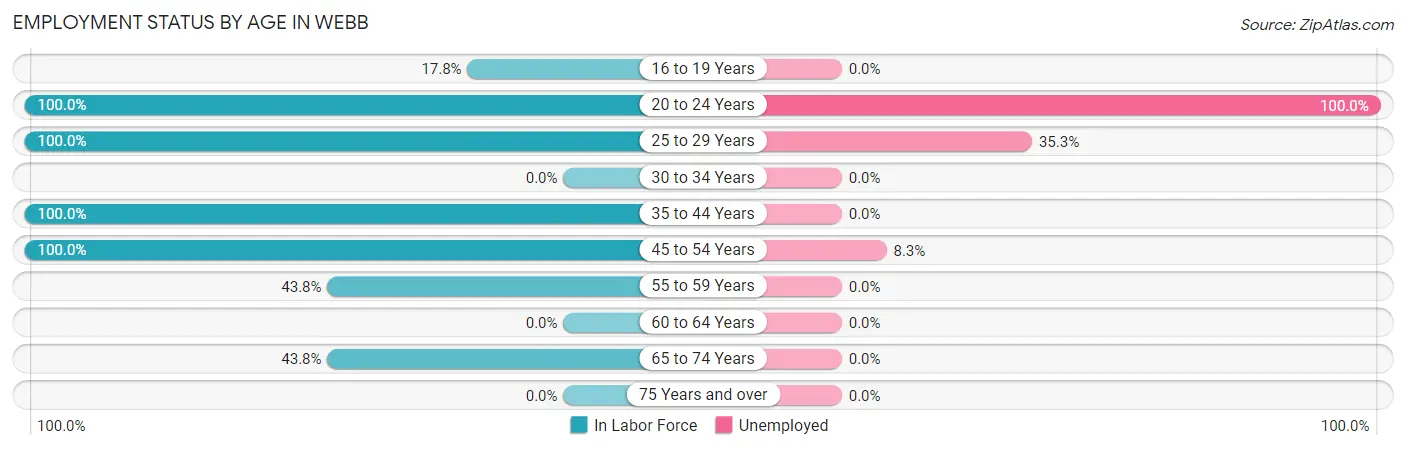
Employment Status by Age in Webb
According to the labor force statistics for Webb, out of the total population over 16 years of age (358), 44.7% or 160 individuals are in the labor force, with 12.5% or 20 of them unemployed. The age group with the highest labor force participation rate is 20 to 24 years, with 100.0% or 12 individuals in the labor force. Within the labor force, the 20 to 24 years age range has the highest percentage of unemployed individuals, with 100.0% or 12 of them being unemployed.
| Age Bracket | In Labor Force | Unemployed |
| 16 to 19 Years | 8 (17.8%) | 0 (0.0%) |
| 20 to 24 Years | 12 (100.0%) | 12 (100.0%) |
| 25 to 29 Years | 17 (100.0%) | 6 (35.3%) |
| 30 to 34 Years | 0 (0.0%) | 0 (0.0%) |
| 35 to 44 Years | 71 (100.0%) | 0 (0.0%) |
| 45 to 54 Years | 24 (100.0%) | 2 (8.3%) |
| 55 to 59 Years | 7 (43.8%) | 0 (0.0%) |
| 60 to 64 Years | 0 (0.0%) | 0 (0.0%) |
| 65 to 74 Years | 21 (43.8%) | 0 (0.0%) |
| 75 Years and over | 0 (0.0%) | 0 (0.0%) |
| Total | 160 (44.7%) | 20 (12.5%) |
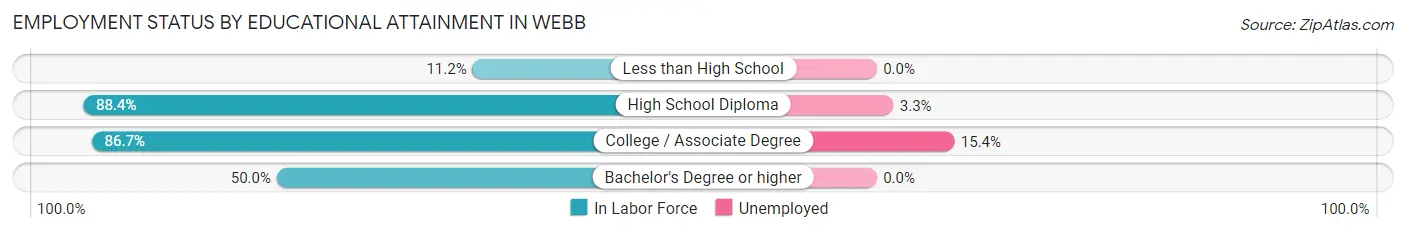
Employment Status by Educational Attainment in Webb
According to labor force statistics for Webb, 52.2% of individuals (119) out of the total population between 25 and 64 years of age (228) are in the labor force, with 6.7% or 8 of them being unemployed. The group with the highest labor force participation rate are those with the educational attainment of high school diploma, with 88.4% or 61 individuals in the labor force. Within the labor force, individuals with college / associate degree education have the highest percentage of unemployment, with 15.4% or 6 of them being unemployed.
| Educational Attainment | In Labor Force | Unemployed |
| Less than High School | 11 (11.2%) | 0 (0.0%) |
| High School Diploma | 61 (88.4%) | 2 (3.3%) |
| College / Associate Degree | 39 (86.7%) | 7 (15.4%) |
| Bachelor's Degree or higher | 8 (50.0%) | 0 (0.0%) |
| Total | 119 (52.2%) | 15 (6.7%) |
Employment Occupations by Sex in Webb
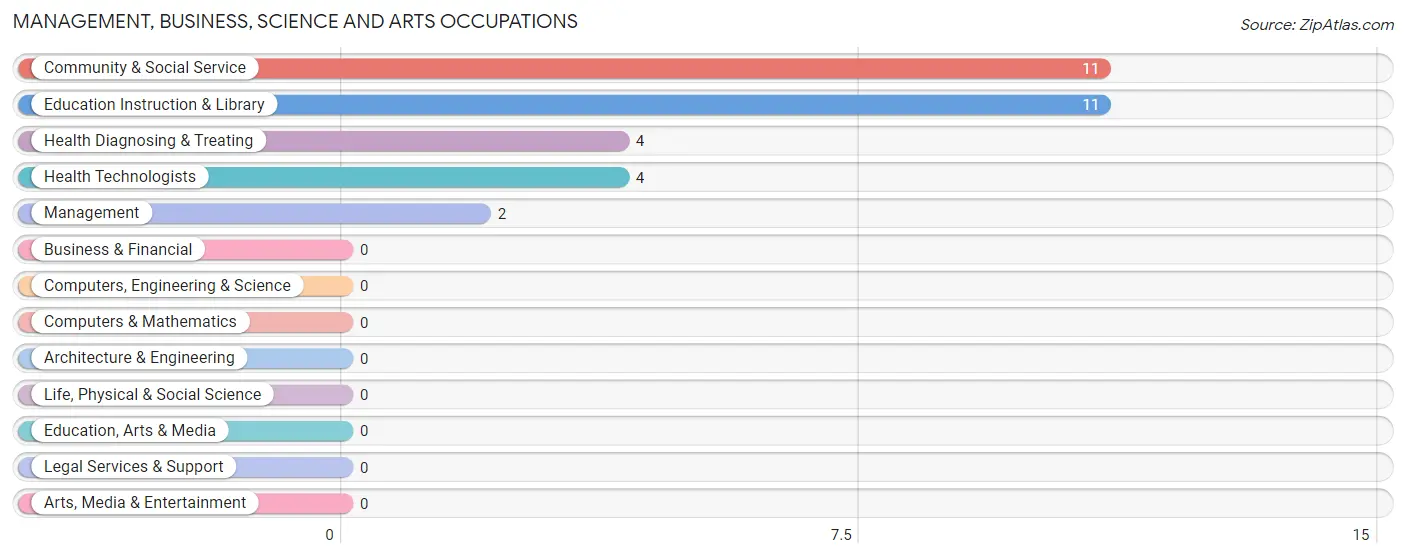
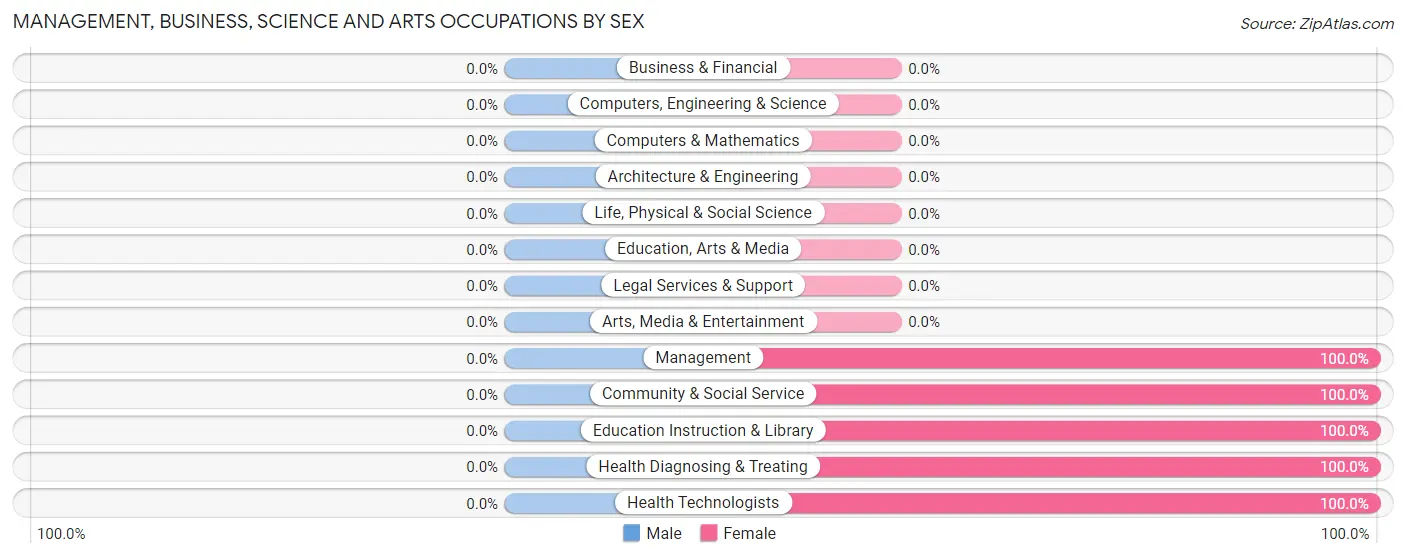
Management, Business, Science and Arts Occupations
The most common Management, Business, Science and Arts occupations in Webb are Community & Social Service (11 | 7.9%), Education Instruction & Library (11 | 7.9%), Health Diagnosing & Treating (4 | 2.9%), Health Technologists (4 | 2.9%), and Management (2 | 1.4%).
Management, Business, Science and Arts Occupations by Sex
| Occupation | Male | Female |
| Management | 0 (0.0%) | 2 (100.0%) |
| Business & Financial | 0 (0.0%) | 0 (0.0%) |
| Computers, Engineering & Science | 0 (0.0%) | 0 (0.0%) |
| Computers & Mathematics | 0 (0.0%) | 0 (0.0%) |
| Architecture & Engineering | 0 (0.0%) | 0 (0.0%) |
| Life, Physical & Social Science | 0 (0.0%) | 0 (0.0%) |
| Community & Social Service | 0 (0.0%) | 11 (100.0%) |
| Education, Arts & Media | 0 (0.0%) | 0 (0.0%) |
| Legal Services & Support | 0 (0.0%) | 0 (0.0%) |
| Education Instruction & Library | 0 (0.0%) | 11 (100.0%) |
| Arts, Media & Entertainment | 0 (0.0%) | 0 (0.0%) |
| Health Diagnosing & Treating | 0 (0.0%) | 4 (100.0%) |
| Health Technologists | 0 (0.0%) | 4 (100.0%) |
| Total (Category) | 0 (0.0%) | 17 (100.0%) |
| Total (Overall) | 79 (56.4%) | 61 (43.6%) |
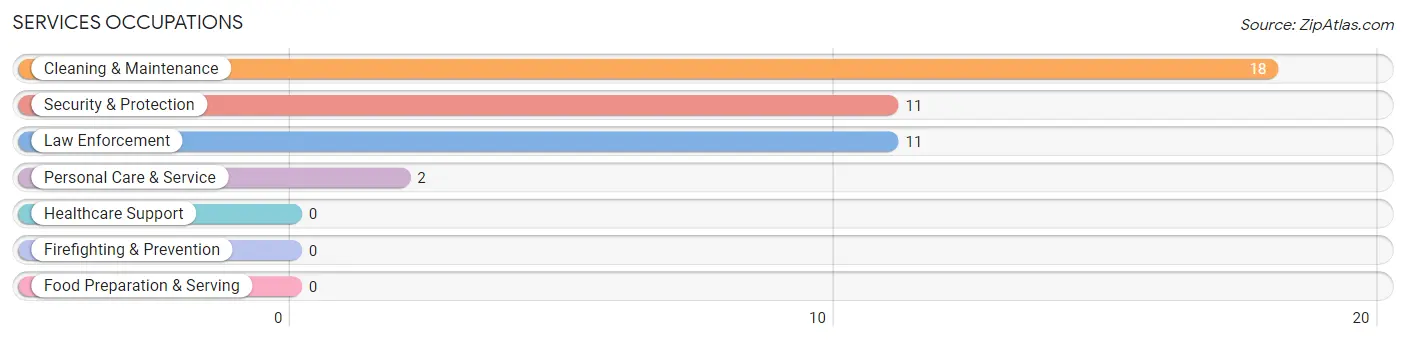
Services Occupations
The most common Services occupations in Webb are Cleaning & Maintenance (18 | 12.9%), Security & Protection (11 | 7.9%), Law Enforcement (11 | 7.9%), and Personal Care & Service (2 | 1.4%).
Services Occupations by Sex
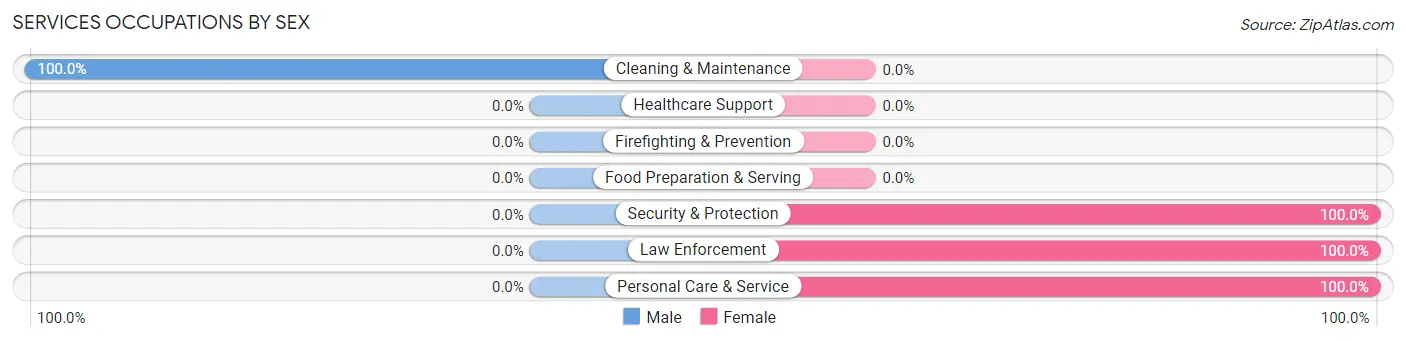
| Occupation | Male | Female |
| Healthcare Support | 0 (0.0%) | 0 (0.0%) |
| Security & Protection | 0 (0.0%) | 11 (100.0%) |
| Firefighting & Prevention | 0 (0.0%) | 0 (0.0%) |
| Law Enforcement | 0 (0.0%) | 11 (100.0%) |
| Food Preparation & Serving | 0 (0.0%) | 0 (0.0%) |
| Cleaning & Maintenance | 18 (100.0%) | 0 (0.0%) |
| Personal Care & Service | 0 (0.0%) | 2 (100.0%) |
| Total (Category) | 18 (58.1%) | 13 (41.9%) |
| Total (Overall) | 79 (56.4%) | 61 (43.6%) |
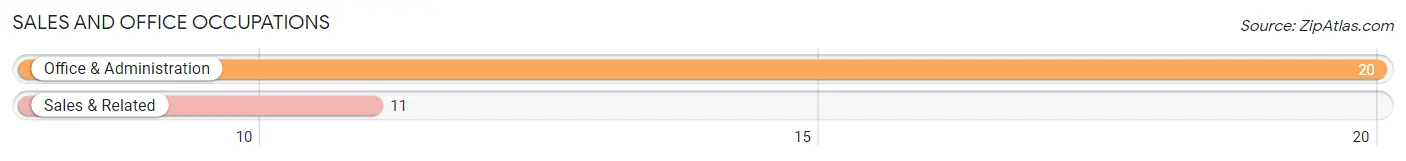
Sales and Office Occupations
The most common Sales and Office occupations in Webb are Office & Administration (20 | 14.3%), and Sales & Related (11 | 7.9%).
Sales and Office Occupations by Sex
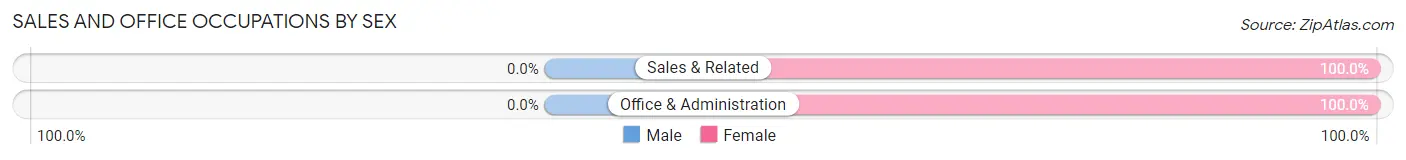
| Occupation | Male | Female |
| Sales & Related | 0 (0.0%) | 11 (100.0%) |
| Office & Administration | 0 (0.0%) | 20 (100.0%) |
| Total (Category) | 0 (0.0%) | 31 (100.0%) |
| Total (Overall) | 79 (56.4%) | 61 (43.6%) |
Natural Resources, Construction and Maintenance Occupations
The most common Natural Resources, Construction and Maintenance occupations in Webb are , and Installation, Maintenance & Repair (24 | 17.1%).
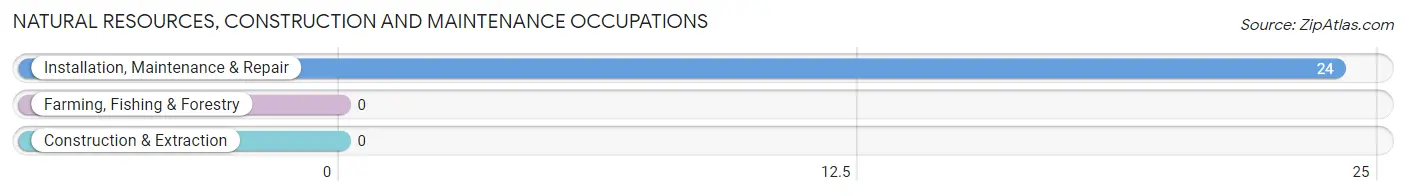
Natural Resources, Construction and Maintenance Occupations by Sex
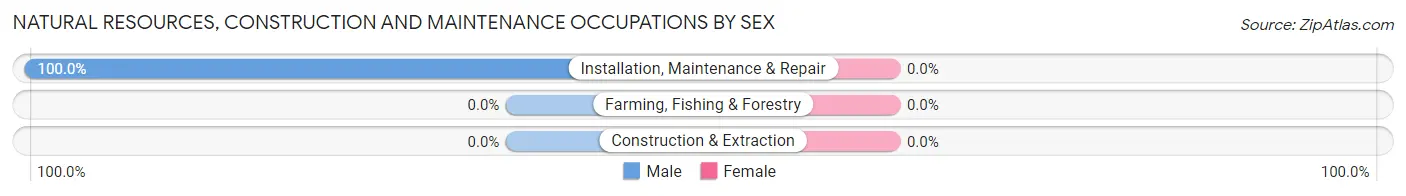
| Occupation | Male | Female |
| Farming, Fishing & Forestry | 0 (0.0%) | 0 (0.0%) |
| Construction & Extraction | 0 (0.0%) | 0 (0.0%) |
| Installation, Maintenance & Repair | 24 (100.0%) | 0 (0.0%) |
| Total (Category) | 24 (100.0%) | 0 (0.0%) |
| Total (Overall) | 79 (56.4%) | 61 (43.6%) |
Production, Transportation and Moving Occupations
The most common Production, Transportation and Moving occupations in Webb are Transportation (15 | 10.7%), Production (11 | 7.9%), and Material Moving (11 | 7.9%).
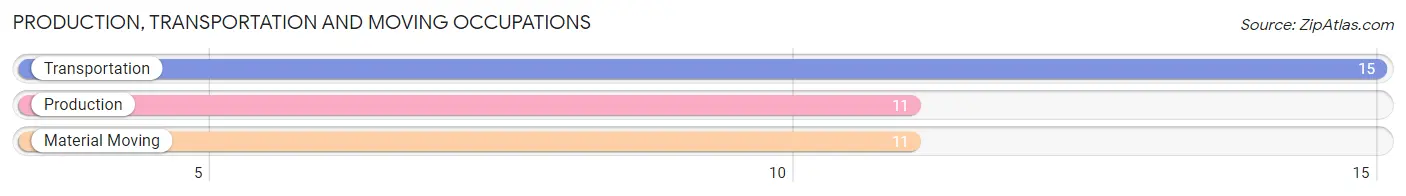
Production, Transportation and Moving Occupations by Sex
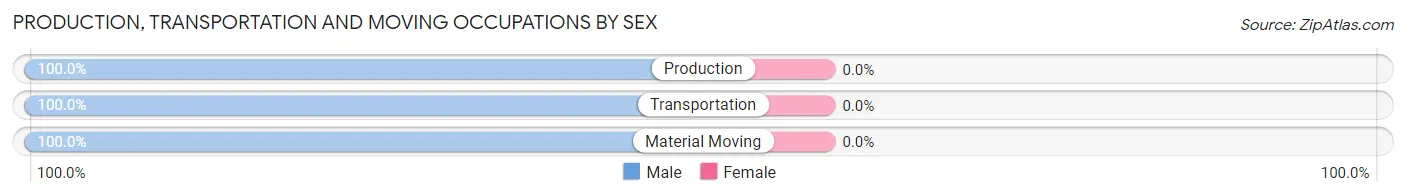
| Occupation | Male | Female |
| Production | 11 (100.0%) | 0 (0.0%) |
| Transportation | 15 (100.0%) | 0 (0.0%) |
| Material Moving | 11 (100.0%) | 0 (0.0%) |
| Total (Category) | 37 (100.0%) | 0 (0.0%) |
| Total (Overall) | 79 (56.4%) | 61 (43.6%) |
Employment Industries by Sex in Webb
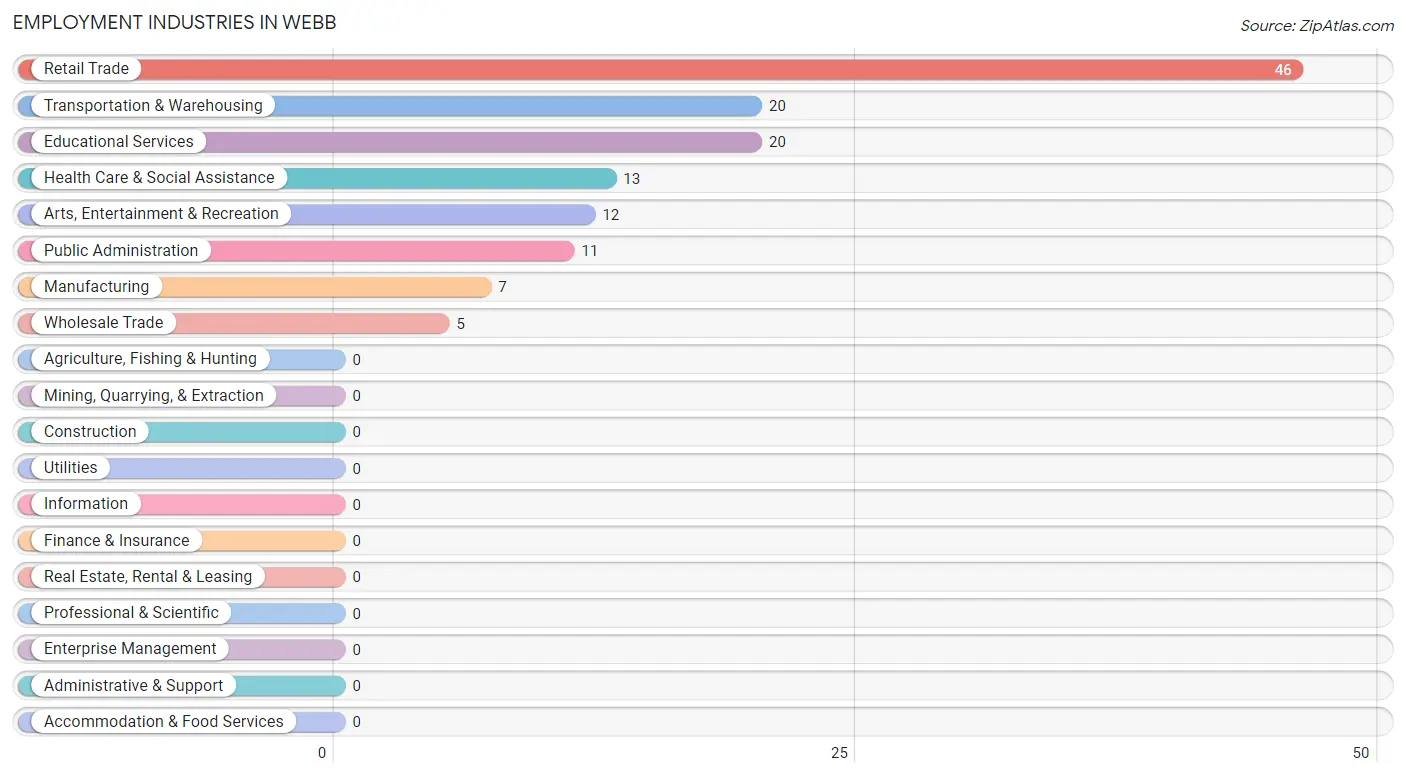
Employment Industries in Webb
The major employment industries in Webb include Retail Trade (46 | 32.9%), Transportation & Warehousing (20 | 14.3%), Educational Services (20 | 14.3%), Health Care & Social Assistance (13 | 9.3%), and Arts, Entertainment & Recreation (12 | 8.6%).
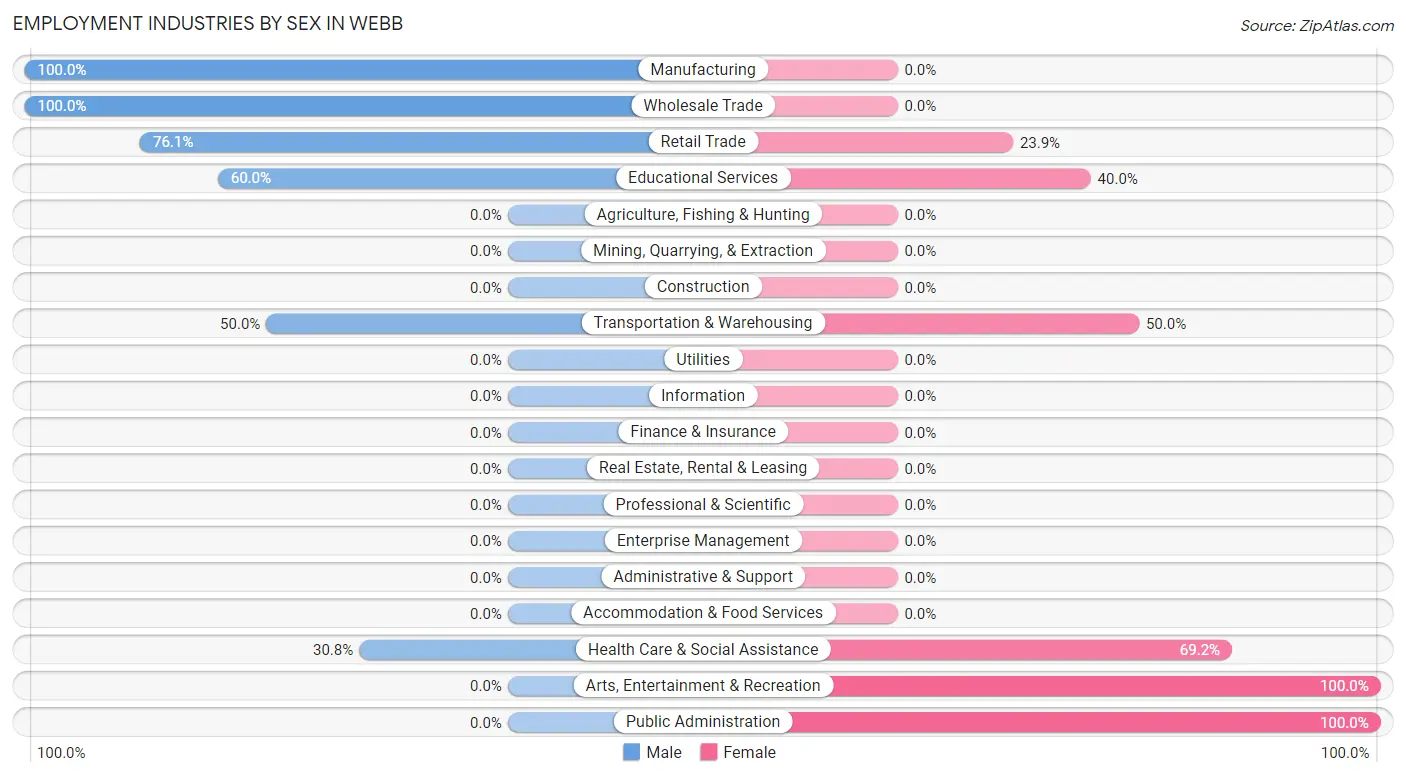
Employment Industries by Sex in Webb
The Webb industries that see more men than women are Manufacturing (100.0%), Wholesale Trade (100.0%), and Retail Trade (76.1%), whereas the industries that tend to have a higher number of women are Arts, Entertainment & Recreation (100.0%), Public Administration (100.0%), and Health Care & Social Assistance (69.2%).
| Industry | Male | Female |
| Agriculture, Fishing & Hunting | 0 (0.0%) | 0 (0.0%) |
| Mining, Quarrying, & Extraction | 0 (0.0%) | 0 (0.0%) |
| Construction | 0 (0.0%) | 0 (0.0%) |
| Manufacturing | 7 (100.0%) | 0 (0.0%) |
| Wholesale Trade | 5 (100.0%) | 0 (0.0%) |
| Retail Trade | 35 (76.1%) | 11 (23.9%) |
| Transportation & Warehousing | 10 (50.0%) | 10 (50.0%) |
| Utilities | 0 (0.0%) | 0 (0.0%) |
| Information | 0 (0.0%) | 0 (0.0%) |
| Finance & Insurance | 0 (0.0%) | 0 (0.0%) |
| Real Estate, Rental & Leasing | 0 (0.0%) | 0 (0.0%) |
| Professional & Scientific | 0 (0.0%) | 0 (0.0%) |
| Enterprise Management | 0 (0.0%) | 0 (0.0%) |
| Administrative & Support | 0 (0.0%) | 0 (0.0%) |
| Educational Services | 12 (60.0%) | 8 (40.0%) |
| Health Care & Social Assistance | 4 (30.8%) | 9 (69.2%) |
| Arts, Entertainment & Recreation | 0 (0.0%) | 12 (100.0%) |
| Accommodation & Food Services | 0 (0.0%) | 0 (0.0%) |
| Public Administration | 0 (0.0%) | 11 (100.0%) |
| Total | 79 (56.4%) | 61 (43.6%) |
Education in Webb
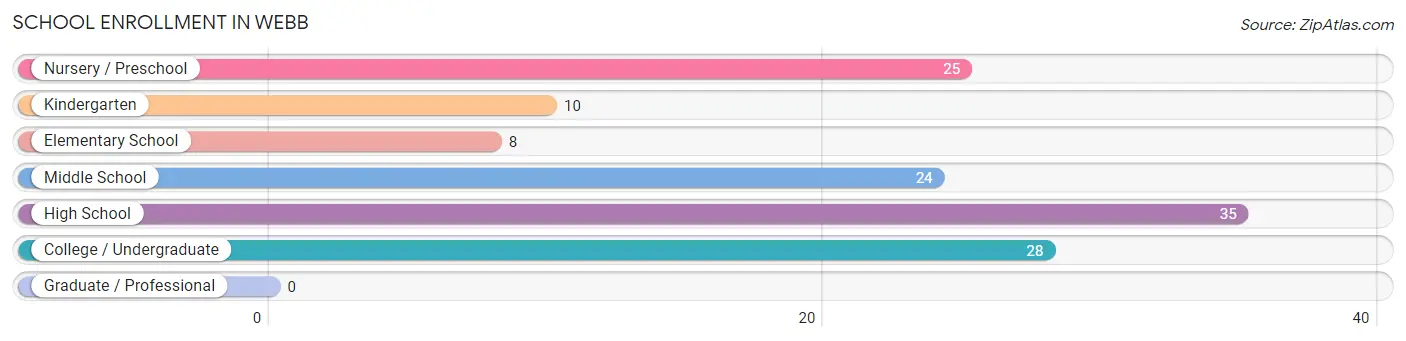
School Enrollment in Webb
The most common levels of schooling among the 130 students in Webb are high school (35 | 26.9%), college / undergraduate (28 | 21.5%), and nursery / preschool (25 | 19.2%).
| School Level | # Students | % Students |
| Nursery / Preschool | 25 | 19.2% |
| Kindergarten | 10 | 7.7% |
| Elementary School | 8 | 6.1% |
| Middle School | 24 | 18.5% |
| High School | 35 | 26.9% |
| College / Undergraduate | 28 | 21.5% |
| Graduate / Professional | 0 | 0.0% |
| Total | 130 | 100.0% |
School Enrollment by Age by Funding Source in Webb
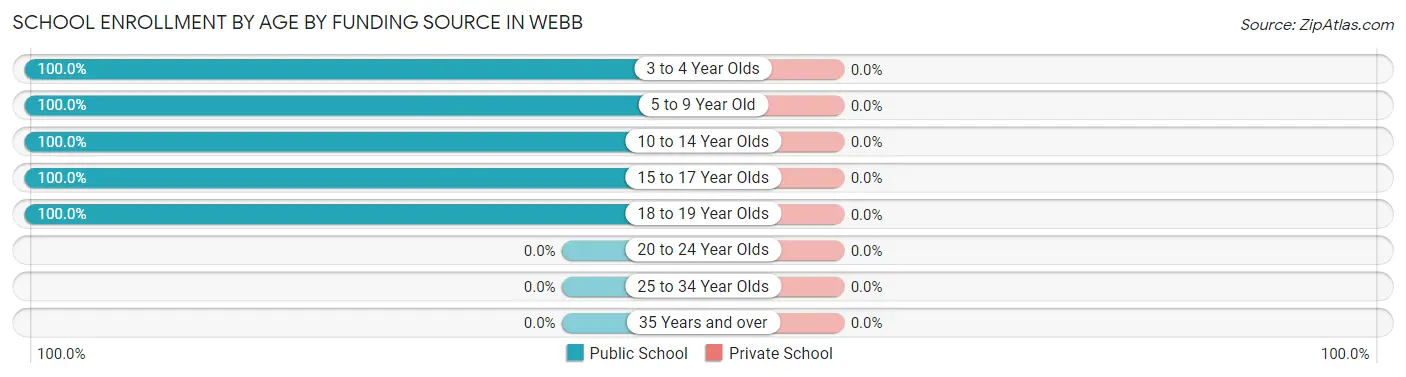
| Age Bracket | Public School | Private School |
| 3 to 4 Year Olds | 25 (100.0%) | 0 (0.0%) |
| 5 to 9 Year Old | 18 (100.0%) | 0 (0.0%) |
| 10 to 14 Year Olds | 42 (100.0%) | 0 (0.0%) |
| 15 to 17 Year Olds | 17 (100.0%) | 0 (0.0%) |
| 18 to 19 Year Olds | 28 (100.0%) | 0 (0.0%) |
| 20 to 24 Year Olds | 0 (0.0%) | 0 (0.0%) |
| 25 to 34 Year Olds | 0 (0.0%) | 0 (0.0%) |
| 35 Years and over | 0 (0.0%) | 0 (0.0%) |
| Total | 130 (100.0%) | 0 (0.0%) |
Educational Attainment by Field of Study in Webb
Liberal arts & history (9 | 36.0%), arts & humanities (8 | 32.0%), education (6 | 24.0%), and social sciences (2 | 8.0%) are the most common fields of study among 25 individuals in Webb who have obtained a bachelor's degree or higher.
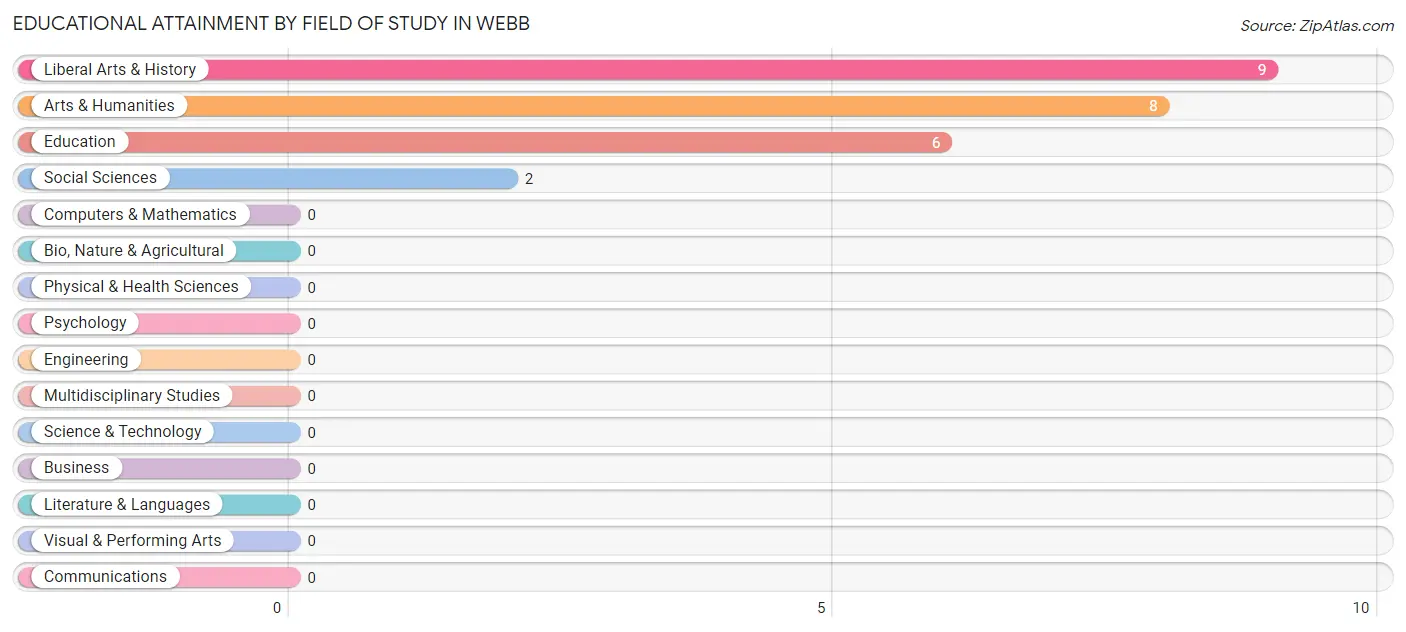
| Field of Study | # Graduates | % Graduates |
| Computers & Mathematics | 0 | 0.0% |
| Bio, Nature & Agricultural | 0 | 0.0% |
| Physical & Health Sciences | 0 | 0.0% |
| Psychology | 0 | 0.0% |
| Social Sciences | 2 | 8.0% |
| Engineering | 0 | 0.0% |
| Multidisciplinary Studies | 0 | 0.0% |
| Science & Technology | 0 | 0.0% |
| Business | 0 | 0.0% |
| Education | 6 | 24.0% |
| Literature & Languages | 0 | 0.0% |
| Liberal Arts & History | 9 | 36.0% |
| Visual & Performing Arts | 0 | 0.0% |
| Communications | 0 | 0.0% |
| Arts & Humanities | 8 | 32.0% |
| Total | 25 | 100.0% |
Transportation & Commute in Webb
Vehicle Availability by Sex in Webb
The most prevalent vehicle ownership categories in Webb are males with 1 vehicle (38, accounting for 48.1%) and females with 1 vehicle (17, making up 69.1%).
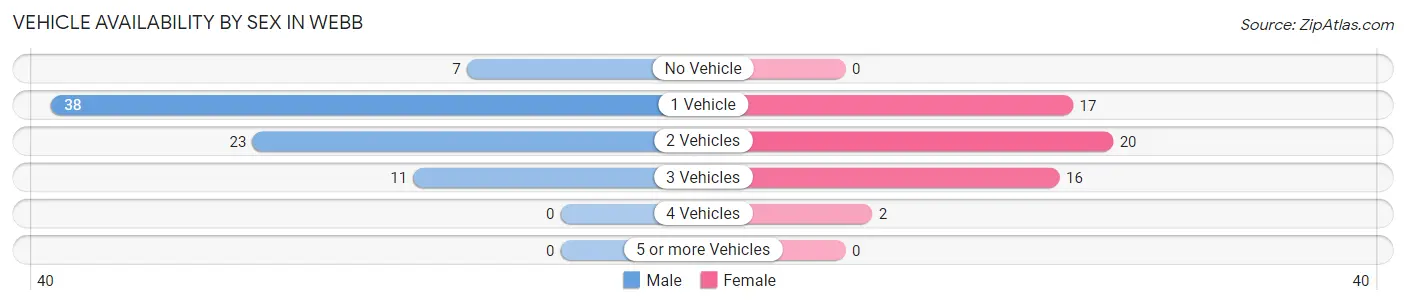
| Vehicles Available | Male | Female |
| No Vehicle | 7 (8.9%) | 0 (0.0%) |
| 1 Vehicle | 38 (48.1%) | 17 (30.9%) |
| 2 Vehicles | 23 (29.1%) | 20 (36.4%) |
| 3 Vehicles | 11 (13.9%) | 16 (29.1%) |
| 4 Vehicles | 0 (0.0%) | 2 (3.6%) |
| 5 or more Vehicles | 0 (0.0%) | 0 (0.0%) |
| Total | 79 (100.0%) | 55 (100.0%) |
Commute Time in Webb
The most frequently occuring commute durations in Webb are less than 5 minutes (29 commuters, 21.6%), 25 to 29 minutes (25 commuters, 18.7%), and 5 to 9 minutes (22 commuters, 16.4%).
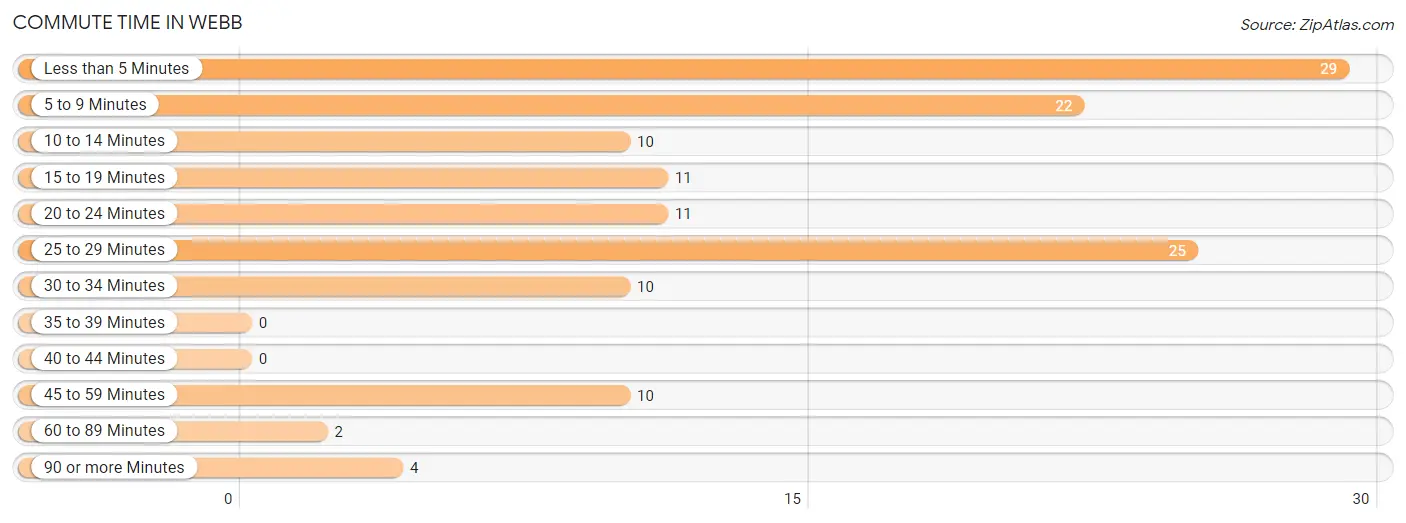
| Commute Time | # Commuters | % Commuters |
| Less than 5 Minutes | 29 | 21.6% |
| 5 to 9 Minutes | 22 | 16.4% |
| 10 to 14 Minutes | 10 | 7.5% |
| 15 to 19 Minutes | 11 | 8.2% |
| 20 to 24 Minutes | 11 | 8.2% |
| 25 to 29 Minutes | 25 | 18.7% |
| 30 to 34 Minutes | 10 | 7.5% |
| 35 to 39 Minutes | 0 | 0.0% |
| 40 to 44 Minutes | 0 | 0.0% |
| 45 to 59 Minutes | 10 | 7.5% |
| 60 to 89 Minutes | 2 | 1.5% |
| 90 or more Minutes | 4 | 3.0% |
Commute Time by Sex in Webb
The most common commute times in Webb are less than 5 minutes (24 commuters, 30.4%) for males and 5 to 9 minutes (17 commuters, 30.9%) for females.
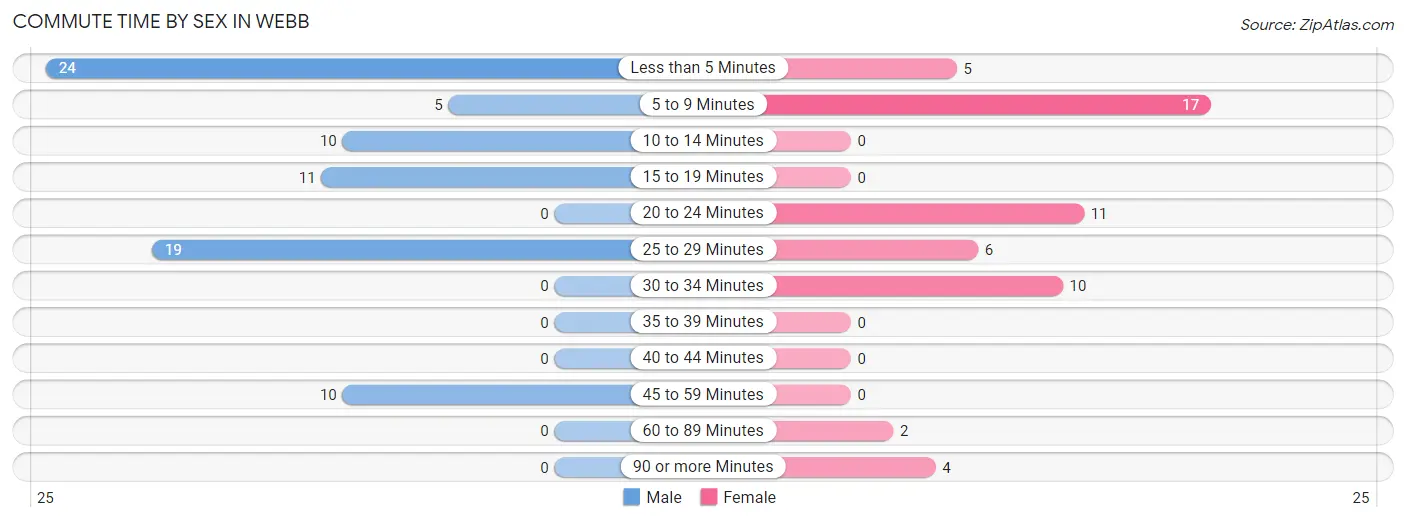
| Commute Time | Male | Female |
| Less than 5 Minutes | 24 (30.4%) | 5 (9.1%) |
| 5 to 9 Minutes | 5 (6.3%) | 17 (30.9%) |
| 10 to 14 Minutes | 10 (12.7%) | 0 (0.0%) |
| 15 to 19 Minutes | 11 (13.9%) | 0 (0.0%) |
| 20 to 24 Minutes | 0 (0.0%) | 11 (20.0%) |
| 25 to 29 Minutes | 19 (24.0%) | 6 (10.9%) |
| 30 to 34 Minutes | 0 (0.0%) | 10 (18.2%) |
| 35 to 39 Minutes | 0 (0.0%) | 0 (0.0%) |
| 40 to 44 Minutes | 0 (0.0%) | 0 (0.0%) |
| 45 to 59 Minutes | 10 (12.7%) | 0 (0.0%) |
| 60 to 89 Minutes | 0 (0.0%) | 2 (3.6%) |
| 90 or more Minutes | 0 (0.0%) | 4 (7.3%) |
Time of Departure to Work by Sex in Webb
The most frequent times of departure to work in Webb are 7:00 AM to 7:29 AM (24, 30.4%) for males and 7:00 AM to 7:29 AM (11, 20.0%) for females.
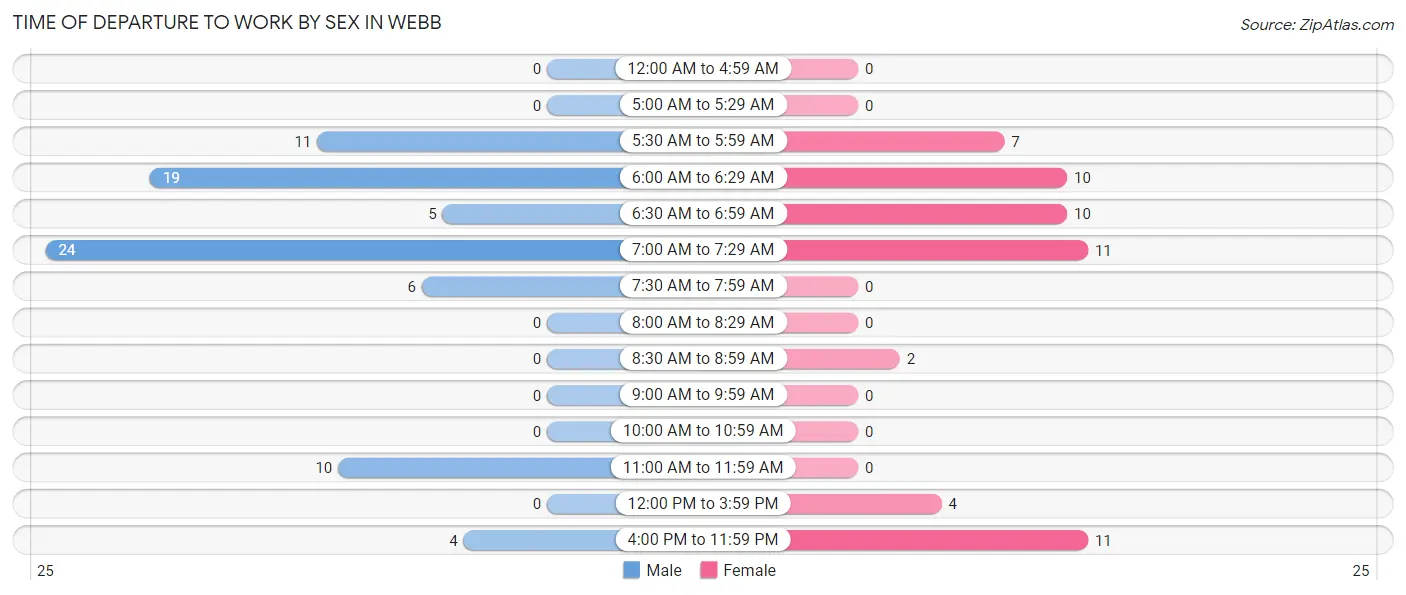
| Time of Departure | Male | Female |
| 12:00 AM to 4:59 AM | 0 (0.0%) | 0 (0.0%) |
| 5:00 AM to 5:29 AM | 0 (0.0%) | 0 (0.0%) |
| 5:30 AM to 5:59 AM | 11 (13.9%) | 7 (12.7%) |
| 6:00 AM to 6:29 AM | 19 (24.0%) | 10 (18.2%) |
| 6:30 AM to 6:59 AM | 5 (6.3%) | 10 (18.2%) |
| 7:00 AM to 7:29 AM | 24 (30.4%) | 11 (20.0%) |
| 7:30 AM to 7:59 AM | 6 (7.6%) | 0 (0.0%) |
| 8:00 AM to 8:29 AM | 0 (0.0%) | 0 (0.0%) |
| 8:30 AM to 8:59 AM | 0 (0.0%) | 2 (3.6%) |
| 9:00 AM to 9:59 AM | 0 (0.0%) | 0 (0.0%) |
| 10:00 AM to 10:59 AM | 0 (0.0%) | 0 (0.0%) |
| 11:00 AM to 11:59 AM | 10 (12.7%) | 0 (0.0%) |
| 12:00 PM to 3:59 PM | 0 (0.0%) | 4 (7.3%) |
| 4:00 PM to 11:59 PM | 4 (5.1%) | 11 (20.0%) |
| Total | 79 (100.0%) | 55 (100.0%) |
Housing Occupancy in Webb
Occupancy by Ownership in Webb
Of the total 226 dwellings in Webb, owner-occupied units account for 122 (54.0%), while renter-occupied units make up 104 (46.0%).
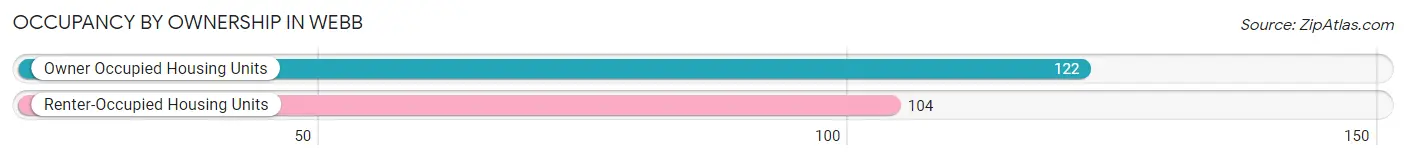
| Occupancy | # Housing Units | % Housing Units |
| Owner Occupied Housing Units | 122 | 54.0% |
| Renter-Occupied Housing Units | 104 | 46.0% |
| Total Occupied Housing Units | 226 | 100.0% |
Occupancy by Household Size in Webb

| Household Size | # Housing Units | % Housing Units |
| 1-Person Household | 91 | 40.3% |
| 2-Person Household | 77 | 34.1% |
| 3-Person Household | 48 | 21.2% |
| 4+ Person Household | 10 | 4.4% |
| Total Housing Units | 226 | 100.0% |
Occupancy by Ownership by Household Size in Webb
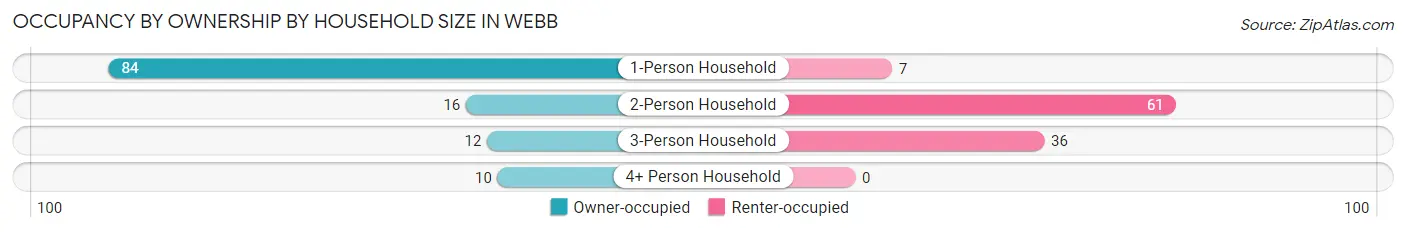
| Household Size | Owner-occupied | Renter-occupied |
| 1-Person Household | 84 (92.3%) | 7 (7.7%) |
| 2-Person Household | 16 (20.8%) | 61 (79.2%) |
| 3-Person Household | 12 (25.0%) | 36 (75.0%) |
| 4+ Person Household | 10 (100.0%) | 0 (0.0%) |
| Total Housing Units | 122 (54.0%) | 104 (46.0%) |
Occupancy by Educational Attainment in Webb
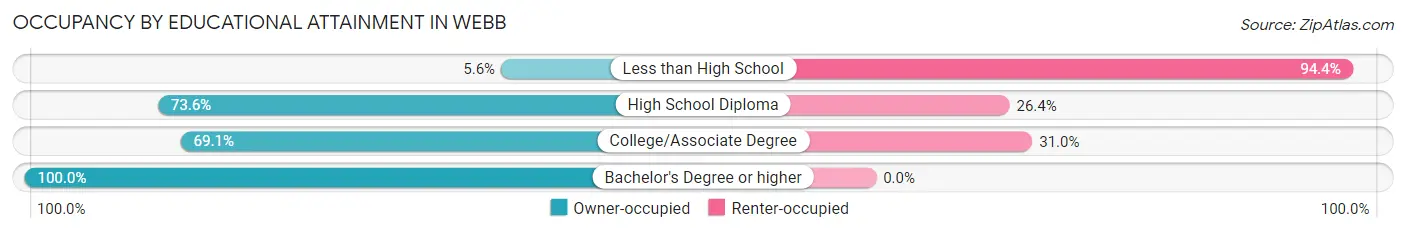
| Household Size | Owner-occupied | Renter-occupied |
| Less than High School | 4 (5.6%) | 68 (94.4%) |
| High School Diploma | 64 (73.6%) | 23 (26.4%) |
| College/Associate Degree | 29 (69.1%) | 13 (30.9%) |
| Bachelor's Degree or higher | 25 (100.0%) | 0 (0.0%) |
Occupancy by Age of Householder in Webb
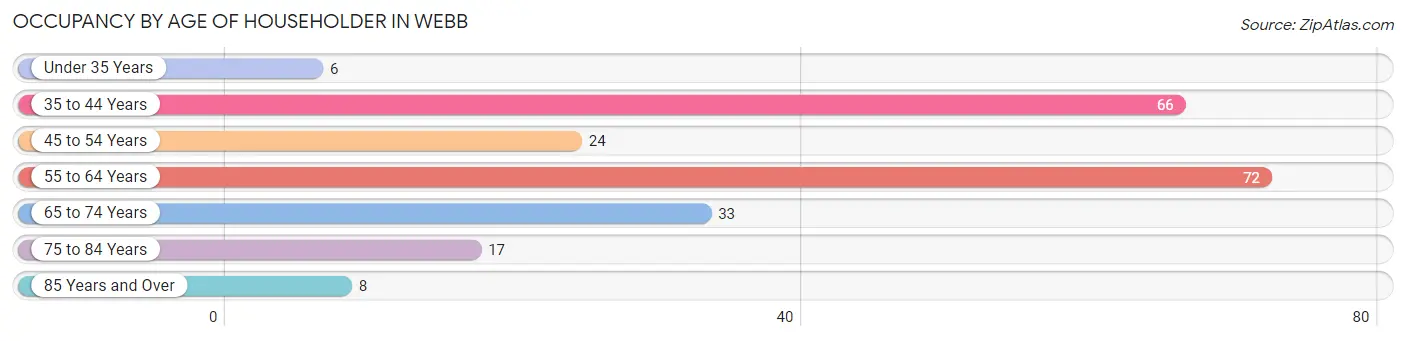
| Age Bracket | # Households | % Households |
| Under 35 Years | 6 | 2.6% |
| 35 to 44 Years | 66 | 29.2% |
| 45 to 54 Years | 24 | 10.6% |
| 55 to 64 Years | 72 | 31.9% |
| 65 to 74 Years | 33 | 14.6% |
| 75 to 84 Years | 17 | 7.5% |
| 85 Years and Over | 8 | 3.5% |
| Total | 226 | 100.0% |
Housing Finances in Webb
Median Income by Occupancy in Webb
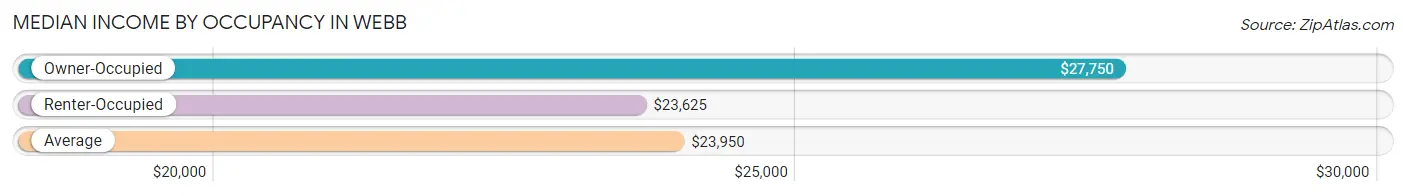
| Occupancy Type | # Households | Median Income |
| Owner-Occupied | 122 (54.0%) | $27,750 |
| Renter-Occupied | 104 (46.0%) | $23,625 |
| Average | 226 (100.0%) | $23,950 |
Occupancy by Householder Income Bracket in Webb
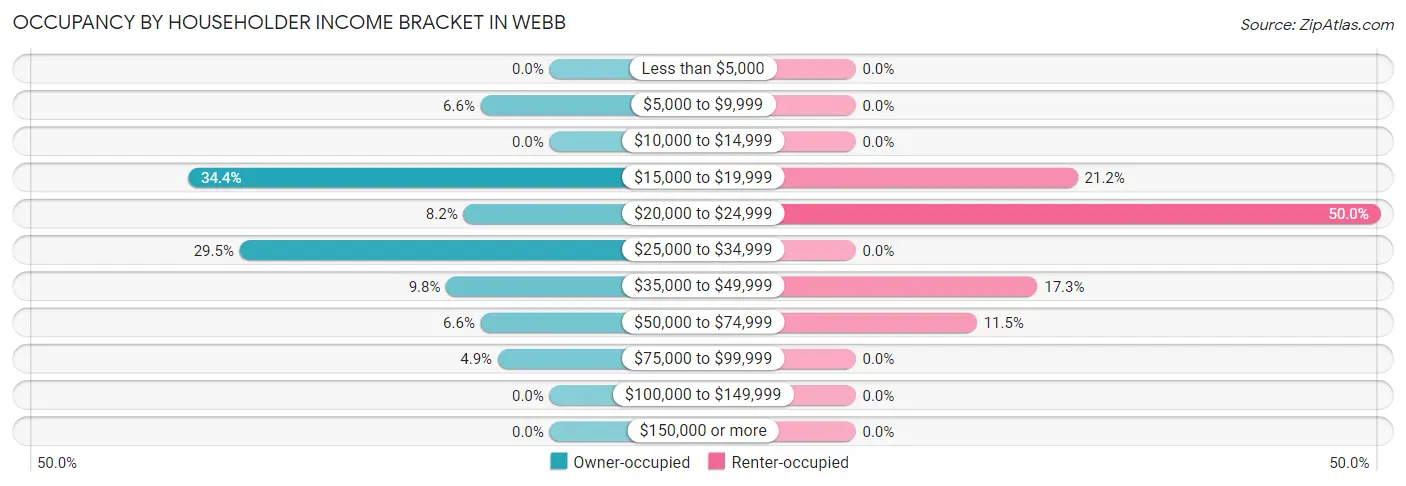
| Income Bracket | Owner-occupied | Renter-occupied |
| Less than $5,000 | 0 (0.0%) | 0 (0.0%) |
| $5,000 to $9,999 | 8 (6.6%) | 0 (0.0%) |
| $10,000 to $14,999 | 0 (0.0%) | 0 (0.0%) |
| $15,000 to $19,999 | 42 (34.4%) | 22 (21.1%) |
| $20,000 to $24,999 | 10 (8.2%) | 52 (50.0%) |
| $25,000 to $34,999 | 36 (29.5%) | 0 (0.0%) |
| $35,000 to $49,999 | 12 (9.8%) | 18 (17.3%) |
| $50,000 to $74,999 | 8 (6.6%) | 12 (11.5%) |
| $75,000 to $99,999 | 6 (4.9%) | 0 (0.0%) |
| $100,000 to $149,999 | 0 (0.0%) | 0 (0.0%) |
| $150,000 or more | 0 (0.0%) | 0 (0.0%) |
| Total | 122 (100.0%) | 104 (100.0%) |
Monthly Housing Cost Tiers in Webb
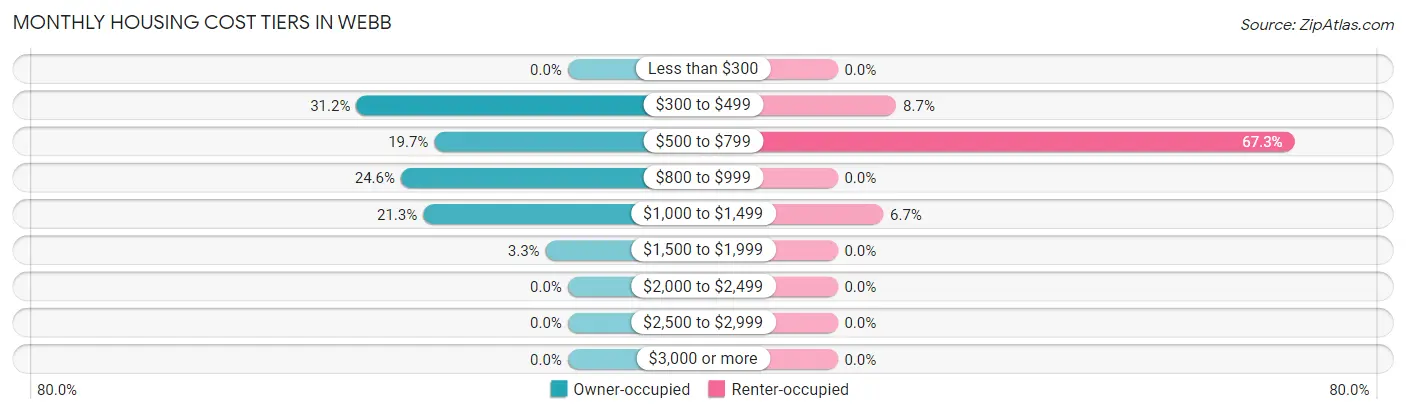
| Monthly Cost | Owner-occupied | Renter-occupied |
| Less than $300 | 0 (0.0%) | 0 (0.0%) |
| $300 to $499 | 38 (31.1%) | 9 (8.6%) |
| $500 to $799 | 24 (19.7%) | 70 (67.3%) |
| $800 to $999 | 30 (24.6%) | 0 (0.0%) |
| $1,000 to $1,499 | 26 (21.3%) | 7 (6.7%) |
| $1,500 to $1,999 | 4 (3.3%) | 0 (0.0%) |
| $2,000 to $2,499 | 0 (0.0%) | 0 (0.0%) |
| $2,500 to $2,999 | 0 (0.0%) | 0 (0.0%) |
| $3,000 or more | 0 (0.0%) | 0 (0.0%) |
| Total | 122 (100.0%) | 104 (100.0%) |
Physical Housing Characteristics in Webb
Housing Structures in Webb
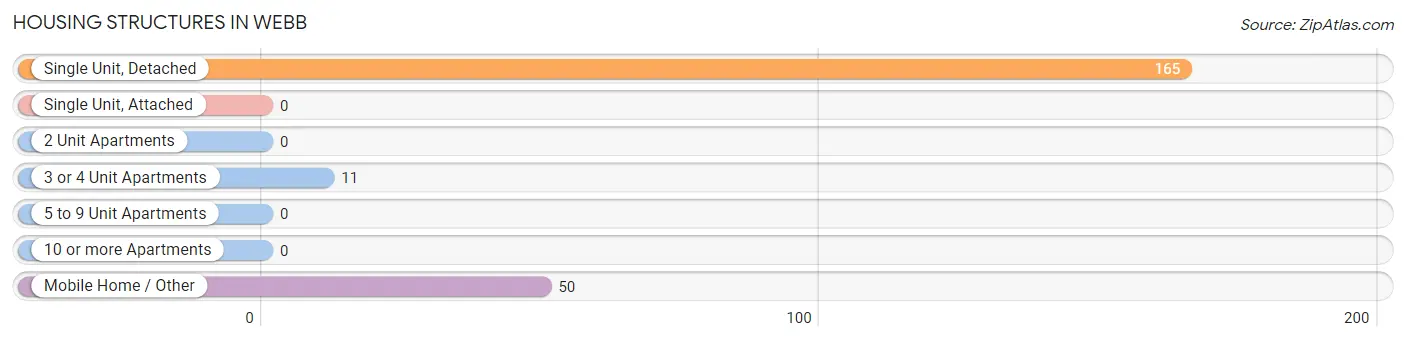
| Structure Type | # Housing Units | % Housing Units |
| Single Unit, Detached | 165 | 73.0% |
| Single Unit, Attached | 0 | 0.0% |
| 2 Unit Apartments | 0 | 0.0% |
| 3 or 4 Unit Apartments | 11 | 4.9% |
| 5 to 9 Unit Apartments | 0 | 0.0% |
| 10 or more Apartments | 0 | 0.0% |
| Mobile Home / Other | 50 | 22.1% |
| Total | 226 | 100.0% |
Housing Structures by Occupancy in Webb
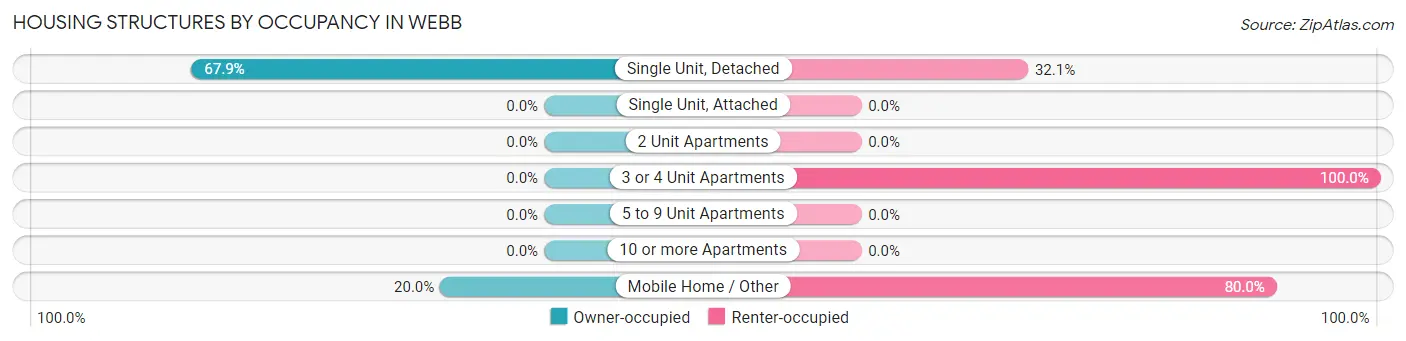
| Structure Type | Owner-occupied | Renter-occupied |
| Single Unit, Detached | 112 (67.9%) | 53 (32.1%) |
| Single Unit, Attached | 0 (0.0%) | 0 (0.0%) |
| 2 Unit Apartments | 0 (0.0%) | 0 (0.0%) |
| 3 or 4 Unit Apartments | 0 (0.0%) | 11 (100.0%) |
| 5 to 9 Unit Apartments | 0 (0.0%) | 0 (0.0%) |
| 10 or more Apartments | 0 (0.0%) | 0 (0.0%) |
| Mobile Home / Other | 10 (20.0%) | 40 (80.0%) |
| Total | 122 (54.0%) | 104 (46.0%) |
Housing Structures by Number of Rooms in Webb
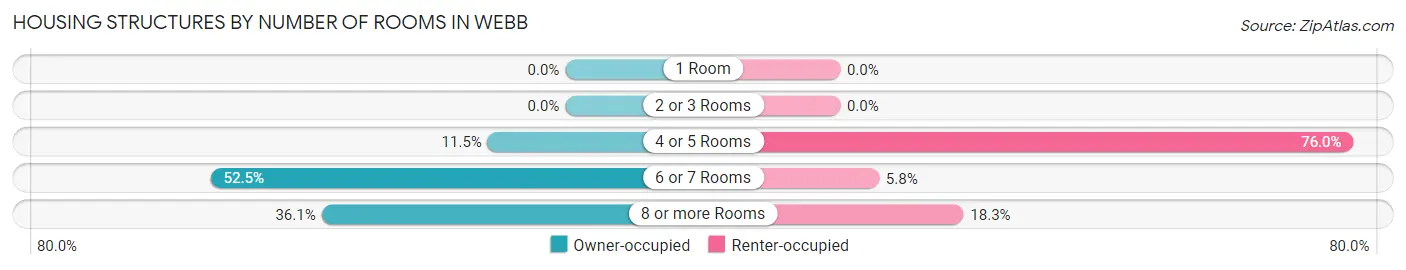
| Number of Rooms | Owner-occupied | Renter-occupied |
| 1 Room | 0 (0.0%) | 0 (0.0%) |
| 2 or 3 Rooms | 0 (0.0%) | 0 (0.0%) |
| 4 or 5 Rooms | 14 (11.5%) | 79 (76.0%) |
| 6 or 7 Rooms | 64 (52.5%) | 6 (5.8%) |
| 8 or more Rooms | 44 (36.1%) | 19 (18.3%) |
| Total | 122 (100.0%) | 104 (100.0%) |
Housing Structure by Heating Type in Webb
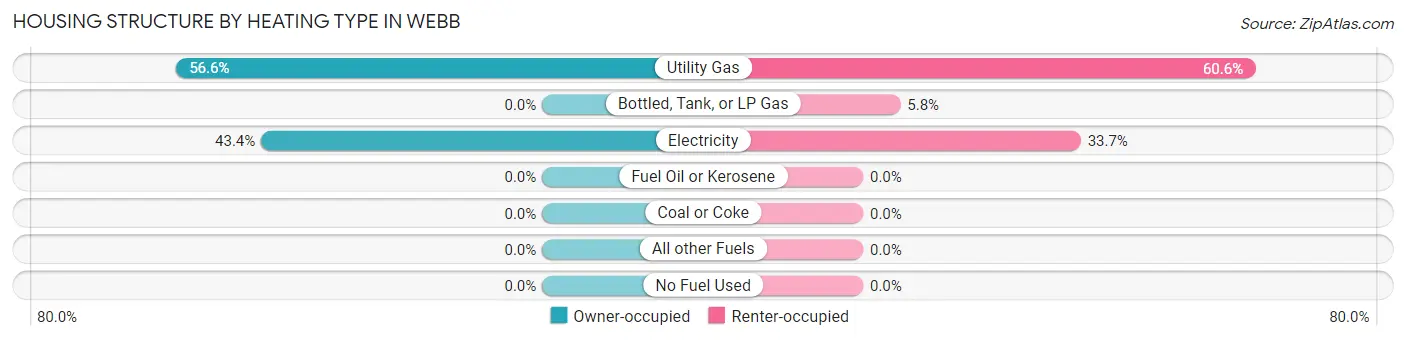
| Heating Type | Owner-occupied | Renter-occupied |
| Utility Gas | 69 (56.6%) | 63 (60.6%) |
| Bottled, Tank, or LP Gas | 0 (0.0%) | 6 (5.8%) |
| Electricity | 53 (43.4%) | 35 (33.7%) |
| Fuel Oil or Kerosene | 0 (0.0%) | 0 (0.0%) |
| Coal or Coke | 0 (0.0%) | 0 (0.0%) |
| All other Fuels | 0 (0.0%) | 0 (0.0%) |
| No Fuel Used | 0 (0.0%) | 0 (0.0%) |
| Total | 122 (100.0%) | 104 (100.0%) |
Household Vehicle Usage in Webb
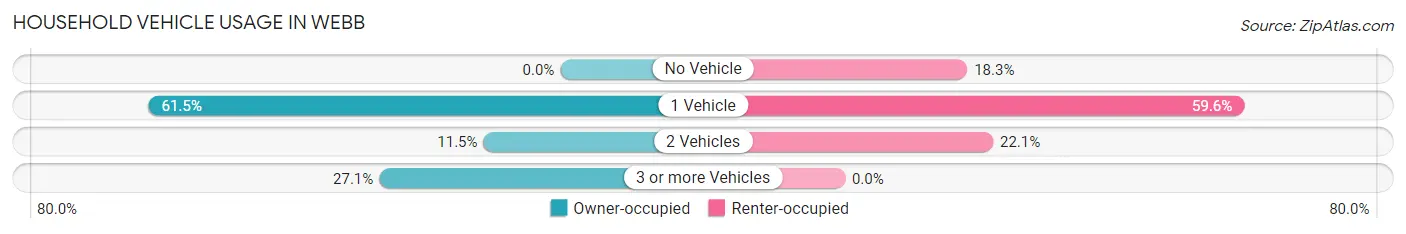
| Vehicles per Household | Owner-occupied | Renter-occupied |
| No Vehicle | 0 (0.0%) | 19 (18.3%) |
| 1 Vehicle | 75 (61.5%) | 62 (59.6%) |
| 2 Vehicles | 14 (11.5%) | 23 (22.1%) |
| 3 or more Vehicles | 33 (27.1%) | 0 (0.0%) |
| Total | 122 (100.0%) | 104 (100.0%) |
Real Estate & Mortgages in Webb
Real Estate and Mortgage Overview in Webb
| Characteristic | Without Mortgage | With Mortgage |
| Housing Units | 38 | 84 |
| Median Property Value | $81,800 | $69,400 |
| Median Household Income | $30,536 | $0 |
| Monthly Housing Costs | $363 | $0 |
| Real Estate Taxes | $931 | $32 |
Property Value by Mortgage Status in Webb
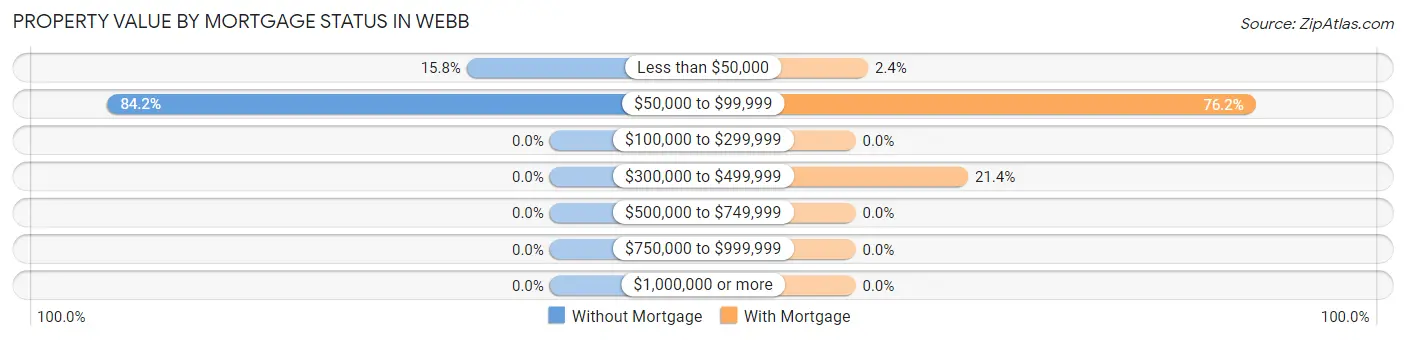
| Property Value | Without Mortgage | With Mortgage |
| Less than $50,000 | 6 (15.8%) | 2 (2.4%) |
| $50,000 to $99,999 | 32 (84.2%) | 64 (76.2%) |
| $100,000 to $299,999 | 0 (0.0%) | 0 (0.0%) |
| $300,000 to $499,999 | 0 (0.0%) | 18 (21.4%) |
| $500,000 to $749,999 | 0 (0.0%) | 0 (0.0%) |
| $750,000 to $999,999 | 0 (0.0%) | 0 (0.0%) |
| $1,000,000 or more | 0 (0.0%) | 0 (0.0%) |
| Total | 38 (100.0%) | 84 (100.0%) |
Household Income by Mortgage Status in Webb
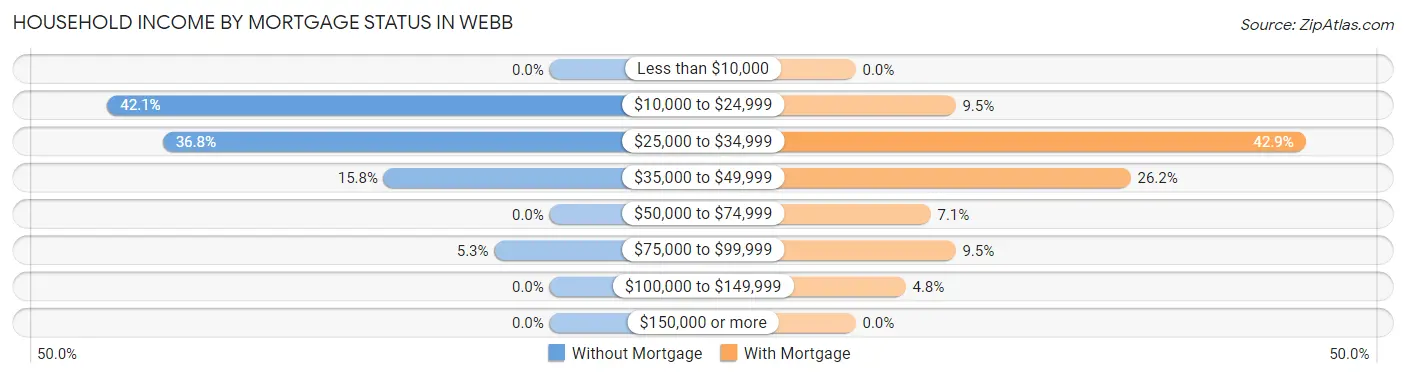
| Household Income | Without Mortgage | With Mortgage |
| Less than $10,000 | 0 (0.0%) | 0 (0.0%) |
| $10,000 to $24,999 | 16 (42.1%) | 8 (9.5%) |
| $25,000 to $34,999 | 14 (36.8%) | 36 (42.9%) |
| $35,000 to $49,999 | 6 (15.8%) | 22 (26.2%) |
| $50,000 to $74,999 | 0 (0.0%) | 6 (7.1%) |
| $75,000 to $99,999 | 2 (5.3%) | 8 (9.5%) |
| $100,000 to $149,999 | 0 (0.0%) | 4 (4.8%) |
| $150,000 or more | 0 (0.0%) | 0 (0.0%) |
| Total | 38 (100.0%) | 84 (100.0%) |
Property Value to Household Income Ratio in Webb
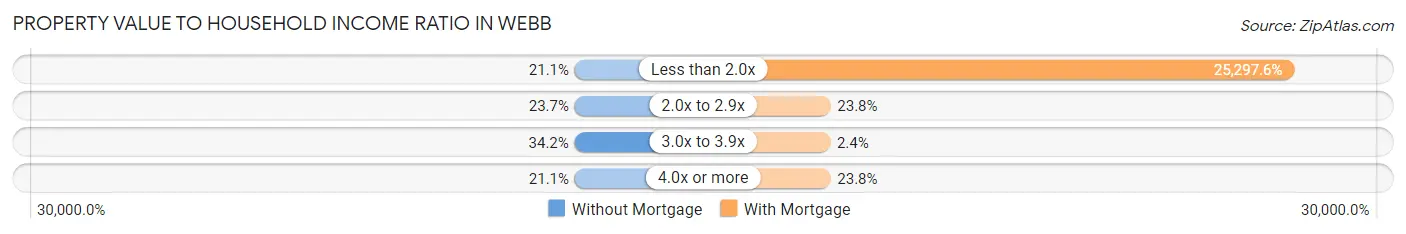
| Value-to-Income Ratio | Without Mortgage | With Mortgage |
| Less than 2.0x | 8 (21.0%) | 21,250 (25,297.6%) |
| 2.0x to 2.9x | 9 (23.7%) | 20 (23.8%) |
| 3.0x to 3.9x | 13 (34.2%) | 2 (2.4%) |
| 4.0x or more | 8 (21.0%) | 20 (23.8%) |
| Total | 38 (100.0%) | 84 (100.0%) |
Real Estate Taxes by Mortgage Status in Webb
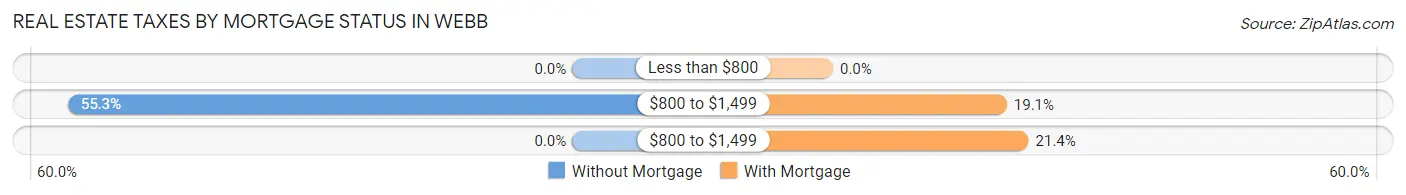
| Property Taxes | Without Mortgage | With Mortgage |
| Less than $800 | 0 (0.0%) | 0 (0.0%) |
| $800 to $1,499 | 21 (55.3%) | 16 (19.1%) |
| $800 to $1,499 | 0 (0.0%) | 18 (21.4%) |
| Total | 38 (100.0%) | 84 (100.0%) |
Health & Disability in Webb
Health Insurance Coverage by Age in Webb
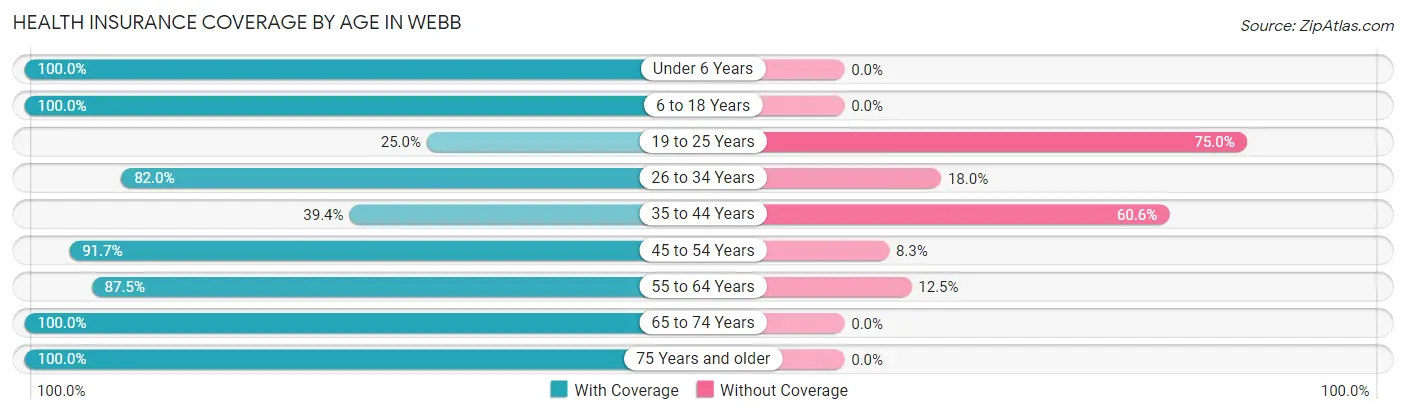
| Age Bracket | With Coverage | Without Coverage |
| Under 6 Years | 81 (100.0%) | 0 (0.0%) |
| 6 to 18 Years | 91 (100.0%) | 0 (0.0%) |
| 19 to 25 Years | 4 (25.0%) | 12 (75.0%) |
| 26 to 34 Years | 50 (82.0%) | 11 (18.0%) |
| 35 to 44 Years | 28 (39.4%) | 43 (60.6%) |
| 45 to 54 Years | 22 (91.7%) | 2 (8.3%) |
| 55 to 64 Years | 63 (87.5%) | 9 (12.5%) |
| 65 to 74 Years | 48 (100.0%) | 0 (0.0%) |
| 75 Years and older | 25 (100.0%) | 0 (0.0%) |
| Total | 412 (84.3%) | 77 (15.8%) |
Health Insurance Coverage by Citizenship Status in Webb
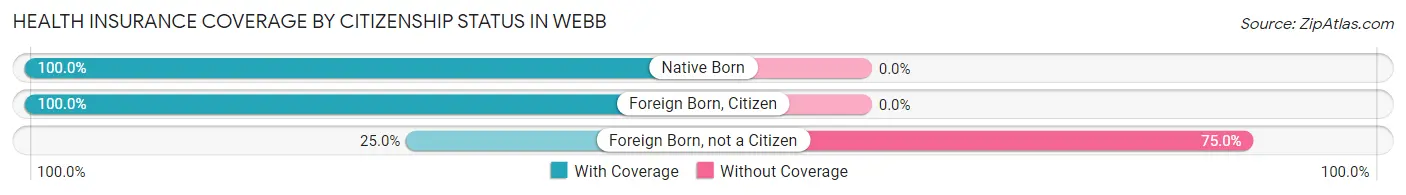
| Citizenship Status | With Coverage | Without Coverage |
| Native Born | 81 (100.0%) | 0 (0.0%) |
| Foreign Born, Citizen | 91 (100.0%) | 0 (0.0%) |
| Foreign Born, not a Citizen | 4 (25.0%) | 12 (75.0%) |
Health Insurance Coverage by Household Income in Webb
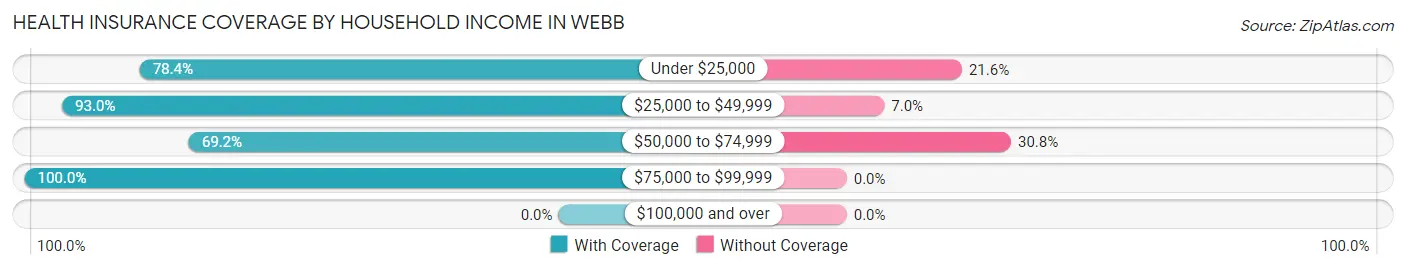
| Household Income | With Coverage | Without Coverage |
| Under $25,000 | 189 (78.4%) | 52 (21.6%) |
| $25,000 to $49,999 | 172 (93.0%) | 13 (7.0%) |
| $50,000 to $74,999 | 27 (69.2%) | 12 (30.8%) |
| $75,000 to $99,999 | 24 (100.0%) | 0 (0.0%) |
| $100,000 and over | 0 (0.0%) | 0 (0.0%) |
Public vs Private Health Insurance Coverage by Age in Webb
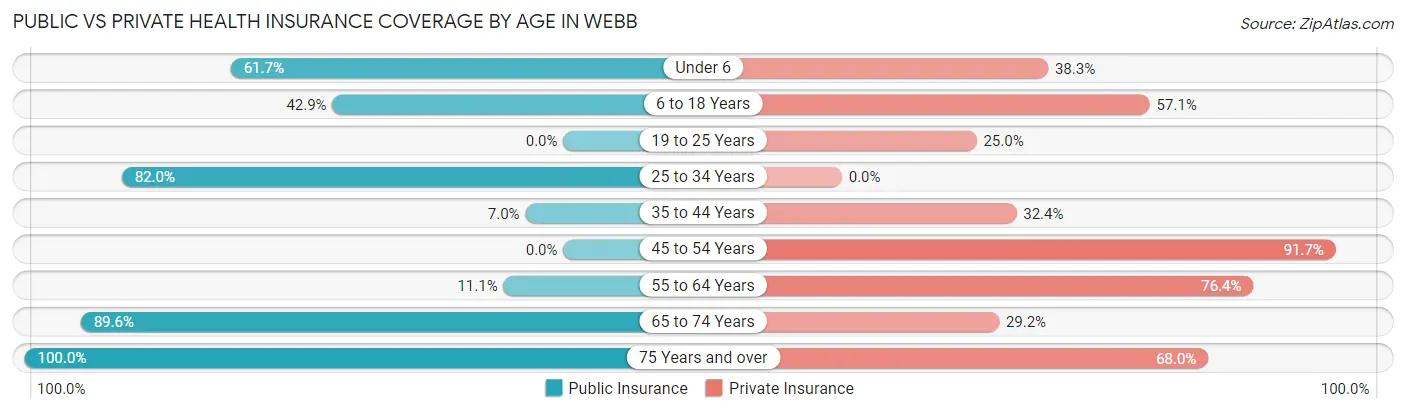
| Age Bracket | Public Insurance | Private Insurance |
| Under 6 | 50 (61.7%) | 31 (38.3%) |
| 6 to 18 Years | 39 (42.9%) | 52 (57.1%) |
| 19 to 25 Years | 0 (0.0%) | 4 (25.0%) |
| 25 to 34 Years | 50 (82.0%) | 0 (0.0%) |
| 35 to 44 Years | 5 (7.0%) | 23 (32.4%) |
| 45 to 54 Years | 0 (0.0%) | 22 (91.7%) |
| 55 to 64 Years | 8 (11.1%) | 55 (76.4%) |
| 65 to 74 Years | 43 (89.6%) | 14 (29.2%) |
| 75 Years and over | 25 (100.0%) | 17 (68.0%) |
| Total | 220 (45.0%) | 218 (44.6%) |
Disability Status by Sex by Age in Webb
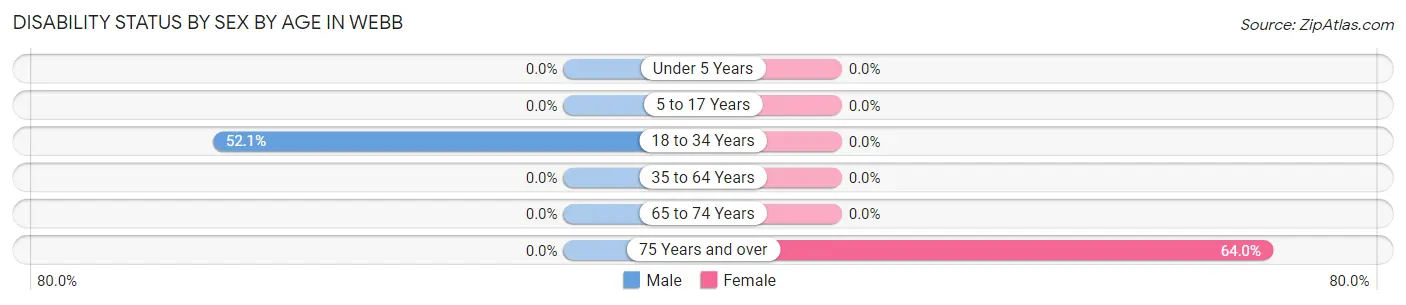
| Age Bracket | Male | Female |
| Under 5 Years | 0 (0.0%) | 0 (0.0%) |
| 5 to 17 Years | 0 (0.0%) | 0 (0.0%) |
| 18 to 34 Years | 38 (52.0%) | 0 (0.0%) |
| 35 to 64 Years | 0 (0.0%) | 0 (0.0%) |
| 65 to 74 Years | 0 (0.0%) | 0 (0.0%) |
| 75 Years and over | 0 (0.0%) | 16 (64.0%) |
Disability Class by Sex by Age in Webb
Disability Class: Hearing Difficulty
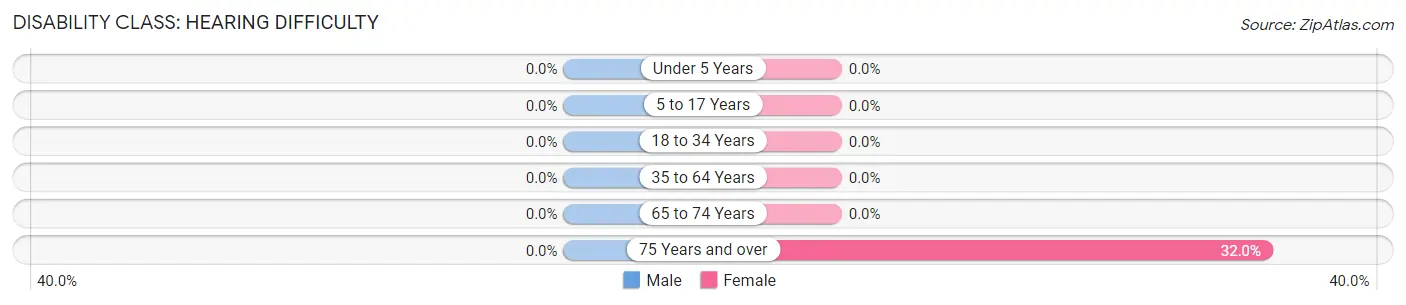
| Age Bracket | Male | Female |
| Under 5 Years | 0 (0.0%) | 0 (0.0%) |
| 5 to 17 Years | 0 (0.0%) | 0 (0.0%) |
| 18 to 34 Years | 0 (0.0%) | 0 (0.0%) |
| 35 to 64 Years | 0 (0.0%) | 0 (0.0%) |
| 65 to 74 Years | 0 (0.0%) | 0 (0.0%) |
| 75 Years and over | 0 (0.0%) | 8 (32.0%) |
Disability Class: Vision Difficulty
| Age Bracket | Male | Female |
| Under 5 Years | 0 (0.0%) | 0 (0.0%) |
| 5 to 17 Years | 0 (0.0%) | 0 (0.0%) |
| 18 to 34 Years | 0 (0.0%) | 0 (0.0%) |
| 35 to 64 Years | 0 (0.0%) | 0 (0.0%) |
| 65 to 74 Years | 0 (0.0%) | 0 (0.0%) |
| 75 Years and over | 0 (0.0%) | 0 (0.0%) |
Disability Class: Cognitive Difficulty
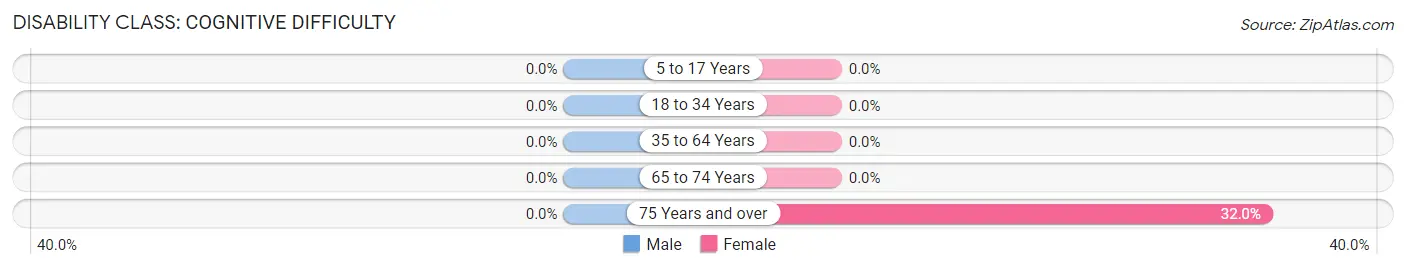
| Age Bracket | Male | Female |
| 5 to 17 Years | 0 (0.0%) | 0 (0.0%) |
| 18 to 34 Years | 0 (0.0%) | 0 (0.0%) |
| 35 to 64 Years | 0 (0.0%) | 0 (0.0%) |
| 65 to 74 Years | 0 (0.0%) | 0 (0.0%) |
| 75 Years and over | 0 (0.0%) | 8 (32.0%) |
Disability Class: Ambulatory Difficulty
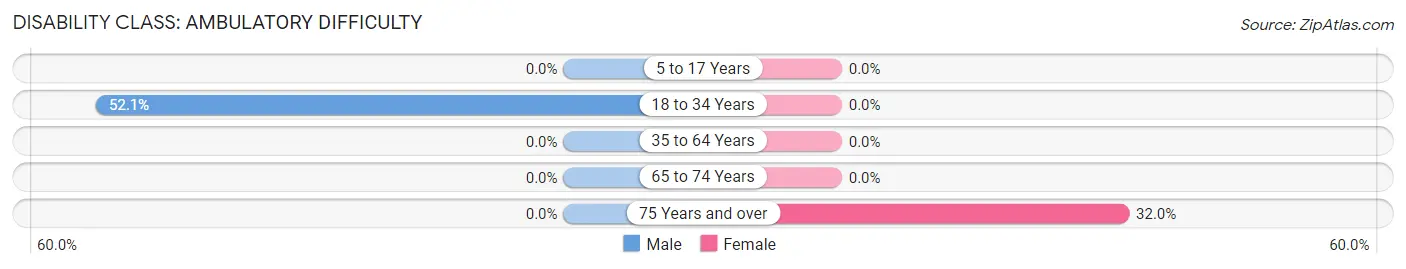
| Age Bracket | Male | Female |
| 5 to 17 Years | 0 (0.0%) | 0 (0.0%) |
| 18 to 34 Years | 38 (52.0%) | 0 (0.0%) |
| 35 to 64 Years | 0 (0.0%) | 0 (0.0%) |
| 65 to 74 Years | 0 (0.0%) | 0 (0.0%) |
| 75 Years and over | 0 (0.0%) | 8 (32.0%) |
Disability Class: Self-Care Difficulty
| Age Bracket | Male | Female |
| 5 to 17 Years | 0 (0.0%) | 0 (0.0%) |
| 18 to 34 Years | 0 (0.0%) | 0 (0.0%) |
| 35 to 64 Years | 0 (0.0%) | 0 (0.0%) |
| 65 to 74 Years | 0 (0.0%) | 0 (0.0%) |
| 75 Years and over | 0 (0.0%) | 0 (0.0%) |
Technology Access in Webb
Computing Device Access in Webb
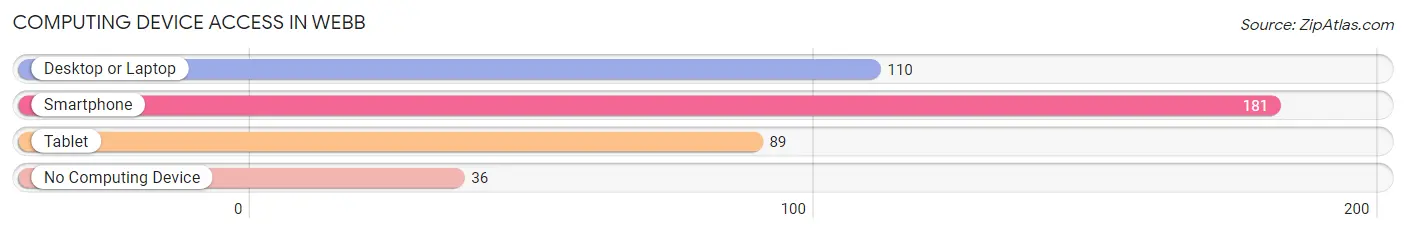
| Device Type | # Households | % Households |
| Desktop or Laptop | 110 | 48.7% |
| Smartphone | 181 | 80.1% |
| Tablet | 89 | 39.4% |
| No Computing Device | 36 | 15.9% |
| Total | 226 | 100.0% |
Internet Access in Webb
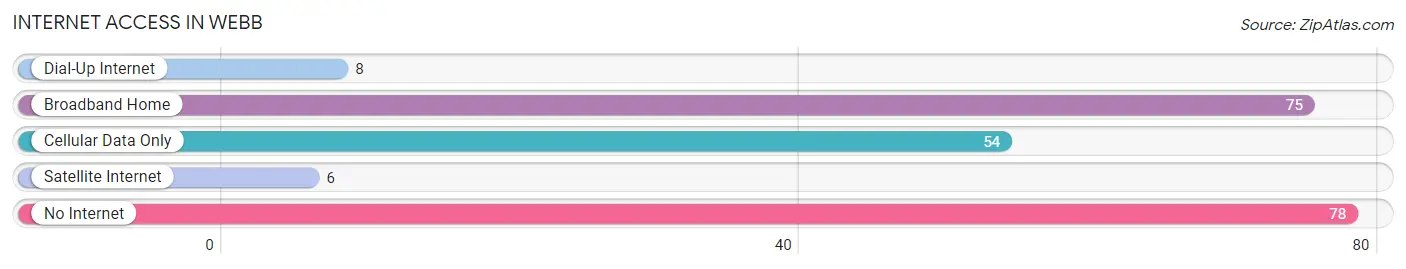
| Internet Type | # Households | % Households |
| Dial-Up Internet | 8 | 3.5% |
| Broadband Home | 75 | 33.2% |
| Cellular Data Only | 54 | 23.9% |
| Satellite Internet | 6 | 2.6% |
| No Internet | 78 | 34.5% |
| Total | 226 | 100.0% |
Webb Summary
MS History
Mississippi is a state located in the southeastern region of the United States. It is bordered by Tennessee to the north, Alabama to the east, the Gulf of Mexico to the south, and Louisiana and Arkansas to the west. Mississippi has a rich and diverse history, with its roots stretching back to the early days of the United States. The state was originally part of the French colony of Louisiana, and was later ceded to the United States in the Louisiana Purchase of 1803. Mississippi was admitted to the Union as the 20th state in 1817.
Mississippi has a long and complex history, with its roots stretching back to the early days of the United States. The state was originally inhabited by Native American tribes, including the Choctaw, Chickasaw, and Natchez. The first Europeans to explore the area were the Spanish, who arrived in the 16th century. The French later established a colony in the area, and the British took control of the region after the French and Indian War. After the American Revolution, the area became part of the United States.
Mississippi was a major battleground during the Civil War, with the state’s capital, Jackson, being the site of several major battles. After the war, Mississippi was the first state to ratify the Thirteenth Amendment, which abolished slavery. The state was also the first to ratify the Fourteenth Amendment, which granted citizenship to former slaves.
In the late 19th and early 20th centuries, Mississippi was a major center of the civil rights movement. The state was the site of several major civil rights protests, including the Freedom Rides of 1961 and the March on Washington in 1963. In 1964, Mississippi became the last state to ratify the Thirteenth Amendment, which abolished slavery.
Geography
Mississippi is located in the southeastern region of the United States. It is bordered by Tennessee to the north, Alabama to the east, the Gulf of Mexico to the south, and Louisiana and Arkansas to the west. The state has a total area of 48,430 square miles, making it the 32nd largest state in the country.
The landscape of Mississippi is mostly flat, with the exception of the hills and mountains in the northern part of the state. The highest point in the state is Woodall Mountain, which has an elevation of 806 feet. The state is home to several major rivers, including the Mississippi River, the Yazoo River, and the Pearl River.
Economy
Mississippi has a diverse economy, with a variety of industries contributing to its overall economic output. The state’s largest industry is agriculture, which accounts for about one-third of the state’s total economic output. Other major industries in the state include manufacturing, tourism, and services.
The state’s agricultural sector is dominated by the production of cotton, soybeans, corn, and rice. Mississippi is also a major producer of poultry, livestock, and timber. The state’s manufacturing sector is centered around the production of chemicals, food products, and furniture.
The state’s tourism industry is centered around its many beaches, parks, and historic sites. Mississippi is also home to several major casinos, which attract visitors from all over the country.
Demographics
As of 2019, Mississippi had an estimated population of 2,976,149. The state has a population density of 60.3 people per square mile, making it the 37th most densely populated state in the country.
The racial makeup of Mississippi is 63.7% White, 37.3% African American, 0.3% Native American, 0.5% Asian, 0.1% Pacific Islander, and 1.1% from other races. The state’s Hispanic population is 2.2%.
The median household income in Mississippi is $41,754, and the median home value is $118,400. The state’s poverty rate is 19.8%, which is higher than the national average. The state’s unemployment rate is 5.2%.
Common Questions
What is Per Capita Income in Webb?
Per Capita income in Webb is $14,000.
What is the Median Family Income in Webb?
Median Family Income in Webb is $32,813.
What is the Median Household income in Webb?
Median Household Income in Webb is $23,950.
What is Family Income Deficit in Webb?
Family Income Deficit in Webb is $2,525.
Families that are below poverty line in Webb earn $2,525 less on average than the poverty threshold level.
What is Inequality or Gini Index in Webb?
Inequality or Gini Index in Webb is 0.27.
What is the Total Population of Webb?
Total Population of Webb is 489.
What is the Total Male Population of Webb?
Total Male Population of Webb is 260.
What is the Total Female Population of Webb?
Total Female Population of Webb is 229.
What is the Ratio of Males per 100 Females in Webb?
There are 113.54 Males per 100 Females in Webb.
What is the Ratio of Females per 100 Males in Webb?
There are 88.08 Females per 100 Males in Webb.
What is the Median Population Age in Webb?
Median Population Age in Webb is 34.9 Years.
What is the Average Family Size in Webb
Average Family Size in Webb is 3.5 People.
What is the Average Household Size in Webb
Average Household Size in Webb is 2.2 People.
How Large is the Labor Force in Webb?
There are 160 People in the Labor Forcein in Webb.
What is the Percentage of People in the Labor Force in Webb?
44.7% of People are in the Labor Force in Webb.
What is the Unemployment Rate in Webb?
Unemployment Rate in Webb is 12.5%.