Water Valley, MS Map & Demographics
Water Valley Map
Water Valley Overview
$23,388
PER CAPITA INCOME
$50,388
AVG FAMILY INCOME
$45,718
AVG HOUSEHOLD INCOME
53.8%
WAGE / INCOME GAP [ % ]
46.2¢/ $1
WAGE / INCOME GAP [ $ ]
0.40
INEQUALITY / GINI INDEX
3,383
TOTAL POPULATION
1,480
MALE POPULATION
1,903
FEMALE POPULATION
77.77
MALES / 100 FEMALES
128.58
FEMALES / 100 MALES
35.8
MEDIAN AGE
3.0
AVG FAMILY SIZE
2.5
AVG HOUSEHOLD SIZE
1,447
LABOR FORCE [ PEOPLE ]
52.0%
PERCENT IN LABOR FORCE
4.7%
UNEMPLOYMENT RATE
Water Valley Zip Codes
Water Valley Area Codes
Income in Water Valley
Income Overview in Water Valley
Per Capita Income in Water Valley is $23,388, while median incomes of families and households are $50,388 and $45,718 respectively.
| Characteristic | Number | Measure |
| Per Capita Income | 3,383 | $23,388 |
| Median Family Income | 873 | $50,388 |
| Mean Family Income | 873 | $61,522 |
| Median Household Income | 1,263 | $45,718 |
| Mean Household Income | 1,263 | $59,504 |
| Income Deficit | 873 | $0 |
| Wage / Income Gap (%) | 3,383 | 53.78% |
| Wage / Income Gap ($) | 3,383 | 46.22¢ per $1 |
| Gini / Inequality Index | 3,383 | 0.40 |
Earnings by Sex in Water Valley
Average Earnings in Water Valley are $24,838, $44,018 for men and $20,345 for women, a difference of 53.8%.
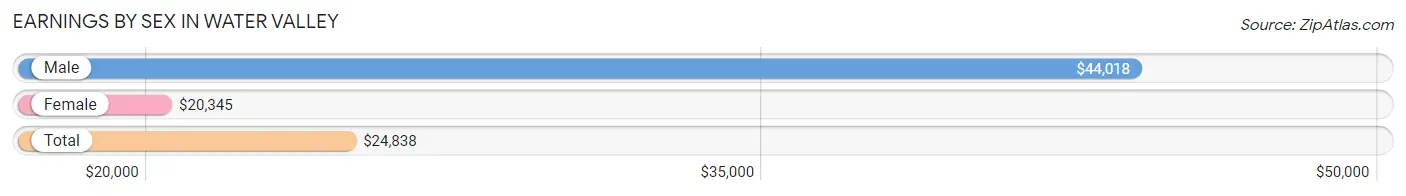
| Sex | Number | Average Earnings |
| Male | 615 (40.2%) | $44,018 |
| Female | 914 (59.8%) | $20,345 |
| Total | 1,529 (100.0%) | $24,838 |
Earnings by Sex by Income Bracket in Water Valley
The most common earnings brackets in Water Valley are $55,000 to $64,999 for men (154 | 25.0%) and $17,500 to $19,999 for women (108 | 11.8%).
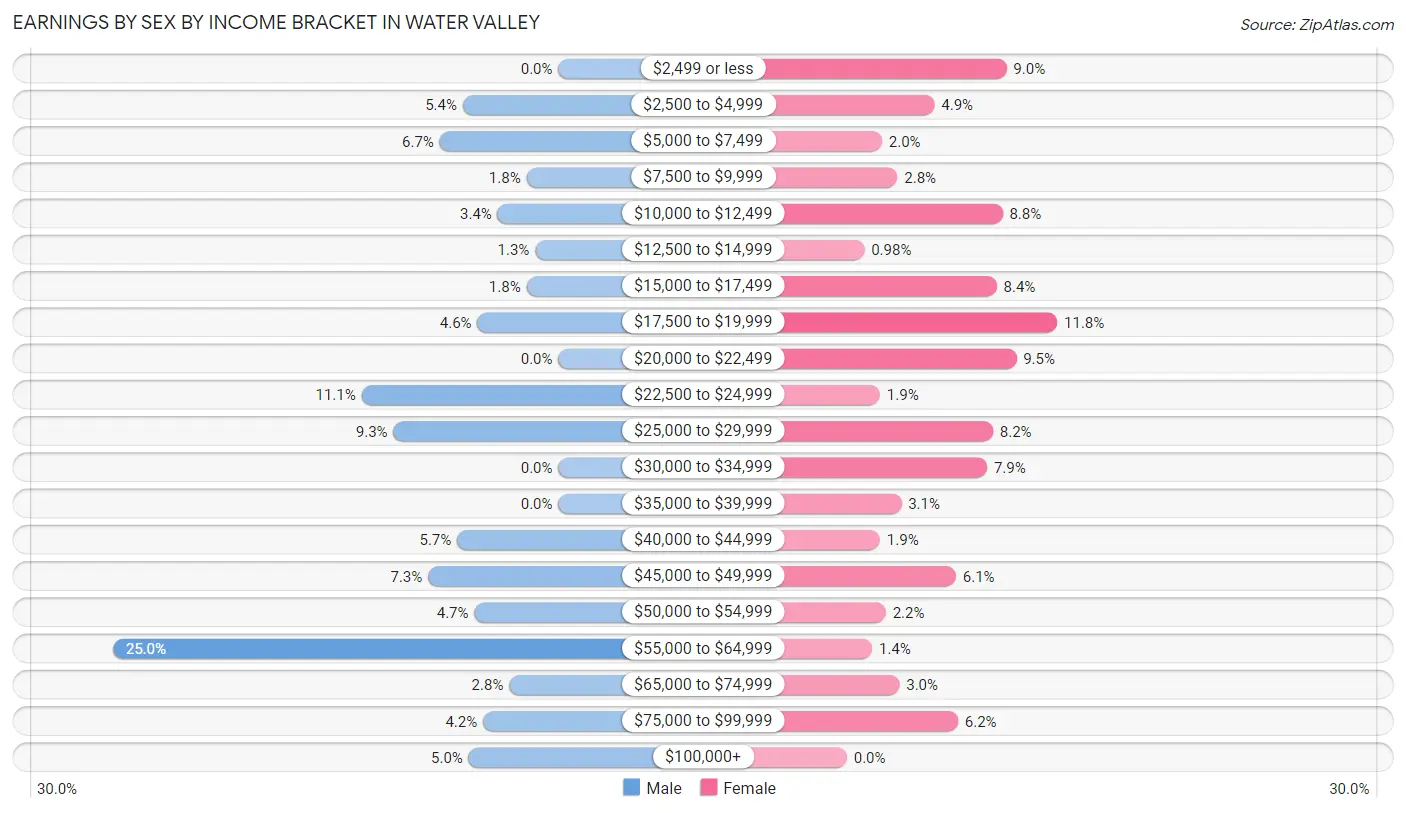
| Income | Male | Female |
| $2,499 or less | 0 (0.0%) | 82 (9.0%) |
| $2,500 to $4,999 | 33 (5.4%) | 45 (4.9%) |
| $5,000 to $7,499 | 41 (6.7%) | 18 (2.0%) |
| $7,500 to $9,999 | 11 (1.8%) | 26 (2.8%) |
| $10,000 to $12,499 | 21 (3.4%) | 80 (8.7%) |
| $12,500 to $14,999 | 8 (1.3%) | 9 (1.0%) |
| $15,000 to $17,499 | 11 (1.8%) | 77 (8.4%) |
| $17,500 to $19,999 | 28 (4.5%) | 108 (11.8%) |
| $20,000 to $22,499 | 0 (0.0%) | 87 (9.5%) |
| $22,500 to $24,999 | 68 (11.1%) | 17 (1.9%) |
| $25,000 to $29,999 | 57 (9.3%) | 75 (8.2%) |
| $30,000 to $34,999 | 0 (0.0%) | 72 (7.9%) |
| $35,000 to $39,999 | 0 (0.0%) | 28 (3.1%) |
| $40,000 to $44,999 | 35 (5.7%) | 17 (1.9%) |
| $45,000 to $49,999 | 45 (7.3%) | 56 (6.1%) |
| $50,000 to $54,999 | 29 (4.7%) | 20 (2.2%) |
| $55,000 to $64,999 | 154 (25.0%) | 13 (1.4%) |
| $65,000 to $74,999 | 17 (2.8%) | 27 (2.9%) |
| $75,000 to $99,999 | 26 (4.2%) | 57 (6.2%) |
| $100,000+ | 31 (5.0%) | 0 (0.0%) |
| Total | 615 (100.0%) | 914 (100.0%) |
Earnings by Sex by Educational Attainment in Water Valley
Average earnings in Water Valley are $49,389 for men and $25,179 for women, a difference of 49.0%. Men with an educational attainment of bachelor's degree enjoy the highest average annual earnings of $61,049, while those with high school diploma education earn the least with $29,130. Women with an educational attainment of bachelor's degree earn the most with the average annual earnings of $40,917, while those with less than high school education have the smallest earnings of $18,579.
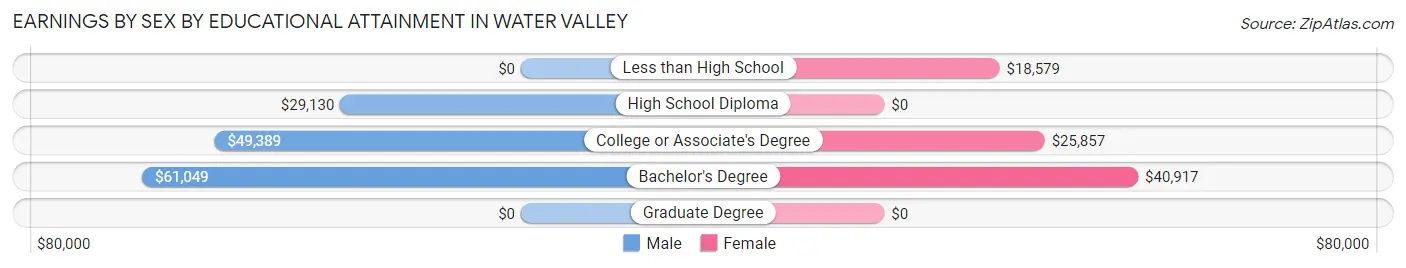
| Educational Attainment | Male Income | Female Income |
| Less than High School | - | - |
| High School Diploma | $29,130 | $0 |
| College or Associate's Degree | $49,389 | $25,857 |
| Bachelor's Degree | $61,049 | $40,917 |
| Graduate Degree | - | - |
| Total | $49,389 | $25,179 |
Family Income in Water Valley
Family Income Brackets in Water Valley
According to the Water Valley family income data, there are 218 families falling into the $75,000 to $99,999 income range, which is the most common income bracket and makes up 25.0% of all families.
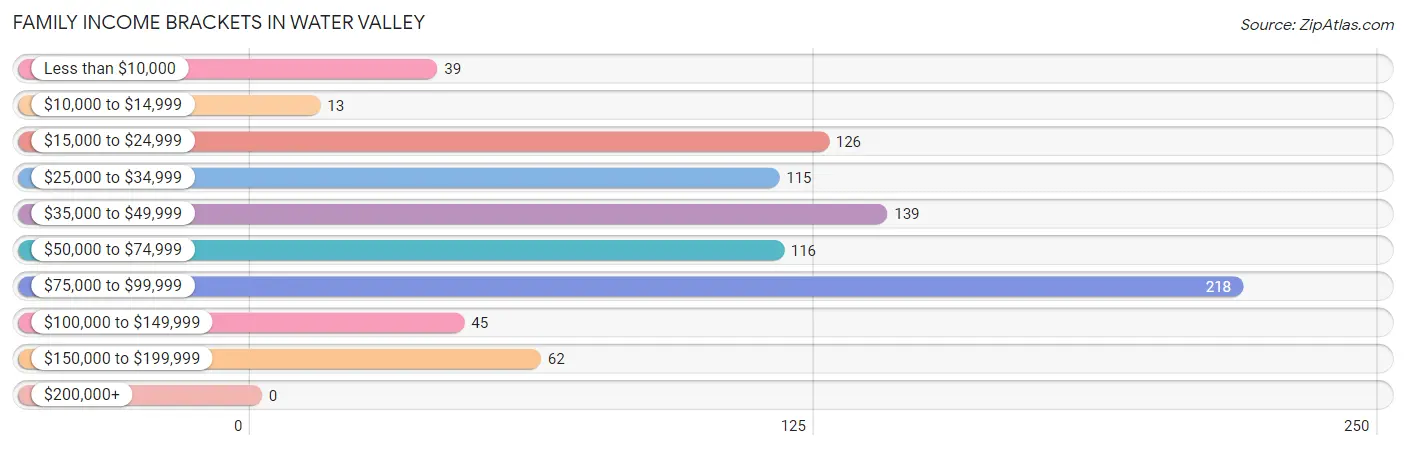
| Income Bracket | # Families | % Families |
| Less than $10,000 | 39 | 4.5% |
| $10,000 to $14,999 | 13 | 1.5% |
| $15,000 to $24,999 | 126 | 14.4% |
| $25,000 to $34,999 | 115 | 13.2% |
| $35,000 to $49,999 | 139 | 15.9% |
| $50,000 to $74,999 | 116 | 13.3% |
| $75,000 to $99,999 | 218 | 25.0% |
| $100,000 to $149,999 | 45 | 5.2% |
| $150,000 to $199,999 | 62 | 7.1% |
| $200,000+ | 0 | 0.0% |
Family Income by Famaliy Size in Water Valley
3-person families (228 | 26.1%) account for the highest median family income in Water Valley with $78,378 per family, while 2-person families (425 | 48.7%) have the highest median income of $31,788 per family member.
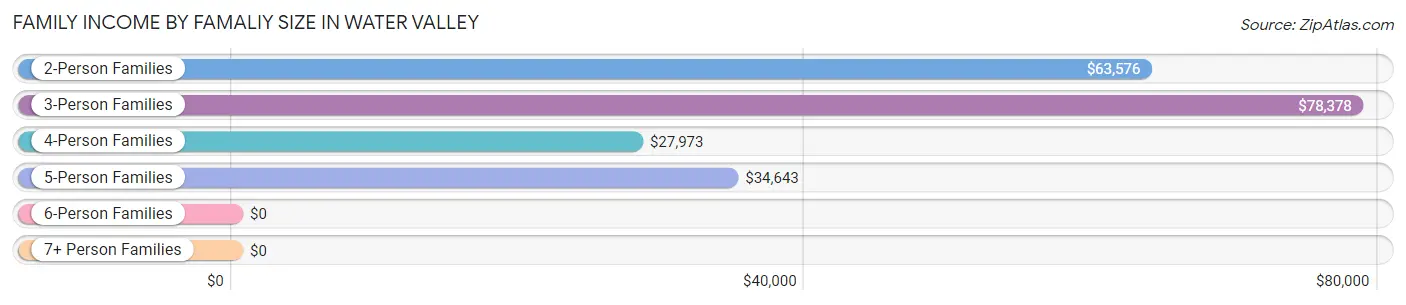
| Income Bracket | # Families | Median Income |
| 2-Person Families | 425 (48.7%) | $63,576 |
| 3-Person Families | 228 (26.1%) | $78,378 |
| 4-Person Families | 160 (18.3%) | $27,973 |
| 5-Person Families | 60 (6.9%) | $34,643 |
| 6-Person Families | 0 (0.0%) | $0 |
| 7+ Person Families | 0 (0.0%) | $0 |
| Total | 873 (100.0%) | $50,388 |
Family Income by Number of Earners in Water Valley
The median family income in Water Valley is $50,388, with families comprising 2 earners (292) having the highest median family income of $79,662, while families with 3+ earners (65) have the lowest median family income of $33,893, accounting for 33.5% and 7.4% of families, respectively.
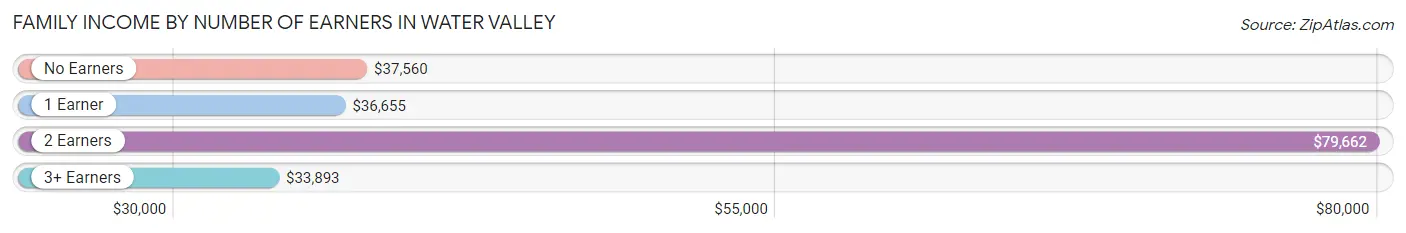
| Number of Earners | # Families | Median Income |
| No Earners | 157 (18.0%) | $37,560 |
| 1 Earner | 359 (41.1%) | $36,655 |
| 2 Earners | 292 (33.5%) | $79,662 |
| 3+ Earners | 65 (7.4%) | $33,893 |
| Total | 873 (100.0%) | $50,388 |
Household Income in Water Valley
Household Income Brackets in Water Valley
With 250 households falling in the category, the $75,000 to $99,999 income range is the most frequent in Water Valley, accounting for 19.8% of all households. In contrast, only 32 households (2.5%) fall into the $200,000+ income bracket, making it the least populous group.
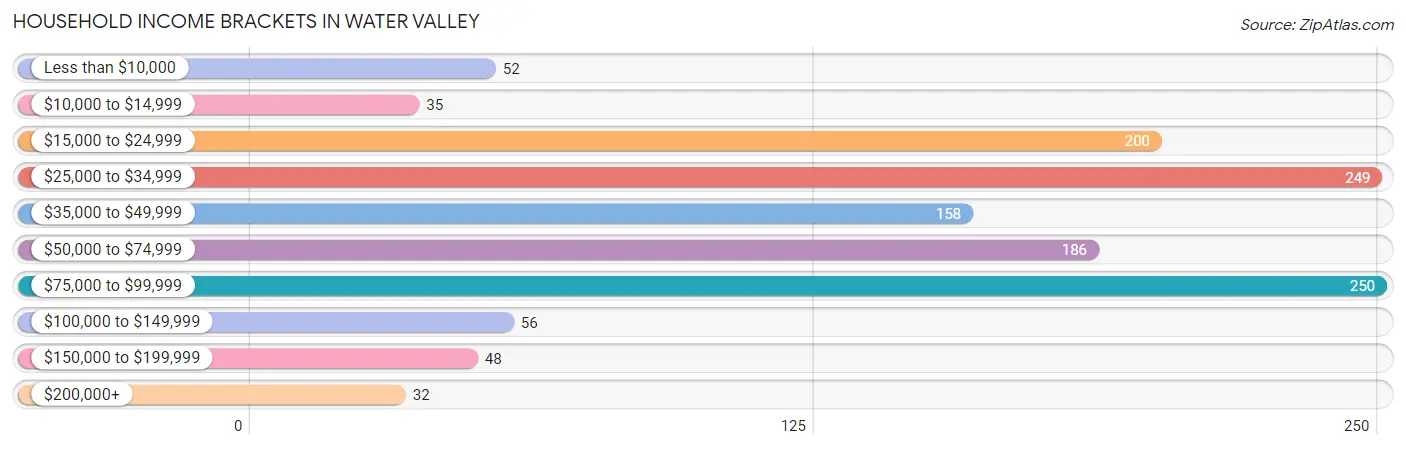
| Income Bracket | # Households | % Households |
| Less than $10,000 | 52 | 4.1% |
| $10,000 to $14,999 | 35 | 2.8% |
| $15,000 to $24,999 | 200 | 15.8% |
| $25,000 to $34,999 | 249 | 19.7% |
| $35,000 to $49,999 | 158 | 12.5% |
| $50,000 to $74,999 | 186 | 14.7% |
| $75,000 to $99,999 | 250 | 19.8% |
| $100,000 to $149,999 | 56 | 4.4% |
| $150,000 to $199,999 | 48 | 3.8% |
| $200,000+ | 32 | 2.5% |
Household Income by Householder Age in Water Valley
The median household income in Water Valley is $45,718, with the highest median household income of $63,029 found in the 25 to 44 years age bracket for the primary householder. A total of 576 households (45.6%) fall into this category. Meanwhile, the 15 to 24 years age bracket for the primary householder has the lowest median household income of $0, with 24 households (1.9%) in this group.
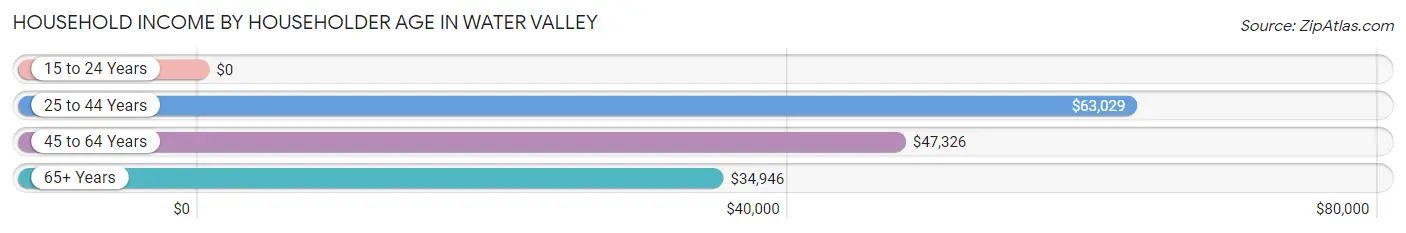
| Income Bracket | # Households | Median Income |
| 15 to 24 Years | 24 (1.9%) | $0 |
| 25 to 44 Years | 576 (45.6%) | $63,029 |
| 45 to 64 Years | 271 (21.5%) | $47,326 |
| 65+ Years | 392 (31.0%) | $34,946 |
| Total | 1,263 (100.0%) | $45,718 |
Poverty in Water Valley
Income Below Poverty by Sex and Age in Water Valley
With 26.4% poverty level for males and 28.1% for females among the residents of Water Valley, under 5 year old males and 16 and 17 year old females are the most vulnerable to poverty, with 116 males (91.3%) and 18 females (58.1%) in their respective age groups living below the poverty level.
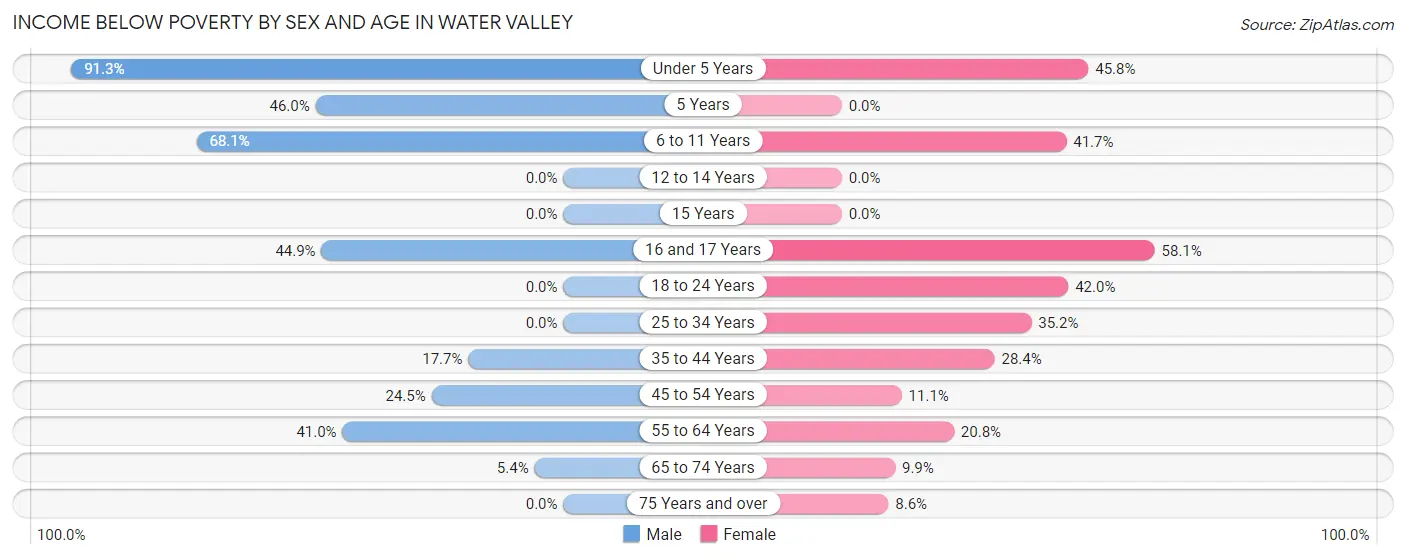
| Age Bracket | Male | Female |
| Under 5 Years | 116 (91.3%) | 70 (45.8%) |
| 5 Years | 23 (46.0%) | 0 (0.0%) |
| 6 to 11 Years | 79 (68.1%) | 50 (41.7%) |
| 12 to 14 Years | 0 (0.0%) | 0 (0.0%) |
| 15 Years | 0 (0.0%) | 0 (0.0%) |
| 16 and 17 Years | 44 (44.9%) | 18 (58.1%) |
| 18 to 24 Years | 0 (0.0%) | 87 (42.0%) |
| 25 to 34 Years | 0 (0.0%) | 115 (35.2%) |
| 35 to 44 Years | 42 (17.6%) | 72 (28.3%) |
| 45 to 54 Years | 23 (24.5%) | 13 (11.1%) |
| 55 to 64 Years | 41 (41.0%) | 41 (20.8%) |
| 65 to 74 Years | 9 (5.4%) | 25 (9.9%) |
| 75 Years and over | 0 (0.0%) | 7 (8.6%) |
| Total | 377 (26.4%) | 498 (28.1%) |
Income Above Poverty by Sex and Age in Water Valley
According to the poverty statistics in Water Valley, males aged 18 to 24 years and females aged 5 years are the age groups that are most secure financially, with 100.0% of males and 100.0% of females in these age groups living above the poverty line.
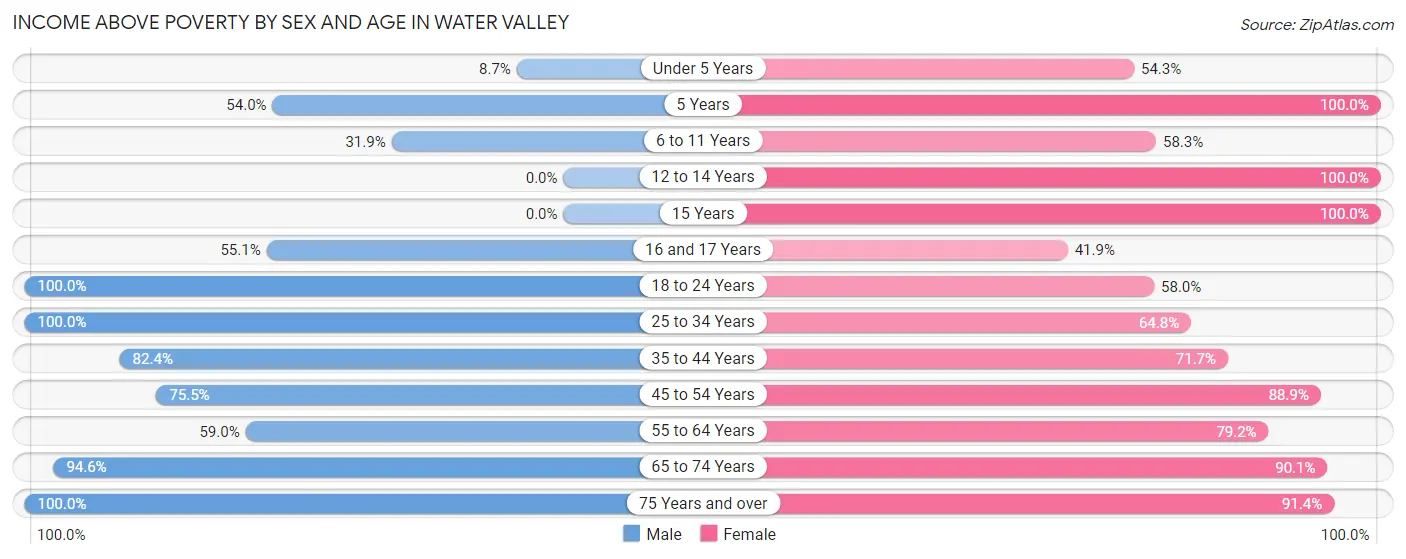
| Age Bracket | Male | Female |
| Under 5 Years | 11 (8.7%) | 83 (54.2%) |
| 5 Years | 27 (54.0%) | 4 (100.0%) |
| 6 to 11 Years | 37 (31.9%) | 70 (58.3%) |
| 12 to 14 Years | 0 (0.0%) | 20 (100.0%) |
| 15 Years | 0 (0.0%) | 11 (100.0%) |
| 16 and 17 Years | 54 (55.1%) | 13 (41.9%) |
| 18 to 24 Years | 121 (100.0%) | 120 (58.0%) |
| 25 to 34 Years | 246 (100.0%) | 212 (64.8%) |
| 35 to 44 Years | 196 (82.4%) | 182 (71.7%) |
| 45 to 54 Years | 71 (75.5%) | 104 (88.9%) |
| 55 to 64 Years | 59 (59.0%) | 156 (79.2%) |
| 65 to 74 Years | 159 (94.6%) | 228 (90.1%) |
| 75 Years and over | 70 (100.0%) | 74 (91.4%) |
| Total | 1,051 (73.6%) | 1,277 (71.9%) |
Income Below Poverty Among Married-Couple Families in Water Valley
The poverty statistics for married-couple families in Water Valley show that 3.6% or 17 of the total 468 families live below the poverty line. Families with 1 or 2 children have the highest poverty rate of 6.8%, comprising of 8 families. On the other hand, families with no children have the lowest poverty rate of 2.6%, which includes 9 families.
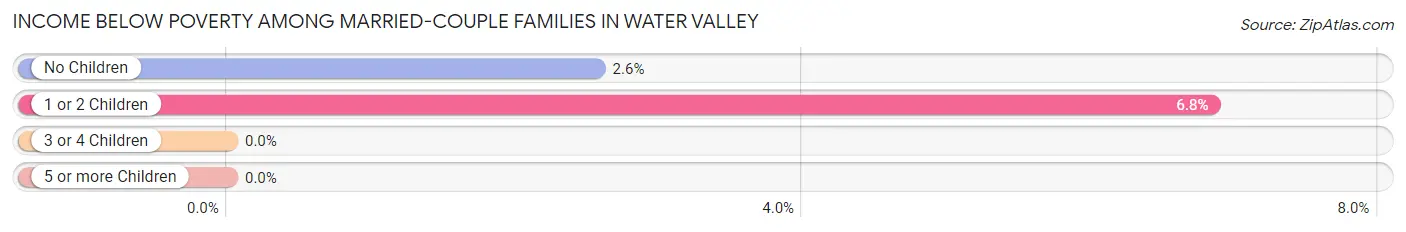
| Children | Above Poverty | Below Poverty |
| No Children | 342 (97.4%) | 9 (2.6%) |
| 1 or 2 Children | 109 (93.2%) | 8 (6.8%) |
| 3 or 4 Children | 0 (0.0%) | 0 (0.0%) |
| 5 or more Children | 0 (0.0%) | 0 (0.0%) |
| Total | 451 (96.4%) | 17 (3.6%) |
Income Below Poverty Among Single-Parent Households in Water Valley
According to the poverty data in Water Valley, 26.0% or 19 single-father households and 48.5% or 161 single-mother households are living below the poverty line. Among single-father households, those with 1 or 2 children have the highest poverty rate, with 19 households (95.0%) experiencing poverty. Likewise, among single-mother households, those with 3 or 4 children have the highest poverty rate, with 52 households (100.0%) falling below the poverty line.
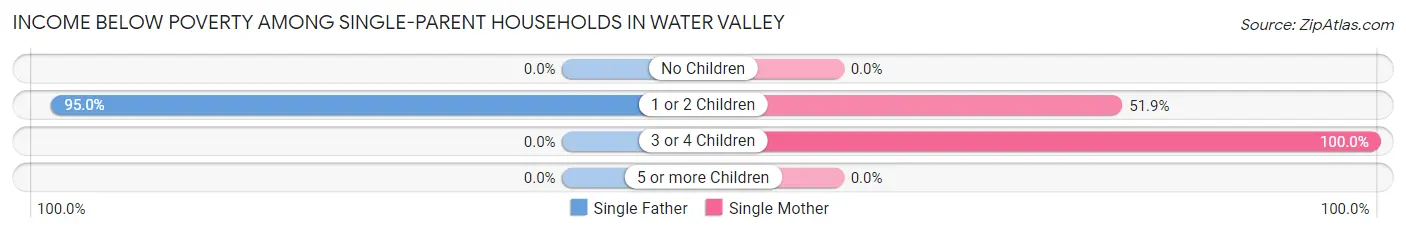
| Children | Single Father | Single Mother |
| No Children | 0 (0.0%) | 0 (0.0%) |
| 1 or 2 Children | 19 (95.0%) | 109 (51.9%) |
| 3 or 4 Children | 0 (0.0%) | 52 (100.0%) |
| 5 or more Children | 0 (0.0%) | 0 (0.0%) |
| Total | 19 (26.0%) | 161 (48.5%) |
Income Below Poverty Among Married-Couple vs Single-Parent Households in Water Valley
The poverty data for Water Valley shows that 17 of the married-couple family households (3.6%) and 180 of the single-parent households (44.4%) are living below the poverty level. Within the married-couple family households, those with 1 or 2 children have the highest poverty rate, with 8 households (6.8%) falling below the poverty line. Among the single-parent households, those with 3 or 4 children have the highest poverty rate, with 52 household (100.0%) living below poverty.
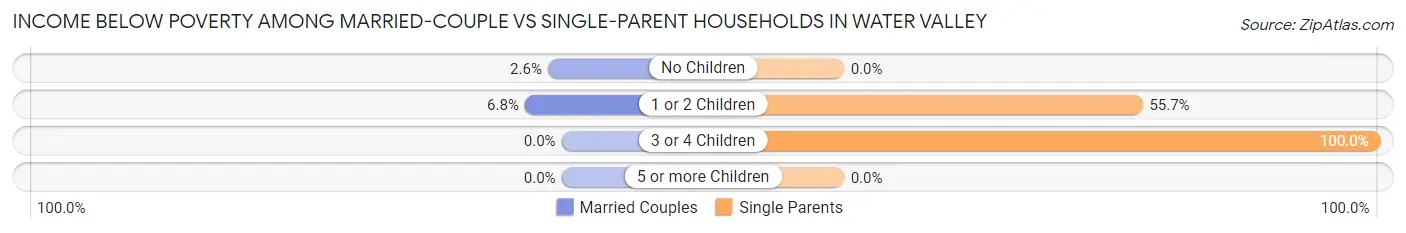
| Children | Married-Couple Families | Single-Parent Households |
| No Children | 9 (2.6%) | 0 (0.0%) |
| 1 or 2 Children | 8 (6.8%) | 128 (55.6%) |
| 3 or 4 Children | 0 (0.0%) | 52 (100.0%) |
| 5 or more Children | 0 (0.0%) | 0 (0.0%) |
| Total | 17 (3.6%) | 180 (44.4%) |
Race in Water Valley
The most populous races in Water Valley are White / Caucasian (1,705 | 50.4%), Black / African American (1,640 | 48.5%), and Hispanic or Latino (56 | 1.7%).
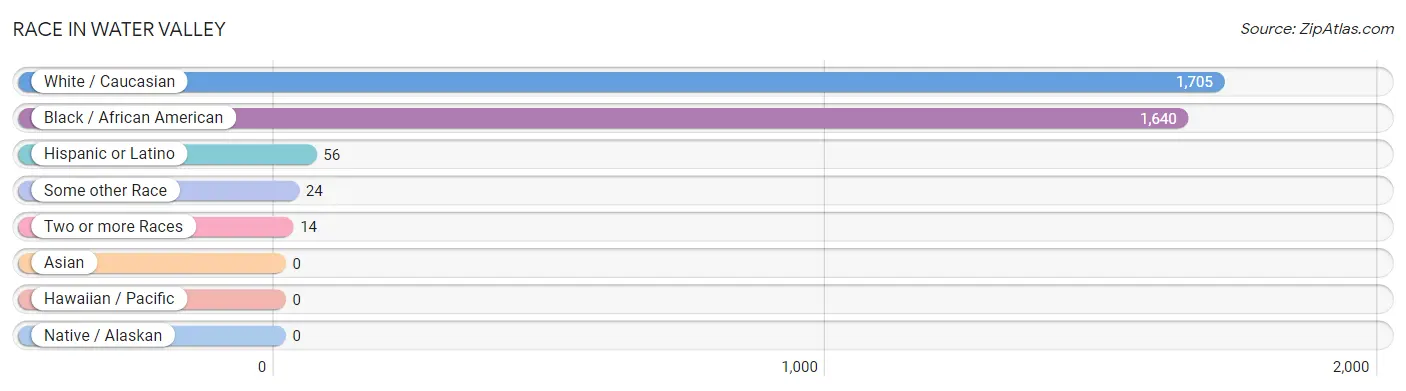
| Race | # Population | % Population |
| Asian | 0 | 0.0% |
| Black / African American | 1,640 | 48.5% |
| Hawaiian / Pacific | 0 | 0.0% |
| Hispanic or Latino | 56 | 1.7% |
| Native / Alaskan | 0 | 0.0% |
| White / Caucasian | 1,705 | 50.4% |
| Two or more Races | 14 | 0.4% |
| Some other Race | 24 | 0.7% |
| Total | 3,383 | 100.0% |
Ancestry in Water Valley
The most populous ancestries reported in Water Valley are German (179 | 5.3%), American (165 | 4.9%), English (110 | 3.3%), Irish (67 | 2.0%), and Arab (45 | 1.3%), together accounting for 16.7% of all Water Valley residents.
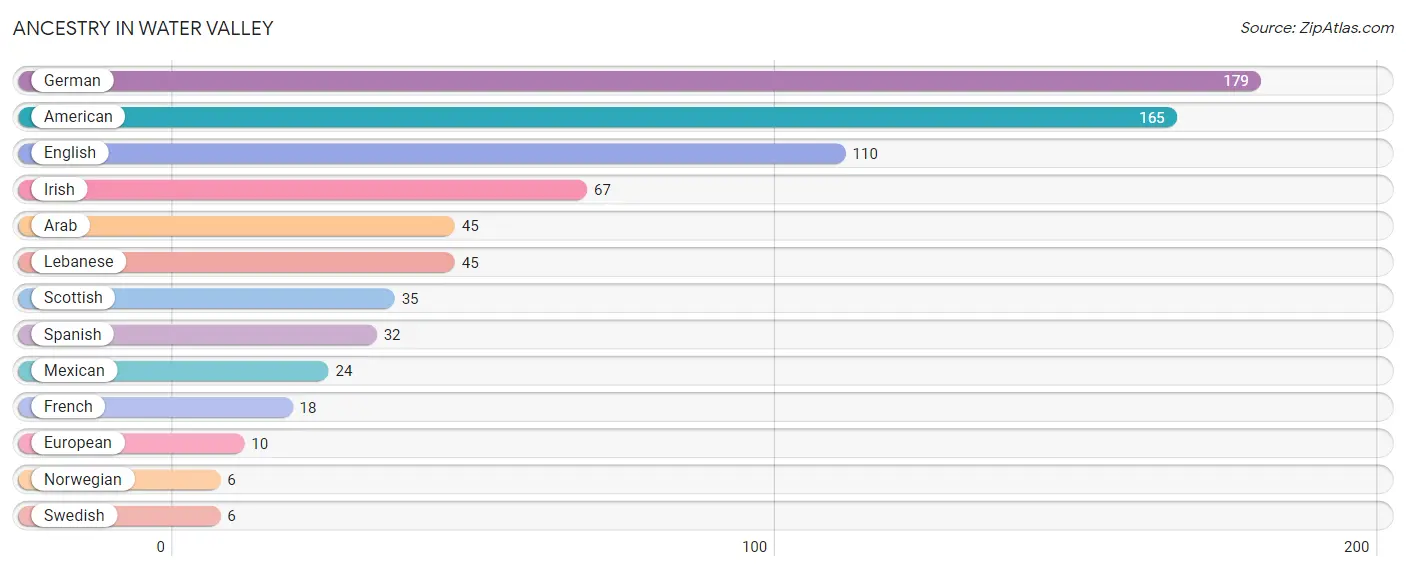
| Ancestry | # Population | % Population |
| American | 165 | 4.9% |
| Arab | 45 | 1.3% |
| English | 110 | 3.3% |
| European | 10 | 0.3% |
| French | 18 | 0.5% |
| German | 179 | 5.3% |
| Irish | 67 | 2.0% |
| Lebanese | 45 | 1.3% |
| Mexican | 24 | 0.7% |
| Norwegian | 6 | 0.2% |
| Scottish | 35 | 1.0% |
| Spanish | 32 | 0.9% |
| Swedish | 6 | 0.2% | View All 13 Rows |
Immigrants in Water Valley

| Immigration Origin | # Population | % Population | View All 0 Rows |
Sex and Age in Water Valley
Sex and Age in Water Valley
The most populous age groups in Water Valley are 25 to 29 Years (201 | 13.6%) for men and 25 to 29 Years (244 | 12.8%) for women.
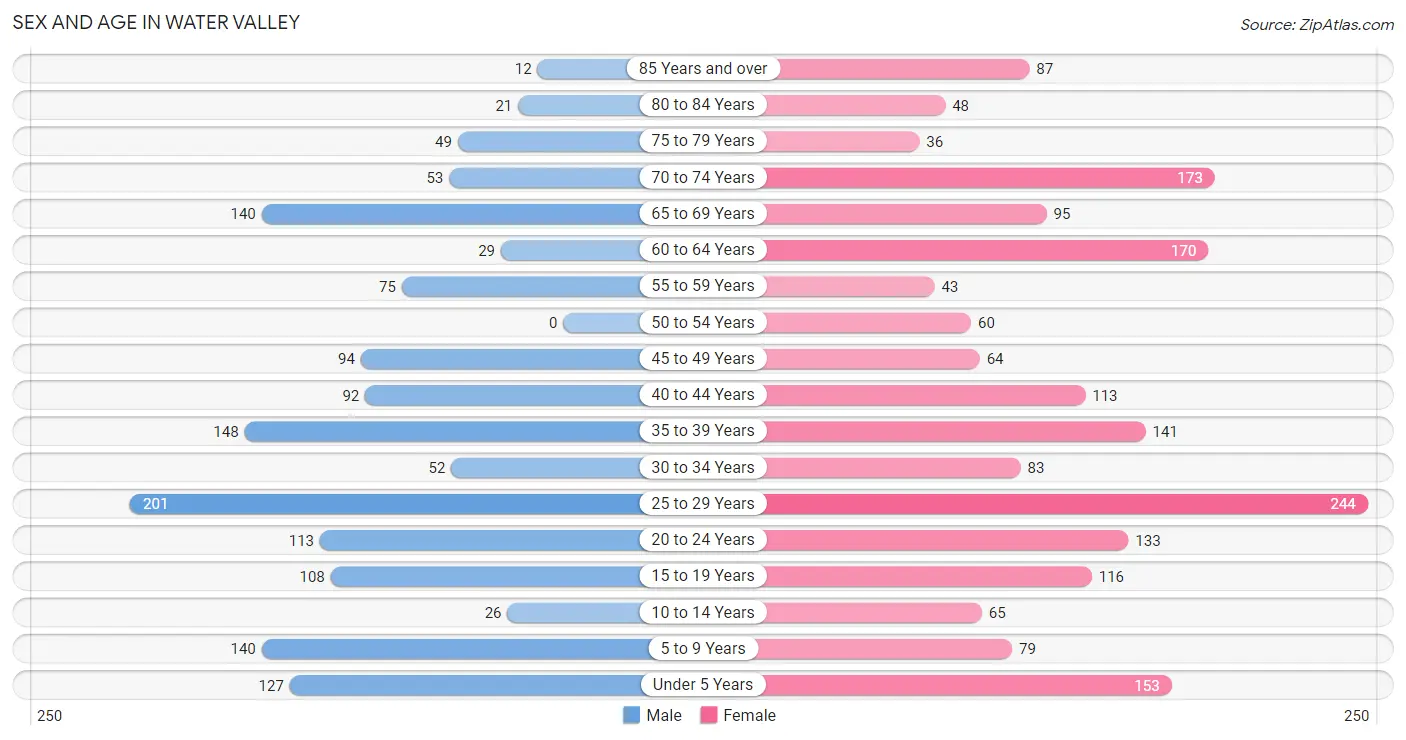
| Age Bracket | Male | Female |
| Under 5 Years | 127 (8.6%) | 153 (8.0%) |
| 5 to 9 Years | 140 (9.5%) | 79 (4.2%) |
| 10 to 14 Years | 26 (1.8%) | 65 (3.4%) |
| 15 to 19 Years | 108 (7.3%) | 116 (6.1%) |
| 20 to 24 Years | 113 (7.6%) | 133 (7.0%) |
| 25 to 29 Years | 201 (13.6%) | 244 (12.8%) |
| 30 to 34 Years | 52 (3.5%) | 83 (4.4%) |
| 35 to 39 Years | 148 (10.0%) | 141 (7.4%) |
| 40 to 44 Years | 92 (6.2%) | 113 (5.9%) |
| 45 to 49 Years | 94 (6.4%) | 64 (3.4%) |
| 50 to 54 Years | 0 (0.0%) | 60 (3.2%) |
| 55 to 59 Years | 75 (5.1%) | 43 (2.3%) |
| 60 to 64 Years | 29 (2.0%) | 170 (8.9%) |
| 65 to 69 Years | 140 (9.5%) | 95 (5.0%) |
| 70 to 74 Years | 53 (3.6%) | 173 (9.1%) |
| 75 to 79 Years | 49 (3.3%) | 36 (1.9%) |
| 80 to 84 Years | 21 (1.4%) | 48 (2.5%) |
| 85 Years and over | 12 (0.8%) | 87 (4.6%) |
| Total | 1,480 (100.0%) | 1,903 (100.0%) |
Families and Households in Water Valley
Median Family Size in Water Valley
The median family size in Water Valley is 2.95 persons per family, with single female/mother families (332 | 38.0%) accounting for the largest median family size of 3.5 persons per family. On the other hand, single male/father families (73 | 8.4%) represent the smallest median family size with 2.56 persons per family.
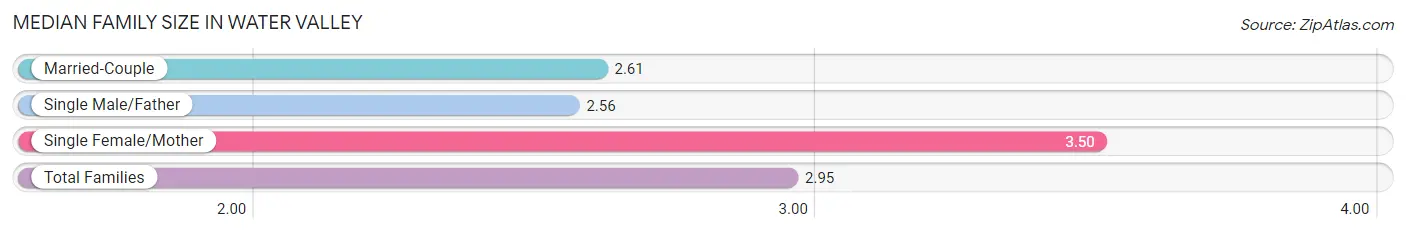
| Family Type | # Families | Family Size |
| Married-Couple | 468 (53.6%) | 2.61 |
| Single Male/Father | 73 (8.4%) | 2.56 |
| Single Female/Mother | 332 (38.0%) | 3.50 |
| Total Families | 873 (100.0%) | 2.95 |
Median Household Size in Water Valley
The median household size in Water Valley is 2.54 persons per household, with single female/mother households (332 | 26.3%) accounting for the largest median household size of 3.71 persons per household. non-family households (390 | 30.9%) represent the smallest median household size with 1.34 persons per household.
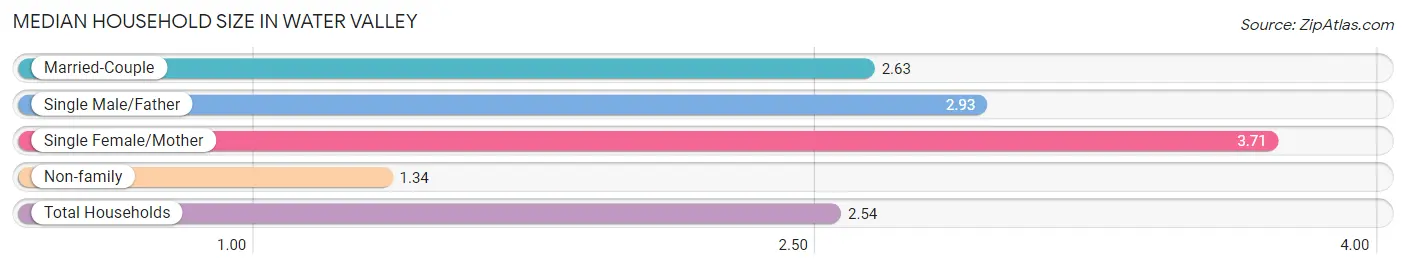
| Household Type | # Households | Household Size |
| Married-Couple | 468 (37.0%) | 2.63 |
| Single Male/Father | 73 (5.8%) | 2.93 |
| Single Female/Mother | 332 (26.3%) | 3.71 |
| Non-family | 390 (30.9%) | 1.34 |
| Total Households | 1,263 (100.0%) | 2.54 |
Household Size by Marriage Status in Water Valley
Out of a total of 1,263 households in Water Valley, 873 (69.1%) are family households, while 390 (30.9%) are nonfamily households. The most numerous type of family households are 2-person households, comprising 421, and the most common type of nonfamily households are 1-person households, comprising 301.
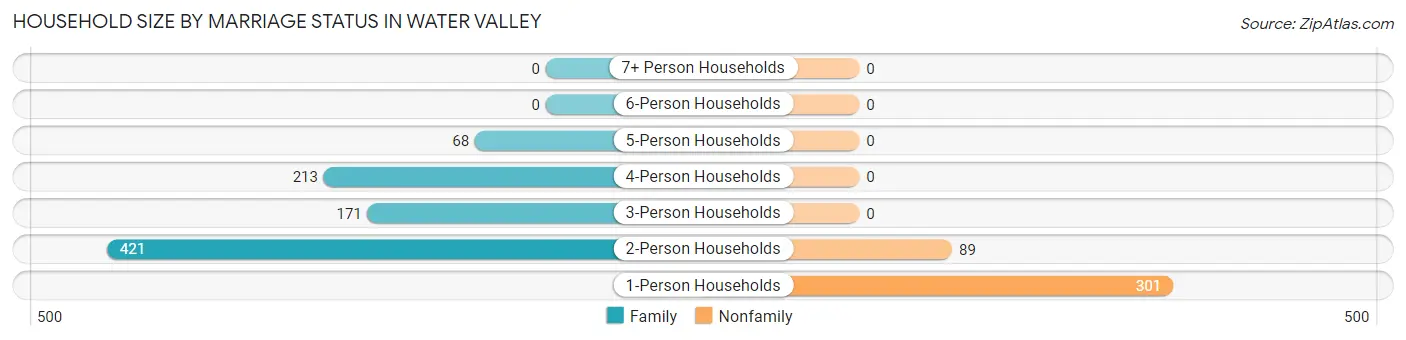
| Household Size | Family Households | Nonfamily Households |
| 1-Person Households | - | 301 (23.8%) |
| 2-Person Households | 421 (33.3%) | 89 (7.0%) |
| 3-Person Households | 171 (13.5%) | 0 (0.0%) |
| 4-Person Households | 213 (16.9%) | 0 (0.0%) |
| 5-Person Households | 68 (5.4%) | 0 (0.0%) |
| 6-Person Households | 0 (0.0%) | 0 (0.0%) |
| 7+ Person Households | 0 (0.0%) | 0 (0.0%) |
| Total | 873 (69.1%) | 390 (30.9%) |
Female Fertility in Water Valley
Fertility by Age in Water Valley
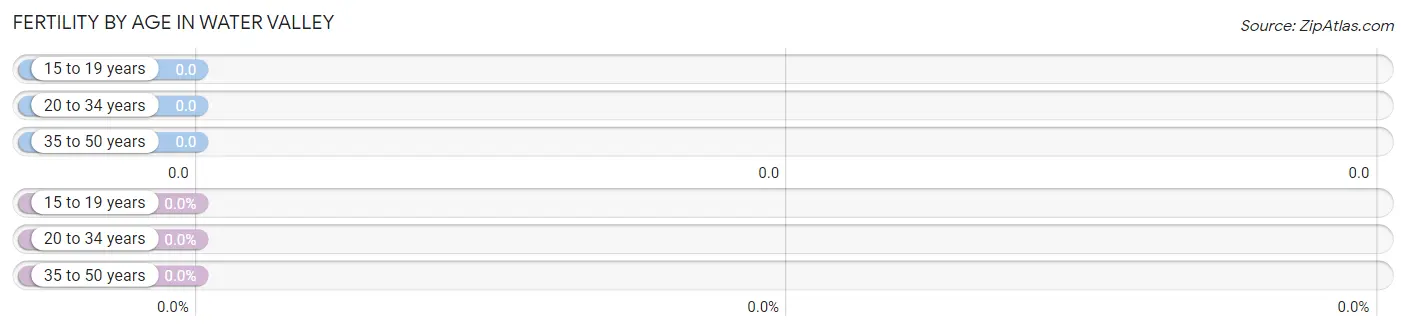
| Age Bracket | Women with Births | Births / 1,000 Women |
| 15 to 19 years | 0 (0.0%) | 0.0 |
| 20 to 34 years | 0 (0.0%) | 0.0 |
| 35 to 50 years | 0 (0.0%) | 0.0 |
| Total | 0 (0.0%) | 0.0 |
Fertility by Age by Marriage Status in Water Valley
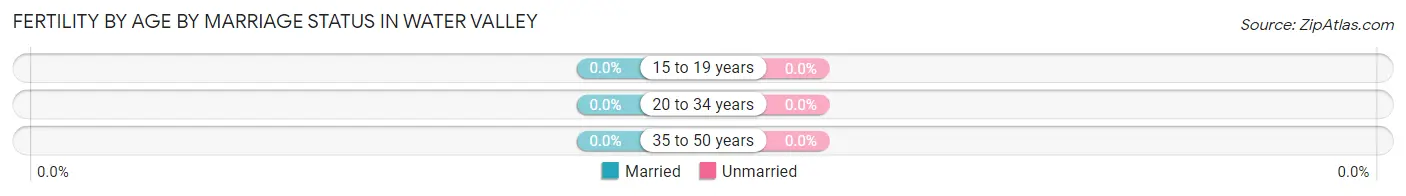
| Age Bracket | Married | Unmarried |
| 15 to 19 years | 0 (0.0%) | 0 (0.0%) |
| 20 to 34 years | 0 (0.0%) | 0 (0.0%) |
| 35 to 50 years | 0 (0.0%) | 0 (0.0%) |
| Total | 0 (0.0%) | 0 (0.0%) |
Fertility by Education in Water Valley
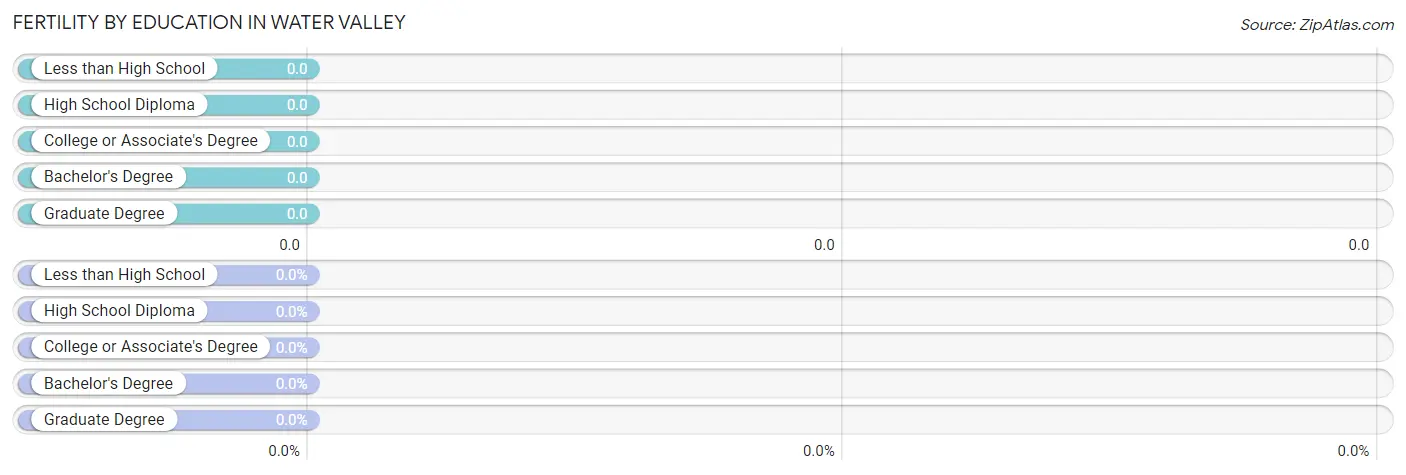
| Educational Attainment | Women with Births | Births / 1,000 Women |
| Less than High School | 0 (0.0%) | 0.0 |
| High School Diploma | 0 (0.0%) | 0.0 |
| College or Associate's Degree | 0 (0.0%) | 0.0 |
| Bachelor's Degree | 0 (0.0%) | 0.0 |
| Graduate Degree | 0 (0.0%) | 0.0 |
| Total | 0 (0.0%) | 0.0 |
Fertility by Education by Marriage Status in Water Valley
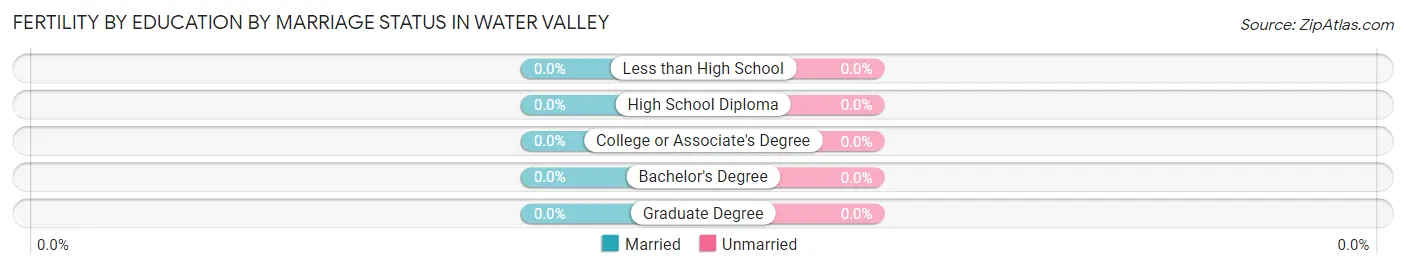
| Educational Attainment | Married | Unmarried |
| Less than High School | 0 (0.0%) | 0 (0.0%) |
| High School Diploma | 0 (0.0%) | 0 (0.0%) |
| College or Associate's Degree | 0 (0.0%) | 0 (0.0%) |
| Bachelor's Degree | 0 (0.0%) | 0 (0.0%) |
| Graduate Degree | 0 (0.0%) | 0 (0.0%) |
| Total | 0 (0.0%) | 0 (0.0%) |
Employment Characteristics in Water Valley
Employment by Class of Employer in Water Valley
Among the 1,368 employed individuals in Water Valley, private company employees (1,002 | 73.3%), state government employees (177 | 12.9%), and self-employed (not incorporated) (98 | 7.2%) make up the most common classes of employment.
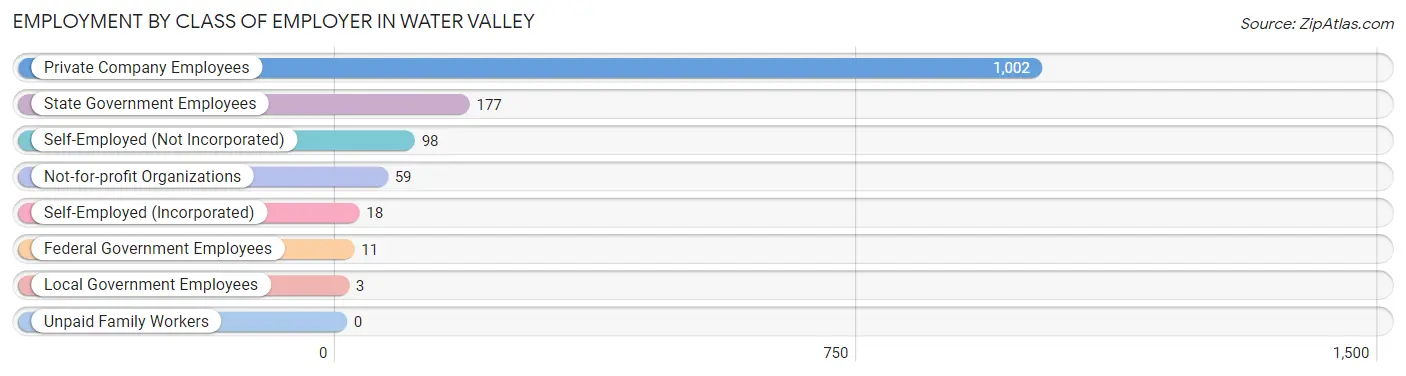
| Employer Class | # Employees | % Employees |
| Private Company Employees | 1,002 | 73.3% |
| Self-Employed (Incorporated) | 18 | 1.3% |
| Self-Employed (Not Incorporated) | 98 | 7.2% |
| Not-for-profit Organizations | 59 | 4.3% |
| Local Government Employees | 3 | 0.2% |
| State Government Employees | 177 | 12.9% |
| Federal Government Employees | 11 | 0.8% |
| Unpaid Family Workers | 0 | 0.0% |
| Total | 1,368 | 100.0% |
Employment Status by Age in Water Valley
According to the labor force statistics for Water Valley, out of the total population over 16 years of age (2,782), 52.0% or 1,447 individuals are in the labor force, with 4.7% or 68 of them unemployed. The age group with the highest labor force participation rate is 30 to 34 years, with 94.1% or 127 individuals in the labor force. Within the labor force, the 16 to 19 years age range has the highest percentage of unemployed individuals, with 25.0% or 16 of them being unemployed.
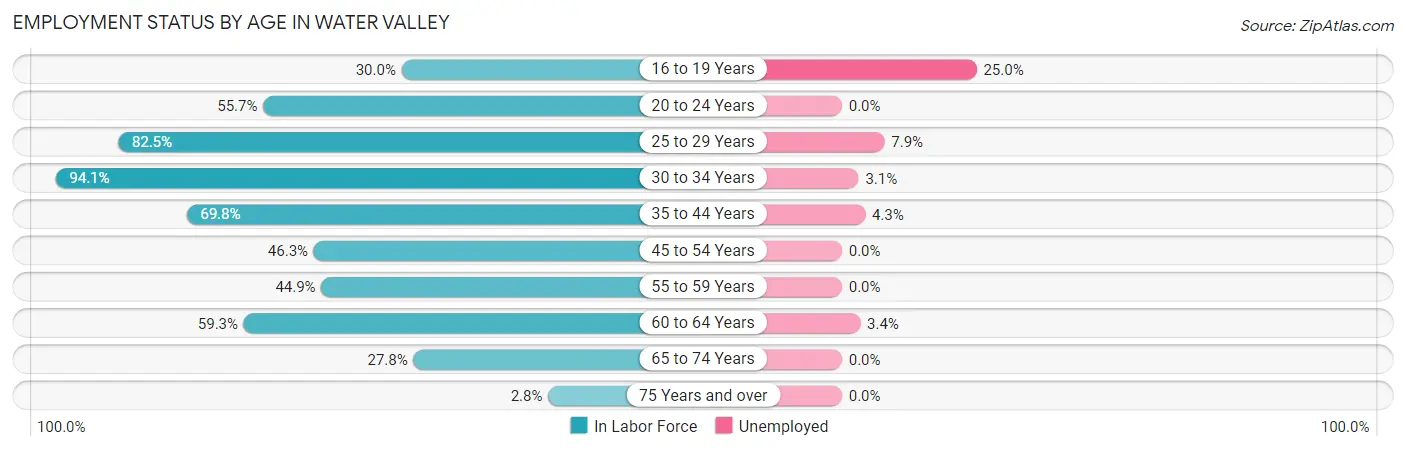
| Age Bracket | In Labor Force | Unemployed |
| 16 to 19 Years | 64 (30.0%) | 16 (25.0%) |
| 20 to 24 Years | 137 (55.7%) | 0 (0.0%) |
| 25 to 29 Years | 367 (82.5%) | 29 (7.9%) |
| 30 to 34 Years | 127 (94.1%) | 4 (3.1%) |
| 35 to 44 Years | 345 (69.8%) | 15 (4.3%) |
| 45 to 54 Years | 101 (46.3%) | 0 (0.0%) |
| 55 to 59 Years | 53 (44.9%) | 0 (0.0%) |
| 60 to 64 Years | 118 (59.3%) | 4 (3.4%) |
| 65 to 74 Years | 128 (27.8%) | 0 (0.0%) |
| 75 Years and over | 7 (2.8%) | 0 (0.0%) |
| Total | 1,447 (52.0%) | 68 (4.7%) |
Employment Status by Educational Attainment in Water Valley
According to labor force statistics for Water Valley, 69.0% of individuals (1,110) out of the total population between 25 and 64 years of age (1,609) are in the labor force, with 4.7% or 52 of them being unemployed. The group with the highest labor force participation rate are those with the educational attainment of bachelor's degree or higher, with 93.5% or 186 individuals in the labor force. Within the labor force, individuals with less than high school education have the highest percentage of unemployment, with 15.2% or 15 of them being unemployed.
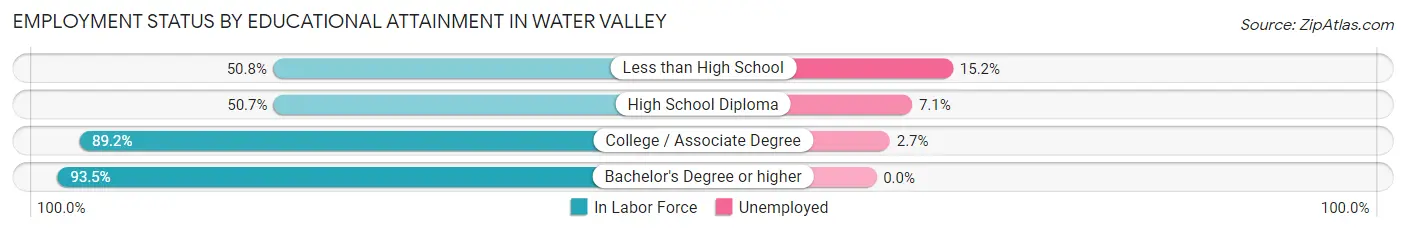
| Educational Attainment | In Labor Force | Unemployed |
| Less than High School | 99 (50.8%) | 30 (15.2%) |
| High School Diploma | 339 (50.7%) | 47 (7.1%) |
| College / Associate Degree | 487 (89.2%) | 15 (2.7%) |
| Bachelor's Degree or higher | 186 (93.5%) | 0 (0.0%) |
| Total | 1,110 (69.0%) | 76 (4.7%) |
Employment Occupations by Sex in Water Valley
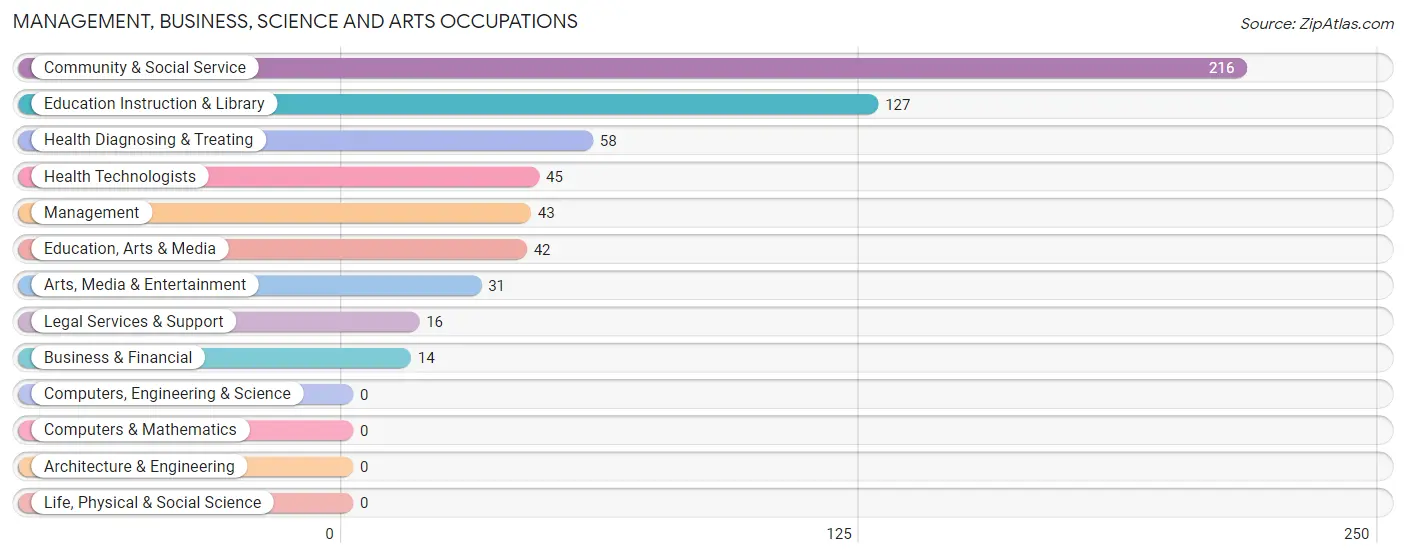
Management, Business, Science and Arts Occupations
The most common Management, Business, Science and Arts occupations in Water Valley are Community & Social Service (216 | 15.7%), Education Instruction & Library (127 | 9.2%), Health Diagnosing & Treating (58 | 4.2%), Health Technologists (45 | 3.3%), and Management (43 | 3.1%).
Management, Business, Science and Arts Occupations by Sex
Within the Management, Business, Science and Arts occupations in Water Valley, the most male-oriented occupations are Business & Financial (100.0%), Legal Services & Support (100.0%), and Health Technologists (100.0%), while the most female-oriented occupations are Education, Arts & Media (100.0%), Arts, Media & Entertainment (100.0%), and Community & Social Service (72.2%).
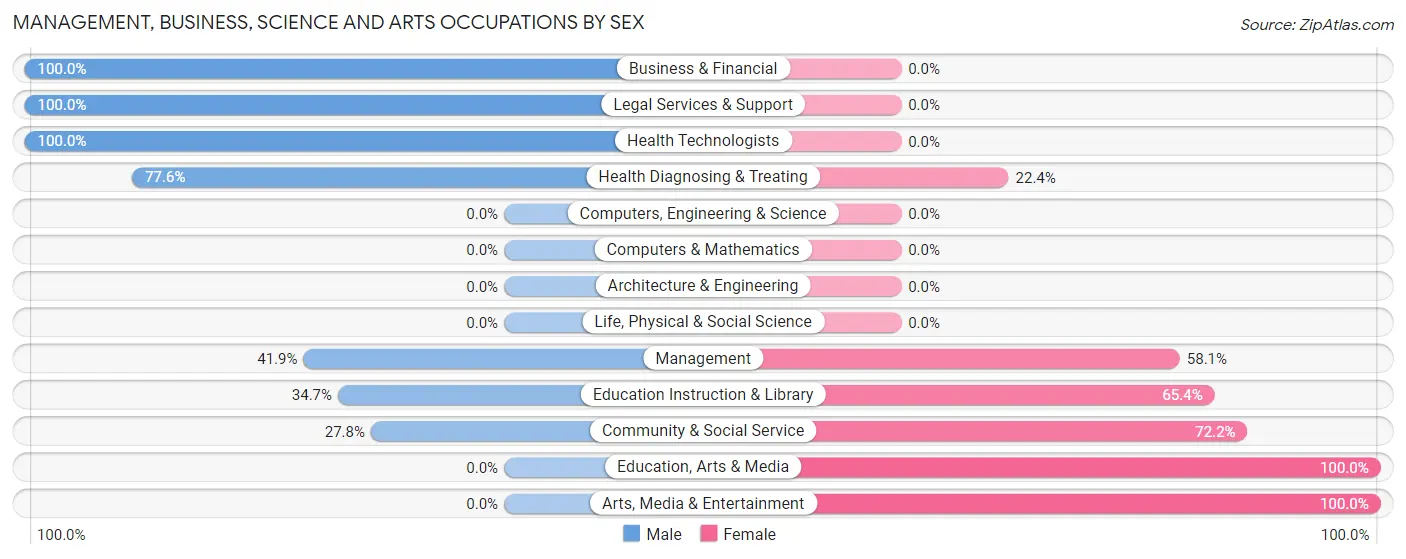
| Occupation | Male | Female |
| Management | 18 (41.9%) | 25 (58.1%) |
| Business & Financial | 14 (100.0%) | 0 (0.0%) |
| Computers, Engineering & Science | 0 (0.0%) | 0 (0.0%) |
| Computers & Mathematics | 0 (0.0%) | 0 (0.0%) |
| Architecture & Engineering | 0 (0.0%) | 0 (0.0%) |
| Life, Physical & Social Science | 0 (0.0%) | 0 (0.0%) |
| Community & Social Service | 60 (27.8%) | 156 (72.2%) |
| Education, Arts & Media | 0 (0.0%) | 42 (100.0%) |
| Legal Services & Support | 16 (100.0%) | 0 (0.0%) |
| Education Instruction & Library | 44 (34.6%) | 83 (65.3%) |
| Arts, Media & Entertainment | 0 (0.0%) | 31 (100.0%) |
| Health Diagnosing & Treating | 45 (77.6%) | 13 (22.4%) |
| Health Technologists | 45 (100.0%) | 0 (0.0%) |
| Total (Category) | 137 (41.4%) | 194 (58.6%) |
| Total (Overall) | 580 (42.1%) | 799 (57.9%) |
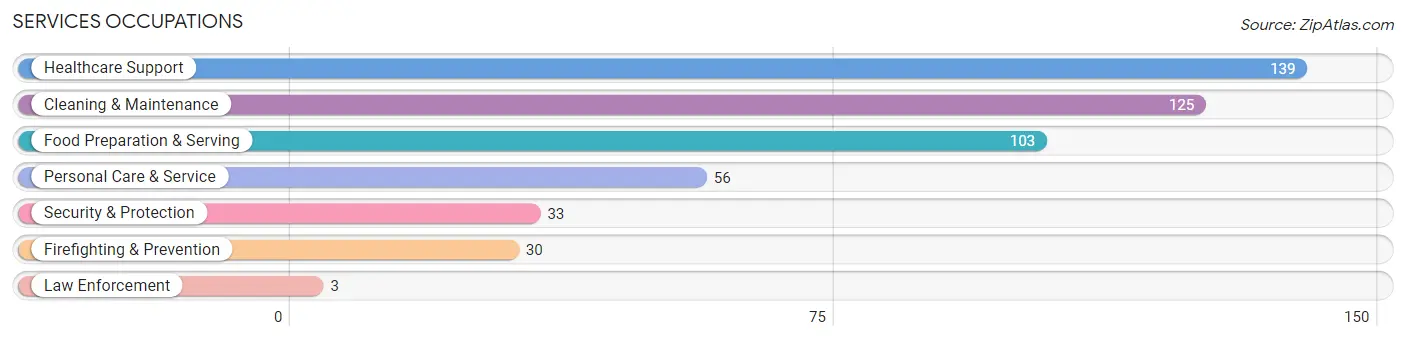
Services Occupations
The most common Services occupations in Water Valley are Healthcare Support (139 | 10.1%), Cleaning & Maintenance (125 | 9.1%), Food Preparation & Serving (103 | 7.5%), Personal Care & Service (56 | 4.1%), and Security & Protection (33 | 2.4%).
Services Occupations by Sex
Within the Services occupations in Water Valley, the most male-oriented occupations are Security & Protection (100.0%), Firefighting & Prevention (100.0%), and Law Enforcement (100.0%), while the most female-oriented occupations are Healthcare Support (100.0%), Personal Care & Service (100.0%), and Food Preparation & Serving (69.9%).
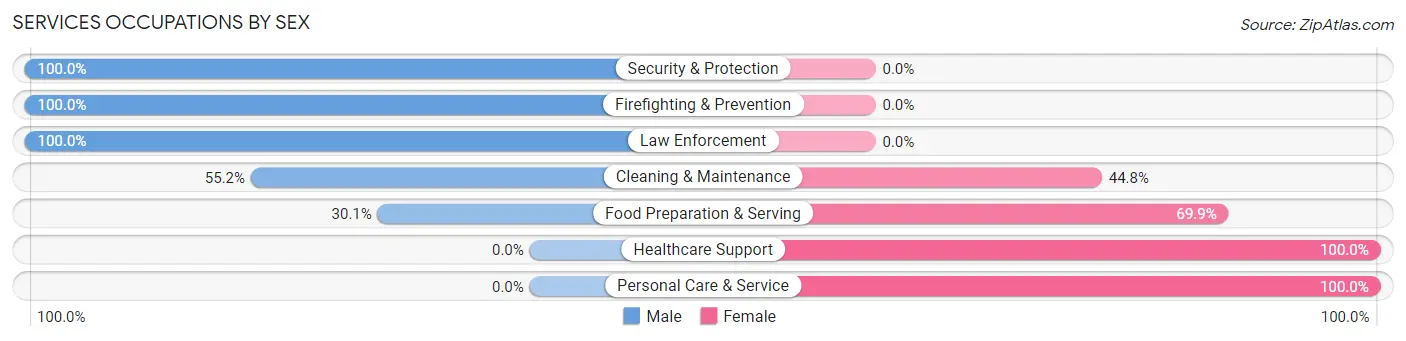
| Occupation | Male | Female |
| Healthcare Support | 0 (0.0%) | 139 (100.0%) |
| Security & Protection | 33 (100.0%) | 0 (0.0%) |
| Firefighting & Prevention | 30 (100.0%) | 0 (0.0%) |
| Law Enforcement | 3 (100.0%) | 0 (0.0%) |
| Food Preparation & Serving | 31 (30.1%) | 72 (69.9%) |
| Cleaning & Maintenance | 69 (55.2%) | 56 (44.8%) |
| Personal Care & Service | 0 (0.0%) | 56 (100.0%) |
| Total (Category) | 133 (29.2%) | 323 (70.8%) |
| Total (Overall) | 580 (42.1%) | 799 (57.9%) |
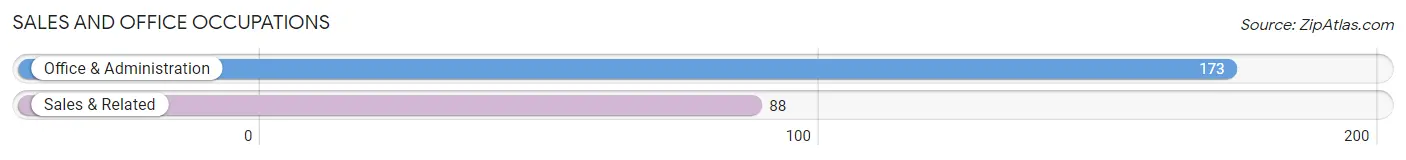
Sales and Office Occupations
The most common Sales and Office occupations in Water Valley are Office & Administration (173 | 12.6%), and Sales & Related (88 | 6.4%).
Sales and Office Occupations by Sex
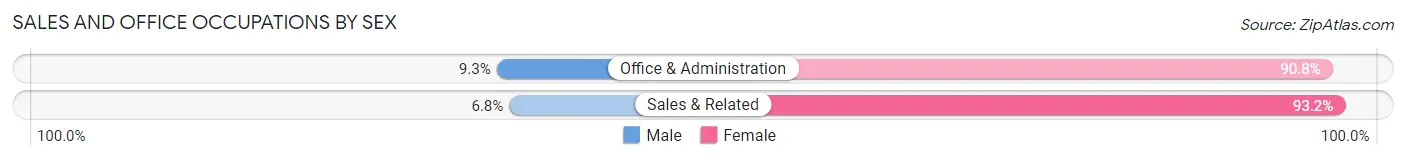
| Occupation | Male | Female |
| Sales & Related | 6 (6.8%) | 82 (93.2%) |
| Office & Administration | 16 (9.2%) | 157 (90.7%) |
| Total (Category) | 22 (8.4%) | 239 (91.6%) |
| Total (Overall) | 580 (42.1%) | 799 (57.9%) |
Natural Resources, Construction and Maintenance Occupations
The most common Natural Resources, Construction and Maintenance occupations in Water Valley are Construction & Extraction (49 | 3.5%), and Installation, Maintenance & Repair (10 | 0.7%).
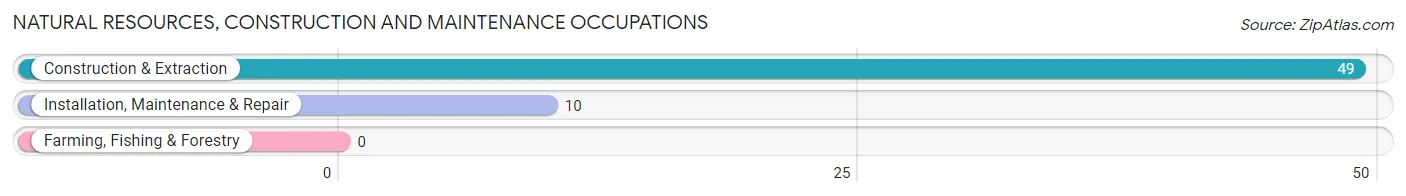
Natural Resources, Construction and Maintenance Occupations by Sex
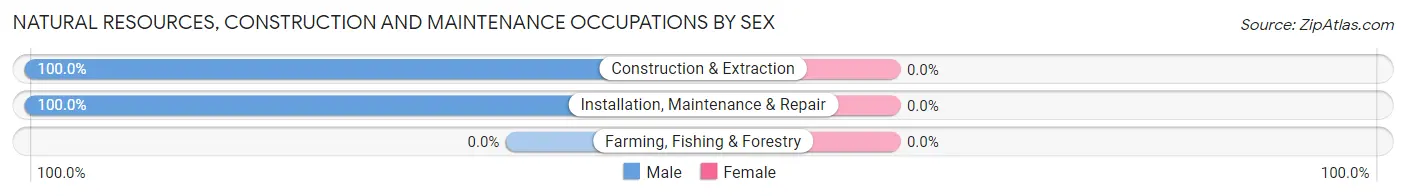
| Occupation | Male | Female |
| Farming, Fishing & Forestry | 0 (0.0%) | 0 (0.0%) |
| Construction & Extraction | 49 (100.0%) | 0 (0.0%) |
| Installation, Maintenance & Repair | 10 (100.0%) | 0 (0.0%) |
| Total (Category) | 59 (100.0%) | 0 (0.0%) |
| Total (Overall) | 580 (42.1%) | 799 (57.9%) |
Production, Transportation and Moving Occupations
The most common Production, Transportation and Moving occupations in Water Valley are Production (172 | 12.5%), Transportation (66 | 4.8%), and Material Moving (34 | 2.5%).
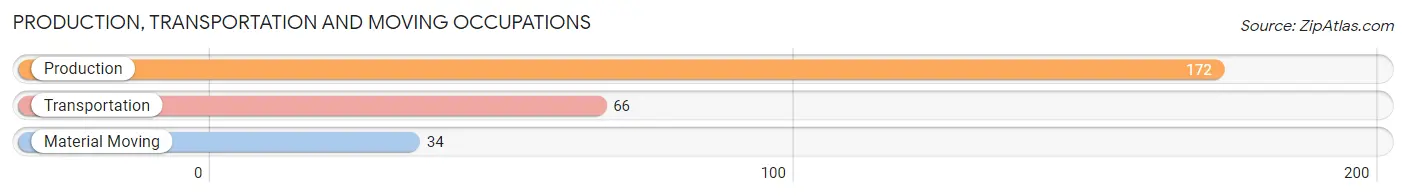
Production, Transportation and Moving Occupations by Sex
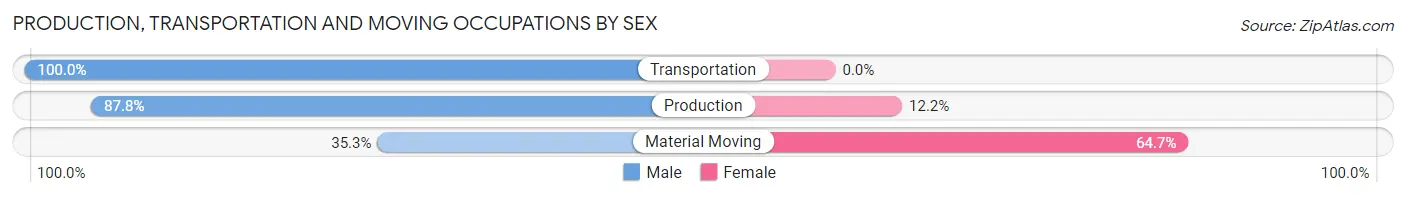
| Occupation | Male | Female |
| Production | 151 (87.8%) | 21 (12.2%) |
| Transportation | 66 (100.0%) | 0 (0.0%) |
| Material Moving | 12 (35.3%) | 22 (64.7%) |
| Total (Category) | 229 (84.2%) | 43 (15.8%) |
| Total (Overall) | 580 (42.1%) | 799 (57.9%) |
Employment Industries by Sex in Water Valley
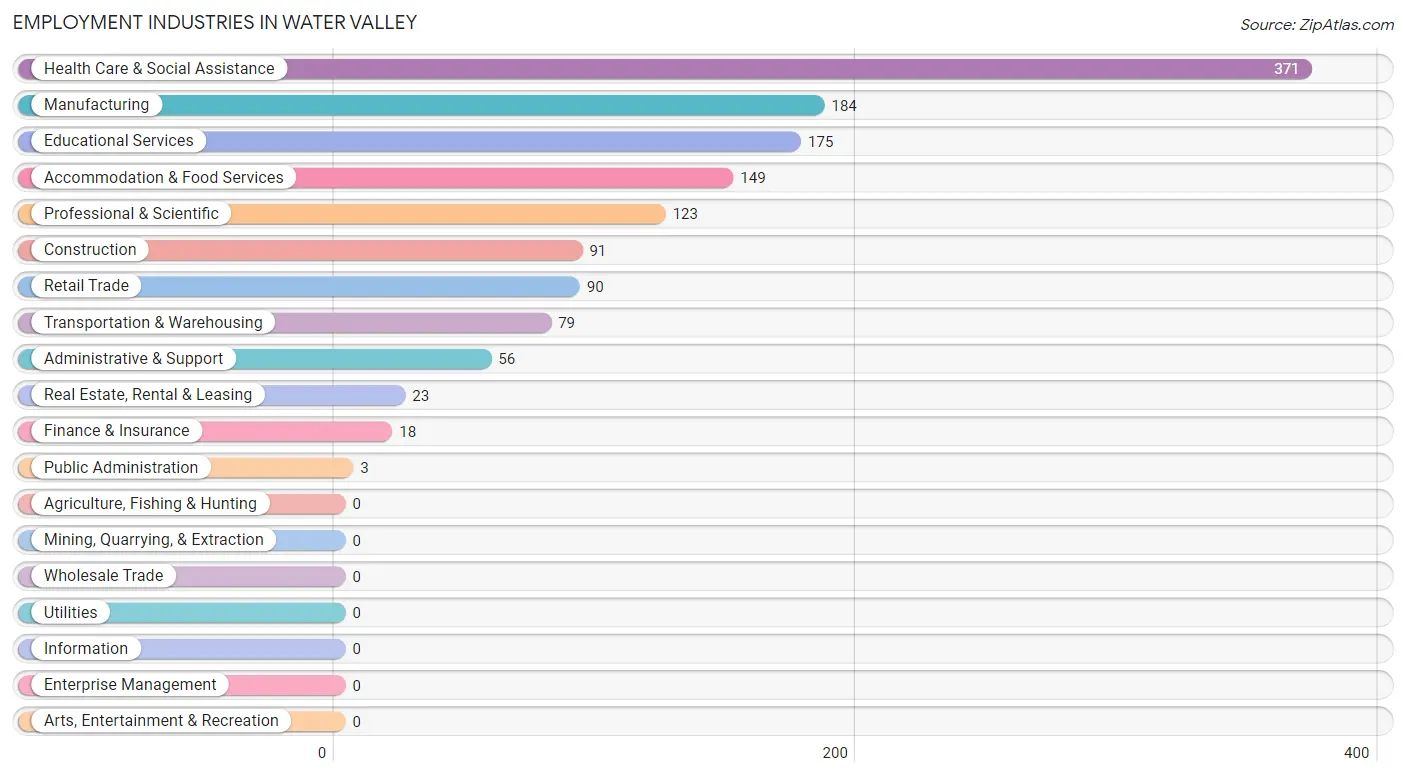
Employment Industries in Water Valley
The major employment industries in Water Valley include Health Care & Social Assistance (371 | 26.9%), Manufacturing (184 | 13.3%), Educational Services (175 | 12.7%), Accommodation & Food Services (149 | 10.8%), and Professional & Scientific (123 | 8.9%).
Employment Industries by Sex in Water Valley
The Water Valley industries that see more men than women are Public Administration (100.0%), Transportation & Warehousing (86.1%), and Administrative & Support (83.9%), whereas the industries that tend to have a higher number of women are Finance & Insurance (100.0%), Real Estate, Rental & Leasing (100.0%), and Retail Trade (82.2%).
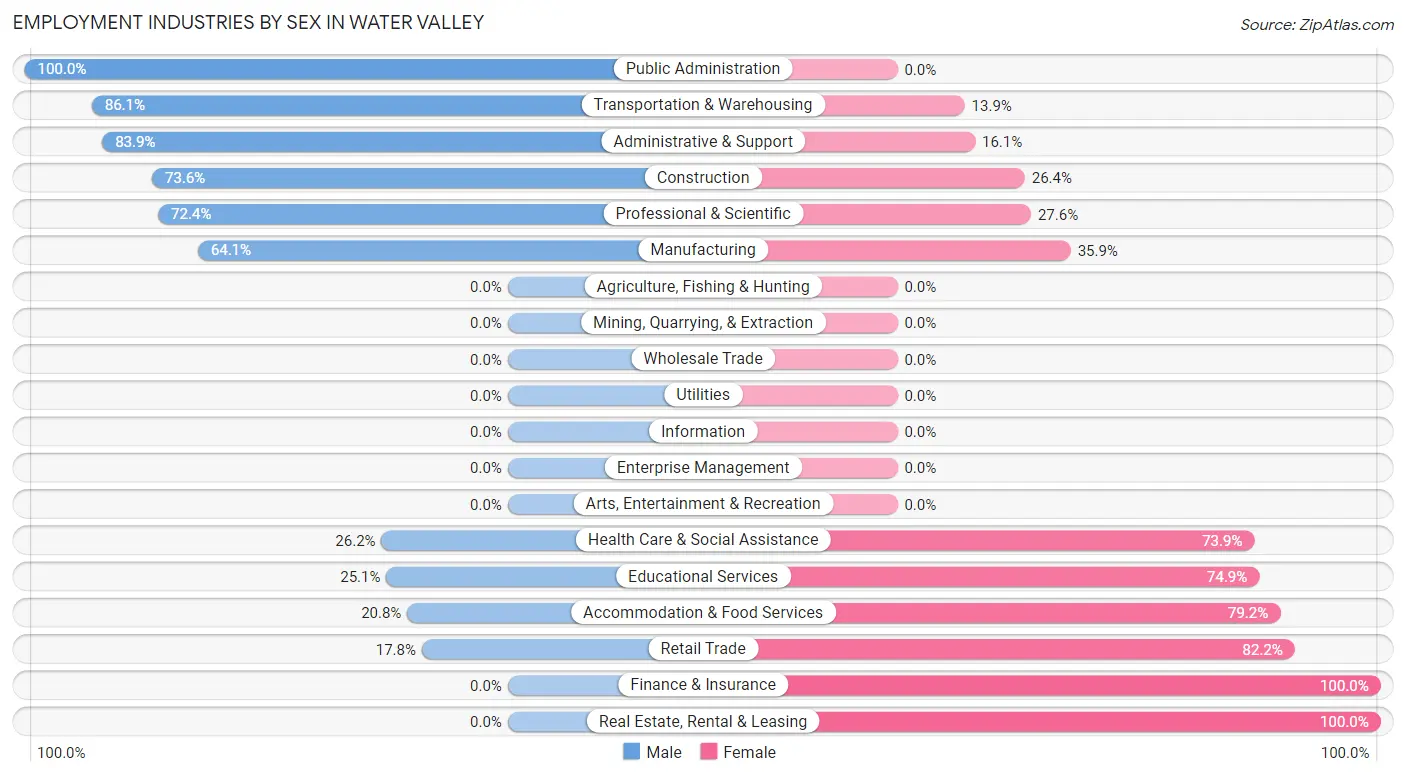
| Industry | Male | Female |
| Agriculture, Fishing & Hunting | 0 (0.0%) | 0 (0.0%) |
| Mining, Quarrying, & Extraction | 0 (0.0%) | 0 (0.0%) |
| Construction | 67 (73.6%) | 24 (26.4%) |
| Manufacturing | 118 (64.1%) | 66 (35.9%) |
| Wholesale Trade | 0 (0.0%) | 0 (0.0%) |
| Retail Trade | 16 (17.8%) | 74 (82.2%) |
| Transportation & Warehousing | 68 (86.1%) | 11 (13.9%) |
| Utilities | 0 (0.0%) | 0 (0.0%) |
| Information | 0 (0.0%) | 0 (0.0%) |
| Finance & Insurance | 0 (0.0%) | 18 (100.0%) |
| Real Estate, Rental & Leasing | 0 (0.0%) | 23 (100.0%) |
| Professional & Scientific | 89 (72.4%) | 34 (27.6%) |
| Enterprise Management | 0 (0.0%) | 0 (0.0%) |
| Administrative & Support | 47 (83.9%) | 9 (16.1%) |
| Educational Services | 44 (25.1%) | 131 (74.9%) |
| Health Care & Social Assistance | 97 (26.2%) | 274 (73.9%) |
| Arts, Entertainment & Recreation | 0 (0.0%) | 0 (0.0%) |
| Accommodation & Food Services | 31 (20.8%) | 118 (79.2%) |
| Public Administration | 3 (100.0%) | 0 (0.0%) |
| Total | 580 (42.1%) | 799 (57.9%) |
Education in Water Valley
School Enrollment in Water Valley
The most common levels of schooling among the 727 students in Water Valley are elementary school (225 | 30.9%), high school (191 | 26.3%), and college / undergraduate (179 | 24.6%).
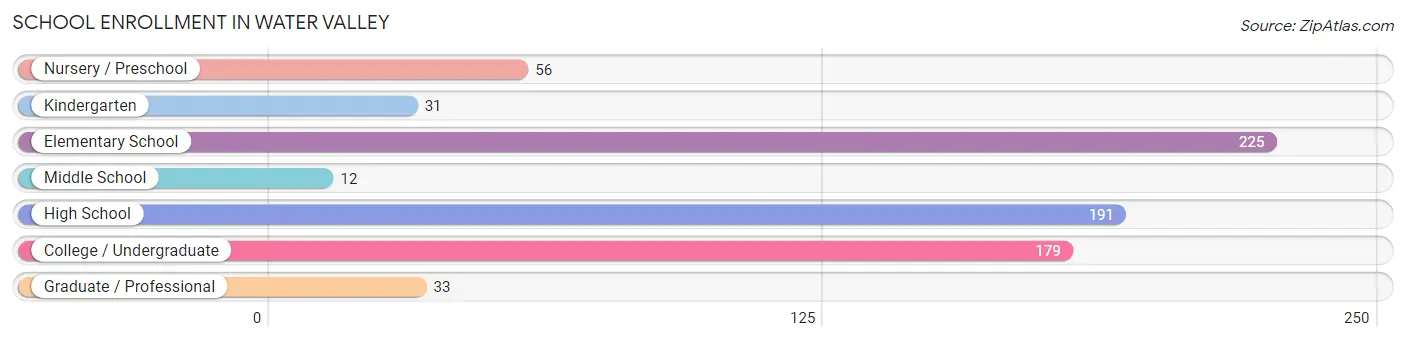
| School Level | # Students | % Students |
| Nursery / Preschool | 56 | 7.7% |
| Kindergarten | 31 | 4.3% |
| Elementary School | 225 | 30.9% |
| Middle School | 12 | 1.7% |
| High School | 191 | 26.3% |
| College / Undergraduate | 179 | 24.6% |
| Graduate / Professional | 33 | 4.5% |
| Total | 727 | 100.0% |
School Enrollment by Age by Funding Source in Water Valley
Out of a total of 727 students who are enrolled in schools in Water Valley, 23 (3.2%) attend a private institution, while the remaining 704 (96.8%) are enrolled in public schools. The age group of 10 to 14 year olds has the highest likelihood of being enrolled in private schools, with 23 (25.3% in the age bracket) enrolled. Conversely, the age group of 3 to 4 year olds has the lowest likelihood of being enrolled in a private school, with 35 (100.0% in the age bracket) attending a public institution.
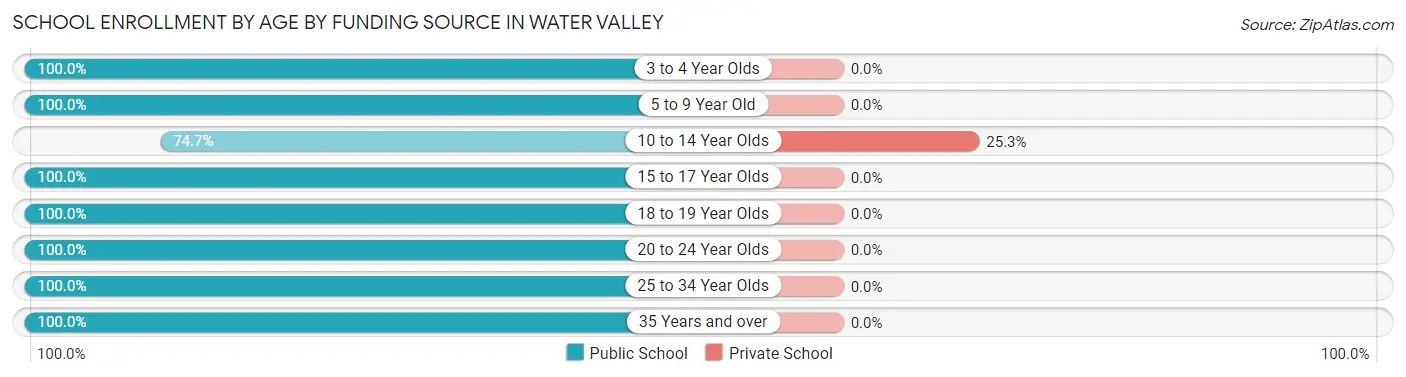
| Age Bracket | Public School | Private School |
| 3 to 4 Year Olds | 35 (100.0%) | 0 (0.0%) |
| 5 to 9 Year Old | 206 (100.0%) | 0 (0.0%) |
| 10 to 14 Year Olds | 68 (74.7%) | 23 (25.3%) |
| 15 to 17 Year Olds | 140 (100.0%) | 0 (0.0%) |
| 18 to 19 Year Olds | 74 (100.0%) | 0 (0.0%) |
| 20 to 24 Year Olds | 91 (100.0%) | 0 (0.0%) |
| 25 to 34 Year Olds | 73 (100.0%) | 0 (0.0%) |
| 35 Years and over | 17 (100.0%) | 0 (0.0%) |
| Total | 704 (96.8%) | 23 (3.2%) |
Educational Attainment by Field of Study in Water Valley
Education (61 | 17.8%), liberal arts & history (60 | 17.5%), arts & humanities (45 | 13.2%), science & technology (38 | 11.1%), and business (30 | 8.8%) are the most common fields of study among 342 individuals in Water Valley who have obtained a bachelor's degree or higher.
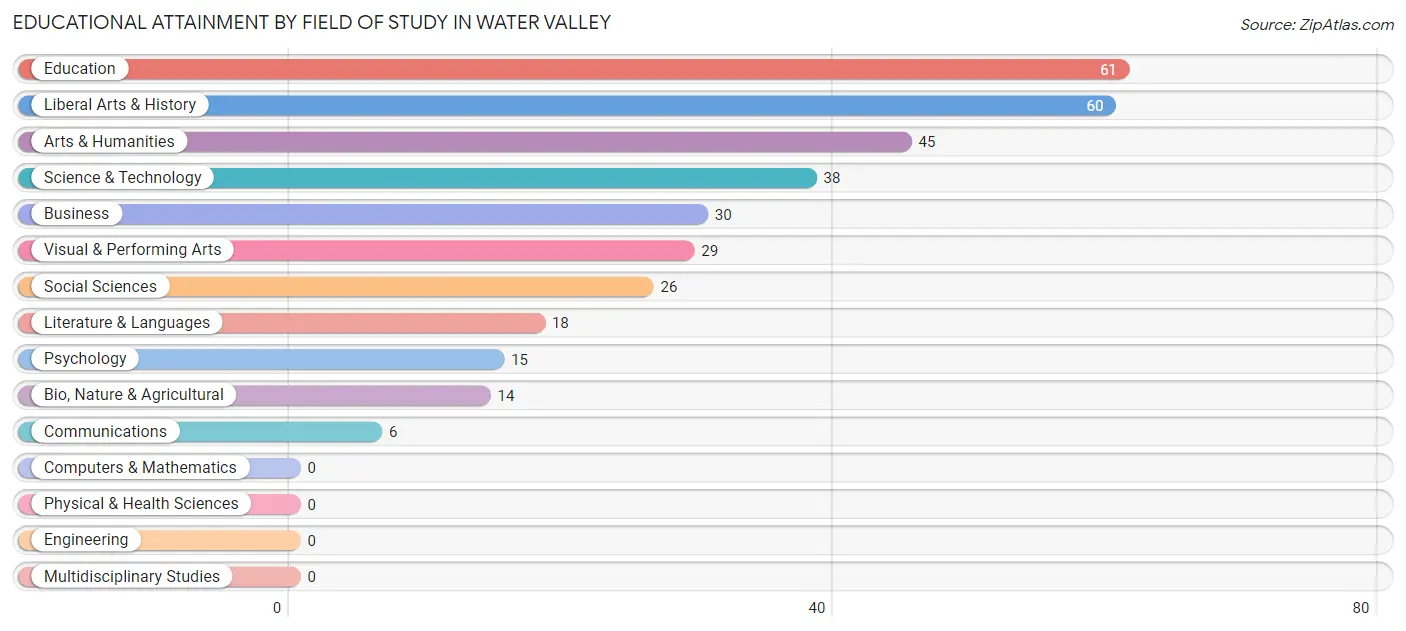
| Field of Study | # Graduates | % Graduates |
| Computers & Mathematics | 0 | 0.0% |
| Bio, Nature & Agricultural | 14 | 4.1% |
| Physical & Health Sciences | 0 | 0.0% |
| Psychology | 15 | 4.4% |
| Social Sciences | 26 | 7.6% |
| Engineering | 0 | 0.0% |
| Multidisciplinary Studies | 0 | 0.0% |
| Science & Technology | 38 | 11.1% |
| Business | 30 | 8.8% |
| Education | 61 | 17.8% |
| Literature & Languages | 18 | 5.3% |
| Liberal Arts & History | 60 | 17.5% |
| Visual & Performing Arts | 29 | 8.5% |
| Communications | 6 | 1.8% |
| Arts & Humanities | 45 | 13.2% |
| Total | 342 | 100.0% |
Transportation & Commute in Water Valley
Vehicle Availability by Sex in Water Valley
The most prevalent vehicle ownership categories in Water Valley are males with 2 vehicles (230, accounting for 39.7%) and females with 2 vehicles (378, making up 29.2%).
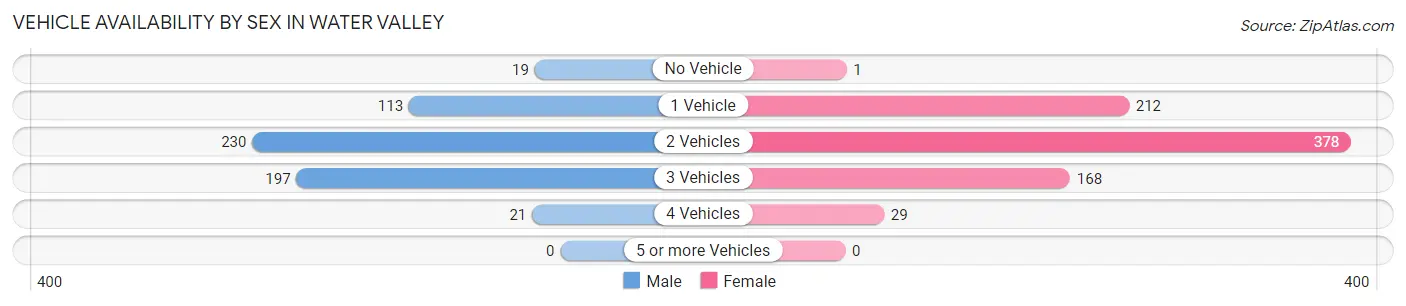
| Vehicles Available | Male | Female |
| No Vehicle | 19 (3.3%) | 1 (0.1%) |
| 1 Vehicle | 113 (19.5%) | 212 (26.9%) |
| 2 Vehicles | 230 (39.7%) | 378 (48.0%) |
| 3 Vehicles | 197 (34.0%) | 168 (21.3%) |
| 4 Vehicles | 21 (3.6%) | 29 (3.7%) |
| 5 or more Vehicles | 0 (0.0%) | 0 (0.0%) |
| Total | 580 (100.0%) | 788 (100.0%) |
Commute Time in Water Valley
The most frequently occuring commute durations in Water Valley are 5 to 9 minutes (406 commuters, 30.9%), 30 to 34 minutes (379 commuters, 28.9%), and 25 to 29 minutes (123 commuters, 9.4%).
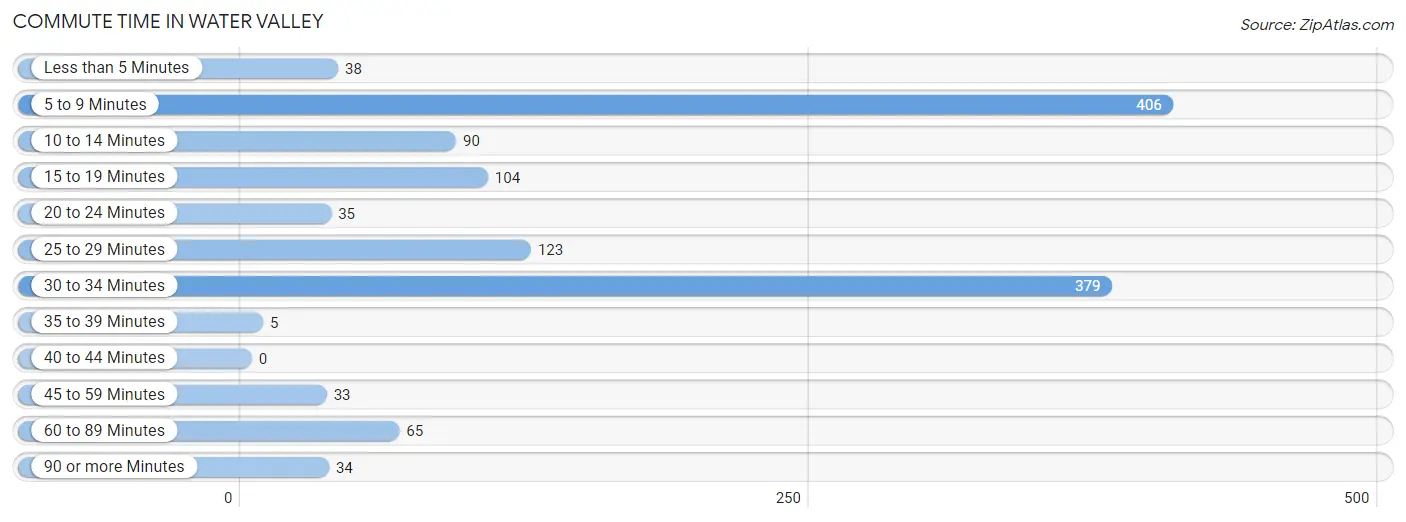
| Commute Time | # Commuters | % Commuters |
| Less than 5 Minutes | 38 | 2.9% |
| 5 to 9 Minutes | 406 | 30.9% |
| 10 to 14 Minutes | 90 | 6.9% |
| 15 to 19 Minutes | 104 | 7.9% |
| 20 to 24 Minutes | 35 | 2.7% |
| 25 to 29 Minutes | 123 | 9.4% |
| 30 to 34 Minutes | 379 | 28.9% |
| 35 to 39 Minutes | 5 | 0.4% |
| 40 to 44 Minutes | 0 | 0.0% |
| 45 to 59 Minutes | 33 | 2.5% |
| 60 to 89 Minutes | 65 | 5.0% |
| 90 or more Minutes | 34 | 2.6% |
Commute Time by Sex in Water Valley
The most common commute times in Water Valley are 30 to 34 minutes (168 commuters, 29.0%) for males and 5 to 9 minutes (293 commuters, 40.0%) for females.
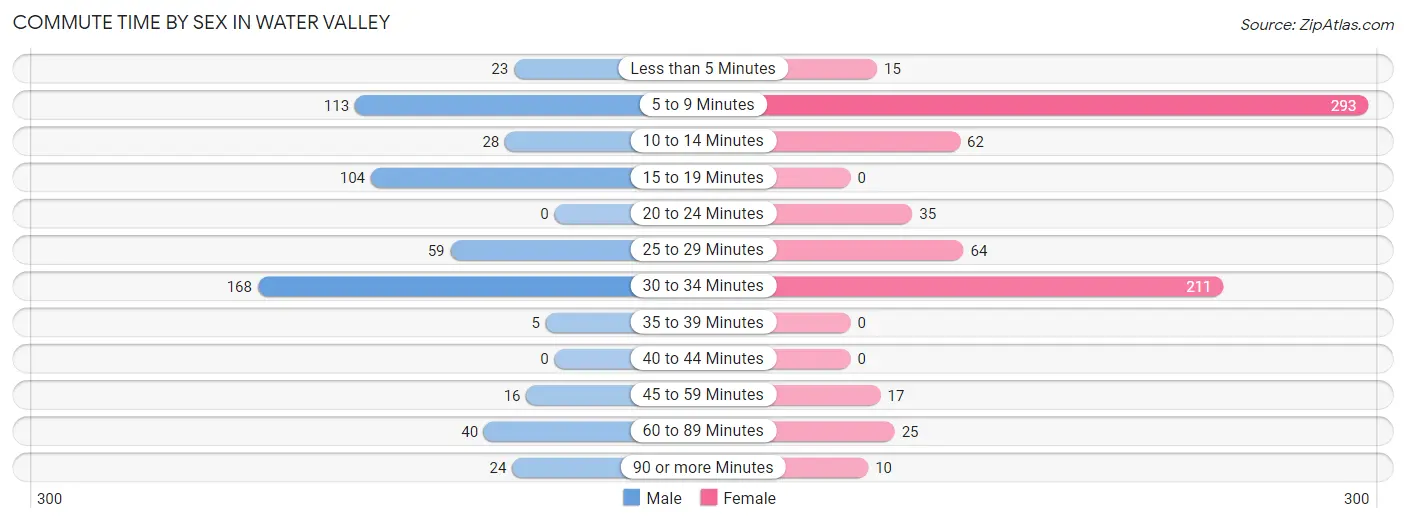
| Commute Time | Male | Female |
| Less than 5 Minutes | 23 (4.0%) | 15 (2.1%) |
| 5 to 9 Minutes | 113 (19.5%) | 293 (40.0%) |
| 10 to 14 Minutes | 28 (4.8%) | 62 (8.5%) |
| 15 to 19 Minutes | 104 (17.9%) | 0 (0.0%) |
| 20 to 24 Minutes | 0 (0.0%) | 35 (4.8%) |
| 25 to 29 Minutes | 59 (10.2%) | 64 (8.7%) |
| 30 to 34 Minutes | 168 (29.0%) | 211 (28.8%) |
| 35 to 39 Minutes | 5 (0.9%) | 0 (0.0%) |
| 40 to 44 Minutes | 0 (0.0%) | 0 (0.0%) |
| 45 to 59 Minutes | 16 (2.8%) | 17 (2.3%) |
| 60 to 89 Minutes | 40 (6.9%) | 25 (3.4%) |
| 90 or more Minutes | 24 (4.1%) | 10 (1.4%) |
Time of Departure to Work by Sex in Water Valley
The most frequent times of departure to work in Water Valley are 6:00 AM to 6:29 AM (196, 33.8%) for males and 8:00 AM to 8:29 AM (132, 18.0%) for females.
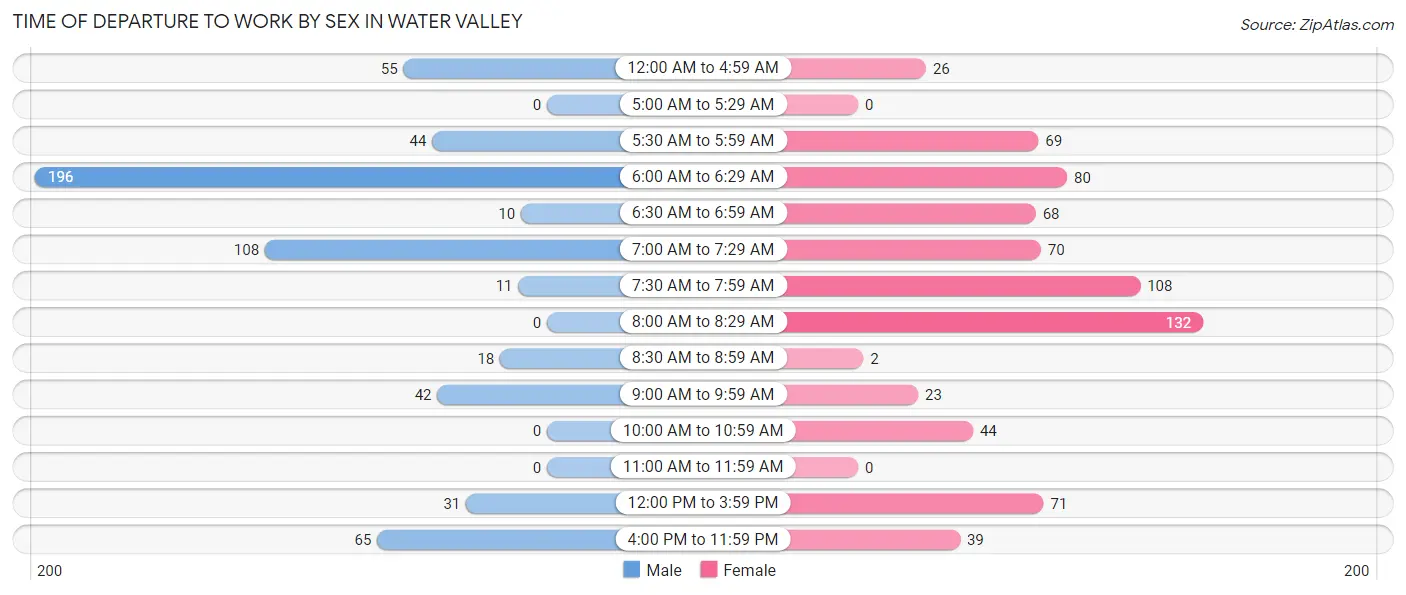
| Time of Departure | Male | Female |
| 12:00 AM to 4:59 AM | 55 (9.5%) | 26 (3.5%) |
| 5:00 AM to 5:29 AM | 0 (0.0%) | 0 (0.0%) |
| 5:30 AM to 5:59 AM | 44 (7.6%) | 69 (9.4%) |
| 6:00 AM to 6:29 AM | 196 (33.8%) | 80 (10.9%) |
| 6:30 AM to 6:59 AM | 10 (1.7%) | 68 (9.3%) |
| 7:00 AM to 7:29 AM | 108 (18.6%) | 70 (9.6%) |
| 7:30 AM to 7:59 AM | 11 (1.9%) | 108 (14.7%) |
| 8:00 AM to 8:29 AM | 0 (0.0%) | 132 (18.0%) |
| 8:30 AM to 8:59 AM | 18 (3.1%) | 2 (0.3%) |
| 9:00 AM to 9:59 AM | 42 (7.2%) | 23 (3.1%) |
| 10:00 AM to 10:59 AM | 0 (0.0%) | 44 (6.0%) |
| 11:00 AM to 11:59 AM | 0 (0.0%) | 0 (0.0%) |
| 12:00 PM to 3:59 PM | 31 (5.3%) | 71 (9.7%) |
| 4:00 PM to 11:59 PM | 65 (11.2%) | 39 (5.3%) |
| Total | 580 (100.0%) | 732 (100.0%) |
Housing Occupancy in Water Valley
Occupancy by Ownership in Water Valley
Of the total 1,263 dwellings in Water Valley, owner-occupied units account for 735 (58.2%), while renter-occupied units make up 528 (41.8%).
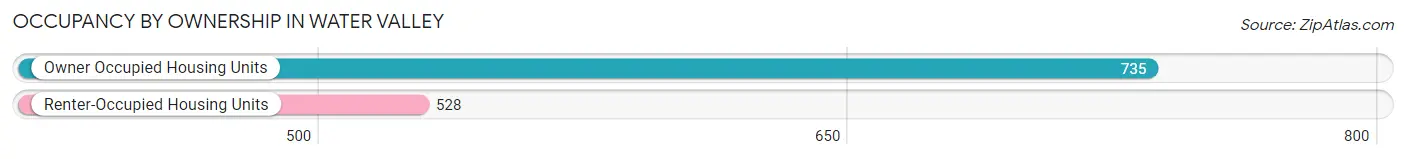
| Occupancy | # Housing Units | % Housing Units |
| Owner Occupied Housing Units | 735 | 58.2% |
| Renter-Occupied Housing Units | 528 | 41.8% |
| Total Occupied Housing Units | 1,263 | 100.0% |
Occupancy by Household Size in Water Valley
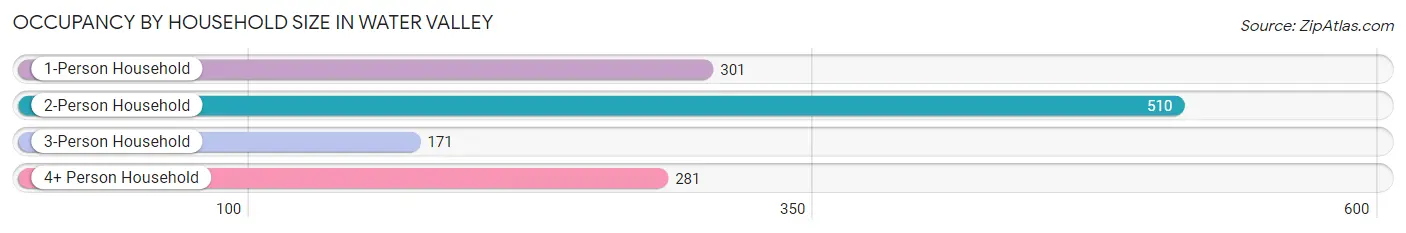
| Household Size | # Housing Units | % Housing Units |
| 1-Person Household | 301 | 23.8% |
| 2-Person Household | 510 | 40.4% |
| 3-Person Household | 171 | 13.5% |
| 4+ Person Household | 281 | 22.3% |
| Total Housing Units | 1,263 | 100.0% |
Occupancy by Ownership by Household Size in Water Valley
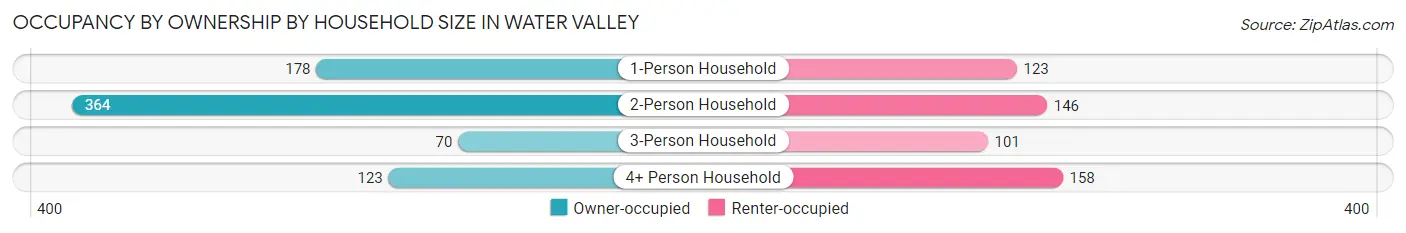
| Household Size | Owner-occupied | Renter-occupied |
| 1-Person Household | 178 (59.1%) | 123 (40.9%) |
| 2-Person Household | 364 (71.4%) | 146 (28.6%) |
| 3-Person Household | 70 (40.9%) | 101 (59.1%) |
| 4+ Person Household | 123 (43.8%) | 158 (56.2%) |
| Total Housing Units | 735 (58.2%) | 528 (41.8%) |
Occupancy by Educational Attainment in Water Valley
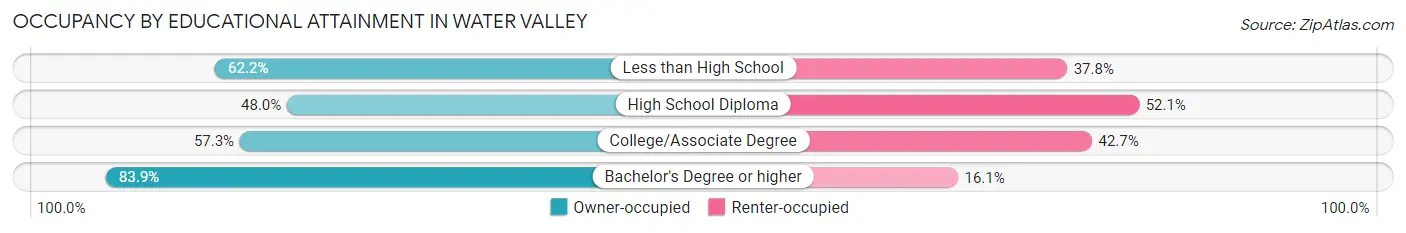
| Household Size | Owner-occupied | Renter-occupied |
| Less than High School | 140 (62.2%) | 85 (37.8%) |
| High School Diploma | 210 (47.9%) | 228 (52.0%) |
| College/Associate Degree | 255 (57.3%) | 190 (42.7%) |
| Bachelor's Degree or higher | 130 (83.9%) | 25 (16.1%) |
Occupancy by Age of Householder in Water Valley
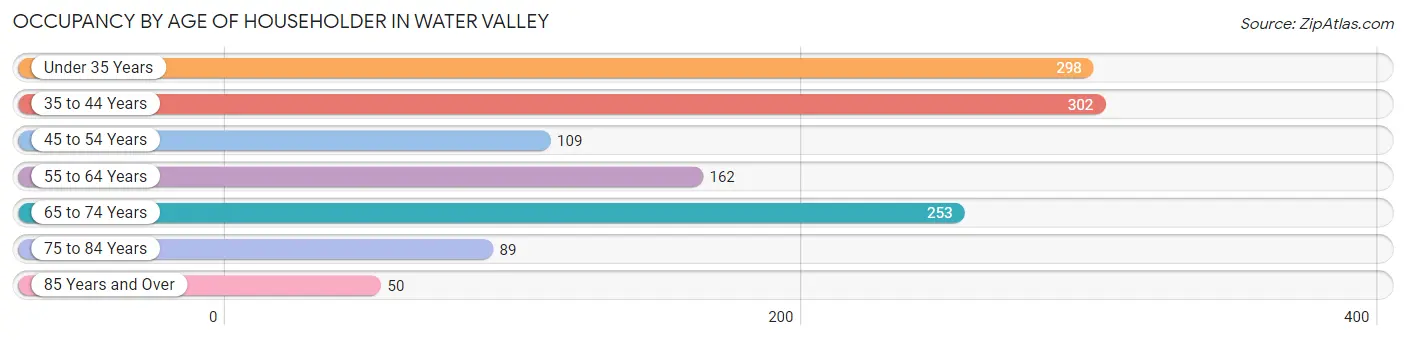
| Age Bracket | # Households | % Households |
| Under 35 Years | 298 | 23.6% |
| 35 to 44 Years | 302 | 23.9% |
| 45 to 54 Years | 109 | 8.6% |
| 55 to 64 Years | 162 | 12.8% |
| 65 to 74 Years | 253 | 20.0% |
| 75 to 84 Years | 89 | 7.0% |
| 85 Years and Over | 50 | 4.0% |
| Total | 1,263 | 100.0% |
Housing Finances in Water Valley
Median Income by Occupancy in Water Valley
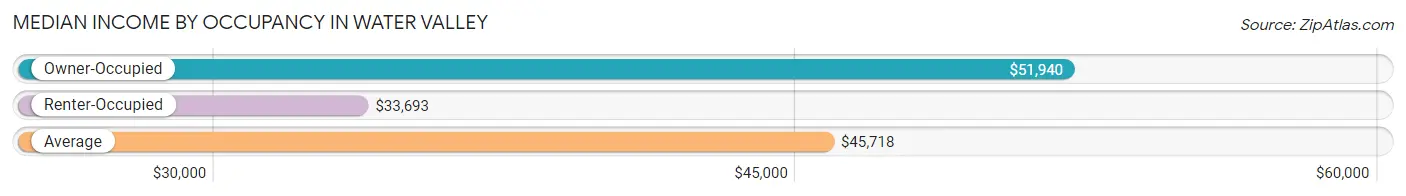
| Occupancy Type | # Households | Median Income |
| Owner-Occupied | 735 (58.2%) | $51,940 |
| Renter-Occupied | 528 (41.8%) | $33,693 |
| Average | 1,263 (100.0%) | $45,718 |
Occupancy by Householder Income Bracket in Water Valley
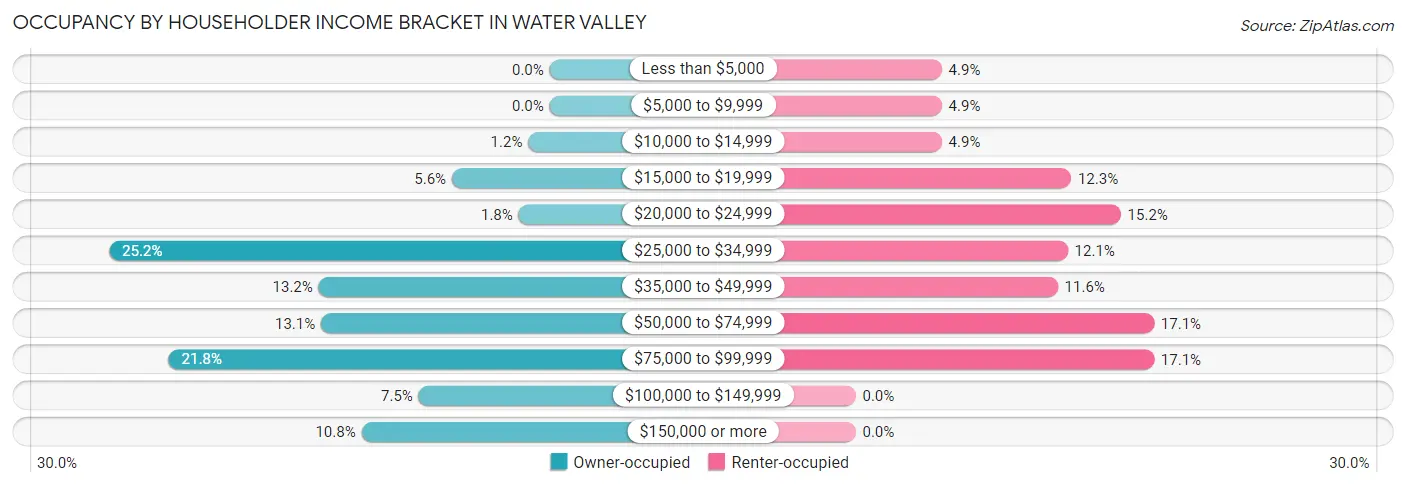
| Income Bracket | Owner-occupied | Renter-occupied |
| Less than $5,000 | 0 (0.0%) | 26 (4.9%) |
| $5,000 to $9,999 | 0 (0.0%) | 26 (4.9%) |
| $10,000 to $14,999 | 9 (1.2%) | 26 (4.9%) |
| $15,000 to $19,999 | 41 (5.6%) | 65 (12.3%) |
| $20,000 to $24,999 | 13 (1.8%) | 80 (15.1%) |
| $25,000 to $34,999 | 185 (25.2%) | 64 (12.1%) |
| $35,000 to $49,999 | 97 (13.2%) | 61 (11.6%) |
| $50,000 to $74,999 | 96 (13.1%) | 90 (17.1%) |
| $75,000 to $99,999 | 160 (21.8%) | 90 (17.1%) |
| $100,000 to $149,999 | 55 (7.5%) | 0 (0.0%) |
| $150,000 or more | 79 (10.7%) | 0 (0.0%) |
| Total | 735 (100.0%) | 528 (100.0%) |
Monthly Housing Cost Tiers in Water Valley
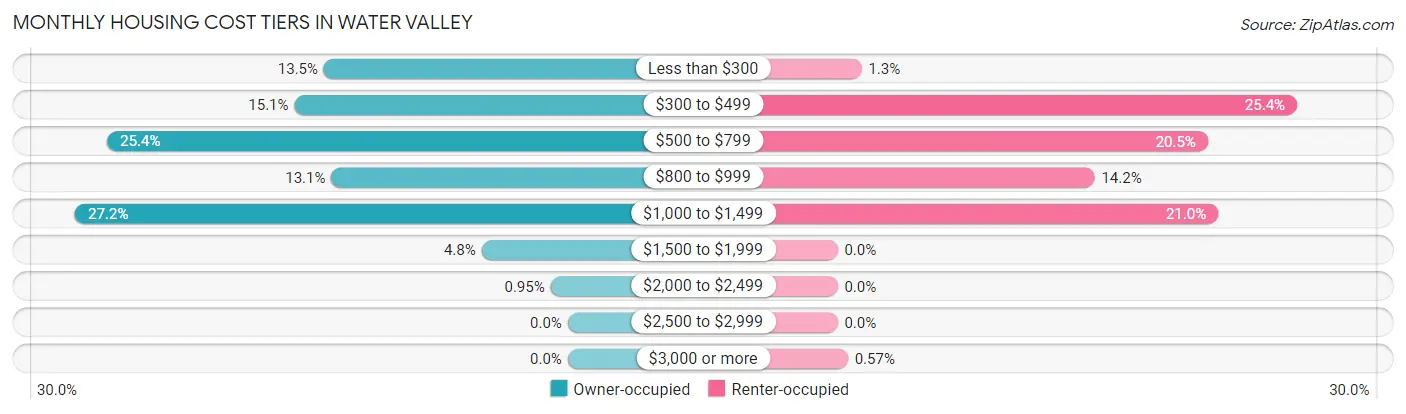
| Monthly Cost | Owner-occupied | Renter-occupied |
| Less than $300 | 99 (13.5%) | 7 (1.3%) |
| $300 to $499 | 111 (15.1%) | 134 (25.4%) |
| $500 to $799 | 187 (25.4%) | 108 (20.4%) |
| $800 to $999 | 96 (13.1%) | 75 (14.2%) |
| $1,000 to $1,499 | 200 (27.2%) | 111 (21.0%) |
| $1,500 to $1,999 | 35 (4.8%) | 0 (0.0%) |
| $2,000 to $2,499 | 7 (0.9%) | 0 (0.0%) |
| $2,500 to $2,999 | 0 (0.0%) | 0 (0.0%) |
| $3,000 or more | 0 (0.0%) | 3 (0.6%) |
| Total | 735 (100.0%) | 528 (100.0%) |
Physical Housing Characteristics in Water Valley
Housing Structures in Water Valley
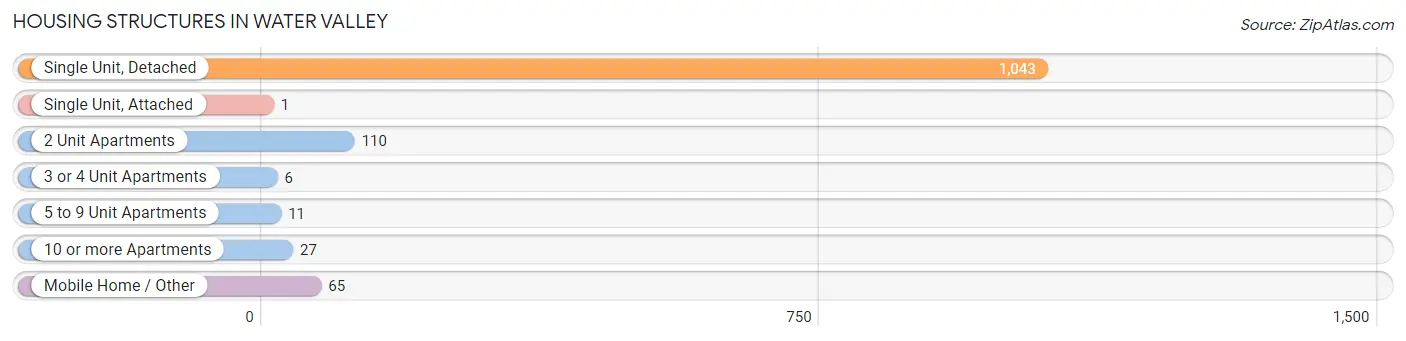
| Structure Type | # Housing Units | % Housing Units |
| Single Unit, Detached | 1,043 | 82.6% |
| Single Unit, Attached | 1 | 0.1% |
| 2 Unit Apartments | 110 | 8.7% |
| 3 or 4 Unit Apartments | 6 | 0.5% |
| 5 to 9 Unit Apartments | 11 | 0.9% |
| 10 or more Apartments | 27 | 2.1% |
| Mobile Home / Other | 65 | 5.1% |
| Total | 1,263 | 100.0% |
Housing Structures by Occupancy in Water Valley
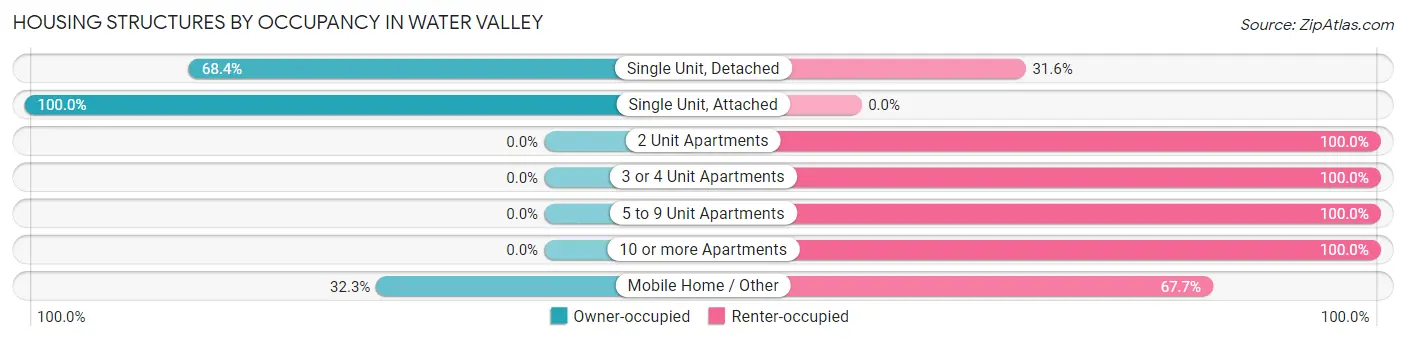
| Structure Type | Owner-occupied | Renter-occupied |
| Single Unit, Detached | 713 (68.4%) | 330 (31.6%) |
| Single Unit, Attached | 1 (100.0%) | 0 (0.0%) |
| 2 Unit Apartments | 0 (0.0%) | 110 (100.0%) |
| 3 or 4 Unit Apartments | 0 (0.0%) | 6 (100.0%) |
| 5 to 9 Unit Apartments | 0 (0.0%) | 11 (100.0%) |
| 10 or more Apartments | 0 (0.0%) | 27 (100.0%) |
| Mobile Home / Other | 21 (32.3%) | 44 (67.7%) |
| Total | 735 (58.2%) | 528 (41.8%) |
Housing Structures by Number of Rooms in Water Valley
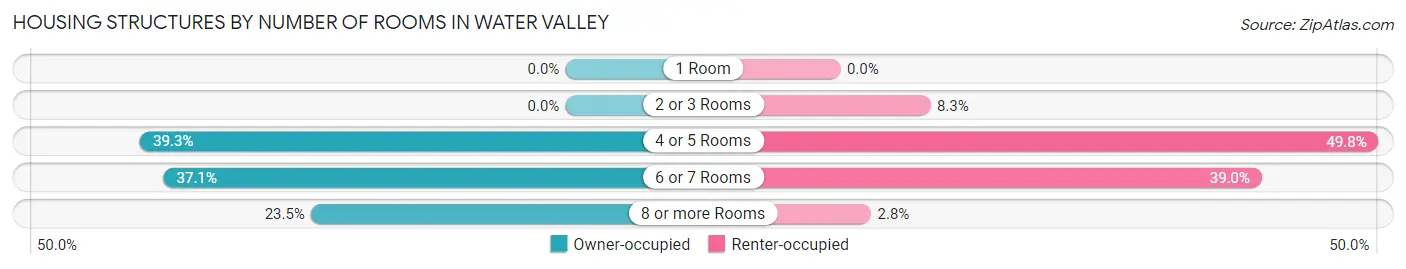
| Number of Rooms | Owner-occupied | Renter-occupied |
| 1 Room | 0 (0.0%) | 0 (0.0%) |
| 2 or 3 Rooms | 0 (0.0%) | 44 (8.3%) |
| 4 or 5 Rooms | 289 (39.3%) | 263 (49.8%) |
| 6 or 7 Rooms | 273 (37.1%) | 206 (39.0%) |
| 8 or more Rooms | 173 (23.5%) | 15 (2.8%) |
| Total | 735 (100.0%) | 528 (100.0%) |
Housing Structure by Heating Type in Water Valley
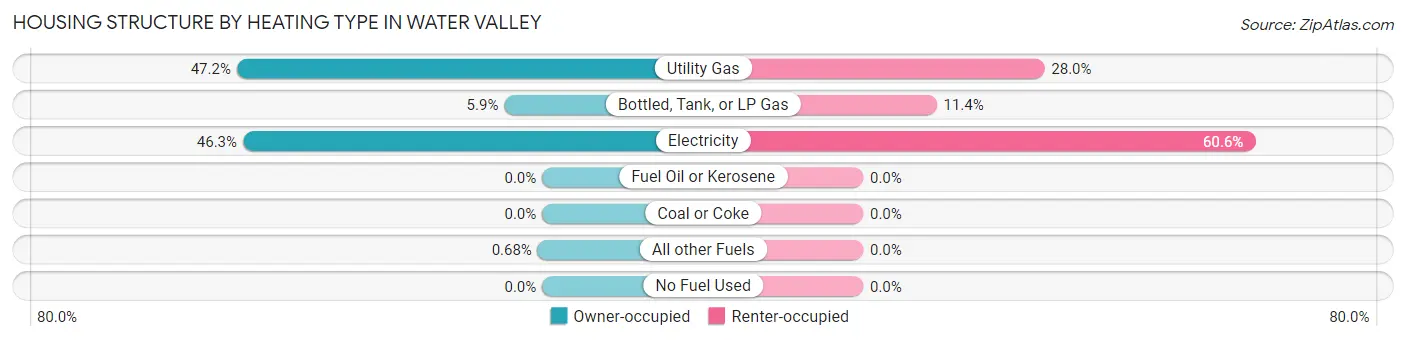
| Heating Type | Owner-occupied | Renter-occupied |
| Utility Gas | 347 (47.2%) | 148 (28.0%) |
| Bottled, Tank, or LP Gas | 43 (5.9%) | 60 (11.4%) |
| Electricity | 340 (46.3%) | 320 (60.6%) |
| Fuel Oil or Kerosene | 0 (0.0%) | 0 (0.0%) |
| Coal or Coke | 0 (0.0%) | 0 (0.0%) |
| All other Fuels | 5 (0.7%) | 0 (0.0%) |
| No Fuel Used | 0 (0.0%) | 0 (0.0%) |
| Total | 735 (100.0%) | 528 (100.0%) |
Household Vehicle Usage in Water Valley
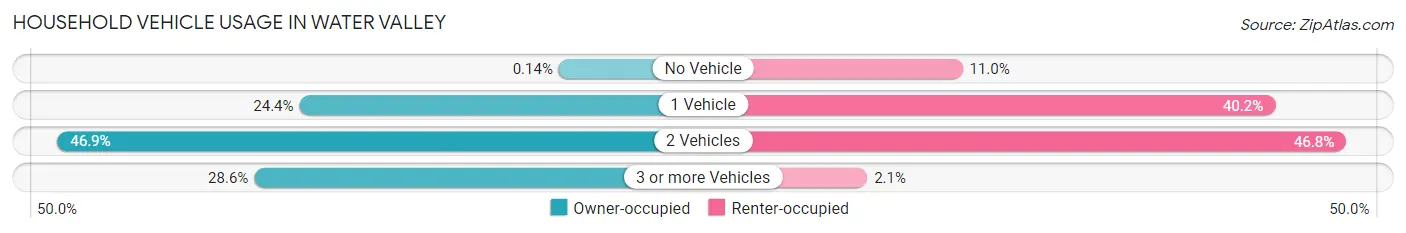
| Vehicles per Household | Owner-occupied | Renter-occupied |
| No Vehicle | 1 (0.1%) | 58 (11.0%) |
| 1 Vehicle | 179 (24.3%) | 212 (40.2%) |
| 2 Vehicles | 345 (46.9%) | 247 (46.8%) |
| 3 or more Vehicles | 210 (28.6%) | 11 (2.1%) |
| Total | 735 (100.0%) | 528 (100.0%) |
Real Estate & Mortgages in Water Valley
Real Estate and Mortgage Overview in Water Valley
| Characteristic | Without Mortgage | With Mortgage |
| Housing Units | 244 | 491 |
| Median Property Value | $89,000 | $117,700 |
| Median Household Income | $52,188 | $54 |
| Monthly Housing Costs | $321 | $0 |
| Real Estate Taxes | $690 | $26 |
Property Value by Mortgage Status in Water Valley
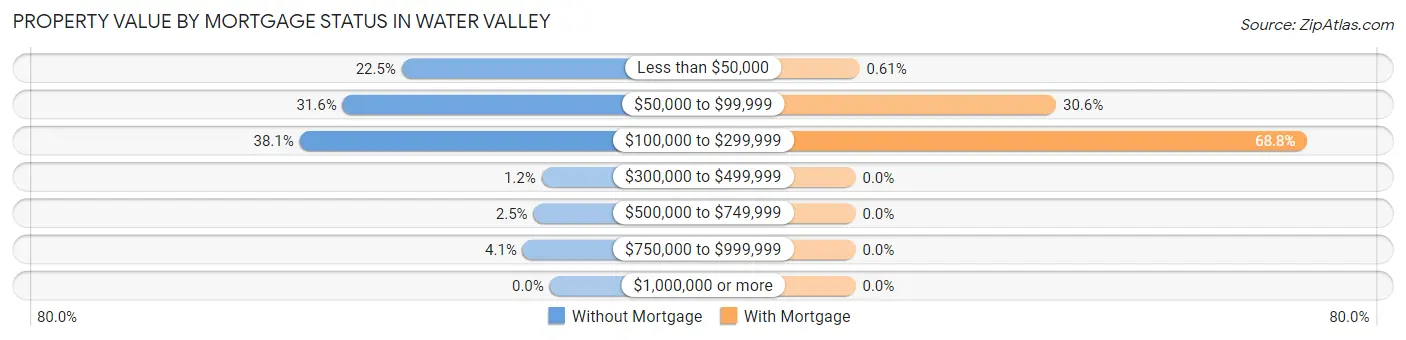
| Property Value | Without Mortgage | With Mortgage |
| Less than $50,000 | 55 (22.5%) | 3 (0.6%) |
| $50,000 to $99,999 | 77 (31.6%) | 150 (30.5%) |
| $100,000 to $299,999 | 93 (38.1%) | 338 (68.8%) |
| $300,000 to $499,999 | 3 (1.2%) | 0 (0.0%) |
| $500,000 to $749,999 | 6 (2.5%) | 0 (0.0%) |
| $750,000 to $999,999 | 10 (4.1%) | 0 (0.0%) |
| $1,000,000 or more | 0 (0.0%) | 0 (0.0%) |
| Total | 244 (100.0%) | 491 (100.0%) |
Household Income by Mortgage Status in Water Valley
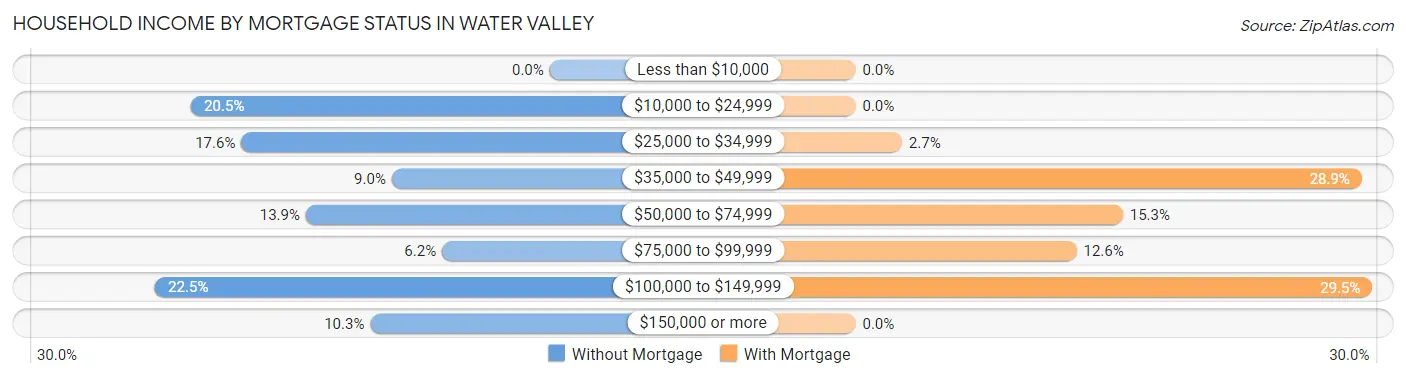
| Household Income | Without Mortgage | With Mortgage |
| Less than $10,000 | 0 (0.0%) | 0 (0.0%) |
| $10,000 to $24,999 | 50 (20.5%) | 0 (0.0%) |
| $25,000 to $34,999 | 43 (17.6%) | 13 (2.6%) |
| $35,000 to $49,999 | 22 (9.0%) | 142 (28.9%) |
| $50,000 to $74,999 | 34 (13.9%) | 75 (15.3%) |
| $75,000 to $99,999 | 15 (6.1%) | 62 (12.6%) |
| $100,000 to $149,999 | 55 (22.5%) | 145 (29.5%) |
| $150,000 or more | 25 (10.2%) | 0 (0.0%) |
| Total | 244 (100.0%) | 491 (100.0%) |
Property Value to Household Income Ratio in Water Valley
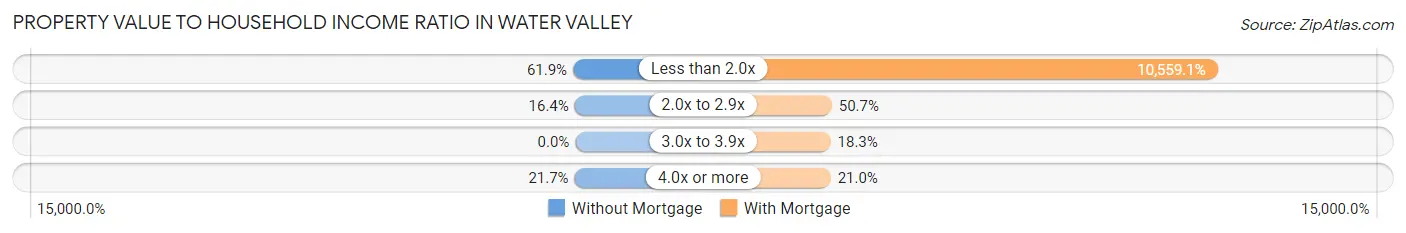
| Value-to-Income Ratio | Without Mortgage | With Mortgage |
| Less than 2.0x | 151 (61.9%) | 51,845 (10,559.1%) |
| 2.0x to 2.9x | 40 (16.4%) | 249 (50.7%) |
| 3.0x to 3.9x | 0 (0.0%) | 90 (18.3%) |
| 4.0x or more | 53 (21.7%) | 103 (21.0%) |
| Total | 244 (100.0%) | 491 (100.0%) |
Real Estate Taxes by Mortgage Status in Water Valley
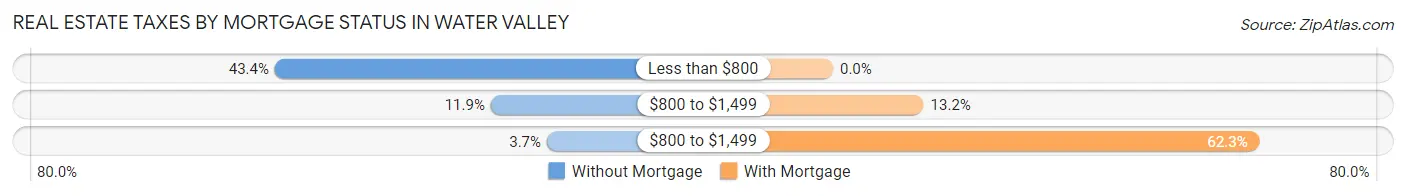
| Property Taxes | Without Mortgage | With Mortgage |
| Less than $800 | 106 (43.4%) | 0 (0.0%) |
| $800 to $1,499 | 29 (11.9%) | 65 (13.2%) |
| $800 to $1,499 | 9 (3.7%) | 306 (62.3%) |
| Total | 244 (100.0%) | 491 (100.0%) |
Health & Disability in Water Valley
Health Insurance Coverage by Age in Water Valley
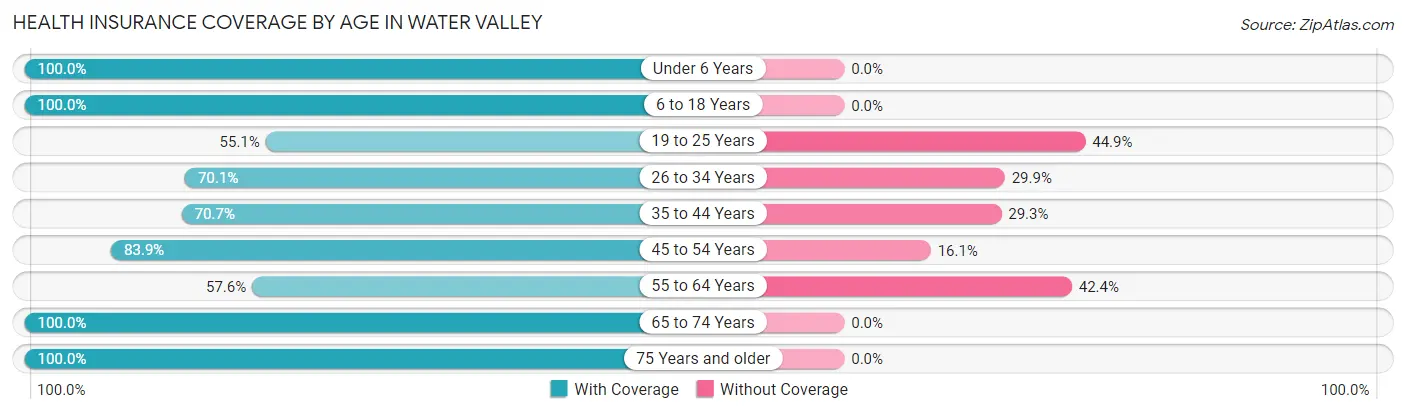
| Age Bracket | With Coverage | Without Coverage |
| Under 6 Years | 334 (100.0%) | 0 (0.0%) |
| 6 to 18 Years | 443 (100.0%) | 0 (0.0%) |
| 19 to 25 Years | 185 (55.1%) | 151 (44.9%) |
| 26 to 34 Years | 363 (70.1%) | 155 (29.9%) |
| 35 to 44 Years | 348 (70.7%) | 144 (29.3%) |
| 45 to 54 Years | 177 (83.9%) | 34 (16.1%) |
| 55 to 64 Years | 171 (57.6%) | 126 (42.4%) |
| 65 to 74 Years | 421 (100.0%) | 0 (0.0%) |
| 75 Years and older | 151 (100.0%) | 0 (0.0%) |
| Total | 2,593 (81.0%) | 610 (19.0%) |
Health Insurance Coverage by Citizenship Status in Water Valley
| Citizenship Status | With Coverage | Without Coverage |
| Native Born | 334 (100.0%) | 0 (0.0%) |
| Foreign Born, Citizen | 443 (100.0%) | 0 (0.0%) |
| Foreign Born, not a Citizen | 185 (55.1%) | 151 (44.9%) |
Health Insurance Coverage by Household Income in Water Valley
| Household Income | With Coverage | Without Coverage |
| Under $25,000 | 503 (72.9%) | 187 (27.1%) |
| $25,000 to $49,999 | 909 (82.6%) | 191 (17.4%) |
| $50,000 to $74,999 | 402 (79.8%) | 102 (20.2%) |
| $75,000 to $99,999 | 496 (91.3%) | 47 (8.7%) |
| $100,000 and over | 283 (77.3%) | 83 (22.7%) |
Public vs Private Health Insurance Coverage by Age in Water Valley
| Age Bracket | Public Insurance | Private Insurance |
| Under 6 | 309 (92.5%) | 25 (7.5%) |
| 6 to 18 Years | 336 (75.8%) | 113 (25.5%) |
| 19 to 25 Years | 93 (27.7%) | 103 (30.6%) |
| 25 to 34 Years | 44 (8.5%) | 319 (61.6%) |
| 35 to 44 Years | 73 (14.8%) | 309 (62.8%) |
| 45 to 54 Years | 98 (46.5%) | 79 (37.4%) |
| 55 to 64 Years | 77 (25.9%) | 112 (37.7%) |
| 65 to 74 Years | 421 (100.0%) | 186 (44.2%) |
| 75 Years and over | 151 (100.0%) | 111 (73.5%) |
| Total | 1,602 (50.0%) | 1,357 (42.4%) |
Disability Status by Sex by Age in Water Valley
| Age Bracket | Male | Female |
| Under 5 Years | 0 (0.0%) | 0 (0.0%) |
| 5 to 17 Years | 11 (4.2%) | 46 (24.7%) |
| 18 to 34 Years | 18 (4.9%) | 30 (5.6%) |
| 35 to 64 Years | 50 (11.6%) | 115 (20.3%) |
| 65 to 74 Years | 43 (25.6%) | 67 (26.5%) |
| 75 Years and over | 28 (40.0%) | 48 (59.3%) |
Disability Class by Sex by Age in Water Valley
Disability Class: Hearing Difficulty
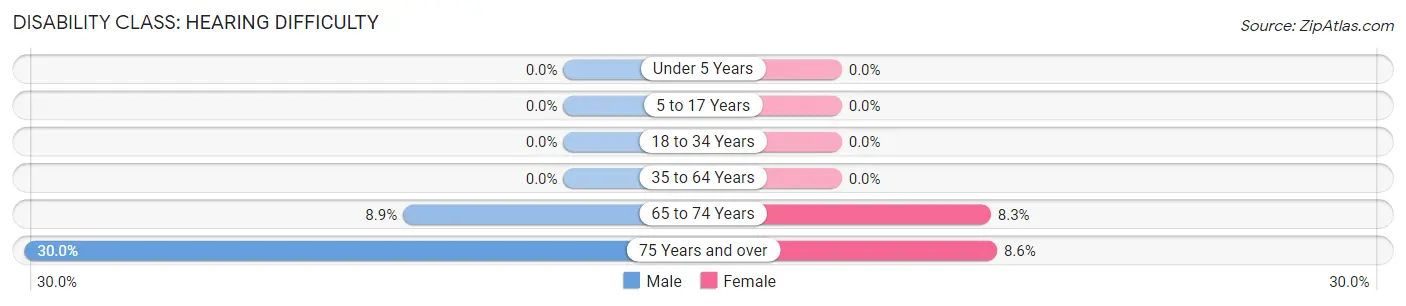
| Age Bracket | Male | Female |
| Under 5 Years | 0 (0.0%) | 0 (0.0%) |
| 5 to 17 Years | 0 (0.0%) | 0 (0.0%) |
| 18 to 34 Years | 0 (0.0%) | 0 (0.0%) |
| 35 to 64 Years | 0 (0.0%) | 0 (0.0%) |
| 65 to 74 Years | 15 (8.9%) | 21 (8.3%) |
| 75 Years and over | 21 (30.0%) | 7 (8.6%) |
Disability Class: Vision Difficulty
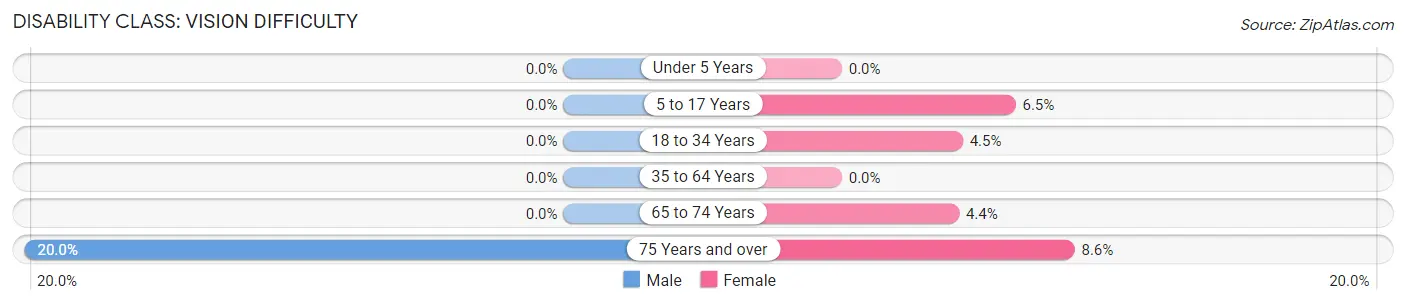
| Age Bracket | Male | Female |
| Under 5 Years | 0 (0.0%) | 0 (0.0%) |
| 5 to 17 Years | 0 (0.0%) | 12 (6.5%) |
| 18 to 34 Years | 0 (0.0%) | 24 (4.5%) |
| 35 to 64 Years | 0 (0.0%) | 0 (0.0%) |
| 65 to 74 Years | 0 (0.0%) | 11 (4.3%) |
| 75 Years and over | 14 (20.0%) | 7 (8.6%) |
Disability Class: Cognitive Difficulty
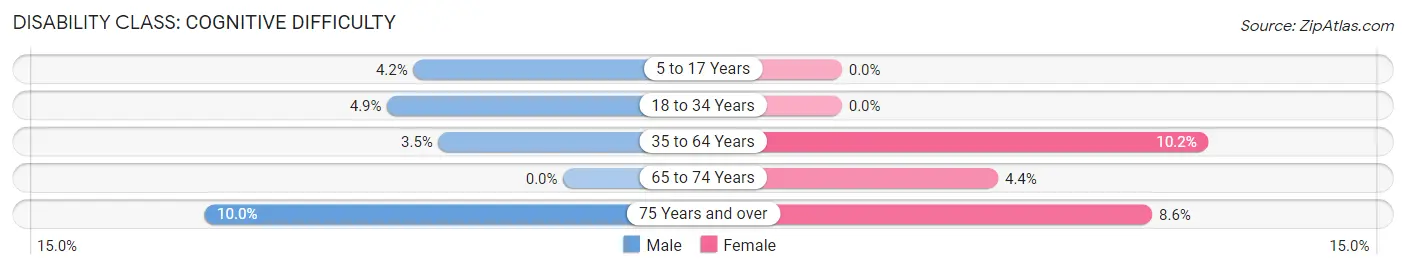
| Age Bracket | Male | Female |
| 5 to 17 Years | 11 (4.2%) | 0 (0.0%) |
| 18 to 34 Years | 18 (4.9%) | 0 (0.0%) |
| 35 to 64 Years | 15 (3.5%) | 58 (10.2%) |
| 65 to 74 Years | 0 (0.0%) | 11 (4.3%) |
| 75 Years and over | 7 (10.0%) | 7 (8.6%) |
Disability Class: Ambulatory Difficulty
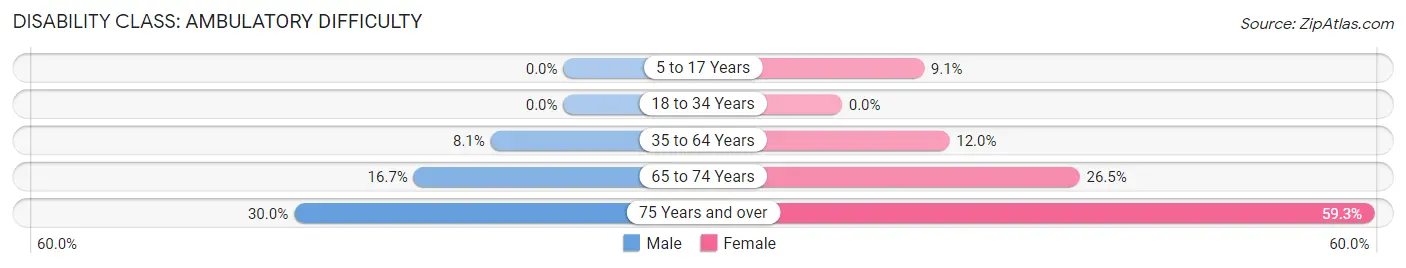
| Age Bracket | Male | Female |
| 5 to 17 Years | 0 (0.0%) | 17 (9.1%) |
| 18 to 34 Years | 0 (0.0%) | 0 (0.0%) |
| 35 to 64 Years | 35 (8.1%) | 68 (12.0%) |
| 65 to 74 Years | 28 (16.7%) | 67 (26.5%) |
| 75 Years and over | 21 (30.0%) | 48 (59.3%) |
Disability Class: Self-Care Difficulty
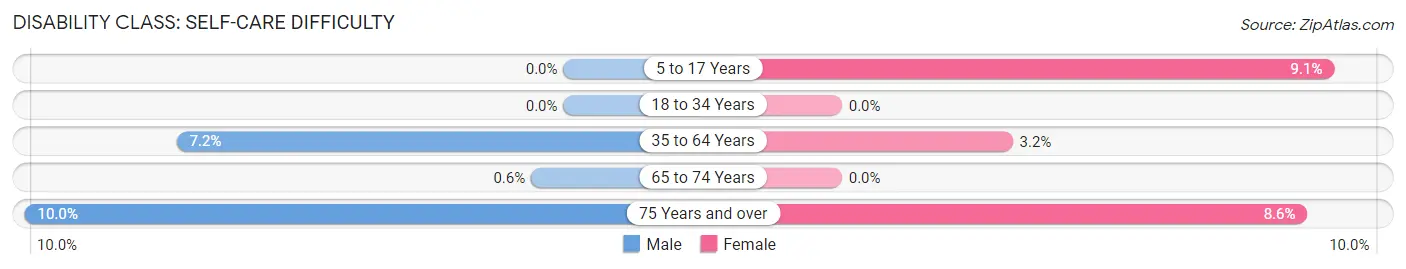
| Age Bracket | Male | Female |
| 5 to 17 Years | 0 (0.0%) | 17 (9.1%) |
| 18 to 34 Years | 0 (0.0%) | 0 (0.0%) |
| 35 to 64 Years | 31 (7.2%) | 18 (3.2%) |
| 65 to 74 Years | 1 (0.6%) | 0 (0.0%) |
| 75 Years and over | 7 (10.0%) | 7 (8.6%) |
Technology Access in Water Valley
Computing Device Access in Water Valley
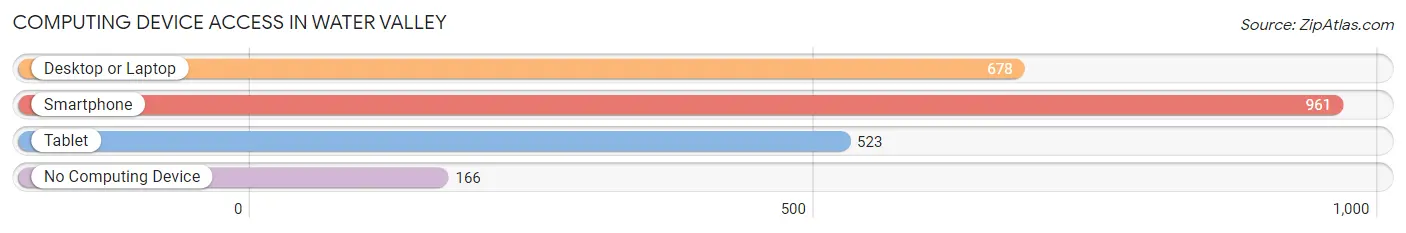
| Device Type | # Households | % Households |
| Desktop or Laptop | 678 | 53.7% |
| Smartphone | 961 | 76.1% |
| Tablet | 523 | 41.4% |
| No Computing Device | 166 | 13.1% |
| Total | 1,263 | 100.0% |
Internet Access in Water Valley
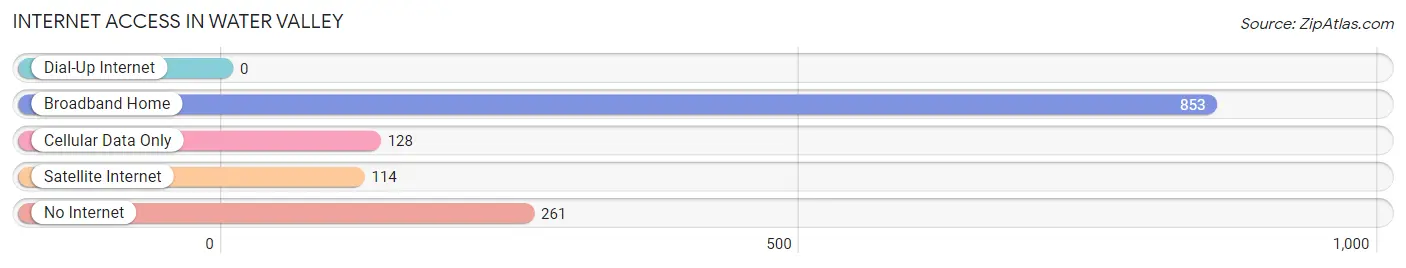
| Internet Type | # Households | % Households |
| Dial-Up Internet | 0 | 0.0% |
| Broadband Home | 853 | 67.5% |
| Cellular Data Only | 128 | 10.1% |
| Satellite Internet | 114 | 9.0% |
| No Internet | 261 | 20.7% |
| Total | 1,263 | 100.0% |
Water Valley Summary
History
Water Valley, Mississippi is a small town located in Yalobusha County, Mississippi. It is situated in the hills of the North Central part of the state, about an hour and a half south of Memphis, Tennessee. The town was founded in 1858 by the Mississippi Central Railroad, and was originally known as Water Valley Station. The town was named after the nearby Yalobusha River, which was known for its abundance of water.
The town was a major stop on the railroad, and it quickly grew into a bustling community. The railroad brought in many new settlers, and the town soon became a center of commerce and industry. The town was home to several cotton mills, a sawmill, a gristmill, and a number of other businesses.
In the late 19th century, Water Valley was a major stop on the Underground Railroad, and many African Americans escaped slavery by traveling through the town. The town was also home to a number of African American churches, schools, and businesses.
In the early 20th century, the town experienced a period of decline as the railroad industry began to decline. The town was hit hard by the Great Depression, and many of the businesses and industries in the town closed.
In the late 20th century, the town began to experience a resurgence. The town was revitalized by the opening of a new hospital, a new library, and a number of new businesses. The town also became a popular tourist destination, as it is located near several popular attractions, such as the Natchez Trace Parkway and the Mississippi Delta.
Geography
Water Valley is located in Yalobusha County, Mississippi, in the North Central part of the state. The town is situated in the hills of the North Central part of the state, about an hour and a half south of Memphis, Tennessee. The town is located near the Yalobusha River, which is known for its abundance of water.
The town is located in a rural area, and is surrounded by rolling hills and farmland. The town is located near several popular attractions, such as the Natchez Trace Parkway and the Mississippi Delta.
Economy
Water Valley is a small town, and the economy is largely based on agriculture and tourism. The town is home to several small businesses, including restaurants, shops, and other services. The town is also home to a number of manufacturing companies, including a furniture factory and a textile mill.
The town is also home to a number of tourist attractions, including the Natchez Trace Parkway and the Mississippi Delta. The town is also home to a number of festivals and events, such as the Water Valley Music Festival and the Water Valley Arts Festival.
Demographics
As of the 2010 census, the population of Water Valley was 2,945. The population is largely white, with African Americans making up about 25% of the population. The median household income is $31,250, and the median home value is $90,000. The town has a poverty rate of 22.3%.
Conclusion
Water Valley, Mississippi is a small town located in Yalobusha County, Mississippi. It is situated in the hills of the North Central part of the state, about an hour and a half south of Memphis, Tennessee. The town was founded in 1858 by the Mississippi Central Railroad, and was originally known as Water Valley Station. The town was a major stop on the railroad, and it quickly grew into a bustling community. The town was home to several cotton mills, a sawmill, a gristmill, and a number of other businesses. In the late 20th century, the town began to experience a resurgence, and it is now a popular tourist destination. The economy of the town is largely based on agriculture and tourism, and the population is largely white, with African Americans making up about 25% of the population.
Common Questions
What is Per Capita Income in Water Valley?
Per Capita income in Water Valley is $23,388.
What is the Median Family Income in Water Valley?
Median Family Income in Water Valley is $50,388.
What is the Median Household income in Water Valley?
Median Household Income in Water Valley is $45,718.
What is Income or Wage Gap in Water Valley?
Income or Wage Gap in Water Valley is 53.8%.
Women in Water Valley earn 46.2 cents for every dollar earned by a man.
What is Inequality or Gini Index in Water Valley?
Inequality or Gini Index in Water Valley is 0.40.
What is the Total Population of Water Valley?
Total Population of Water Valley is 3,383.
What is the Total Male Population of Water Valley?
Total Male Population of Water Valley is 1,480.
What is the Total Female Population of Water Valley?
Total Female Population of Water Valley is 1,903.
What is the Ratio of Males per 100 Females in Water Valley?
There are 77.77 Males per 100 Females in Water Valley.
What is the Ratio of Females per 100 Males in Water Valley?
There are 128.58 Females per 100 Males in Water Valley.
What is the Median Population Age in Water Valley?
Median Population Age in Water Valley is 35.8 Years.
What is the Average Family Size in Water Valley
Average Family Size in Water Valley is 3.0 People.
What is the Average Household Size in Water Valley
Average Household Size in Water Valley is 2.5 People.
How Large is the Labor Force in Water Valley?
There are 1,447 People in the Labor Forcein in Water Valley.
What is the Percentage of People in the Labor Force in Water Valley?
52.0% of People are in the Labor Force in Water Valley.
What is the Unemployment Rate in Water Valley?
Unemployment Rate in Water Valley is 4.7%.