Vardaman, MS Map & Demographics
Vardaman Map
Vardaman Overview
$17,210
PER CAPITA INCOME
$44,643
AVG FAMILY INCOME
$38,594
AVG HOUSEHOLD INCOME
16.9%
WAGE / INCOME GAP [ % ]
83.1¢/ $1
WAGE / INCOME GAP [ $ ]
0.35
INEQUALITY / GINI INDEX
972
TOTAL POPULATION
465
MALE POPULATION
507
FEMALE POPULATION
91.72
MALES / 100 FEMALES
109.03
FEMALES / 100 MALES
33.5
MEDIAN AGE
3.3
AVG FAMILY SIZE
2.7
AVG HOUSEHOLD SIZE
413
LABOR FORCE [ PEOPLE ]
56.4%
PERCENT IN LABOR FORCE
2.9%
UNEMPLOYMENT RATE
Vardaman Zip Codes
Vardaman Area Codes
Income in Vardaman
Income Overview in Vardaman
Per Capita Income in Vardaman is $17,210, while median incomes of families and households are $44,643 and $38,594 respectively.
| Characteristic | Number | Measure |
| Per Capita Income | 972 | $17,210 |
| Median Family Income | 230 | $44,643 |
| Mean Family Income | 230 | $51,721 |
| Median Household Income | 356 | $38,594 |
| Mean Household Income | 356 | $46,338 |
| Income Deficit | 230 | $0 |
| Wage / Income Gap (%) | 972 | 16.94% |
| Wage / Income Gap ($) | 972 | 83.06¢ per $1 |
| Gini / Inequality Index | 972 | 0.35 |
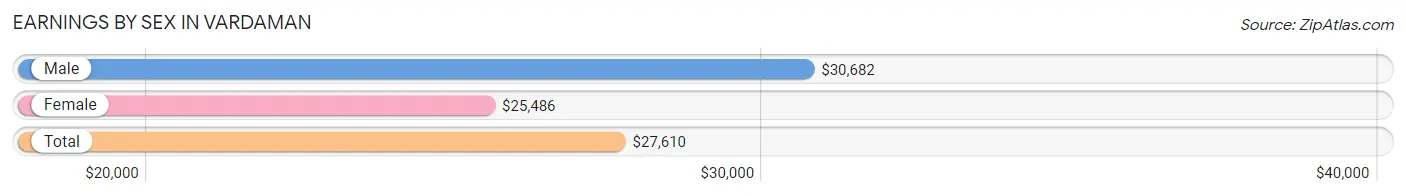
Earnings by Sex in Vardaman
Average Earnings in Vardaman are $27,610, $30,682 for men and $25,486 for women, a difference of 16.9%.
| Sex | Number | Average Earnings |
| Male | 184 (43.1%) | $30,682 |
| Female | 243 (56.9%) | $25,486 |
| Total | 427 (100.0%) | $27,610 |
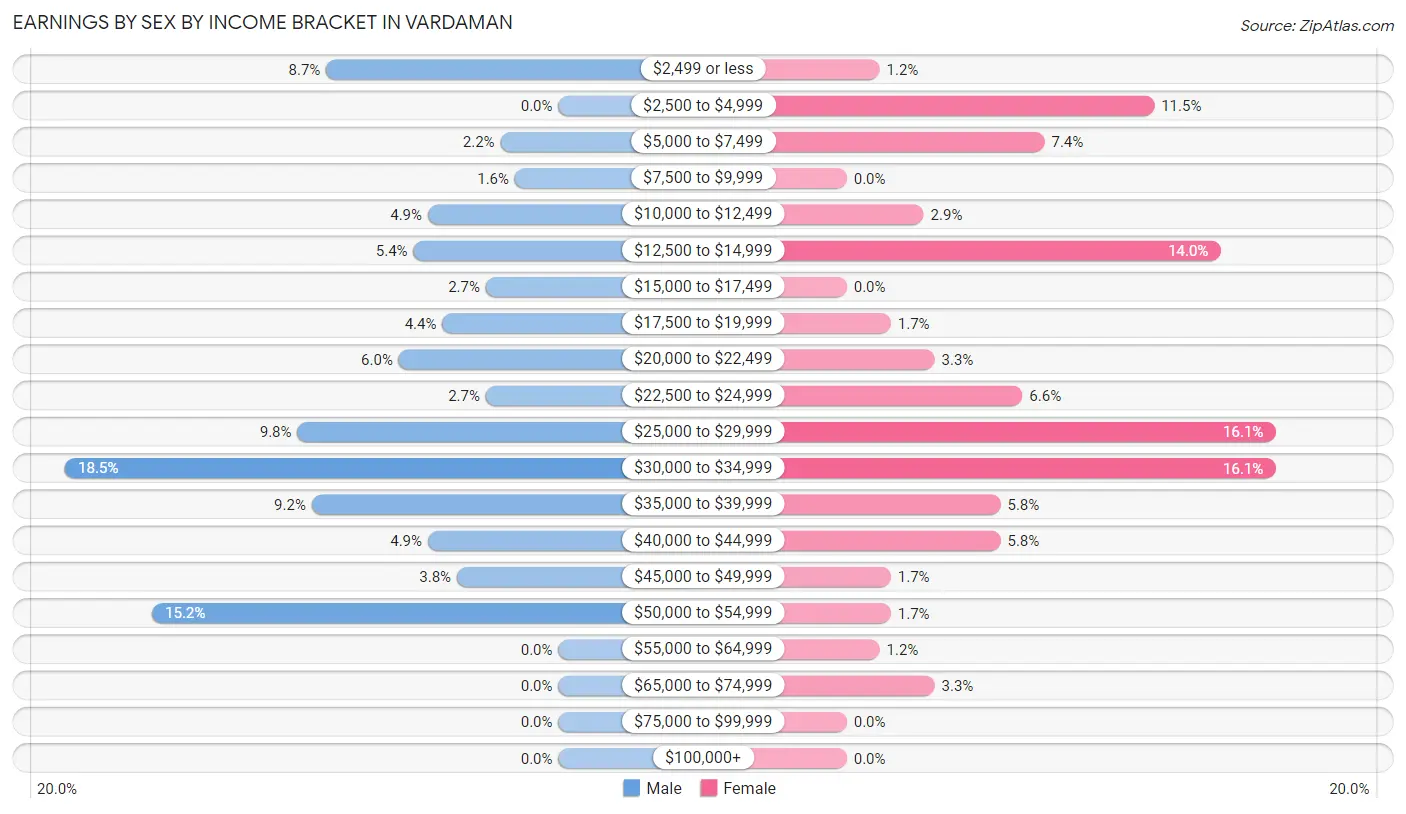
Earnings by Sex by Income Bracket in Vardaman
The most common earnings brackets in Vardaman are $30,000 to $34,999 for men (34 | 18.5%) and $25,000 to $29,999 for women (39 | 16.1%).
| Income | Male | Female |
| $2,499 or less | 16 (8.7%) | 3 (1.2%) |
| $2,500 to $4,999 | 0 (0.0%) | 28 (11.5%) |
| $5,000 to $7,499 | 4 (2.2%) | 18 (7.4%) |
| $7,500 to $9,999 | 3 (1.6%) | 0 (0.0%) |
| $10,000 to $12,499 | 9 (4.9%) | 7 (2.9%) |
| $12,500 to $14,999 | 10 (5.4%) | 34 (14.0%) |
| $15,000 to $17,499 | 5 (2.7%) | 0 (0.0%) |
| $17,500 to $19,999 | 8 (4.3%) | 4 (1.7%) |
| $20,000 to $22,499 | 11 (6.0%) | 8 (3.3%) |
| $22,500 to $24,999 | 5 (2.7%) | 16 (6.6%) |
| $25,000 to $29,999 | 18 (9.8%) | 39 (16.1%) |
| $30,000 to $34,999 | 34 (18.5%) | 39 (16.1%) |
| $35,000 to $39,999 | 17 (9.2%) | 14 (5.8%) |
| $40,000 to $44,999 | 9 (4.9%) | 14 (5.8%) |
| $45,000 to $49,999 | 7 (3.8%) | 4 (1.7%) |
| $50,000 to $54,999 | 28 (15.2%) | 4 (1.7%) |
| $55,000 to $64,999 | 0 (0.0%) | 3 (1.2%) |
| $65,000 to $74,999 | 0 (0.0%) | 8 (3.3%) |
| $75,000 to $99,999 | 0 (0.0%) | 0 (0.0%) |
| $100,000+ | 0 (0.0%) | 0 (0.0%) |
| Total | 184 (100.0%) | 243 (100.0%) |
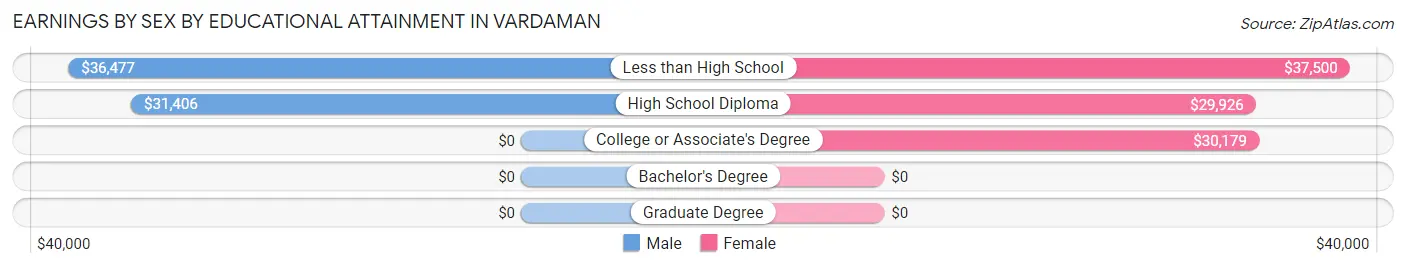
Earnings by Sex by Educational Attainment in Vardaman
Average earnings in Vardaman are $32,935 for men and $30,263 for women, a difference of 8.1%. Men with an educational attainment of less than high school enjoy the highest average annual earnings of $36,477, while those with high school diploma education earn the least with $31,406. Women with an educational attainment of less than high school earn the most with the average annual earnings of $37,500, while those with high school diploma education have the smallest earnings of $29,926.
| Educational Attainment | Male Income | Female Income |
| Less than High School | $36,477 | $37,500 |
| High School Diploma | $31,406 | $29,926 |
| College or Associate's Degree | - | - |
| Bachelor's Degree | - | - |
| Graduate Degree | - | - |
| Total | $32,935 | $30,263 |
Family Income in Vardaman
Family Income Brackets in Vardaman
According to the Vardaman family income data, there are 61 families falling into the $50,000 to $74,999 income range, which is the most common income bracket and makes up 26.5% of all families.
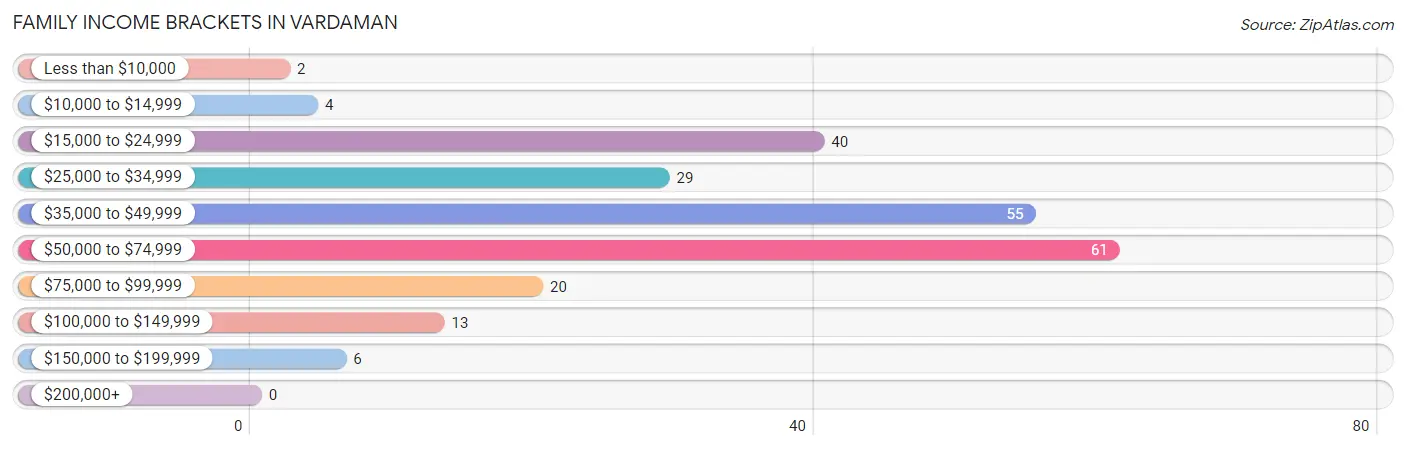
| Income Bracket | # Families | % Families |
| Less than $10,000 | 2 | 0.9% |
| $10,000 to $14,999 | 4 | 1.7% |
| $15,000 to $24,999 | 40 | 17.4% |
| $25,000 to $34,999 | 29 | 12.6% |
| $35,000 to $49,999 | 55 | 23.9% |
| $50,000 to $74,999 | 61 | 26.5% |
| $75,000 to $99,999 | 20 | 8.7% |
| $100,000 to $149,999 | 13 | 5.7% |
| $150,000 to $199,999 | 6 | 2.6% |
| $200,000+ | 0 | 0.0% |
Family Income by Famaliy Size in Vardaman
4-person families (37 | 16.1%) account for the highest median family income in Vardaman with $68,036 per family, while 2-person families (106 | 46.1%) have the highest median income of $19,643 per family member.
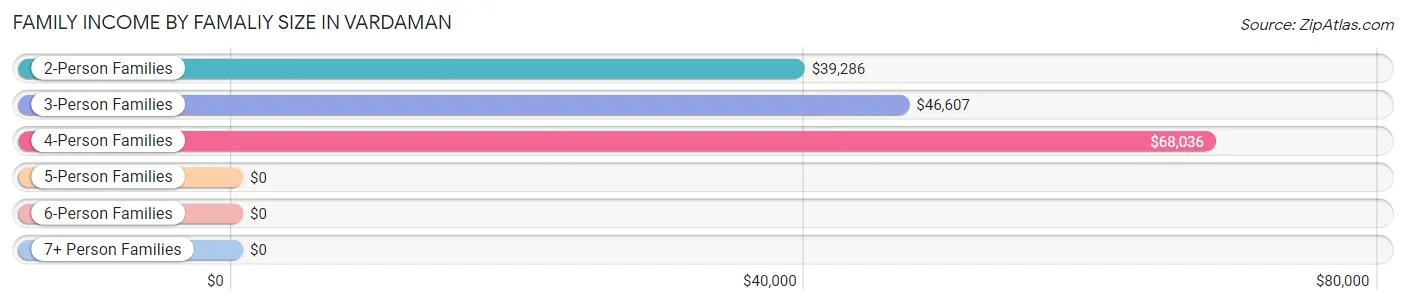
| Income Bracket | # Families | Median Income |
| 2-Person Families | 106 (46.1%) | $39,286 |
| 3-Person Families | 57 (24.8%) | $46,607 |
| 4-Person Families | 37 (16.1%) | $68,036 |
| 5-Person Families | 6 (2.6%) | $0 |
| 6-Person Families | 16 (7.0%) | $0 |
| 7+ Person Families | 8 (3.5%) | $0 |
| Total | 230 (100.0%) | $44,643 |
Family Income by Number of Earners in Vardaman
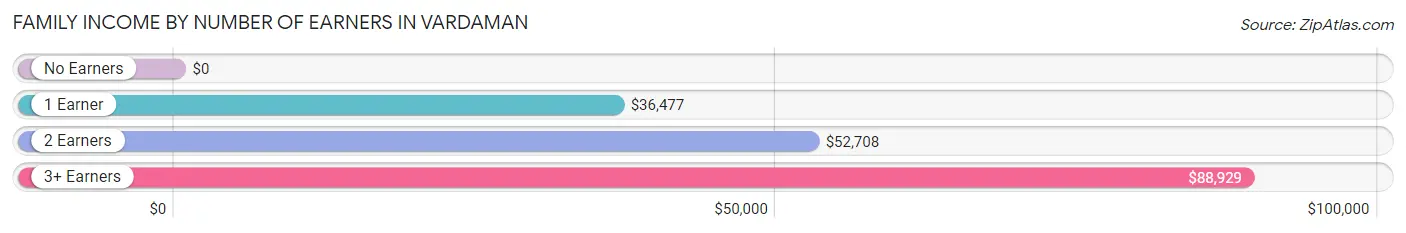
| Number of Earners | # Families | Median Income |
| No Earners | 36 (15.7%) | $0 |
| 1 Earner | 107 (46.5%) | $36,477 |
| 2 Earners | 69 (30.0%) | $52,708 |
| 3+ Earners | 18 (7.8%) | $88,929 |
| Total | 230 (100.0%) | $44,643 |
Household Income in Vardaman
Household Income Brackets in Vardaman
With 82 households falling in the category, the $50,000 to $74,999 income range is the most frequent in Vardaman, accounting for 23.0% of all households.
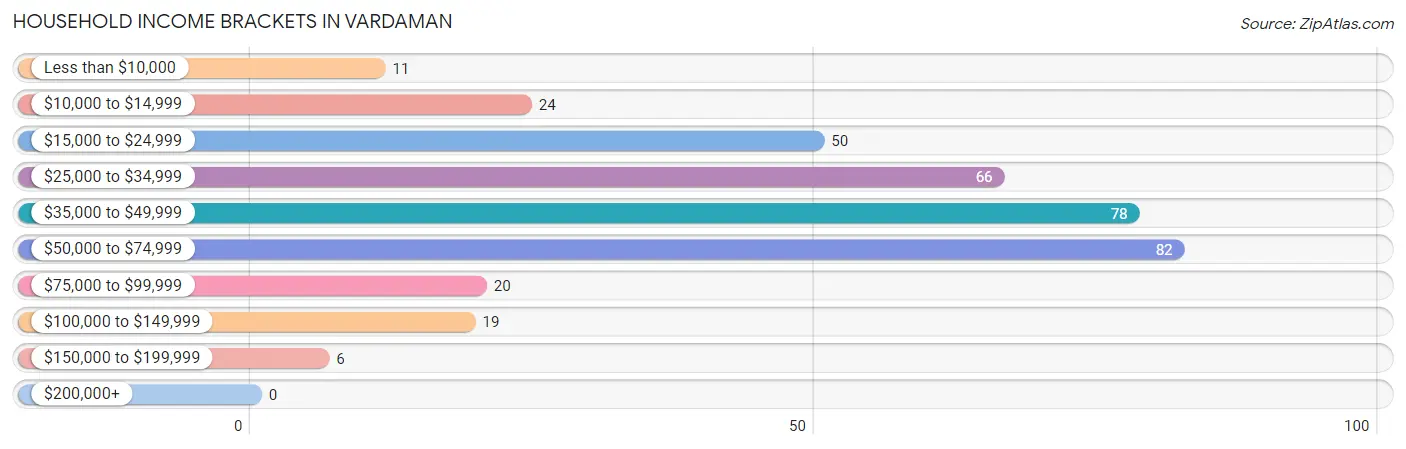
| Income Bracket | # Households | % Households |
| Less than $10,000 | 11 | 3.1% |
| $10,000 to $14,999 | 24 | 6.7% |
| $15,000 to $24,999 | 50 | 14.0% |
| $25,000 to $34,999 | 66 | 18.5% |
| $35,000 to $49,999 | 78 | 21.9% |
| $50,000 to $74,999 | 82 | 23.0% |
| $75,000 to $99,999 | 20 | 5.6% |
| $100,000 to $149,999 | 19 | 5.3% |
| $150,000 to $199,999 | 6 | 1.7% |
| $200,000+ | 0 | 0.0% |
Household Income by Householder Age in Vardaman
The median household income in Vardaman is $38,594, with the highest median household income of $43,438 found in the 45 to 64 years age bracket for the primary householder. A total of 121 households (34.0%) fall into this category.
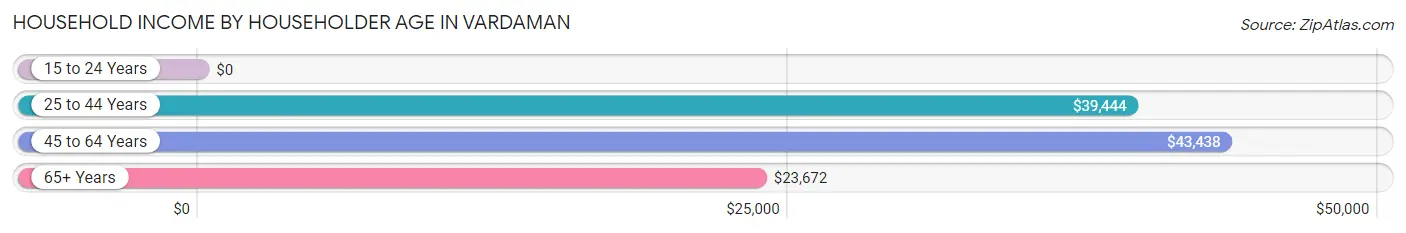
| Income Bracket | # Households | Median Income |
| 15 to 24 Years | 0 (0.0%) | $0 |
| 25 to 44 Years | 134 (37.6%) | $39,444 |
| 45 to 64 Years | 121 (34.0%) | $43,438 |
| 65+ Years | 101 (28.4%) | $23,672 |
| Total | 356 (100.0%) | $38,594 |
Poverty in Vardaman
Income Below Poverty by Sex and Age in Vardaman
With 24.1% poverty level for males and 24.1% for females among the residents of Vardaman, 12 to 14 year old males and 12 to 14 year old females are the most vulnerable to poverty, with 7 males (43.8%) and 12 females (100.0%) in their respective age groups living below the poverty level.
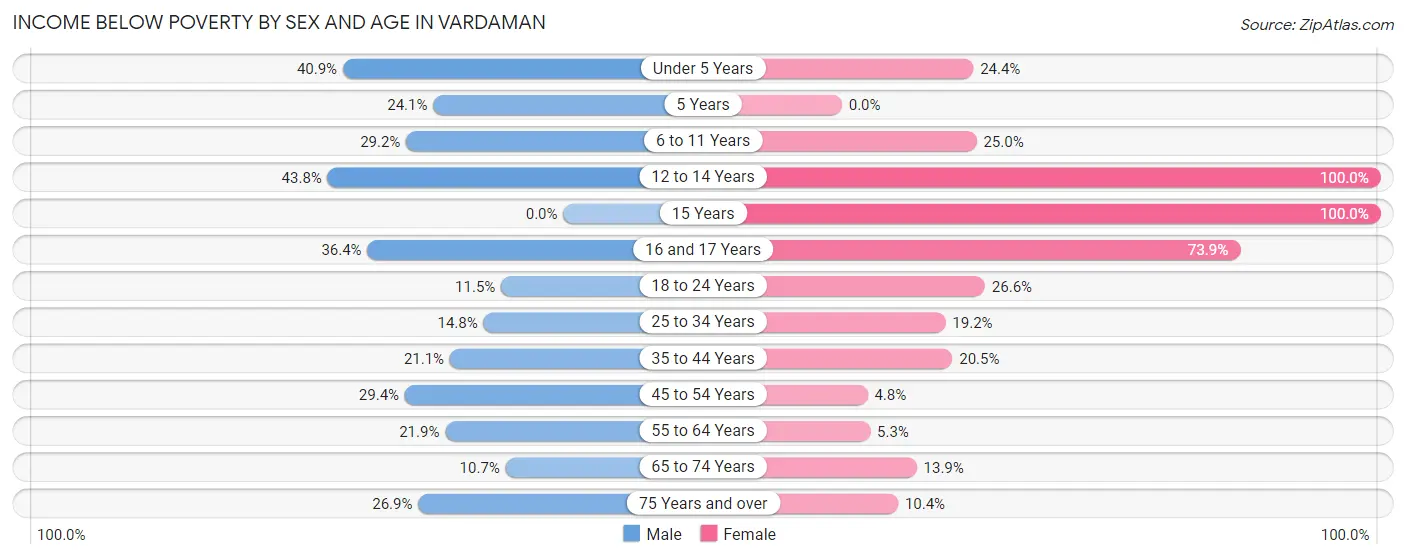
| Age Bracket | Male | Female |
| Under 5 Years | 9 (40.9%) | 10 (24.4%) |
| 5 Years | 7 (24.1%) | 0 (0.0%) |
| 6 to 11 Years | 21 (29.2%) | 7 (25.0%) |
| 12 to 14 Years | 7 (43.8%) | 12 (100.0%) |
| 15 Years | 0 (0.0%) | 20 (100.0%) |
| 16 and 17 Years | 8 (36.4%) | 17 (73.9%) |
| 18 to 24 Years | 3 (11.5%) | 17 (26.6%) |
| 25 to 34 Years | 12 (14.8%) | 15 (19.2%) |
| 35 to 44 Years | 4 (21.0%) | 8 (20.5%) |
| 45 to 54 Years | 15 (29.4%) | 2 (4.8%) |
| 55 to 64 Years | 16 (21.9%) | 4 (5.3%) |
| 65 to 74 Years | 3 (10.7%) | 5 (13.9%) |
| 75 Years and over | 7 (26.9%) | 5 (10.4%) |
| Total | 112 (24.1%) | 122 (24.1%) |
Income Above Poverty by Sex and Age in Vardaman
According to the poverty statistics in Vardaman, males aged 65 to 74 years and females aged 45 to 54 years are the age groups that are most secure financially, with 89.3% of males and 95.2% of females in these age groups living above the poverty line.
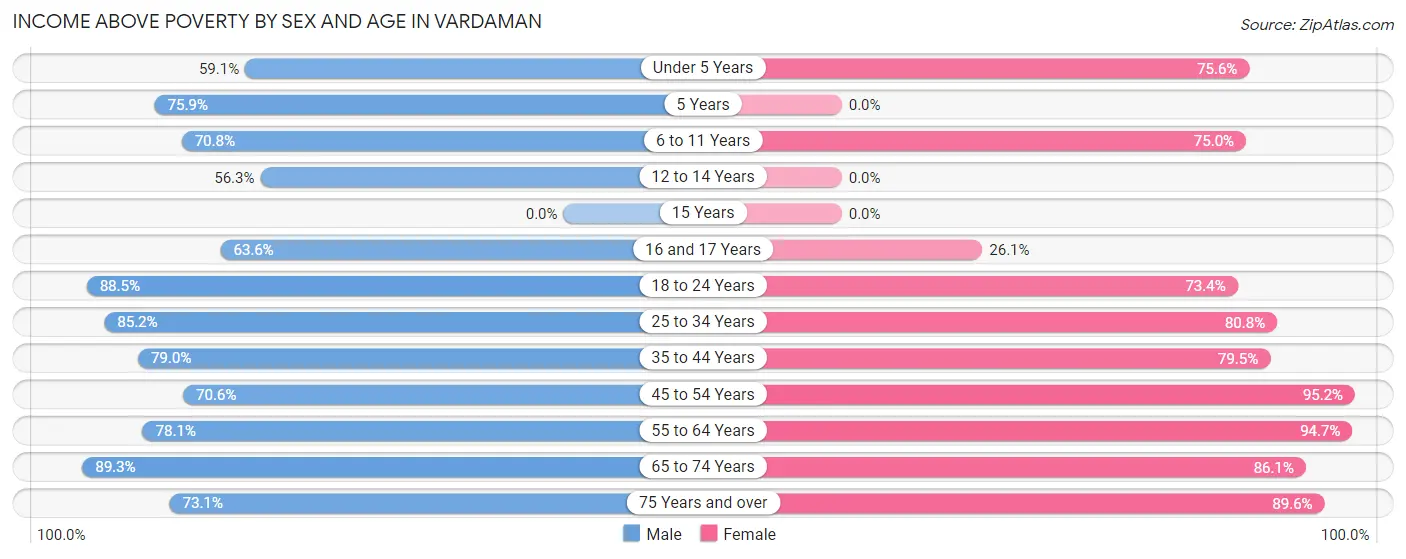
| Age Bracket | Male | Female |
| Under 5 Years | 13 (59.1%) | 31 (75.6%) |
| 5 Years | 22 (75.9%) | 0 (0.0%) |
| 6 to 11 Years | 51 (70.8%) | 21 (75.0%) |
| 12 to 14 Years | 9 (56.2%) | 0 (0.0%) |
| 15 Years | 0 (0.0%) | 0 (0.0%) |
| 16 and 17 Years | 14 (63.6%) | 6 (26.1%) |
| 18 to 24 Years | 23 (88.5%) | 47 (73.4%) |
| 25 to 34 Years | 69 (85.2%) | 63 (80.8%) |
| 35 to 44 Years | 15 (78.9%) | 31 (79.5%) |
| 45 to 54 Years | 36 (70.6%) | 40 (95.2%) |
| 55 to 64 Years | 57 (78.1%) | 72 (94.7%) |
| 65 to 74 Years | 25 (89.3%) | 31 (86.1%) |
| 75 Years and over | 19 (73.1%) | 43 (89.6%) |
| Total | 353 (75.9%) | 385 (75.9%) |
Income Below Poverty Among Married-Couple Families in Vardaman
The poverty statistics for married-couple families in Vardaman show that 6.0% or 9 of the total 150 families live below the poverty line. Families with 3 or 4 children have the highest poverty rate of 100.0%, comprising of 7 families. On the other hand, families with no children have the lowest poverty rate of 0.0%, which includes 0 families.
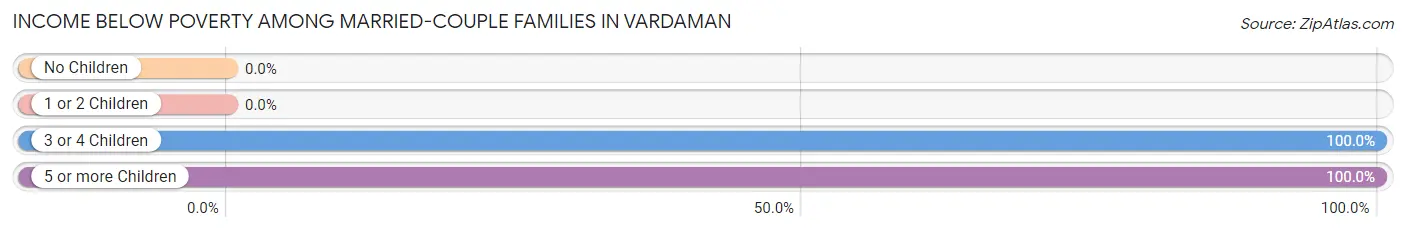
| Children | Above Poverty | Below Poverty |
| No Children | 92 (100.0%) | 0 (0.0%) |
| 1 or 2 Children | 49 (100.0%) | 0 (0.0%) |
| 3 or 4 Children | 0 (0.0%) | 7 (100.0%) |
| 5 or more Children | 0 (0.0%) | 2 (100.0%) |
| Total | 141 (94.0%) | 9 (6.0%) |
Income Below Poverty Among Single-Parent Households in Vardaman
According to the poverty data in Vardaman, 33.3% or 5 single-father households and 21.5% or 14 single-mother households are living below the poverty line. Among single-father households, those with 1 or 2 children have the highest poverty rate, with 5 households (41.7%) experiencing poverty. Likewise, among single-mother households, those with 1 or 2 children have the highest poverty rate, with 8 households (80.0%) falling below the poverty line.
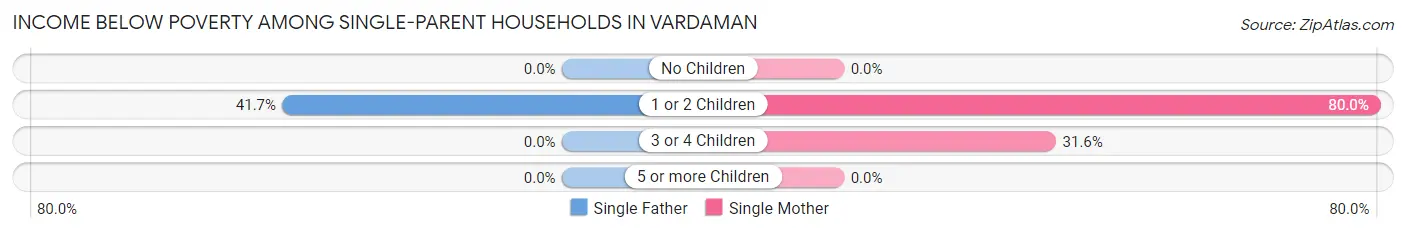
| Children | Single Father | Single Mother |
| No Children | 0 (0.0%) | 0 (0.0%) |
| 1 or 2 Children | 5 (41.7%) | 8 (80.0%) |
| 3 or 4 Children | 0 (0.0%) | 6 (31.6%) |
| 5 or more Children | 0 (0.0%) | 0 (0.0%) |
| Total | 5 (33.3%) | 14 (21.5%) |
Income Below Poverty Among Married-Couple vs Single-Parent Households in Vardaman
The poverty data for Vardaman shows that 9 of the married-couple family households (6.0%) and 19 of the single-parent households (23.7%) are living below the poverty level. Within the married-couple family households, those with 3 or 4 children have the highest poverty rate, with 7 households (100.0%) falling below the poverty line. Among the single-parent households, those with 1 or 2 children have the highest poverty rate, with 13 household (59.1%) living below poverty.
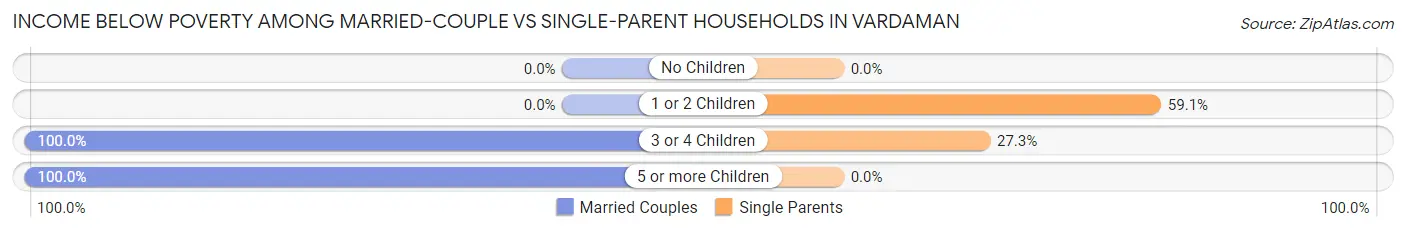
| Children | Married-Couple Families | Single-Parent Households |
| No Children | 0 (0.0%) | 0 (0.0%) |
| 1 or 2 Children | 0 (0.0%) | 13 (59.1%) |
| 3 or 4 Children | 7 (100.0%) | 6 (27.3%) |
| 5 or more Children | 2 (100.0%) | 0 (0.0%) |
| Total | 9 (6.0%) | 19 (23.7%) |
Race in Vardaman
The most populous races in Vardaman are White / Caucasian (338 | 34.8%), Black / African American (307 | 31.6%), and Hispanic or Latino (301 | 31.0%).
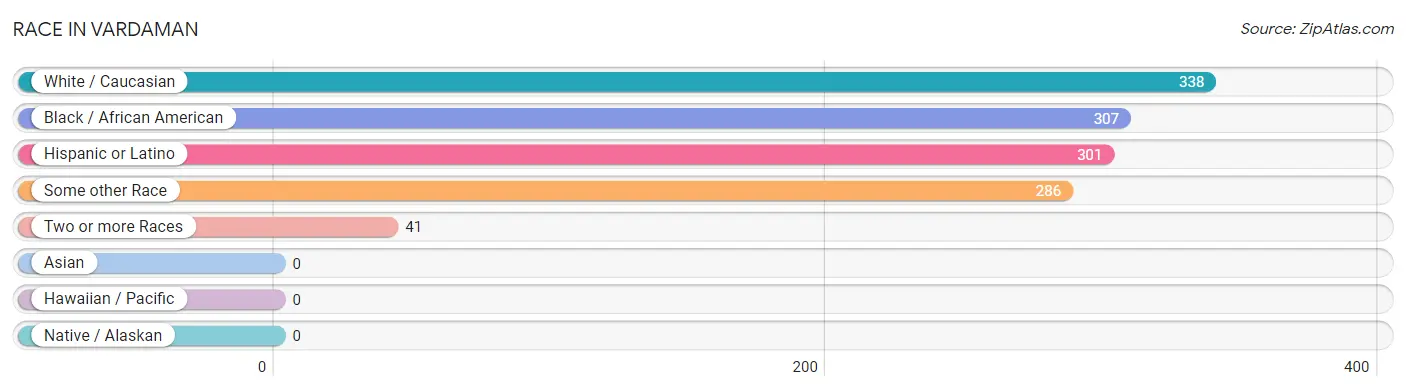
| Race | # Population | % Population |
| Asian | 0 | 0.0% |
| Black / African American | 307 | 31.6% |
| Hawaiian / Pacific | 0 | 0.0% |
| Hispanic or Latino | 301 | 31.0% |
| Native / Alaskan | 0 | 0.0% |
| White / Caucasian | 338 | 34.8% |
| Two or more Races | 41 | 4.2% |
| Some other Race | 286 | 29.4% |
| Total | 972 | 100.0% |
Ancestry in Vardaman
The most populous ancestries reported in Vardaman are Mexican (286 | 29.4%), American (125 | 12.9%), Irish (66 | 6.8%), German (50 | 5.1%), and Scotch-Irish (17 | 1.8%), together accounting for 56.0% of all Vardaman residents.
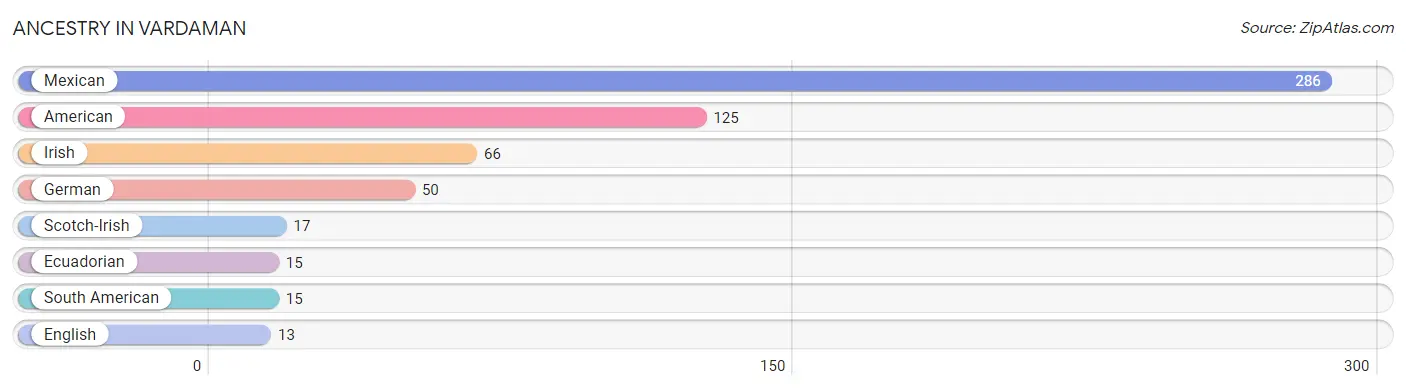
| Ancestry | # Population | % Population |
| American | 125 | 12.9% |
| Ecuadorian | 15 | 1.5% |
| English | 13 | 1.3% |
| German | 50 | 5.1% |
| Irish | 66 | 6.8% |
| Mexican | 286 | 29.4% |
| Scotch-Irish | 17 | 1.8% |
| South American | 15 | 1.5% | View All 8 Rows |
Immigrants in Vardaman
The most numerous immigrant groups reported in Vardaman came from Latin America (160 | 16.5%), Central America (145 | 14.9%), Mexico (145 | 14.9%), Ecuador (15 | 1.5%), and South America (15 | 1.5%), together accounting for 49.4% of all Vardaman residents.
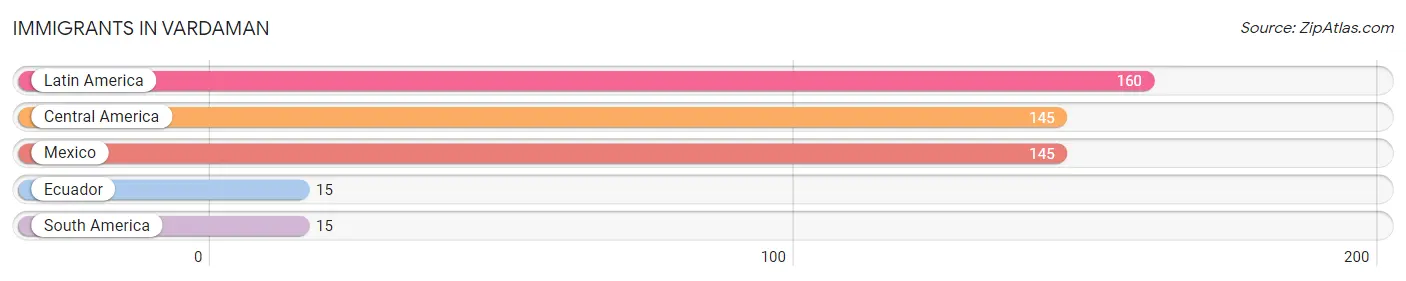
| Immigration Origin | # Population | % Population |
| Central America | 145 | 14.9% |
| Ecuador | 15 | 1.5% |
| Latin America | 160 | 16.5% |
| Mexico | 145 | 14.9% |
| South America | 15 | 1.5% | View All 5 Rows |
Sex and Age in Vardaman
Sex and Age in Vardaman
The most populous age groups in Vardaman are 10 to 14 Years (74 | 15.9%) for men and 15 to 19 Years (58 | 11.4%) for women.
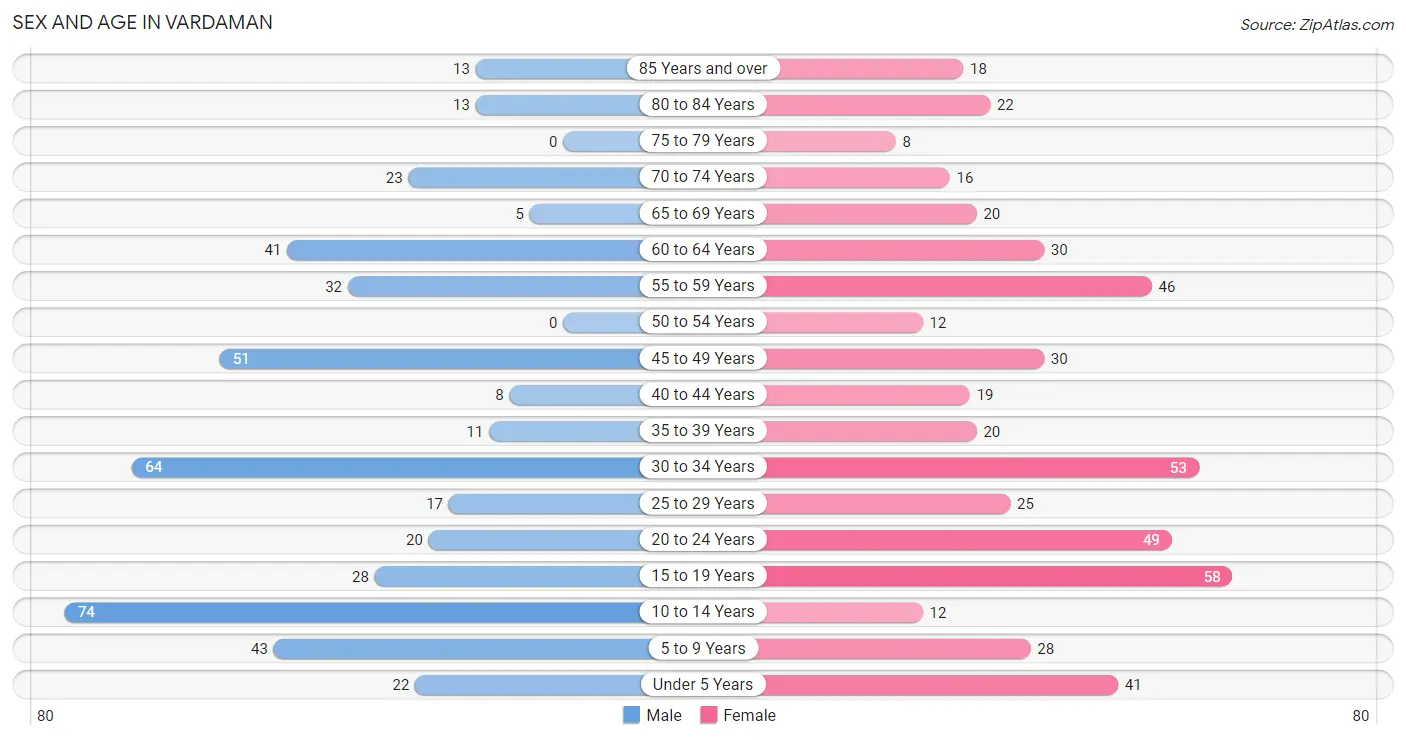
| Age Bracket | Male | Female |
| Under 5 Years | 22 (4.7%) | 41 (8.1%) |
| 5 to 9 Years | 43 (9.2%) | 28 (5.5%) |
| 10 to 14 Years | 74 (15.9%) | 12 (2.4%) |
| 15 to 19 Years | 28 (6.0%) | 58 (11.4%) |
| 20 to 24 Years | 20 (4.3%) | 49 (9.7%) |
| 25 to 29 Years | 17 (3.7%) | 25 (4.9%) |
| 30 to 34 Years | 64 (13.8%) | 53 (10.4%) |
| 35 to 39 Years | 11 (2.4%) | 20 (3.9%) |
| 40 to 44 Years | 8 (1.7%) | 19 (3.7%) |
| 45 to 49 Years | 51 (11.0%) | 30 (5.9%) |
| 50 to 54 Years | 0 (0.0%) | 12 (2.4%) |
| 55 to 59 Years | 32 (6.9%) | 46 (9.1%) |
| 60 to 64 Years | 41 (8.8%) | 30 (5.9%) |
| 65 to 69 Years | 5 (1.1%) | 20 (3.9%) |
| 70 to 74 Years | 23 (5.0%) | 16 (3.2%) |
| 75 to 79 Years | 0 (0.0%) | 8 (1.6%) |
| 80 to 84 Years | 13 (2.8%) | 22 (4.3%) |
| 85 Years and over | 13 (2.8%) | 18 (3.5%) |
| Total | 465 (100.0%) | 507 (100.0%) |
Families and Households in Vardaman
Median Family Size in Vardaman
The median family size in Vardaman is 3.31 persons per family, with married-couple families (150 | 65.2%) accounting for the largest median family size of 3.35 persons per family. On the other hand, single male/father families (15 | 6.5%) represent the smallest median family size with 3.07 persons per family.
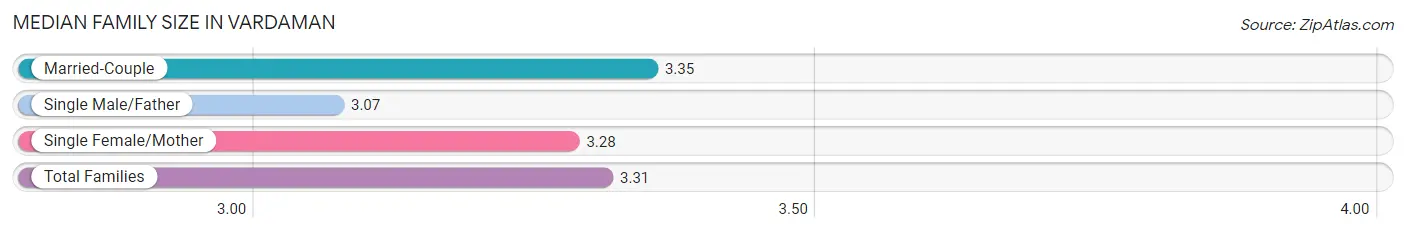
| Family Type | # Families | Family Size |
| Married-Couple | 150 (65.2%) | 3.35 |
| Single Male/Father | 15 (6.5%) | 3.07 |
| Single Female/Mother | 65 (28.3%) | 3.28 |
| Total Families | 230 (100.0%) | 3.31 |
Median Household Size in Vardaman
The median household size in Vardaman is 2.67 persons per household, with single male/father households (15 | 4.2%) accounting for the largest median household size of 3.53 persons per household. non-family households (126 | 35.4%) represent the smallest median household size with 1.33 persons per household.
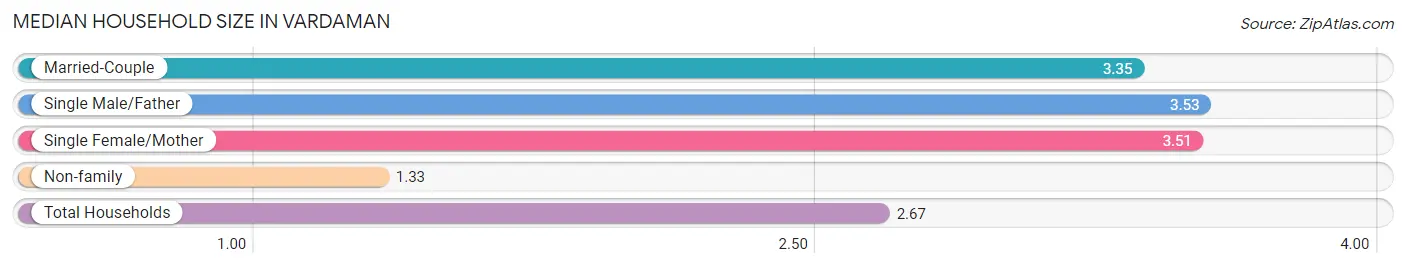
| Household Type | # Households | Household Size |
| Married-Couple | 150 (42.1%) | 3.35 |
| Single Male/Father | 15 (4.2%) | 3.53 |
| Single Female/Mother | 65 (18.3%) | 3.51 |
| Non-family | 126 (35.4%) | 1.33 |
| Total Households | 356 (100.0%) | 2.67 |
Household Size by Marriage Status in Vardaman
Out of a total of 356 households in Vardaman, 230 (64.6%) are family households, while 126 (35.4%) are nonfamily households. The most numerous type of family households are 2-person households, comprising 97, and the most common type of nonfamily households are 1-person households, comprising 110.
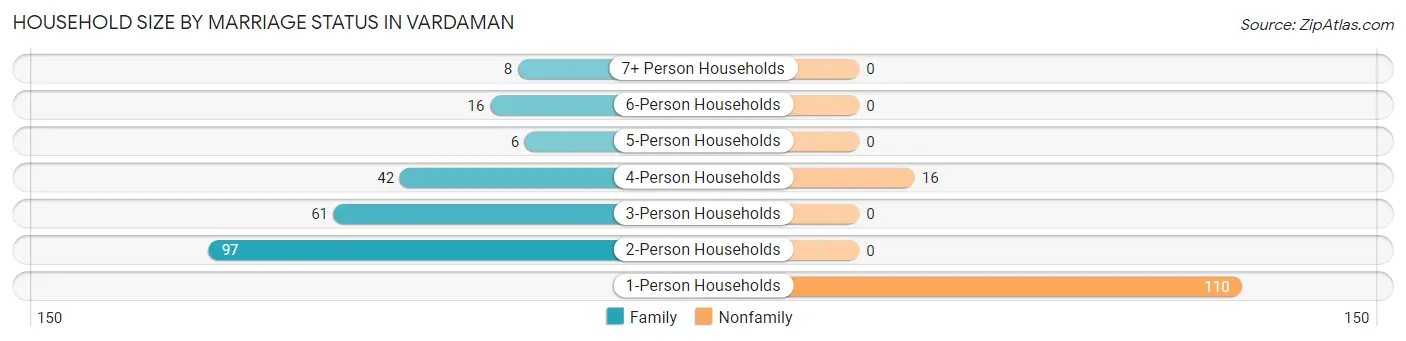
| Household Size | Family Households | Nonfamily Households |
| 1-Person Households | - | 110 (30.9%) |
| 2-Person Households | 97 (27.3%) | 0 (0.0%) |
| 3-Person Households | 61 (17.1%) | 0 (0.0%) |
| 4-Person Households | 42 (11.8%) | 16 (4.5%) |
| 5-Person Households | 6 (1.7%) | 0 (0.0%) |
| 6-Person Households | 16 (4.5%) | 0 (0.0%) |
| 7+ Person Households | 8 (2.2%) | 0 (0.0%) |
| Total | 230 (64.6%) | 126 (35.4%) |
Female Fertility in Vardaman
Fertility by Age in Vardaman
Average fertility rate in Vardaman is 24.0 births per 1,000 women. Women in the age bracket of 20 to 34 years have the highest fertility rate with 47.0 births per 1,000 women. Women in the age bracket of 20 to 34 years acount for 100.0% of all women with births.
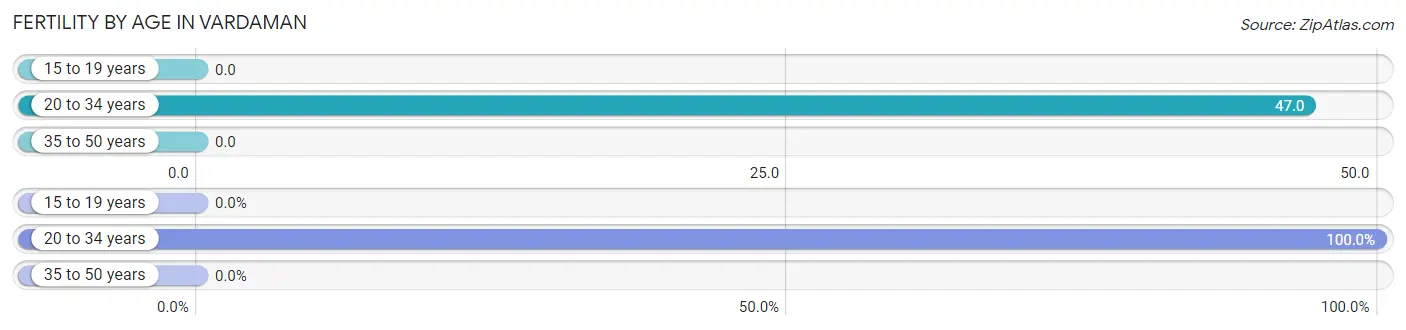
| Age Bracket | Women with Births | Births / 1,000 Women |
| 15 to 19 years | 0 (0.0%) | 0.0 |
| 20 to 34 years | 6 (100.0%) | 47.0 |
| 35 to 50 years | 0 (0.0%) | 0.0 |
| Total | 6 (100.0%) | 24.0 |
Fertility by Age by Marriage Status in Vardaman
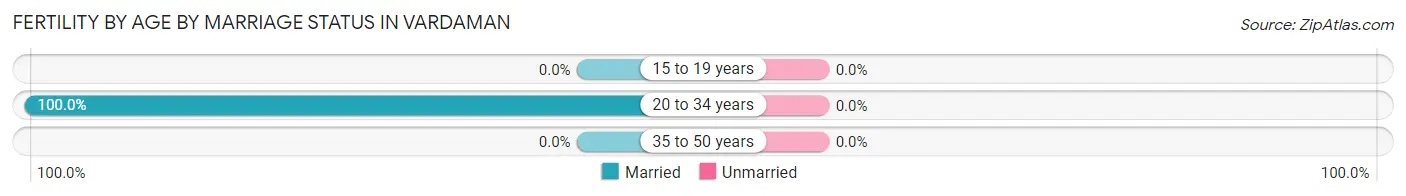
| Age Bracket | Married | Unmarried |
| 15 to 19 years | 0 (0.0%) | 0 (0.0%) |
| 20 to 34 years | 6 (100.0%) | 0 (0.0%) |
| 35 to 50 years | 0 (0.0%) | 0 (0.0%) |
| Total | 6 (100.0%) | 0 (0.0%) |
Fertility by Education in Vardaman
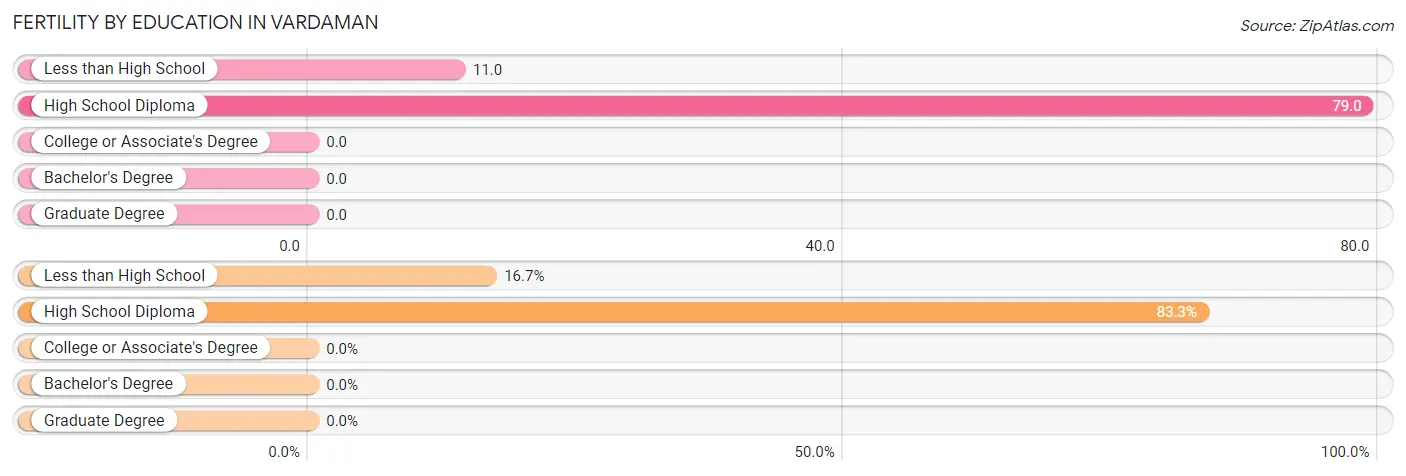
| Educational Attainment | Women with Births | Births / 1,000 Women |
| Less than High School | 1 (16.7%) | 11.0 |
| High School Diploma | 5 (83.3%) | 79.0 |
| College or Associate's Degree | 0 (0.0%) | 0.0 |
| Bachelor's Degree | 0 (0.0%) | 0.0 |
| Graduate Degree | 0 (0.0%) | 0.0 |
| Total | 6 (100.0%) | 24.0 |
Fertility by Education by Marriage Status in Vardaman
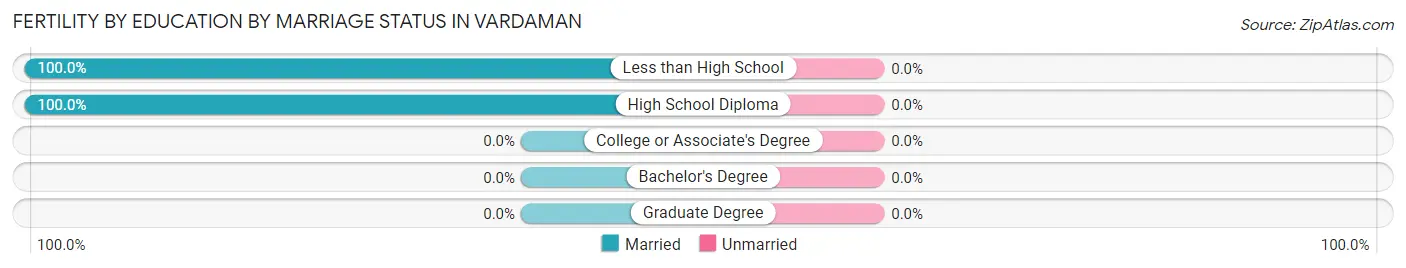
| Educational Attainment | Married | Unmarried |
| Less than High School | 1 (100.0%) | 0 (0.0%) |
| High School Diploma | 5 (100.0%) | 0 (0.0%) |
| College or Associate's Degree | 0 (0.0%) | 0 (0.0%) |
| Bachelor's Degree | 0 (0.0%) | 0 (0.0%) |
| Graduate Degree | 0 (0.0%) | 0 (0.0%) |
| Total | 6 (100.0%) | 0 (0.0%) |
Employment Characteristics in Vardaman
Employment by Class of Employer in Vardaman
Among the 377 employed individuals in Vardaman, private company employees (319 | 84.6%), self-employed (not incorporated) (21 | 5.6%), and federal government employees (13 | 3.5%) make up the most common classes of employment.
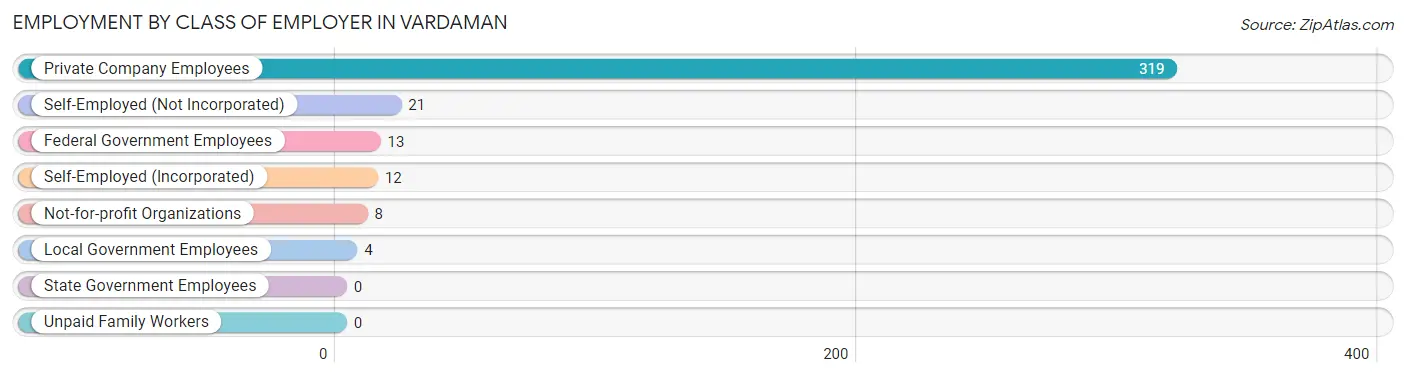
| Employer Class | # Employees | % Employees |
| Private Company Employees | 319 | 84.6% |
| Self-Employed (Incorporated) | 12 | 3.2% |
| Self-Employed (Not Incorporated) | 21 | 5.6% |
| Not-for-profit Organizations | 8 | 2.1% |
| Local Government Employees | 4 | 1.1% |
| State Government Employees | 0 | 0.0% |
| Federal Government Employees | 13 | 3.5% |
| Unpaid Family Workers | 0 | 0.0% |
| Total | 377 | 100.0% |
Employment Status by Age in Vardaman
According to the labor force statistics for Vardaman, out of the total population over 16 years of age (732), 56.4% or 413 individuals are in the labor force, with 2.9% or 12 of them unemployed. The age group with the highest labor force participation rate is 20 to 24 years, with 100.0% or 69 individuals in the labor force. Within the labor force, the 25 to 29 years age range has the highest percentage of unemployed individuals, with 16.7% or 7 of them being unemployed.
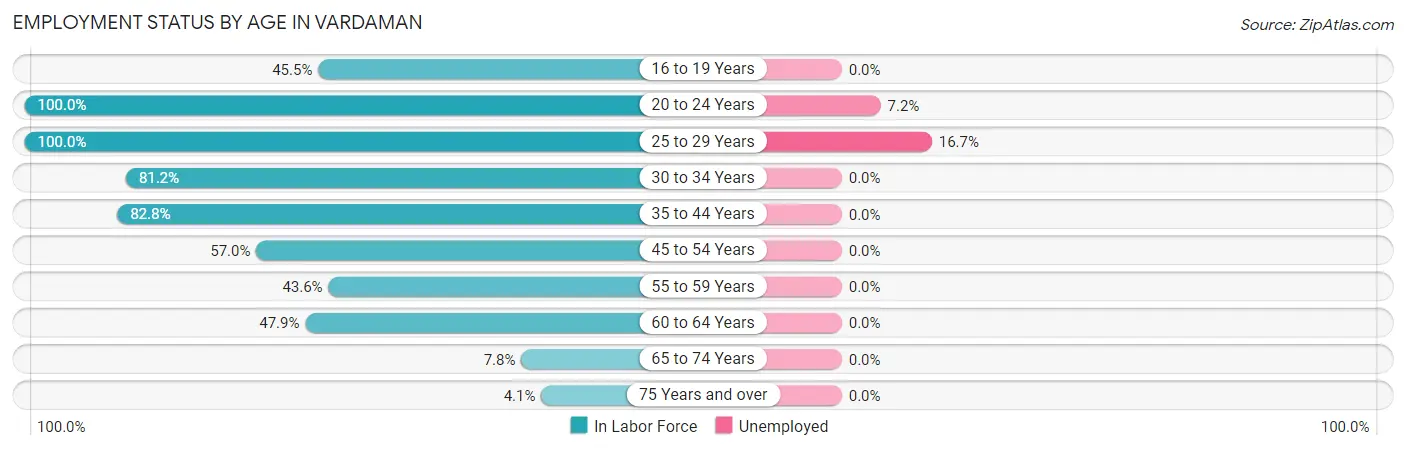
| Age Bracket | In Labor Force | Unemployed |
| 16 to 19 Years | 30 (45.5%) | 0 (0.0%) |
| 20 to 24 Years | 69 (100.0%) | 5 (7.2%) |
| 25 to 29 Years | 42 (100.0%) | 7 (16.7%) |
| 30 to 34 Years | 95 (81.2%) | 0 (0.0%) |
| 35 to 44 Years | 48 (82.8%) | 0 (0.0%) |
| 45 to 54 Years | 53 (57.0%) | 0 (0.0%) |
| 55 to 59 Years | 34 (43.6%) | 0 (0.0%) |
| 60 to 64 Years | 34 (47.9%) | 0 (0.0%) |
| 65 to 74 Years | 5 (7.8%) | 0 (0.0%) |
| 75 Years and over | 3 (4.1%) | 0 (0.0%) |
| Total | 413 (56.4%) | 12 (2.9%) |
Employment Status by Educational Attainment in Vardaman
According to labor force statistics for Vardaman, 66.7% of individuals (306) out of the total population between 25 and 64 years of age (459) are in the labor force, with 2.3% or 7 of them being unemployed. The group with the highest labor force participation rate are those with the educational attainment of bachelor's degree or higher, with 100.0% or 7 individuals in the labor force. Within the labor force, individuals with high school diploma education have the highest percentage of unemployment, with 4.8% or 7 of them being unemployed.
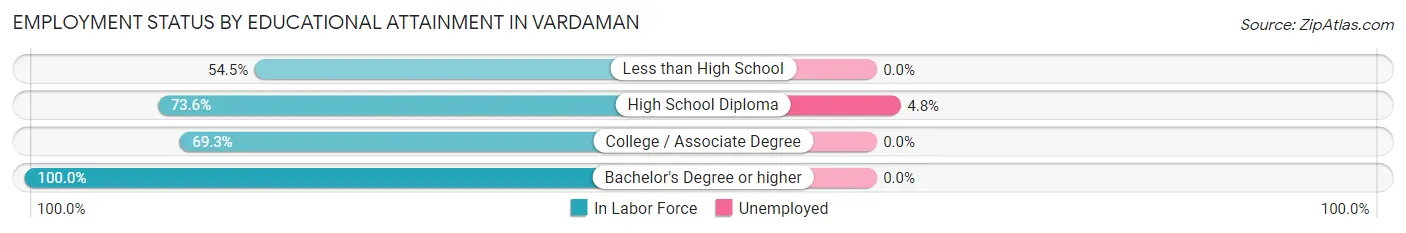
| Educational Attainment | In Labor Force | Unemployed |
| Less than High School | 84 (54.5%) | 0 (0.0%) |
| High School Diploma | 145 (73.6%) | 9 (4.8%) |
| College / Associate Degree | 70 (69.3%) | 0 (0.0%) |
| Bachelor's Degree or higher | 7 (100.0%) | 0 (0.0%) |
| Total | 306 (66.7%) | 11 (2.3%) |
Employment Occupations by Sex in Vardaman
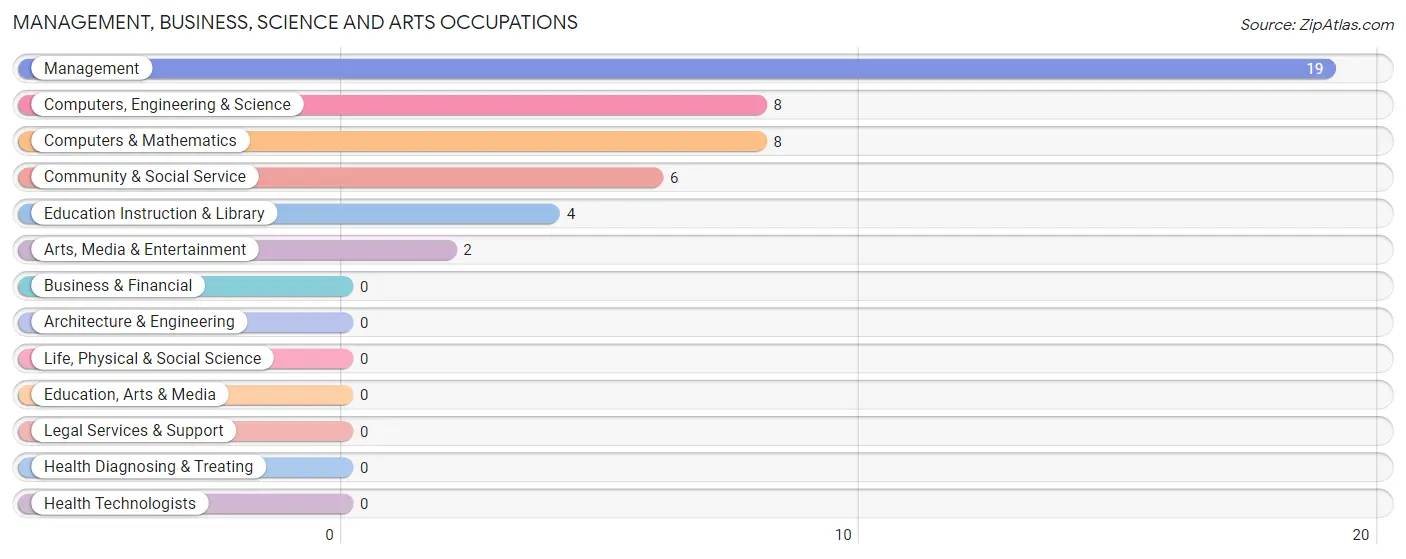
Management, Business, Science and Arts Occupations
The most common Management, Business, Science and Arts occupations in Vardaman are Management (19 | 4.7%), Computers, Engineering & Science (8 | 2.0%), Computers & Mathematics (8 | 2.0%), Community & Social Service (6 | 1.5%), and Education Instruction & Library (4 | 1.0%).
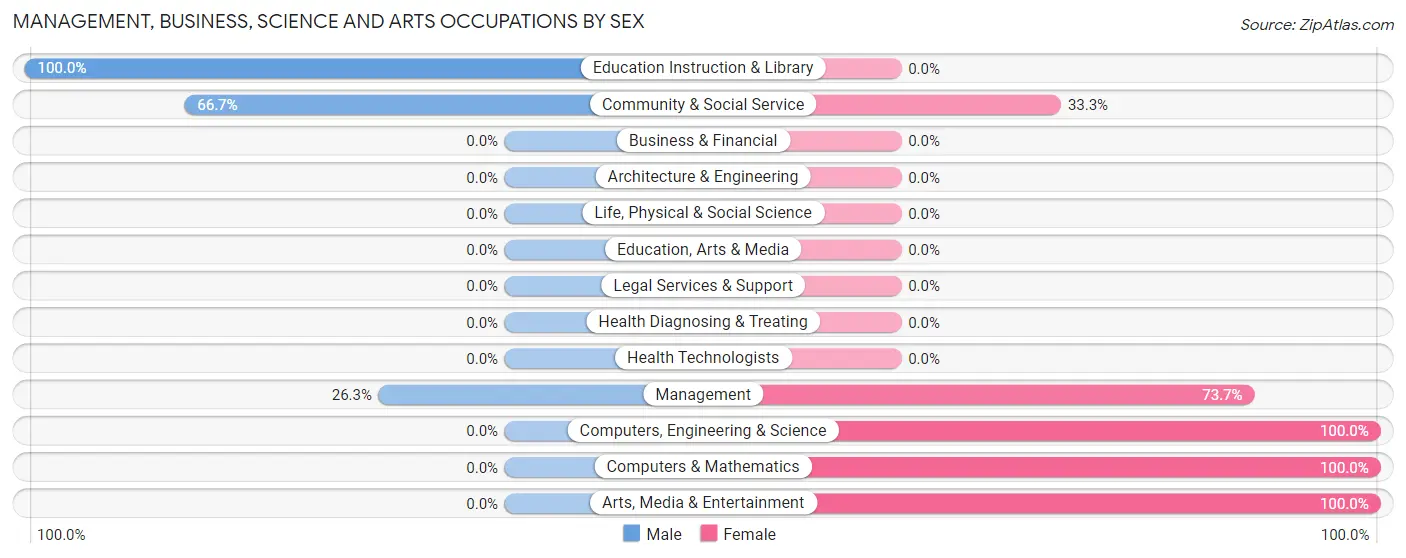
Management, Business, Science and Arts Occupations by Sex
Within the Management, Business, Science and Arts occupations in Vardaman, the most male-oriented occupations are Education Instruction & Library (100.0%), Community & Social Service (66.7%), and Management (26.3%), while the most female-oriented occupations are Computers, Engineering & Science (100.0%), Computers & Mathematics (100.0%), and Arts, Media & Entertainment (100.0%).
| Occupation | Male | Female |
| Management | 5 (26.3%) | 14 (73.7%) |
| Business & Financial | 0 (0.0%) | 0 (0.0%) |
| Computers, Engineering & Science | 0 (0.0%) | 8 (100.0%) |
| Computers & Mathematics | 0 (0.0%) | 8 (100.0%) |
| Architecture & Engineering | 0 (0.0%) | 0 (0.0%) |
| Life, Physical & Social Science | 0 (0.0%) | 0 (0.0%) |
| Community & Social Service | 4 (66.7%) | 2 (33.3%) |
| Education, Arts & Media | 0 (0.0%) | 0 (0.0%) |
| Legal Services & Support | 0 (0.0%) | 0 (0.0%) |
| Education Instruction & Library | 4 (100.0%) | 0 (0.0%) |
| Arts, Media & Entertainment | 0 (0.0%) | 2 (100.0%) |
| Health Diagnosing & Treating | 0 (0.0%) | 0 (0.0%) |
| Health Technologists | 0 (0.0%) | 0 (0.0%) |
| Total (Category) | 9 (27.3%) | 24 (72.7%) |
| Total (Overall) | 166 (41.4%) | 235 (58.6%) |
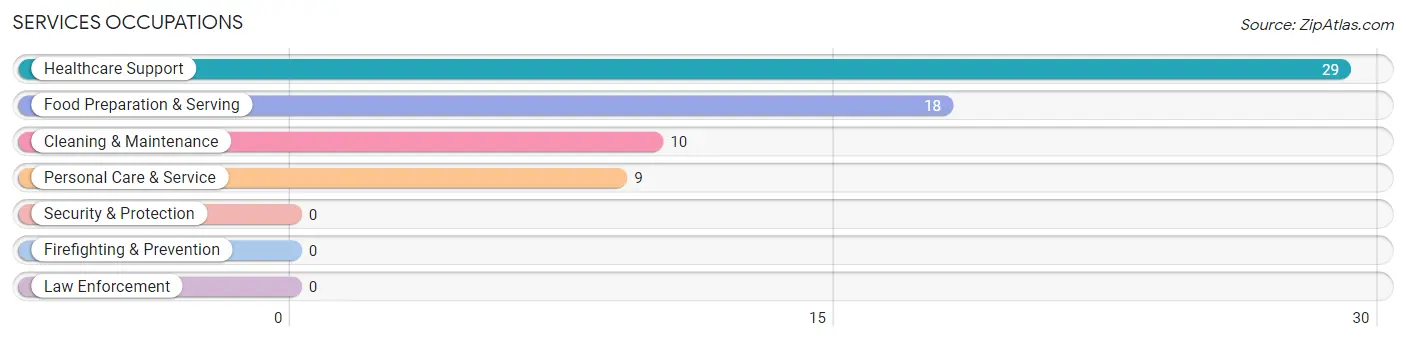
Services Occupations
The most common Services occupations in Vardaman are Healthcare Support (29 | 7.2%), Food Preparation & Serving (18 | 4.5%), Cleaning & Maintenance (10 | 2.5%), and Personal Care & Service (9 | 2.2%).
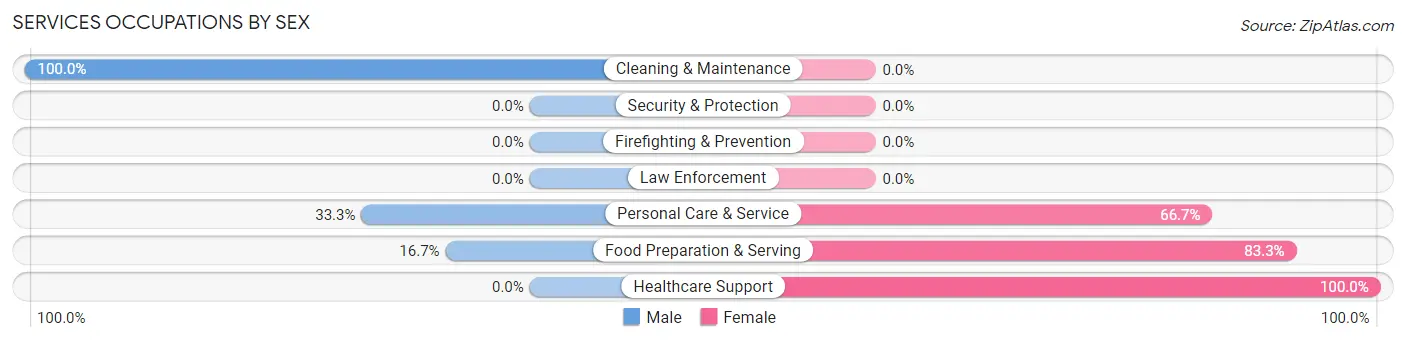
Services Occupations by Sex
Within the Services occupations in Vardaman, the most male-oriented occupations are Cleaning & Maintenance (100.0%), Personal Care & Service (33.3%), and Food Preparation & Serving (16.7%), while the most female-oriented occupations are Healthcare Support (100.0%), Food Preparation & Serving (83.3%), and Personal Care & Service (66.7%).
| Occupation | Male | Female |
| Healthcare Support | 0 (0.0%) | 29 (100.0%) |
| Security & Protection | 0 (0.0%) | 0 (0.0%) |
| Firefighting & Prevention | 0 (0.0%) | 0 (0.0%) |
| Law Enforcement | 0 (0.0%) | 0 (0.0%) |
| Food Preparation & Serving | 3 (16.7%) | 15 (83.3%) |
| Cleaning & Maintenance | 10 (100.0%) | 0 (0.0%) |
| Personal Care & Service | 3 (33.3%) | 6 (66.7%) |
| Total (Category) | 16 (24.2%) | 50 (75.8%) |
| Total (Overall) | 166 (41.4%) | 235 (58.6%) |
Sales and Office Occupations
The most common Sales and Office occupations in Vardaman are Office & Administration (40 | 10.0%), and Sales & Related (32 | 8.0%).
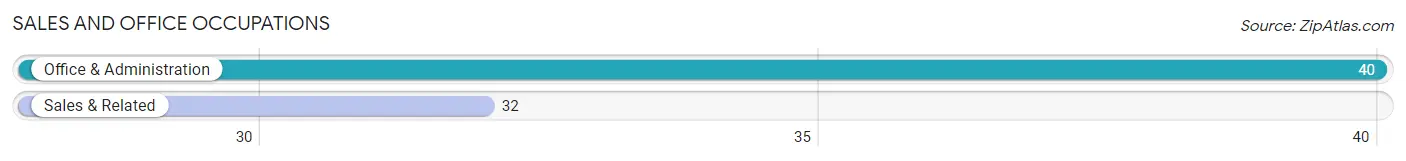
Sales and Office Occupations by Sex
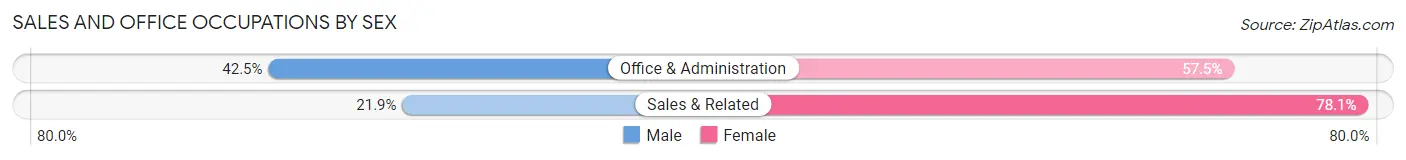
| Occupation | Male | Female |
| Sales & Related | 7 (21.9%) | 25 (78.1%) |
| Office & Administration | 17 (42.5%) | 23 (57.5%) |
| Total (Category) | 24 (33.3%) | 48 (66.7%) |
| Total (Overall) | 166 (41.4%) | 235 (58.6%) |
Natural Resources, Construction and Maintenance Occupations
The most common Natural Resources, Construction and Maintenance occupations in Vardaman are Farming, Fishing & Forestry (59 | 14.7%), and Construction & Extraction (8 | 2.0%).
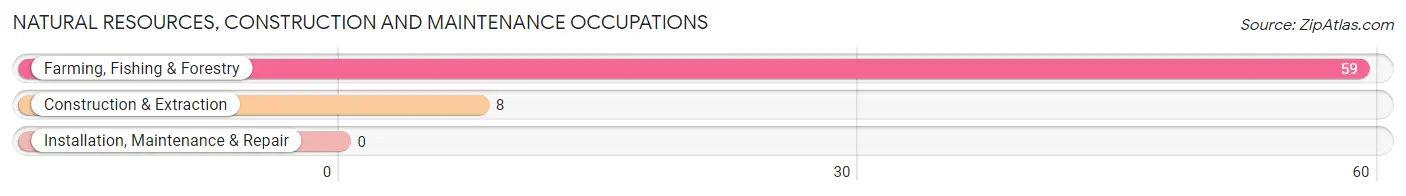
Natural Resources, Construction and Maintenance Occupations by Sex
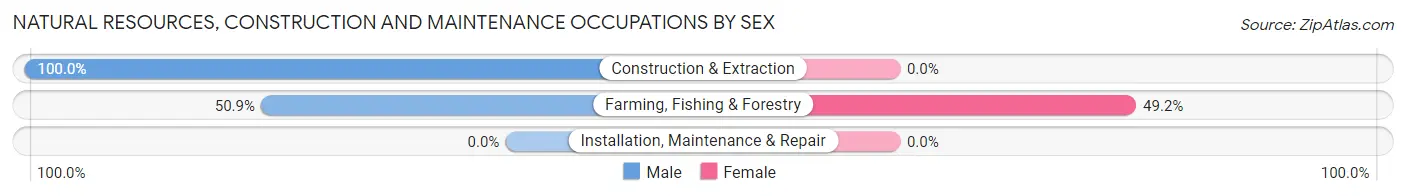
| Occupation | Male | Female |
| Farming, Fishing & Forestry | 30 (50.8%) | 29 (49.1%) |
| Construction & Extraction | 8 (100.0%) | 0 (0.0%) |
| Installation, Maintenance & Repair | 0 (0.0%) | 0 (0.0%) |
| Total (Category) | 38 (56.7%) | 29 (43.3%) |
| Total (Overall) | 166 (41.4%) | 235 (58.6%) |
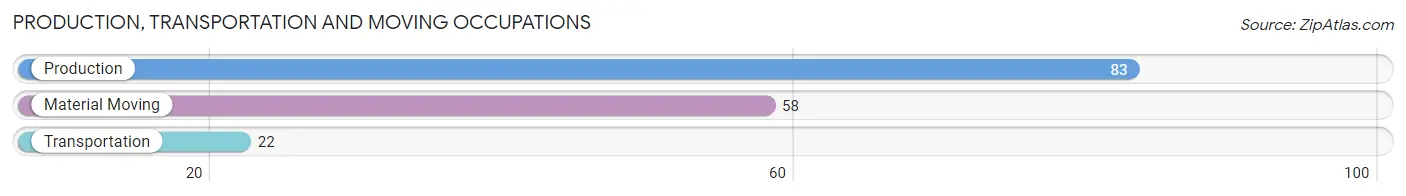
Production, Transportation and Moving Occupations
The most common Production, Transportation and Moving occupations in Vardaman are Production (83 | 20.7%), Material Moving (58 | 14.5%), and Transportation (22 | 5.5%).
Production, Transportation and Moving Occupations by Sex
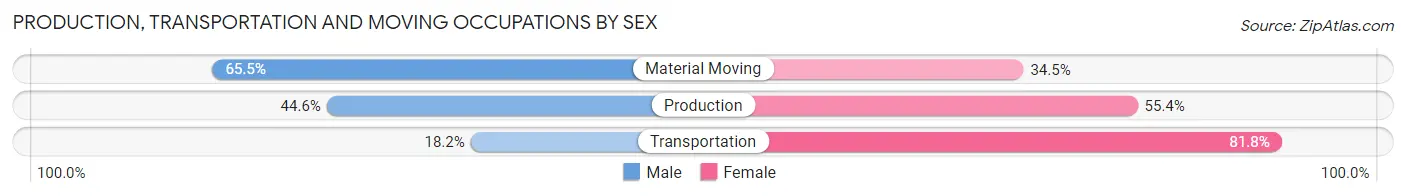
| Occupation | Male | Female |
| Production | 37 (44.6%) | 46 (55.4%) |
| Transportation | 4 (18.2%) | 18 (81.8%) |
| Material Moving | 38 (65.5%) | 20 (34.5%) |
| Total (Category) | 79 (48.5%) | 84 (51.5%) |
| Total (Overall) | 166 (41.4%) | 235 (58.6%) |
Employment Industries by Sex in Vardaman
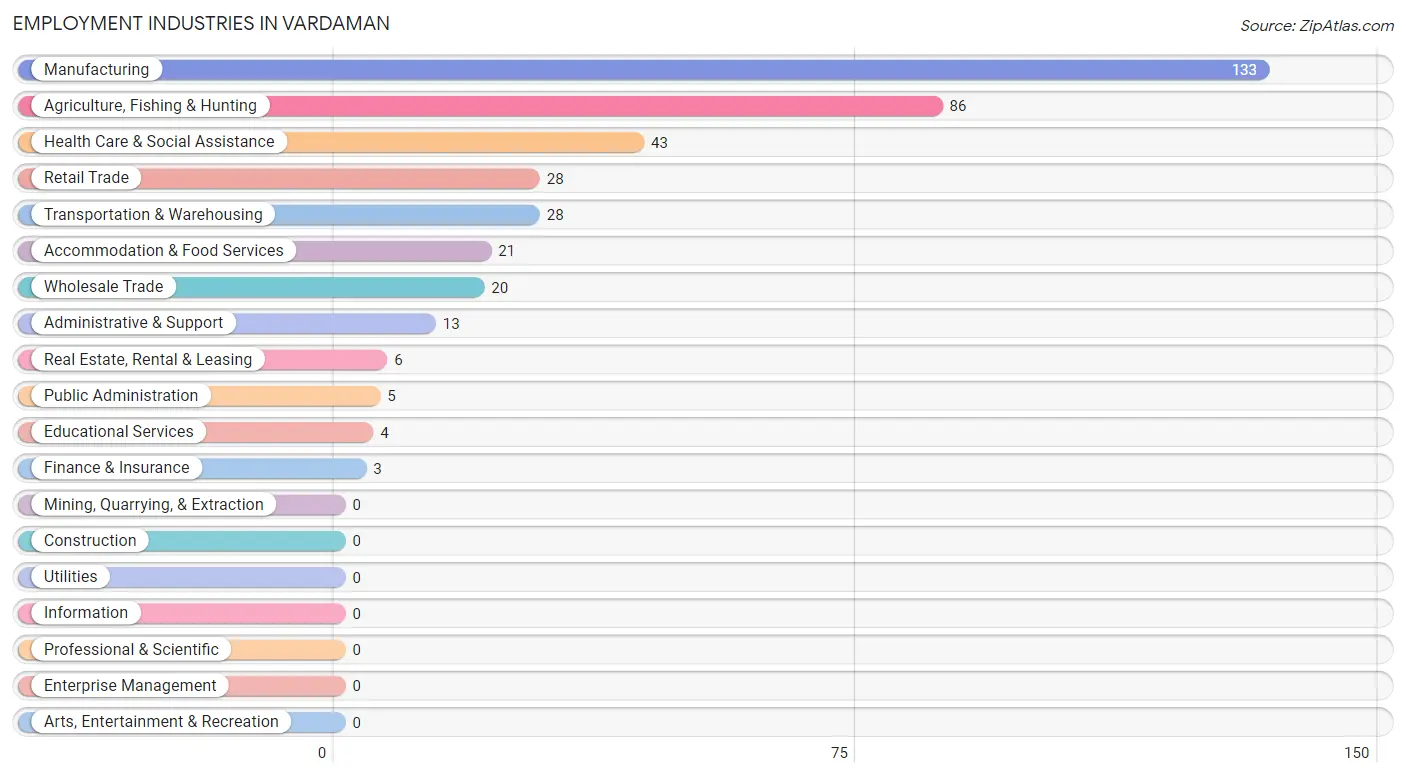
Employment Industries in Vardaman
The major employment industries in Vardaman include Manufacturing (133 | 33.2%), Agriculture, Fishing & Hunting (86 | 21.4%), Health Care & Social Assistance (43 | 10.7%), Retail Trade (28 | 7.0%), and Transportation & Warehousing (28 | 7.0%).
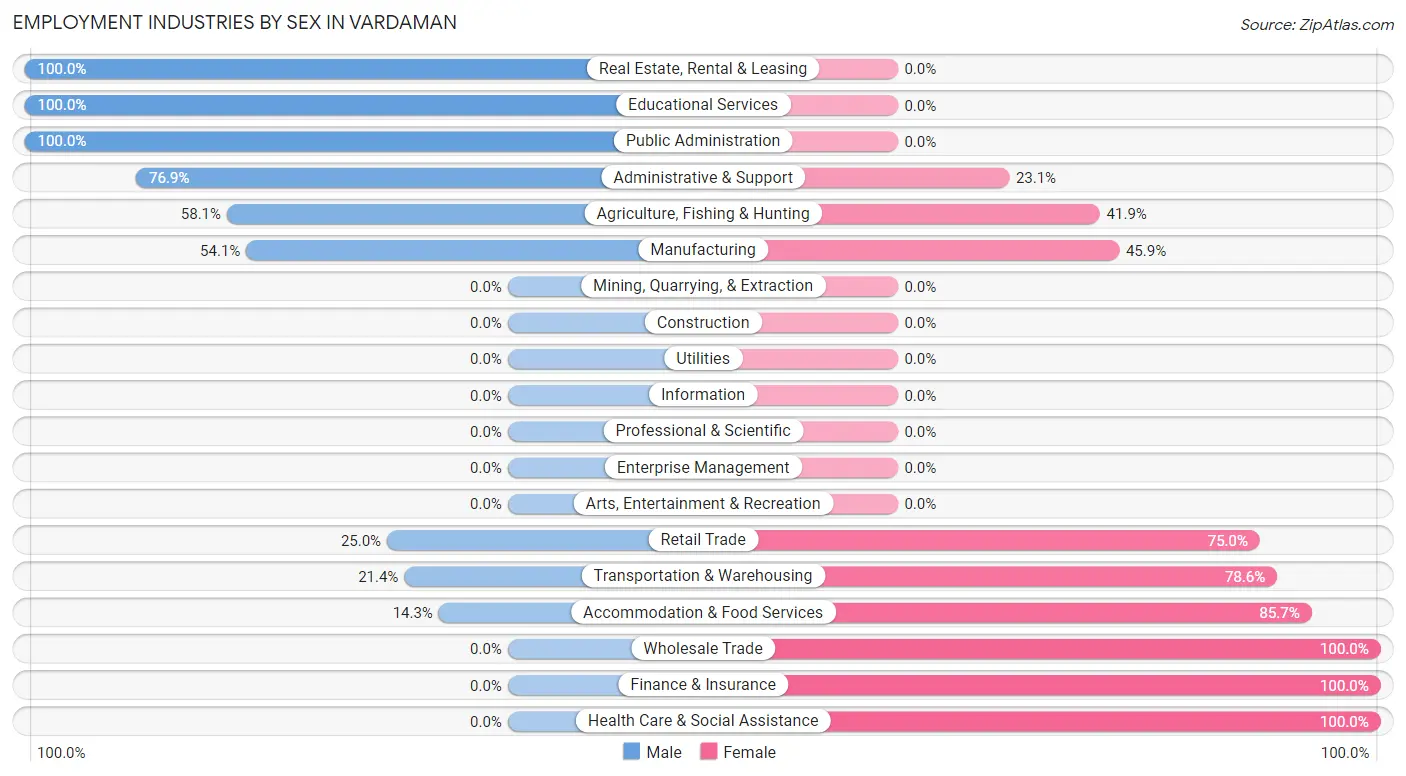
Employment Industries by Sex in Vardaman
The Vardaman industries that see more men than women are Real Estate, Rental & Leasing (100.0%), Educational Services (100.0%), and Public Administration (100.0%), whereas the industries that tend to have a higher number of women are Wholesale Trade (100.0%), Finance & Insurance (100.0%), and Health Care & Social Assistance (100.0%).
| Industry | Male | Female |
| Agriculture, Fishing & Hunting | 50 (58.1%) | 36 (41.9%) |
| Mining, Quarrying, & Extraction | 0 (0.0%) | 0 (0.0%) |
| Construction | 0 (0.0%) | 0 (0.0%) |
| Manufacturing | 72 (54.1%) | 61 (45.9%) |
| Wholesale Trade | 0 (0.0%) | 20 (100.0%) |
| Retail Trade | 7 (25.0%) | 21 (75.0%) |
| Transportation & Warehousing | 6 (21.4%) | 22 (78.6%) |
| Utilities | 0 (0.0%) | 0 (0.0%) |
| Information | 0 (0.0%) | 0 (0.0%) |
| Finance & Insurance | 0 (0.0%) | 3 (100.0%) |
| Real Estate, Rental & Leasing | 6 (100.0%) | 0 (0.0%) |
| Professional & Scientific | 0 (0.0%) | 0 (0.0%) |
| Enterprise Management | 0 (0.0%) | 0 (0.0%) |
| Administrative & Support | 10 (76.9%) | 3 (23.1%) |
| Educational Services | 4 (100.0%) | 0 (0.0%) |
| Health Care & Social Assistance | 0 (0.0%) | 43 (100.0%) |
| Arts, Entertainment & Recreation | 0 (0.0%) | 0 (0.0%) |
| Accommodation & Food Services | 3 (14.3%) | 18 (85.7%) |
| Public Administration | 5 (100.0%) | 0 (0.0%) |
| Total | 166 (41.4%) | 235 (58.6%) |
Education in Vardaman
School Enrollment in Vardaman
The most common levels of schooling among the 214 students in Vardaman are middle school (59 | 27.6%), elementary school (58 | 27.1%), and high school (57 | 26.6%).
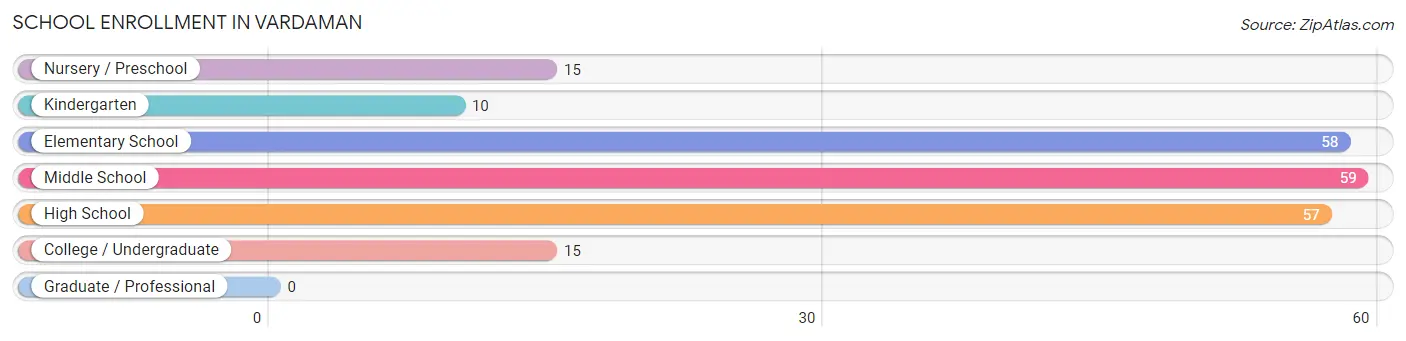
| School Level | # Students | % Students |
| Nursery / Preschool | 15 | 7.0% |
| Kindergarten | 10 | 4.7% |
| Elementary School | 58 | 27.1% |
| Middle School | 59 | 27.6% |
| High School | 57 | 26.6% |
| College / Undergraduate | 15 | 7.0% |
| Graduate / Professional | 0 | 0.0% |
| Total | 214 | 100.0% |
School Enrollment by Age by Funding Source in Vardaman
Out of a total of 214 students who are enrolled in schools in Vardaman, 11 (5.1%) attend a private institution, while the remaining 203 (94.9%) are enrolled in public schools. The age group of 18 to 19 year olds has the highest likelihood of being enrolled in private schools, with 3 (21.4% in the age bracket) enrolled. Conversely, the age group of 3 to 4 year olds has the lowest likelihood of being enrolled in a private school, with 2 (100.0% in the age bracket) attending a public institution.
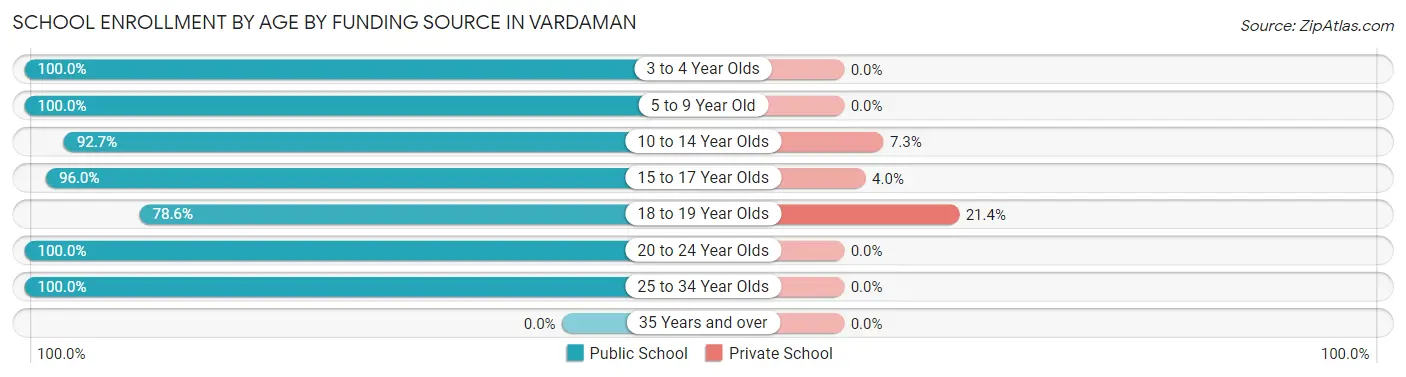
| Age Bracket | Public School | Private School |
| 3 to 4 Year Olds | 2 (100.0%) | 0 (0.0%) |
| 5 to 9 Year Old | 59 (100.0%) | 0 (0.0%) |
| 10 to 14 Year Olds | 76 (92.7%) | 6 (7.3%) |
| 15 to 17 Year Olds | 48 (96.0%) | 2 (4.0%) |
| 18 to 19 Year Olds | 11 (78.6%) | 3 (21.4%) |
| 20 to 24 Year Olds | 3 (100.0%) | 0 (0.0%) |
| 25 to 34 Year Olds | 4 (100.0%) | 0 (0.0%) |
| 35 Years and over | 0 (0.0%) | 0 (0.0%) |
| Total | 203 (94.9%) | 11 (5.1%) |
Educational Attainment by Field of Study in Vardaman
Business (13 | 27.7%), education (13 | 27.7%), science & technology (11 | 23.4%), and arts & humanities (10 | 21.3%) are the most common fields of study among 47 individuals in Vardaman who have obtained a bachelor's degree or higher.
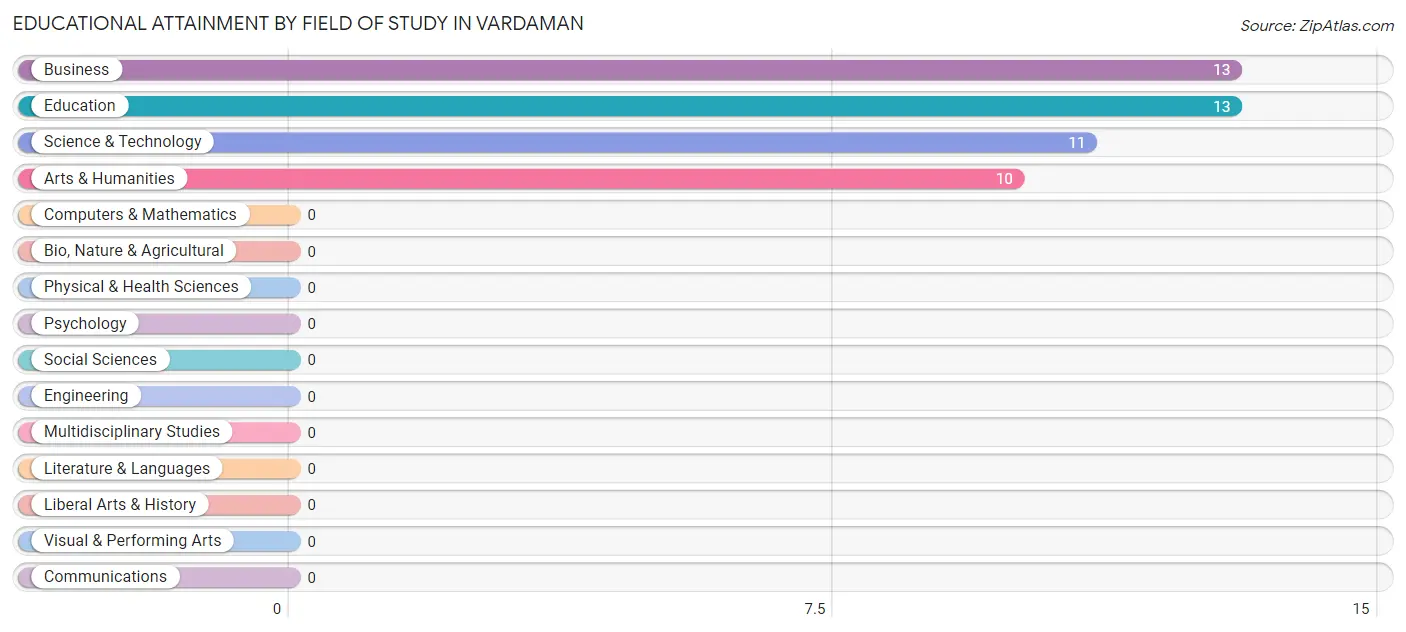
| Field of Study | # Graduates | % Graduates |
| Computers & Mathematics | 0 | 0.0% |
| Bio, Nature & Agricultural | 0 | 0.0% |
| Physical & Health Sciences | 0 | 0.0% |
| Psychology | 0 | 0.0% |
| Social Sciences | 0 | 0.0% |
| Engineering | 0 | 0.0% |
| Multidisciplinary Studies | 0 | 0.0% |
| Science & Technology | 11 | 23.4% |
| Business | 13 | 27.7% |
| Education | 13 | 27.7% |
| Literature & Languages | 0 | 0.0% |
| Liberal Arts & History | 0 | 0.0% |
| Visual & Performing Arts | 0 | 0.0% |
| Communications | 0 | 0.0% |
| Arts & Humanities | 10 | 21.3% |
| Total | 47 | 100.0% |
Transportation & Commute in Vardaman
Vehicle Availability by Sex in Vardaman
The most prevalent vehicle ownership categories in Vardaman are males with 3 vehicles (36, accounting for 22.4%) and females with 3 vehicles (52, making up 16.7%).
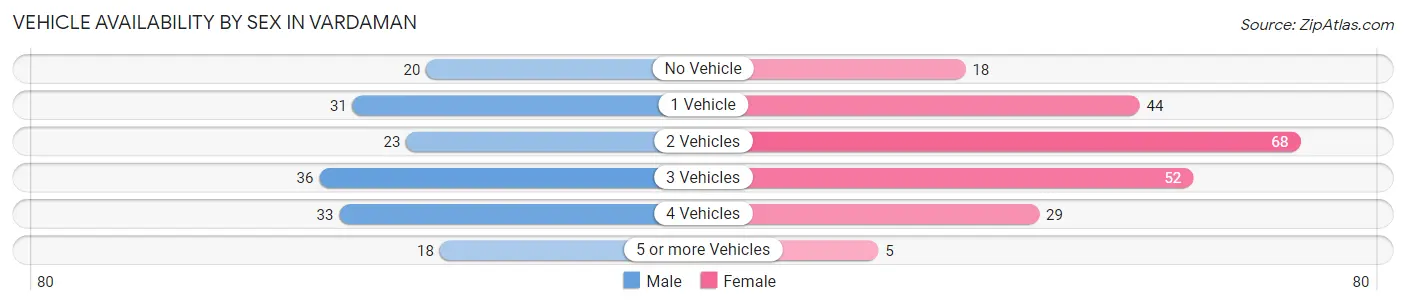
| Vehicles Available | Male | Female |
| No Vehicle | 20 (12.4%) | 18 (8.3%) |
| 1 Vehicle | 31 (19.3%) | 44 (20.4%) |
| 2 Vehicles | 23 (14.3%) | 68 (31.5%) |
| 3 Vehicles | 36 (22.4%) | 52 (24.1%) |
| 4 Vehicles | 33 (20.5%) | 29 (13.4%) |
| 5 or more Vehicles | 18 (11.2%) | 5 (2.3%) |
| Total | 161 (100.0%) | 216 (100.0%) |
Commute Time in Vardaman
The most frequently occuring commute durations in Vardaman are 10 to 14 minutes (135 commuters, 36.3%), 15 to 19 minutes (66 commuters, 17.7%), and 20 to 24 minutes (50 commuters, 13.4%).
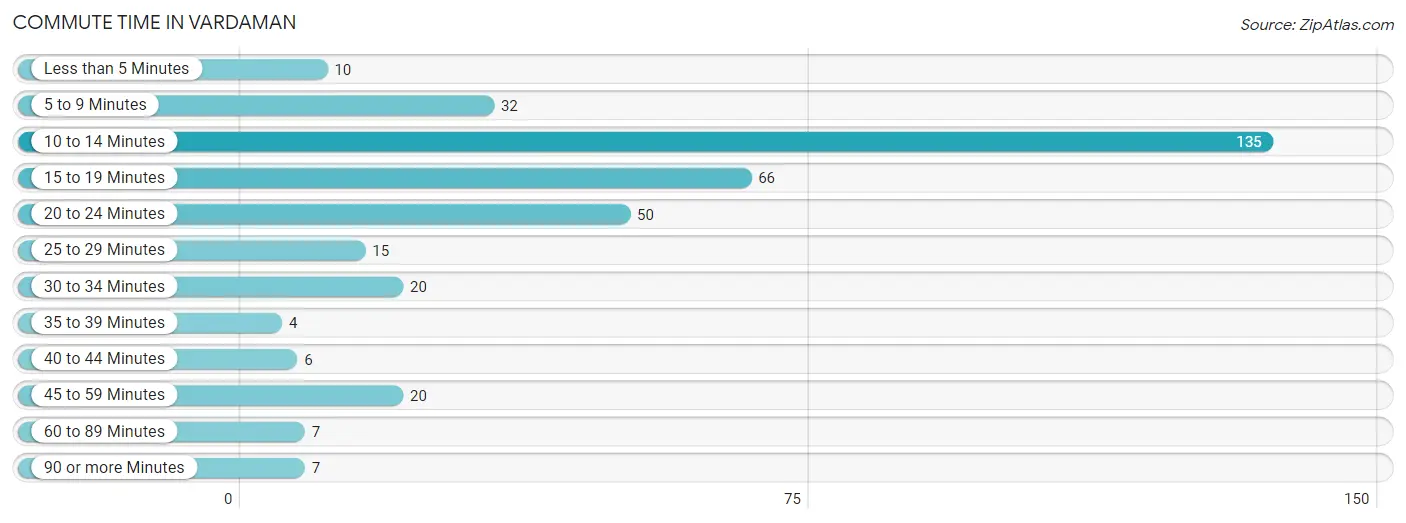
| Commute Time | # Commuters | % Commuters |
| Less than 5 Minutes | 10 | 2.7% |
| 5 to 9 Minutes | 32 | 8.6% |
| 10 to 14 Minutes | 135 | 36.3% |
| 15 to 19 Minutes | 66 | 17.7% |
| 20 to 24 Minutes | 50 | 13.4% |
| 25 to 29 Minutes | 15 | 4.0% |
| 30 to 34 Minutes | 20 | 5.4% |
| 35 to 39 Minutes | 4 | 1.1% |
| 40 to 44 Minutes | 6 | 1.6% |
| 45 to 59 Minutes | 20 | 5.4% |
| 60 to 89 Minutes | 7 | 1.9% |
| 90 or more Minutes | 7 | 1.9% |
Commute Time by Sex in Vardaman
The most common commute times in Vardaman are 10 to 14 minutes (74 commuters, 46.0%) for males and 10 to 14 minutes (61 commuters, 28.9%) for females.
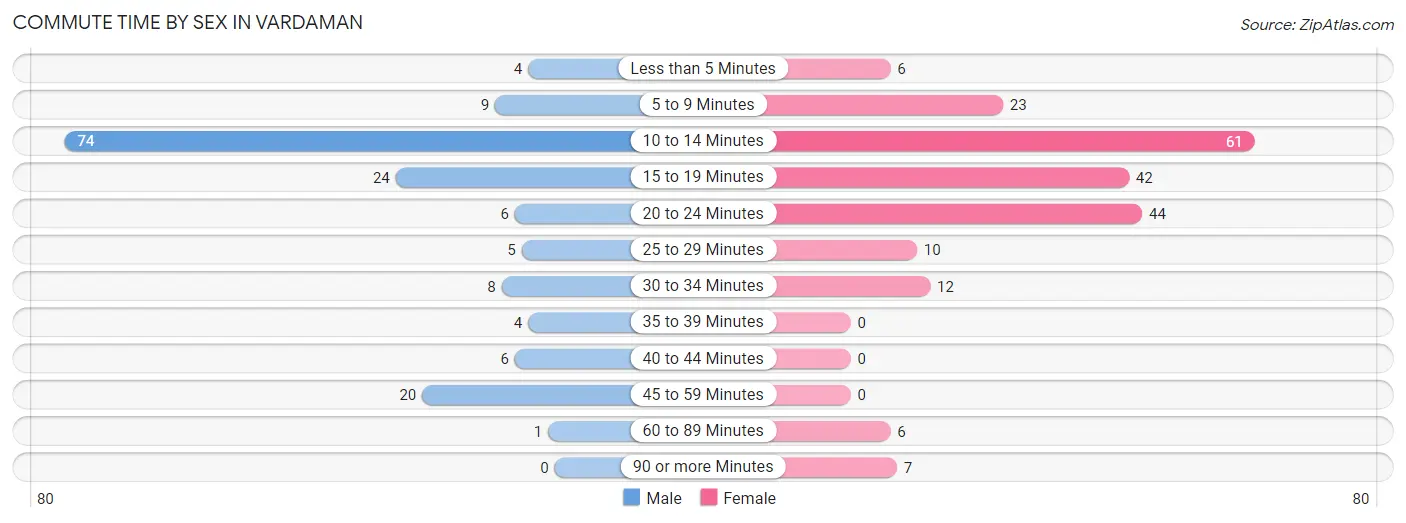
| Commute Time | Male | Female |
| Less than 5 Minutes | 4 (2.5%) | 6 (2.8%) |
| 5 to 9 Minutes | 9 (5.6%) | 23 (10.9%) |
| 10 to 14 Minutes | 74 (46.0%) | 61 (28.9%) |
| 15 to 19 Minutes | 24 (14.9%) | 42 (19.9%) |
| 20 to 24 Minutes | 6 (3.7%) | 44 (20.8%) |
| 25 to 29 Minutes | 5 (3.1%) | 10 (4.7%) |
| 30 to 34 Minutes | 8 (5.0%) | 12 (5.7%) |
| 35 to 39 Minutes | 4 (2.5%) | 0 (0.0%) |
| 40 to 44 Minutes | 6 (3.7%) | 0 (0.0%) |
| 45 to 59 Minutes | 20 (12.4%) | 0 (0.0%) |
| 60 to 89 Minutes | 1 (0.6%) | 6 (2.8%) |
| 90 or more Minutes | 0 (0.0%) | 7 (3.3%) |
Time of Departure to Work by Sex in Vardaman
The most frequent times of departure to work in Vardaman are 6:00 AM to 6:29 AM (78, 48.4%) for males and 6:00 AM to 6:29 AM (62, 29.4%) for females.
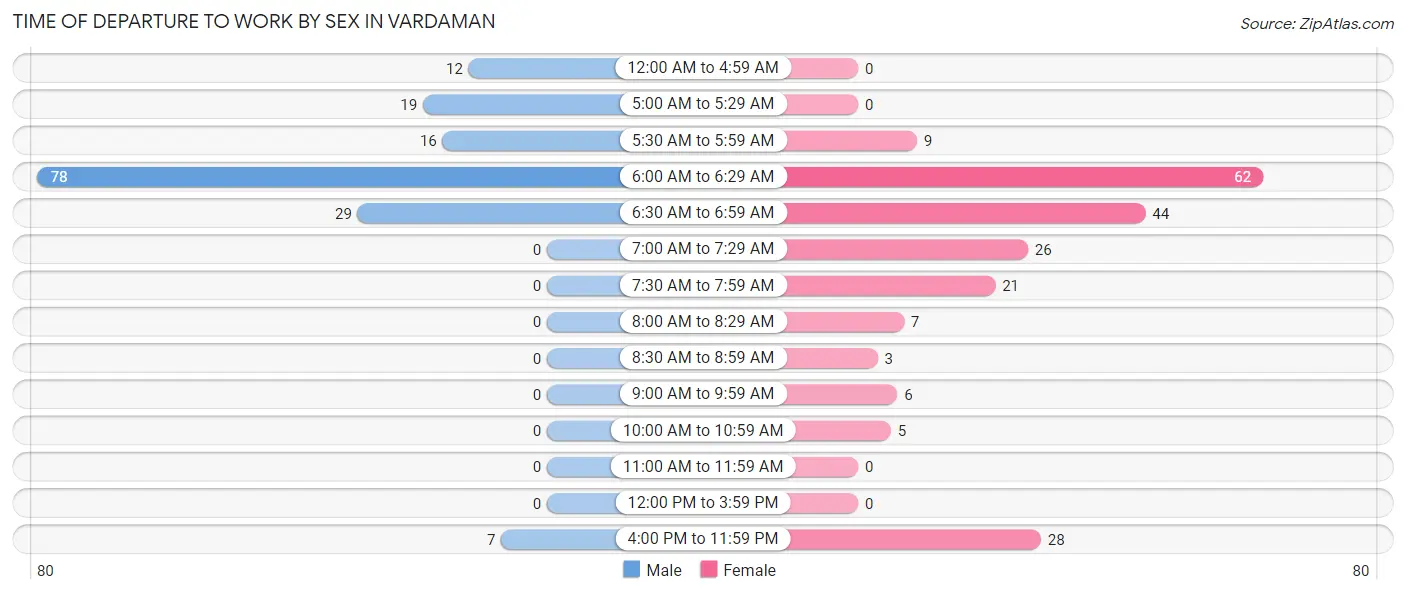
| Time of Departure | Male | Female |
| 12:00 AM to 4:59 AM | 12 (7.4%) | 0 (0.0%) |
| 5:00 AM to 5:29 AM | 19 (11.8%) | 0 (0.0%) |
| 5:30 AM to 5:59 AM | 16 (9.9%) | 9 (4.3%) |
| 6:00 AM to 6:29 AM | 78 (48.4%) | 62 (29.4%) |
| 6:30 AM to 6:59 AM | 29 (18.0%) | 44 (20.8%) |
| 7:00 AM to 7:29 AM | 0 (0.0%) | 26 (12.3%) |
| 7:30 AM to 7:59 AM | 0 (0.0%) | 21 (10.0%) |
| 8:00 AM to 8:29 AM | 0 (0.0%) | 7 (3.3%) |
| 8:30 AM to 8:59 AM | 0 (0.0%) | 3 (1.4%) |
| 9:00 AM to 9:59 AM | 0 (0.0%) | 6 (2.8%) |
| 10:00 AM to 10:59 AM | 0 (0.0%) | 5 (2.4%) |
| 11:00 AM to 11:59 AM | 0 (0.0%) | 0 (0.0%) |
| 12:00 PM to 3:59 PM | 0 (0.0%) | 0 (0.0%) |
| 4:00 PM to 11:59 PM | 7 (4.3%) | 28 (13.3%) |
| Total | 161 (100.0%) | 211 (100.0%) |
Housing Occupancy in Vardaman
Occupancy by Ownership in Vardaman
Of the total 356 dwellings in Vardaman, owner-occupied units account for 238 (66.8%), while renter-occupied units make up 118 (33.2%).
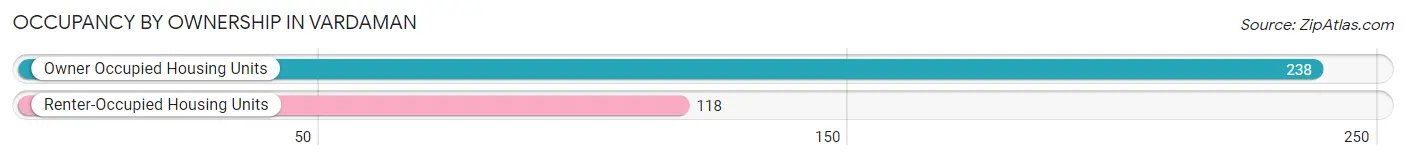
| Occupancy | # Housing Units | % Housing Units |
| Owner Occupied Housing Units | 238 | 66.8% |
| Renter-Occupied Housing Units | 118 | 33.2% |
| Total Occupied Housing Units | 356 | 100.0% |
Occupancy by Household Size in Vardaman
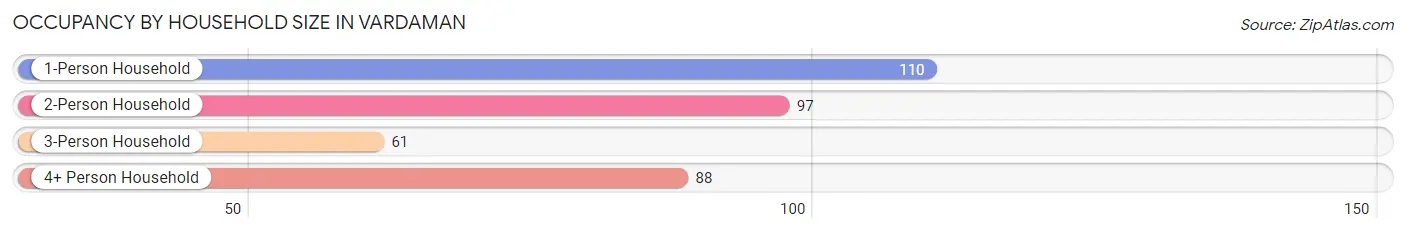
| Household Size | # Housing Units | % Housing Units |
| 1-Person Household | 110 | 30.9% |
| 2-Person Household | 97 | 27.3% |
| 3-Person Household | 61 | 17.1% |
| 4+ Person Household | 88 | 24.7% |
| Total Housing Units | 356 | 100.0% |
Occupancy by Ownership by Household Size in Vardaman
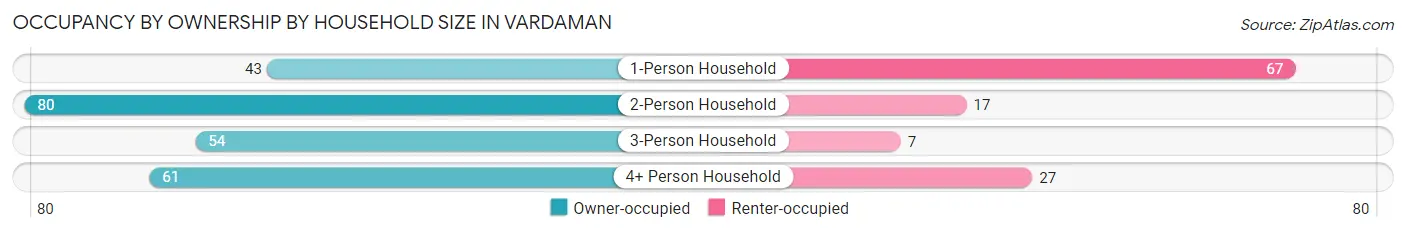
| Household Size | Owner-occupied | Renter-occupied |
| 1-Person Household | 43 (39.1%) | 67 (60.9%) |
| 2-Person Household | 80 (82.5%) | 17 (17.5%) |
| 3-Person Household | 54 (88.5%) | 7 (11.5%) |
| 4+ Person Household | 61 (69.3%) | 27 (30.7%) |
| Total Housing Units | 238 (66.8%) | 118 (33.2%) |
Occupancy by Educational Attainment in Vardaman
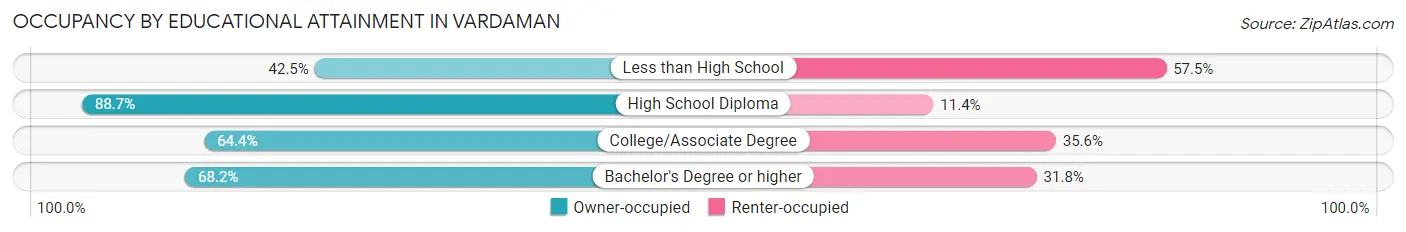
| Household Size | Owner-occupied | Renter-occupied |
| Less than High School | 51 (42.5%) | 69 (57.5%) |
| High School Diploma | 125 (88.6%) | 16 (11.4%) |
| College/Associate Degree | 47 (64.4%) | 26 (35.6%) |
| Bachelor's Degree or higher | 15 (68.2%) | 7 (31.8%) |
Occupancy by Age of Householder in Vardaman
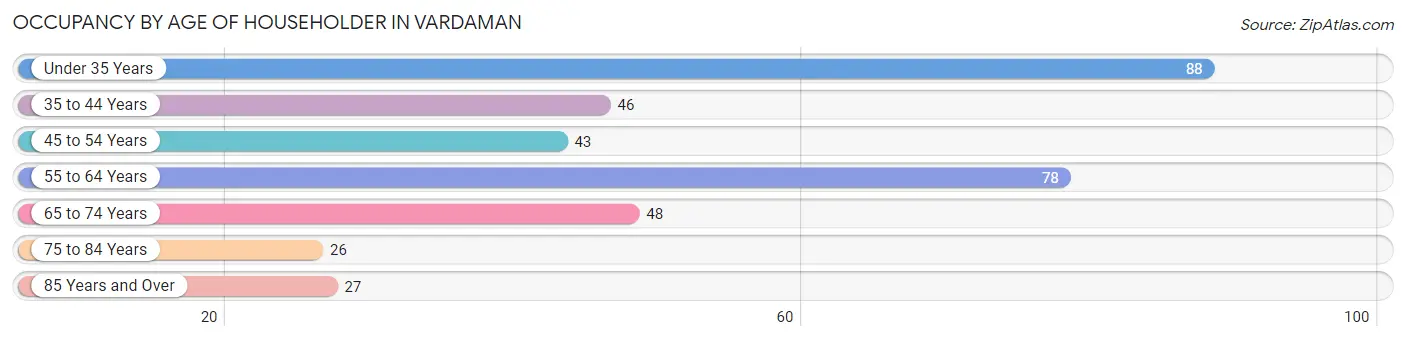
| Age Bracket | # Households | % Households |
| Under 35 Years | 88 | 24.7% |
| 35 to 44 Years | 46 | 12.9% |
| 45 to 54 Years | 43 | 12.1% |
| 55 to 64 Years | 78 | 21.9% |
| 65 to 74 Years | 48 | 13.5% |
| 75 to 84 Years | 26 | 7.3% |
| 85 Years and Over | 27 | 7.6% |
| Total | 356 | 100.0% |
Housing Finances in Vardaman
Median Income by Occupancy in Vardaman
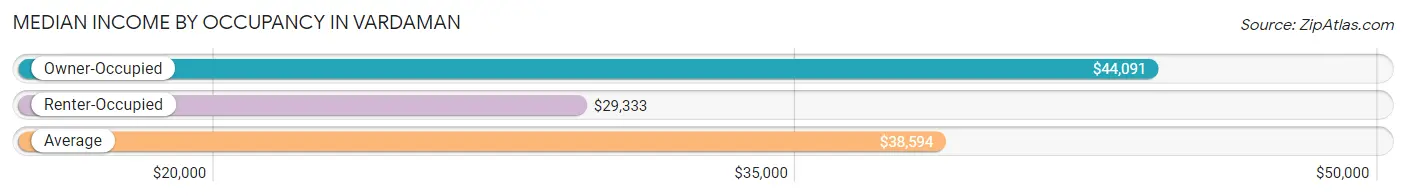
| Occupancy Type | # Households | Median Income |
| Owner-Occupied | 238 (66.8%) | $44,091 |
| Renter-Occupied | 118 (33.2%) | $29,333 |
| Average | 356 (100.0%) | $38,594 |
Occupancy by Householder Income Bracket in Vardaman
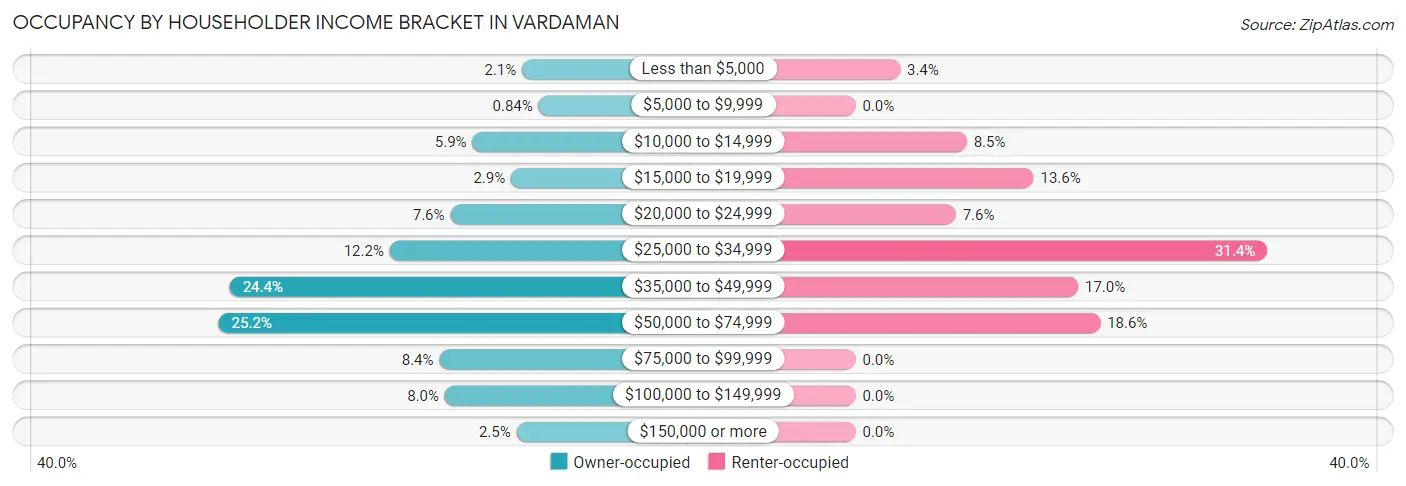
| Income Bracket | Owner-occupied | Renter-occupied |
| Less than $5,000 | 5 (2.1%) | 4 (3.4%) |
| $5,000 to $9,999 | 2 (0.8%) | 0 (0.0%) |
| $10,000 to $14,999 | 14 (5.9%) | 10 (8.5%) |
| $15,000 to $19,999 | 7 (2.9%) | 16 (13.6%) |
| $20,000 to $24,999 | 18 (7.6%) | 9 (7.6%) |
| $25,000 to $34,999 | 29 (12.2%) | 37 (31.4%) |
| $35,000 to $49,999 | 58 (24.4%) | 20 (17.0%) |
| $50,000 to $74,999 | 60 (25.2%) | 22 (18.6%) |
| $75,000 to $99,999 | 20 (8.4%) | 0 (0.0%) |
| $100,000 to $149,999 | 19 (8.0%) | 0 (0.0%) |
| $150,000 or more | 6 (2.5%) | 0 (0.0%) |
| Total | 238 (100.0%) | 118 (100.0%) |
Monthly Housing Cost Tiers in Vardaman
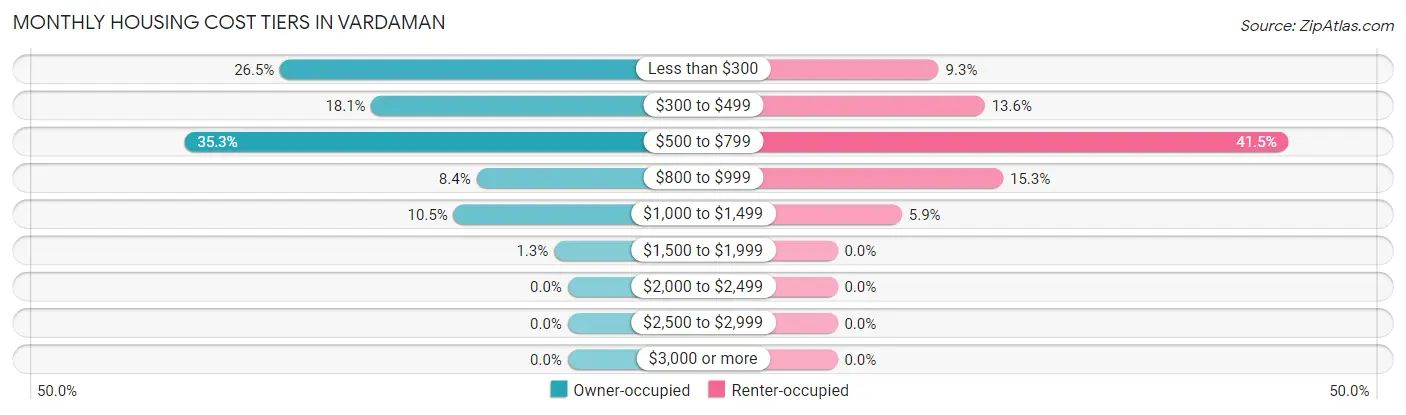
| Monthly Cost | Owner-occupied | Renter-occupied |
| Less than $300 | 63 (26.5%) | 11 (9.3%) |
| $300 to $499 | 43 (18.1%) | 16 (13.6%) |
| $500 to $799 | 84 (35.3%) | 49 (41.5%) |
| $800 to $999 | 20 (8.4%) | 18 (15.2%) |
| $1,000 to $1,499 | 25 (10.5%) | 7 (5.9%) |
| $1,500 to $1,999 | 3 (1.3%) | 0 (0.0%) |
| $2,000 to $2,499 | 0 (0.0%) | 0 (0.0%) |
| $2,500 to $2,999 | 0 (0.0%) | 0 (0.0%) |
| $3,000 or more | 0 (0.0%) | 0 (0.0%) |
| Total | 238 (100.0%) | 118 (100.0%) |
Physical Housing Characteristics in Vardaman
Housing Structures in Vardaman
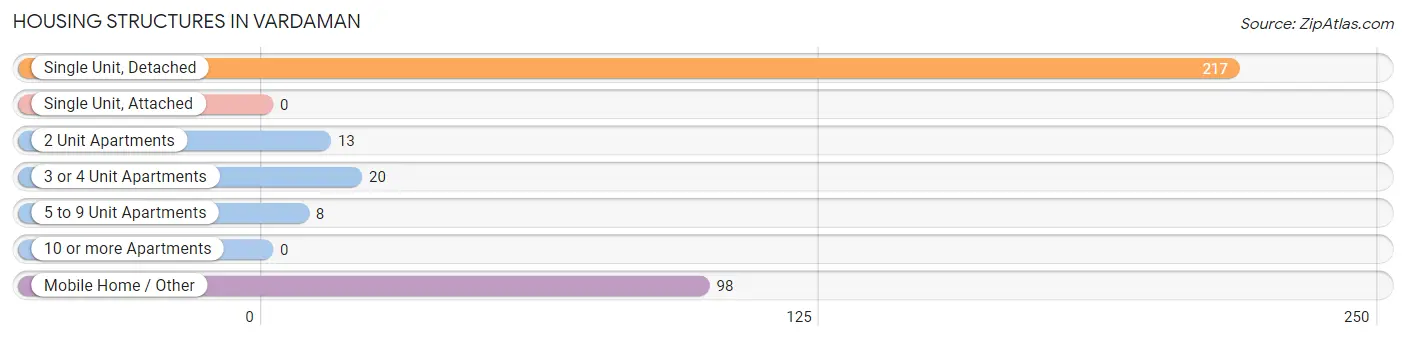
| Structure Type | # Housing Units | % Housing Units |
| Single Unit, Detached | 217 | 61.0% |
| Single Unit, Attached | 0 | 0.0% |
| 2 Unit Apartments | 13 | 3.6% |
| 3 or 4 Unit Apartments | 20 | 5.6% |
| 5 to 9 Unit Apartments | 8 | 2.2% |
| 10 or more Apartments | 0 | 0.0% |
| Mobile Home / Other | 98 | 27.5% |
| Total | 356 | 100.0% |
Housing Structures by Occupancy in Vardaman
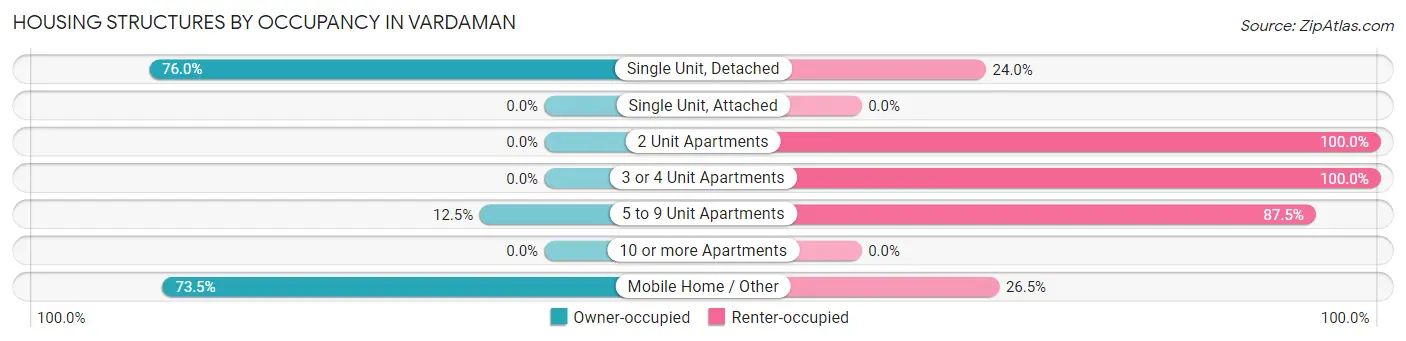
| Structure Type | Owner-occupied | Renter-occupied |
| Single Unit, Detached | 165 (76.0%) | 52 (24.0%) |
| Single Unit, Attached | 0 (0.0%) | 0 (0.0%) |
| 2 Unit Apartments | 0 (0.0%) | 13 (100.0%) |
| 3 or 4 Unit Apartments | 0 (0.0%) | 20 (100.0%) |
| 5 to 9 Unit Apartments | 1 (12.5%) | 7 (87.5%) |
| 10 or more Apartments | 0 (0.0%) | 0 (0.0%) |
| Mobile Home / Other | 72 (73.5%) | 26 (26.5%) |
| Total | 238 (66.8%) | 118 (33.2%) |
Housing Structures by Number of Rooms in Vardaman
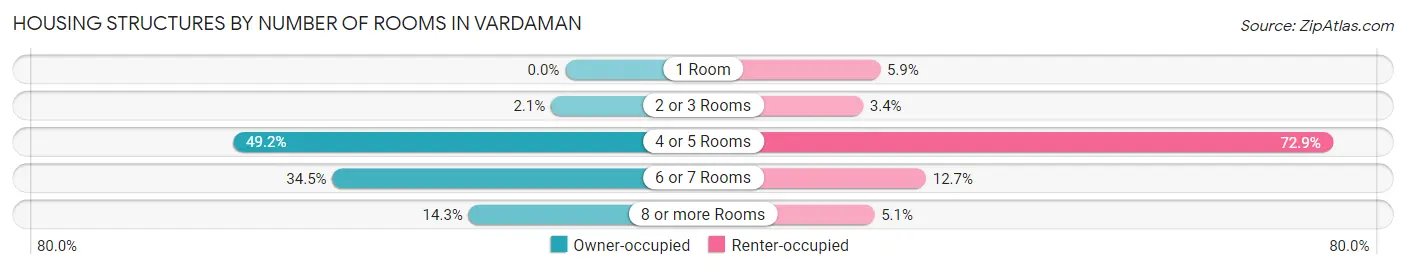
| Number of Rooms | Owner-occupied | Renter-occupied |
| 1 Room | 0 (0.0%) | 7 (5.9%) |
| 2 or 3 Rooms | 5 (2.1%) | 4 (3.4%) |
| 4 or 5 Rooms | 117 (49.2%) | 86 (72.9%) |
| 6 or 7 Rooms | 82 (34.4%) | 15 (12.7%) |
| 8 or more Rooms | 34 (14.3%) | 6 (5.1%) |
| Total | 238 (100.0%) | 118 (100.0%) |
Housing Structure by Heating Type in Vardaman
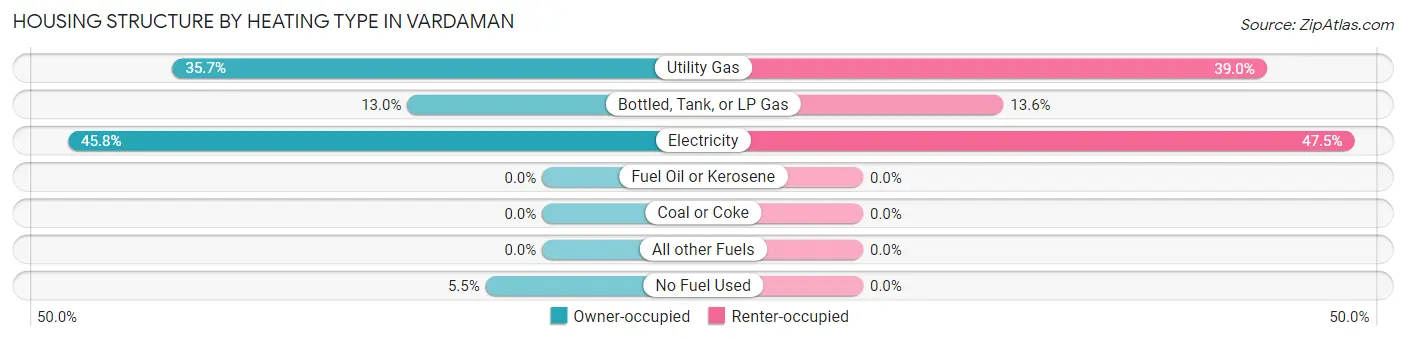
| Heating Type | Owner-occupied | Renter-occupied |
| Utility Gas | 85 (35.7%) | 46 (39.0%) |
| Bottled, Tank, or LP Gas | 31 (13.0%) | 16 (13.6%) |
| Electricity | 109 (45.8%) | 56 (47.5%) |
| Fuel Oil or Kerosene | 0 (0.0%) | 0 (0.0%) |
| Coal or Coke | 0 (0.0%) | 0 (0.0%) |
| All other Fuels | 0 (0.0%) | 0 (0.0%) |
| No Fuel Used | 13 (5.5%) | 0 (0.0%) |
| Total | 238 (100.0%) | 118 (100.0%) |
Household Vehicle Usage in Vardaman
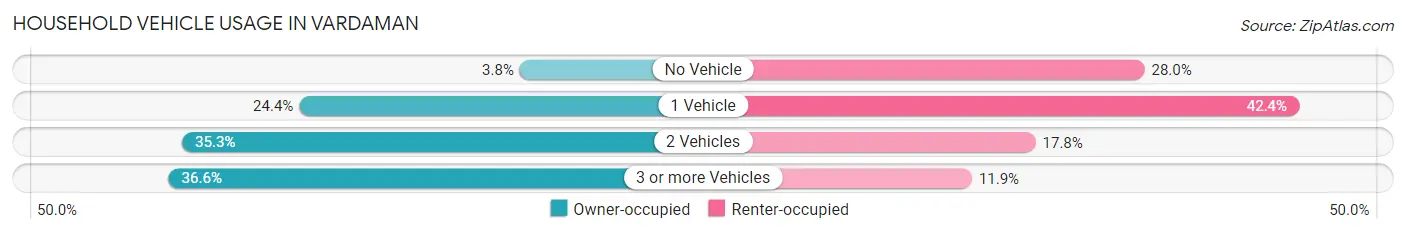
| Vehicles per Household | Owner-occupied | Renter-occupied |
| No Vehicle | 9 (3.8%) | 33 (28.0%) |
| 1 Vehicle | 58 (24.4%) | 50 (42.4%) |
| 2 Vehicles | 84 (35.3%) | 21 (17.8%) |
| 3 or more Vehicles | 87 (36.5%) | 14 (11.9%) |
| Total | 238 (100.0%) | 118 (100.0%) |
Real Estate & Mortgages in Vardaman
Real Estate and Mortgage Overview in Vardaman
| Characteristic | Without Mortgage | With Mortgage |
| Housing Units | 167 | 71 |
| Median Property Value | $46,600 | $88,100 |
| Median Household Income | $39,306 | $2 |
| Monthly Housing Costs | $402 | $0 |
| Real Estate Taxes | $458 | $20 |
Property Value by Mortgage Status in Vardaman
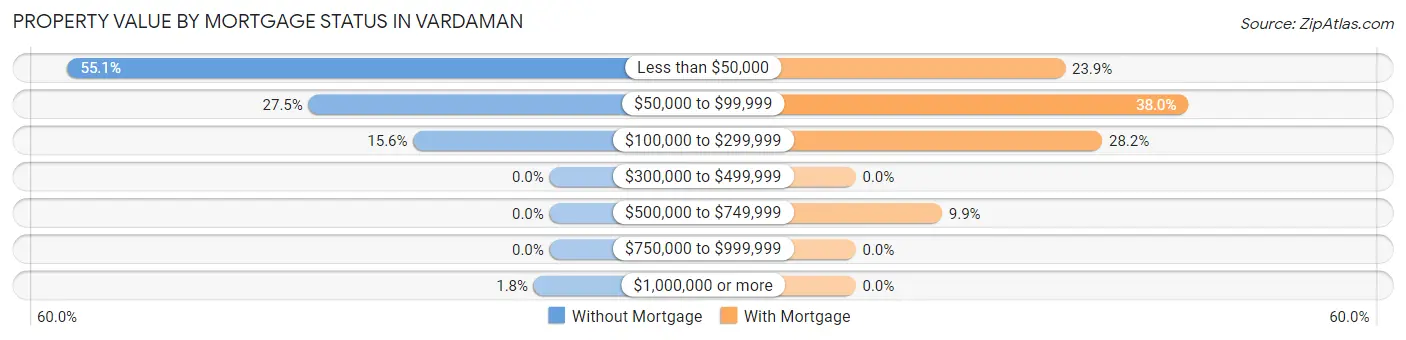
| Property Value | Without Mortgage | With Mortgage |
| Less than $50,000 | 92 (55.1%) | 17 (23.9%) |
| $50,000 to $99,999 | 46 (27.5%) | 27 (38.0%) |
| $100,000 to $299,999 | 26 (15.6%) | 20 (28.2%) |
| $300,000 to $499,999 | 0 (0.0%) | 0 (0.0%) |
| $500,000 to $749,999 | 0 (0.0%) | 7 (9.9%) |
| $750,000 to $999,999 | 0 (0.0%) | 0 (0.0%) |
| $1,000,000 or more | 3 (1.8%) | 0 (0.0%) |
| Total | 167 (100.0%) | 71 (100.0%) |
Household Income by Mortgage Status in Vardaman
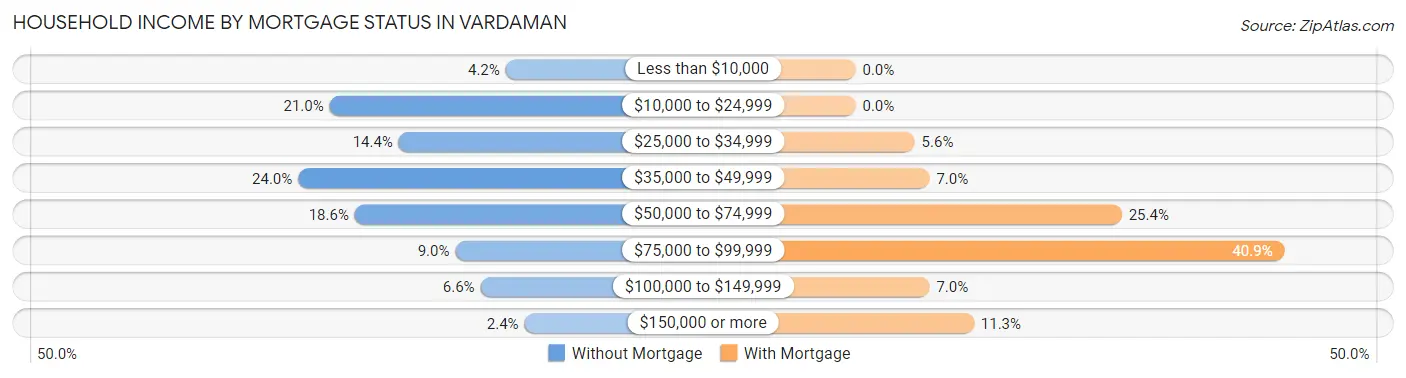
| Household Income | Without Mortgage | With Mortgage |
| Less than $10,000 | 7 (4.2%) | 0 (0.0%) |
| $10,000 to $24,999 | 35 (21.0%) | 0 (0.0%) |
| $25,000 to $34,999 | 24 (14.4%) | 4 (5.6%) |
| $35,000 to $49,999 | 40 (23.9%) | 5 (7.0%) |
| $50,000 to $74,999 | 31 (18.6%) | 18 (25.4%) |
| $75,000 to $99,999 | 15 (9.0%) | 29 (40.8%) |
| $100,000 to $149,999 | 11 (6.6%) | 5 (7.0%) |
| $150,000 or more | 4 (2.4%) | 8 (11.3%) |
| Total | 167 (100.0%) | 71 (100.0%) |
Property Value to Household Income Ratio in Vardaman
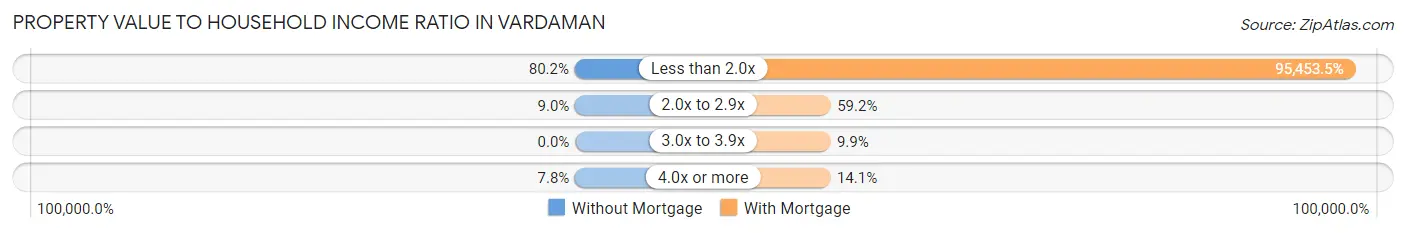
| Value-to-Income Ratio | Without Mortgage | With Mortgage |
| Less than 2.0x | 134 (80.2%) | 67,772 (95,453.5%) |
| 2.0x to 2.9x | 15 (9.0%) | 42 (59.2%) |
| 3.0x to 3.9x | 0 (0.0%) | 7 (9.9%) |
| 4.0x or more | 13 (7.8%) | 10 (14.1%) |
| Total | 167 (100.0%) | 71 (100.0%) |
Real Estate Taxes by Mortgage Status in Vardaman
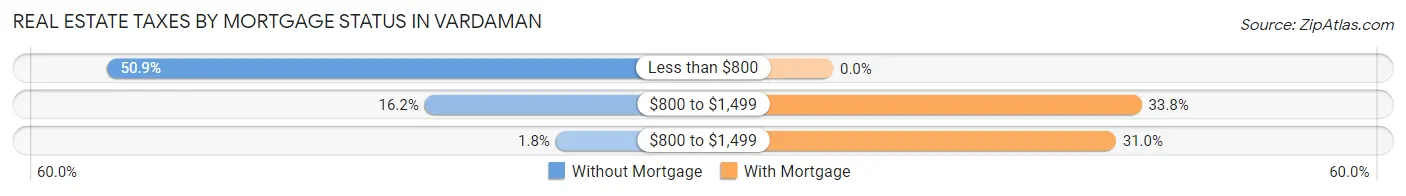
| Property Taxes | Without Mortgage | With Mortgage |
| Less than $800 | 85 (50.9%) | 0 (0.0%) |
| $800 to $1,499 | 27 (16.2%) | 24 (33.8%) |
| $800 to $1,499 | 3 (1.8%) | 22 (31.0%) |
| Total | 167 (100.0%) | 71 (100.0%) |
Health & Disability in Vardaman
Health Insurance Coverage by Age in Vardaman
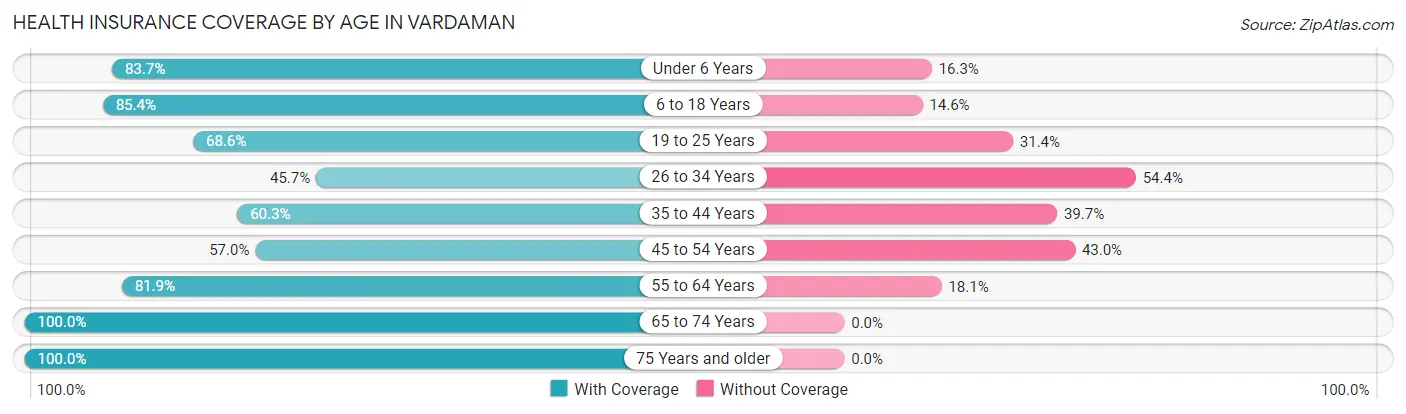
| Age Bracket | With Coverage | Without Coverage |
| Under 6 Years | 77 (83.7%) | 15 (16.3%) |
| 6 to 18 Years | 170 (85.4%) | 29 (14.6%) |
| 19 to 25 Years | 72 (68.6%) | 33 (31.4%) |
| 26 to 34 Years | 63 (45.7%) | 75 (54.3%) |
| 35 to 44 Years | 35 (60.3%) | 23 (39.7%) |
| 45 to 54 Years | 53 (57.0%) | 40 (43.0%) |
| 55 to 64 Years | 122 (81.9%) | 27 (18.1%) |
| 65 to 74 Years | 64 (100.0%) | 0 (0.0%) |
| 75 Years and older | 74 (100.0%) | 0 (0.0%) |
| Total | 730 (75.1%) | 242 (24.9%) |
Health Insurance Coverage by Citizenship Status in Vardaman
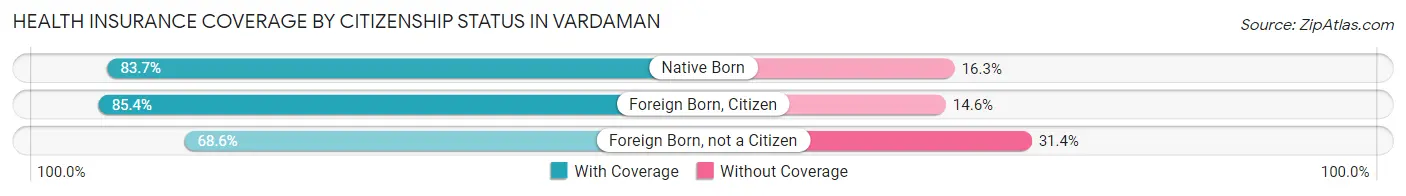
| Citizenship Status | With Coverage | Without Coverage |
| Native Born | 77 (83.7%) | 15 (16.3%) |
| Foreign Born, Citizen | 170 (85.4%) | 29 (14.6%) |
| Foreign Born, not a Citizen | 72 (68.6%) | 33 (31.4%) |
Health Insurance Coverage by Household Income in Vardaman
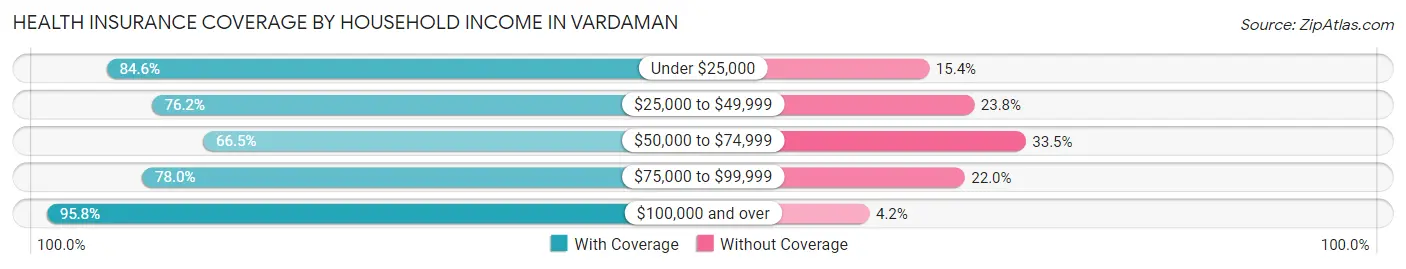
| Household Income | With Coverage | Without Coverage |
| Under $25,000 | 143 (84.6%) | 26 (15.4%) |
| $25,000 to $49,999 | 301 (76.2%) | 94 (23.8%) |
| $50,000 to $74,999 | 171 (66.5%) | 86 (33.5%) |
| $75,000 to $99,999 | 46 (78.0%) | 13 (22.0%) |
| $100,000 and over | 69 (95.8%) | 3 (4.2%) |
Public vs Private Health Insurance Coverage by Age in Vardaman
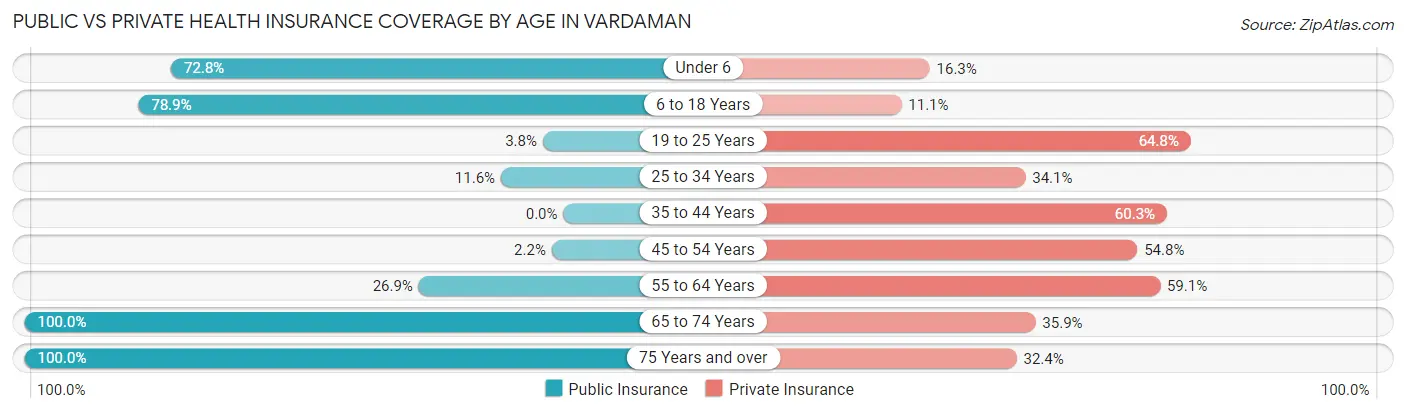
| Age Bracket | Public Insurance | Private Insurance |
| Under 6 | 67 (72.8%) | 15 (16.3%) |
| 6 to 18 Years | 157 (78.9%) | 22 (11.1%) |
| 19 to 25 Years | 4 (3.8%) | 68 (64.8%) |
| 25 to 34 Years | 16 (11.6%) | 47 (34.1%) |
| 35 to 44 Years | 0 (0.0%) | 35 (60.3%) |
| 45 to 54 Years | 2 (2.1%) | 51 (54.8%) |
| 55 to 64 Years | 40 (26.9%) | 88 (59.1%) |
| 65 to 74 Years | 64 (100.0%) | 23 (35.9%) |
| 75 Years and over | 74 (100.0%) | 24 (32.4%) |
| Total | 424 (43.6%) | 373 (38.4%) |
Disability Status by Sex by Age in Vardaman
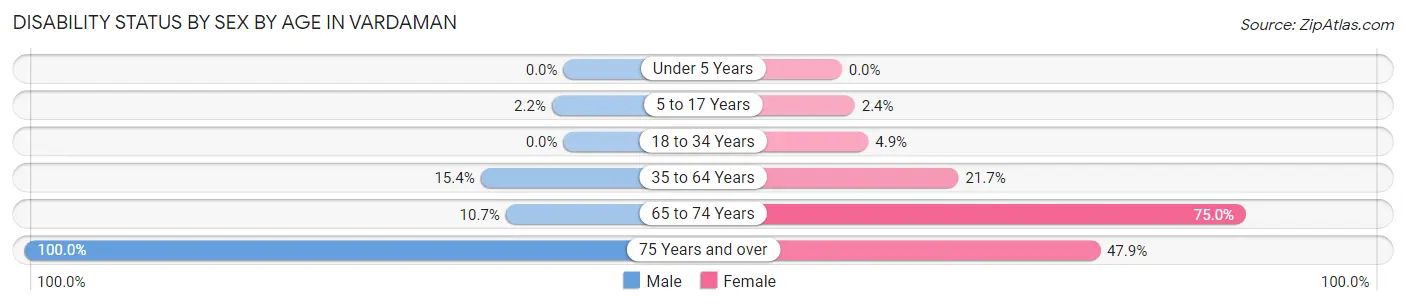
| Age Bracket | Male | Female |
| Under 5 Years | 0 (0.0%) | 0 (0.0%) |
| 5 to 17 Years | 3 (2.2%) | 2 (2.4%) |
| 18 to 34 Years | 0 (0.0%) | 7 (4.9%) |
| 35 to 64 Years | 22 (15.4%) | 34 (21.7%) |
| 65 to 74 Years | 3 (10.7%) | 27 (75.0%) |
| 75 Years and over | 26 (100.0%) | 23 (47.9%) |
Disability Class by Sex by Age in Vardaman
Disability Class: Hearing Difficulty
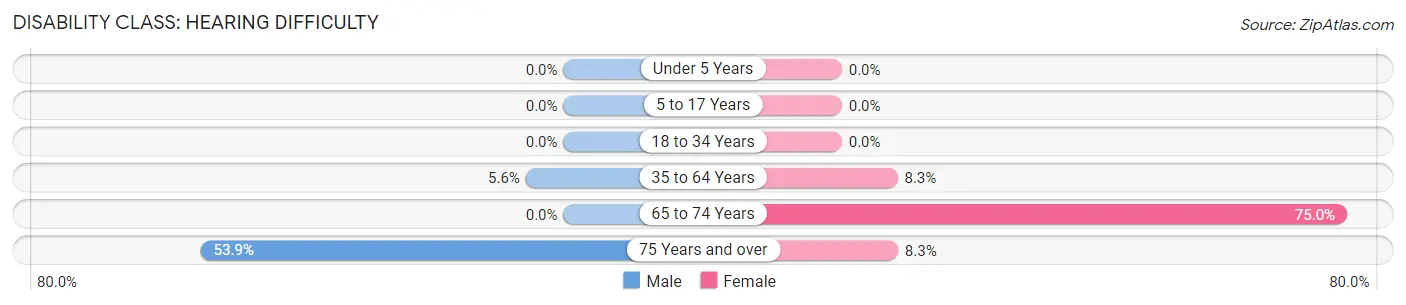
| Age Bracket | Male | Female |
| Under 5 Years | 0 (0.0%) | 0 (0.0%) |
| 5 to 17 Years | 0 (0.0%) | 0 (0.0%) |
| 18 to 34 Years | 0 (0.0%) | 0 (0.0%) |
| 35 to 64 Years | 8 (5.6%) | 13 (8.3%) |
| 65 to 74 Years | 0 (0.0%) | 27 (75.0%) |
| 75 Years and over | 14 (53.8%) | 4 (8.3%) |
Disability Class: Vision Difficulty
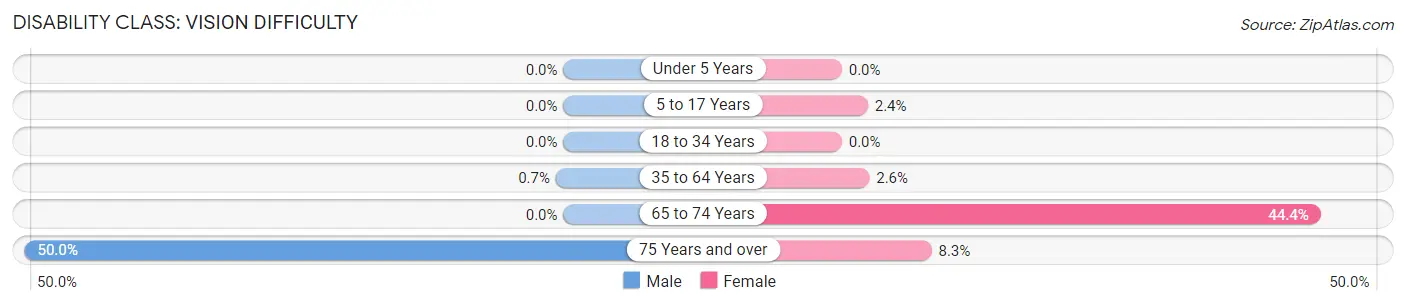
| Age Bracket | Male | Female |
| Under 5 Years | 0 (0.0%) | 0 (0.0%) |
| 5 to 17 Years | 0 (0.0%) | 2 (2.4%) |
| 18 to 34 Years | 0 (0.0%) | 0 (0.0%) |
| 35 to 64 Years | 1 (0.7%) | 4 (2.5%) |
| 65 to 74 Years | 0 (0.0%) | 16 (44.4%) |
| 75 Years and over | 13 (50.0%) | 4 (8.3%) |
Disability Class: Cognitive Difficulty
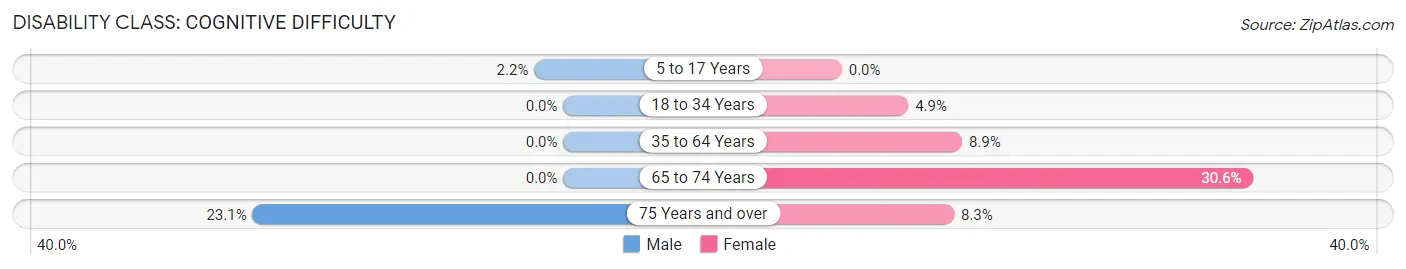
| Age Bracket | Male | Female |
| 5 to 17 Years | 3 (2.2%) | 0 (0.0%) |
| 18 to 34 Years | 0 (0.0%) | 7 (4.9%) |
| 35 to 64 Years | 0 (0.0%) | 14 (8.9%) |
| 65 to 74 Years | 0 (0.0%) | 11 (30.6%) |
| 75 Years and over | 6 (23.1%) | 4 (8.3%) |
Disability Class: Ambulatory Difficulty
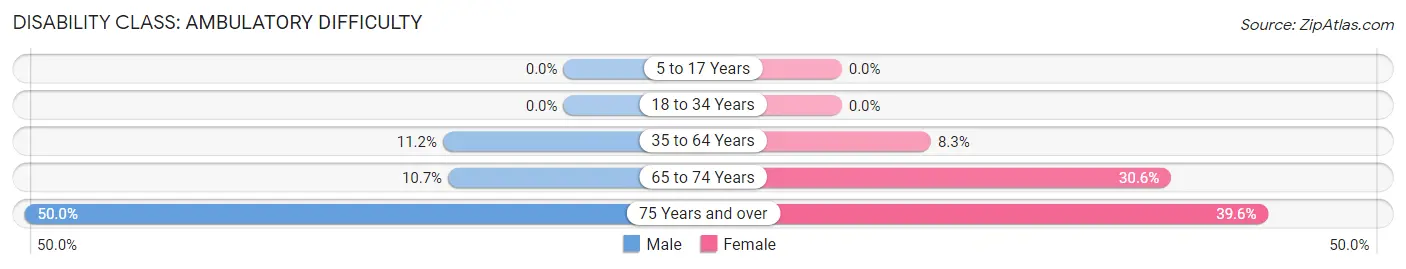
| Age Bracket | Male | Female |
| 5 to 17 Years | 0 (0.0%) | 0 (0.0%) |
| 18 to 34 Years | 0 (0.0%) | 0 (0.0%) |
| 35 to 64 Years | 16 (11.2%) | 13 (8.3%) |
| 65 to 74 Years | 3 (10.7%) | 11 (30.6%) |
| 75 Years and over | 13 (50.0%) | 19 (39.6%) |
Disability Class: Self-Care Difficulty
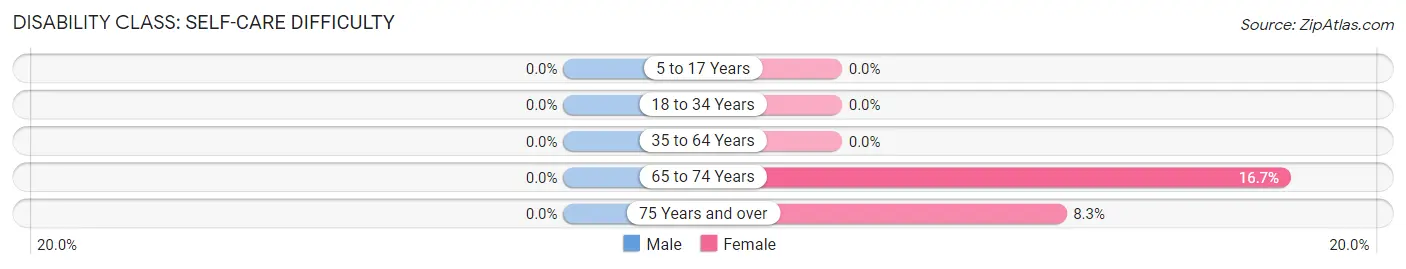
| Age Bracket | Male | Female |
| 5 to 17 Years | 0 (0.0%) | 0 (0.0%) |
| 18 to 34 Years | 0 (0.0%) | 0 (0.0%) |
| 35 to 64 Years | 0 (0.0%) | 0 (0.0%) |
| 65 to 74 Years | 0 (0.0%) | 6 (16.7%) |
| 75 Years and over | 0 (0.0%) | 4 (8.3%) |
Technology Access in Vardaman
Computing Device Access in Vardaman
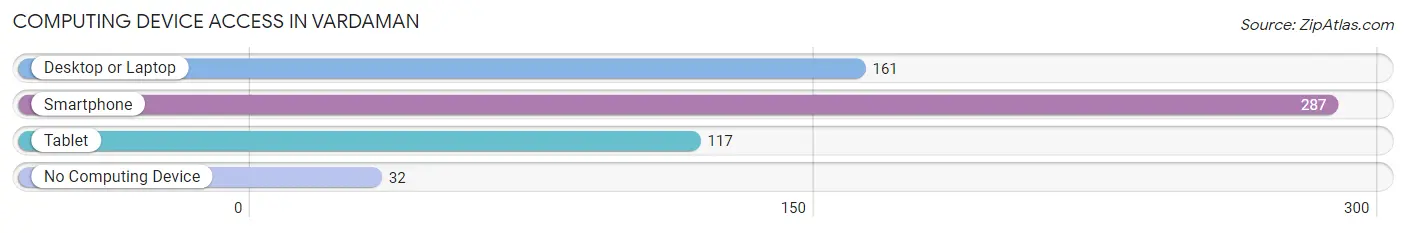
| Device Type | # Households | % Households |
| Desktop or Laptop | 161 | 45.2% |
| Smartphone | 287 | 80.6% |
| Tablet | 117 | 32.9% |
| No Computing Device | 32 | 9.0% |
| Total | 356 | 100.0% |
Internet Access in Vardaman
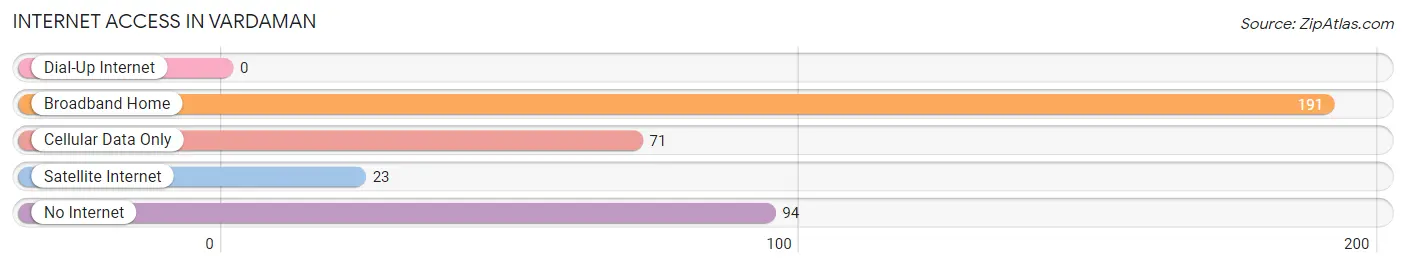
| Internet Type | # Households | % Households |
| Dial-Up Internet | 0 | 0.0% |
| Broadband Home | 191 | 53.6% |
| Cellular Data Only | 71 | 19.9% |
| Satellite Internet | 23 | 6.5% |
| No Internet | 94 | 26.4% |
| Total | 356 | 100.0% |
Vardaman Summary
Vardaman, Mississippi is a small town located in Calhoun County in the northeastern part of the state. It is situated on the banks of the Yalobusha River, and is home to a population of approximately 1,000 people. The town was founded in 1887 and named after James K. Vardaman, who served as Governor of Mississippi from 1904 to 1908.
History
Vardaman was founded in 1887 by a group of settlers from nearby Calhoun City. The town was named after James K. Vardaman, who served as Governor of Mississippi from 1904 to 1908. The town was originally a farming community, and the main crops grown were cotton, corn, and soybeans. In the early 1900s, the town began to grow and develop, and by the 1920s, it had become a thriving business center.
The town was also home to a number of churches, including the First Baptist Church, which was founded in 1887. The town also had a number of schools, including the Vardaman High School, which was established in 1910.
Geography
Vardaman is located in Calhoun County in the northeastern part of the state. It is situated on the banks of the Yalobusha River, and is surrounded by rolling hills and forests. The town is located approximately 30 miles south of Tupelo, Mississippi, and is about an hour and a half drive from Memphis, Tennessee.
Economy
The economy of Vardaman is largely based on agriculture. The main crops grown in the area are cotton, corn, and soybeans. The town also has a number of small businesses, including a grocery store, a hardware store, and a few restaurants.
Demographics
As of the 2010 census, the population of Vardaman was 1,000 people. The racial makeup of the town was 97.2% White, 0.7% African American, 0.3% Native American, 0.2% Asian, and 1.6% from other races. The median household income in Vardaman was $30,000, and the median age was 39 years.
Conclusion
Vardaman, Mississippi is a small town located in Calhoun County in the northeastern part of the state. It is situated on the banks of the Yalobusha River, and is home to a population of approximately 1,000 people. The town was founded in 1887 and named after James K. Vardaman, who served as Governor of Mississippi from 1904 to 1908. The economy of Vardaman is largely based on agriculture, and the main crops grown in the area are cotton, corn, and soybeans. The town also has a number of small businesses, including a grocery store, a hardware store, and a few restaurants. As of the 2010 census, the population of Vardaman was 1,000 people, and the median household income was $30,000.
Common Questions
What is Per Capita Income in Vardaman?
Per Capita income in Vardaman is $17,210.
What is the Median Family Income in Vardaman?
Median Family Income in Vardaman is $44,643.
What is the Median Household income in Vardaman?
Median Household Income in Vardaman is $38,594.
What is Income or Wage Gap in Vardaman?
Income or Wage Gap in Vardaman is 16.9%.
Women in Vardaman earn 83.1 cents for every dollar earned by a man.
What is Inequality or Gini Index in Vardaman?
Inequality or Gini Index in Vardaman is 0.35.
What is the Total Population of Vardaman?
Total Population of Vardaman is 972.
What is the Total Male Population of Vardaman?
Total Male Population of Vardaman is 465.
What is the Total Female Population of Vardaman?
Total Female Population of Vardaman is 507.
What is the Ratio of Males per 100 Females in Vardaman?
There are 91.72 Males per 100 Females in Vardaman.
What is the Ratio of Females per 100 Males in Vardaman?
There are 109.03 Females per 100 Males in Vardaman.
What is the Median Population Age in Vardaman?
Median Population Age in Vardaman is 33.5 Years.
What is the Average Family Size in Vardaman
Average Family Size in Vardaman is 3.3 People.
What is the Average Household Size in Vardaman
Average Household Size in Vardaman is 2.7 People.
How Large is the Labor Force in Vardaman?
There are 413 People in the Labor Forcein in Vardaman.
What is the Percentage of People in the Labor Force in Vardaman?
56.4% of People are in the Labor Force in Vardaman.
What is the Unemployment Rate in Vardaman?
Unemployment Rate in Vardaman is 2.9%.