Utica, MS Map & Demographics
Utica Map
Utica Overview
$19,098
PER CAPITA INCOME
$41,250
AVG FAMILY INCOME
$42,222
AVG HOUSEHOLD INCOME
27.8%
WAGE / INCOME GAP [ % ]
72.2¢/ $1
WAGE / INCOME GAP [ $ ]
0.44
INEQUALITY / GINI INDEX
977
TOTAL POPULATION
532
MALE POPULATION
445
FEMALE POPULATION
119.55
MALES / 100 FEMALES
83.65
FEMALES / 100 MALES
39.4
MEDIAN AGE
3.4
AVG FAMILY SIZE
2.9
AVG HOUSEHOLD SIZE
344
LABOR FORCE [ PEOPLE ]
44.0%
PERCENT IN LABOR FORCE
3.5%
UNEMPLOYMENT RATE
Utica Zip Codes
Income in Utica
Income Overview in Utica
Per Capita Income in Utica is $19,098, while median incomes of families and households are $41,250 and $42,222 respectively.
| Characteristic | Number | Measure |
| Per Capita Income | 977 | $19,098 |
| Median Family Income | 231 | $41,250 |
| Mean Family Income | 231 | $53,492 |
| Median Household Income | 332 | $42,222 |
| Mean Household Income | 332 | $52,417 |
| Income Deficit | 231 | $0 |
| Wage / Income Gap (%) | 977 | 27.76% |
| Wage / Income Gap ($) | 977 | 72.24¢ per $1 |
| Gini / Inequality Index | 977 | 0.44 |
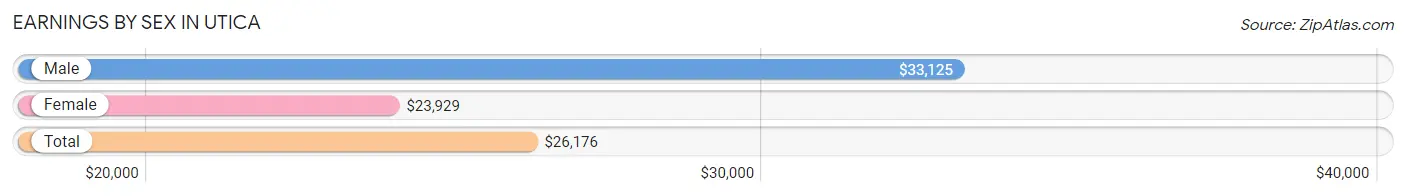
Earnings by Sex in Utica
Average Earnings in Utica are $26,176, $33,125 for men and $23,929 for women, a difference of 27.8%.
| Sex | Number | Average Earnings |
| Male | 184 (48.4%) | $33,125 |
| Female | 196 (51.6%) | $23,929 |
| Total | 380 (100.0%) | $26,176 |
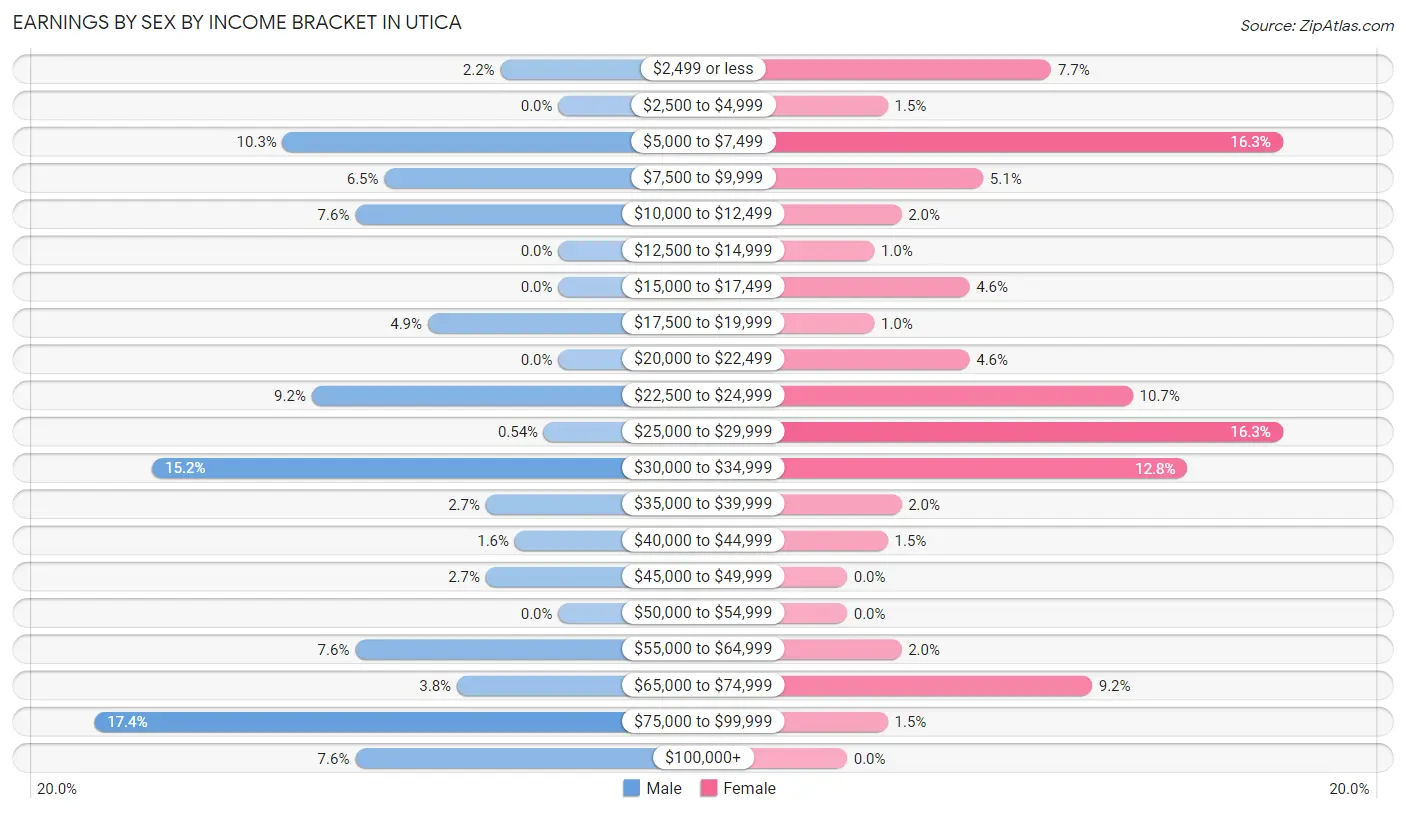
Earnings by Sex by Income Bracket in Utica
The most common earnings brackets in Utica are $75,000 to $99,999 for men (32 | 17.4%) and $5,000 to $7,499 for women (32 | 16.3%).
| Income | Male | Female |
| $2,499 or less | 4 (2.2%) | 15 (7.6%) |
| $2,500 to $4,999 | 0 (0.0%) | 3 (1.5%) |
| $5,000 to $7,499 | 19 (10.3%) | 32 (16.3%) |
| $7,500 to $9,999 | 12 (6.5%) | 10 (5.1%) |
| $10,000 to $12,499 | 14 (7.6%) | 4 (2.0%) |
| $12,500 to $14,999 | 0 (0.0%) | 2 (1.0%) |
| $15,000 to $17,499 | 0 (0.0%) | 9 (4.6%) |
| $17,500 to $19,999 | 9 (4.9%) | 2 (1.0%) |
| $20,000 to $22,499 | 0 (0.0%) | 9 (4.6%) |
| $22,500 to $24,999 | 17 (9.2%) | 21 (10.7%) |
| $25,000 to $29,999 | 1 (0.5%) | 32 (16.3%) |
| $30,000 to $34,999 | 28 (15.2%) | 25 (12.8%) |
| $35,000 to $39,999 | 5 (2.7%) | 4 (2.0%) |
| $40,000 to $44,999 | 3 (1.6%) | 3 (1.5%) |
| $45,000 to $49,999 | 5 (2.7%) | 0 (0.0%) |
| $50,000 to $54,999 | 0 (0.0%) | 0 (0.0%) |
| $55,000 to $64,999 | 14 (7.6%) | 4 (2.0%) |
| $65,000 to $74,999 | 7 (3.8%) | 18 (9.2%) |
| $75,000 to $99,999 | 32 (17.4%) | 3 (1.5%) |
| $100,000+ | 14 (7.6%) | 0 (0.0%) |
| Total | 184 (100.0%) | 196 (100.0%) |
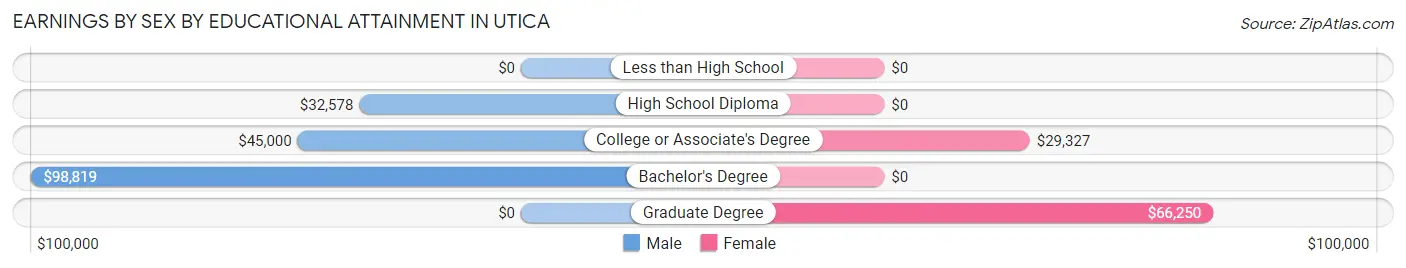
Earnings by Sex by Educational Attainment in Utica
Average earnings in Utica are $34,609 for men and $25,096 for women, a difference of 27.5%. Men with an educational attainment of bachelor's degree enjoy the highest average annual earnings of $98,819, while those with high school diploma education earn the least with $32,578. Women with an educational attainment of graduate degree earn the most with the average annual earnings of $66,250, while those with college or associate's degree education have the smallest earnings of $29,327.
| Educational Attainment | Male Income | Female Income |
| Less than High School | - | - |
| High School Diploma | $32,578 | $0 |
| College or Associate's Degree | $45,000 | $29,327 |
| Bachelor's Degree | $98,819 | $0 |
| Graduate Degree | - | - |
| Total | $34,609 | $25,096 |
Family Income in Utica
Family Income Brackets in Utica
According to the Utica family income data, there are 71 families falling into the $50,000 to $74,999 income range, which is the most common income bracket and makes up 30.7% of all families. Conversely, the $150,000 to $199,999 income bracket is the least frequent group with only 3 families (1.3%) belonging to this category.
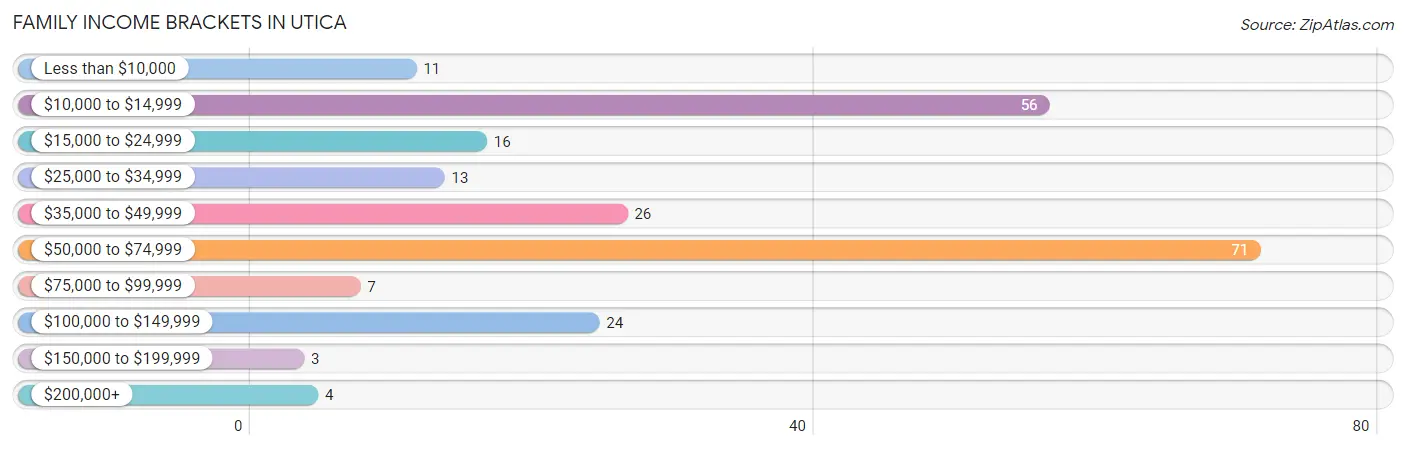
| Income Bracket | # Families | % Families |
| Less than $10,000 | 11 | 4.8% |
| $10,000 to $14,999 | 56 | 24.2% |
| $15,000 to $24,999 | 16 | 6.9% |
| $25,000 to $34,999 | 13 | 5.6% |
| $35,000 to $49,999 | 26 | 11.3% |
| $50,000 to $74,999 | 71 | 30.7% |
| $75,000 to $99,999 | 7 | 3.0% |
| $100,000 to $149,999 | 24 | 10.4% |
| $150,000 to $199,999 | 3 | 1.3% |
| $200,000+ | 4 | 1.7% |
Family Income by Famaliy Size in Utica
4-person families (25 | 10.8%) account for the highest median family income in Utica with $70,096 per family, while 3-person families (28 | 12.1%) have the highest median income of $19,524 per family member.
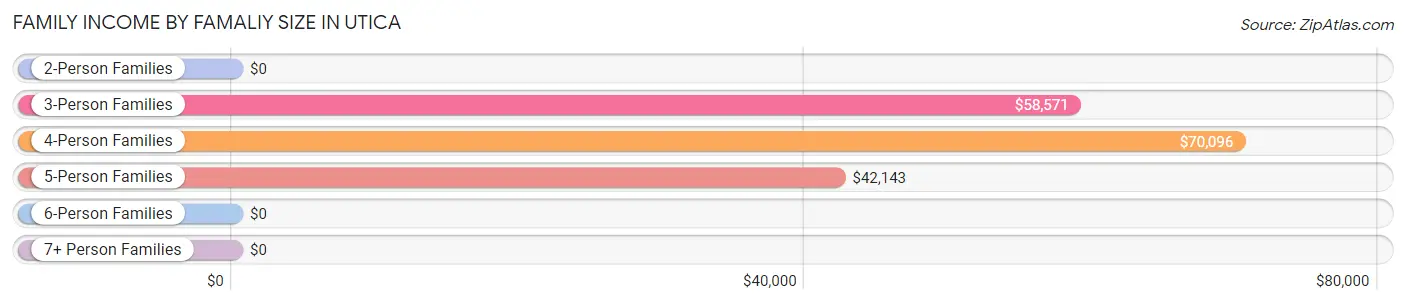
| Income Bracket | # Families | Median Income |
| 2-Person Families | 134 (58.0%) | $0 |
| 3-Person Families | 28 (12.1%) | $58,571 |
| 4-Person Families | 25 (10.8%) | $70,096 |
| 5-Person Families | 28 (12.1%) | $42,143 |
| 6-Person Families | 0 (0.0%) | $0 |
| 7+ Person Families | 16 (6.9%) | $0 |
| Total | 231 (100.0%) | $41,250 |
Family Income by Number of Earners in Utica
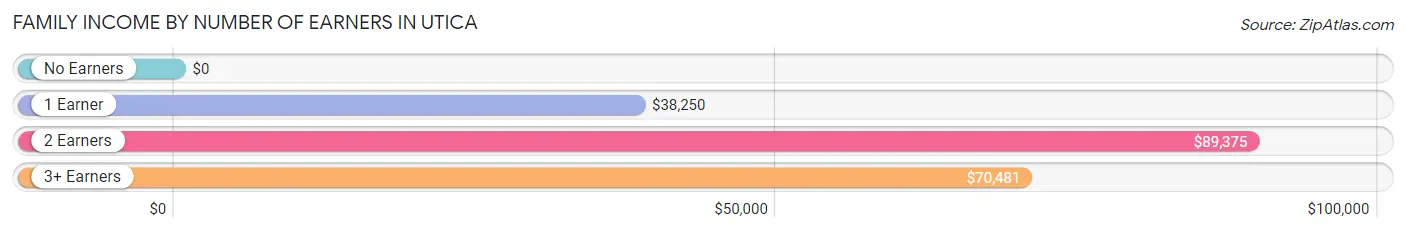
| Number of Earners | # Families | Median Income |
| No Earners | 93 (40.3%) | $0 |
| 1 Earner | 59 (25.5%) | $38,250 |
| 2 Earners | 48 (20.8%) | $89,375 |
| 3+ Earners | 31 (13.4%) | $70,481 |
| Total | 231 (100.0%) | $41,250 |
Household Income in Utica
Household Income Brackets in Utica
With 93 households falling in the category, the $50,000 to $74,999 income range is the most frequent in Utica, accounting for 28.0% of all households. In contrast, only 3 households (0.9%) fall into the $150,000 to $199,999 income bracket, making it the least populous group.
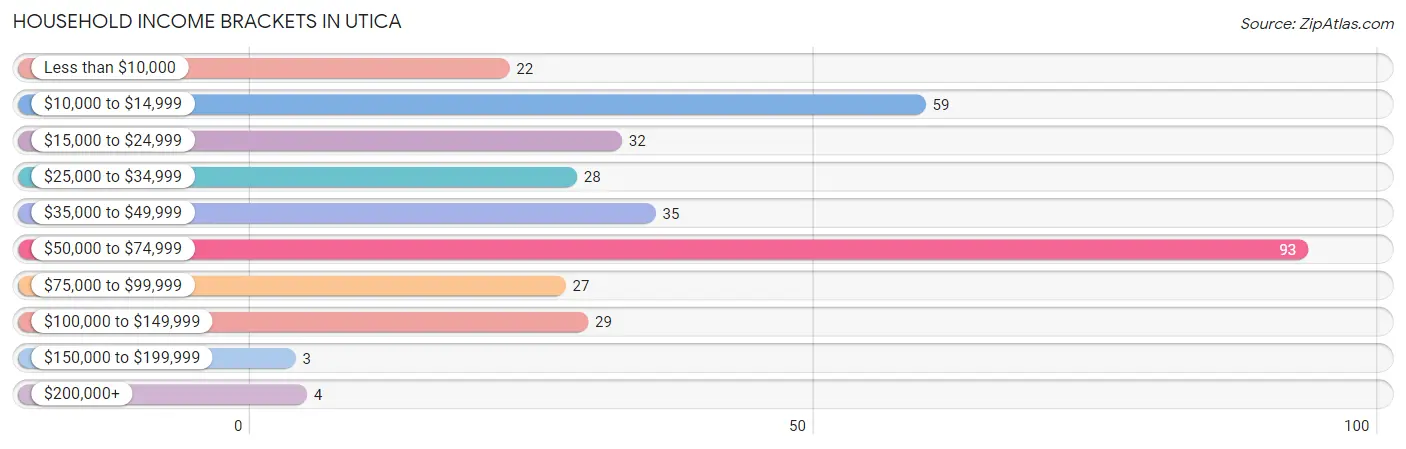
| Income Bracket | # Households | % Households |
| Less than $10,000 | 22 | 6.6% |
| $10,000 to $14,999 | 59 | 17.8% |
| $15,000 to $24,999 | 32 | 9.6% |
| $25,000 to $34,999 | 28 | 8.4% |
| $35,000 to $49,999 | 35 | 10.5% |
| $50,000 to $74,999 | 93 | 28.0% |
| $75,000 to $99,999 | 27 | 8.1% |
| $100,000 to $149,999 | 29 | 8.7% |
| $150,000 to $199,999 | 3 | 0.9% |
| $200,000+ | 4 | 1.2% |
Household Income by Householder Age in Utica
The median household income in Utica is $42,222, with the highest median household income of $55,625 found in the 45 to 64 years age bracket for the primary householder. A total of 131 households (39.5%) fall into this category.
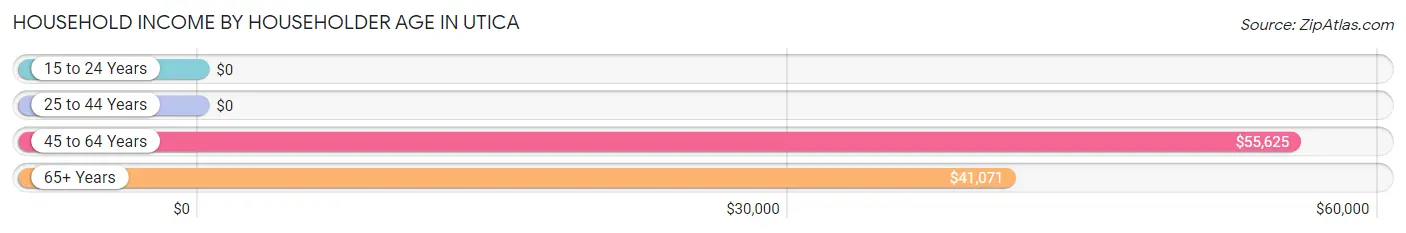
| Income Bracket | # Households | Median Income |
| 15 to 24 Years | 0 (0.0%) | $0 |
| 25 to 44 Years | 95 (28.6%) | $0 |
| 45 to 64 Years | 131 (39.5%) | $55,625 |
| 65+ Years | 106 (31.9%) | $41,071 |
| Total | 332 (100.0%) | $42,222 |
Poverty in Utica
Income Below Poverty by Sex and Age in Utica
With 22.4% poverty level for males and 36.2% for females among the residents of Utica, 15 year old males and 5 year old females are the most vulnerable to poverty, with 8 males (57.1%) and 2 females (100.0%) in their respective age groups living below the poverty level.
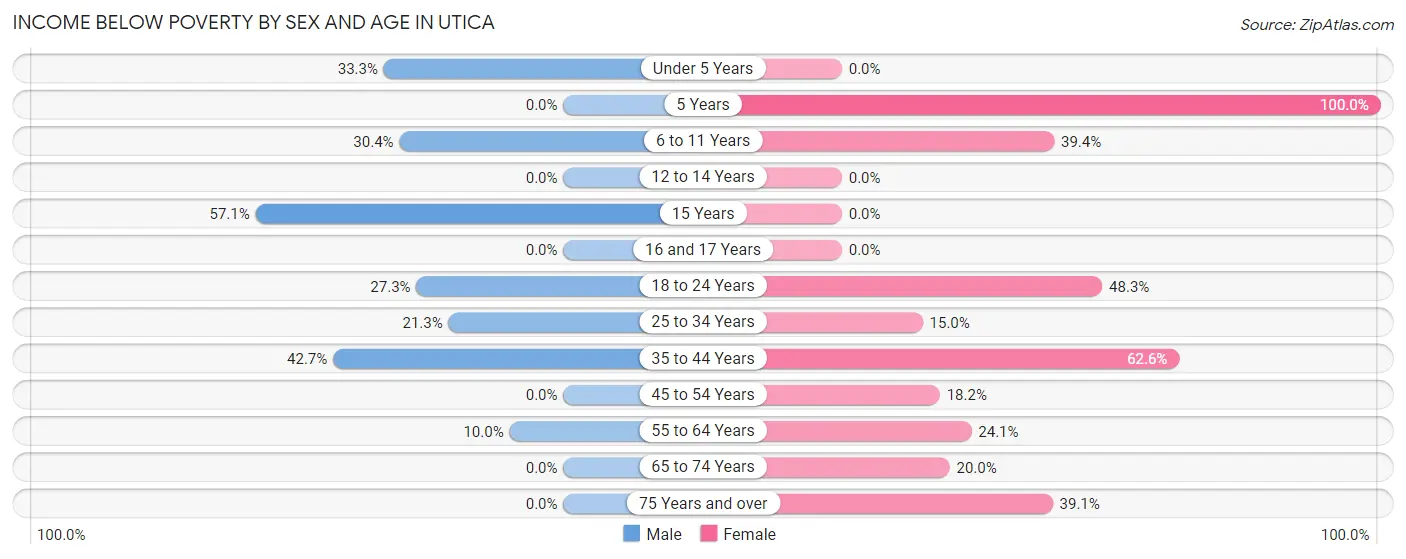
| Age Bracket | Male | Female |
| Under 5 Years | 19 (33.3%) | 0 (0.0%) |
| 5 Years | 0 (0.0%) | 2 (100.0%) |
| 6 to 11 Years | 14 (30.4%) | 13 (39.4%) |
| 12 to 14 Years | 0 (0.0%) | 0 (0.0%) |
| 15 Years | 8 (57.1%) | 0 (0.0%) |
| 16 and 17 Years | 0 (0.0%) | 0 (0.0%) |
| 18 to 24 Years | 6 (27.3%) | 29 (48.3%) |
| 25 to 34 Years | 13 (21.3%) | 3 (15.0%) |
| 35 to 44 Years | 53 (42.7%) | 67 (62.6%) |
| 45 to 54 Years | 0 (0.0%) | 8 (18.2%) |
| 55 to 64 Years | 6 (10.0%) | 19 (24.0%) |
| 65 to 74 Years | 0 (0.0%) | 11 (20.0%) |
| 75 Years and over | 0 (0.0%) | 9 (39.1%) |
| Total | 119 (22.4%) | 161 (36.2%) |
Income Above Poverty by Sex and Age in Utica
According to the poverty statistics in Utica, males aged 12 to 14 years and females aged under 5 years are the age groups that are most secure financially, with 100.0% of males and 100.0% of females in these age groups living above the poverty line.
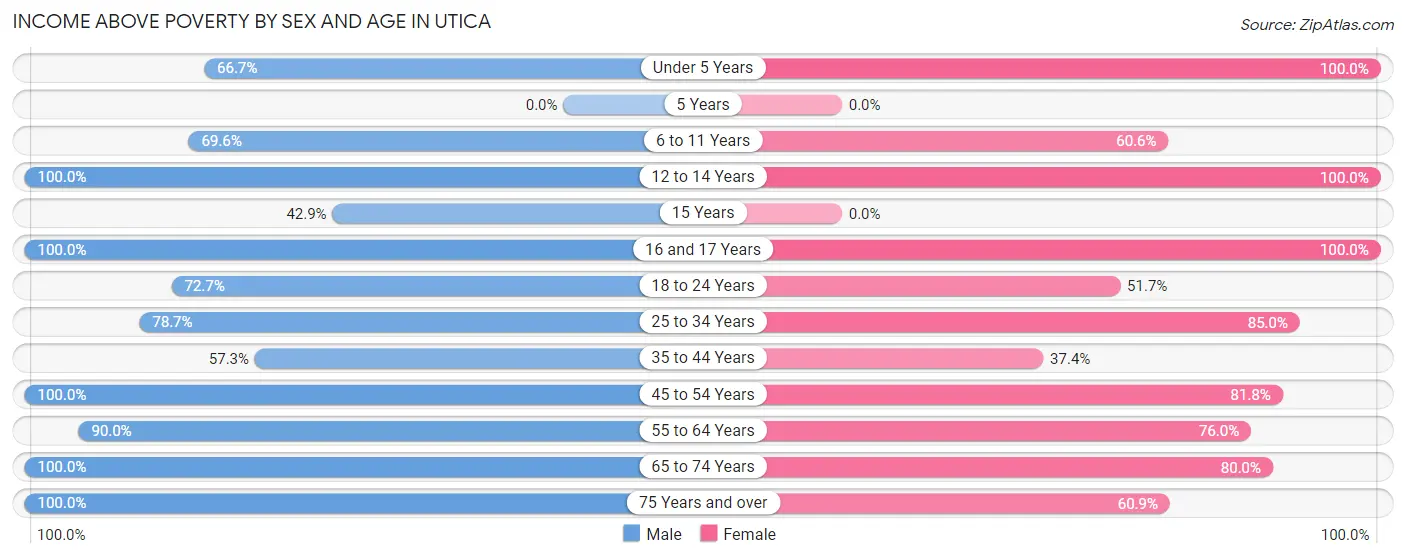
| Age Bracket | Male | Female |
| Under 5 Years | 38 (66.7%) | 5 (100.0%) |
| 5 Years | 0 (0.0%) | 0 (0.0%) |
| 6 to 11 Years | 32 (69.6%) | 20 (60.6%) |
| 12 to 14 Years | 35 (100.0%) | 4 (100.0%) |
| 15 Years | 6 (42.9%) | 0 (0.0%) |
| 16 and 17 Years | 12 (100.0%) | 13 (100.0%) |
| 18 to 24 Years | 16 (72.7%) | 31 (51.7%) |
| 25 to 34 Years | 48 (78.7%) | 17 (85.0%) |
| 35 to 44 Years | 71 (57.3%) | 40 (37.4%) |
| 45 to 54 Years | 38 (100.0%) | 36 (81.8%) |
| 55 to 64 Years | 54 (90.0%) | 60 (75.9%) |
| 65 to 74 Years | 50 (100.0%) | 44 (80.0%) |
| 75 Years and over | 13 (100.0%) | 14 (60.9%) |
| Total | 413 (77.6%) | 284 (63.8%) |
Income Below Poverty Among Married-Couple Families in Utica
The poverty statistics for married-couple families in Utica show that 2.6% or 2 of the total 78 families live below the poverty line. Families with 1 or 2 children have the highest poverty rate of 5.6%, comprising of 2 families. On the other hand, families with no children have the lowest poverty rate of 0.0%, which includes 0 families.
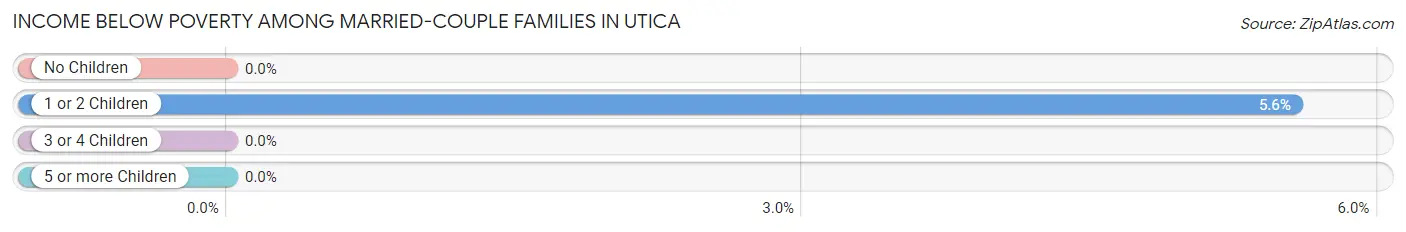
| Children | Above Poverty | Below Poverty |
| No Children | 42 (100.0%) | 0 (0.0%) |
| 1 or 2 Children | 34 (94.4%) | 2 (5.6%) |
| 3 or 4 Children | 0 (0.0%) | 0 (0.0%) |
| 5 or more Children | 0 (0.0%) | 0 (0.0%) |
| Total | 76 (97.4%) | 2 (2.6%) |
Income Below Poverty Among Single-Parent Households in Utica
According to the poverty data in Utica, 70.8% or 51 single-father households and 34.6% or 28 single-mother households are living below the poverty line. Among single-father households, those with no children have the highest poverty rate, with 51 households (86.4%) experiencing poverty. Likewise, among single-mother households, those with 3 or 4 children have the highest poverty rate, with 8 households (66.7%) falling below the poverty line.
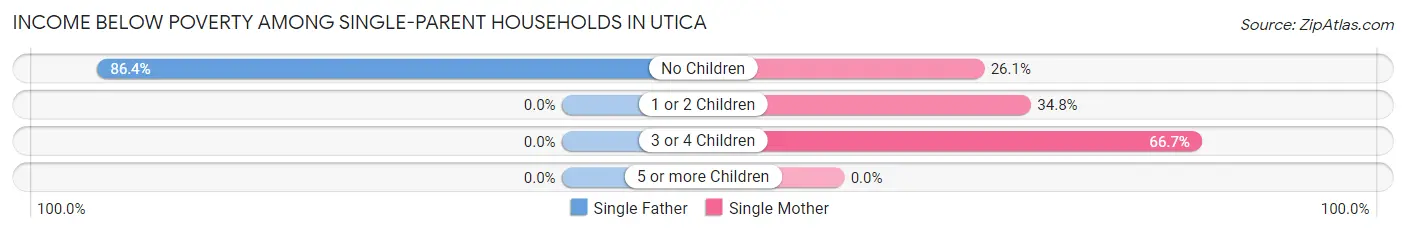
| Children | Single Father | Single Mother |
| No Children | 51 (86.4%) | 12 (26.1%) |
| 1 or 2 Children | 0 (0.0%) | 8 (34.8%) |
| 3 or 4 Children | 0 (0.0%) | 8 (66.7%) |
| 5 or more Children | 0 (0.0%) | 0 (0.0%) |
| Total | 51 (70.8%) | 28 (34.6%) |
Income Below Poverty Among Married-Couple vs Single-Parent Households in Utica
The poverty data for Utica shows that 2 of the married-couple family households (2.6%) and 79 of the single-parent households (51.6%) are living below the poverty level. Within the married-couple family households, those with 1 or 2 children have the highest poverty rate, with 2 households (5.6%) falling below the poverty line. Among the single-parent households, those with no children have the highest poverty rate, with 63 household (60.0%) living below poverty.
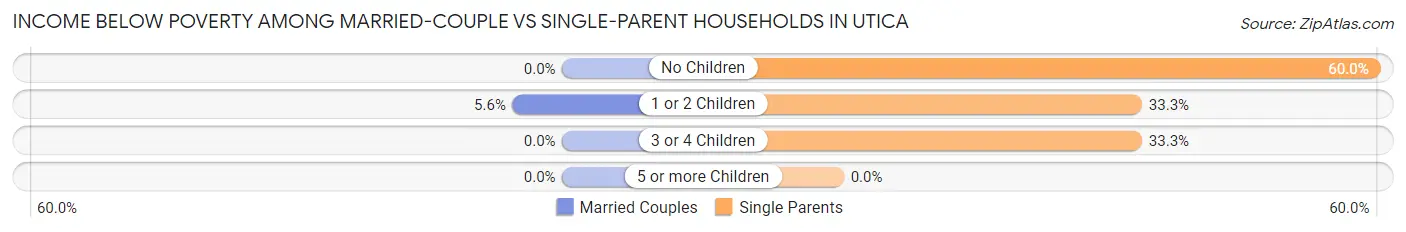
| Children | Married-Couple Families | Single-Parent Households |
| No Children | 0 (0.0%) | 63 (60.0%) |
| 1 or 2 Children | 2 (5.6%) | 8 (33.3%) |
| 3 or 4 Children | 0 (0.0%) | 8 (33.3%) |
| 5 or more Children | 0 (0.0%) | 0 (0.0%) |
| Total | 2 (2.6%) | 79 (51.6%) |
Race in Utica
The most populous races in Utica are Black / African American (797 | 81.6%), White / Caucasian (146 | 14.9%), and Some other Race (27 | 2.8%).
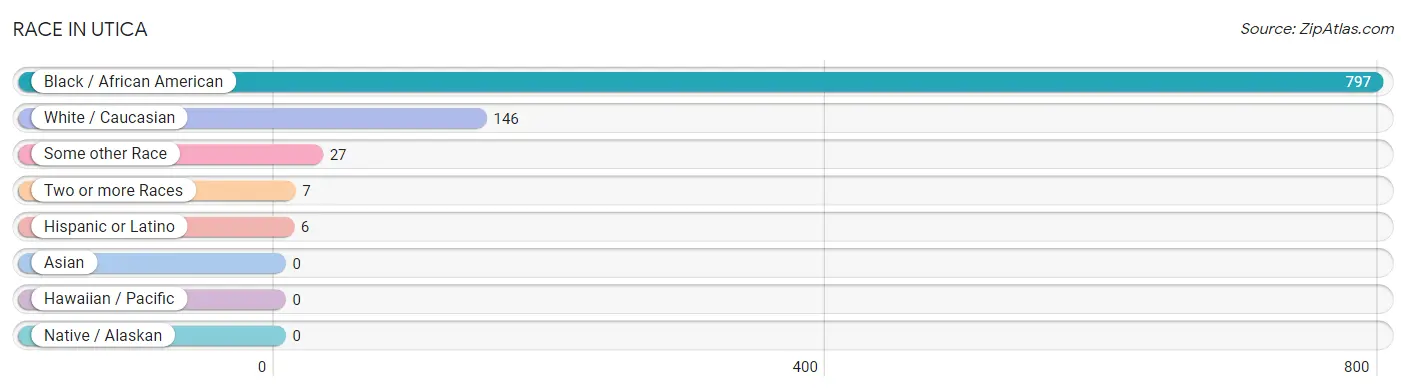
| Race | # Population | % Population |
| Asian | 0 | 0.0% |
| Black / African American | 797 | 81.6% |
| Hawaiian / Pacific | 0 | 0.0% |
| Hispanic or Latino | 6 | 0.6% |
| Native / Alaskan | 0 | 0.0% |
| White / Caucasian | 146 | 14.9% |
| Two or more Races | 7 | 0.7% |
| Some other Race | 27 | 2.8% |
| Total | 977 | 100.0% |
Ancestry in Utica
The most populous ancestries reported in Utica are American (15 | 1.5%), English (12 | 1.2%), Scottish (9 | 0.9%), Subsaharan African (8 | 0.8%), and Mexican (6 | 0.6%), together accounting for 5.1% of all Utica residents.
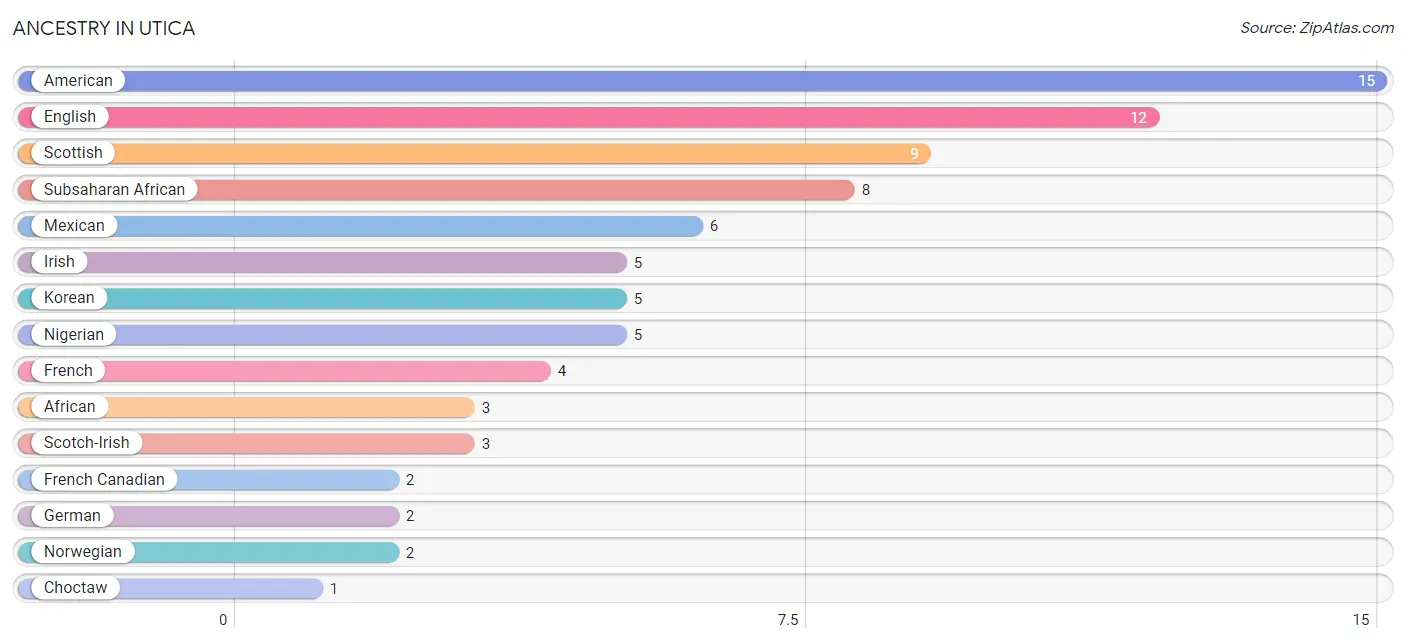
| Ancestry | # Population | % Population |
| African | 3 | 0.3% |
| American | 15 | 1.5% |
| Choctaw | 1 | 0.1% |
| English | 12 | 1.2% |
| European | 1 | 0.1% |
| French | 4 | 0.4% |
| French Canadian | 2 | 0.2% |
| German | 2 | 0.2% |
| Irish | 5 | 0.5% |
| Italian | 1 | 0.1% |
| Korean | 5 | 0.5% |
| Mexican | 6 | 0.6% |
| Nigerian | 5 | 0.5% |
| Northern European | 1 | 0.1% |
| Norwegian | 2 | 0.2% |
| Scotch-Irish | 3 | 0.3% |
| Scottish | 9 | 0.9% |
| Subsaharan African | 8 | 0.8% | View All 18 Rows |
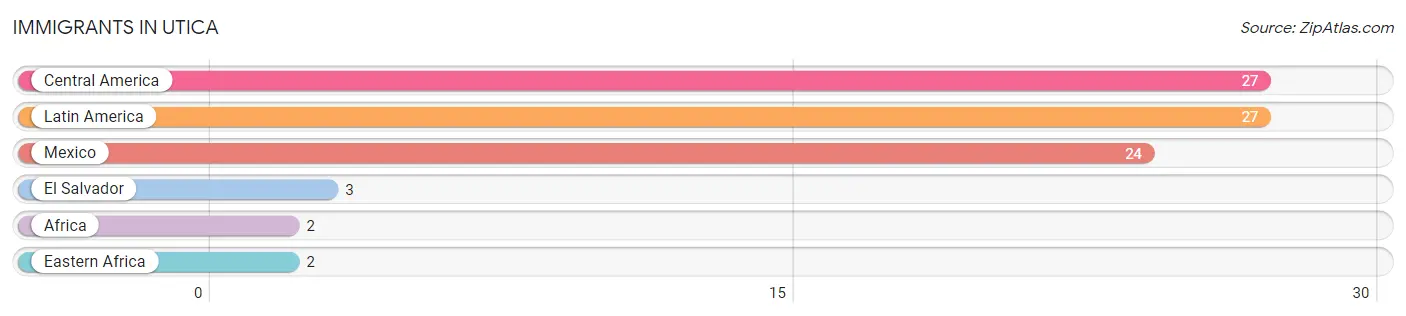
Immigrants in Utica
The most numerous immigrant groups reported in Utica came from Central America (27 | 2.8%), Latin America (27 | 2.8%), Mexico (24 | 2.5%), El Salvador (3 | 0.3%), and Africa (2 | 0.2%), together accounting for 8.5% of all Utica residents.
| Immigration Origin | # Population | % Population |
| Africa | 2 | 0.2% |
| Central America | 27 | 2.8% |
| Eastern Africa | 2 | 0.2% |
| El Salvador | 3 | 0.3% |
| Latin America | 27 | 2.8% |
| Mexico | 24 | 2.5% | View All 6 Rows |
Sex and Age in Utica
Sex and Age in Utica
The most populous age groups in Utica are 40 to 44 Years (96 | 18.0%) for men and 35 to 39 Years (83 | 18.6%) for women.
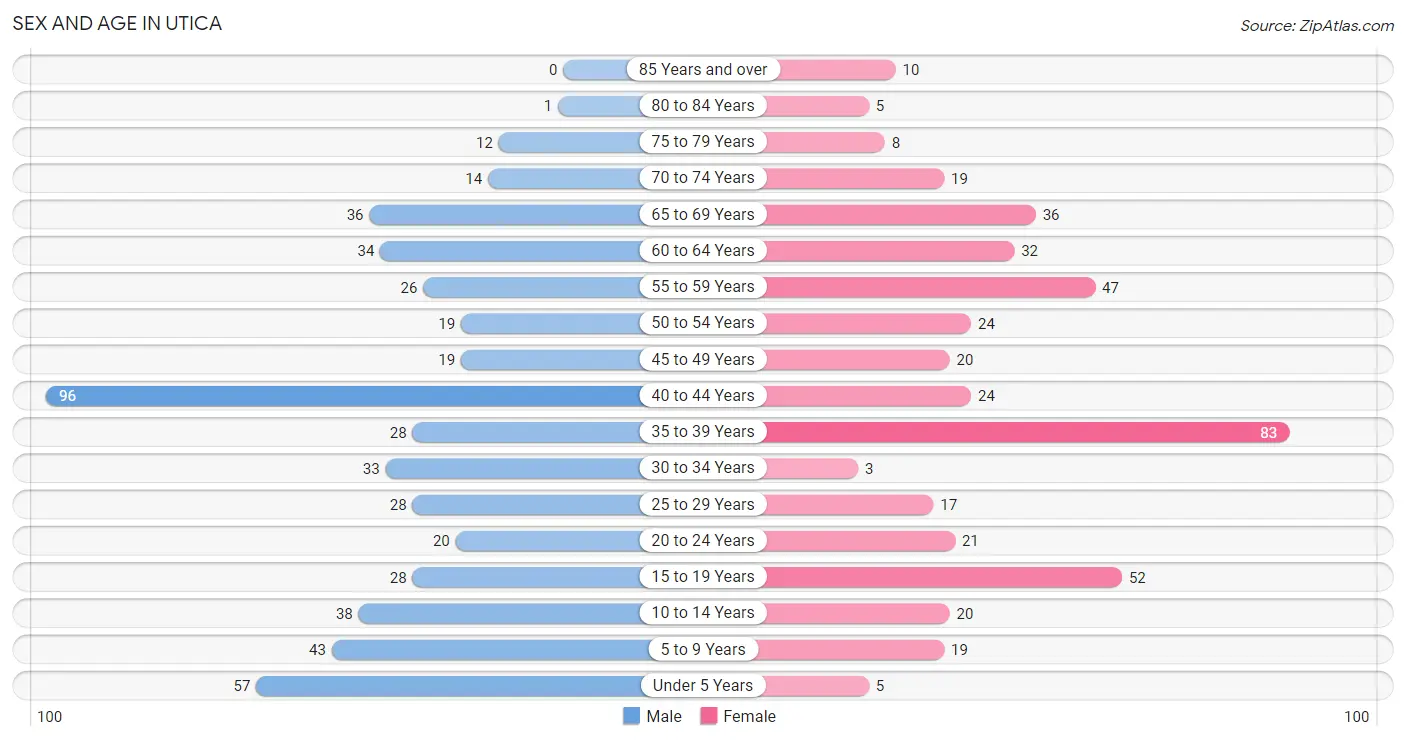
| Age Bracket | Male | Female |
| Under 5 Years | 57 (10.7%) | 5 (1.1%) |
| 5 to 9 Years | 43 (8.1%) | 19 (4.3%) |
| 10 to 14 Years | 38 (7.1%) | 20 (4.5%) |
| 15 to 19 Years | 28 (5.3%) | 52 (11.7%) |
| 20 to 24 Years | 20 (3.8%) | 21 (4.7%) |
| 25 to 29 Years | 28 (5.3%) | 17 (3.8%) |
| 30 to 34 Years | 33 (6.2%) | 3 (0.7%) |
| 35 to 39 Years | 28 (5.3%) | 83 (18.6%) |
| 40 to 44 Years | 96 (18.0%) | 24 (5.4%) |
| 45 to 49 Years | 19 (3.6%) | 20 (4.5%) |
| 50 to 54 Years | 19 (3.6%) | 24 (5.4%) |
| 55 to 59 Years | 26 (4.9%) | 47 (10.6%) |
| 60 to 64 Years | 34 (6.4%) | 32 (7.2%) |
| 65 to 69 Years | 36 (6.8%) | 36 (8.1%) |
| 70 to 74 Years | 14 (2.6%) | 19 (4.3%) |
| 75 to 79 Years | 12 (2.3%) | 8 (1.8%) |
| 80 to 84 Years | 1 (0.2%) | 5 (1.1%) |
| 85 Years and over | 0 (0.0%) | 10 (2.2%) |
| Total | 532 (100.0%) | 445 (100.0%) |
Families and Households in Utica
Median Family Size in Utica
The median family size in Utica is 3.39 persons per family, with single female/mother families (81 | 35.1%) accounting for the largest median family size of 3.85 persons per family. On the other hand, single male/father families (72 | 31.2%) represent the smallest median family size with 2.90 persons per family.
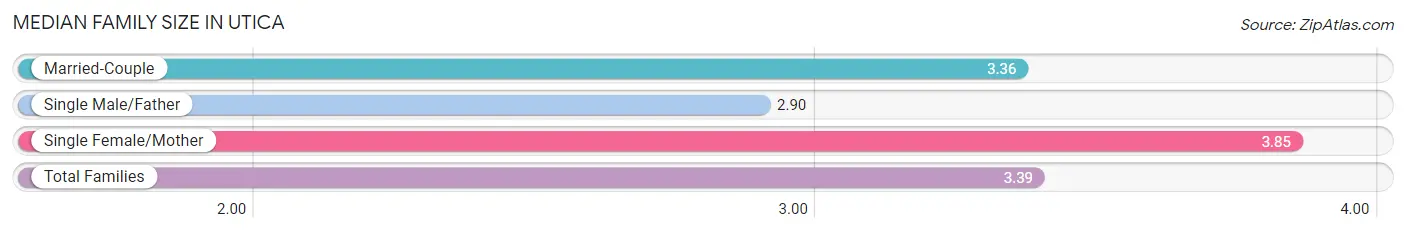
| Family Type | # Families | Family Size |
| Married-Couple | 78 (33.8%) | 3.36 |
| Single Male/Father | 72 (31.2%) | 2.90 |
| Single Female/Mother | 81 (35.1%) | 3.85 |
| Total Families | 231 (100.0%) | 3.39 |
Median Household Size in Utica
The median household size in Utica is 2.94 persons per household, with single female/mother households (81 | 24.4%) accounting for the largest median household size of 3.85 persons per household. non-family households (101 | 30.4%) represent the smallest median household size with 1.29 persons per household.
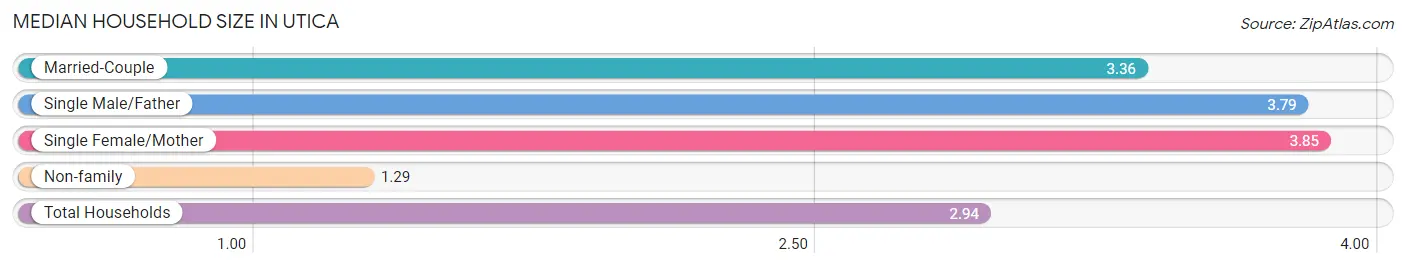
| Household Type | # Households | Household Size |
| Married-Couple | 78 (23.5%) | 3.36 |
| Single Male/Father | 72 (21.7%) | 3.79 |
| Single Female/Mother | 81 (24.4%) | 3.85 |
| Non-family | 101 (30.4%) | 1.29 |
| Total Households | 332 (100.0%) | 2.94 |
Household Size by Marriage Status in Utica
Out of a total of 332 households in Utica, 231 (69.6%) are family households, while 101 (30.4%) are nonfamily households. The most numerous type of family households are 2-person households, comprising 83, and the most common type of nonfamily households are 1-person households, comprising 78.
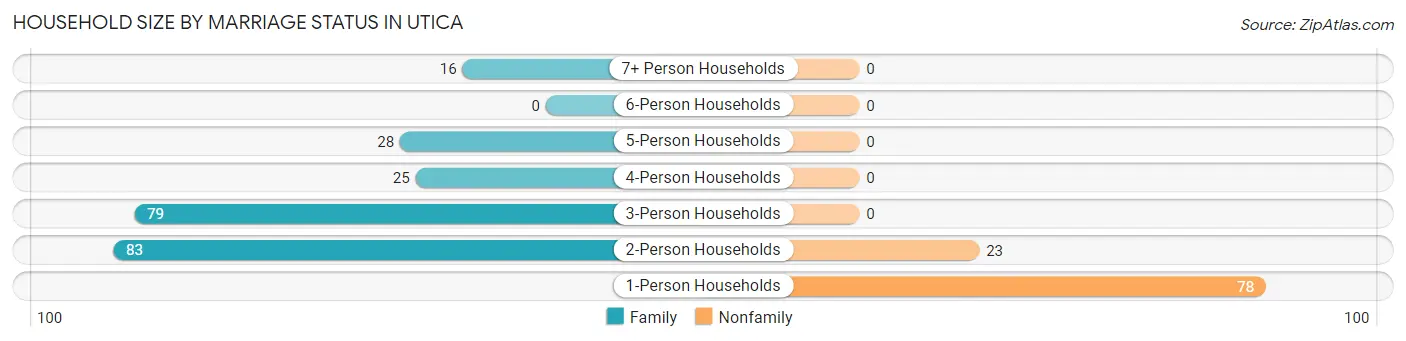
| Household Size | Family Households | Nonfamily Households |
| 1-Person Households | - | 78 (23.5%) |
| 2-Person Households | 83 (25.0%) | 23 (6.9%) |
| 3-Person Households | 79 (23.8%) | 0 (0.0%) |
| 4-Person Households | 25 (7.5%) | 0 (0.0%) |
| 5-Person Households | 28 (8.4%) | 0 (0.0%) |
| 6-Person Households | 0 (0.0%) | 0 (0.0%) |
| 7+ Person Households | 16 (4.8%) | 0 (0.0%) |
| Total | 231 (69.6%) | 101 (30.4%) |
Female Fertility in Utica
Fertility by Age in Utica
Average fertility rate in Utica is 18.0 births per 1,000 women. Women in the age bracket of 20 to 34 years have the highest fertility rate with 98.0 births per 1,000 women. Women in the age bracket of 20 to 34 years acount for 100.0% of all women with births.
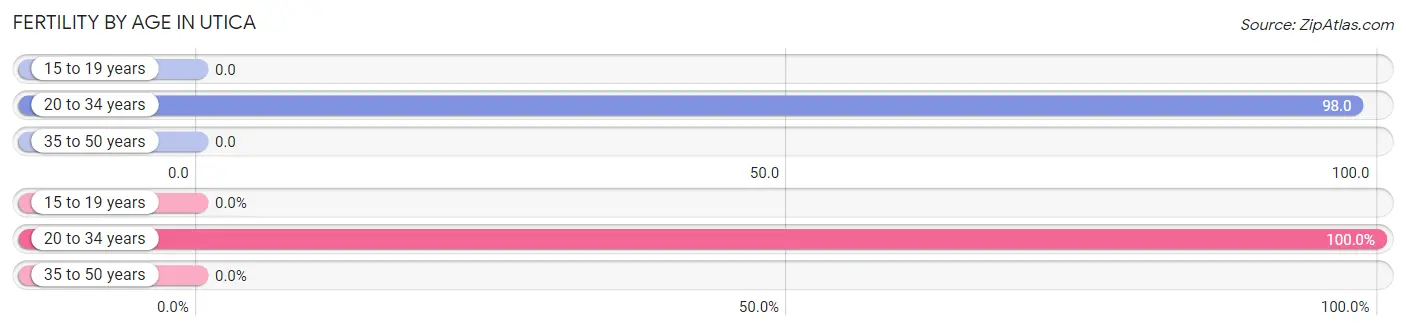
| Age Bracket | Women with Births | Births / 1,000 Women |
| 15 to 19 years | 0 (0.0%) | 0.0 |
| 20 to 34 years | 4 (100.0%) | 98.0 |
| 35 to 50 years | 0 (0.0%) | 0.0 |
| Total | 4 (100.0%) | 18.0 |
Fertility by Age by Marriage Status in Utica
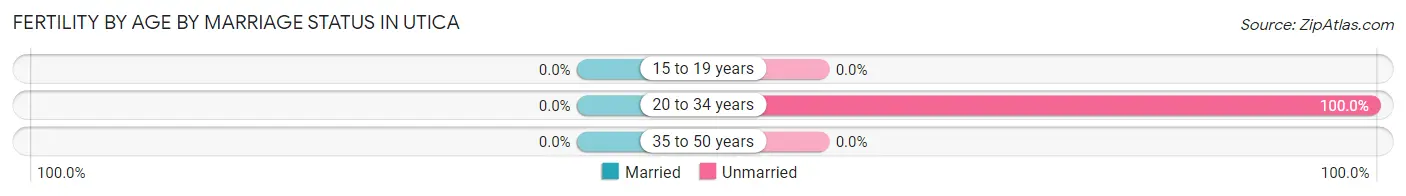
| Age Bracket | Married | Unmarried |
| 15 to 19 years | 0 (0.0%) | 0 (0.0%) |
| 20 to 34 years | 0 (0.0%) | 4 (100.0%) |
| 35 to 50 years | 0 (0.0%) | 0 (0.0%) |
| Total | 0 (0.0%) | 4 (100.0%) |
Fertility by Education in Utica
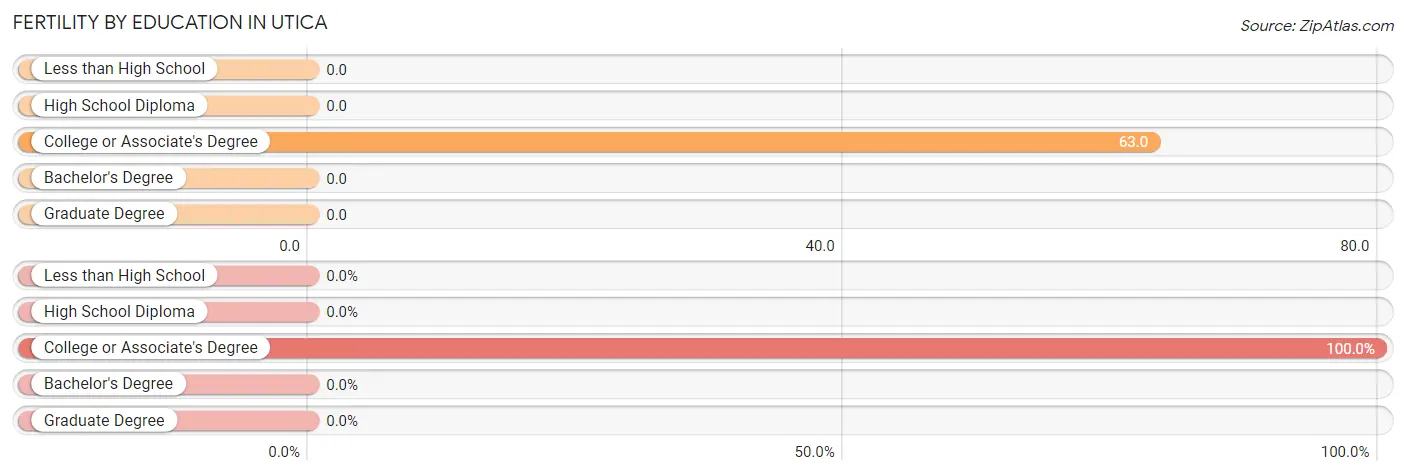
| Educational Attainment | Women with Births | Births / 1,000 Women |
| Less than High School | 0 (0.0%) | 0.0 |
| High School Diploma | 0 (0.0%) | 0.0 |
| College or Associate's Degree | 4 (100.0%) | 63.0 |
| Bachelor's Degree | 0 (0.0%) | 0.0 |
| Graduate Degree | 0 (0.0%) | 0.0 |
| Total | 4 (100.0%) | 18.0 |
Fertility by Education by Marriage Status in Utica
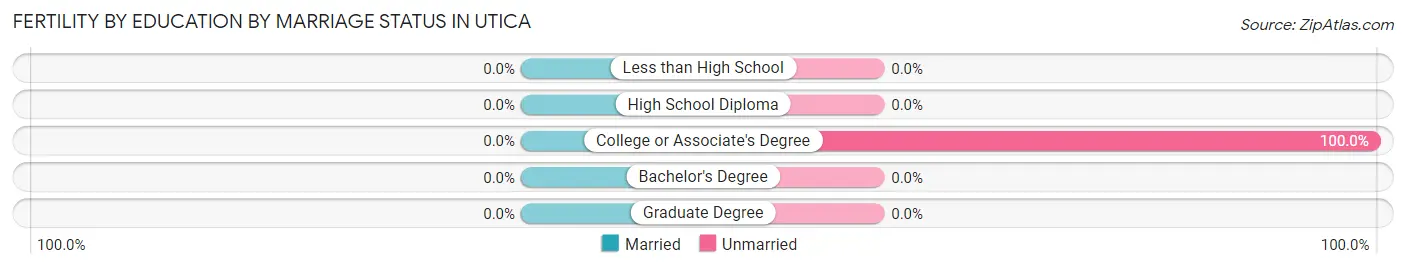
| Educational Attainment | Married | Unmarried |
| Less than High School | 0 (0.0%) | 0 (0.0%) |
| High School Diploma | 0 (0.0%) | 0 (0.0%) |
| College or Associate's Degree | 0 (0.0%) | 4 (100.0%) |
| Bachelor's Degree | 0 (0.0%) | 0 (0.0%) |
| Graduate Degree | 0 (0.0%) | 0 (0.0%) |
| Total | 0 (0.0%) | 4 (100.0%) |
Employment Characteristics in Utica
Employment by Class of Employer in Utica
Among the 332 employed individuals in Utica, private company employees (189 | 56.9%), state government employees (76 | 22.9%), and local government employees (25 | 7.5%) make up the most common classes of employment.
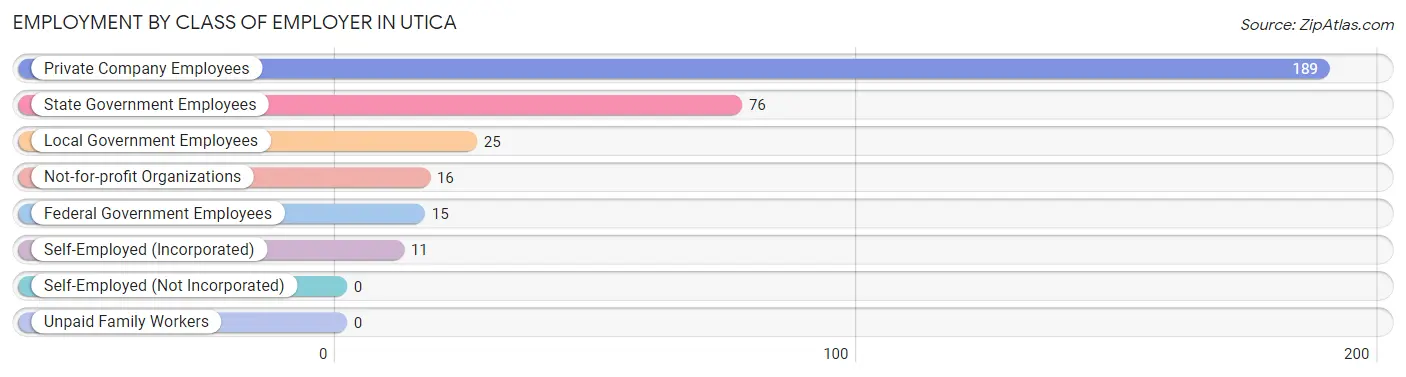
| Employer Class | # Employees | % Employees |
| Private Company Employees | 189 | 56.9% |
| Self-Employed (Incorporated) | 11 | 3.3% |
| Self-Employed (Not Incorporated) | 0 | 0.0% |
| Not-for-profit Organizations | 16 | 4.8% |
| Local Government Employees | 25 | 7.5% |
| State Government Employees | 76 | 22.9% |
| Federal Government Employees | 15 | 4.5% |
| Unpaid Family Workers | 0 | 0.0% |
| Total | 332 | 100.0% |
Employment Status by Age in Utica
According to the labor force statistics for Utica, out of the total population over 16 years of age (781), 44.0% or 344 individuals are in the labor force, with 3.5% or 12 of them unemployed. The age group with the highest labor force participation rate is 30 to 34 years, with 88.9% or 32 individuals in the labor force. Within the labor force, the 20 to 24 years age range has the highest percentage of unemployed individuals, with 12.5% or 4 of them being unemployed.
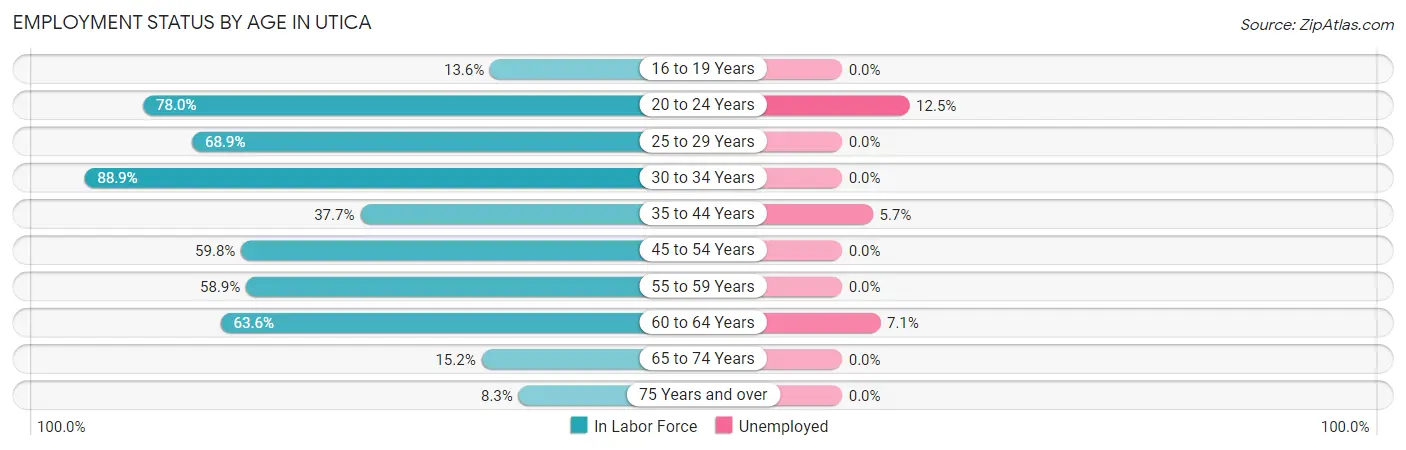
| Age Bracket | In Labor Force | Unemployed |
| 16 to 19 Years | 9 (13.6%) | 0 (0.0%) |
| 20 to 24 Years | 32 (78.0%) | 4 (12.5%) |
| 25 to 29 Years | 31 (68.9%) | 0 (0.0%) |
| 30 to 34 Years | 32 (88.9%) | 0 (0.0%) |
| 35 to 44 Years | 87 (37.7%) | 5 (5.7%) |
| 45 to 54 Years | 49 (59.8%) | 0 (0.0%) |
| 55 to 59 Years | 43 (58.9%) | 0 (0.0%) |
| 60 to 64 Years | 42 (63.6%) | 3 (7.1%) |
| 65 to 74 Years | 16 (15.2%) | 0 (0.0%) |
| 75 Years and over | 3 (8.3%) | 0 (0.0%) |
| Total | 344 (44.0%) | 12 (3.5%) |
Employment Status by Educational Attainment in Utica
According to labor force statistics for Utica, 53.3% of individuals (284) out of the total population between 25 and 64 years of age (533) are in the labor force, with 2.8% or 8 of them being unemployed. The group with the highest labor force participation rate are those with the educational attainment of bachelor's degree or higher, with 81.3% or 65 individuals in the labor force. Within the labor force, individuals with high school diploma education have the highest percentage of unemployment, with 4.8% or 3 of them being unemployed.
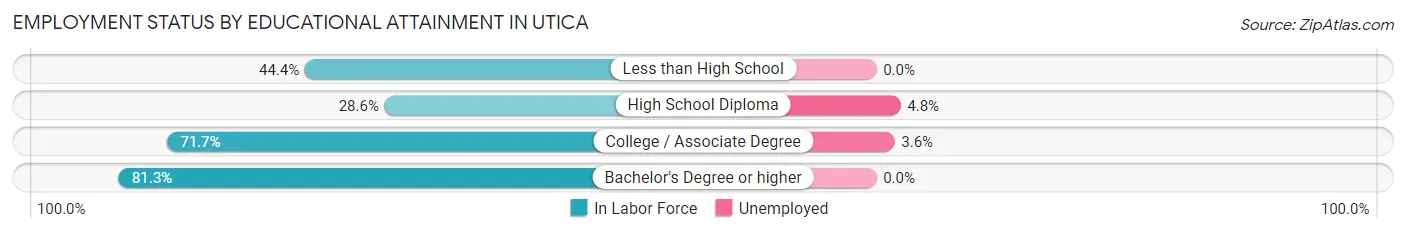
| Educational Attainment | In Labor Force | Unemployed |
| Less than High School | 20 (44.4%) | 0 (0.0%) |
| High School Diploma | 62 (28.6%) | 10 (4.8%) |
| College / Associate Degree | 137 (71.7%) | 7 (3.6%) |
| Bachelor's Degree or higher | 65 (81.3%) | 0 (0.0%) |
| Total | 284 (53.3%) | 15 (2.8%) |
Employment Occupations by Sex in Utica
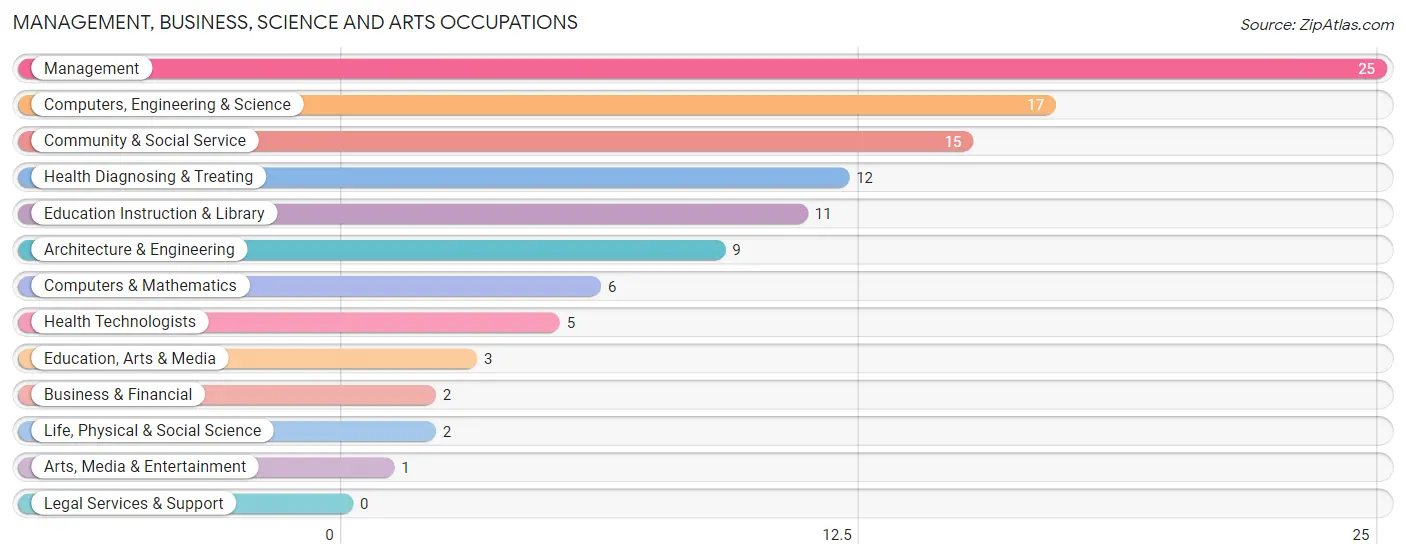
Management, Business, Science and Arts Occupations
The most common Management, Business, Science and Arts occupations in Utica are Management (25 | 7.5%), Computers, Engineering & Science (17 | 5.1%), Community & Social Service (15 | 4.5%), Health Diagnosing & Treating (12 | 3.6%), and Education Instruction & Library (11 | 3.3%).
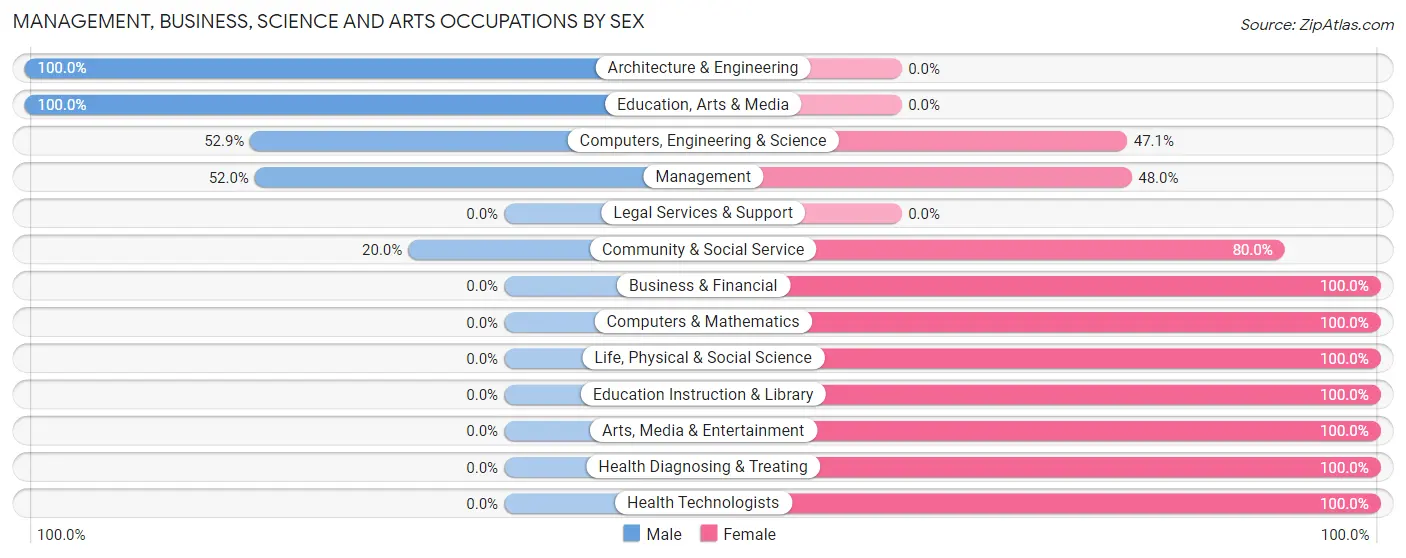
Management, Business, Science and Arts Occupations by Sex
Within the Management, Business, Science and Arts occupations in Utica, the most male-oriented occupations are Architecture & Engineering (100.0%), Education, Arts & Media (100.0%), and Computers, Engineering & Science (52.9%), while the most female-oriented occupations are Business & Financial (100.0%), Computers & Mathematics (100.0%), and Life, Physical & Social Science (100.0%).
| Occupation | Male | Female |
| Management | 13 (52.0%) | 12 (48.0%) |
| Business & Financial | 0 (0.0%) | 2 (100.0%) |
| Computers, Engineering & Science | 9 (52.9%) | 8 (47.1%) |
| Computers & Mathematics | 0 (0.0%) | 6 (100.0%) |
| Architecture & Engineering | 9 (100.0%) | 0 (0.0%) |
| Life, Physical & Social Science | 0 (0.0%) | 2 (100.0%) |
| Community & Social Service | 3 (20.0%) | 12 (80.0%) |
| Education, Arts & Media | 3 (100.0%) | 0 (0.0%) |
| Legal Services & Support | 0 (0.0%) | 0 (0.0%) |
| Education Instruction & Library | 0 (0.0%) | 11 (100.0%) |
| Arts, Media & Entertainment | 0 (0.0%) | 1 (100.0%) |
| Health Diagnosing & Treating | 0 (0.0%) | 12 (100.0%) |
| Health Technologists | 0 (0.0%) | 5 (100.0%) |
| Total (Category) | 25 (35.2%) | 46 (64.8%) |
| Total (Overall) | 177 (53.3%) | 155 (46.7%) |
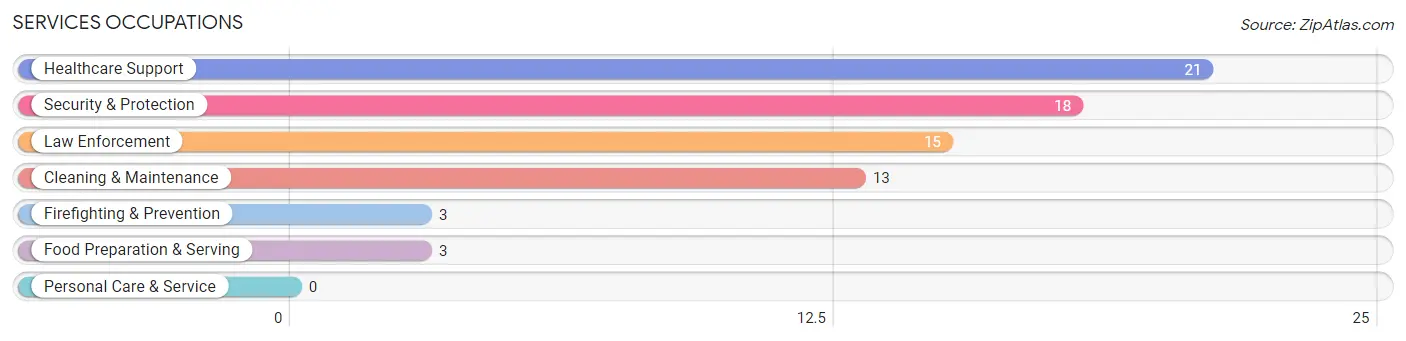
Services Occupations
The most common Services occupations in Utica are Healthcare Support (21 | 6.3%), Security & Protection (18 | 5.4%), Law Enforcement (15 | 4.5%), Cleaning & Maintenance (13 | 3.9%), and Firefighting & Prevention (3 | 0.9%).
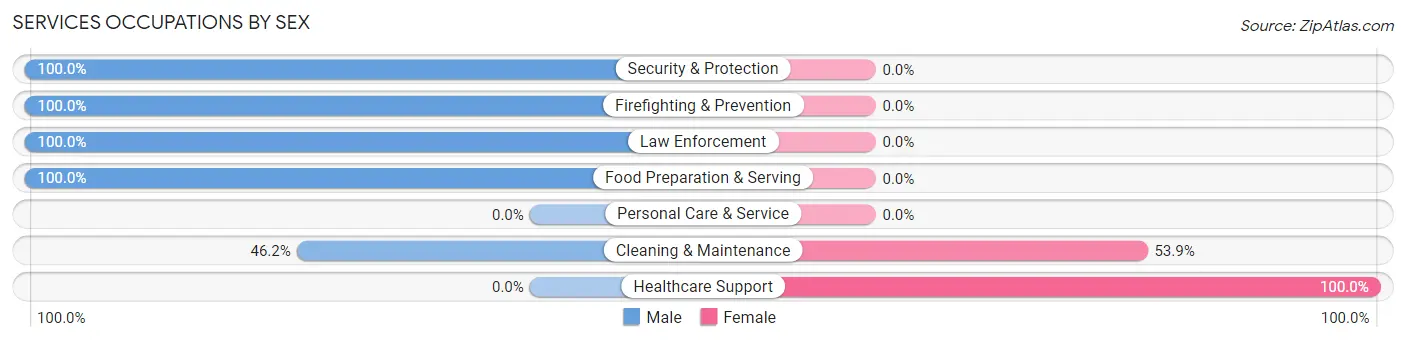
Services Occupations by Sex
Within the Services occupations in Utica, the most male-oriented occupations are Security & Protection (100.0%), Firefighting & Prevention (100.0%), and Law Enforcement (100.0%), while the most female-oriented occupations are Healthcare Support (100.0%), and Cleaning & Maintenance (53.8%).
| Occupation | Male | Female |
| Healthcare Support | 0 (0.0%) | 21 (100.0%) |
| Security & Protection | 18 (100.0%) | 0 (0.0%) |
| Firefighting & Prevention | 3 (100.0%) | 0 (0.0%) |
| Law Enforcement | 15 (100.0%) | 0 (0.0%) |
| Food Preparation & Serving | 3 (100.0%) | 0 (0.0%) |
| Cleaning & Maintenance | 6 (46.2%) | 7 (53.8%) |
| Personal Care & Service | 0 (0.0%) | 0 (0.0%) |
| Total (Category) | 27 (49.1%) | 28 (50.9%) |
| Total (Overall) | 177 (53.3%) | 155 (46.7%) |
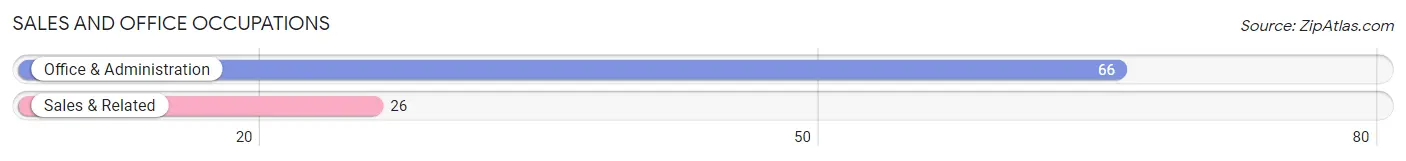
Sales and Office Occupations
The most common Sales and Office occupations in Utica are Office & Administration (66 | 19.9%), and Sales & Related (26 | 7.8%).
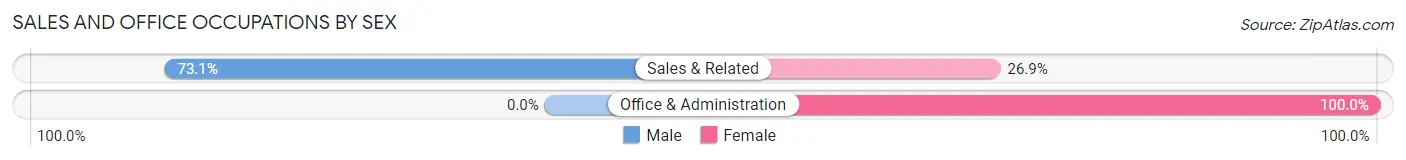
Sales and Office Occupations by Sex
| Occupation | Male | Female |
| Sales & Related | 19 (73.1%) | 7 (26.9%) |
| Office & Administration | 0 (0.0%) | 66 (100.0%) |
| Total (Category) | 19 (20.6%) | 73 (79.3%) |
| Total (Overall) | 177 (53.3%) | 155 (46.7%) |
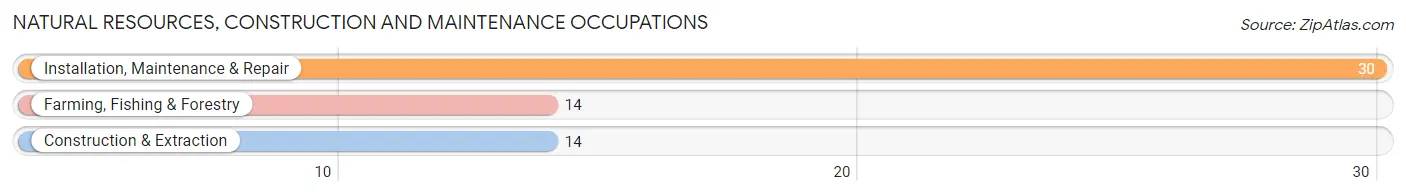
Natural Resources, Construction and Maintenance Occupations
The most common Natural Resources, Construction and Maintenance occupations in Utica are Installation, Maintenance & Repair (30 | 9.0%), Farming, Fishing & Forestry (14 | 4.2%), and Construction & Extraction (14 | 4.2%).
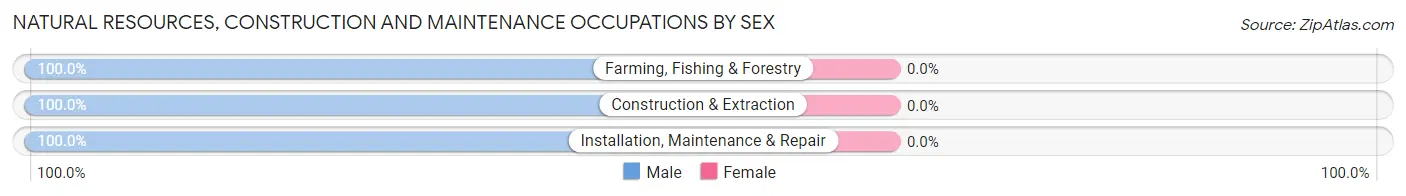
Natural Resources, Construction and Maintenance Occupations by Sex
| Occupation | Male | Female |
| Farming, Fishing & Forestry | 14 (100.0%) | 0 (0.0%) |
| Construction & Extraction | 14 (100.0%) | 0 (0.0%) |
| Installation, Maintenance & Repair | 30 (100.0%) | 0 (0.0%) |
| Total (Category) | 58 (100.0%) | 0 (0.0%) |
| Total (Overall) | 177 (53.3%) | 155 (46.7%) |
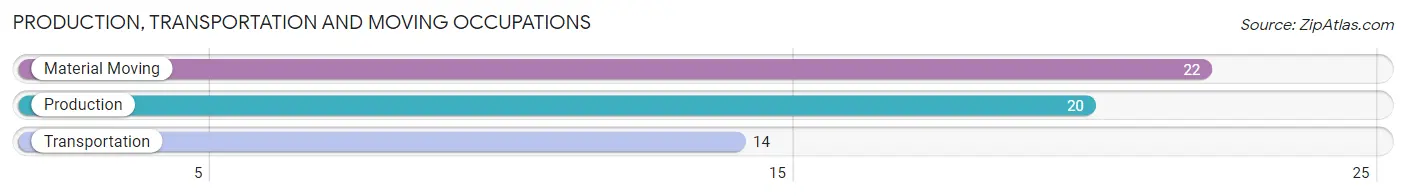
Production, Transportation and Moving Occupations
The most common Production, Transportation and Moving occupations in Utica are Material Moving (22 | 6.6%), Production (20 | 6.0%), and Transportation (14 | 4.2%).
Production, Transportation and Moving Occupations by Sex
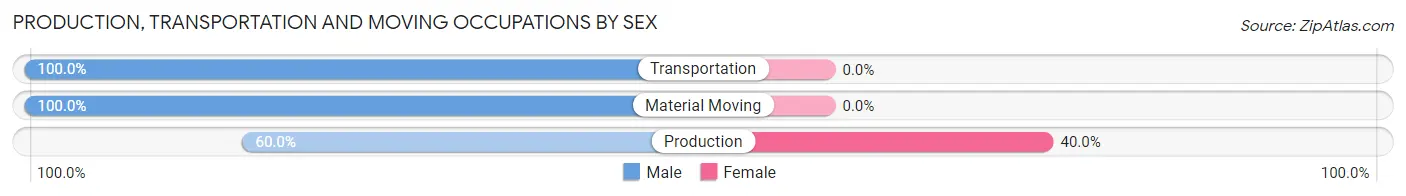
| Occupation | Male | Female |
| Production | 12 (60.0%) | 8 (40.0%) |
| Transportation | 14 (100.0%) | 0 (0.0%) |
| Material Moving | 22 (100.0%) | 0 (0.0%) |
| Total (Category) | 48 (85.7%) | 8 (14.3%) |
| Total (Overall) | 177 (53.3%) | 155 (46.7%) |
Employment Industries by Sex in Utica
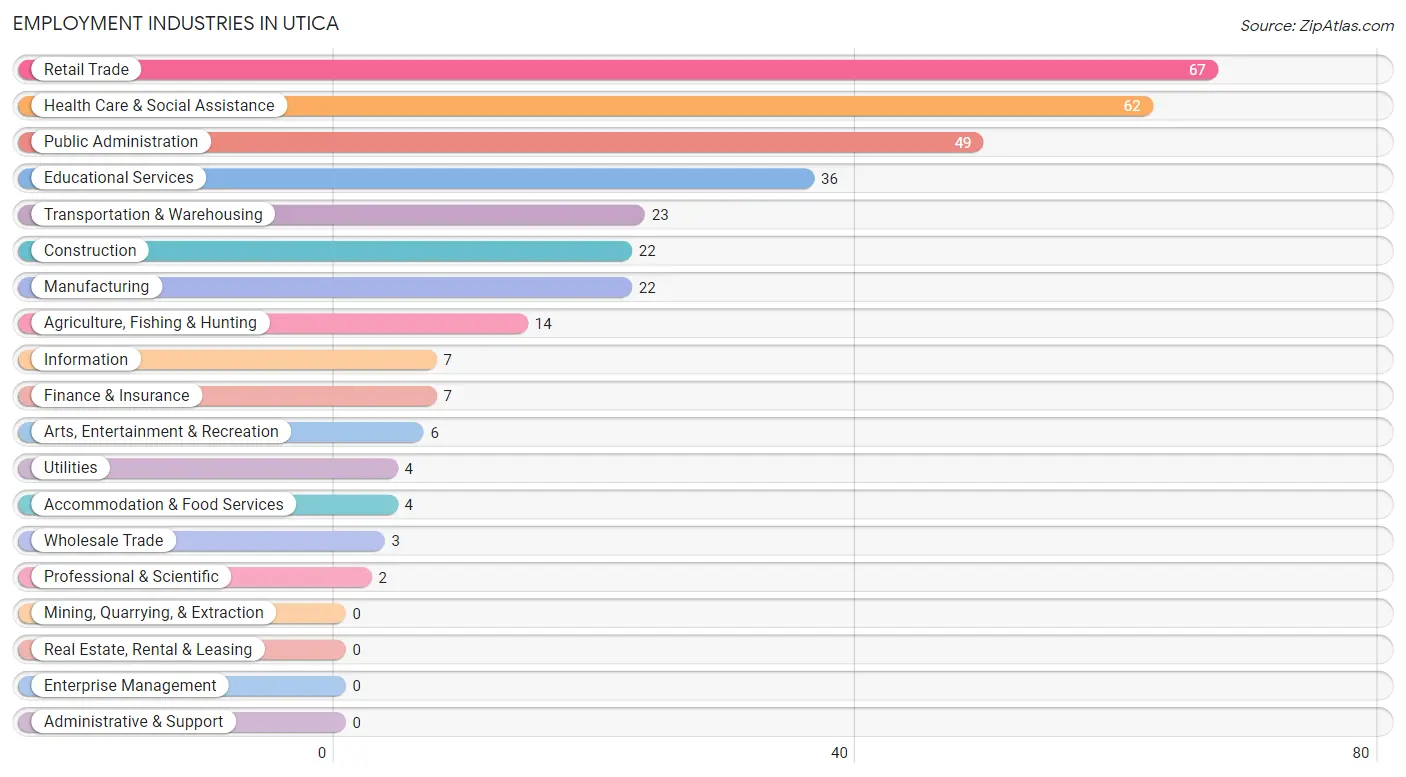
Employment Industries in Utica
The major employment industries in Utica include Retail Trade (67 | 20.2%), Health Care & Social Assistance (62 | 18.7%), Public Administration (49 | 14.8%), Educational Services (36 | 10.8%), and Transportation & Warehousing (23 | 6.9%).
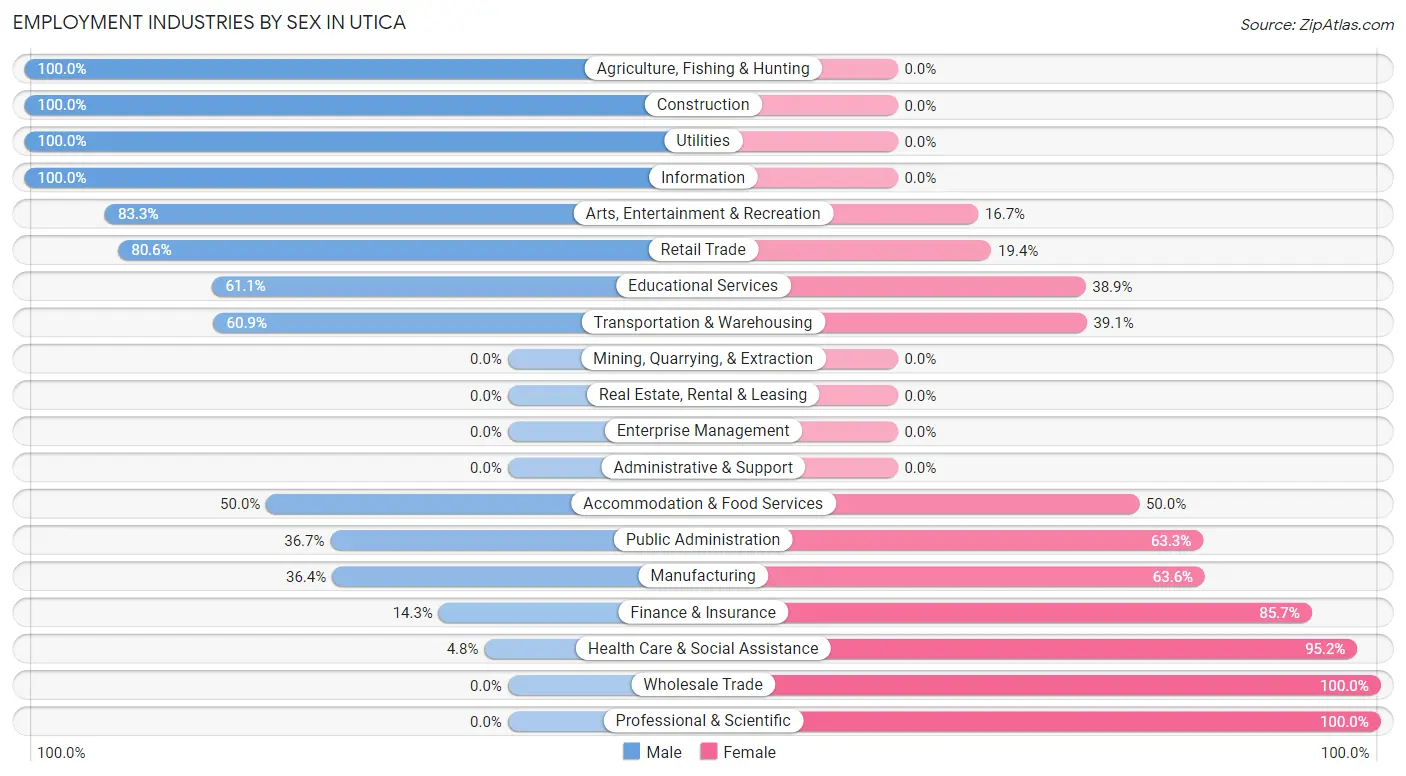
Employment Industries by Sex in Utica
The Utica industries that see more men than women are Agriculture, Fishing & Hunting (100.0%), Construction (100.0%), and Utilities (100.0%), whereas the industries that tend to have a higher number of women are Wholesale Trade (100.0%), Professional & Scientific (100.0%), and Health Care & Social Assistance (95.2%).
| Industry | Male | Female |
| Agriculture, Fishing & Hunting | 14 (100.0%) | 0 (0.0%) |
| Mining, Quarrying, & Extraction | 0 (0.0%) | 0 (0.0%) |
| Construction | 22 (100.0%) | 0 (0.0%) |
| Manufacturing | 8 (36.4%) | 14 (63.6%) |
| Wholesale Trade | 0 (0.0%) | 3 (100.0%) |
| Retail Trade | 54 (80.6%) | 13 (19.4%) |
| Transportation & Warehousing | 14 (60.9%) | 9 (39.1%) |
| Utilities | 4 (100.0%) | 0 (0.0%) |
| Information | 7 (100.0%) | 0 (0.0%) |
| Finance & Insurance | 1 (14.3%) | 6 (85.7%) |
| Real Estate, Rental & Leasing | 0 (0.0%) | 0 (0.0%) |
| Professional & Scientific | 0 (0.0%) | 2 (100.0%) |
| Enterprise Management | 0 (0.0%) | 0 (0.0%) |
| Administrative & Support | 0 (0.0%) | 0 (0.0%) |
| Educational Services | 22 (61.1%) | 14 (38.9%) |
| Health Care & Social Assistance | 3 (4.8%) | 59 (95.2%) |
| Arts, Entertainment & Recreation | 5 (83.3%) | 1 (16.7%) |
| Accommodation & Food Services | 2 (50.0%) | 2 (50.0%) |
| Public Administration | 18 (36.7%) | 31 (63.3%) |
| Total | 177 (53.3%) | 155 (46.7%) |
Education in Utica
School Enrollment in Utica
The most common levels of schooling among the 202 students in Utica are elementary school (46 | 22.8%), high school (45 | 22.3%), and middle school (40 | 19.8%).
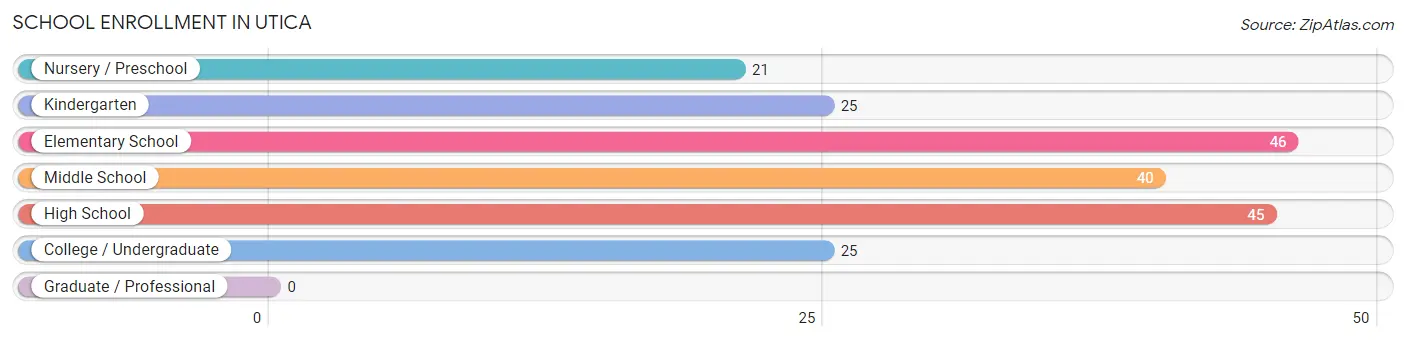
| School Level | # Students | % Students |
| Nursery / Preschool | 21 | 10.4% |
| Kindergarten | 25 | 12.4% |
| Elementary School | 46 | 22.8% |
| Middle School | 40 | 19.8% |
| High School | 45 | 22.3% |
| College / Undergraduate | 25 | 12.4% |
| Graduate / Professional | 0 | 0.0% |
| Total | 202 | 100.0% |
School Enrollment by Age by Funding Source in Utica
Out of a total of 202 students who are enrolled in schools in Utica, 52 (25.7%) attend a private institution, while the remaining 150 (74.3%) are enrolled in public schools. The age group of 3 to 4 year olds has the highest likelihood of being enrolled in private schools, with 21 (63.6% in the age bracket) enrolled. Conversely, the age group of 18 to 19 year olds has the lowest likelihood of being enrolled in a private school, with 9 (100.0% in the age bracket) attending a public institution.
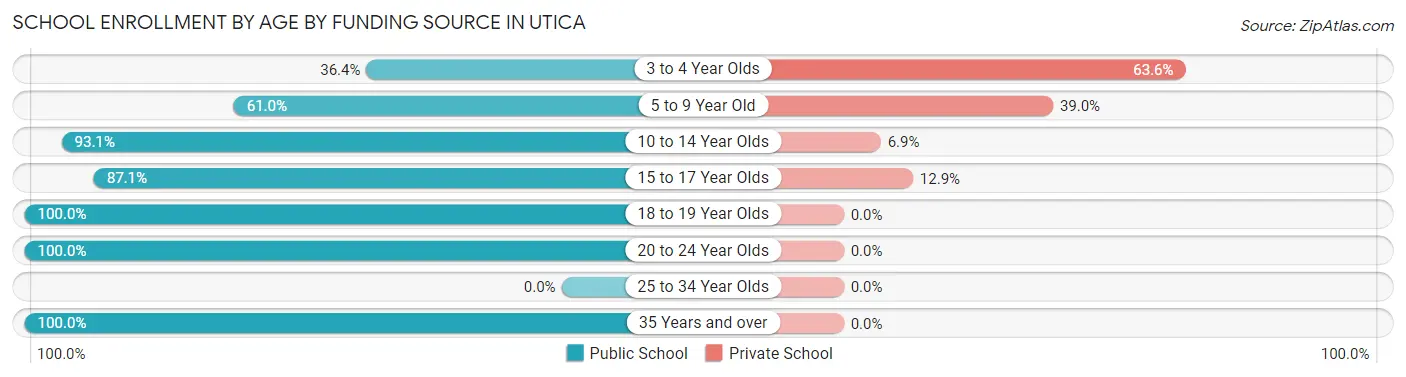
| Age Bracket | Public School | Private School |
| 3 to 4 Year Olds | 12 (36.4%) | 21 (63.6%) |
| 5 to 9 Year Old | 36 (61.0%) | 23 (39.0%) |
| 10 to 14 Year Olds | 54 (93.1%) | 4 (6.9%) |
| 15 to 17 Year Olds | 27 (87.1%) | 4 (12.9%) |
| 18 to 19 Year Olds | 9 (100.0%) | 0 (0.0%) |
| 20 to 24 Year Olds | 7 (100.0%) | 0 (0.0%) |
| 25 to 34 Year Olds | 0 (0.0%) | 0 (0.0%) |
| 35 Years and over | 5 (100.0%) | 0 (0.0%) |
| Total | 150 (74.3%) | 52 (25.7%) |
Educational Attainment by Field of Study in Utica
Arts & humanities (29 | 29.0%), business (25 | 25.0%), science & technology (12 | 12.0%), liberal arts & history (12 | 12.0%), and education (6 | 6.0%) are the most common fields of study among 100 individuals in Utica who have obtained a bachelor's degree or higher.
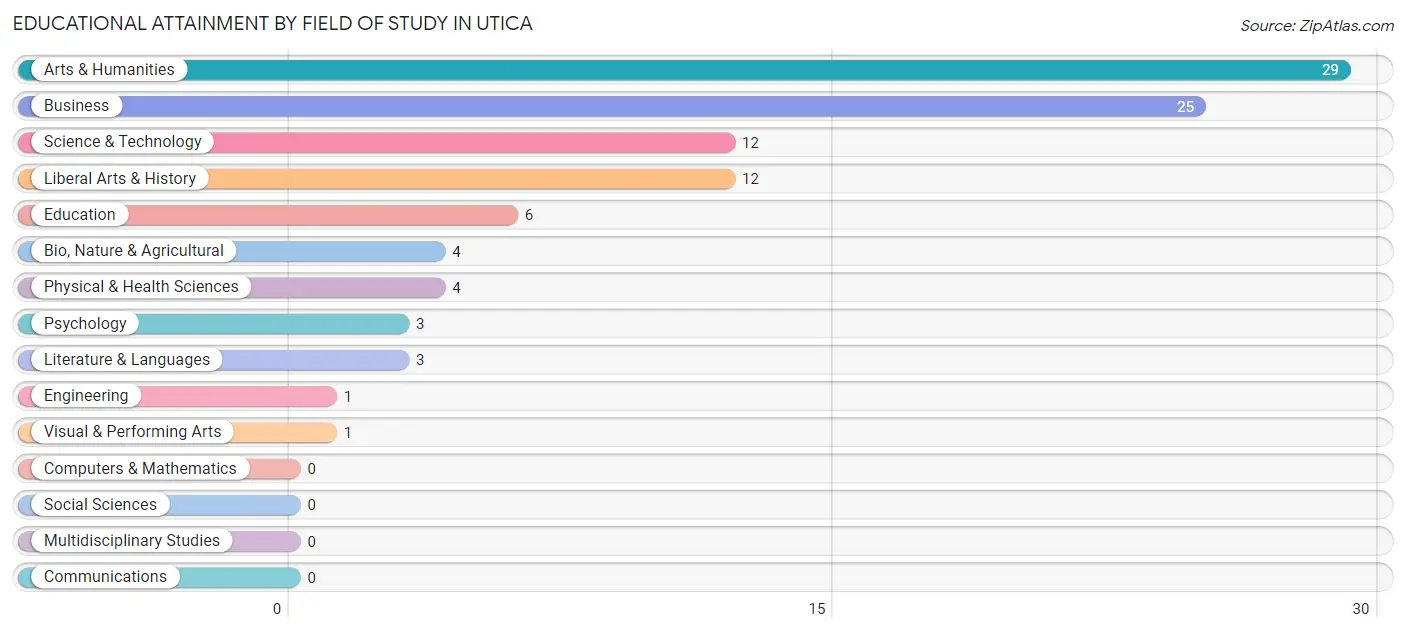
| Field of Study | # Graduates | % Graduates |
| Computers & Mathematics | 0 | 0.0% |
| Bio, Nature & Agricultural | 4 | 4.0% |
| Physical & Health Sciences | 4 | 4.0% |
| Psychology | 3 | 3.0% |
| Social Sciences | 0 | 0.0% |
| Engineering | 1 | 1.0% |
| Multidisciplinary Studies | 0 | 0.0% |
| Science & Technology | 12 | 12.0% |
| Business | 25 | 25.0% |
| Education | 6 | 6.0% |
| Literature & Languages | 3 | 3.0% |
| Liberal Arts & History | 12 | 12.0% |
| Visual & Performing Arts | 1 | 1.0% |
| Communications | 0 | 0.0% |
| Arts & Humanities | 29 | 29.0% |
| Total | 100 | 100.0% |
Transportation & Commute in Utica
Vehicle Availability by Sex in Utica
The most prevalent vehicle ownership categories in Utica are males with 2 vehicles (60, accounting for 33.9%) and females with 2 vehicles (60, making up 38.7%).
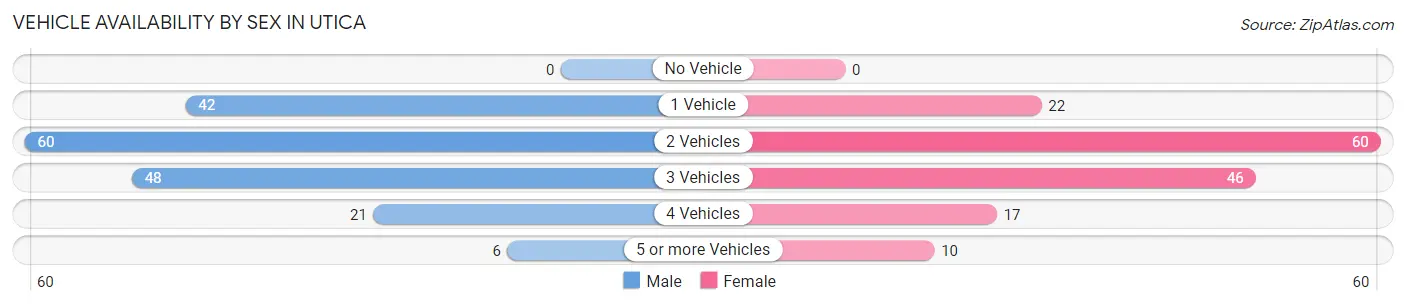
| Vehicles Available | Male | Female |
| No Vehicle | 0 (0.0%) | 0 (0.0%) |
| 1 Vehicle | 42 (23.7%) | 22 (14.2%) |
| 2 Vehicles | 60 (33.9%) | 60 (38.7%) |
| 3 Vehicles | 48 (27.1%) | 46 (29.7%) |
| 4 Vehicles | 21 (11.9%) | 17 (11.0%) |
| 5 or more Vehicles | 6 (3.4%) | 10 (6.5%) |
| Total | 177 (100.0%) | 155 (100.0%) |
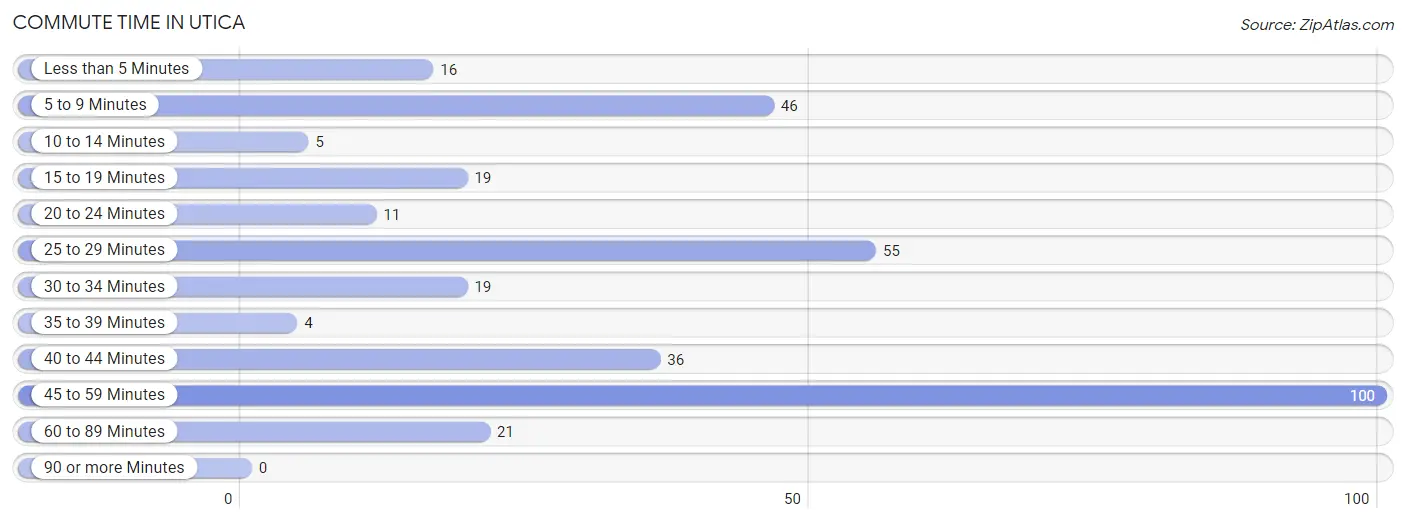
Commute Time in Utica
The most frequently occuring commute durations in Utica are 45 to 59 minutes (100 commuters, 30.1%), 25 to 29 minutes (55 commuters, 16.6%), and 5 to 9 minutes (46 commuters, 13.9%).
| Commute Time | # Commuters | % Commuters |
| Less than 5 Minutes | 16 | 4.8% |
| 5 to 9 Minutes | 46 | 13.9% |
| 10 to 14 Minutes | 5 | 1.5% |
| 15 to 19 Minutes | 19 | 5.7% |
| 20 to 24 Minutes | 11 | 3.3% |
| 25 to 29 Minutes | 55 | 16.6% |
| 30 to 34 Minutes | 19 | 5.7% |
| 35 to 39 Minutes | 4 | 1.2% |
| 40 to 44 Minutes | 36 | 10.8% |
| 45 to 59 Minutes | 100 | 30.1% |
| 60 to 89 Minutes | 21 | 6.3% |
| 90 or more Minutes | 0 | 0.0% |
Commute Time by Sex in Utica
The most common commute times in Utica are 45 to 59 minutes (67 commuters, 37.9%) for males and 40 to 44 minutes (33 commuters, 21.3%) for females.
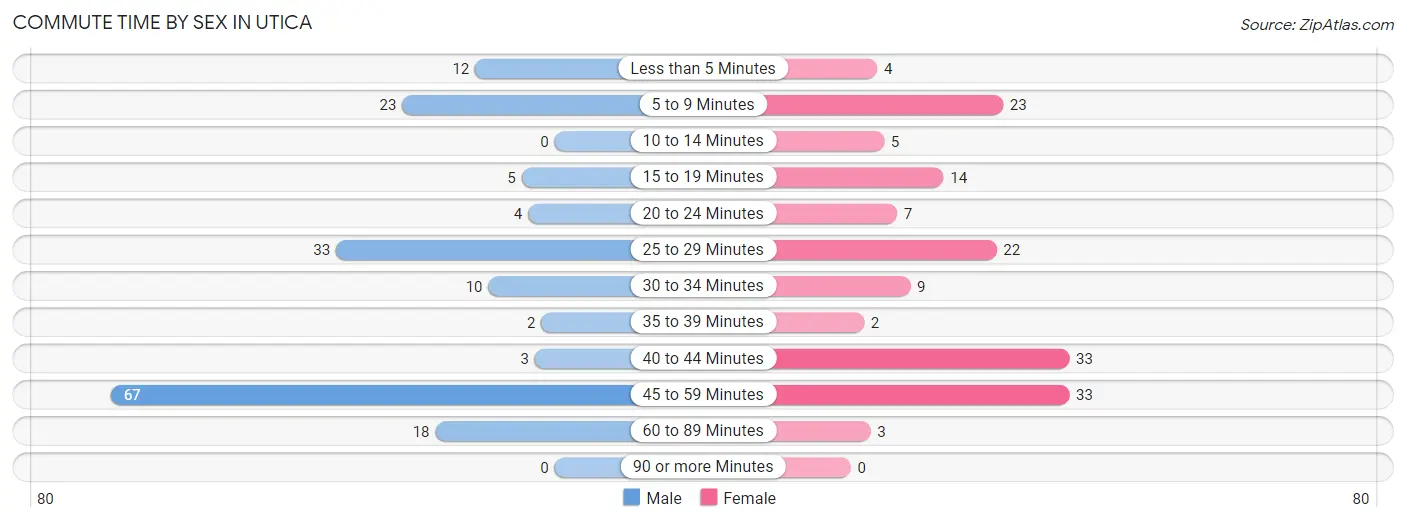
| Commute Time | Male | Female |
| Less than 5 Minutes | 12 (6.8%) | 4 (2.6%) |
| 5 to 9 Minutes | 23 (13.0%) | 23 (14.8%) |
| 10 to 14 Minutes | 0 (0.0%) | 5 (3.2%) |
| 15 to 19 Minutes | 5 (2.8%) | 14 (9.0%) |
| 20 to 24 Minutes | 4 (2.3%) | 7 (4.5%) |
| 25 to 29 Minutes | 33 (18.6%) | 22 (14.2%) |
| 30 to 34 Minutes | 10 (5.7%) | 9 (5.8%) |
| 35 to 39 Minutes | 2 (1.1%) | 2 (1.3%) |
| 40 to 44 Minutes | 3 (1.7%) | 33 (21.3%) |
| 45 to 59 Minutes | 67 (37.9%) | 33 (21.3%) |
| 60 to 89 Minutes | 18 (10.2%) | 3 (1.9%) |
| 90 or more Minutes | 0 (0.0%) | 0 (0.0%) |
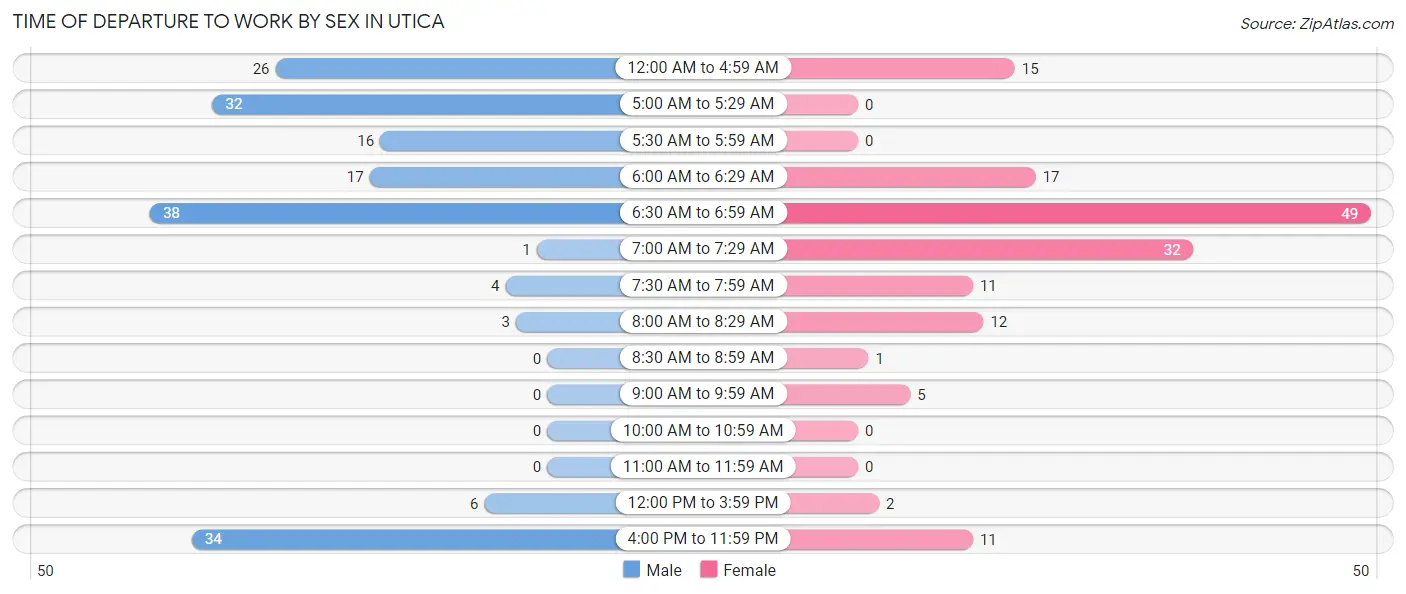
Time of Departure to Work by Sex in Utica
The most frequent times of departure to work in Utica are 6:30 AM to 6:59 AM (38, 21.5%) for males and 6:30 AM to 6:59 AM (49, 31.6%) for females.
| Time of Departure | Male | Female |
| 12:00 AM to 4:59 AM | 26 (14.7%) | 15 (9.7%) |
| 5:00 AM to 5:29 AM | 32 (18.1%) | 0 (0.0%) |
| 5:30 AM to 5:59 AM | 16 (9.0%) | 0 (0.0%) |
| 6:00 AM to 6:29 AM | 17 (9.6%) | 17 (11.0%) |
| 6:30 AM to 6:59 AM | 38 (21.5%) | 49 (31.6%) |
| 7:00 AM to 7:29 AM | 1 (0.6%) | 32 (20.6%) |
| 7:30 AM to 7:59 AM | 4 (2.3%) | 11 (7.1%) |
| 8:00 AM to 8:29 AM | 3 (1.7%) | 12 (7.7%) |
| 8:30 AM to 8:59 AM | 0 (0.0%) | 1 (0.6%) |
| 9:00 AM to 9:59 AM | 0 (0.0%) | 5 (3.2%) |
| 10:00 AM to 10:59 AM | 0 (0.0%) | 0 (0.0%) |
| 11:00 AM to 11:59 AM | 0 (0.0%) | 0 (0.0%) |
| 12:00 PM to 3:59 PM | 6 (3.4%) | 2 (1.3%) |
| 4:00 PM to 11:59 PM | 34 (19.2%) | 11 (7.1%) |
| Total | 177 (100.0%) | 155 (100.0%) |
Housing Occupancy in Utica
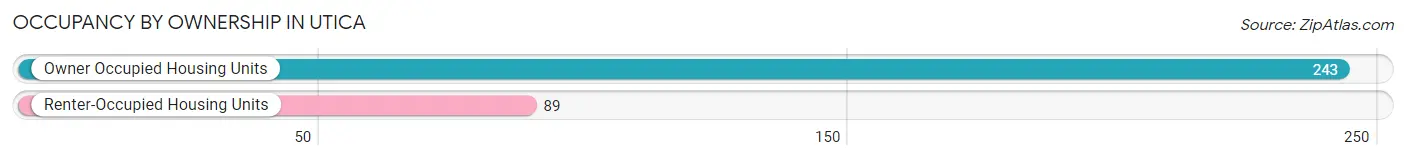
Occupancy by Ownership in Utica
Of the total 332 dwellings in Utica, owner-occupied units account for 243 (73.2%), while renter-occupied units make up 89 (26.8%).
| Occupancy | # Housing Units | % Housing Units |
| Owner Occupied Housing Units | 243 | 73.2% |
| Renter-Occupied Housing Units | 89 | 26.8% |
| Total Occupied Housing Units | 332 | 100.0% |
Occupancy by Household Size in Utica
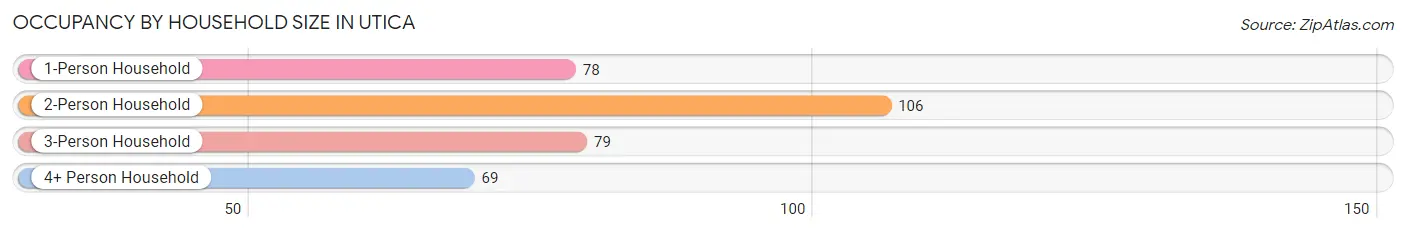
| Household Size | # Housing Units | % Housing Units |
| 1-Person Household | 78 | 23.5% |
| 2-Person Household | 106 | 31.9% |
| 3-Person Household | 79 | 23.8% |
| 4+ Person Household | 69 | 20.8% |
| Total Housing Units | 332 | 100.0% |
Occupancy by Ownership by Household Size in Utica
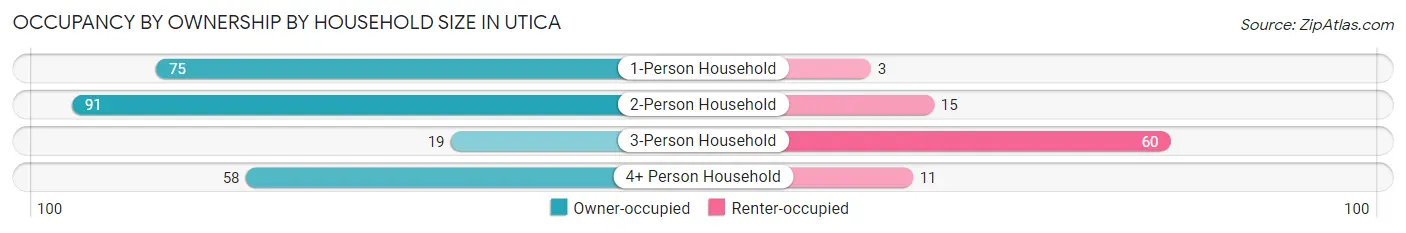
| Household Size | Owner-occupied | Renter-occupied |
| 1-Person Household | 75 (96.2%) | 3 (3.8%) |
| 2-Person Household | 91 (85.9%) | 15 (14.1%) |
| 3-Person Household | 19 (24.0%) | 60 (75.9%) |
| 4+ Person Household | 58 (84.1%) | 11 (15.9%) |
| Total Housing Units | 243 (73.2%) | 89 (26.8%) |
Occupancy by Educational Attainment in Utica
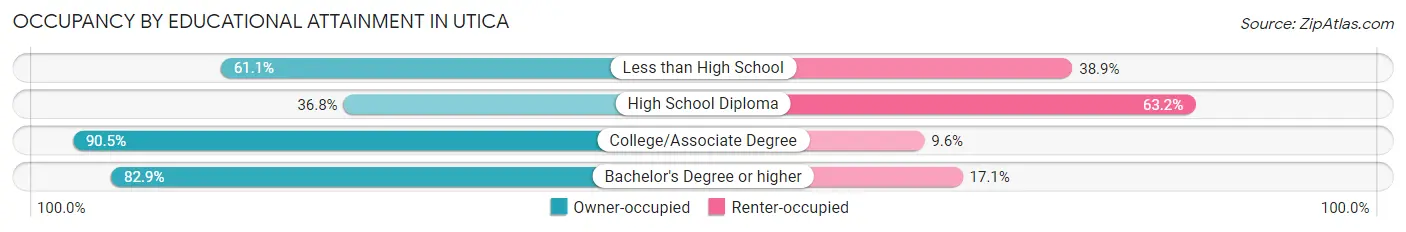
| Household Size | Owner-occupied | Renter-occupied |
| Less than High School | 11 (61.1%) | 7 (38.9%) |
| High School Diploma | 32 (36.8%) | 55 (63.2%) |
| College/Associate Degree | 142 (90.4%) | 15 (9.6%) |
| Bachelor's Degree or higher | 58 (82.9%) | 12 (17.1%) |
Occupancy by Age of Householder in Utica
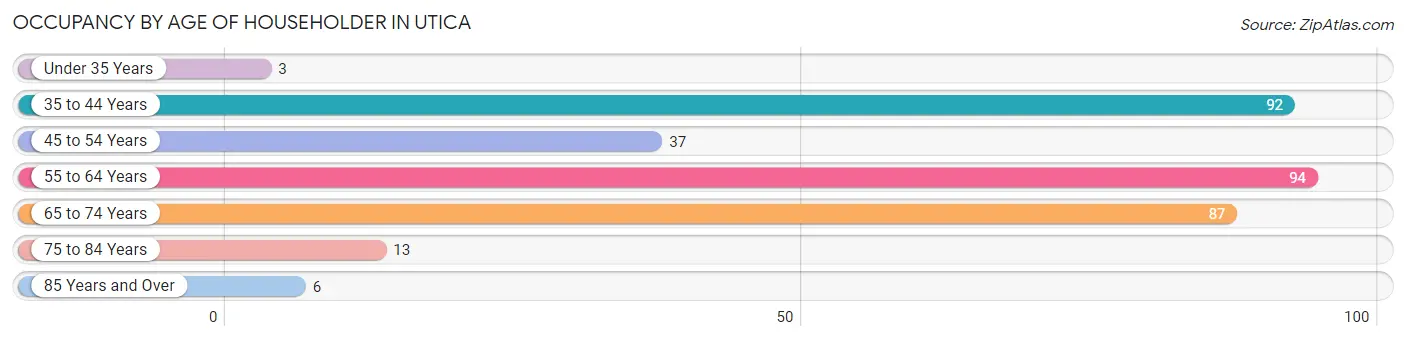
| Age Bracket | # Households | % Households |
| Under 35 Years | 3 | 0.9% |
| 35 to 44 Years | 92 | 27.7% |
| 45 to 54 Years | 37 | 11.1% |
| 55 to 64 Years | 94 | 28.3% |
| 65 to 74 Years | 87 | 26.2% |
| 75 to 84 Years | 13 | 3.9% |
| 85 Years and Over | 6 | 1.8% |
| Total | 332 | 100.0% |
Housing Finances in Utica
Median Income by Occupancy in Utica
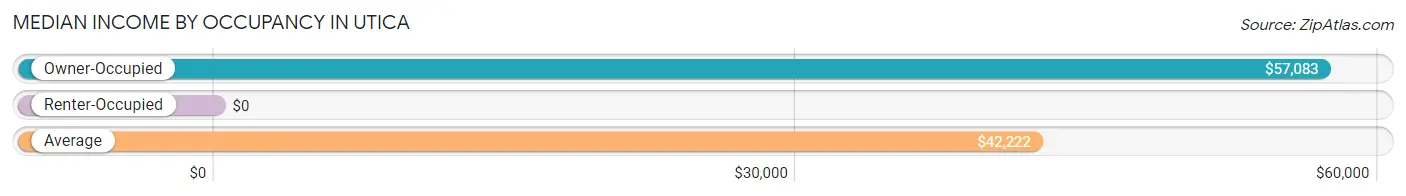
| Occupancy Type | # Households | Median Income |
| Owner-Occupied | 243 (73.2%) | $57,083 |
| Renter-Occupied | 89 (26.8%) | $0 |
| Average | 332 (100.0%) | $42,222 |
Occupancy by Householder Income Bracket in Utica
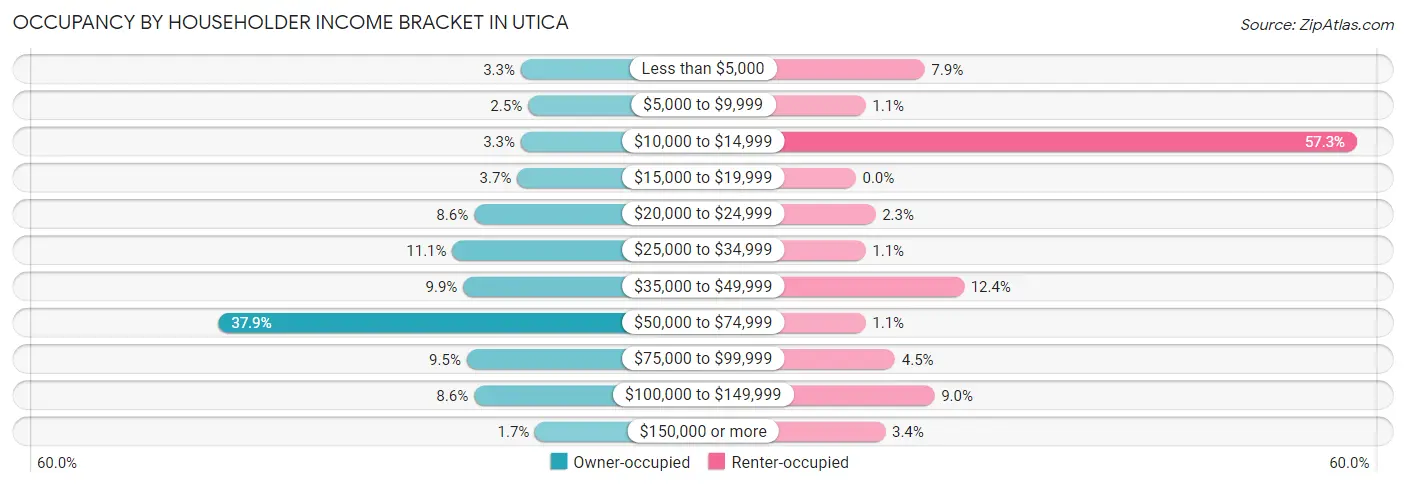
| Income Bracket | Owner-occupied | Renter-occupied |
| Less than $5,000 | 8 (3.3%) | 7 (7.9%) |
| $5,000 to $9,999 | 6 (2.5%) | 1 (1.1%) |
| $10,000 to $14,999 | 8 (3.3%) | 51 (57.3%) |
| $15,000 to $19,999 | 9 (3.7%) | 0 (0.0%) |
| $20,000 to $24,999 | 21 (8.6%) | 2 (2.2%) |
| $25,000 to $34,999 | 27 (11.1%) | 1 (1.1%) |
| $35,000 to $49,999 | 24 (9.9%) | 11 (12.4%) |
| $50,000 to $74,999 | 92 (37.9%) | 1 (1.1%) |
| $75,000 to $99,999 | 23 (9.5%) | 4 (4.5%) |
| $100,000 to $149,999 | 21 (8.6%) | 8 (9.0%) |
| $150,000 or more | 4 (1.7%) | 3 (3.4%) |
| Total | 243 (100.0%) | 89 (100.0%) |
Monthly Housing Cost Tiers in Utica
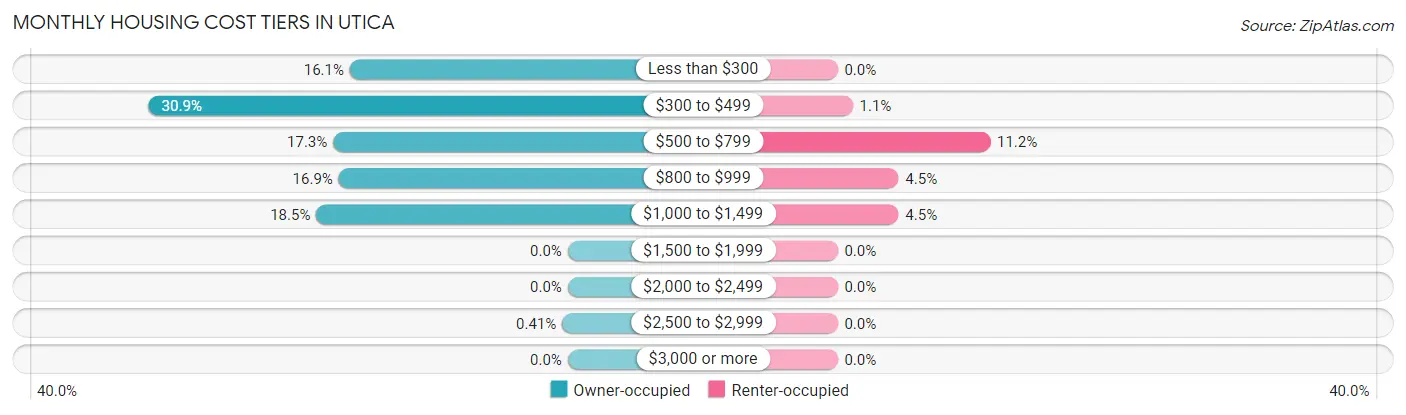
| Monthly Cost | Owner-occupied | Renter-occupied |
| Less than $300 | 39 (16.1%) | 0 (0.0%) |
| $300 to $499 | 75 (30.9%) | 1 (1.1%) |
| $500 to $799 | 42 (17.3%) | 10 (11.2%) |
| $800 to $999 | 41 (16.9%) | 4 (4.5%) |
| $1,000 to $1,499 | 45 (18.5%) | 4 (4.5%) |
| $1,500 to $1,999 | 0 (0.0%) | 0 (0.0%) |
| $2,000 to $2,499 | 0 (0.0%) | 0 (0.0%) |
| $2,500 to $2,999 | 1 (0.4%) | 0 (0.0%) |
| $3,000 or more | 0 (0.0%) | 0 (0.0%) |
| Total | 243 (100.0%) | 89 (100.0%) |
Physical Housing Characteristics in Utica
Housing Structures in Utica
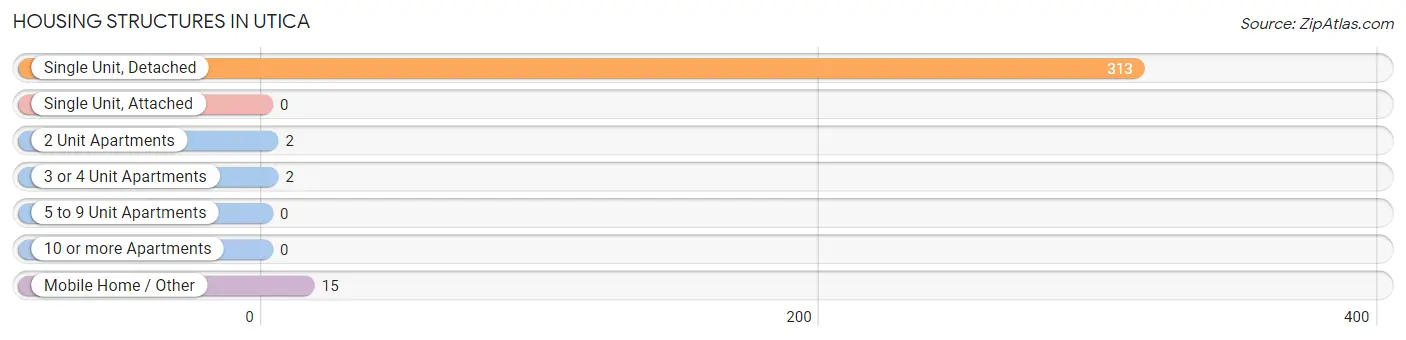
| Structure Type | # Housing Units | % Housing Units |
| Single Unit, Detached | 313 | 94.3% |
| Single Unit, Attached | 0 | 0.0% |
| 2 Unit Apartments | 2 | 0.6% |
| 3 or 4 Unit Apartments | 2 | 0.6% |
| 5 to 9 Unit Apartments | 0 | 0.0% |
| 10 or more Apartments | 0 | 0.0% |
| Mobile Home / Other | 15 | 4.5% |
| Total | 332 | 100.0% |
Housing Structures by Occupancy in Utica
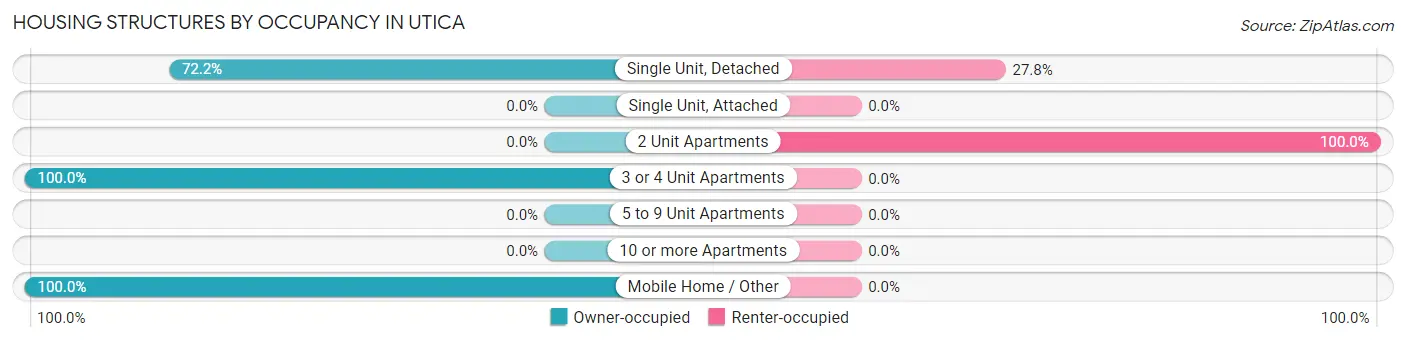
| Structure Type | Owner-occupied | Renter-occupied |
| Single Unit, Detached | 226 (72.2%) | 87 (27.8%) |
| Single Unit, Attached | 0 (0.0%) | 0 (0.0%) |
| 2 Unit Apartments | 0 (0.0%) | 2 (100.0%) |
| 3 or 4 Unit Apartments | 2 (100.0%) | 0 (0.0%) |
| 5 to 9 Unit Apartments | 0 (0.0%) | 0 (0.0%) |
| 10 or more Apartments | 0 (0.0%) | 0 (0.0%) |
| Mobile Home / Other | 15 (100.0%) | 0 (0.0%) |
| Total | 243 (73.2%) | 89 (26.8%) |
Housing Structures by Number of Rooms in Utica
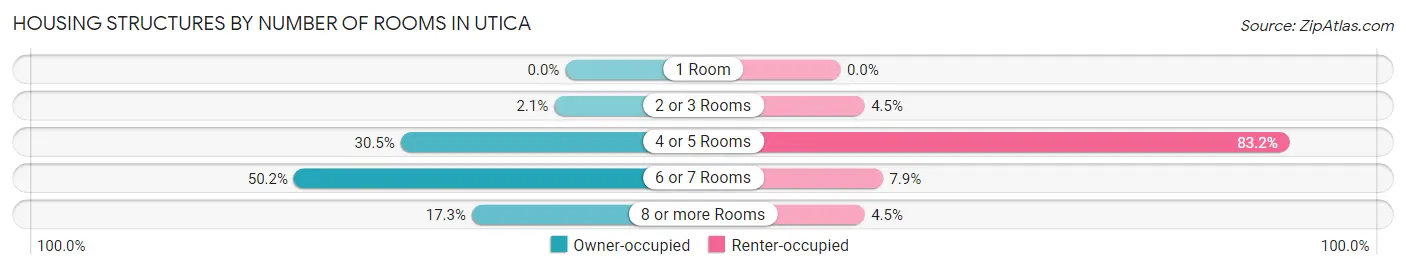
| Number of Rooms | Owner-occupied | Renter-occupied |
| 1 Room | 0 (0.0%) | 0 (0.0%) |
| 2 or 3 Rooms | 5 (2.1%) | 4 (4.5%) |
| 4 or 5 Rooms | 74 (30.4%) | 74 (83.2%) |
| 6 or 7 Rooms | 122 (50.2%) | 7 (7.9%) |
| 8 or more Rooms | 42 (17.3%) | 4 (4.5%) |
| Total | 243 (100.0%) | 89 (100.0%) |
Housing Structure by Heating Type in Utica
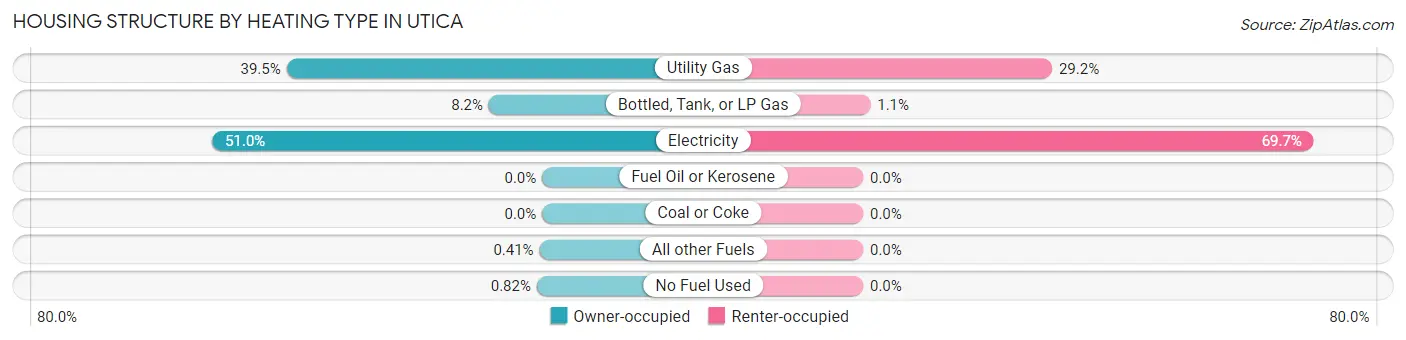
| Heating Type | Owner-occupied | Renter-occupied |
| Utility Gas | 96 (39.5%) | 26 (29.2%) |
| Bottled, Tank, or LP Gas | 20 (8.2%) | 1 (1.1%) |
| Electricity | 124 (51.0%) | 62 (69.7%) |
| Fuel Oil or Kerosene | 0 (0.0%) | 0 (0.0%) |
| Coal or Coke | 0 (0.0%) | 0 (0.0%) |
| All other Fuels | 1 (0.4%) | 0 (0.0%) |
| No Fuel Used | 2 (0.8%) | 0 (0.0%) |
| Total | 243 (100.0%) | 89 (100.0%) |
Household Vehicle Usage in Utica
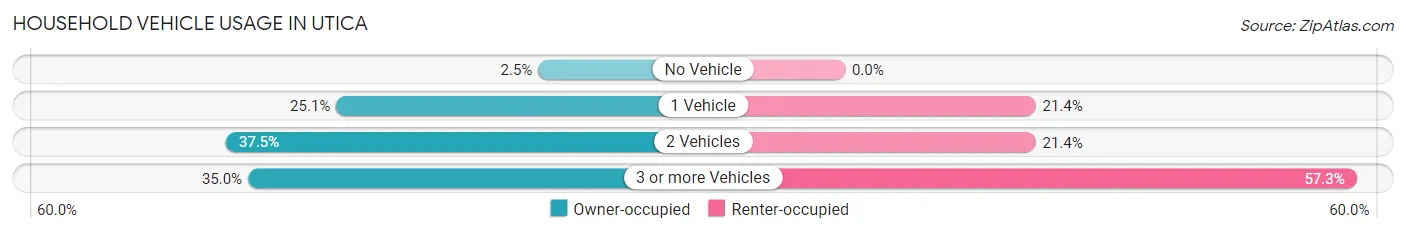
| Vehicles per Household | Owner-occupied | Renter-occupied |
| No Vehicle | 6 (2.5%) | 0 (0.0%) |
| 1 Vehicle | 61 (25.1%) | 19 (21.3%) |
| 2 Vehicles | 91 (37.4%) | 19 (21.3%) |
| 3 or more Vehicles | 85 (35.0%) | 51 (57.3%) |
| Total | 243 (100.0%) | 89 (100.0%) |
Real Estate & Mortgages in Utica
Real Estate and Mortgage Overview in Utica
| Characteristic | Without Mortgage | With Mortgage |
| Housing Units | 126 | 117 |
| Median Property Value | $91,000 | $91,100 |
| Median Household Income | $48,500 | $4 |
| Monthly Housing Costs | $343 | $0 |
| Real Estate Taxes | $403 | $13 |
Property Value by Mortgage Status in Utica
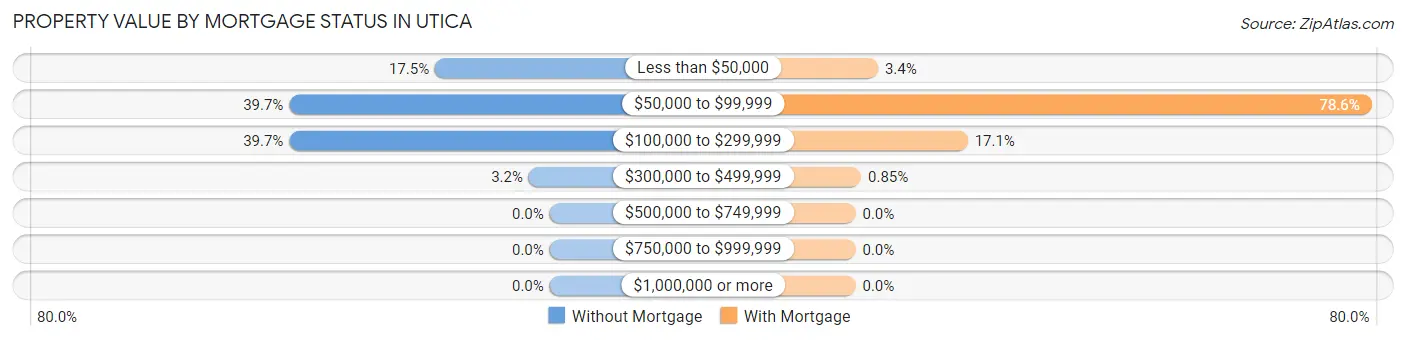
| Property Value | Without Mortgage | With Mortgage |
| Less than $50,000 | 22 (17.5%) | 4 (3.4%) |
| $50,000 to $99,999 | 50 (39.7%) | 92 (78.6%) |
| $100,000 to $299,999 | 50 (39.7%) | 20 (17.1%) |
| $300,000 to $499,999 | 4 (3.2%) | 1 (0.9%) |
| $500,000 to $749,999 | 0 (0.0%) | 0 (0.0%) |
| $750,000 to $999,999 | 0 (0.0%) | 0 (0.0%) |
| $1,000,000 or more | 0 (0.0%) | 0 (0.0%) |
| Total | 126 (100.0%) | 117 (100.0%) |
Household Income by Mortgage Status in Utica
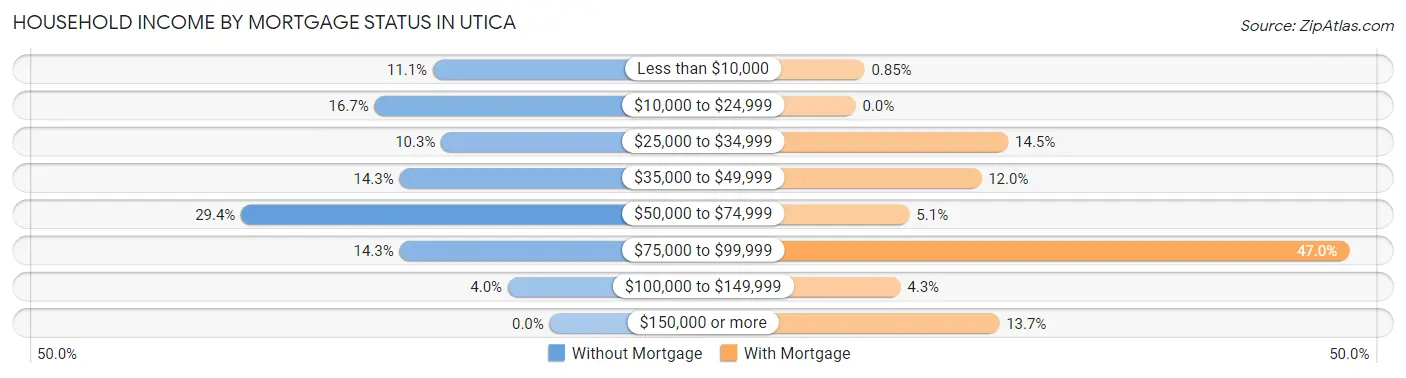
| Household Income | Without Mortgage | With Mortgage |
| Less than $10,000 | 14 (11.1%) | 1 (0.9%) |
| $10,000 to $24,999 | 21 (16.7%) | 0 (0.0%) |
| $25,000 to $34,999 | 13 (10.3%) | 17 (14.5%) |
| $35,000 to $49,999 | 18 (14.3%) | 14 (12.0%) |
| $50,000 to $74,999 | 37 (29.4%) | 6 (5.1%) |
| $75,000 to $99,999 | 18 (14.3%) | 55 (47.0%) |
| $100,000 to $149,999 | 5 (4.0%) | 5 (4.3%) |
| $150,000 or more | 0 (0.0%) | 16 (13.7%) |
| Total | 126 (100.0%) | 117 (100.0%) |
Property Value to Household Income Ratio in Utica
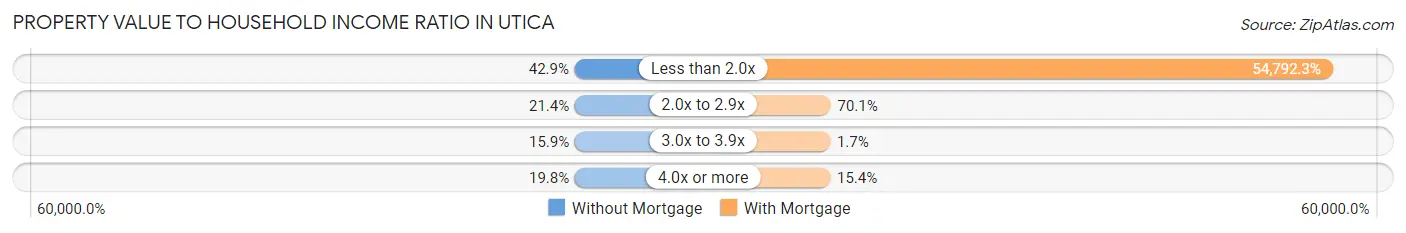
| Value-to-Income Ratio | Without Mortgage | With Mortgage |
| Less than 2.0x | 54 (42.9%) | 64,107 (54,792.3%) |
| 2.0x to 2.9x | 27 (21.4%) | 82 (70.1%) |
| 3.0x to 3.9x | 20 (15.9%) | 2 (1.7%) |
| 4.0x or more | 25 (19.8%) | 18 (15.4%) |
| Total | 126 (100.0%) | 117 (100.0%) |
Real Estate Taxes by Mortgage Status in Utica
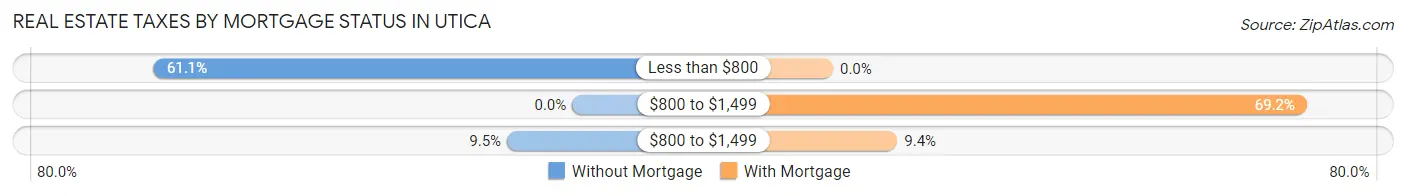
| Property Taxes | Without Mortgage | With Mortgage |
| Less than $800 | 77 (61.1%) | 0 (0.0%) |
| $800 to $1,499 | 0 (0.0%) | 81 (69.2%) |
| $800 to $1,499 | 12 (9.5%) | 11 (9.4%) |
| Total | 126 (100.0%) | 117 (100.0%) |
Health & Disability in Utica
Health Insurance Coverage by Age in Utica
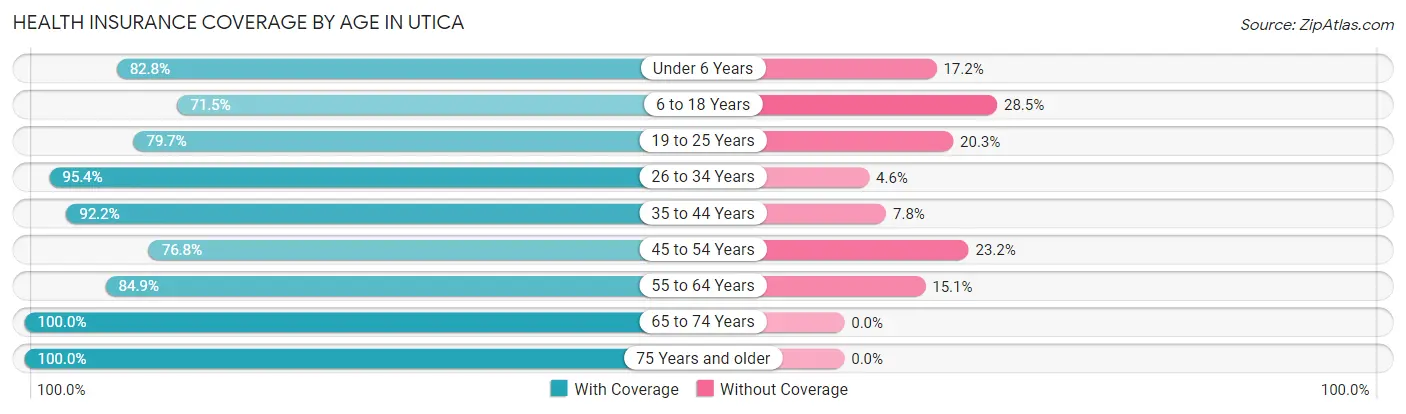
| Age Bracket | With Coverage | Without Coverage |
| Under 6 Years | 53 (82.8%) | 11 (17.2%) |
| 6 to 18 Years | 133 (71.5%) | 53 (28.5%) |
| 19 to 25 Years | 55 (79.7%) | 14 (20.3%) |
| 26 to 34 Years | 62 (95.4%) | 3 (4.6%) |
| 35 to 44 Years | 213 (92.2%) | 18 (7.8%) |
| 45 to 54 Years | 63 (76.8%) | 19 (23.2%) |
| 55 to 64 Years | 118 (84.9%) | 21 (15.1%) |
| 65 to 74 Years | 105 (100.0%) | 0 (0.0%) |
| 75 Years and older | 36 (100.0%) | 0 (0.0%) |
| Total | 838 (85.8%) | 139 (14.2%) |
Health Insurance Coverage by Citizenship Status in Utica
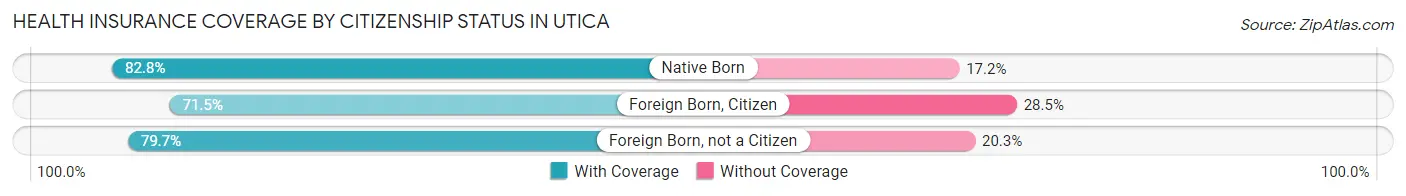
| Citizenship Status | With Coverage | Without Coverage |
| Native Born | 53 (82.8%) | 11 (17.2%) |
| Foreign Born, Citizen | 133 (71.5%) | 53 (28.5%) |
| Foreign Born, not a Citizen | 55 (79.7%) | 14 (20.3%) |
Health Insurance Coverage by Household Income in Utica
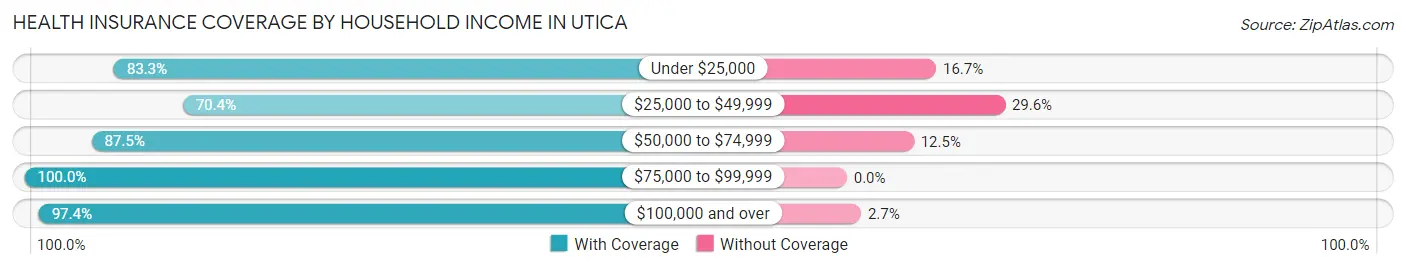
| Household Income | With Coverage | Without Coverage |
| Under $25,000 | 249 (83.3%) | 50 (16.7%) |
| $25,000 to $49,999 | 114 (70.4%) | 48 (29.6%) |
| $50,000 to $74,999 | 251 (87.5%) | 36 (12.5%) |
| $75,000 to $99,999 | 40 (100.0%) | 0 (0.0%) |
| $100,000 and over | 184 (97.4%) | 5 (2.6%) |
Public vs Private Health Insurance Coverage by Age in Utica
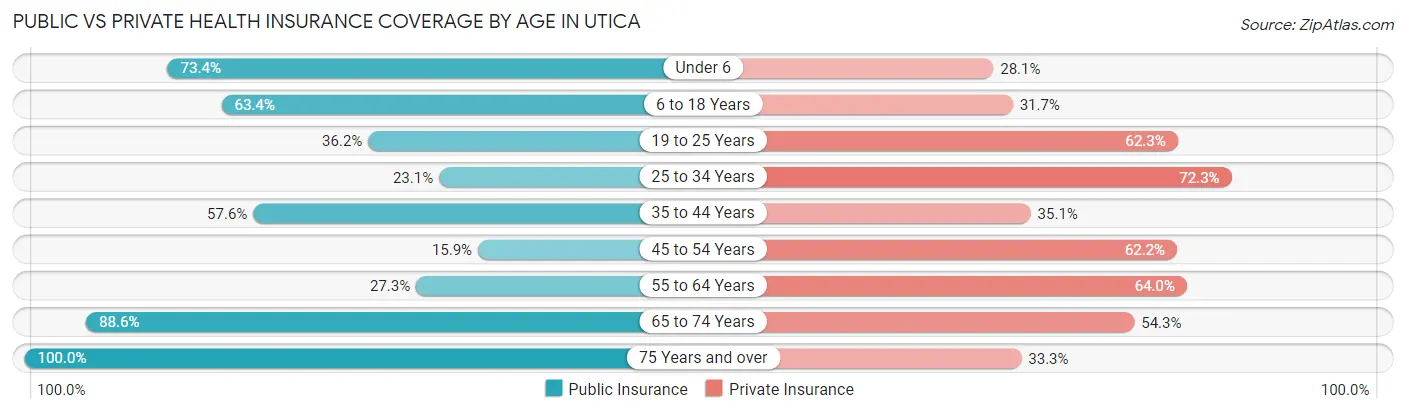
| Age Bracket | Public Insurance | Private Insurance |
| Under 6 | 47 (73.4%) | 18 (28.1%) |
| 6 to 18 Years | 118 (63.4%) | 59 (31.7%) |
| 19 to 25 Years | 25 (36.2%) | 43 (62.3%) |
| 25 to 34 Years | 15 (23.1%) | 47 (72.3%) |
| 35 to 44 Years | 133 (57.6%) | 81 (35.1%) |
| 45 to 54 Years | 13 (15.9%) | 51 (62.2%) |
| 55 to 64 Years | 38 (27.3%) | 89 (64.0%) |
| 65 to 74 Years | 93 (88.6%) | 57 (54.3%) |
| 75 Years and over | 36 (100.0%) | 12 (33.3%) |
| Total | 518 (53.0%) | 457 (46.8%) |
Disability Status by Sex by Age in Utica
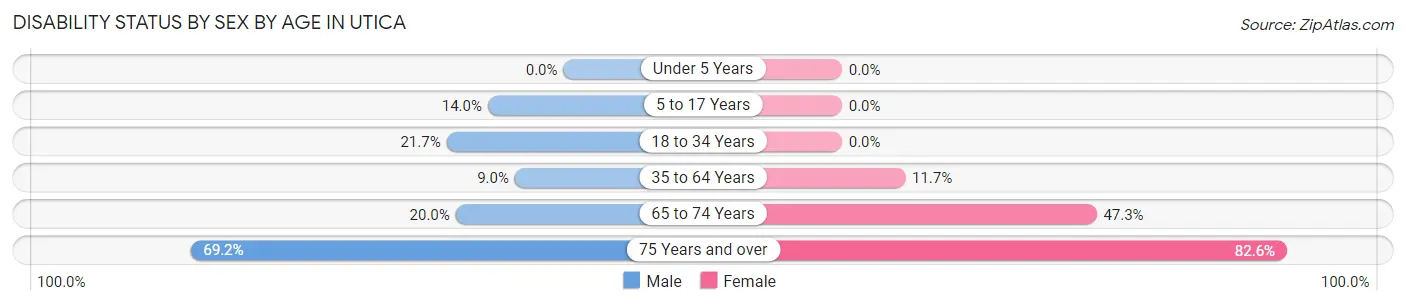
| Age Bracket | Male | Female |
| Under 5 Years | 0 (0.0%) | 0 (0.0%) |
| 5 to 17 Years | 15 (14.0%) | 0 (0.0%) |
| 18 to 34 Years | 18 (21.7%) | 0 (0.0%) |
| 35 to 64 Years | 20 (9.0%) | 27 (11.7%) |
| 65 to 74 Years | 10 (20.0%) | 26 (47.3%) |
| 75 Years and over | 9 (69.2%) | 19 (82.6%) |
Disability Class by Sex by Age in Utica
Disability Class: Hearing Difficulty
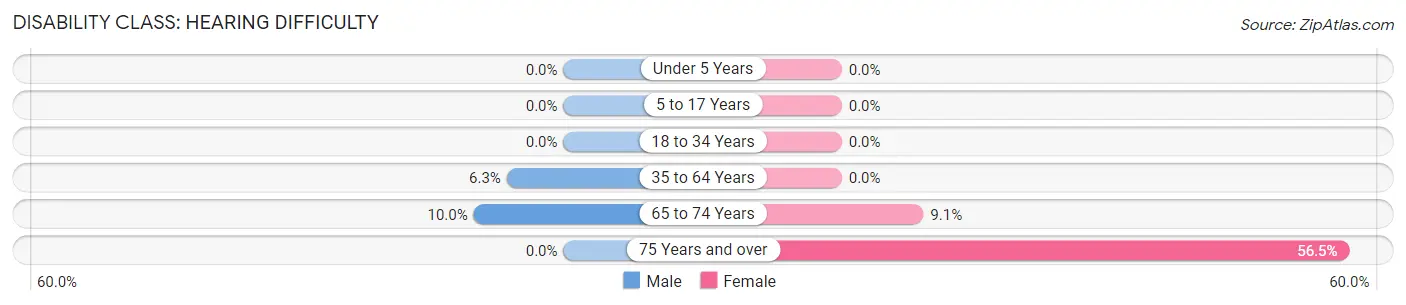
| Age Bracket | Male | Female |
| Under 5 Years | 0 (0.0%) | 0 (0.0%) |
| 5 to 17 Years | 0 (0.0%) | 0 (0.0%) |
| 18 to 34 Years | 0 (0.0%) | 0 (0.0%) |
| 35 to 64 Years | 14 (6.3%) | 0 (0.0%) |
| 65 to 74 Years | 5 (10.0%) | 5 (9.1%) |
| 75 Years and over | 0 (0.0%) | 13 (56.5%) |
Disability Class: Vision Difficulty
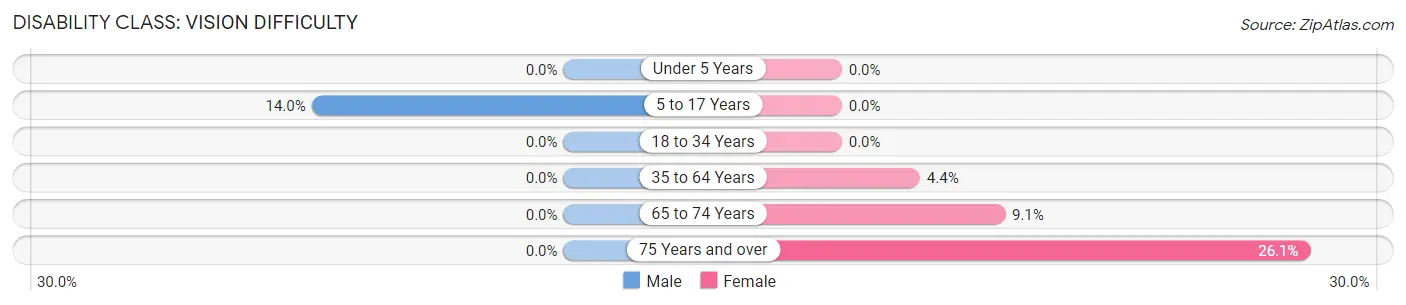
| Age Bracket | Male | Female |
| Under 5 Years | 0 (0.0%) | 0 (0.0%) |
| 5 to 17 Years | 15 (14.0%) | 0 (0.0%) |
| 18 to 34 Years | 0 (0.0%) | 0 (0.0%) |
| 35 to 64 Years | 0 (0.0%) | 10 (4.3%) |
| 65 to 74 Years | 0 (0.0%) | 5 (9.1%) |
| 75 Years and over | 0 (0.0%) | 6 (26.1%) |
Disability Class: Cognitive Difficulty
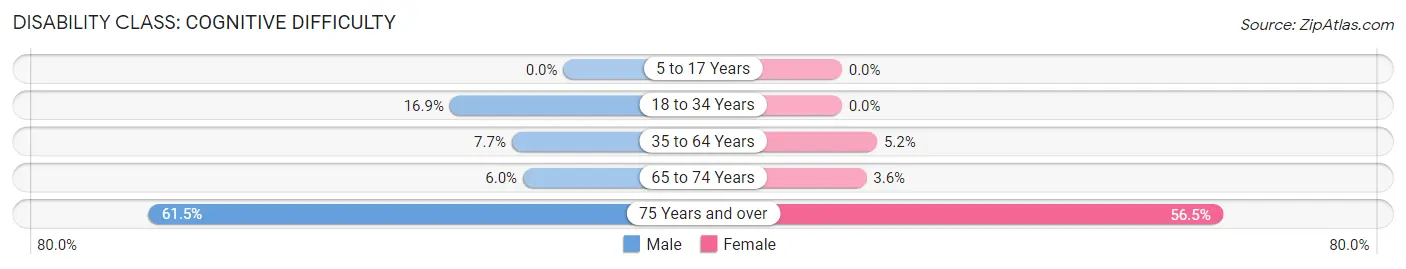
| Age Bracket | Male | Female |
| 5 to 17 Years | 0 (0.0%) | 0 (0.0%) |
| 18 to 34 Years | 14 (16.9%) | 0 (0.0%) |
| 35 to 64 Years | 17 (7.7%) | 12 (5.2%) |
| 65 to 74 Years | 3 (6.0%) | 2 (3.6%) |
| 75 Years and over | 8 (61.5%) | 13 (56.5%) |
Disability Class: Ambulatory Difficulty
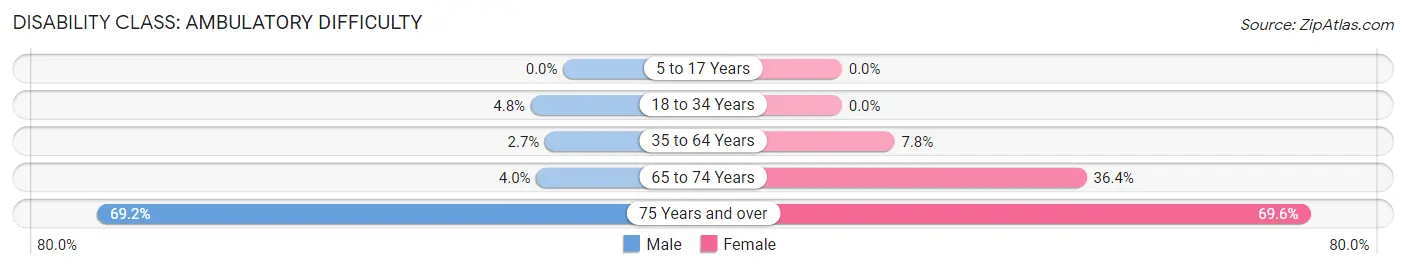
| Age Bracket | Male | Female |
| 5 to 17 Years | 0 (0.0%) | 0 (0.0%) |
| 18 to 34 Years | 4 (4.8%) | 0 (0.0%) |
| 35 to 64 Years | 6 (2.7%) | 18 (7.8%) |
| 65 to 74 Years | 2 (4.0%) | 20 (36.4%) |
| 75 Years and over | 9 (69.2%) | 16 (69.6%) |
Disability Class: Self-Care Difficulty
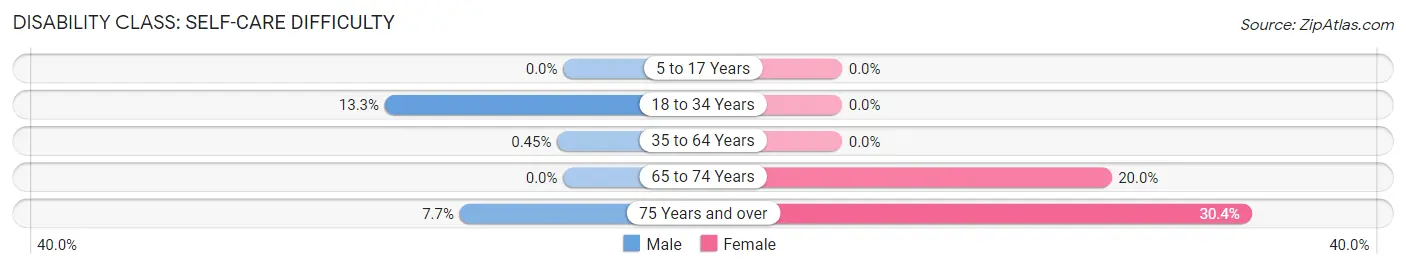
| Age Bracket | Male | Female |
| 5 to 17 Years | 0 (0.0%) | 0 (0.0%) |
| 18 to 34 Years | 11 (13.3%) | 0 (0.0%) |
| 35 to 64 Years | 1 (0.4%) | 0 (0.0%) |
| 65 to 74 Years | 0 (0.0%) | 11 (20.0%) |
| 75 Years and over | 1 (7.7%) | 7 (30.4%) |
Technology Access in Utica
Computing Device Access in Utica
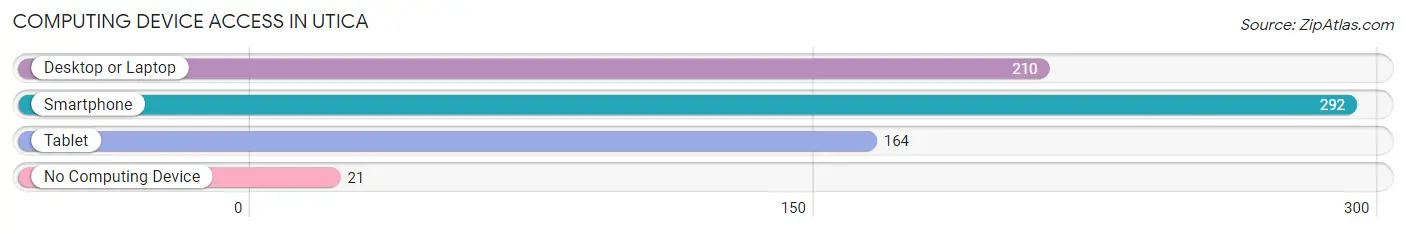
| Device Type | # Households | % Households |
| Desktop or Laptop | 210 | 63.2% |
| Smartphone | 292 | 87.9% |
| Tablet | 164 | 49.4% |
| No Computing Device | 21 | 6.3% |
| Total | 332 | 100.0% |
Internet Access in Utica
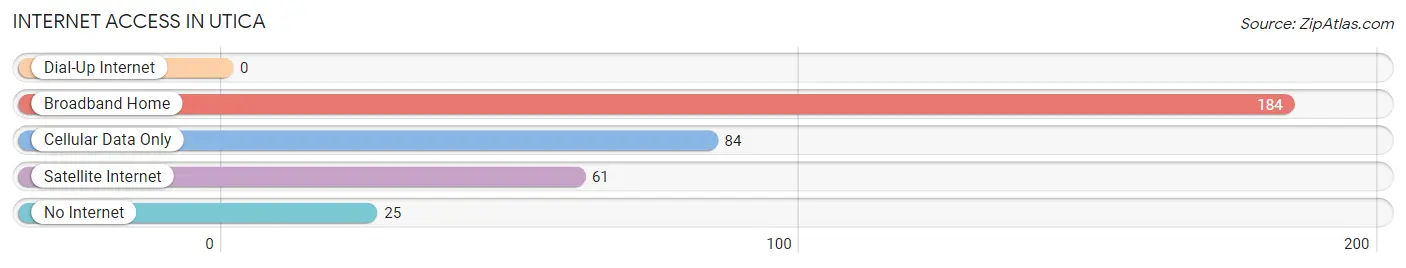
| Internet Type | # Households | % Households |
| Dial-Up Internet | 0 | 0.0% |
| Broadband Home | 184 | 55.4% |
| Cellular Data Only | 84 | 25.3% |
| Satellite Internet | 61 | 18.4% |
| No Internet | 25 | 7.5% |
| Total | 332 | 100.0% |
Utica Summary
Utica, Mississippi is a small town located in Hinds County, Mississippi. It is situated on the banks of the Pearl River, about 25 miles northeast of Jackson, the state capital. The town was founded in 1837 and is named after the city of Utica, New York. As of the 2010 census, the population of Utica was 1,764.
Geography
Utica is located at 32°45'25" North, 90°25'45" West (32.756944, -90.429167). It is situated on the banks of the Pearl River, about 25 miles northeast of Jackson, the state capital. The town has a total area of 1.2 square miles, all of which is land.
Climate
Utica has a humid subtropical climate, with hot, humid summers and mild winters. The average annual temperature is 64°F, with an average high of 91°F in July and an average low of 37°F in January. The average annual precipitation is 56 inches, with the wettest month being June, when an average of 6.5 inches of rain falls.
Demographics
As of the 2010 census, there were 1,764 people, 690 households, and 463 families residing in Utica. The population density was 1,467.5 people per square mile. The racial makeup of the town was 57.2% African American, 40.2% White, 0.3% Native American, 0.2% Asian, 0.1% Pacific Islander, 0.7% from other races, and 1.3% from two or more races. Hispanic or Latino of any race were 1.7% of the population.
There were 690 households, out of which 33.3% had children under the age of 18 living with them, 37.7% were married couples living together, 25.2% had a female householder with no husband present, and 32.2% were non-families. 28.3% of all households were made up of individuals, and 11.3% had someone living alone who was 65 years of age or older. The average household size was 2.56 and the average family size was 3.14.
The median age in Utica was 36.2 years. 25.7% of residents were under the age of 18; 9.7% were between the ages of 18 and 24; 24.2% were from 25 to 44; 25.7% were from 45 to 64; and 14.7% were 65 years of age or older. The gender makeup of the town was 48.2% male and 51.8% female.
Economy
Utica's economy is largely based on agriculture and manufacturing. The town is home to several small businesses, including a lumber mill, a furniture factory, and a canning plant. The town also has a few retail stores, including a grocery store, a hardware store, and a few restaurants.
Utica is also home to a few large employers, including the Hinds County School District, the Hinds County Sheriff's Office, and the Hinds County Courthouse. The town is also home to a few small manufacturing companies, including a plastics factory and a metal fabrication plant.
Utica is served by the Utica-Hinds County Airport, which offers daily flights to Jackson and other nearby cities. The town is also served by the Utica-Hinds County Public Library, which offers a variety of books, magazines, and other materials.
Conclusion
Utica, Mississippi is a small town located in Hinds County, Mississippi. It is situated on the banks of the Pearl River, about 25 miles northeast of Jackson, the state capital. The town was founded in 1837 and is named after the city of Utica, New York. As of the 2010 census, the population of Utica was 1,764. Utica has a humid subtropical climate, with hot, humid summers and mild winters. The town's economy is largely based on agriculture and manufacturing, and it is home to several small businesses, as well as a few large employers. Utica is served by the Utica-Hinds County Airport, and the Utica-Hinds County Public Library.
Common Questions
What is Per Capita Income in Utica?
Per Capita income in Utica is $19,098.
What is the Median Family Income in Utica?
Median Family Income in Utica is $41,250.
What is the Median Household income in Utica?
Median Household Income in Utica is $42,222.
What is Income or Wage Gap in Utica?
Income or Wage Gap in Utica is 27.8%.
Women in Utica earn 72.2 cents for every dollar earned by a man.
What is Inequality or Gini Index in Utica?
Inequality or Gini Index in Utica is 0.44.
What is the Total Population of Utica?
Total Population of Utica is 977.
What is the Total Male Population of Utica?
Total Male Population of Utica is 532.
What is the Total Female Population of Utica?
Total Female Population of Utica is 445.
What is the Ratio of Males per 100 Females in Utica?
There are 119.55 Males per 100 Females in Utica.
What is the Ratio of Females per 100 Males in Utica?
There are 83.65 Females per 100 Males in Utica.
What is the Median Population Age in Utica?
Median Population Age in Utica is 39.4 Years.
What is the Average Family Size in Utica
Average Family Size in Utica is 3.4 People.
What is the Average Household Size in Utica
Average Household Size in Utica is 2.9 People.
How Large is the Labor Force in Utica?
There are 344 People in the Labor Forcein in Utica.
What is the Percentage of People in the Labor Force in Utica?
44.0% of People are in the Labor Force in Utica.
What is the Unemployment Rate in Utica?
Unemployment Rate in Utica is 3.5%.