Tylertown, MS Map & Demographics
Tylertown Map
Tylertown Overview
$18,792
PER CAPITA INCOME
$64,125
AVG FAMILY INCOME
$32,019
AVG HOUSEHOLD INCOME
27.4%
WAGE / INCOME GAP [ % ]
72.6¢/ $1
WAGE / INCOME GAP [ $ ]
0.53
INEQUALITY / GINI INDEX
2,341
TOTAL POPULATION
945
MALE POPULATION
1,396
FEMALE POPULATION
67.69
MALES / 100 FEMALES
147.72
FEMALES / 100 MALES
33.9
MEDIAN AGE
5.0
AVG FAMILY SIZE
3.5
AVG HOUSEHOLD SIZE
788
LABOR FORCE [ PEOPLE ]
46.8%
PERCENT IN LABOR FORCE
16.6%
UNEMPLOYMENT RATE
Tylertown Zip Codes
Tylertown Area Codes
Income in Tylertown
Income Overview in Tylertown
Per Capita Income in Tylertown is $18,792, while median incomes of families and households are $64,125 and $32,019 respectively.
| Characteristic | Number | Measure |
| Per Capita Income | 2,341 | $18,792 |
| Median Family Income | 365 | $64,125 |
| Mean Family Income | 365 | $79,319 |
| Median Household Income | 623 | $32,019 |
| Mean Household Income | 623 | $58,948 |
| Income Deficit | 365 | $0 |
| Wage / Income Gap (%) | 2,341 | 27.40% |
| Wage / Income Gap ($) | 2,341 | 72.60¢ per $1 |
| Gini / Inequality Index | 2,341 | 0.53 |
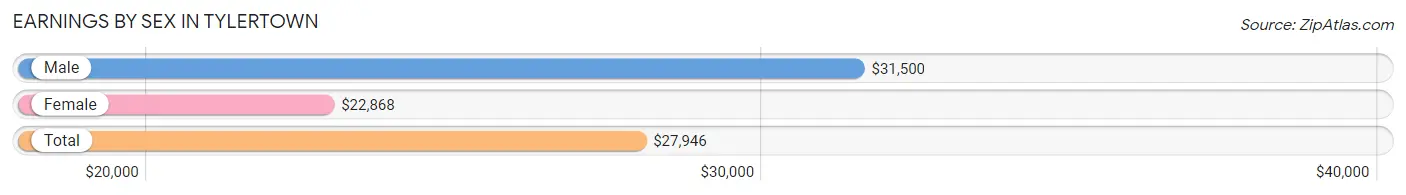
Earnings by Sex in Tylertown
Average Earnings in Tylertown are $27,946, $31,500 for men and $22,868 for women, a difference of 27.4%.
| Sex | Number | Average Earnings |
| Male | 402 (50.3%) | $31,500 |
| Female | 397 (49.7%) | $22,868 |
| Total | 799 (100.0%) | $27,946 |
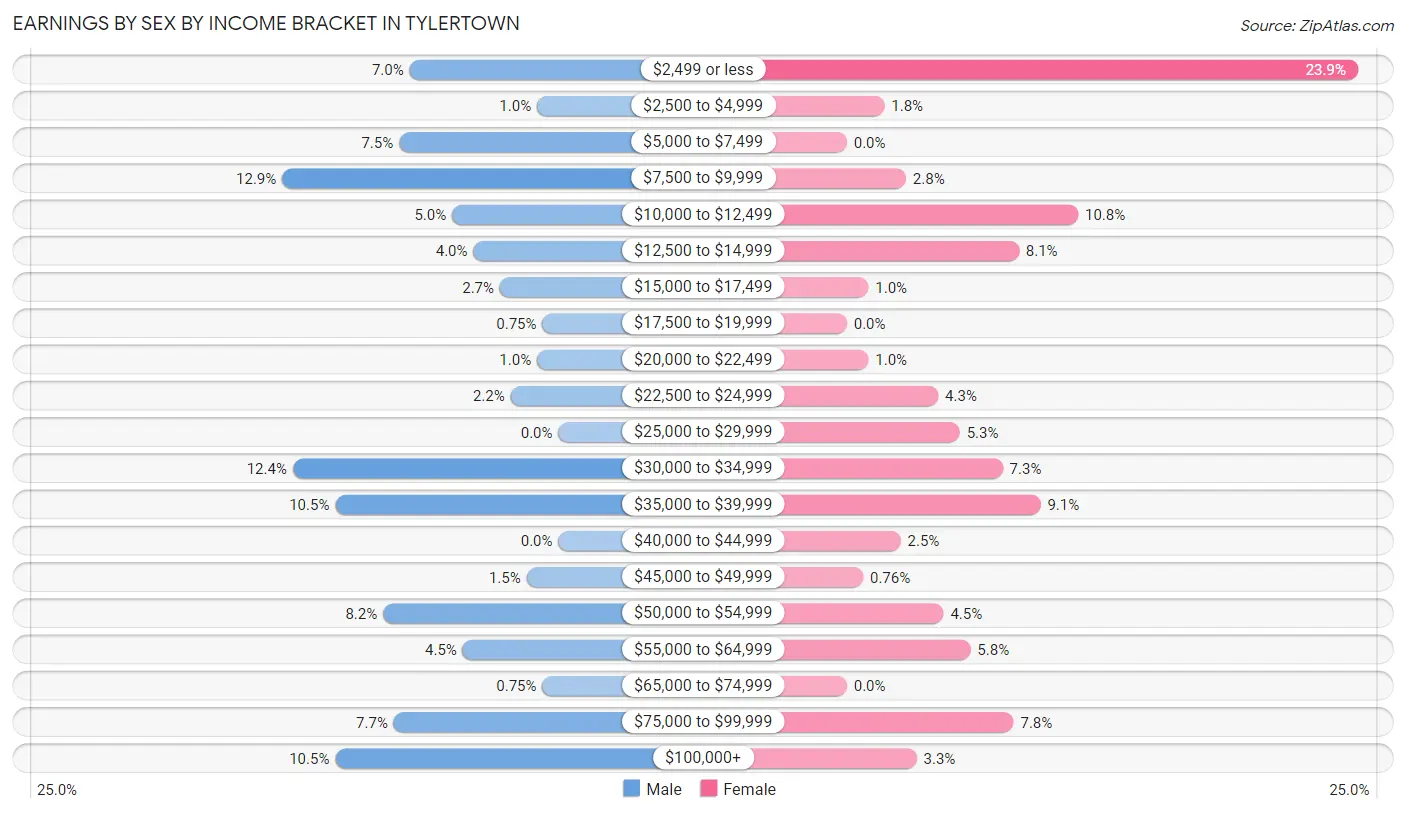
Earnings by Sex by Income Bracket in Tylertown
The most common earnings brackets in Tylertown are $7,500 to $9,999 for men (52 | 12.9%) and $2,499 or less for women (95 | 23.9%).
| Income | Male | Female |
| $2,499 or less | 28 (7.0%) | 95 (23.9%) |
| $2,500 to $4,999 | 4 (1.0%) | 7 (1.8%) |
| $5,000 to $7,499 | 30 (7.5%) | 0 (0.0%) |
| $7,500 to $9,999 | 52 (12.9%) | 11 (2.8%) |
| $10,000 to $12,499 | 20 (5.0%) | 43 (10.8%) |
| $12,500 to $14,999 | 16 (4.0%) | 32 (8.1%) |
| $15,000 to $17,499 | 11 (2.7%) | 4 (1.0%) |
| $17,500 to $19,999 | 3 (0.7%) | 0 (0.0%) |
| $20,000 to $22,499 | 4 (1.0%) | 4 (1.0%) |
| $22,500 to $24,999 | 9 (2.2%) | 17 (4.3%) |
| $25,000 to $29,999 | 0 (0.0%) | 21 (5.3%) |
| $30,000 to $34,999 | 50 (12.4%) | 29 (7.3%) |
| $35,000 to $39,999 | 42 (10.4%) | 36 (9.1%) |
| $40,000 to $44,999 | 0 (0.0%) | 10 (2.5%) |
| $45,000 to $49,999 | 6 (1.5%) | 3 (0.8%) |
| $50,000 to $54,999 | 33 (8.2%) | 18 (4.5%) |
| $55,000 to $64,999 | 18 (4.5%) | 23 (5.8%) |
| $65,000 to $74,999 | 3 (0.7%) | 0 (0.0%) |
| $75,000 to $99,999 | 31 (7.7%) | 31 (7.8%) |
| $100,000+ | 42 (10.4%) | 13 (3.3%) |
| Total | 402 (100.0%) | 397 (100.0%) |
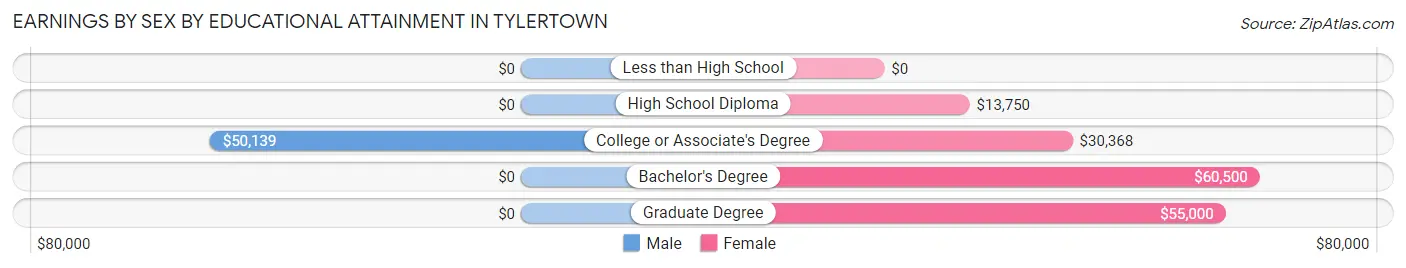
Earnings by Sex by Educational Attainment in Tylertown
Average earnings in Tylertown are $35,980 for men and $31,544 for women, a difference of 12.3%. Men with an educational attainment of college or associate's degree enjoy the highest average annual earnings of $50,139, while those with college or associate's degree education earn the least with $50,139. Women with an educational attainment of bachelor's degree earn the most with the average annual earnings of $60,500, while those with high school diploma education have the smallest earnings of $13,750.
| Educational Attainment | Male Income | Female Income |
| Less than High School | - | - |
| High School Diploma | - | - |
| College or Associate's Degree | $50,139 | $30,368 |
| Bachelor's Degree | - | - |
| Graduate Degree | - | - |
| Total | $35,980 | $31,544 |
Family Income in Tylertown
Family Income Brackets in Tylertown
According to the Tylertown family income data, there are 61 families falling into the $50,000 to $74,999 income range, which is the most common income bracket and makes up 16.7% of all families. Conversely, the less than $10,000 income bracket is the least frequent group with only 12 families (3.3%) belonging to this category.
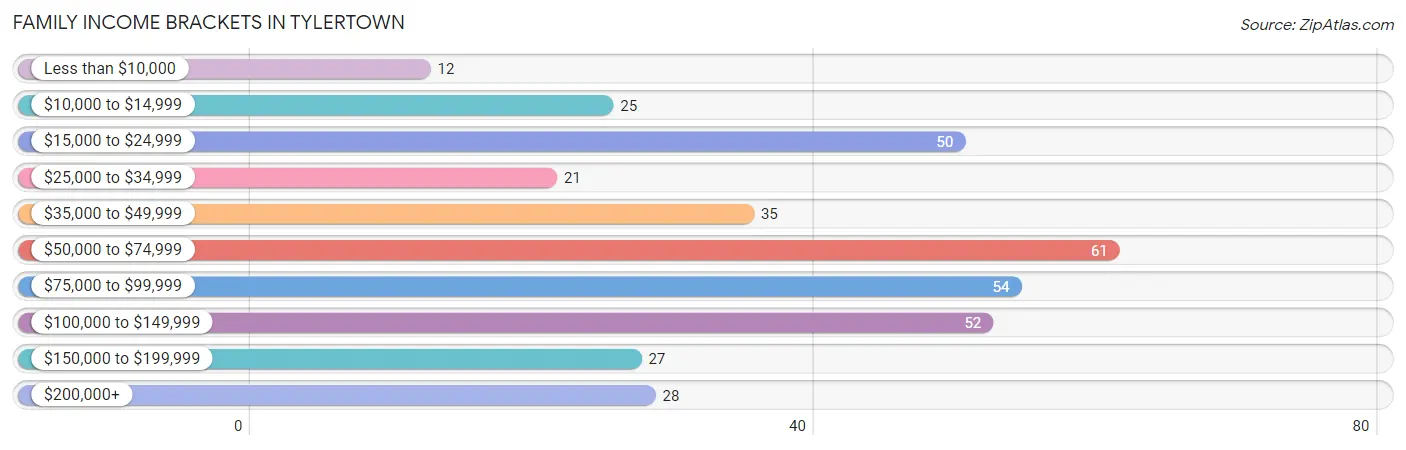
| Income Bracket | # Families | % Families |
| Less than $10,000 | 12 | 3.3% |
| $10,000 to $14,999 | 25 | 6.8% |
| $15,000 to $24,999 | 50 | 13.7% |
| $25,000 to $34,999 | 21 | 5.8% |
| $35,000 to $49,999 | 35 | 9.6% |
| $50,000 to $74,999 | 61 | 16.7% |
| $75,000 to $99,999 | 54 | 14.8% |
| $100,000 to $149,999 | 52 | 14.2% |
| $150,000 to $199,999 | 27 | 7.4% |
| $200,000+ | 28 | 7.7% |
Family Income by Famaliy Size in Tylertown
4-person families (55 | 15.1%) account for the highest median family income in Tylertown with $103,438 per family, while 2-person families (216 | 59.2%) have the highest median income of $31,875 per family member.
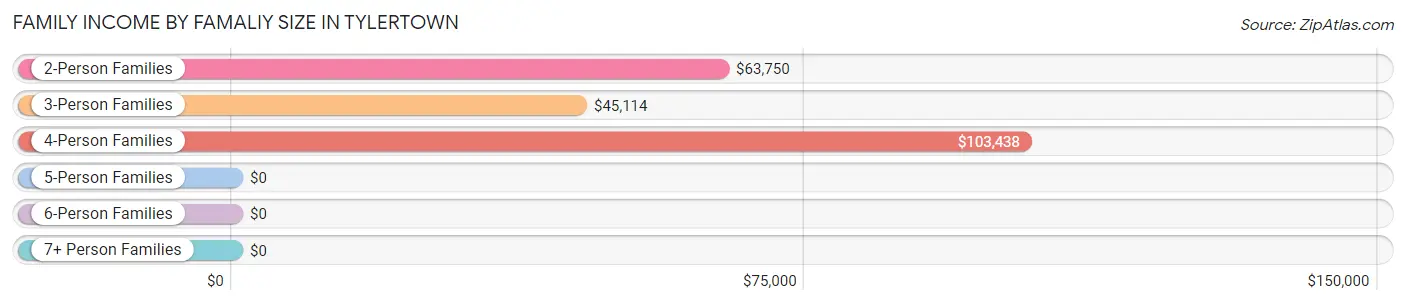
| Income Bracket | # Families | Median Income |
| 2-Person Families | 216 (59.2%) | $63,750 |
| 3-Person Families | 63 (17.3%) | $45,114 |
| 4-Person Families | 55 (15.1%) | $103,438 |
| 5-Person Families | 15 (4.1%) | $0 |
| 6-Person Families | 16 (4.4%) | $0 |
| 7+ Person Families | 0 (0.0%) | $0 |
| Total | 365 (100.0%) | $64,125 |
Family Income by Number of Earners in Tylertown
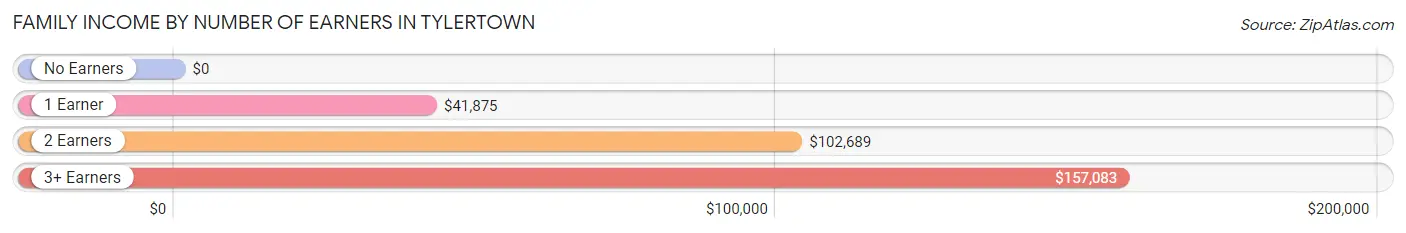
| Number of Earners | # Families | Median Income |
| No Earners | 82 (22.5%) | $0 |
| 1 Earner | 117 (32.1%) | $41,875 |
| 2 Earners | 155 (42.5%) | $102,689 |
| 3+ Earners | 11 (3.0%) | $157,083 |
| Total | 365 (100.0%) | $64,125 |
Household Income in Tylertown
Household Income Brackets in Tylertown
With 185 households falling in the category, the $10,000 to $14,999 income range is the most frequent in Tylertown, accounting for 29.7% of all households. In contrast, only 25 households (4.0%) fall into the $25,000 to $34,999 income bracket, making it the least populous group.
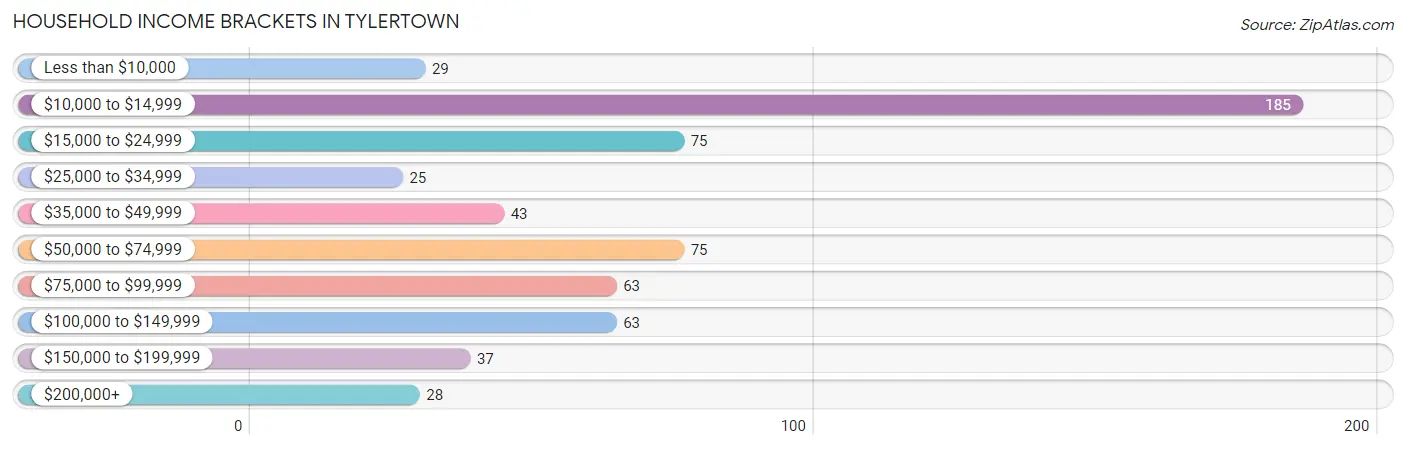
| Income Bracket | # Households | % Households |
| Less than $10,000 | 29 | 4.7% |
| $10,000 to $14,999 | 185 | 29.7% |
| $15,000 to $24,999 | 75 | 12.0% |
| $25,000 to $34,999 | 25 | 4.0% |
| $35,000 to $49,999 | 43 | 6.9% |
| $50,000 to $74,999 | 75 | 12.0% |
| $75,000 to $99,999 | 63 | 10.1% |
| $100,000 to $149,999 | 63 | 10.1% |
| $150,000 to $199,999 | 37 | 5.9% |
| $200,000+ | 28 | 4.5% |
Household Income by Householder Age in Tylertown
The median household income in Tylertown is $32,019, with the highest median household income of $46,023 found in the 25 to 44 years age bracket for the primary householder. A total of 143 households (23.0%) fall into this category. Meanwhile, the 15 to 24 years age bracket for the primary householder has the lowest median household income of $0, with 2 households (0.3%) in this group.
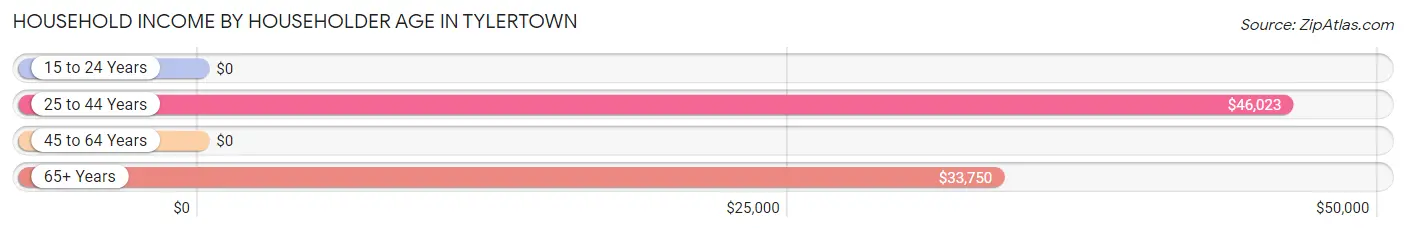
| Income Bracket | # Households | Median Income |
| 15 to 24 Years | 2 (0.3%) | $0 |
| 25 to 44 Years | 143 (23.0%) | $46,023 |
| 45 to 64 Years | 340 (54.6%) | $0 |
| 65+ Years | 138 (22.2%) | $33,750 |
| Total | 623 (100.0%) | $32,019 |
Poverty in Tylertown
Income Below Poverty by Sex and Age in Tylertown
With 26.3% poverty level for males and 43.3% for females among the residents of Tylertown, 16 and 17 year old males and 15 year old females are the most vulnerable to poverty, with 19 males (79.2%) and 102 females (100.0%) in their respective age groups living below the poverty level.
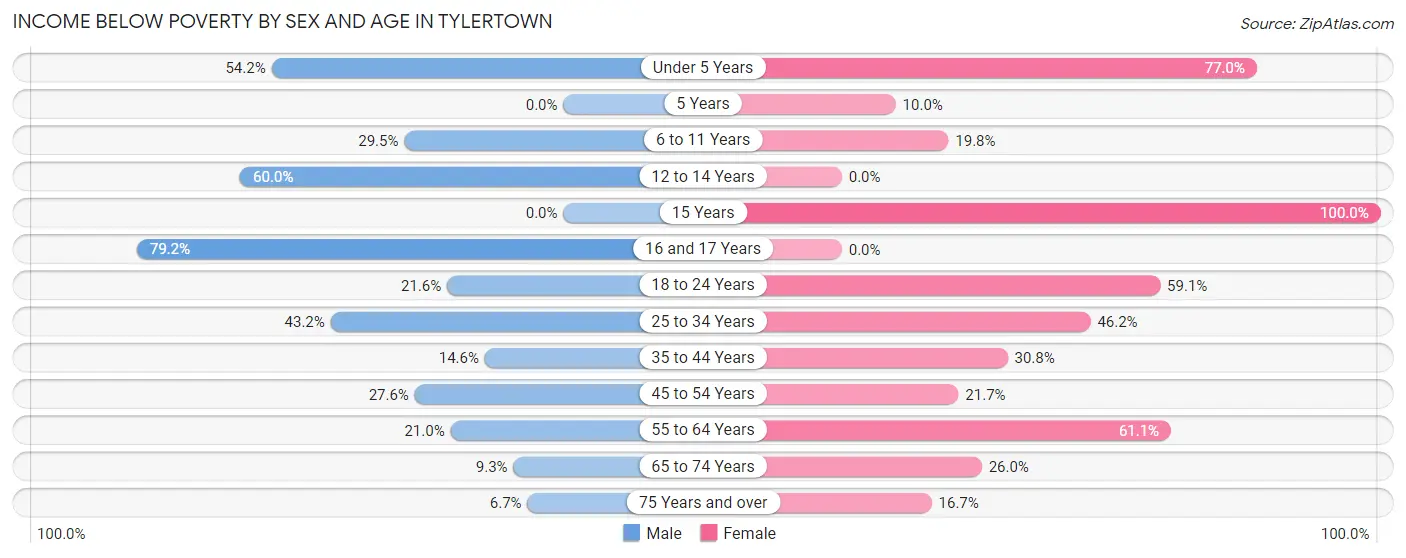
| Age Bracket | Male | Female |
| Under 5 Years | 13 (54.2%) | 57 (77.0%) |
| 5 Years | 0 (0.0%) | 2 (10.0%) |
| 6 to 11 Years | 31 (29.5%) | 36 (19.8%) |
| 12 to 14 Years | 24 (60.0%) | 0 (0.0%) |
| 15 Years | 0 (0.0%) | 102 (100.0%) |
| 16 and 17 Years | 19 (79.2%) | 0 (0.0%) |
| 18 to 24 Years | 30 (21.6%) | 78 (59.1%) |
| 25 to 34 Years | 54 (43.2%) | 48 (46.2%) |
| 35 to 44 Years | 14 (14.6%) | 36 (30.8%) |
| 45 to 54 Years | 16 (27.6%) | 21 (21.6%) |
| 55 to 64 Years | 22 (20.9%) | 146 (61.1%) |
| 65 to 74 Years | 5 (9.3%) | 20 (26.0%) |
| 75 Years and over | 4 (6.7%) | 16 (16.7%) |
| Total | 232 (26.3%) | 562 (43.3%) |
Income Above Poverty by Sex and Age in Tylertown
According to the poverty statistics in Tylertown, males aged 5 years and females aged 12 to 14 years are the age groups that are most secure financially, with 100.0% of males and 100.0% of females in these age groups living above the poverty line.
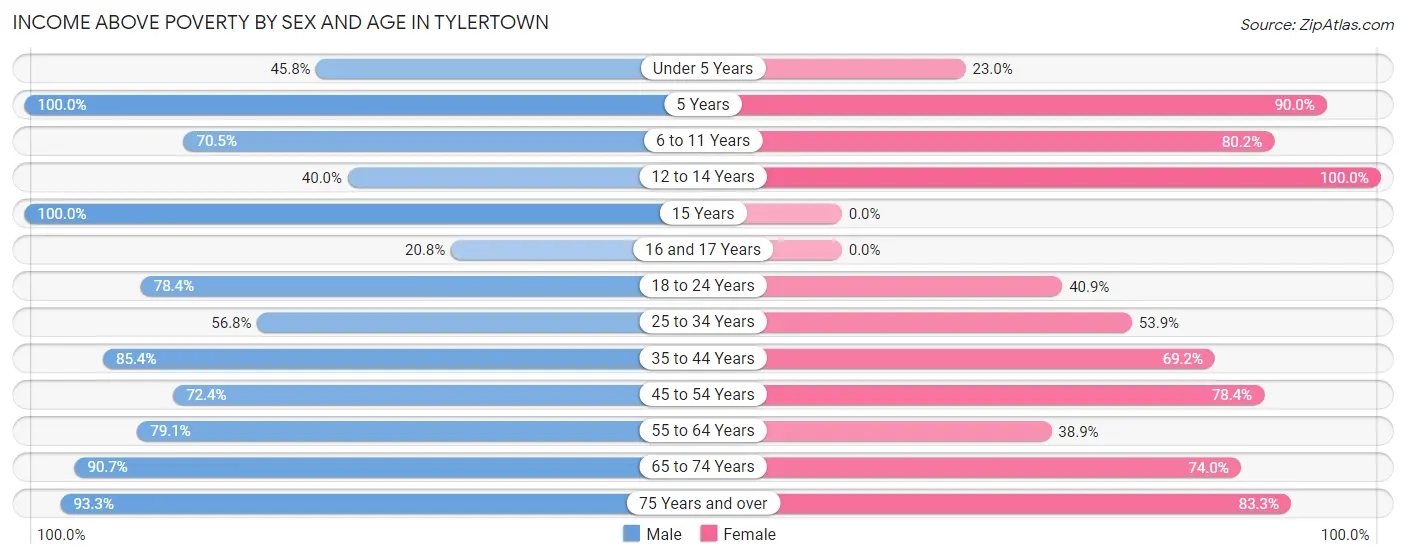
| Age Bracket | Male | Female |
| Under 5 Years | 11 (45.8%) | 17 (23.0%) |
| 5 Years | 23 (100.0%) | 18 (90.0%) |
| 6 to 11 Years | 74 (70.5%) | 146 (80.2%) |
| 12 to 14 Years | 16 (40.0%) | 57 (100.0%) |
| 15 Years | 30 (100.0%) | 0 (0.0%) |
| 16 and 17 Years | 5 (20.8%) | 0 (0.0%) |
| 18 to 24 Years | 109 (78.4%) | 54 (40.9%) |
| 25 to 34 Years | 71 (56.8%) | 56 (53.8%) |
| 35 to 44 Years | 82 (85.4%) | 81 (69.2%) |
| 45 to 54 Years | 42 (72.4%) | 76 (78.3%) |
| 55 to 64 Years | 83 (79.0%) | 93 (38.9%) |
| 65 to 74 Years | 49 (90.7%) | 57 (74.0%) |
| 75 Years and over | 56 (93.3%) | 80 (83.3%) |
| Total | 651 (73.7%) | 735 (56.7%) |
Income Below Poverty Among Married-Couple Families in Tylertown
The poverty statistics for married-couple families in Tylertown show that 11.9% or 27 of the total 227 families live below the poverty line. Families with 3 or 4 children have the highest poverty rate of 62.5%, comprising of 15 families. On the other hand, families with 1 or 2 children have the lowest poverty rate of 0.0%, which includes 0 families.
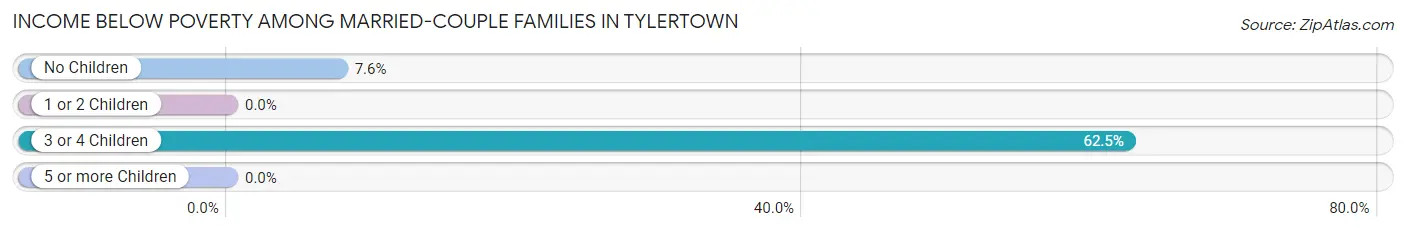
| Children | Above Poverty | Below Poverty |
| No Children | 145 (92.4%) | 12 (7.6%) |
| 1 or 2 Children | 46 (100.0%) | 0 (0.0%) |
| 3 or 4 Children | 9 (37.5%) | 15 (62.5%) |
| 5 or more Children | 0 (0.0%) | 0 (0.0%) |
| Total | 200 (88.1%) | 27 (11.9%) |
Income Below Poverty Among Single-Parent Households in Tylertown
According to the poverty data in Tylertown, 45.2% or 14 single-father households and 23.4% or 25 single-mother households are living below the poverty line. Among single-father households, those with no children have the highest poverty rate, with 14 households (66.7%) experiencing poverty. Likewise, among single-mother households, those with 5 or more children have the highest poverty rate, with 1 households (100.0%) falling below the poverty line.
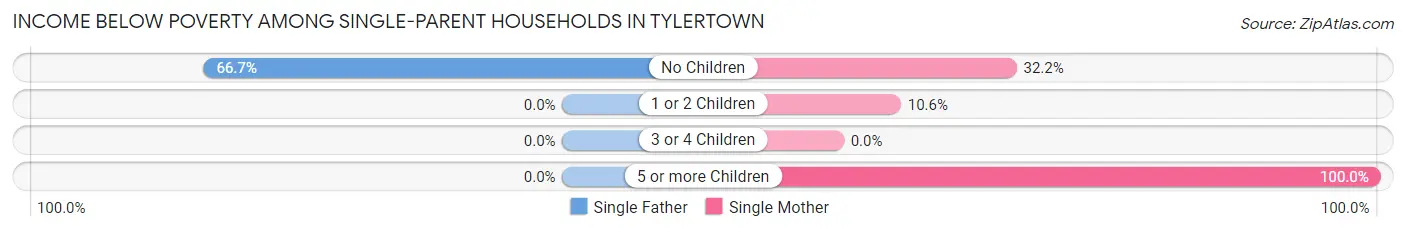
| Children | Single Father | Single Mother |
| No Children | 14 (66.7%) | 19 (32.2%) |
| 1 or 2 Children | 0 (0.0%) | 5 (10.6%) |
| 3 or 4 Children | 0 (0.0%) | 0 (0.0%) |
| 5 or more Children | 0 (0.0%) | 1 (100.0%) |
| Total | 14 (45.2%) | 25 (23.4%) |
Income Below Poverty Among Married-Couple vs Single-Parent Households in Tylertown
The poverty data for Tylertown shows that 27 of the married-couple family households (11.9%) and 39 of the single-parent households (28.3%) are living below the poverty level. Within the married-couple family households, those with 3 or 4 children have the highest poverty rate, with 15 households (62.5%) falling below the poverty line. Among the single-parent households, those with 5 or more children have the highest poverty rate, with 1 household (100.0%) living below poverty.
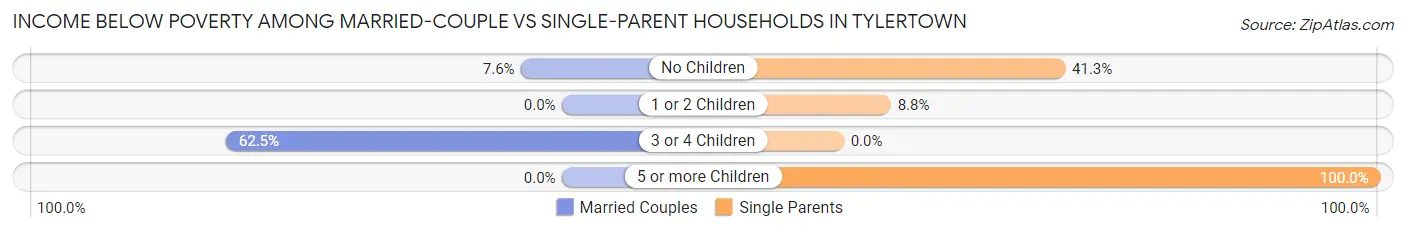
| Children | Married-Couple Families | Single-Parent Households |
| No Children | 12 (7.6%) | 33 (41.2%) |
| 1 or 2 Children | 0 (0.0%) | 5 (8.8%) |
| 3 or 4 Children | 15 (62.5%) | 0 (0.0%) |
| 5 or more Children | 0 (0.0%) | 1 (100.0%) |
| Total | 27 (11.9%) | 39 (28.3%) |
Race in Tylertown
The most populous races in Tylertown are White / Caucasian (1,274 | 54.4%), Black / African American (731 | 31.2%), and Hispanic or Latino (254 | 10.8%).
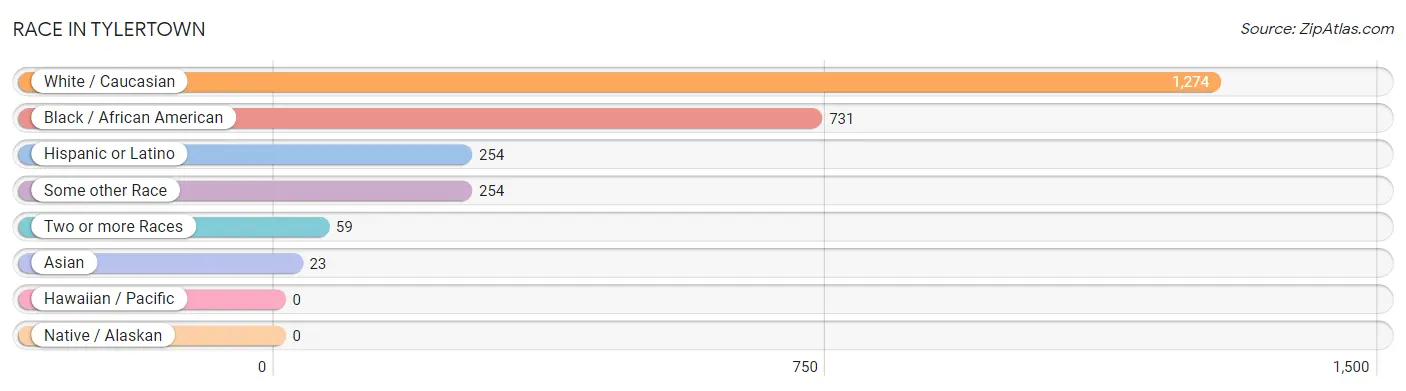
| Race | # Population | % Population |
| Asian | 23 | 1.0% |
| Black / African American | 731 | 31.2% |
| Hawaiian / Pacific | 0 | 0.0% |
| Hispanic or Latino | 254 | 10.8% |
| Native / Alaskan | 0 | 0.0% |
| White / Caucasian | 1,274 | 54.4% |
| Two or more Races | 59 | 2.5% |
| Some other Race | 254 | 10.8% |
| Total | 2,341 | 100.0% |
Ancestry in Tylertown
The most populous ancestries reported in Tylertown are Mexican (247 | 10.5%), American (195 | 8.3%), German (195 | 8.3%), Irish (167 | 7.1%), and English (113 | 4.8%), together accounting for 39.2% of all Tylertown residents.
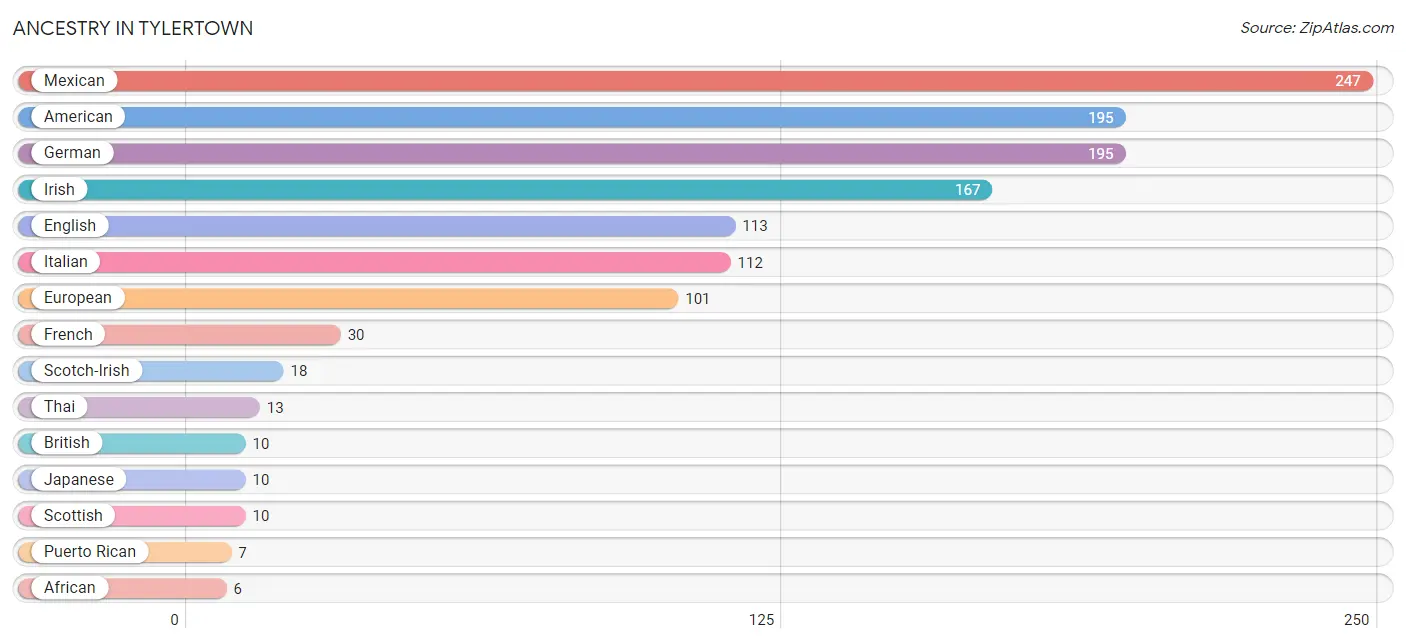
| Ancestry | # Population | % Population |
| African | 6 | 0.3% |
| American | 195 | 8.3% |
| British | 10 | 0.4% |
| Cherokee | 1 | 0.0% |
| Comanche | 6 | 0.3% |
| English | 113 | 4.8% |
| European | 101 | 4.3% |
| French | 30 | 1.3% |
| French Canadian | 1 | 0.0% |
| German | 195 | 8.3% |
| Irish | 167 | 7.1% |
| Italian | 112 | 4.8% |
| Japanese | 10 | 0.4% |
| Mexican | 247 | 10.5% |
| Norwegian | 4 | 0.2% |
| Puerto Rican | 7 | 0.3% |
| Russian | 3 | 0.1% |
| Scotch-Irish | 18 | 0.8% |
| Scottish | 10 | 0.4% |
| Subsaharan African | 6 | 0.3% |
| Thai | 13 | 0.6% |
| Welsh | 3 | 0.1% | View All 22 Rows |
Immigrants in Tylertown
The most numerous immigrant groups reported in Tylertown came from Central America (174 | 7.4%), Latin America (174 | 7.4%), Mexico (174 | 7.4%), Asia (21 | 0.9%), and India (11 | 0.5%), together accounting for 23.7% of all Tylertown residents.
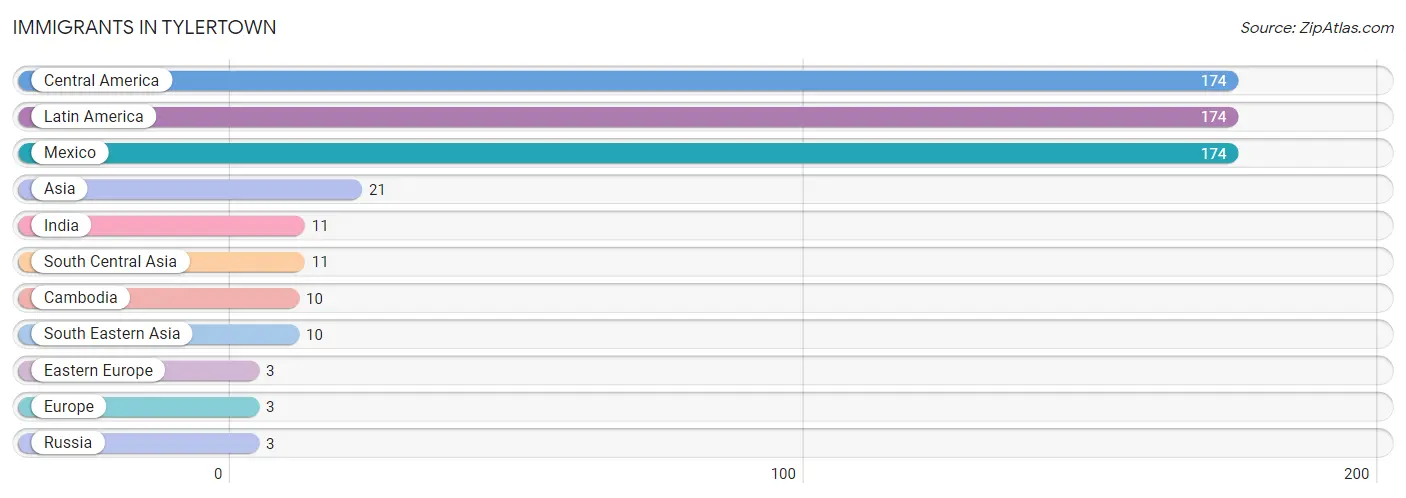
| Immigration Origin | # Population | % Population |
| Asia | 21 | 0.9% |
| Cambodia | 10 | 0.4% |
| Central America | 174 | 7.4% |
| Eastern Europe | 3 | 0.1% |
| Europe | 3 | 0.1% |
| India | 11 | 0.5% |
| Latin America | 174 | 7.4% |
| Mexico | 174 | 7.4% |
| Russia | 3 | 0.1% |
| South Central Asia | 11 | 0.5% |
| South Eastern Asia | 10 | 0.4% | View All 11 Rows |
Sex and Age in Tylertown
Sex and Age in Tylertown
The most populous age groups in Tylertown are 15 to 19 Years (129 | 13.7%) for men and 60 to 64 Years (155 | 11.1%) for women.
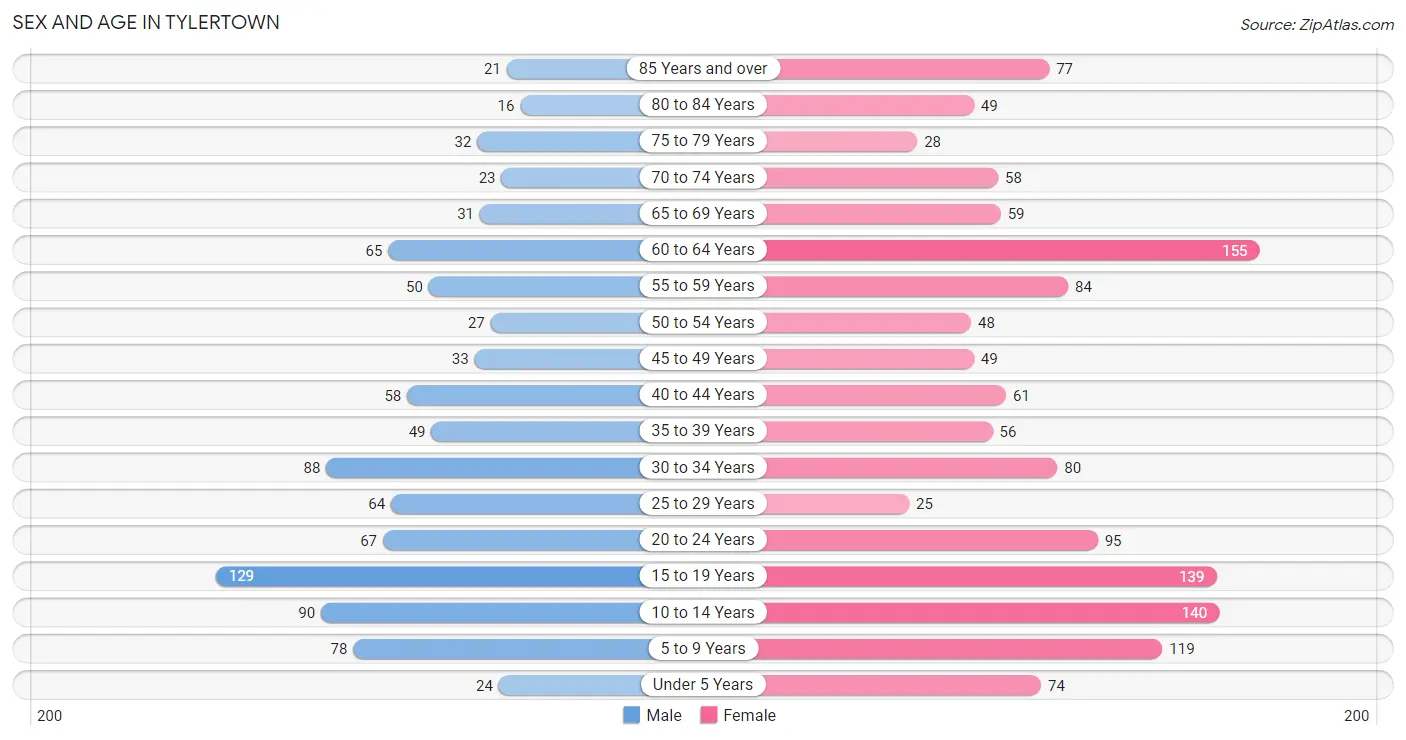
| Age Bracket | Male | Female |
| Under 5 Years | 24 (2.5%) | 74 (5.3%) |
| 5 to 9 Years | 78 (8.3%) | 119 (8.5%) |
| 10 to 14 Years | 90 (9.5%) | 140 (10.0%) |
| 15 to 19 Years | 129 (13.7%) | 139 (10.0%) |
| 20 to 24 Years | 67 (7.1%) | 95 (6.8%) |
| 25 to 29 Years | 64 (6.8%) | 25 (1.8%) |
| 30 to 34 Years | 88 (9.3%) | 80 (5.7%) |
| 35 to 39 Years | 49 (5.2%) | 56 (4.0%) |
| 40 to 44 Years | 58 (6.1%) | 61 (4.4%) |
| 45 to 49 Years | 33 (3.5%) | 49 (3.5%) |
| 50 to 54 Years | 27 (2.9%) | 48 (3.4%) |
| 55 to 59 Years | 50 (5.3%) | 84 (6.0%) |
| 60 to 64 Years | 65 (6.9%) | 155 (11.1%) |
| 65 to 69 Years | 31 (3.3%) | 59 (4.2%) |
| 70 to 74 Years | 23 (2.4%) | 58 (4.2%) |
| 75 to 79 Years | 32 (3.4%) | 28 (2.0%) |
| 80 to 84 Years | 16 (1.7%) | 49 (3.5%) |
| 85 Years and over | 21 (2.2%) | 77 (5.5%) |
| Total | 945 (100.0%) | 1,396 (100.0%) |
Families and Households in Tylertown
Median Family Size in Tylertown
The median family size in Tylertown is 5.00 persons per family, with single female/mother families (107 | 29.3%) accounting for the largest median family size of 5.78 persons per family. On the other hand, single male/father families (31 | 8.5%) represent the smallest median family size with 3.13 persons per family.
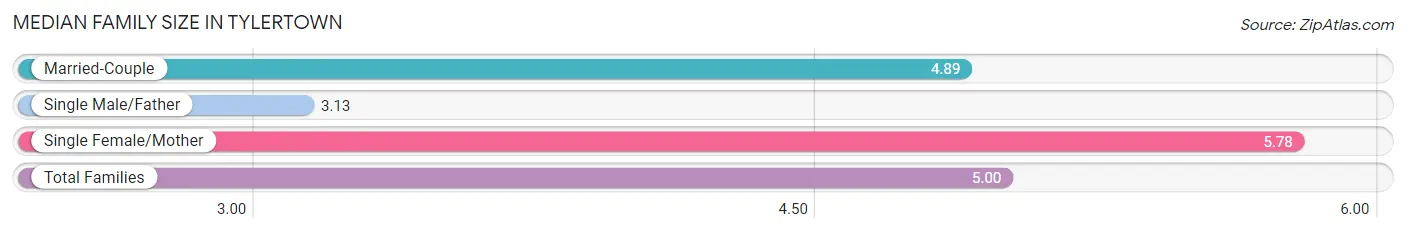
| Family Type | # Families | Family Size |
| Married-Couple | 227 (62.2%) | 4.89 |
| Single Male/Father | 31 (8.5%) | 3.13 |
| Single Female/Mother | 107 (29.3%) | 5.78 |
| Total Families | 365 (100.0%) | 5.00 |
Median Household Size in Tylertown
The median household size in Tylertown is 3.50 persons per household, with single female/mother households (107 | 17.2%) accounting for the largest median household size of 6.49 persons per household. non-family households (258 | 41.4%) represent the smallest median household size with 1.07 persons per household.
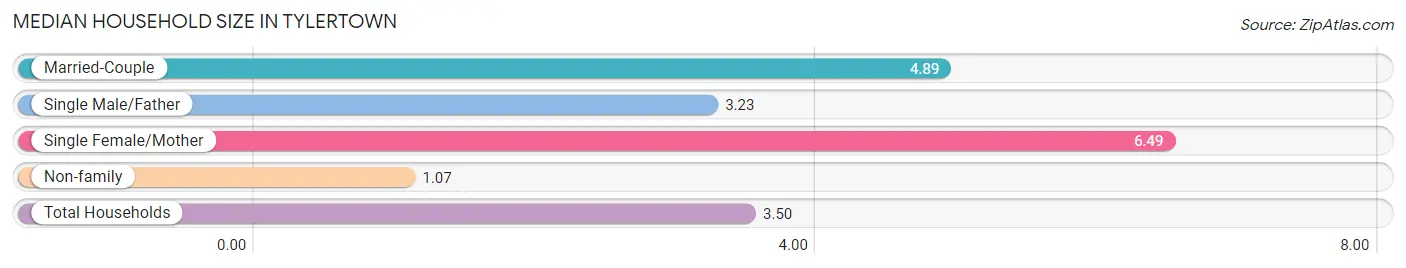
| Household Type | # Households | Household Size |
| Married-Couple | 227 (36.4%) | 4.89 |
| Single Male/Father | 31 (5.0%) | 3.23 |
| Single Female/Mother | 107 (17.2%) | 6.49 |
| Non-family | 258 (41.4%) | 1.07 |
| Total Households | 623 (100.0%) | 3.50 |
Household Size by Marriage Status in Tylertown
Out of a total of 623 households in Tylertown, 365 (58.6%) are family households, while 258 (41.4%) are nonfamily households. The most numerous type of family households are 2-person households, comprising 207, and the most common type of nonfamily households are 1-person households, comprising 240.
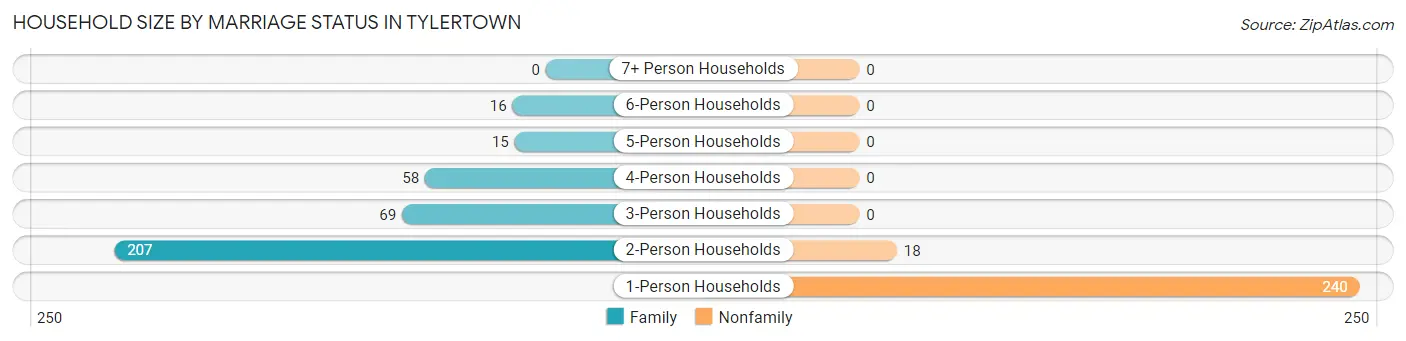
| Household Size | Family Households | Nonfamily Households |
| 1-Person Households | - | 240 (38.5%) |
| 2-Person Households | 207 (33.2%) | 18 (2.9%) |
| 3-Person Households | 69 (11.1%) | 0 (0.0%) |
| 4-Person Households | 58 (9.3%) | 0 (0.0%) |
| 5-Person Households | 15 (2.4%) | 0 (0.0%) |
| 6-Person Households | 16 (2.6%) | 0 (0.0%) |
| 7+ Person Households | 0 (0.0%) | 0 (0.0%) |
| Total | 365 (58.6%) | 258 (41.4%) |
Female Fertility in Tylertown
Fertility by Age in Tylertown
Average fertility rate in Tylertown is 18.0 births per 1,000 women. Women in the age bracket of 35 to 50 years have the highest fertility rate with 52.0 births per 1,000 women. Women in the age bracket of 35 to 50 years acount for 100.0% of all women with births.
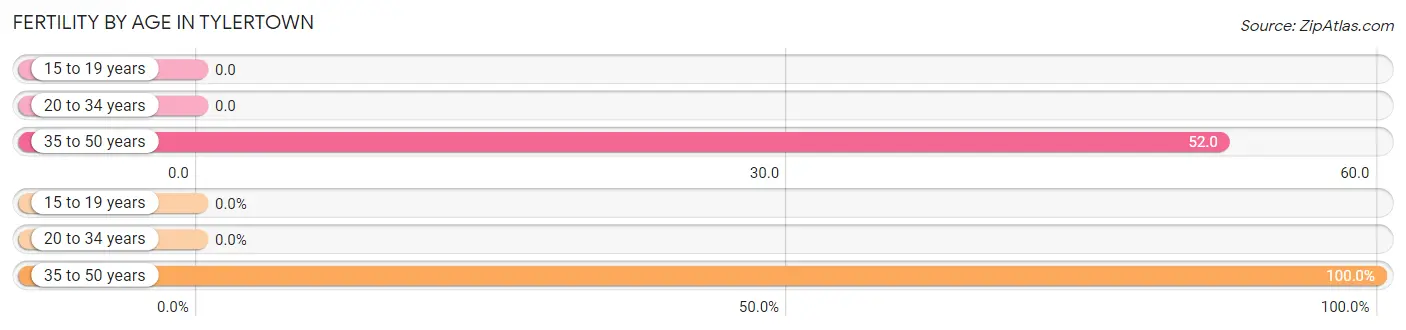
| Age Bracket | Women with Births | Births / 1,000 Women |
| 15 to 19 years | 0 (0.0%) | 0.0 |
| 20 to 34 years | 0 (0.0%) | 0.0 |
| 35 to 50 years | 9 (100.0%) | 52.0 |
| Total | 9 (100.0%) | 18.0 |
Fertility by Age by Marriage Status in Tylertown
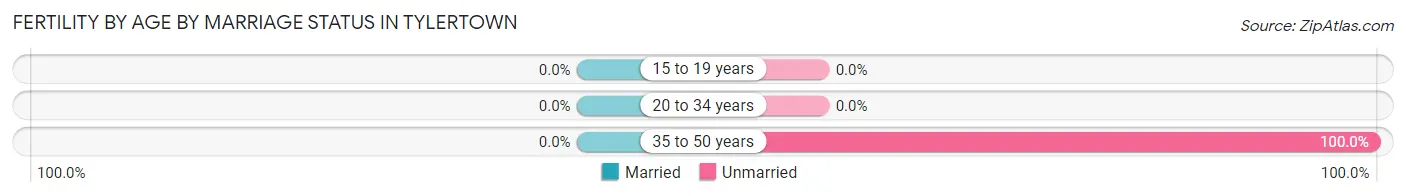
| Age Bracket | Married | Unmarried |
| 15 to 19 years | 0 (0.0%) | 0 (0.0%) |
| 20 to 34 years | 0 (0.0%) | 0 (0.0%) |
| 35 to 50 years | 0 (0.0%) | 9 (100.0%) |
| Total | 0 (0.0%) | 9 (100.0%) |
Fertility by Education in Tylertown
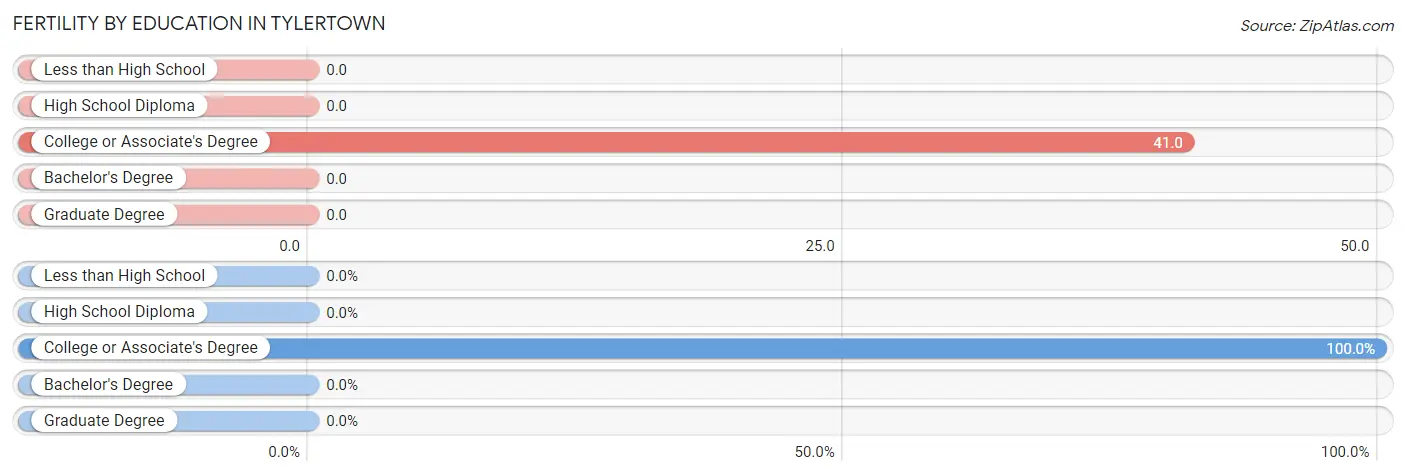
| Educational Attainment | Women with Births | Births / 1,000 Women |
| Less than High School | 0 (0.0%) | 0.0 |
| High School Diploma | 0 (0.0%) | 0.0 |
| College or Associate's Degree | 9 (100.0%) | 41.0 |
| Bachelor's Degree | 0 (0.0%) | 0.0 |
| Graduate Degree | 0 (0.0%) | 0.0 |
| Total | 9 (100.0%) | 18.0 |
Fertility by Education by Marriage Status in Tylertown
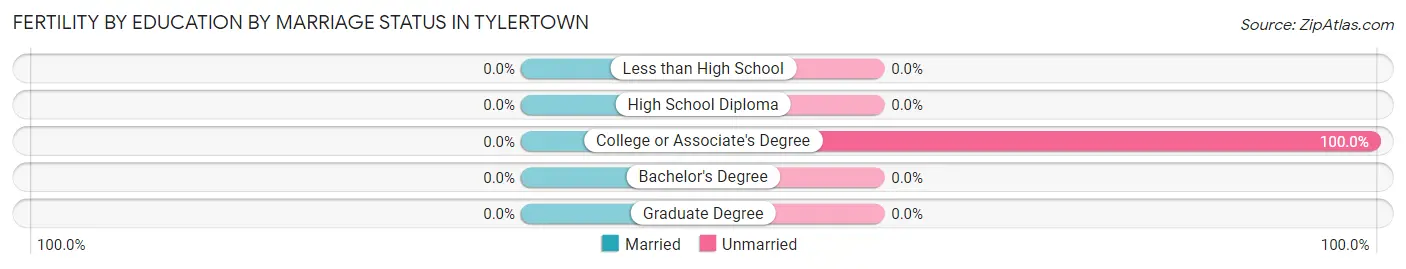
| Educational Attainment | Married | Unmarried |
| Less than High School | 0 (0.0%) | 0 (0.0%) |
| High School Diploma | 0 (0.0%) | 0 (0.0%) |
| College or Associate's Degree | 0 (0.0%) | 9 (100.0%) |
| Bachelor's Degree | 0 (0.0%) | 0 (0.0%) |
| Graduate Degree | 0 (0.0%) | 0 (0.0%) |
| Total | 0 (0.0%) | 9 (100.0%) |
Employment Characteristics in Tylertown
Employment by Class of Employer in Tylertown
Among the 622 employed individuals in Tylertown, private company employees (415 | 66.7%), self-employed (not incorporated) (73 | 11.7%), and state government employees (48 | 7.7%) make up the most common classes of employment.
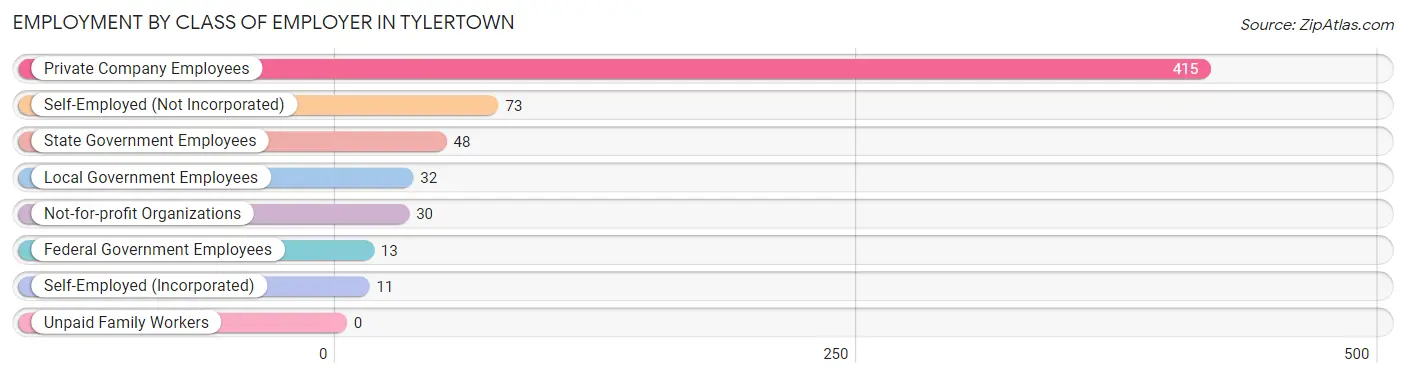
| Employer Class | # Employees | % Employees |
| Private Company Employees | 415 | 66.7% |
| Self-Employed (Incorporated) | 11 | 1.8% |
| Self-Employed (Not Incorporated) | 73 | 11.7% |
| Not-for-profit Organizations | 30 | 4.8% |
| Local Government Employees | 32 | 5.1% |
| State Government Employees | 48 | 7.7% |
| Federal Government Employees | 13 | 2.1% |
| Unpaid Family Workers | 0 | 0.0% |
| Total | 622 | 100.0% |
Employment Status by Age in Tylertown
According to the labor force statistics for Tylertown, out of the total population over 16 years of age (1,684), 46.8% or 788 individuals are in the labor force, with 16.6% or 131 of them unemployed. The age group with the highest labor force participation rate is 30 to 34 years, with 89.3% or 150 individuals in the labor force. Within the labor force, the 20 to 24 years age range has the highest percentage of unemployed individuals, with 57.1% or 76 of them being unemployed.
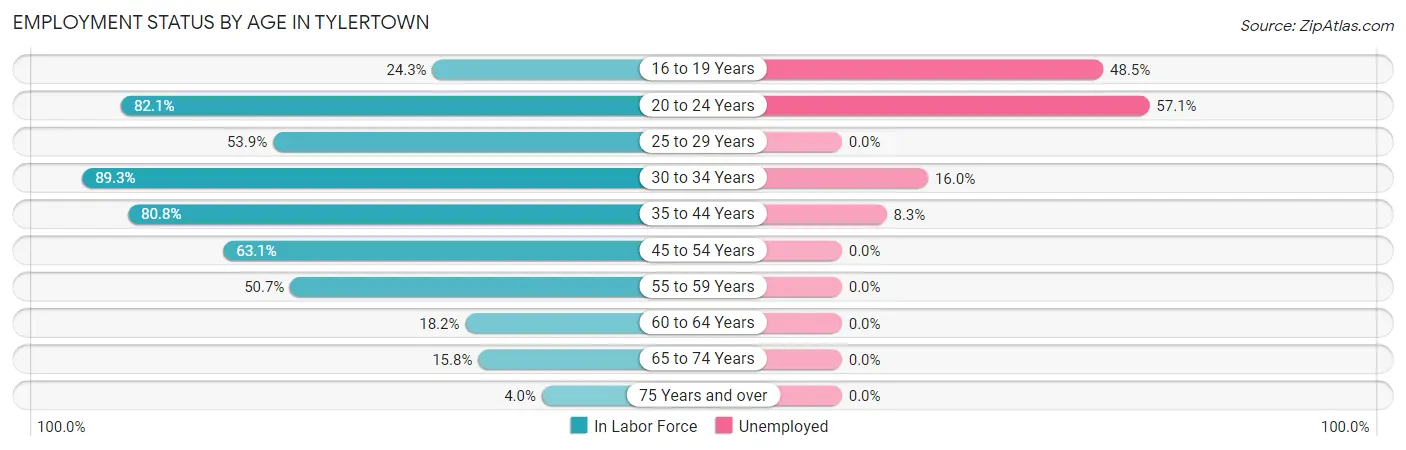
| Age Bracket | In Labor Force | Unemployed |
| 16 to 19 Years | 33 (24.3%) | 16 (48.5%) |
| 20 to 24 Years | 133 (82.1%) | 76 (57.1%) |
| 25 to 29 Years | 48 (53.9%) | 0 (0.0%) |
| 30 to 34 Years | 150 (89.3%) | 24 (16.0%) |
| 35 to 44 Years | 181 (80.8%) | 15 (8.3%) |
| 45 to 54 Years | 99 (63.1%) | 0 (0.0%) |
| 55 to 59 Years | 68 (50.7%) | 0 (0.0%) |
| 60 to 64 Years | 40 (18.2%) | 0 (0.0%) |
| 65 to 74 Years | 27 (15.8%) | 0 (0.0%) |
| 75 Years and over | 9 (4.0%) | 0 (0.0%) |
| Total | 788 (46.8%) | 131 (16.6%) |
Employment Status by Educational Attainment in Tylertown
According to labor force statistics for Tylertown, 59.1% of individuals (586) out of the total population between 25 and 64 years of age (992) are in the labor force, with 6.7% or 39 of them being unemployed. The group with the highest labor force participation rate are those with the educational attainment of bachelor's degree or higher, with 77.4% or 164 individuals in the labor force. Within the labor force, individuals with less than high school education have the highest percentage of unemployment, with 41.4% or 24 of them being unemployed.
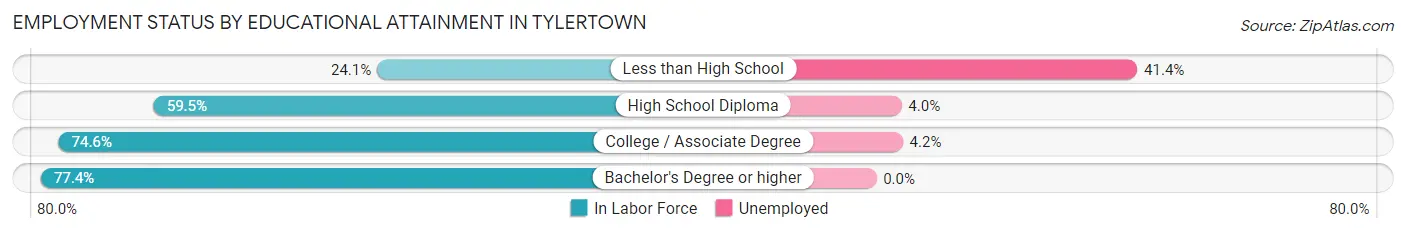
| Educational Attainment | In Labor Force | Unemployed |
| Less than High School | 58 (24.1%) | 100 (41.4%) |
| High School Diploma | 150 (59.5%) | 10 (4.0%) |
| College / Associate Degree | 214 (74.6%) | 12 (4.2%) |
| Bachelor's Degree or higher | 164 (77.4%) | 0 (0.0%) |
| Total | 586 (59.1%) | 66 (6.7%) |
Employment Occupations by Sex in Tylertown
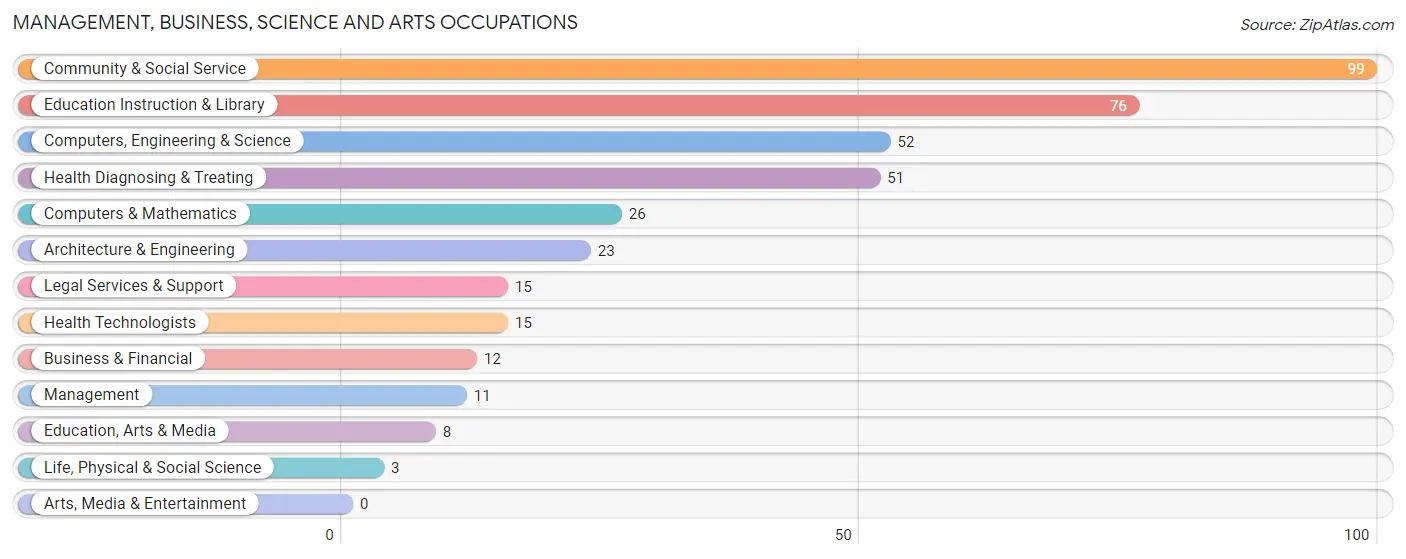
Management, Business, Science and Arts Occupations
The most common Management, Business, Science and Arts occupations in Tylertown are Community & Social Service (99 | 15.1%), Education Instruction & Library (76 | 11.6%), Computers, Engineering & Science (52 | 7.9%), Health Diagnosing & Treating (51 | 7.8%), and Computers & Mathematics (26 | 4.0%).
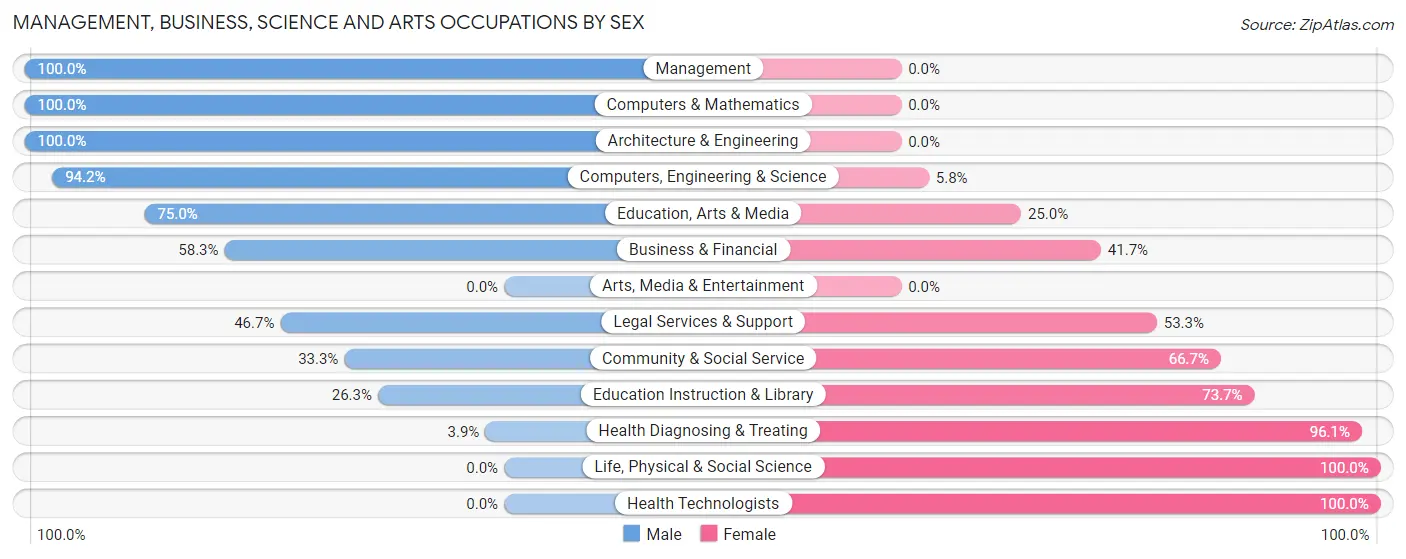
Management, Business, Science and Arts Occupations by Sex
Within the Management, Business, Science and Arts occupations in Tylertown, the most male-oriented occupations are Management (100.0%), Computers & Mathematics (100.0%), and Architecture & Engineering (100.0%), while the most female-oriented occupations are Life, Physical & Social Science (100.0%), Health Technologists (100.0%), and Health Diagnosing & Treating (96.1%).
| Occupation | Male | Female |
| Management | 11 (100.0%) | 0 (0.0%) |
| Business & Financial | 7 (58.3%) | 5 (41.7%) |
| Computers, Engineering & Science | 49 (94.2%) | 3 (5.8%) |
| Computers & Mathematics | 26 (100.0%) | 0 (0.0%) |
| Architecture & Engineering | 23 (100.0%) | 0 (0.0%) |
| Life, Physical & Social Science | 0 (0.0%) | 3 (100.0%) |
| Community & Social Service | 33 (33.3%) | 66 (66.7%) |
| Education, Arts & Media | 6 (75.0%) | 2 (25.0%) |
| Legal Services & Support | 7 (46.7%) | 8 (53.3%) |
| Education Instruction & Library | 20 (26.3%) | 56 (73.7%) |
| Arts, Media & Entertainment | 0 (0.0%) | 0 (0.0%) |
| Health Diagnosing & Treating | 2 (3.9%) | 49 (96.1%) |
| Health Technologists | 0 (0.0%) | 15 (100.0%) |
| Total (Category) | 102 (45.3%) | 123 (54.7%) |
| Total (Overall) | 367 (55.9%) | 290 (44.1%) |
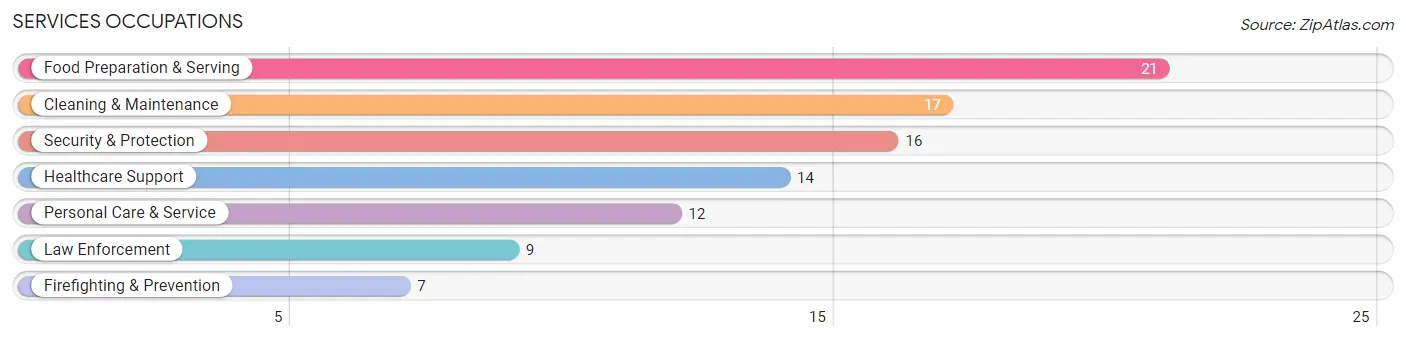
Services Occupations
The most common Services occupations in Tylertown are Food Preparation & Serving (21 | 3.2%), Cleaning & Maintenance (17 | 2.6%), Security & Protection (16 | 2.4%), Healthcare Support (14 | 2.1%), and Personal Care & Service (12 | 1.8%).
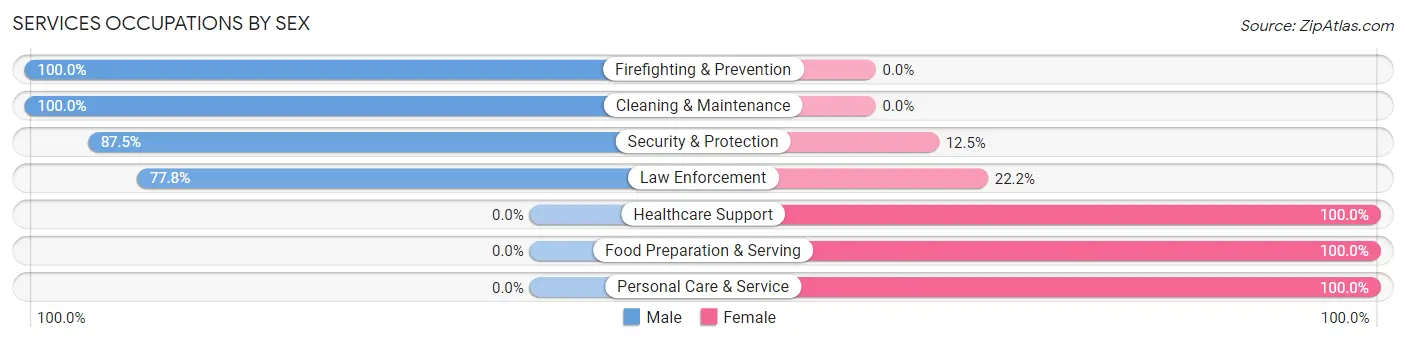
Services Occupations by Sex
Within the Services occupations in Tylertown, the most male-oriented occupations are Firefighting & Prevention (100.0%), Cleaning & Maintenance (100.0%), and Security & Protection (87.5%), while the most female-oriented occupations are Healthcare Support (100.0%), Food Preparation & Serving (100.0%), and Personal Care & Service (100.0%).
| Occupation | Male | Female |
| Healthcare Support | 0 (0.0%) | 14 (100.0%) |
| Security & Protection | 14 (87.5%) | 2 (12.5%) |
| Firefighting & Prevention | 7 (100.0%) | 0 (0.0%) |
| Law Enforcement | 7 (77.8%) | 2 (22.2%) |
| Food Preparation & Serving | 0 (0.0%) | 21 (100.0%) |
| Cleaning & Maintenance | 17 (100.0%) | 0 (0.0%) |
| Personal Care & Service | 0 (0.0%) | 12 (100.0%) |
| Total (Category) | 31 (38.8%) | 49 (61.3%) |
| Total (Overall) | 367 (55.9%) | 290 (44.1%) |
Sales and Office Occupations
The most common Sales and Office occupations in Tylertown are Office & Administration (77 | 11.7%), and Sales & Related (30 | 4.6%).
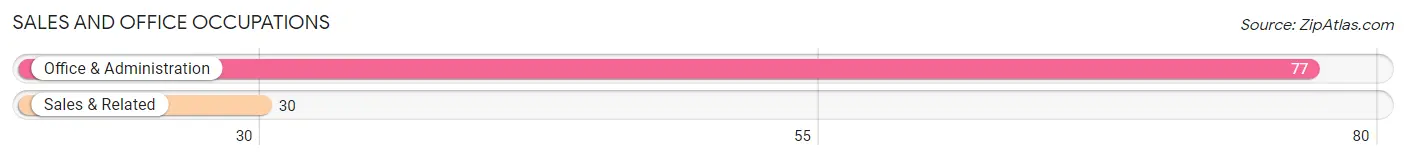
Sales and Office Occupations by Sex

| Occupation | Male | Female |
| Sales & Related | 30 (100.0%) | 0 (0.0%) |
| Office & Administration | 5 (6.5%) | 72 (93.5%) |
| Total (Category) | 35 (32.7%) | 72 (67.3%) |
| Total (Overall) | 367 (55.9%) | 290 (44.1%) |
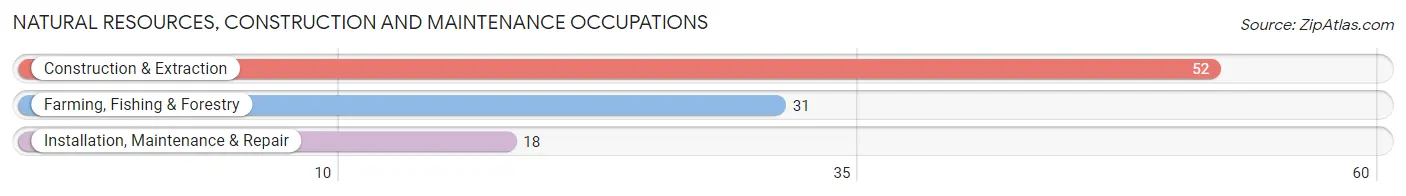
Natural Resources, Construction and Maintenance Occupations
The most common Natural Resources, Construction and Maintenance occupations in Tylertown are Construction & Extraction (52 | 7.9%), Farming, Fishing & Forestry (31 | 4.7%), and Installation, Maintenance & Repair (18 | 2.7%).
Natural Resources, Construction and Maintenance Occupations by Sex
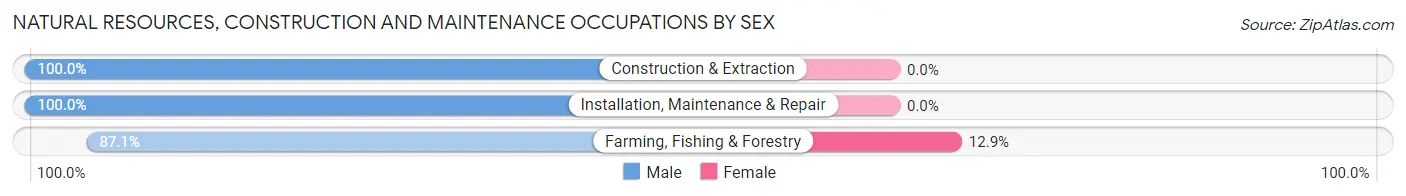
| Occupation | Male | Female |
| Farming, Fishing & Forestry | 27 (87.1%) | 4 (12.9%) |
| Construction & Extraction | 52 (100.0%) | 0 (0.0%) |
| Installation, Maintenance & Repair | 18 (100.0%) | 0 (0.0%) |
| Total (Category) | 97 (96.0%) | 4 (4.0%) |
| Total (Overall) | 367 (55.9%) | 290 (44.1%) |
Production, Transportation and Moving Occupations
The most common Production, Transportation and Moving occupations in Tylertown are Production (83 | 12.6%), Transportation (53 | 8.1%), and Material Moving (8 | 1.2%).
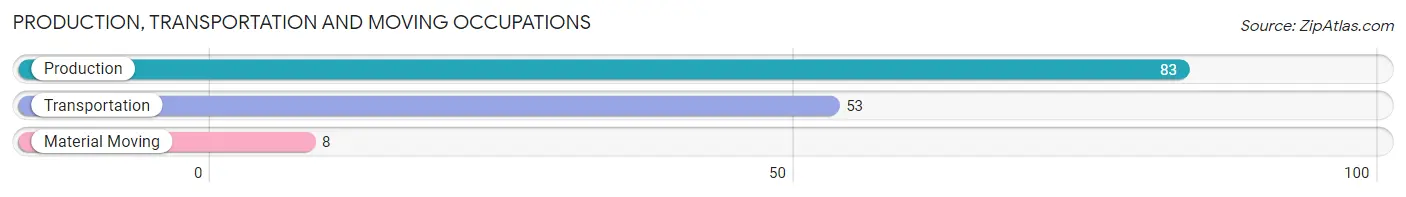
Production, Transportation and Moving Occupations by Sex
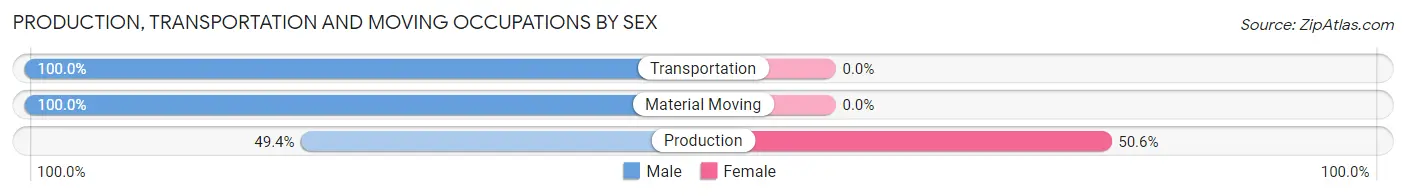
| Occupation | Male | Female |
| Production | 41 (49.4%) | 42 (50.6%) |
| Transportation | 53 (100.0%) | 0 (0.0%) |
| Material Moving | 8 (100.0%) | 0 (0.0%) |
| Total (Category) | 102 (70.8%) | 42 (29.2%) |
| Total (Overall) | 367 (55.9%) | 290 (44.1%) |
Employment Industries by Sex in Tylertown
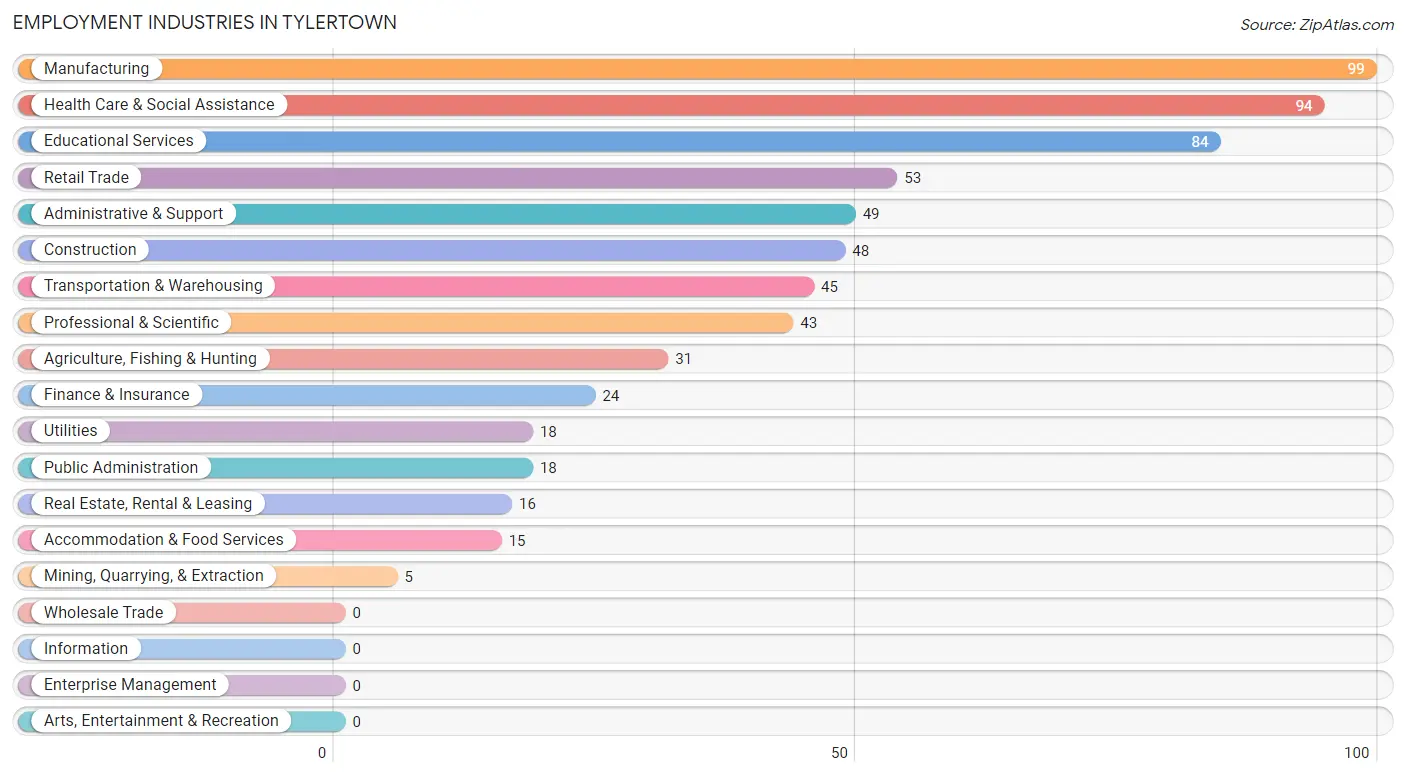
Employment Industries in Tylertown
The major employment industries in Tylertown include Manufacturing (99 | 15.1%), Health Care & Social Assistance (94 | 14.3%), Educational Services (84 | 12.8%), Retail Trade (53 | 8.1%), and Administrative & Support (49 | 7.5%).
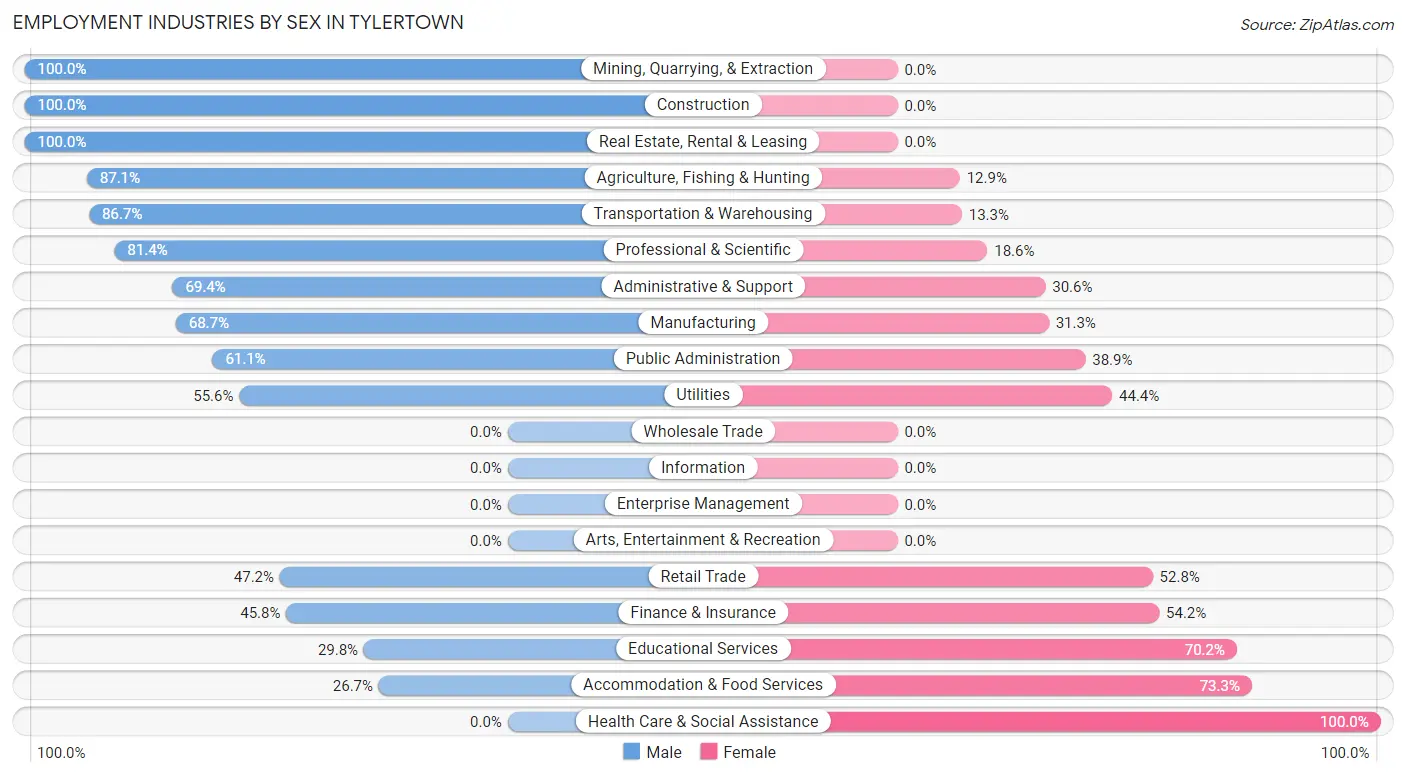
Employment Industries by Sex in Tylertown
The Tylertown industries that see more men than women are Mining, Quarrying, & Extraction (100.0%), Construction (100.0%), and Real Estate, Rental & Leasing (100.0%), whereas the industries that tend to have a higher number of women are Health Care & Social Assistance (100.0%), Accommodation & Food Services (73.3%), and Educational Services (70.2%).
| Industry | Male | Female |
| Agriculture, Fishing & Hunting | 27 (87.1%) | 4 (12.9%) |
| Mining, Quarrying, & Extraction | 5 (100.0%) | 0 (0.0%) |
| Construction | 48 (100.0%) | 0 (0.0%) |
| Manufacturing | 68 (68.7%) | 31 (31.3%) |
| Wholesale Trade | 0 (0.0%) | 0 (0.0%) |
| Retail Trade | 25 (47.2%) | 28 (52.8%) |
| Transportation & Warehousing | 39 (86.7%) | 6 (13.3%) |
| Utilities | 10 (55.6%) | 8 (44.4%) |
| Information | 0 (0.0%) | 0 (0.0%) |
| Finance & Insurance | 11 (45.8%) | 13 (54.2%) |
| Real Estate, Rental & Leasing | 16 (100.0%) | 0 (0.0%) |
| Professional & Scientific | 35 (81.4%) | 8 (18.6%) |
| Enterprise Management | 0 (0.0%) | 0 (0.0%) |
| Administrative & Support | 34 (69.4%) | 15 (30.6%) |
| Educational Services | 25 (29.8%) | 59 (70.2%) |
| Health Care & Social Assistance | 0 (0.0%) | 94 (100.0%) |
| Arts, Entertainment & Recreation | 0 (0.0%) | 0 (0.0%) |
| Accommodation & Food Services | 4 (26.7%) | 11 (73.3%) |
| Public Administration | 11 (61.1%) | 7 (38.9%) |
| Total | 367 (55.9%) | 290 (44.1%) |
Education in Tylertown
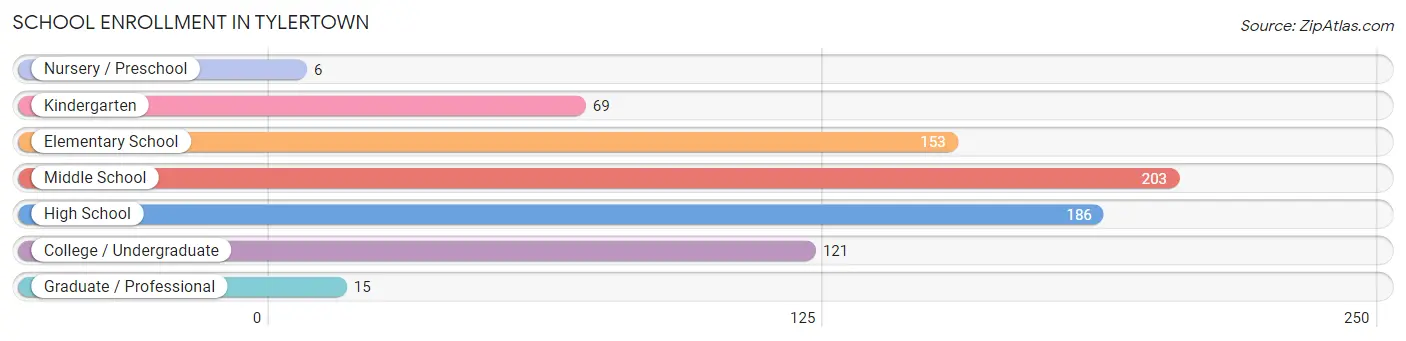
School Enrollment in Tylertown
The most common levels of schooling among the 753 students in Tylertown are middle school (203 | 27.0%), high school (186 | 24.7%), and elementary school (153 | 20.3%).
| School Level | # Students | % Students |
| Nursery / Preschool | 6 | 0.8% |
| Kindergarten | 69 | 9.2% |
| Elementary School | 153 | 20.3% |
| Middle School | 203 | 27.0% |
| High School | 186 | 24.7% |
| College / Undergraduate | 121 | 16.1% |
| Graduate / Professional | 15 | 2.0% |
| Total | 753 | 100.0% |
School Enrollment by Age by Funding Source in Tylertown
Out of a total of 753 students who are enrolled in schools in Tylertown, 177 (23.5%) attend a private institution, while the remaining 576 (76.5%) are enrolled in public schools. The age group of 3 to 4 year olds has the highest likelihood of being enrolled in private schools, with 4 (100.0% in the age bracket) enrolled. Conversely, the age group of 15 to 17 year olds has the lowest likelihood of being enrolled in a private school, with 156 (100.0% in the age bracket) attending a public institution.
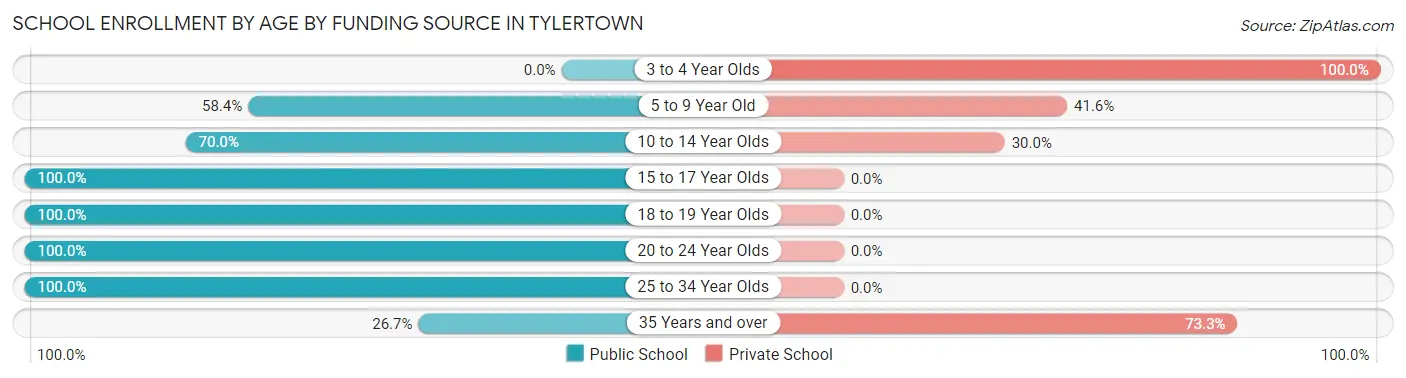
| Age Bracket | Public School | Private School |
| 3 to 4 Year Olds | 0 (0.0%) | 4 (100.0%) |
| 5 to 9 Year Old | 115 (58.4%) | 82 (41.6%) |
| 10 to 14 Year Olds | 161 (70.0%) | 69 (30.0%) |
| 15 to 17 Year Olds | 156 (100.0%) | 0 (0.0%) |
| 18 to 19 Year Olds | 112 (100.0%) | 0 (0.0%) |
| 20 to 24 Year Olds | 12 (100.0%) | 0 (0.0%) |
| 25 to 34 Year Olds | 12 (100.0%) | 0 (0.0%) |
| 35 Years and over | 8 (26.7%) | 22 (73.3%) |
| Total | 576 (76.5%) | 177 (23.5%) |
Educational Attainment by Field of Study in Tylertown
Education (126 | 35.1%), business (51 | 14.2%), arts & humanities (43 | 12.0%), engineering (35 | 9.8%), and psychology (30 | 8.4%) are the most common fields of study among 359 individuals in Tylertown who have obtained a bachelor's degree or higher.
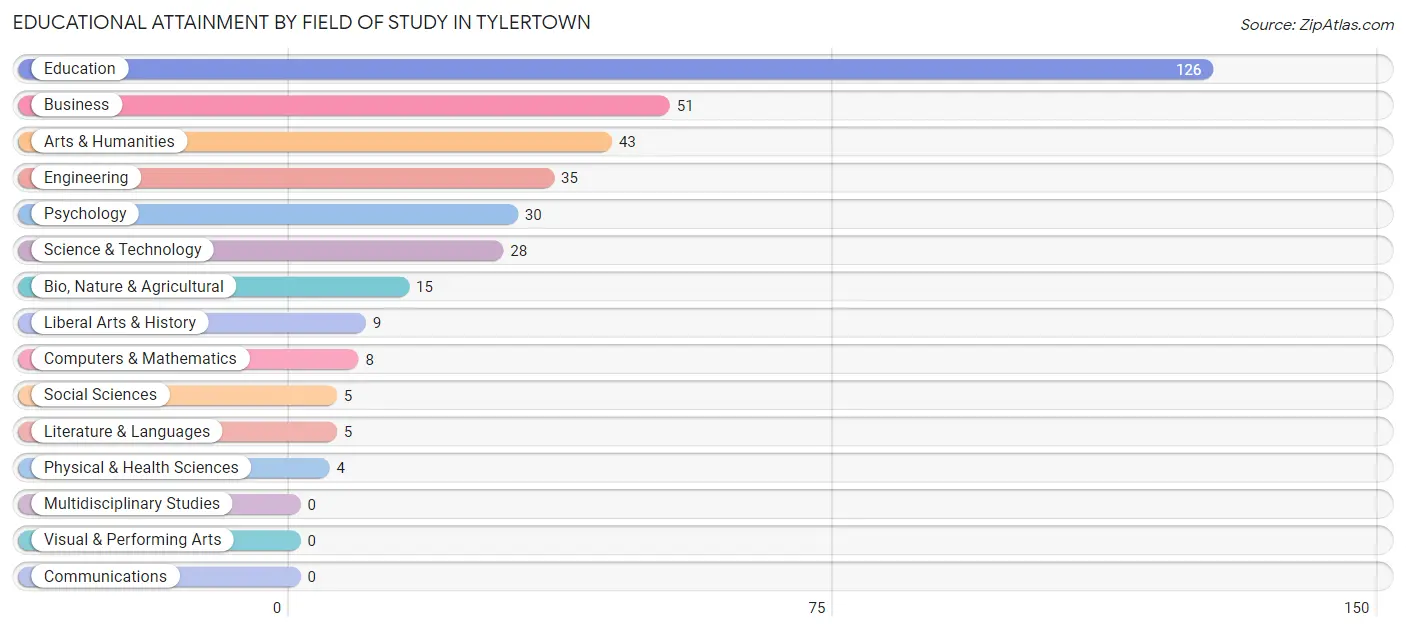
| Field of Study | # Graduates | % Graduates |
| Computers & Mathematics | 8 | 2.2% |
| Bio, Nature & Agricultural | 15 | 4.2% |
| Physical & Health Sciences | 4 | 1.1% |
| Psychology | 30 | 8.4% |
| Social Sciences | 5 | 1.4% |
| Engineering | 35 | 9.8% |
| Multidisciplinary Studies | 0 | 0.0% |
| Science & Technology | 28 | 7.8% |
| Business | 51 | 14.2% |
| Education | 126 | 35.1% |
| Literature & Languages | 5 | 1.4% |
| Liberal Arts & History | 9 | 2.5% |
| Visual & Performing Arts | 0 | 0.0% |
| Communications | 0 | 0.0% |
| Arts & Humanities | 43 | 12.0% |
| Total | 359 | 100.0% |
Transportation & Commute in Tylertown
Vehicle Availability by Sex in Tylertown
The most prevalent vehicle ownership categories in Tylertown are males with 2 vehicles (136, accounting for 37.6%) and females with 2 vehicles (63, making up 52.3%).
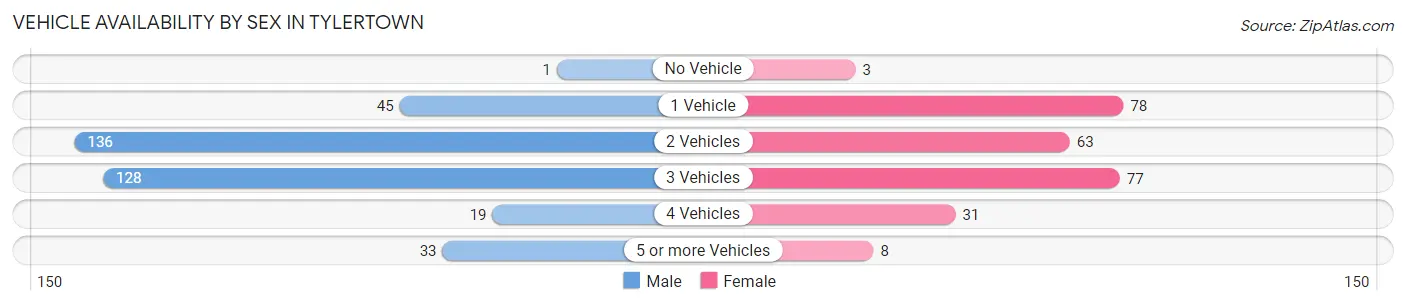
| Vehicles Available | Male | Female |
| No Vehicle | 1 (0.3%) | 3 (1.1%) |
| 1 Vehicle | 45 (12.4%) | 78 (30.0%) |
| 2 Vehicles | 136 (37.6%) | 63 (24.2%) |
| 3 Vehicles | 128 (35.4%) | 77 (29.6%) |
| 4 Vehicles | 19 (5.2%) | 31 (11.9%) |
| 5 or more Vehicles | 33 (9.1%) | 8 (3.1%) |
| Total | 362 (100.0%) | 260 (100.0%) |
Commute Time in Tylertown
The most frequently occuring commute durations in Tylertown are 5 to 9 minutes (152 commuters, 25.9%), 10 to 14 minutes (89 commuters, 15.1%), and 15 to 19 minutes (89 commuters, 15.1%).
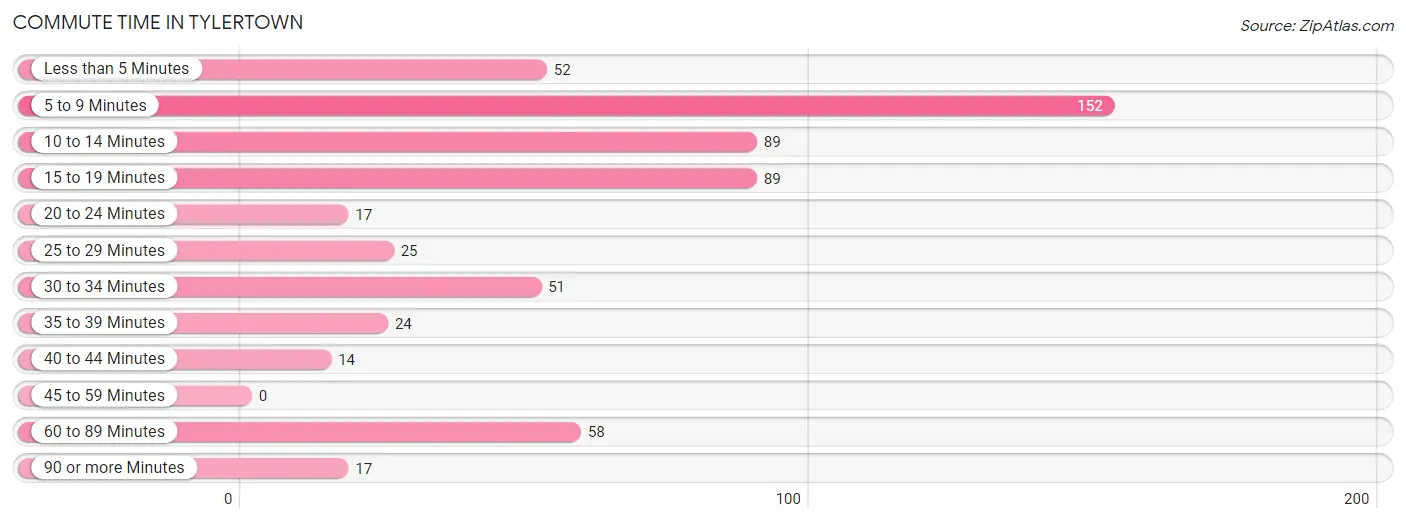
| Commute Time | # Commuters | % Commuters |
| Less than 5 Minutes | 52 | 8.8% |
| 5 to 9 Minutes | 152 | 25.9% |
| 10 to 14 Minutes | 89 | 15.1% |
| 15 to 19 Minutes | 89 | 15.1% |
| 20 to 24 Minutes | 17 | 2.9% |
| 25 to 29 Minutes | 25 | 4.3% |
| 30 to 34 Minutes | 51 | 8.7% |
| 35 to 39 Minutes | 24 | 4.1% |
| 40 to 44 Minutes | 14 | 2.4% |
| 45 to 59 Minutes | 0 | 0.0% |
| 60 to 89 Minutes | 58 | 9.9% |
| 90 or more Minutes | 17 | 2.9% |
Commute Time by Sex in Tylertown
The most common commute times in Tylertown are 15 to 19 minutes (89 commuters, 26.9%) for males and 5 to 9 minutes (98 commuters, 38.1%) for females.
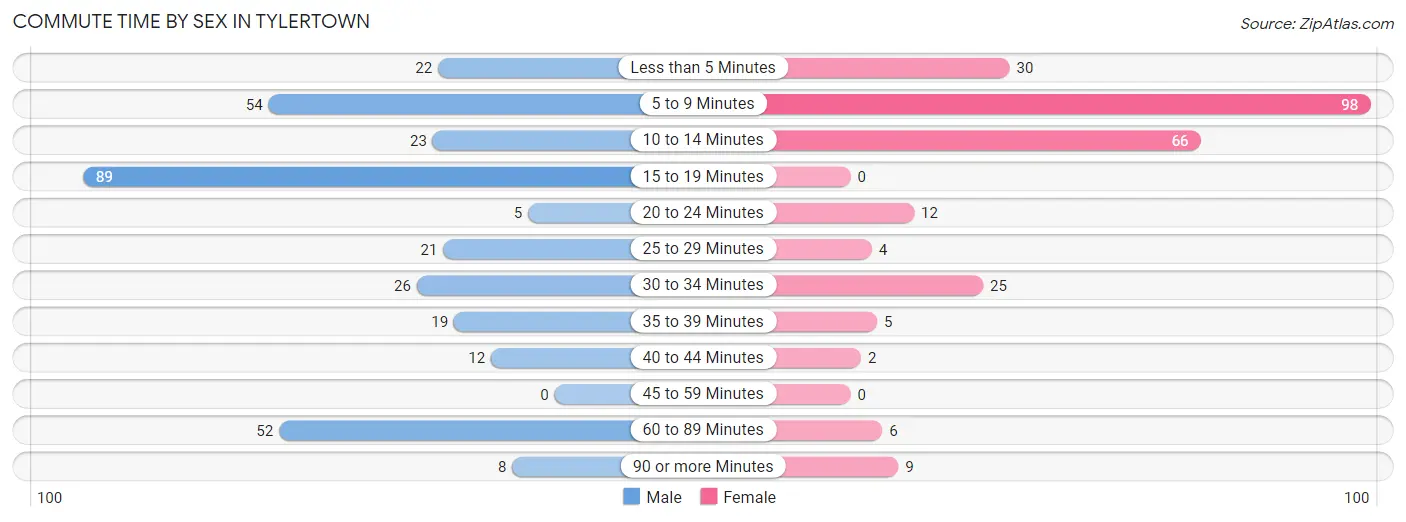
| Commute Time | Male | Female |
| Less than 5 Minutes | 22 (6.7%) | 30 (11.7%) |
| 5 to 9 Minutes | 54 (16.3%) | 98 (38.1%) |
| 10 to 14 Minutes | 23 (7.0%) | 66 (25.7%) |
| 15 to 19 Minutes | 89 (26.9%) | 0 (0.0%) |
| 20 to 24 Minutes | 5 (1.5%) | 12 (4.7%) |
| 25 to 29 Minutes | 21 (6.3%) | 4 (1.6%) |
| 30 to 34 Minutes | 26 (7.9%) | 25 (9.7%) |
| 35 to 39 Minutes | 19 (5.7%) | 5 (1.9%) |
| 40 to 44 Minutes | 12 (3.6%) | 2 (0.8%) |
| 45 to 59 Minutes | 0 (0.0%) | 0 (0.0%) |
| 60 to 89 Minutes | 52 (15.7%) | 6 (2.3%) |
| 90 or more Minutes | 8 (2.4%) | 9 (3.5%) |
Time of Departure to Work by Sex in Tylertown
The most frequent times of departure to work in Tylertown are 12:00 AM to 4:59 AM (62, 18.7%) for males and 7:00 AM to 7:29 AM (76, 29.6%) for females.
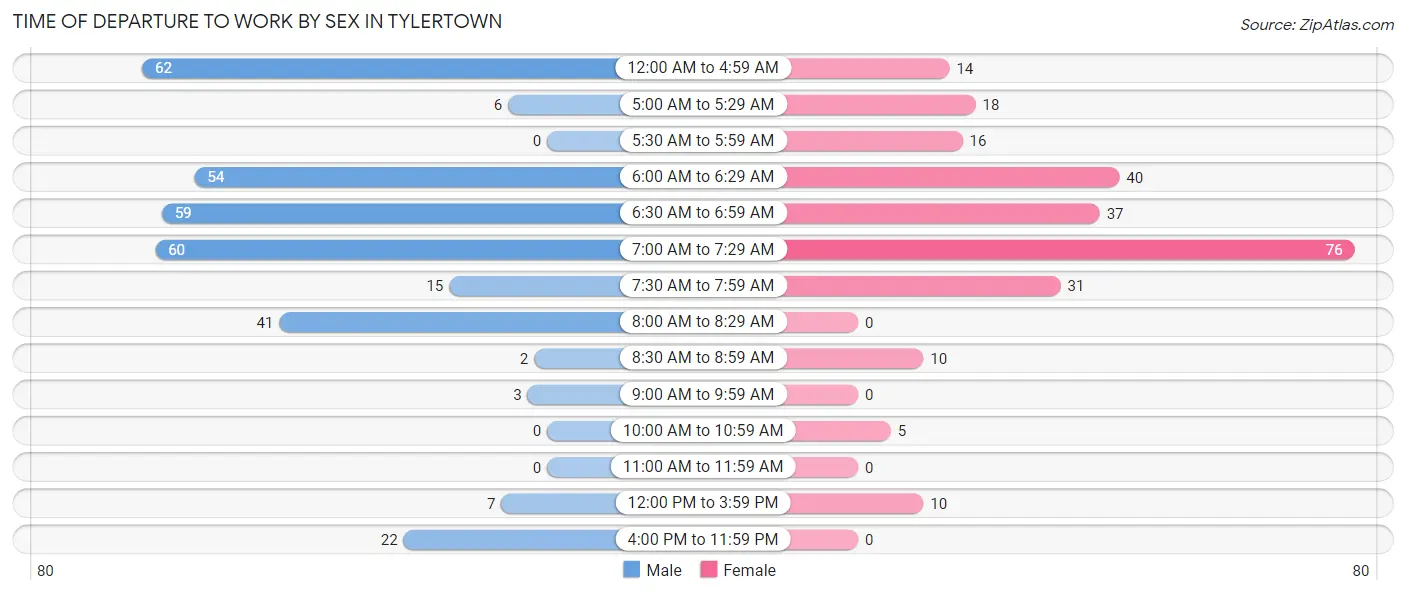
| Time of Departure | Male | Female |
| 12:00 AM to 4:59 AM | 62 (18.7%) | 14 (5.4%) |
| 5:00 AM to 5:29 AM | 6 (1.8%) | 18 (7.0%) |
| 5:30 AM to 5:59 AM | 0 (0.0%) | 16 (6.2%) |
| 6:00 AM to 6:29 AM | 54 (16.3%) | 40 (15.6%) |
| 6:30 AM to 6:59 AM | 59 (17.8%) | 37 (14.4%) |
| 7:00 AM to 7:29 AM | 60 (18.1%) | 76 (29.6%) |
| 7:30 AM to 7:59 AM | 15 (4.5%) | 31 (12.1%) |
| 8:00 AM to 8:29 AM | 41 (12.4%) | 0 (0.0%) |
| 8:30 AM to 8:59 AM | 2 (0.6%) | 10 (3.9%) |
| 9:00 AM to 9:59 AM | 3 (0.9%) | 0 (0.0%) |
| 10:00 AM to 10:59 AM | 0 (0.0%) | 5 (1.9%) |
| 11:00 AM to 11:59 AM | 0 (0.0%) | 0 (0.0%) |
| 12:00 PM to 3:59 PM | 7 (2.1%) | 10 (3.9%) |
| 4:00 PM to 11:59 PM | 22 (6.7%) | 0 (0.0%) |
| Total | 331 (100.0%) | 257 (100.0%) |
Housing Occupancy in Tylertown
Occupancy by Ownership in Tylertown
Of the total 623 dwellings in Tylertown, owner-occupied units account for 395 (63.4%), while renter-occupied units make up 228 (36.6%).
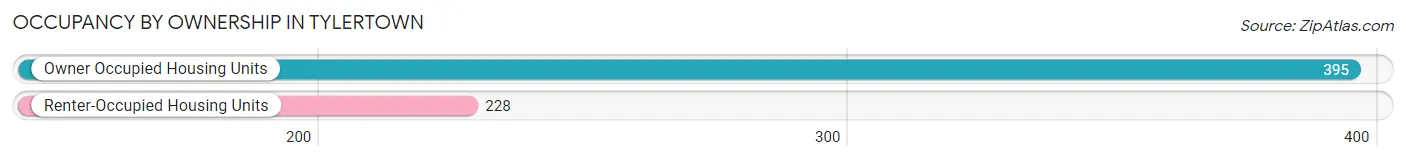
| Occupancy | # Housing Units | % Housing Units |
| Owner Occupied Housing Units | 395 | 63.4% |
| Renter-Occupied Housing Units | 228 | 36.6% |
| Total Occupied Housing Units | 623 | 100.0% |
Occupancy by Household Size in Tylertown
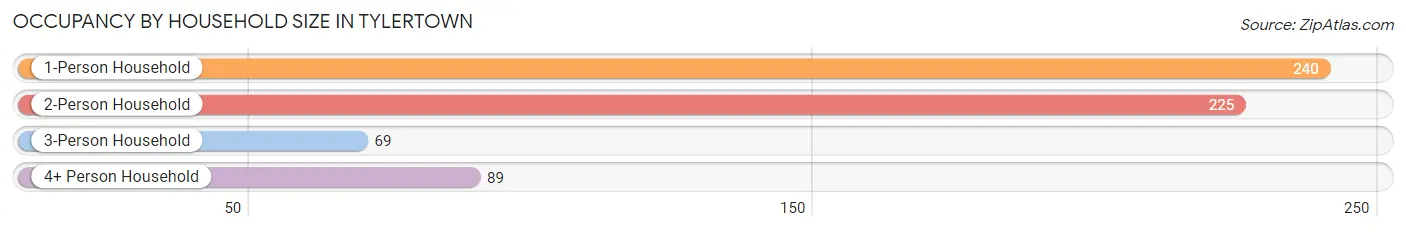
| Household Size | # Housing Units | % Housing Units |
| 1-Person Household | 240 | 38.5% |
| 2-Person Household | 225 | 36.1% |
| 3-Person Household | 69 | 11.1% |
| 4+ Person Household | 89 | 14.3% |
| Total Housing Units | 623 | 100.0% |
Occupancy by Ownership by Household Size in Tylertown
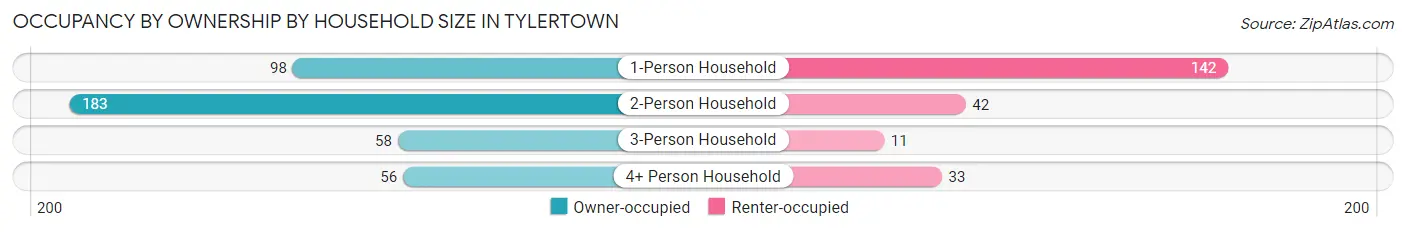
| Household Size | Owner-occupied | Renter-occupied |
| 1-Person Household | 98 (40.8%) | 142 (59.2%) |
| 2-Person Household | 183 (81.3%) | 42 (18.7%) |
| 3-Person Household | 58 (84.1%) | 11 (15.9%) |
| 4+ Person Household | 56 (62.9%) | 33 (37.1%) |
| Total Housing Units | 395 (63.4%) | 228 (36.6%) |
Occupancy by Educational Attainment in Tylertown
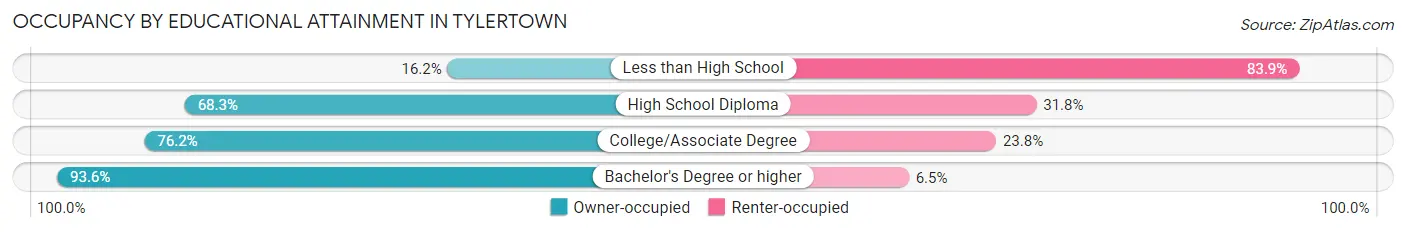
| Household Size | Owner-occupied | Renter-occupied |
| Less than High School | 26 (16.2%) | 135 (83.9%) |
| High School Diploma | 86 (68.2%) | 40 (31.8%) |
| College/Associate Degree | 138 (76.2%) | 43 (23.8%) |
| Bachelor's Degree or higher | 145 (93.5%) | 10 (6.5%) |
Occupancy by Age of Householder in Tylertown
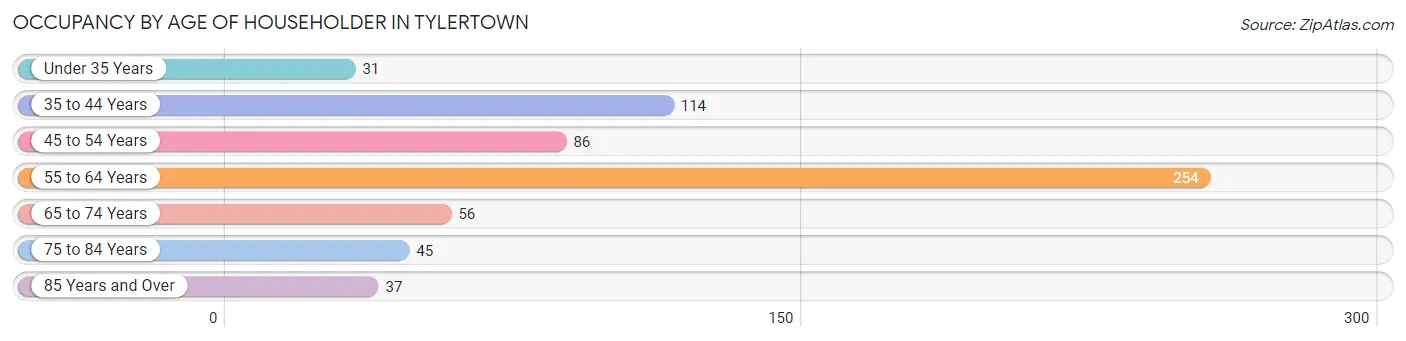
| Age Bracket | # Households | % Households |
| Under 35 Years | 31 | 5.0% |
| 35 to 44 Years | 114 | 18.3% |
| 45 to 54 Years | 86 | 13.8% |
| 55 to 64 Years | 254 | 40.8% |
| 65 to 74 Years | 56 | 9.0% |
| 75 to 84 Years | 45 | 7.2% |
| 85 Years and Over | 37 | 5.9% |
| Total | 623 | 100.0% |
Housing Finances in Tylertown
Median Income by Occupancy in Tylertown
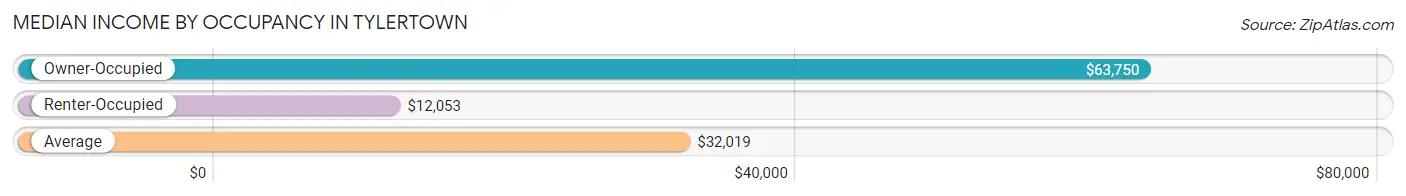
| Occupancy Type | # Households | Median Income |
| Owner-Occupied | 395 (63.4%) | $63,750 |
| Renter-Occupied | 228 (36.6%) | $12,053 |
| Average | 623 (100.0%) | $32,019 |
Occupancy by Householder Income Bracket in Tylertown
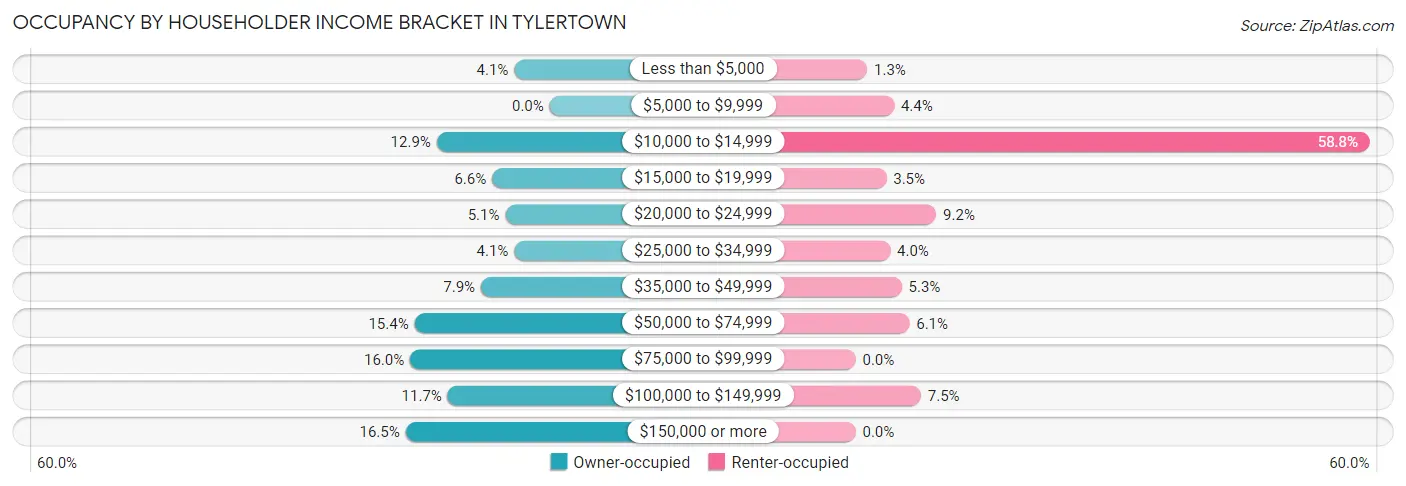
| Income Bracket | Owner-occupied | Renter-occupied |
| Less than $5,000 | 16 (4.1%) | 3 (1.3%) |
| $5,000 to $9,999 | 0 (0.0%) | 10 (4.4%) |
| $10,000 to $14,999 | 51 (12.9%) | 134 (58.8%) |
| $15,000 to $19,999 | 26 (6.6%) | 8 (3.5%) |
| $20,000 to $24,999 | 20 (5.1%) | 21 (9.2%) |
| $25,000 to $34,999 | 16 (4.1%) | 9 (4.0%) |
| $35,000 to $49,999 | 31 (7.9%) | 12 (5.3%) |
| $50,000 to $74,999 | 61 (15.4%) | 14 (6.1%) |
| $75,000 to $99,999 | 63 (16.0%) | 0 (0.0%) |
| $100,000 to $149,999 | 46 (11.7%) | 17 (7.5%) |
| $150,000 or more | 65 (16.5%) | 0 (0.0%) |
| Total | 395 (100.0%) | 228 (100.0%) |
Monthly Housing Cost Tiers in Tylertown
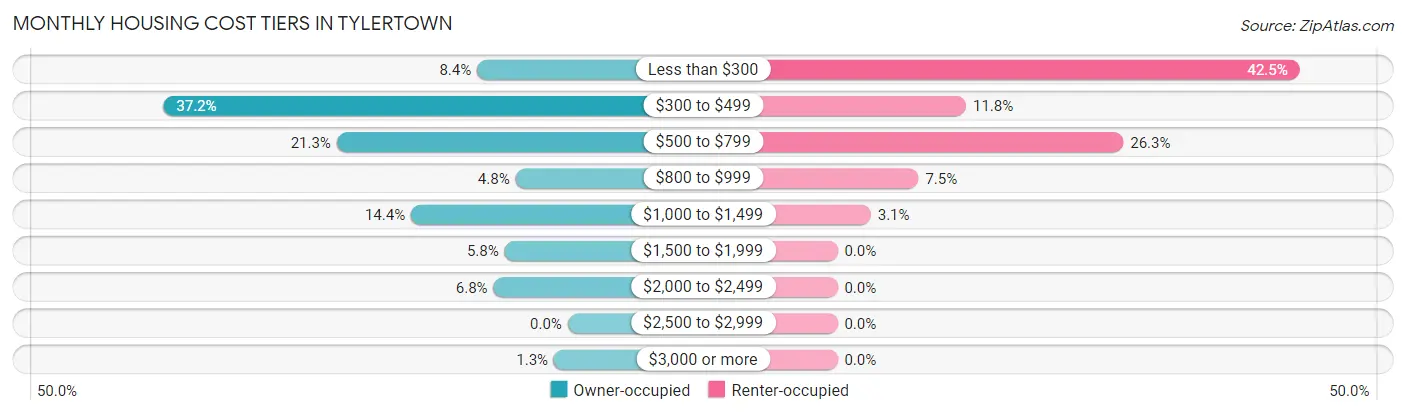
| Monthly Cost | Owner-occupied | Renter-occupied |
| Less than $300 | 33 (8.4%) | 97 (42.5%) |
| $300 to $499 | 147 (37.2%) | 27 (11.8%) |
| $500 to $799 | 84 (21.3%) | 60 (26.3%) |
| $800 to $999 | 19 (4.8%) | 17 (7.5%) |
| $1,000 to $1,499 | 57 (14.4%) | 7 (3.1%) |
| $1,500 to $1,999 | 23 (5.8%) | 0 (0.0%) |
| $2,000 to $2,499 | 27 (6.8%) | 0 (0.0%) |
| $2,500 to $2,999 | 0 (0.0%) | 0 (0.0%) |
| $3,000 or more | 5 (1.3%) | 0 (0.0%) |
| Total | 395 (100.0%) | 228 (100.0%) |
Physical Housing Characteristics in Tylertown
Housing Structures in Tylertown
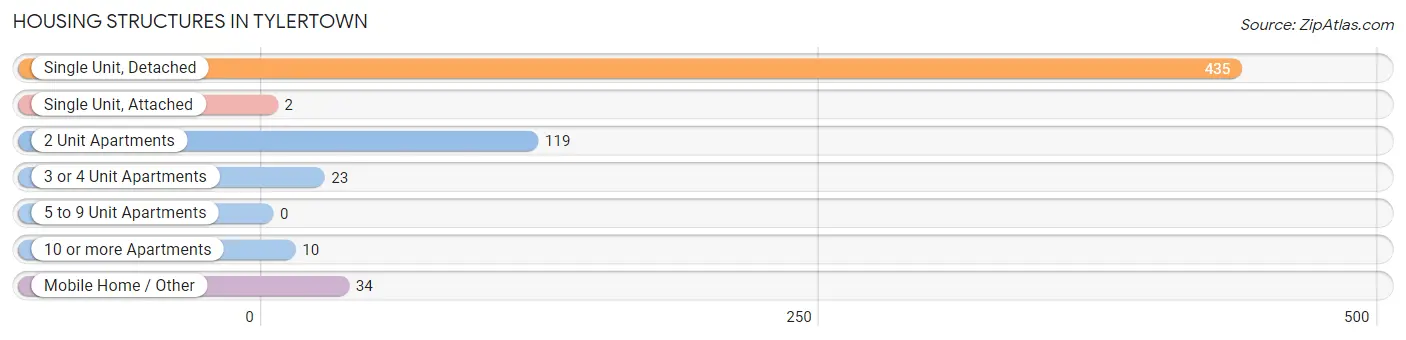
| Structure Type | # Housing Units | % Housing Units |
| Single Unit, Detached | 435 | 69.8% |
| Single Unit, Attached | 2 | 0.3% |
| 2 Unit Apartments | 119 | 19.1% |
| 3 or 4 Unit Apartments | 23 | 3.7% |
| 5 to 9 Unit Apartments | 0 | 0.0% |
| 10 or more Apartments | 10 | 1.6% |
| Mobile Home / Other | 34 | 5.5% |
| Total | 623 | 100.0% |
Housing Structures by Occupancy in Tylertown
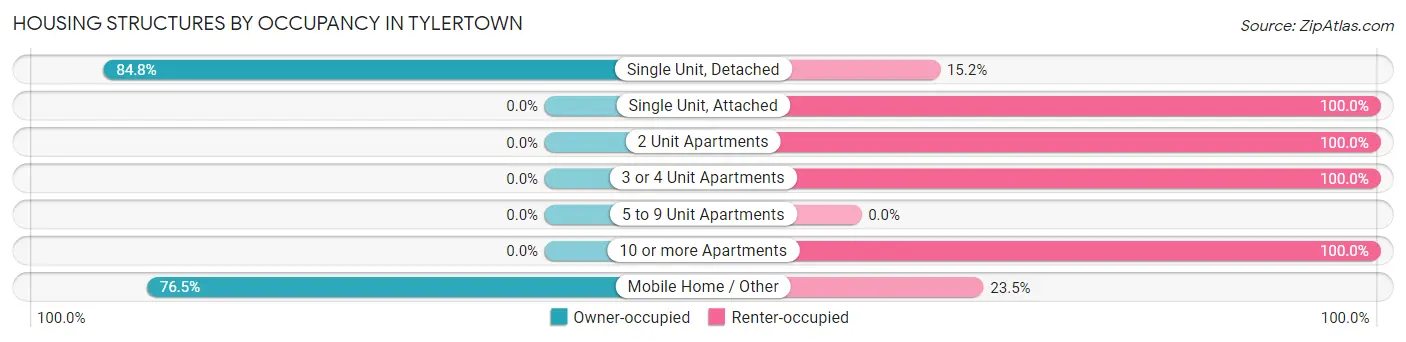
| Structure Type | Owner-occupied | Renter-occupied |
| Single Unit, Detached | 369 (84.8%) | 66 (15.2%) |
| Single Unit, Attached | 0 (0.0%) | 2 (100.0%) |
| 2 Unit Apartments | 0 (0.0%) | 119 (100.0%) |
| 3 or 4 Unit Apartments | 0 (0.0%) | 23 (100.0%) |
| 5 to 9 Unit Apartments | 0 (0.0%) | 0 (0.0%) |
| 10 or more Apartments | 0 (0.0%) | 10 (100.0%) |
| Mobile Home / Other | 26 (76.5%) | 8 (23.5%) |
| Total | 395 (63.4%) | 228 (36.6%) |
Housing Structures by Number of Rooms in Tylertown
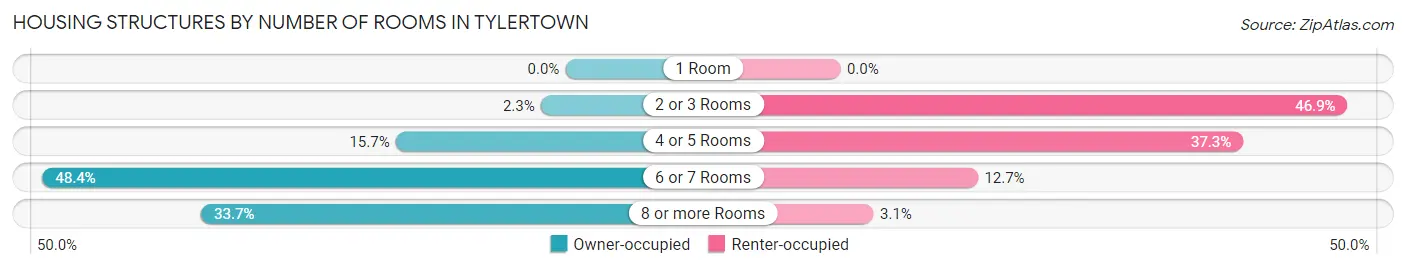
| Number of Rooms | Owner-occupied | Renter-occupied |
| 1 Room | 0 (0.0%) | 0 (0.0%) |
| 2 or 3 Rooms | 9 (2.3%) | 107 (46.9%) |
| 4 or 5 Rooms | 62 (15.7%) | 85 (37.3%) |
| 6 or 7 Rooms | 191 (48.3%) | 29 (12.7%) |
| 8 or more Rooms | 133 (33.7%) | 7 (3.1%) |
| Total | 395 (100.0%) | 228 (100.0%) |
Housing Structure by Heating Type in Tylertown
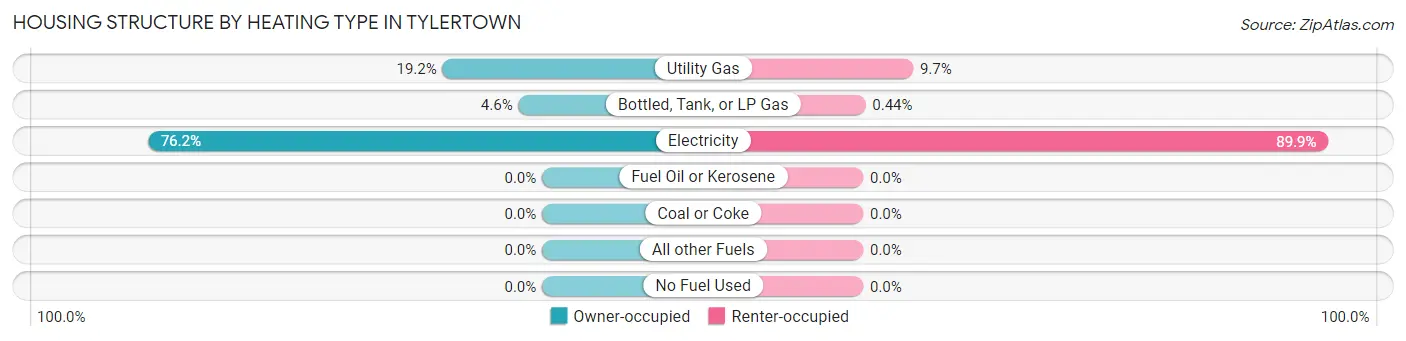
| Heating Type | Owner-occupied | Renter-occupied |
| Utility Gas | 76 (19.2%) | 22 (9.7%) |
| Bottled, Tank, or LP Gas | 18 (4.6%) | 1 (0.4%) |
| Electricity | 301 (76.2%) | 205 (89.9%) |
| Fuel Oil or Kerosene | 0 (0.0%) | 0 (0.0%) |
| Coal or Coke | 0 (0.0%) | 0 (0.0%) |
| All other Fuels | 0 (0.0%) | 0 (0.0%) |
| No Fuel Used | 0 (0.0%) | 0 (0.0%) |
| Total | 395 (100.0%) | 228 (100.0%) |
Household Vehicle Usage in Tylertown
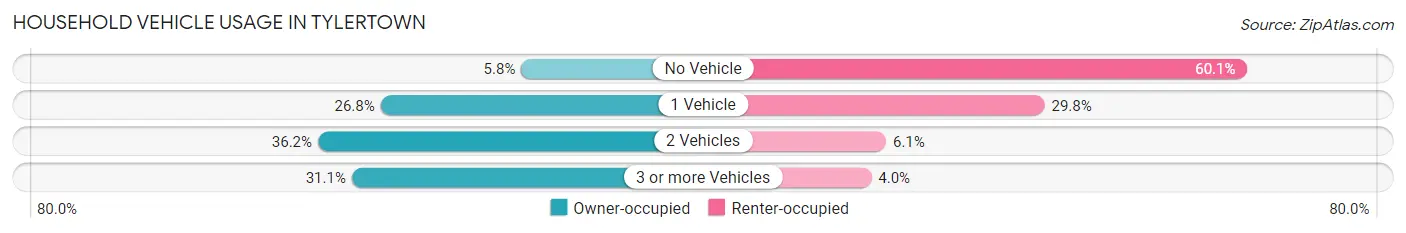
| Vehicles per Household | Owner-occupied | Renter-occupied |
| No Vehicle | 23 (5.8%) | 137 (60.1%) |
| 1 Vehicle | 106 (26.8%) | 68 (29.8%) |
| 2 Vehicles | 143 (36.2%) | 14 (6.1%) |
| 3 or more Vehicles | 123 (31.1%) | 9 (4.0%) |
| Total | 395 (100.0%) | 228 (100.0%) |
Real Estate & Mortgages in Tylertown
Real Estate and Mortgage Overview in Tylertown
| Characteristic | Without Mortgage | With Mortgage |
| Housing Units | 236 | 159 |
| Median Property Value | $108,700 | $152,200 |
| Median Household Income | $44,773 | $45 |
| Monthly Housing Costs | $428 | $5 |
| Real Estate Taxes | $966 | $10 |
Property Value by Mortgage Status in Tylertown
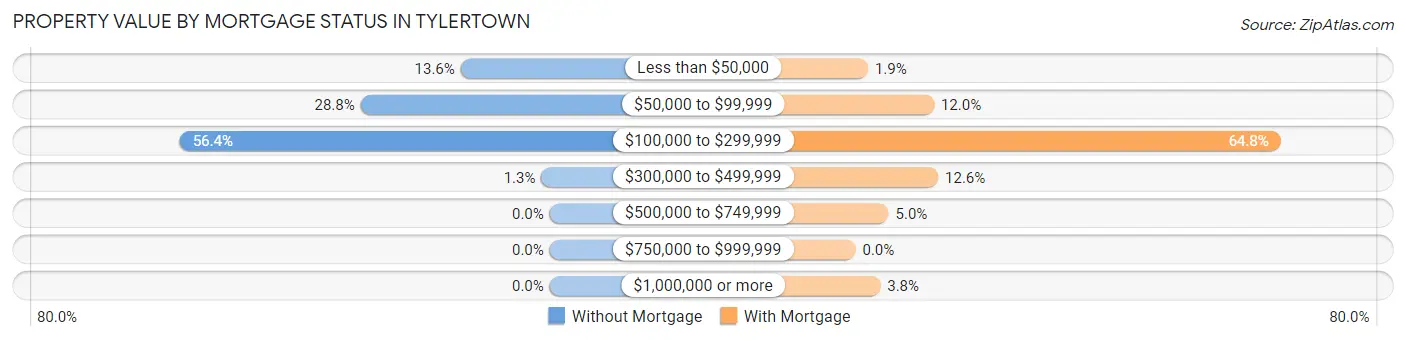
| Property Value | Without Mortgage | With Mortgage |
| Less than $50,000 | 32 (13.6%) | 3 (1.9%) |
| $50,000 to $99,999 | 68 (28.8%) | 19 (11.9%) |
| $100,000 to $299,999 | 133 (56.4%) | 103 (64.8%) |
| $300,000 to $499,999 | 3 (1.3%) | 20 (12.6%) |
| $500,000 to $749,999 | 0 (0.0%) | 8 (5.0%) |
| $750,000 to $999,999 | 0 (0.0%) | 0 (0.0%) |
| $1,000,000 or more | 0 (0.0%) | 6 (3.8%) |
| Total | 236 (100.0%) | 159 (100.0%) |
Household Income by Mortgage Status in Tylertown
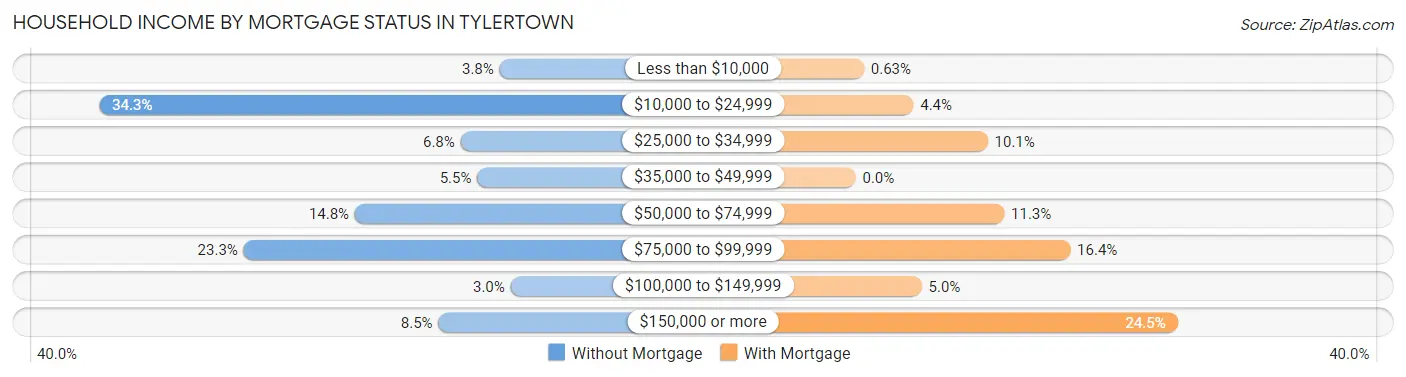
| Household Income | Without Mortgage | With Mortgage |
| Less than $10,000 | 9 (3.8%) | 1 (0.6%) |
| $10,000 to $24,999 | 81 (34.3%) | 7 (4.4%) |
| $25,000 to $34,999 | 16 (6.8%) | 16 (10.1%) |
| $35,000 to $49,999 | 13 (5.5%) | 0 (0.0%) |
| $50,000 to $74,999 | 35 (14.8%) | 18 (11.3%) |
| $75,000 to $99,999 | 55 (23.3%) | 26 (16.4%) |
| $100,000 to $149,999 | 7 (3.0%) | 8 (5.0%) |
| $150,000 or more | 20 (8.5%) | 39 (24.5%) |
| Total | 236 (100.0%) | 159 (100.0%) |
Property Value to Household Income Ratio in Tylertown
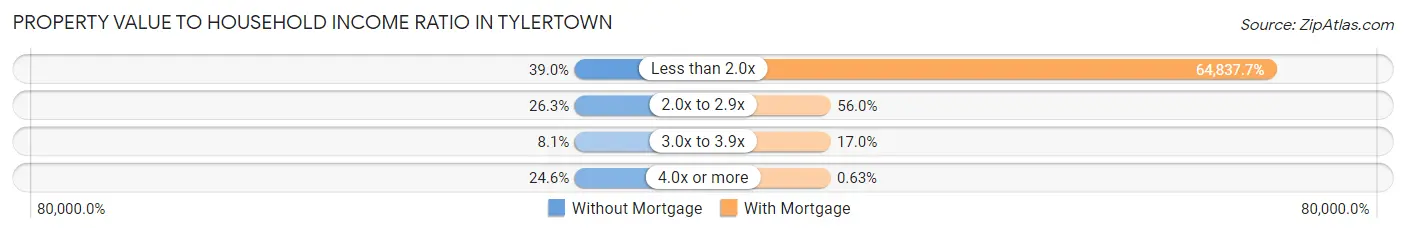
| Value-to-Income Ratio | Without Mortgage | With Mortgage |
| Less than 2.0x | 92 (39.0%) | 103,092 (64,837.7%) |
| 2.0x to 2.9x | 62 (26.3%) | 89 (56.0%) |
| 3.0x to 3.9x | 19 (8.1%) | 27 (17.0%) |
| 4.0x or more | 58 (24.6%) | 1 (0.6%) |
| Total | 236 (100.0%) | 159 (100.0%) |
Real Estate Taxes by Mortgage Status in Tylertown
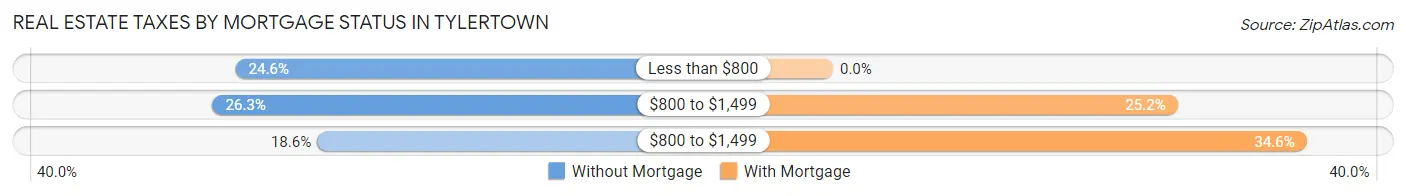
| Property Taxes | Without Mortgage | With Mortgage |
| Less than $800 | 58 (24.6%) | 0 (0.0%) |
| $800 to $1,499 | 62 (26.3%) | 40 (25.2%) |
| $800 to $1,499 | 44 (18.6%) | 55 (34.6%) |
| Total | 236 (100.0%) | 159 (100.0%) |
Health & Disability in Tylertown
Health Insurance Coverage by Age in Tylertown
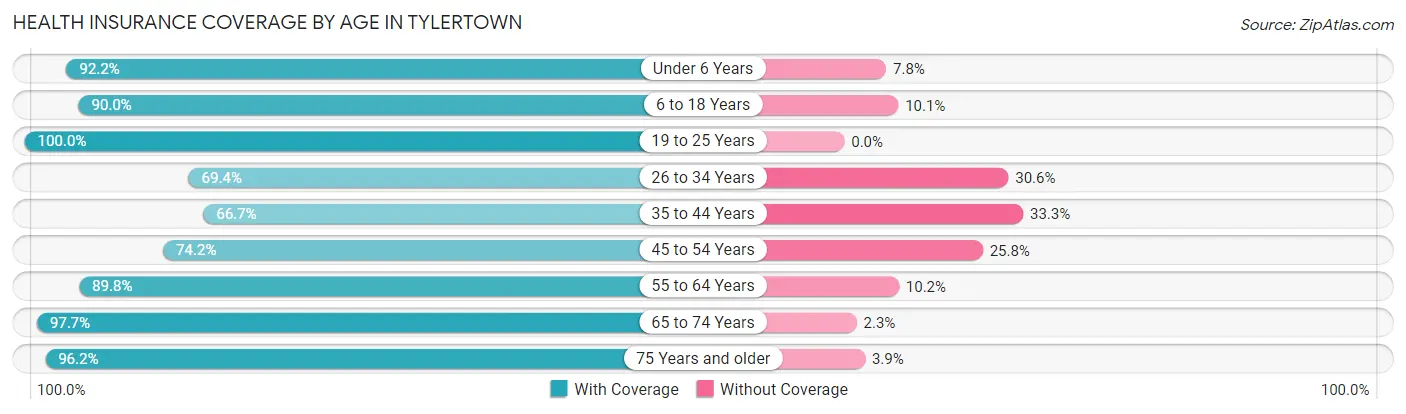
| Age Bracket | With Coverage | Without Coverage |
| Under 6 Years | 130 (92.2%) | 11 (7.8%) |
| 6 to 18 Years | 555 (89.9%) | 62 (10.1%) |
| 19 to 25 Years | 204 (100.0%) | 0 (0.0%) |
| 26 to 34 Years | 152 (69.4%) | 67 (30.6%) |
| 35 to 44 Years | 142 (66.7%) | 71 (33.3%) |
| 45 to 54 Years | 115 (74.2%) | 40 (25.8%) |
| 55 to 64 Years | 309 (89.8%) | 35 (10.2%) |
| 65 to 74 Years | 128 (97.7%) | 3 (2.3%) |
| 75 Years and older | 150 (96.2%) | 6 (3.8%) |
| Total | 1,885 (86.5%) | 295 (13.5%) |
Health Insurance Coverage by Citizenship Status in Tylertown
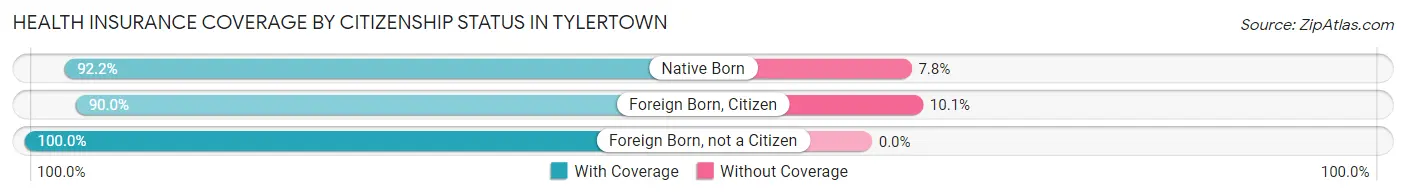
| Citizenship Status | With Coverage | Without Coverage |
| Native Born | 130 (92.2%) | 11 (7.8%) |
| Foreign Born, Citizen | 555 (89.9%) | 62 (10.1%) |
| Foreign Born, not a Citizen | 204 (100.0%) | 0 (0.0%) |
Health Insurance Coverage by Household Income in Tylertown
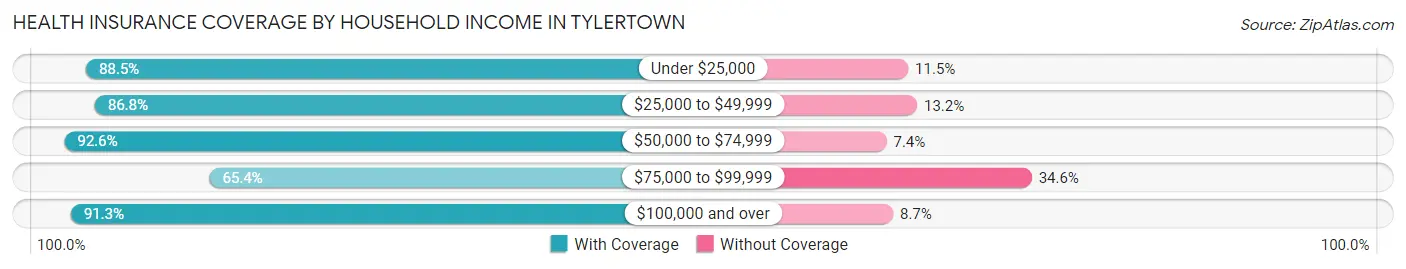
| Household Income | With Coverage | Without Coverage |
| Under $25,000 | 708 (88.5%) | 92 (11.5%) |
| $25,000 to $49,999 | 264 (86.8%) | 40 (13.2%) |
| $50,000 to $74,999 | 224 (92.6%) | 18 (7.4%) |
| $75,000 to $99,999 | 183 (65.4%) | 97 (34.6%) |
| $100,000 and over | 506 (91.3%) | 48 (8.7%) |
Public vs Private Health Insurance Coverage by Age in Tylertown
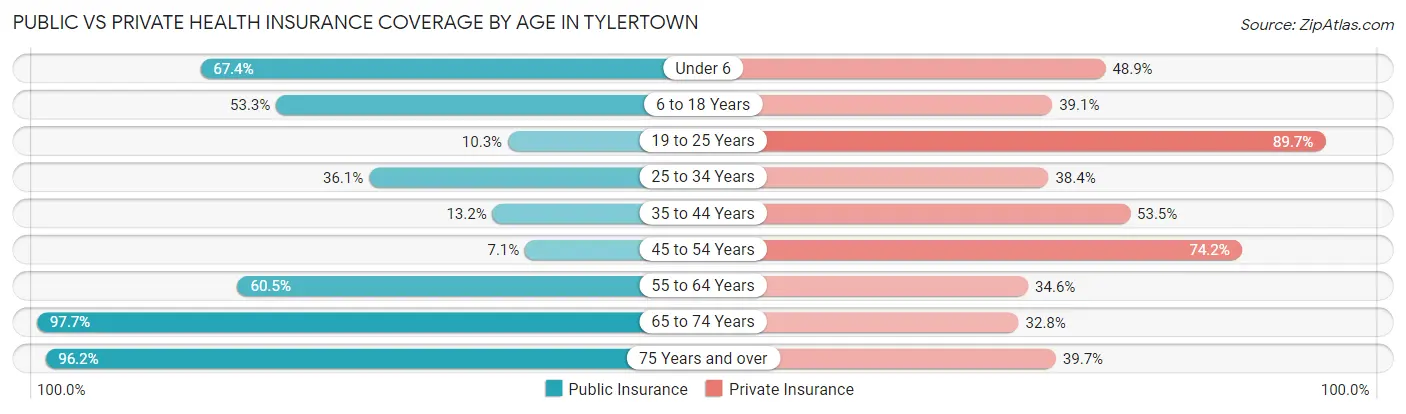
| Age Bracket | Public Insurance | Private Insurance |
| Under 6 | 95 (67.4%) | 69 (48.9%) |
| 6 to 18 Years | 329 (53.3%) | 241 (39.1%) |
| 19 to 25 Years | 21 (10.3%) | 183 (89.7%) |
| 25 to 34 Years | 79 (36.1%) | 84 (38.4%) |
| 35 to 44 Years | 28 (13.2%) | 114 (53.5%) |
| 45 to 54 Years | 11 (7.1%) | 115 (74.2%) |
| 55 to 64 Years | 208 (60.5%) | 119 (34.6%) |
| 65 to 74 Years | 128 (97.7%) | 43 (32.8%) |
| 75 Years and over | 150 (96.2%) | 62 (39.7%) |
| Total | 1,049 (48.1%) | 1,030 (47.2%) |
Disability Status by Sex by Age in Tylertown
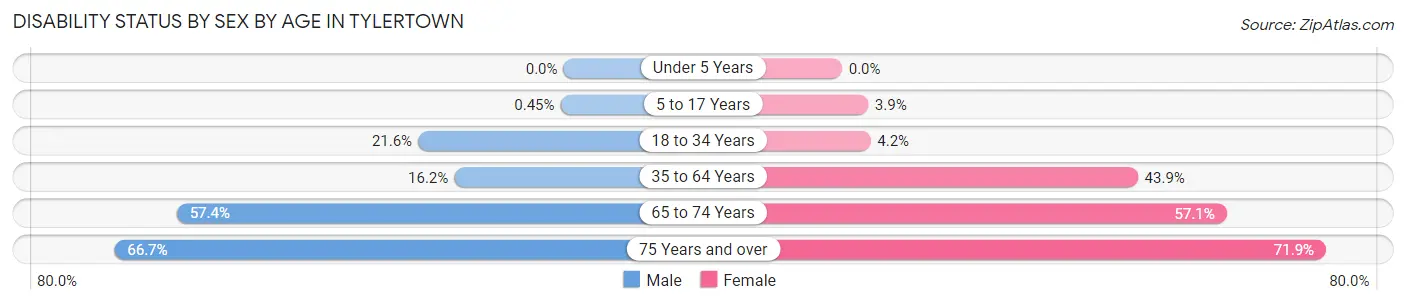
| Age Bracket | Male | Female |
| Under 5 Years | 0 (0.0%) | 0 (0.0%) |
| 5 to 17 Years | 1 (0.4%) | 14 (3.9%) |
| 18 to 34 Years | 57 (21.6%) | 10 (4.2%) |
| 35 to 64 Years | 42 (16.2%) | 199 (43.9%) |
| 65 to 74 Years | 31 (57.4%) | 44 (57.1%) |
| 75 Years and over | 40 (66.7%) | 69 (71.9%) |
Disability Class by Sex by Age in Tylertown
Disability Class: Hearing Difficulty
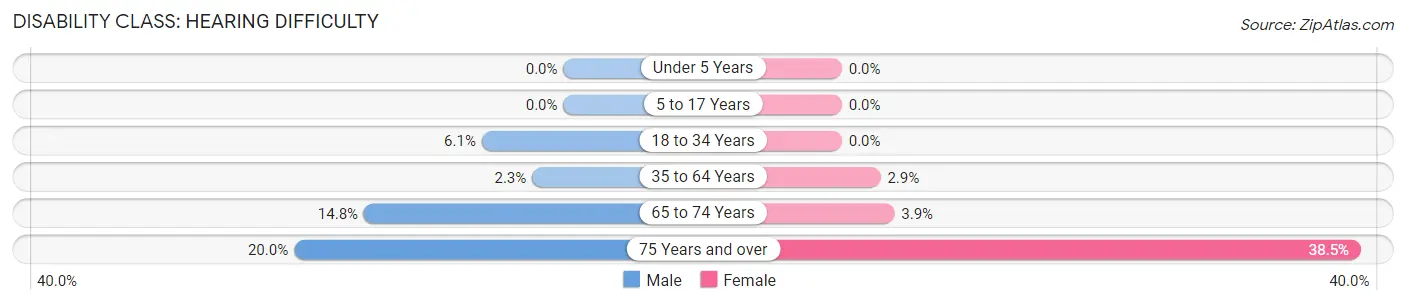
| Age Bracket | Male | Female |
| Under 5 Years | 0 (0.0%) | 0 (0.0%) |
| 5 to 17 Years | 0 (0.0%) | 0 (0.0%) |
| 18 to 34 Years | 16 (6.1%) | 0 (0.0%) |
| 35 to 64 Years | 6 (2.3%) | 13 (2.9%) |
| 65 to 74 Years | 8 (14.8%) | 3 (3.9%) |
| 75 Years and over | 12 (20.0%) | 37 (38.5%) |
Disability Class: Vision Difficulty
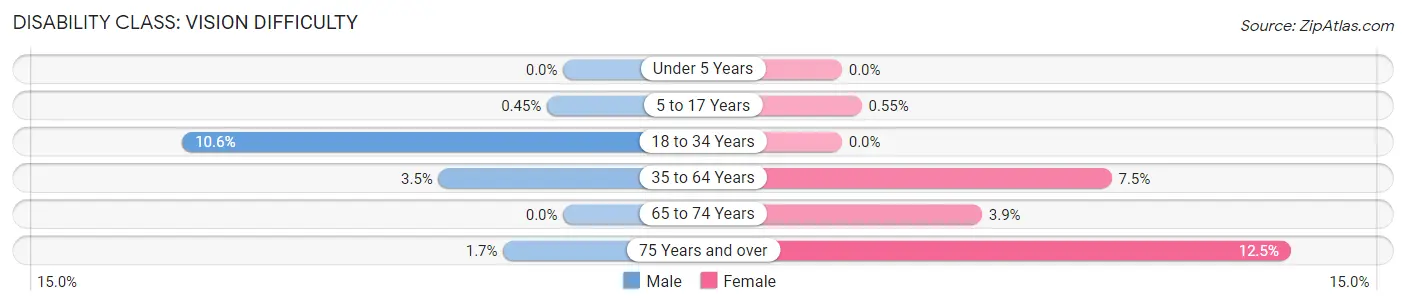
| Age Bracket | Male | Female |
| Under 5 Years | 0 (0.0%) | 0 (0.0%) |
| 5 to 17 Years | 1 (0.4%) | 2 (0.5%) |
| 18 to 34 Years | 28 (10.6%) | 0 (0.0%) |
| 35 to 64 Years | 9 (3.5%) | 34 (7.5%) |
| 65 to 74 Years | 0 (0.0%) | 3 (3.9%) |
| 75 Years and over | 1 (1.7%) | 12 (12.5%) |
Disability Class: Cognitive Difficulty
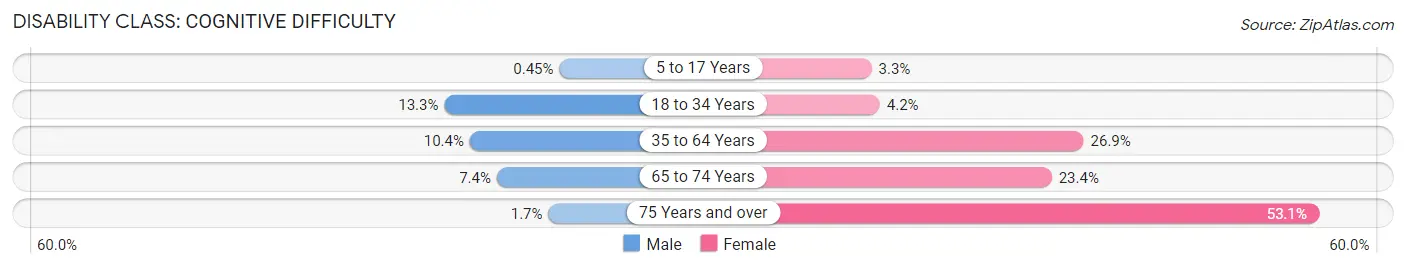
| Age Bracket | Male | Female |
| 5 to 17 Years | 1 (0.4%) | 12 (3.3%) |
| 18 to 34 Years | 35 (13.3%) | 10 (4.2%) |
| 35 to 64 Years | 27 (10.4%) | 122 (26.9%) |
| 65 to 74 Years | 4 (7.4%) | 18 (23.4%) |
| 75 Years and over | 1 (1.7%) | 51 (53.1%) |
Disability Class: Ambulatory Difficulty
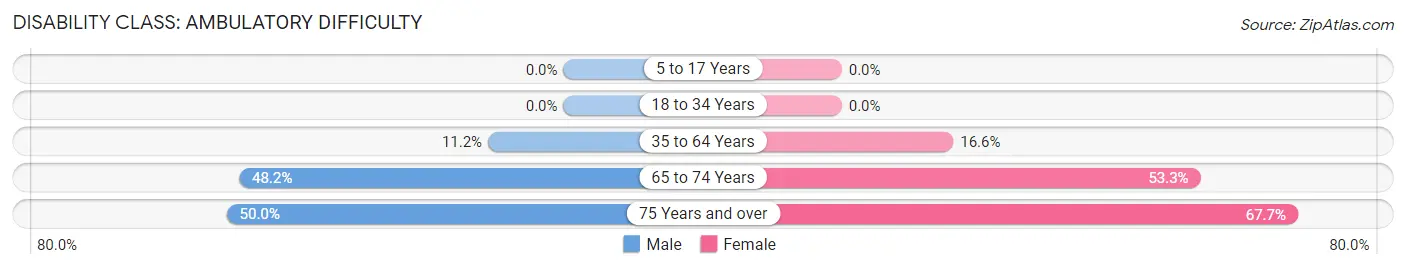
| Age Bracket | Male | Female |
| 5 to 17 Years | 0 (0.0%) | 0 (0.0%) |
| 18 to 34 Years | 0 (0.0%) | 0 (0.0%) |
| 35 to 64 Years | 29 (11.2%) | 75 (16.6%) |
| 65 to 74 Years | 26 (48.1%) | 41 (53.2%) |
| 75 Years and over | 30 (50.0%) | 65 (67.7%) |
Disability Class: Self-Care Difficulty
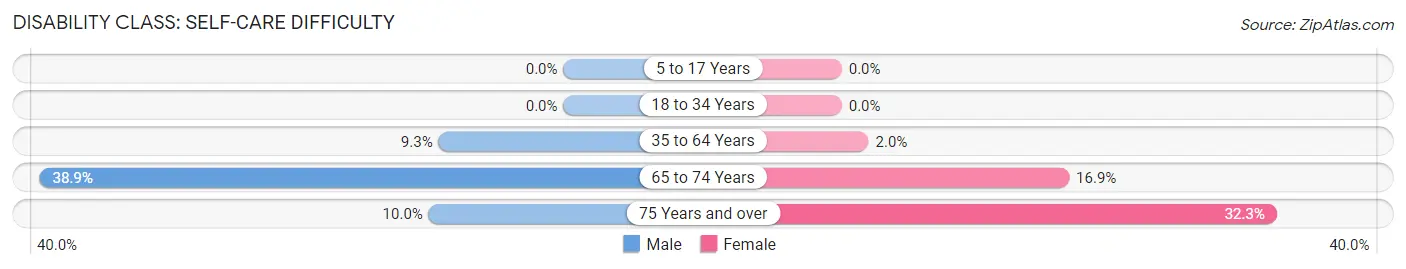
| Age Bracket | Male | Female |
| 5 to 17 Years | 0 (0.0%) | 0 (0.0%) |
| 18 to 34 Years | 0 (0.0%) | 0 (0.0%) |
| 35 to 64 Years | 24 (9.3%) | 9 (2.0%) |
| 65 to 74 Years | 21 (38.9%) | 13 (16.9%) |
| 75 Years and over | 6 (10.0%) | 31 (32.3%) |
Technology Access in Tylertown
Computing Device Access in Tylertown
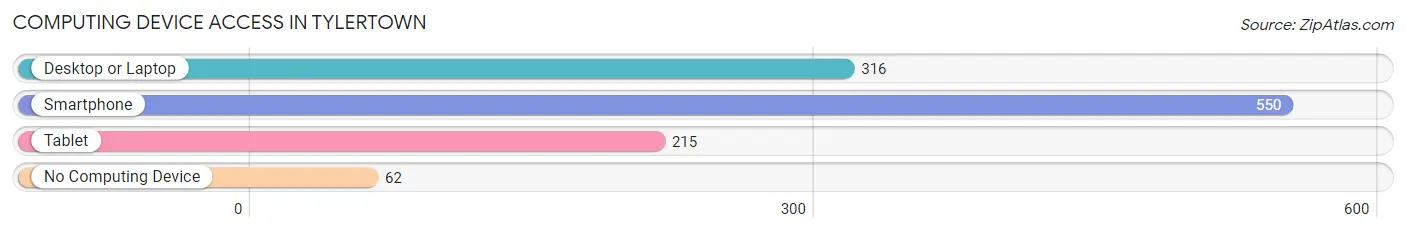
| Device Type | # Households | % Households |
| Desktop or Laptop | 316 | 50.7% |
| Smartphone | 550 | 88.3% |
| Tablet | 215 | 34.5% |
| No Computing Device | 62 | 10.0% |
| Total | 623 | 100.0% |
Internet Access in Tylertown
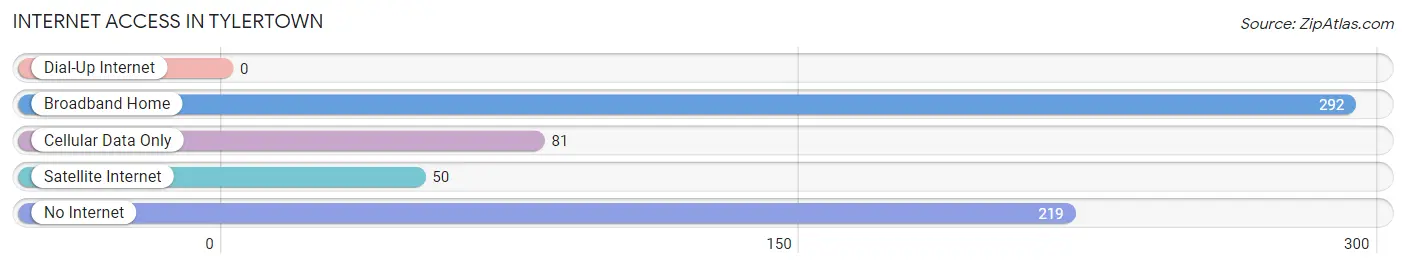
| Internet Type | # Households | % Households |
| Dial-Up Internet | 0 | 0.0% |
| Broadband Home | 292 | 46.9% |
| Cellular Data Only | 81 | 13.0% |
| Satellite Internet | 50 | 8.0% |
| No Internet | 219 | 35.1% |
| Total | 623 | 100.0% |
Tylertown Summary
Tylertown is a small town located in Walthall County, Mississippi. It is situated in the southwestern part of the state, approximately 50 miles north of the Gulf of Mexico. The town was founded in 1854 and named after William Tyler, a prominent local landowner. As of the 2010 census, the population of Tylertown was 1,845.
History
Tylertown was founded in 1854 by William Tyler, a prominent local landowner. Tyler had purchased the land from the Choctaw Indians in 1848 and named the town after himself. The town was incorporated in 1858 and quickly became a thriving agricultural center. Cotton was the primary crop grown in the area, and the town was home to several cotton gins and warehouses.
In the late 19th century, Tylertown was a major stop on the Mobile and Ohio Railroad. The railroad brought new economic opportunities to the town, and it soon became a hub for commerce and industry. The town was also home to several sawmills, gristmills, and other businesses.
Geography
Tylertown is located in southwestern Mississippi, approximately 50 miles north of the Gulf of Mexico. The town is situated in Walthall County, which is bordered by the Pearl River to the east and the Bogue Chitto River to the west. The town is located at the intersection of U.S. Highway 98 and Mississippi Highway 24.
The town has a total area of 2.2 square miles, all of which is land. The terrain is mostly flat, with some rolling hills in the surrounding area. The climate is humid subtropical, with hot, humid summers and mild winters.
Economy
Tylertown’s economy is largely based on agriculture. Cotton is the primary crop grown in the area, and the town is home to several cotton gins and warehouses. Other crops grown in the area include corn, soybeans, and wheat.
The town is also home to several small businesses, including restaurants, retail stores, and service providers. The town is also home to a few manufacturing companies, including a furniture factory and a woodworking plant.
Demographics
As of the 2010 census, the population of Tylertown was 1,845. The racial makeup of the town was 79.3% White, 18.3% African American, 0.7% Native American, 0.2% Asian, 0.1% Pacific Islander, and 1.4% from other races. Hispanic or Latino of any race were 1.7% of the population.
The median household income in Tylertown was $30,938, and the median family income was $37,813. The per capita income was $15,945. About 22.3% of the population was below the poverty line.
Conclusion
Tylertown is a small town located in Walthall County, Mississippi. It was founded in 1854 and named after William Tyler, a prominent local landowner. The town’s economy is largely based on agriculture, and it is home to several small businesses. As of the 2010 census, the population of Tylertown was 1,845. The town has a humid subtropical climate and is situated at the intersection of U.S. Highway 98 and Mississippi Highway 24.
Common Questions
What is Per Capita Income in Tylertown?
Per Capita income in Tylertown is $18,792.
What is the Median Family Income in Tylertown?
Median Family Income in Tylertown is $64,125.
What is the Median Household income in Tylertown?
Median Household Income in Tylertown is $32,019.
What is Income or Wage Gap in Tylertown?
Income or Wage Gap in Tylertown is 27.4%.
Women in Tylertown earn 72.6 cents for every dollar earned by a man.
What is Inequality or Gini Index in Tylertown?
Inequality or Gini Index in Tylertown is 0.53.
What is the Total Population of Tylertown?
Total Population of Tylertown is 2,341.
What is the Total Male Population of Tylertown?
Total Male Population of Tylertown is 945.
What is the Total Female Population of Tylertown?
Total Female Population of Tylertown is 1,396.
What is the Ratio of Males per 100 Females in Tylertown?
There are 67.69 Males per 100 Females in Tylertown.
What is the Ratio of Females per 100 Males in Tylertown?
There are 147.72 Females per 100 Males in Tylertown.
What is the Median Population Age in Tylertown?
Median Population Age in Tylertown is 33.9 Years.
What is the Average Family Size in Tylertown
Average Family Size in Tylertown is 5.0 People.
What is the Average Household Size in Tylertown
Average Household Size in Tylertown is 3.5 People.
How Large is the Labor Force in Tylertown?
There are 788 People in the Labor Forcein in Tylertown.
What is the Percentage of People in the Labor Force in Tylertown?
46.8% of People are in the Labor Force in Tylertown.
What is the Unemployment Rate in Tylertown?
Unemployment Rate in Tylertown is 16.6%.