Toomsuba, MS Map & Demographics
Toomsuba Map
Toomsuba Overview
$34,572
PER CAPITA INCOME
$67,604
AVG FAMILY INCOME
$54,543
AVG HOUSEHOLD INCOME
19.6%
WAGE / INCOME GAP [ % ]
80.4¢/ $1
WAGE / INCOME GAP [ $ ]
0.45
INEQUALITY / GINI INDEX
728
TOTAL POPULATION
326
MALE POPULATION
402
FEMALE POPULATION
81.09
MALES / 100 FEMALES
123.31
FEMALES / 100 MALES
48.2
MEDIAN AGE
2.4
AVG FAMILY SIZE
1.8
AVG HOUSEHOLD SIZE
316
LABOR FORCE [ PEOPLE ]
50.0%
PERCENT IN LABOR FORCE
26.6%
UNEMPLOYMENT RATE
Toomsuba Zip Codes
Toomsuba Area Codes
Income in Toomsuba
Income Overview in Toomsuba
Per Capita Income in Toomsuba is $34,572, while median incomes of families and households are $67,604 and $54,543 respectively.
| Characteristic | Number | Measure |
| Per Capita Income | 728 | $34,572 |
| Median Family Income | 203 | $67,604 |
| Mean Family Income | 203 | $59,096 |
| Median Household Income | 403 | $54,543 |
| Mean Household Income | 403 | $65,529 |
| Income Deficit | 203 | $0 |
| Wage / Income Gap (%) | 728 | 19.64% |
| Wage / Income Gap ($) | 728 | 80.36¢ per $1 |
| Gini / Inequality Index | 728 | 0.45 |
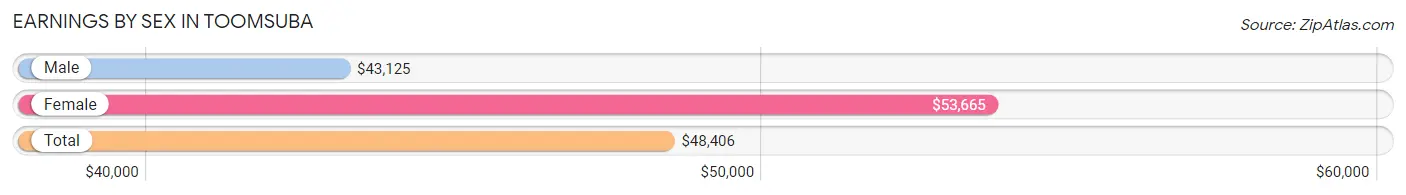
Earnings by Sex in Toomsuba
Average Earnings in Toomsuba are $48,406, $43,125 for men and $53,665 for women, a difference of 19.6%.
| Sex | Number | Average Earnings |
| Male | 178 (72.7%) | $43,125 |
| Female | 67 (27.4%) | $53,665 |
| Total | 245 (100.0%) | $48,406 |
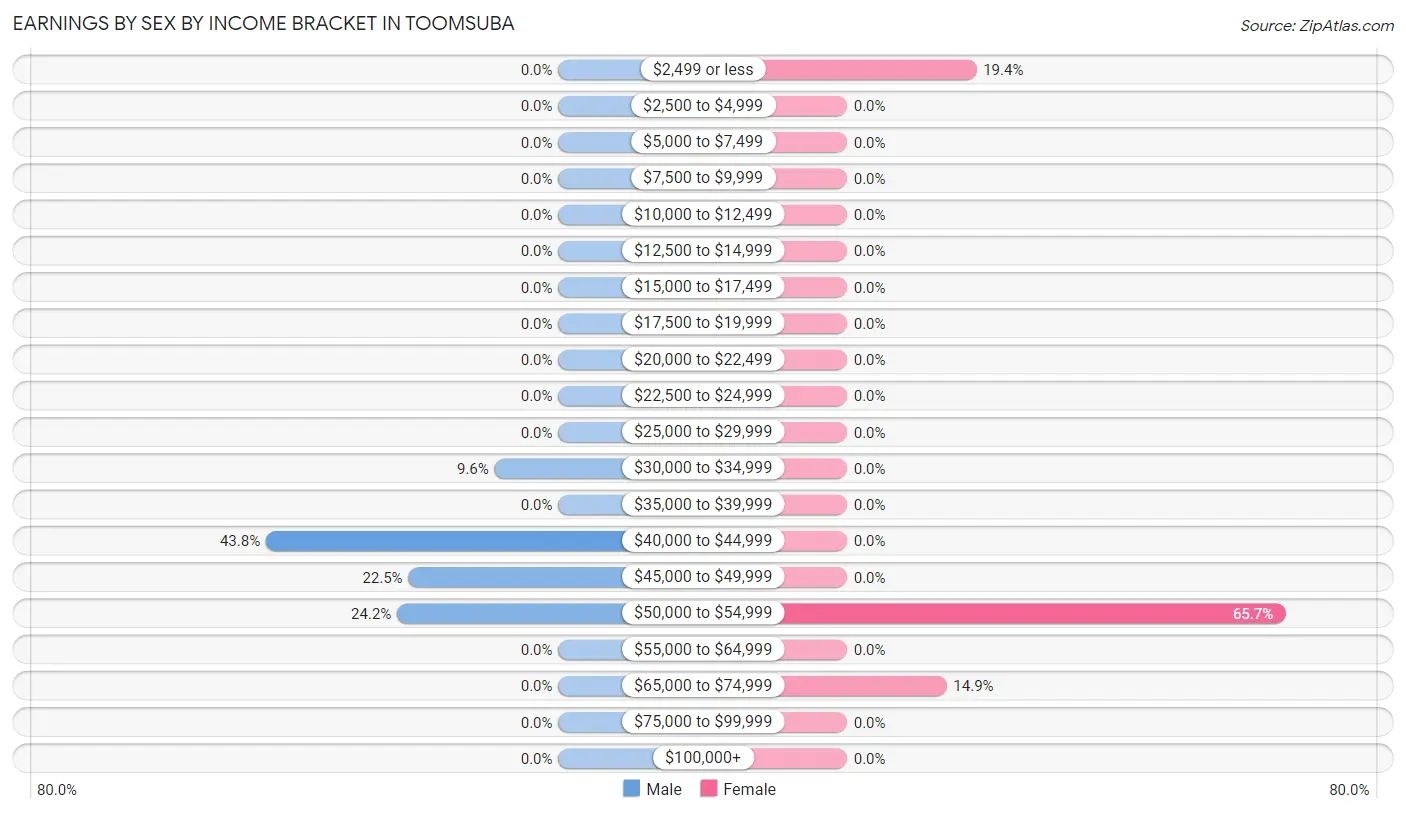
Earnings by Sex by Income Bracket in Toomsuba
The most common earnings brackets in Toomsuba are $40,000 to $44,999 for men (78 | 43.8%) and $50,000 to $54,999 for women (44 | 65.7%).
| Income | Male | Female |
| $2,499 or less | 0 (0.0%) | 13 (19.4%) |
| $2,500 to $4,999 | 0 (0.0%) | 0 (0.0%) |
| $5,000 to $7,499 | 0 (0.0%) | 0 (0.0%) |
| $7,500 to $9,999 | 0 (0.0%) | 0 (0.0%) |
| $10,000 to $12,499 | 0 (0.0%) | 0 (0.0%) |
| $12,500 to $14,999 | 0 (0.0%) | 0 (0.0%) |
| $15,000 to $17,499 | 0 (0.0%) | 0 (0.0%) |
| $17,500 to $19,999 | 0 (0.0%) | 0 (0.0%) |
| $20,000 to $22,499 | 0 (0.0%) | 0 (0.0%) |
| $22,500 to $24,999 | 0 (0.0%) | 0 (0.0%) |
| $25,000 to $29,999 | 0 (0.0%) | 0 (0.0%) |
| $30,000 to $34,999 | 17 (9.6%) | 0 (0.0%) |
| $35,000 to $39,999 | 0 (0.0%) | 0 (0.0%) |
| $40,000 to $44,999 | 78 (43.8%) | 0 (0.0%) |
| $45,000 to $49,999 | 40 (22.5%) | 0 (0.0%) |
| $50,000 to $54,999 | 43 (24.2%) | 44 (65.7%) |
| $55,000 to $64,999 | 0 (0.0%) | 0 (0.0%) |
| $65,000 to $74,999 | 0 (0.0%) | 10 (14.9%) |
| $75,000 to $99,999 | 0 (0.0%) | 0 (0.0%) |
| $100,000+ | 0 (0.0%) | 0 (0.0%) |
| Total | 178 (100.0%) | 67 (100.0%) |
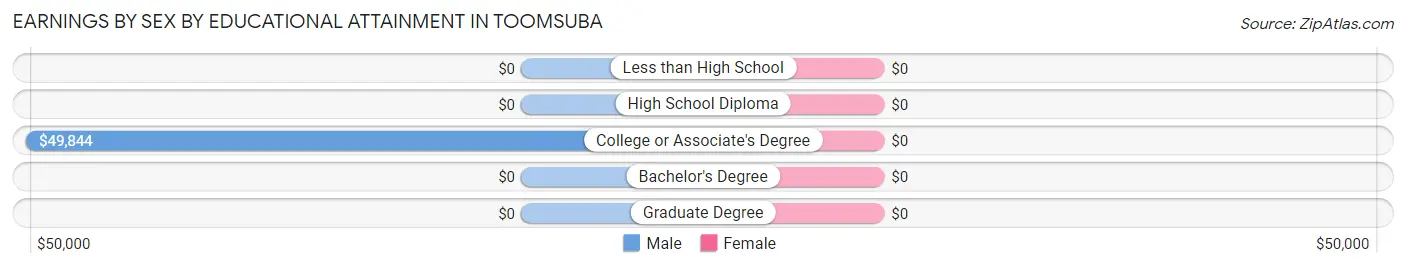
Earnings by Sex by Educational Attainment in Toomsuba
| Educational Attainment | Male Income | Female Income |
| Less than High School | - | - |
| High School Diploma | - | - |
| College or Associate's Degree | $49,844 | $0 |
| Bachelor's Degree | - | - |
| Graduate Degree | - | - |
| Total | $49,313 | $53,665 |
Family Income in Toomsuba
Family Income Brackets in Toomsuba
According to the Toomsuba family income data, there are 157 families falling into the $50,000 to $74,999 income range, which is the most common income bracket and makes up 77.3% of all families.
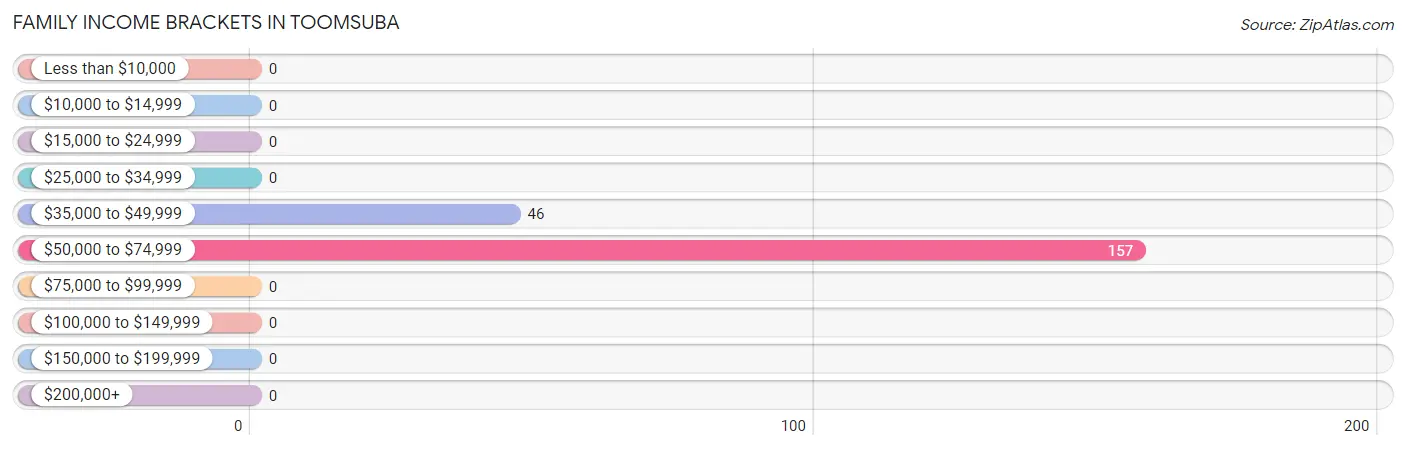
| Income Bracket | # Families | % Families |
| Less than $10,000 | 0 | 0.0% |
| $10,000 to $14,999 | 0 | 0.0% |
| $15,000 to $24,999 | 0 | 0.0% |
| $25,000 to $34,999 | 0 | 0.0% |
| $35,000 to $49,999 | 46 | 22.7% |
| $50,000 to $74,999 | 157 | 77.3% |
| $75,000 to $99,999 | 0 | 0.0% |
| $100,000 to $149,999 | 0 | 0.0% |
| $150,000 to $199,999 | 0 | 0.0% |
| $200,000+ | 0 | 0.0% |
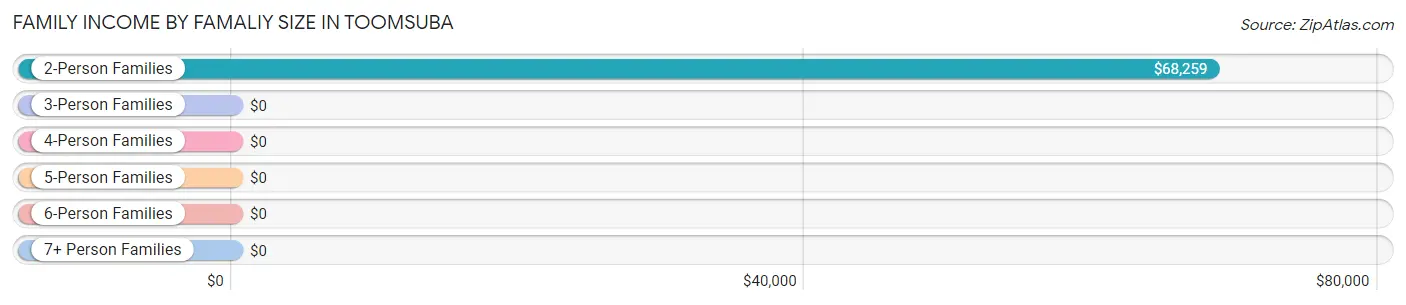
Family Income by Famaliy Size in Toomsuba
2-person families (143 | 70.4%) account for the highest median family income in Toomsuba with $68,259 per family, while 2-person families (143 | 70.4%) have the highest median income of $34,130 per family member.
| Income Bracket | # Families | Median Income |
| 2-Person Families | 143 (70.4%) | $68,259 |
| 3-Person Families | 8 (3.9%) | $0 |
| 4-Person Families | 52 (25.6%) | $0 |
| 5-Person Families | 0 (0.0%) | $0 |
| 6-Person Families | 0 (0.0%) | $0 |
| 7+ Person Families | 0 (0.0%) | $0 |
| Total | 203 (100.0%) | $67,604 |
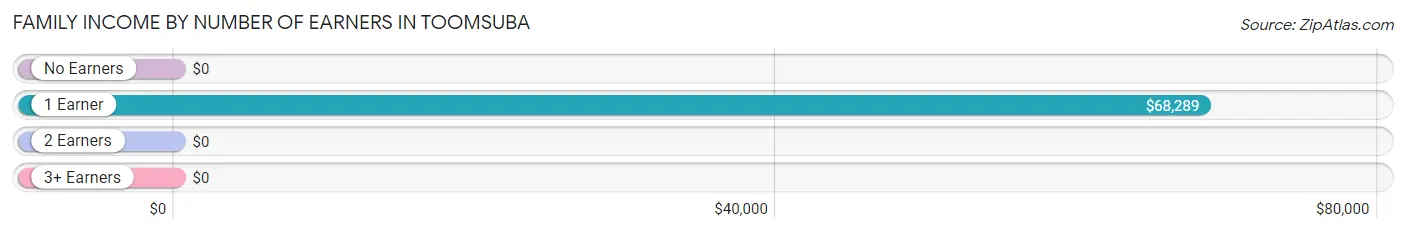
Family Income by Number of Earners in Toomsuba
| Number of Earners | # Families | Median Income |
| No Earners | 46 (22.7%) | $0 |
| 1 Earner | 157 (77.3%) | $68,289 |
| 2 Earners | 0 (0.0%) | $0 |
| 3+ Earners | 0 (0.0%) | $0 |
| Total | 203 (100.0%) | $67,604 |
Household Income in Toomsuba
Household Income Brackets in Toomsuba
With 176 households falling in the category, the $50,000 to $74,999 income range is the most frequent in Toomsuba, accounting for 43.7% of all households.
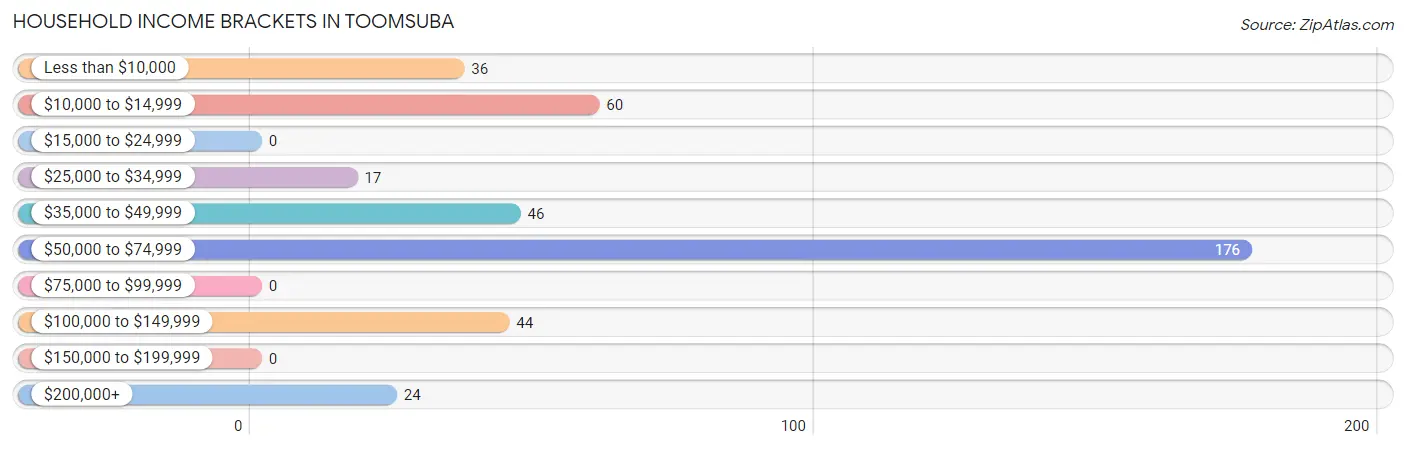
| Income Bracket | # Households | % Households |
| Less than $10,000 | 36 | 8.9% |
| $10,000 to $14,999 | 60 | 14.9% |
| $15,000 to $24,999 | 0 | 0.0% |
| $25,000 to $34,999 | 17 | 4.2% |
| $35,000 to $49,999 | 46 | 11.4% |
| $50,000 to $74,999 | 176 | 43.7% |
| $75,000 to $99,999 | 0 | 0.0% |
| $100,000 to $149,999 | 44 | 10.9% |
| $150,000 to $199,999 | 0 | 0.0% |
| $200,000+ | 24 | 6.0% |
Household Income by Householder Age in Toomsuba
The median household income in Toomsuba is $54,543, with the highest median household income of $39,212 found in the 45 to 64 years age bracket for the primary householder. A total of 197 households (48.9%) fall into this category.
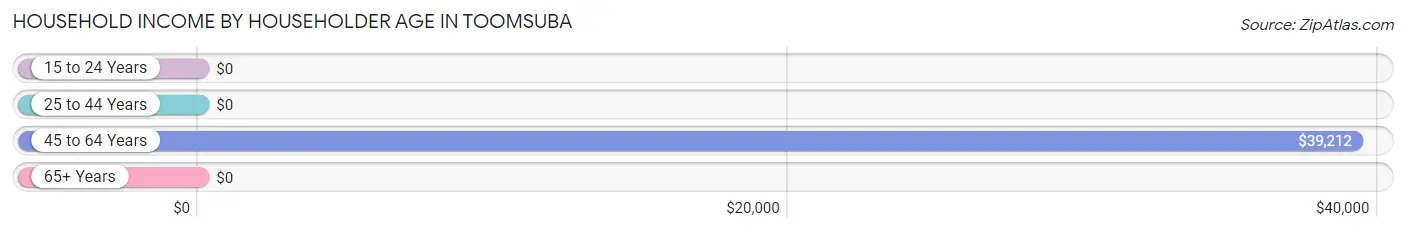
| Income Bracket | # Households | Median Income |
| 15 to 24 Years | 0 (0.0%) | $0 |
| 25 to 44 Years | 96 (23.8%) | $0 |
| 45 to 64 Years | 197 (48.9%) | $39,212 |
| 65+ Years | 110 (27.3%) | $0 |
| Total | 403 (100.0%) | $54,543 |
Poverty in Toomsuba
Income Below Poverty by Sex and Age in Toomsuba
With 11.0% poverty level for males and 14.9% for females among the residents of Toomsuba, 65 to 74 year old males and 45 to 54 year old females are the most vulnerable to poverty, with 36 males (100.0%) and 50 females (37.3%) in their respective age groups living below the poverty level.
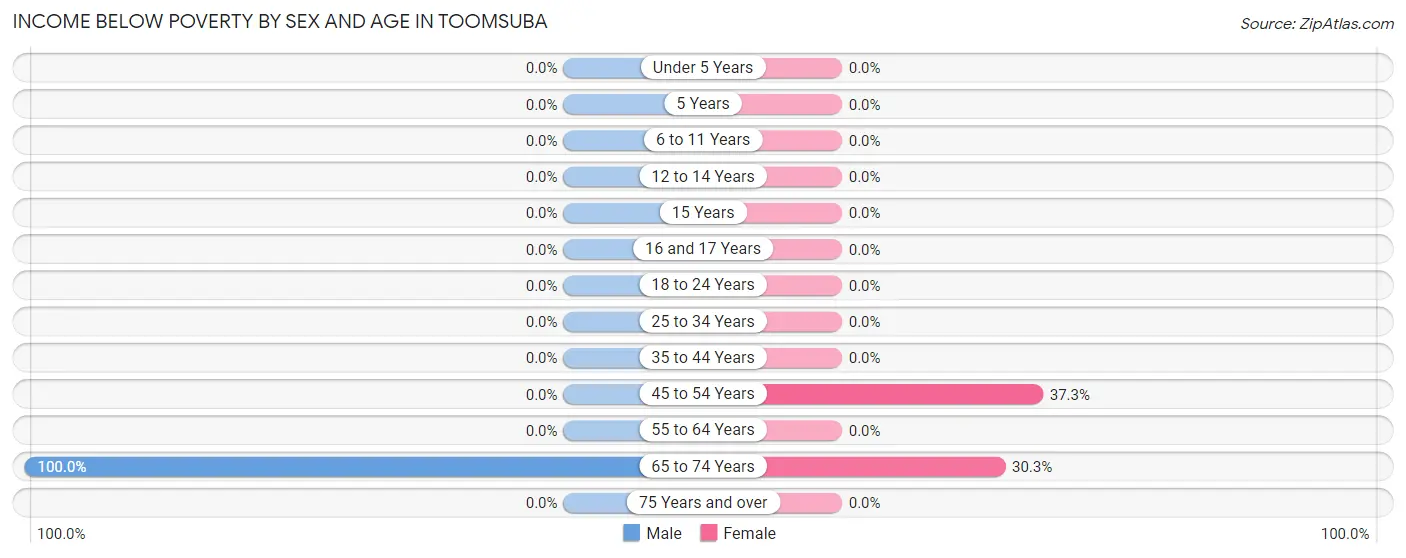
| Age Bracket | Male | Female |
| Under 5 Years | 0 (0.0%) | 0 (0.0%) |
| 5 Years | 0 (0.0%) | 0 (0.0%) |
| 6 to 11 Years | 0 (0.0%) | 0 (0.0%) |
| 12 to 14 Years | 0 (0.0%) | 0 (0.0%) |
| 15 Years | 0 (0.0%) | 0 (0.0%) |
| 16 and 17 Years | 0 (0.0%) | 0 (0.0%) |
| 18 to 24 Years | 0 (0.0%) | 0 (0.0%) |
| 25 to 34 Years | 0 (0.0%) | 0 (0.0%) |
| 35 to 44 Years | 0 (0.0%) | 0 (0.0%) |
| 45 to 54 Years | 0 (0.0%) | 50 (37.3%) |
| 55 to 64 Years | 0 (0.0%) | 0 (0.0%) |
| 65 to 74 Years | 36 (100.0%) | 10 (30.3%) |
| 75 Years and over | 0 (0.0%) | 0 (0.0%) |
| Total | 36 (11.0%) | 60 (14.9%) |
Income Above Poverty by Sex and Age in Toomsuba
According to the poverty statistics in Toomsuba, males aged 5 years and females aged 6 to 11 years are the age groups that are most secure financially, with 100.0% of males and 100.0% of females in these age groups living above the poverty line.
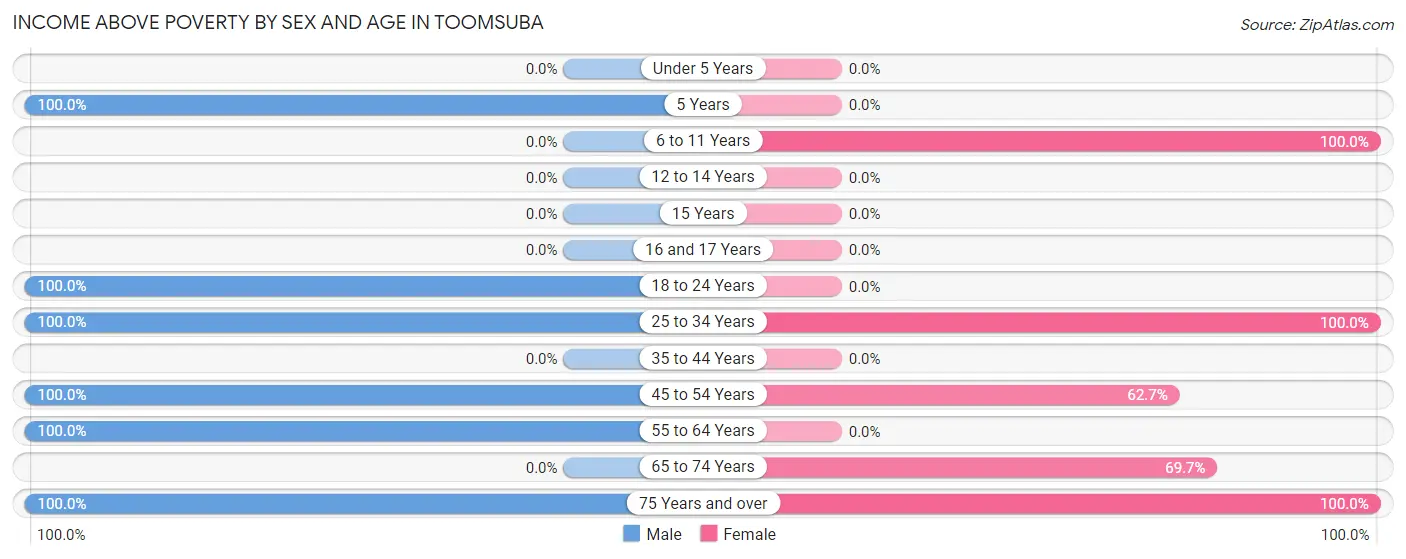
| Age Bracket | Male | Female |
| Under 5 Years | 0 (0.0%) | 0 (0.0%) |
| 5 Years | 49 (100.0%) | 0 (0.0%) |
| 6 to 11 Years | 0 (0.0%) | 47 (100.0%) |
| 12 to 14 Years | 0 (0.0%) | 0 (0.0%) |
| 15 Years | 0 (0.0%) | 0 (0.0%) |
| 16 and 17 Years | 0 (0.0%) | 0 (0.0%) |
| 18 to 24 Years | 70 (100.0%) | 0 (0.0%) |
| 25 to 34 Years | 83 (100.0%) | 96 (100.0%) |
| 35 to 44 Years | 0 (0.0%) | 0 (0.0%) |
| 45 to 54 Years | 46 (100.0%) | 84 (62.7%) |
| 55 to 64 Years | 25 (100.0%) | 0 (0.0%) |
| 65 to 74 Years | 0 (0.0%) | 23 (69.7%) |
| 75 Years and over | 17 (100.0%) | 92 (100.0%) |
| Total | 290 (89.0%) | 342 (85.1%) |
Income Below Poverty Among Married-Couple Families in Toomsuba
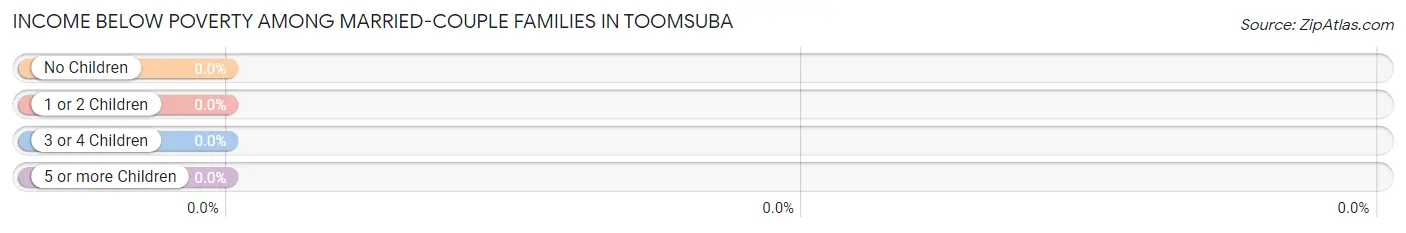
| Children | Above Poverty | Below Poverty |
| No Children | 21 (100.0%) | 0 (0.0%) |
| 1 or 2 Children | 52 (100.0%) | 0 (0.0%) |
| 3 or 4 Children | 0 (0.0%) | 0 (0.0%) |
| 5 or more Children | 0 (0.0%) | 0 (0.0%) |
| Total | 73 (100.0%) | 0 (0.0%) |
Income Below Poverty Among Single-Parent Households in Toomsuba
| Children | Single Father | Single Mother |
| No Children | 0 (0.0%) | 0 (0.0%) |
| 1 or 2 Children | 0 (0.0%) | 0 (0.0%) |
| 3 or 4 Children | 0 (0.0%) | 0 (0.0%) |
| 5 or more Children | 0 (0.0%) | 0 (0.0%) |
| Total | 0 (0.0%) | 0 (0.0%) |
Income Below Poverty Among Married-Couple vs Single-Parent Households in Toomsuba
| Children | Married-Couple Families | Single-Parent Households |
| No Children | 0 (0.0%) | 0 (0.0%) |
| 1 or 2 Children | 0 (0.0%) | 0 (0.0%) |
| 3 or 4 Children | 0 (0.0%) | 0 (0.0%) |
| 5 or more Children | 0 (0.0%) | 0 (0.0%) |
| Total | 0 (0.0%) | 0 (0.0%) |
Race in Toomsuba
The most populous races in Toomsuba are White / Caucasian (604 | 83.0%), Two or more Races (114 | 15.7%), and Hispanic or Latino (70 | 9.6%).
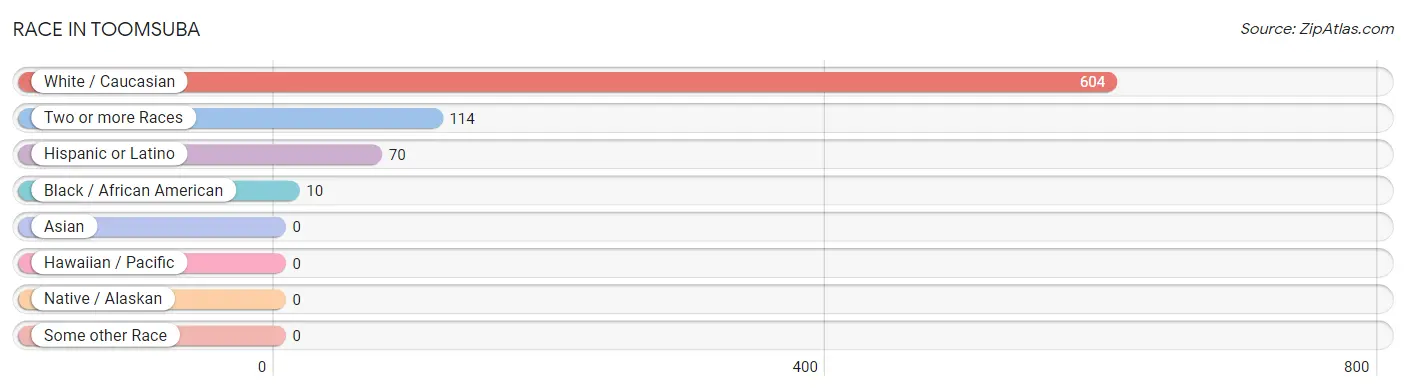
| Race | # Population | % Population |
| Asian | 0 | 0.0% |
| Black / African American | 10 | 1.4% |
| Hawaiian / Pacific | 0 | 0.0% |
| Hispanic or Latino | 70 | 9.6% |
| Native / Alaskan | 0 | 0.0% |
| White / Caucasian | 604 | 83.0% |
| Two or more Races | 114 | 15.7% |
| Some other Race | 0 | 0.0% |
| Total | 728 | 100.0% |
Ancestry in Toomsuba
The most populous ancestries reported in Toomsuba are Irish (102 | 14.0%), English (87 | 11.9%), European (84 | 11.5%), Mexican (70 | 9.6%), and American (52 | 7.1%), together accounting for 54.3% of all Toomsuba residents.
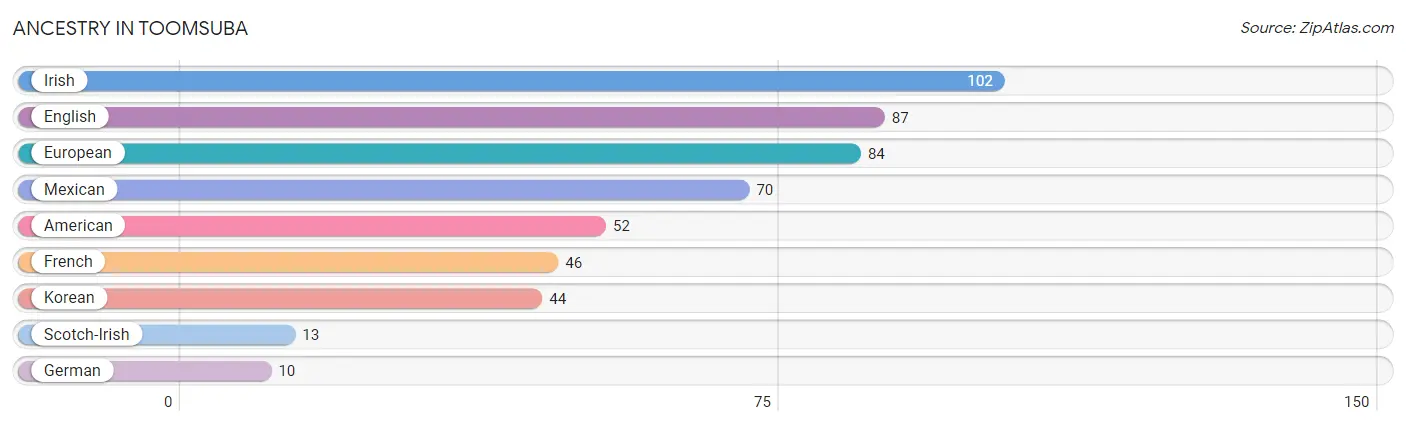
| Ancestry | # Population | % Population |
| American | 52 | 7.1% |
| English | 87 | 11.9% |
| European | 84 | 11.5% |
| French | 46 | 6.3% |
| German | 10 | 1.4% |
| Irish | 102 | 14.0% |
| Korean | 44 | 6.0% |
| Mexican | 70 | 9.6% |
| Scotch-Irish | 13 | 1.8% | View All 9 Rows |
Immigrants in Toomsuba

| Immigration Origin | # Population | % Population | View All 0 Rows |
Sex and Age in Toomsuba
Sex and Age in Toomsuba
The most populous age groups in Toomsuba are 30 to 34 Years (83 | 25.5%) for men and 45 to 49 Years (84 | 20.9%) for women.
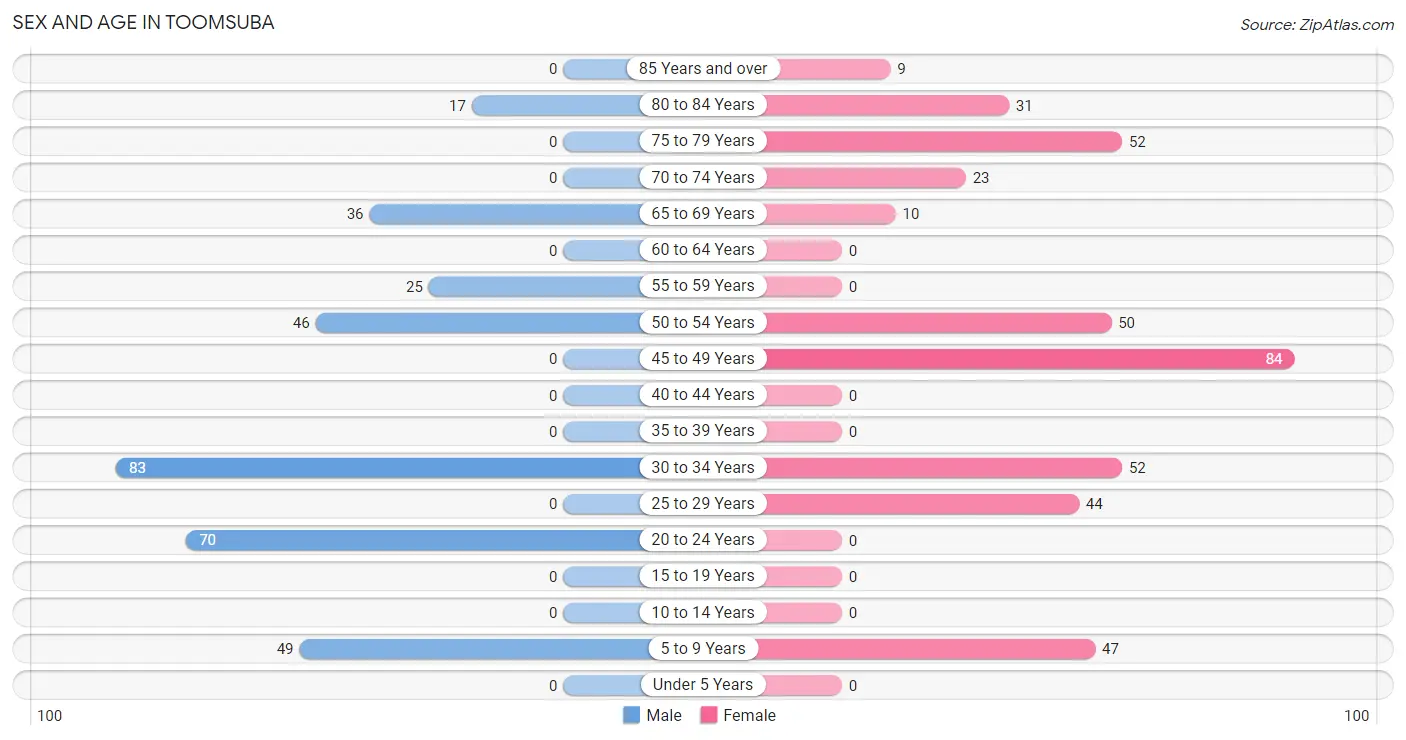
| Age Bracket | Male | Female |
| Under 5 Years | 0 (0.0%) | 0 (0.0%) |
| 5 to 9 Years | 49 (15.0%) | 47 (11.7%) |
| 10 to 14 Years | 0 (0.0%) | 0 (0.0%) |
| 15 to 19 Years | 0 (0.0%) | 0 (0.0%) |
| 20 to 24 Years | 70 (21.5%) | 0 (0.0%) |
| 25 to 29 Years | 0 (0.0%) | 44 (11.0%) |
| 30 to 34 Years | 83 (25.5%) | 52 (12.9%) |
| 35 to 39 Years | 0 (0.0%) | 0 (0.0%) |
| 40 to 44 Years | 0 (0.0%) | 0 (0.0%) |
| 45 to 49 Years | 0 (0.0%) | 84 (20.9%) |
| 50 to 54 Years | 46 (14.1%) | 50 (12.4%) |
| 55 to 59 Years | 25 (7.7%) | 0 (0.0%) |
| 60 to 64 Years | 0 (0.0%) | 0 (0.0%) |
| 65 to 69 Years | 36 (11.0%) | 10 (2.5%) |
| 70 to 74 Years | 0 (0.0%) | 23 (5.7%) |
| 75 to 79 Years | 0 (0.0%) | 52 (12.9%) |
| 80 to 84 Years | 17 (5.2%) | 31 (7.7%) |
| 85 Years and over | 0 (0.0%) | 9 (2.2%) |
| Total | 326 (100.0%) | 402 (100.0%) |
Families and Households in Toomsuba
Median Family Size in Toomsuba
The median family size in Toomsuba is 2.40 persons per family, with married-couple families (73 | 36.0%) accounting for the largest median family size of 3.23 persons per family. On the other hand, single female/mother families (84 | 41.4%) represent the smallest median family size with 1.83 persons per family.
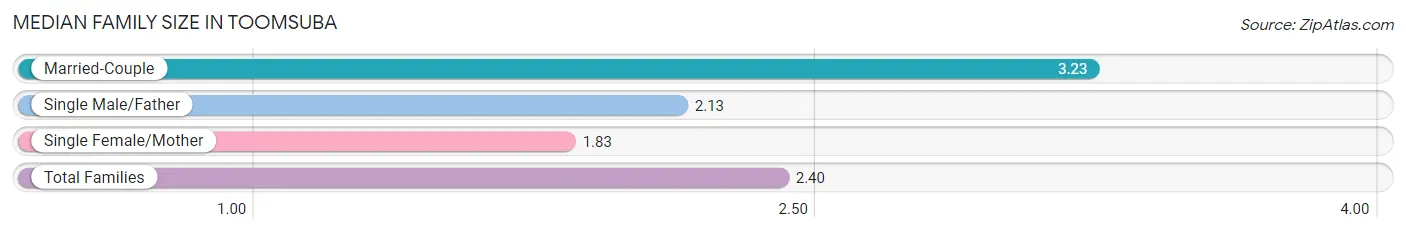
| Family Type | # Families | Family Size |
| Married-Couple | 73 (36.0%) | 3.23 |
| Single Male/Father | 46 (22.7%) | 2.13 |
| Single Female/Mother | 84 (41.4%) | 1.83 |
| Total Families | 203 (100.0%) | 2.40 |
Median Household Size in Toomsuba
The median household size in Toomsuba is 1.81 persons per household, with married-couple households (73 | 18.1%) accounting for the largest median household size of 3.23 persons per household. non-family households (200 | 49.6%) represent the smallest median household size with 1.20 persons per household.
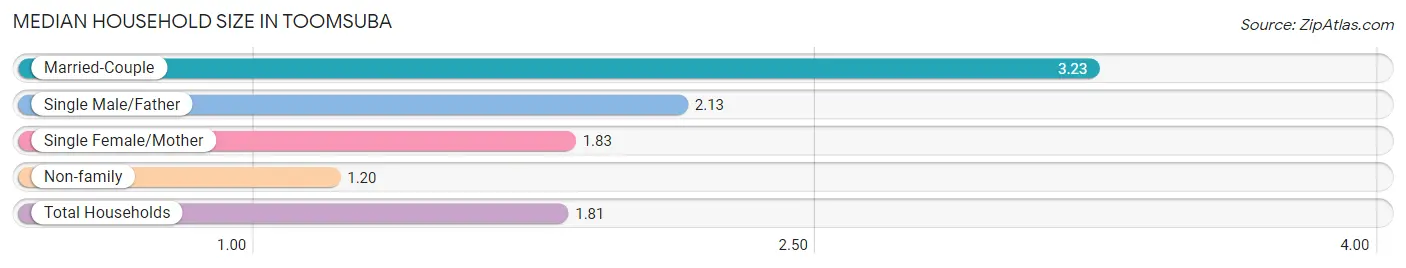
| Household Type | # Households | Household Size |
| Married-Couple | 73 (18.1%) | 3.23 |
| Single Male/Father | 46 (11.4%) | 2.13 |
| Single Female/Mother | 84 (20.8%) | 1.83 |
| Non-family | 200 (49.6%) | 1.20 |
| Total Households | 403 (100.0%) | 1.81 |
Household Size by Marriage Status in Toomsuba
Out of a total of 403 households in Toomsuba, 203 (50.4%) are family households, while 200 (49.6%) are nonfamily households. The most numerous type of family households are 2-person households, comprising 143, and the most common type of nonfamily households are 1-person households, comprising 156.
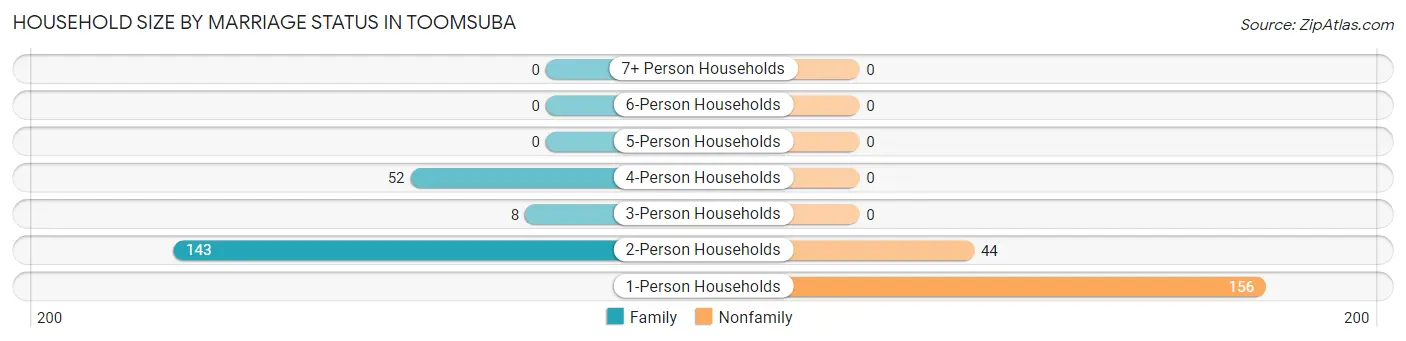
| Household Size | Family Households | Nonfamily Households |
| 1-Person Households | - | 156 (38.7%) |
| 2-Person Households | 143 (35.5%) | 44 (10.9%) |
| 3-Person Households | 8 (2.0%) | 0 (0.0%) |
| 4-Person Households | 52 (12.9%) | 0 (0.0%) |
| 5-Person Households | 0 (0.0%) | 0 (0.0%) |
| 6-Person Households | 0 (0.0%) | 0 (0.0%) |
| 7+ Person Households | 0 (0.0%) | 0 (0.0%) |
| Total | 203 (50.4%) | 200 (49.6%) |
Female Fertility in Toomsuba
Fertility by Age in Toomsuba
| Age Bracket | Women with Births | Births / 1,000 Women |
| 15 to 19 years | 0 (0.0%) | 0.0 |
| 20 to 34 years | 0 (0.0%) | 0.0 |
| 35 to 50 years | 0 (0.0%) | 0.0 |
| Total | 0 (0.0%) | 0.0 |
Fertility by Age by Marriage Status in Toomsuba
| Age Bracket | Married | Unmarried |
| 15 to 19 years | 0 (0.0%) | 0 (0.0%) |
| 20 to 34 years | 0 (0.0%) | 0 (0.0%) |
| 35 to 50 years | 0 (0.0%) | 0 (0.0%) |
| Total | 0 (0.0%) | 0 (0.0%) |
Fertility by Education in Toomsuba
| Educational Attainment | Women with Births | Births / 1,000 Women |
| Less than High School | 0 (0.0%) | 0.0 |
| High School Diploma | 0 (0.0%) | 0.0 |
| College or Associate's Degree | 0 (0.0%) | 0.0 |
| Bachelor's Degree | 0 (0.0%) | 0.0 |
| Graduate Degree | 0 (0.0%) | 0.0 |
| Total | 0 (0.0%) | 0.0 |
Fertility by Education by Marriage Status in Toomsuba
| Educational Attainment | Married | Unmarried |
| Less than High School | 0 (0.0%) | 0 (0.0%) |
| High School Diploma | 0 (0.0%) | 0 (0.0%) |
| College or Associate's Degree | 0 (0.0%) | 0 (0.0%) |
| Bachelor's Degree | 0 (0.0%) | 0 (0.0%) |
| Graduate Degree | 0 (0.0%) | 0 (0.0%) |
| Total | 0 (0.0%) | 0 (0.0%) |
Employment Characteristics in Toomsuba
Employment by Class of Employer in Toomsuba
Among the 232 employed individuals in Toomsuba, , and private company employees (232 | 100.0%) make up the most common classes of employment.
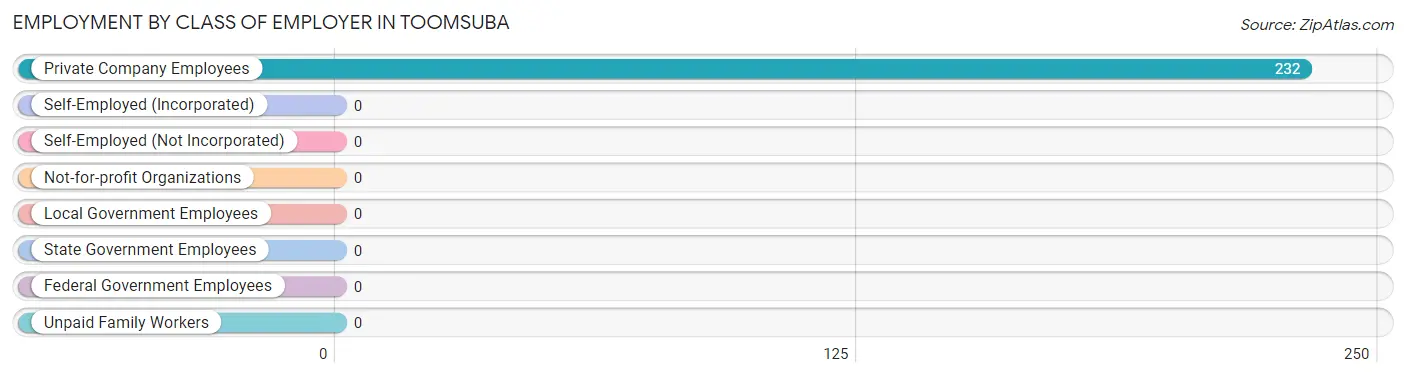
| Employer Class | # Employees | % Employees |
| Private Company Employees | 232 | 100.0% |
| Self-Employed (Incorporated) | 0 | 0.0% |
| Self-Employed (Not Incorporated) | 0 | 0.0% |
| Not-for-profit Organizations | 0 | 0.0% |
| Local Government Employees | 0 | 0.0% |
| State Government Employees | 0 | 0.0% |
| Federal Government Employees | 0 | 0.0% |
| Unpaid Family Workers | 0 | 0.0% |
| Total | 232 | 100.0% |
Employment Status by Age in Toomsuba
According to the labor force statistics for Toomsuba, out of the total population over 16 years of age (632), 50.0% or 316 individuals are in the labor force, with 26.6% or 84 of them unemployed. The age group with the highest labor force participation rate is 20 to 24 years, with 100.0% or 70 individuals in the labor force. Within the labor force, the 45 to 54 years age range has the highest percentage of unemployed individuals, with 100.0% or 84 of them being unemployed.
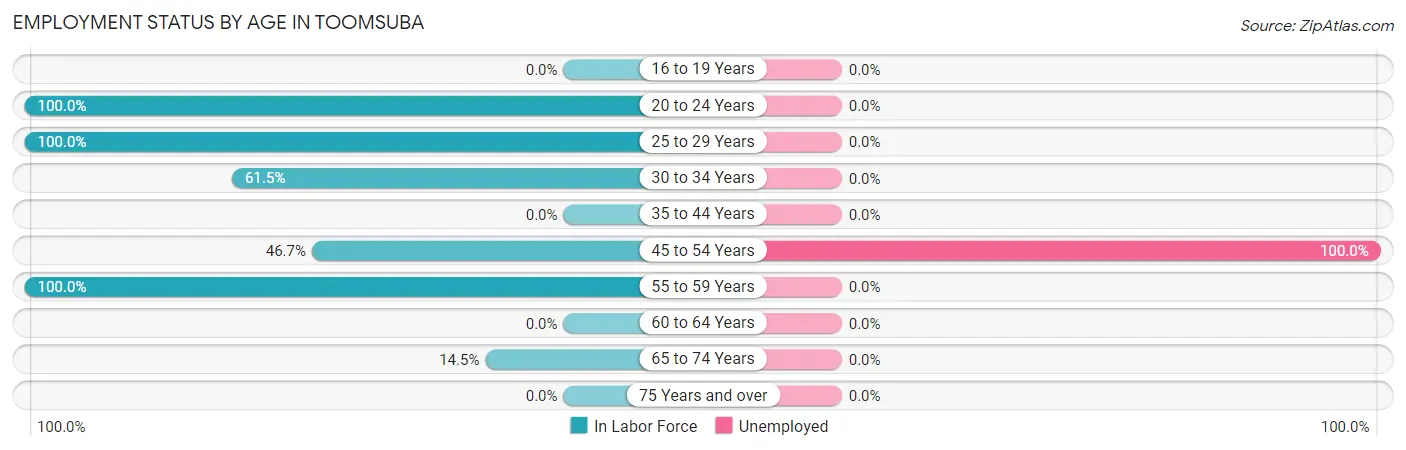
| Age Bracket | In Labor Force | Unemployed |
| 16 to 19 Years | 0 (0.0%) | 0 (0.0%) |
| 20 to 24 Years | 70 (100.0%) | 0 (0.0%) |
| 25 to 29 Years | 44 (100.0%) | 0 (0.0%) |
| 30 to 34 Years | 83 (61.5%) | 0 (0.0%) |
| 35 to 44 Years | 0 (0.0%) | 0 (0.0%) |
| 45 to 54 Years | 84 (46.7%) | 84 (100.0%) |
| 55 to 59 Years | 25 (100.0%) | 0 (0.0%) |
| 60 to 64 Years | 0 (0.0%) | 0 (0.0%) |
| 65 to 74 Years | 10 (14.5%) | 0 (0.0%) |
| 75 Years and over | 0 (0.0%) | 0 (0.0%) |
| Total | 316 (50.0%) | 84 (26.6%) |
Employment Status by Educational Attainment in Toomsuba
According to labor force statistics for Toomsuba, 61.5% of individuals (236) out of the total population between 25 and 64 years of age (384) are in the labor force, with 35.6% or 84 of them being unemployed. The group with the highest labor force participation rate are those with the educational attainment of bachelor's degree or higher, with 100.0% or 128 individuals in the labor force. Within the labor force, individuals with bachelor's degree or higher education have the highest percentage of unemployment, with 65.6% or 84 of them being unemployed.
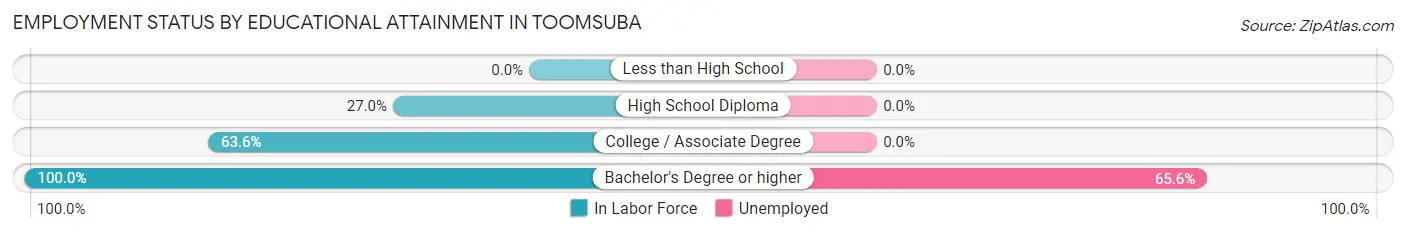
| Educational Attainment | In Labor Force | Unemployed |
| Less than High School | 0 (0.0%) | 0 (0.0%) |
| High School Diploma | 17 (27.0%) | 0 (0.0%) |
| College / Associate Degree | 91 (63.6%) | 0 (0.0%) |
| Bachelor's Degree or higher | 128 (100.0%) | 84 (65.6%) |
| Total | 236 (61.5%) | 137 (35.6%) |
Employment Occupations by Sex in Toomsuba
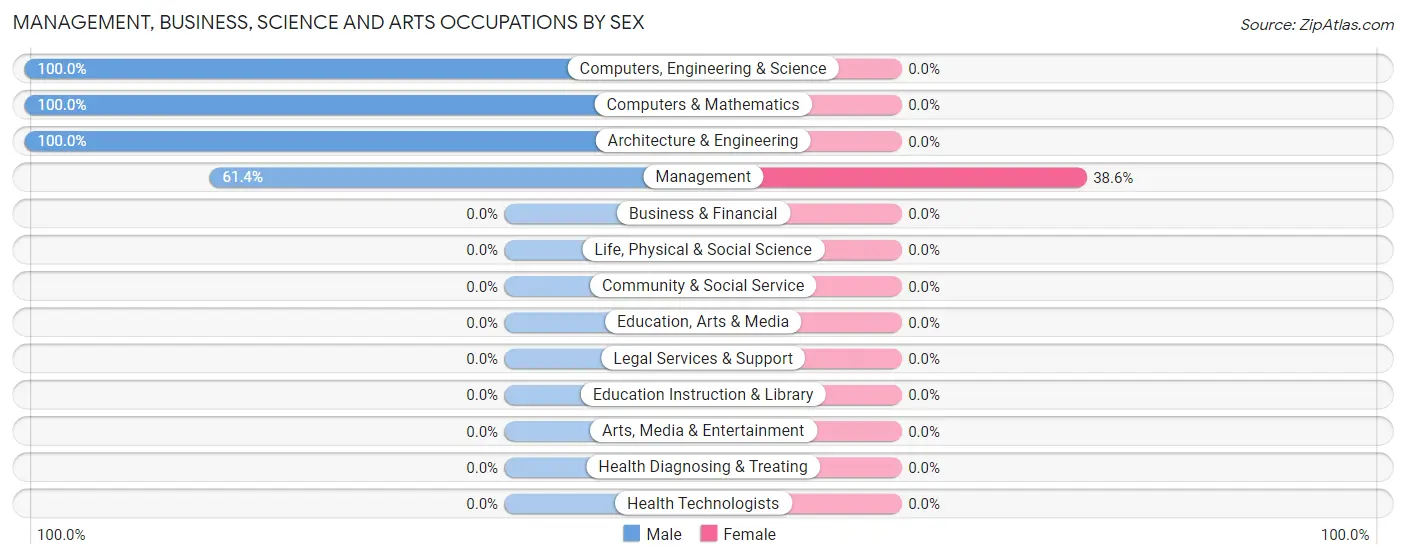
Management, Business, Science and Arts Occupations
The most common Management, Business, Science and Arts occupations in Toomsuba are Management (114 | 49.1%), Computers, Engineering & Science (51 | 22.0%), Architecture & Engineering (43 | 18.5%), and Computers & Mathematics (8 | 3.5%).
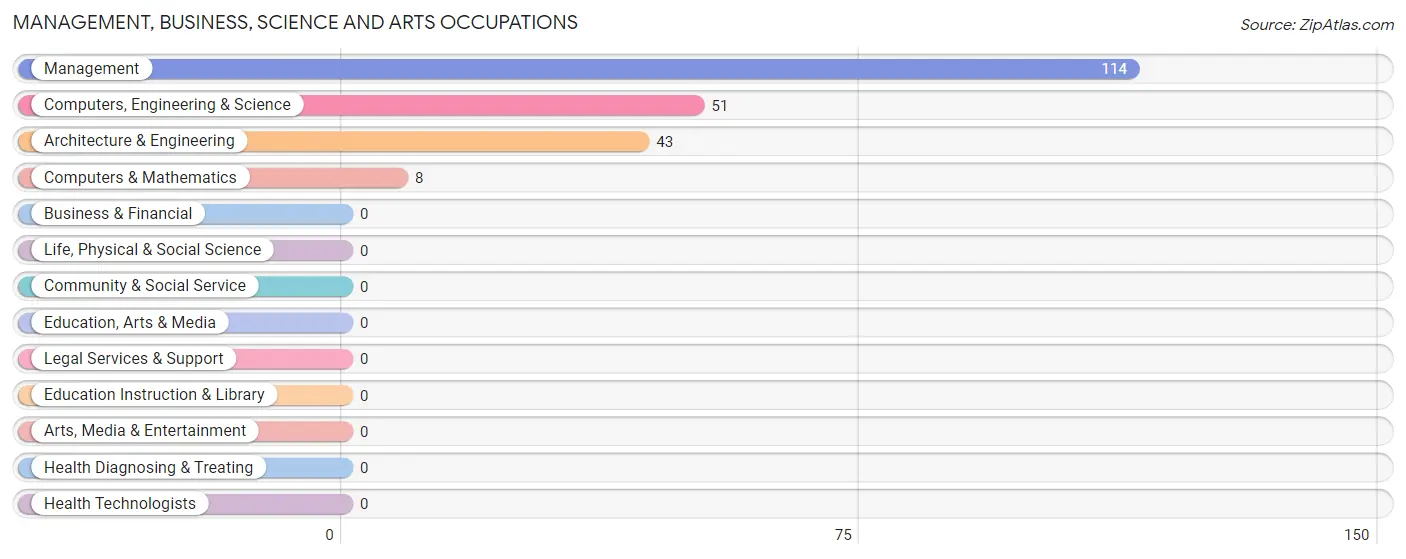
Management, Business, Science and Arts Occupations by Sex
| Occupation | Male | Female |
| Management | 70 (61.4%) | 44 (38.6%) |
| Business & Financial | 0 (0.0%) | 0 (0.0%) |
| Computers, Engineering & Science | 51 (100.0%) | 0 (0.0%) |
| Computers & Mathematics | 8 (100.0%) | 0 (0.0%) |
| Architecture & Engineering | 43 (100.0%) | 0 (0.0%) |
| Life, Physical & Social Science | 0 (0.0%) | 0 (0.0%) |
| Community & Social Service | 0 (0.0%) | 0 (0.0%) |
| Education, Arts & Media | 0 (0.0%) | 0 (0.0%) |
| Legal Services & Support | 0 (0.0%) | 0 (0.0%) |
| Education Instruction & Library | 0 (0.0%) | 0 (0.0%) |
| Arts, Media & Entertainment | 0 (0.0%) | 0 (0.0%) |
| Health Diagnosing & Treating | 0 (0.0%) | 0 (0.0%) |
| Health Technologists | 0 (0.0%) | 0 (0.0%) |
| Total (Category) | 121 (73.3%) | 44 (26.7%) |
| Total (Overall) | 178 (76.7%) | 54 (23.3%) |
Services Occupations
Services Occupations by Sex
| Occupation | Male | Female |
| Healthcare Support | 0 (0.0%) | 0 (0.0%) |
| Security & Protection | 0 (0.0%) | 0 (0.0%) |
| Firefighting & Prevention | 0 (0.0%) | 0 (0.0%) |
| Law Enforcement | 0 (0.0%) | 0 (0.0%) |
| Food Preparation & Serving | 0 (0.0%) | 0 (0.0%) |
| Cleaning & Maintenance | 0 (0.0%) | 0 (0.0%) |
| Personal Care & Service | 0 (0.0%) | 0 (0.0%) |
| Total (Category) | 0 (0.0%) | 0 (0.0%) |
| Total (Overall) | 178 (76.7%) | 54 (23.3%) |
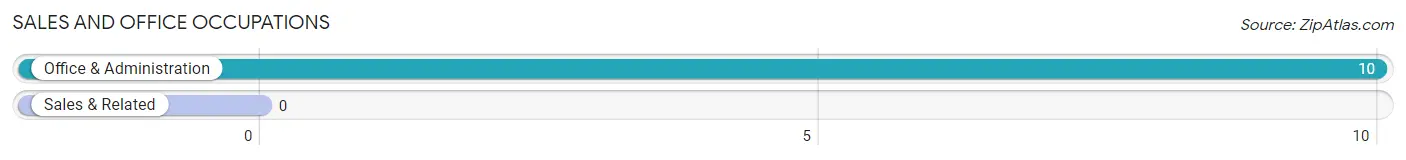
Sales and Office Occupations
The most common Sales and Office occupations in Toomsuba are , and Office & Administration (10 | 4.3%).
Sales and Office Occupations by Sex
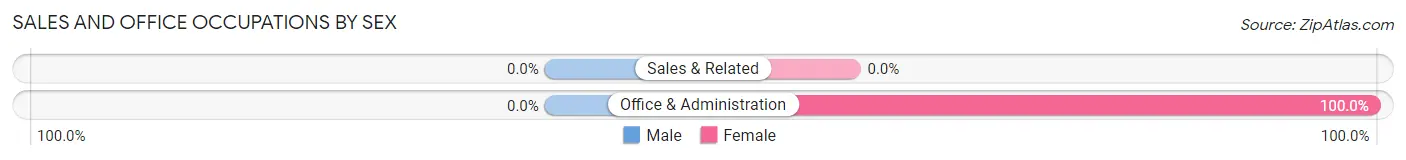
| Occupation | Male | Female |
| Sales & Related | 0 (0.0%) | 0 (0.0%) |
| Office & Administration | 0 (0.0%) | 10 (100.0%) |
| Total (Category) | 0 (0.0%) | 10 (100.0%) |
| Total (Overall) | 178 (76.7%) | 54 (23.3%) |
Natural Resources, Construction and Maintenance Occupations
The most common Natural Resources, Construction and Maintenance occupations in Toomsuba are , and Installation, Maintenance & Repair (17 | 7.3%).
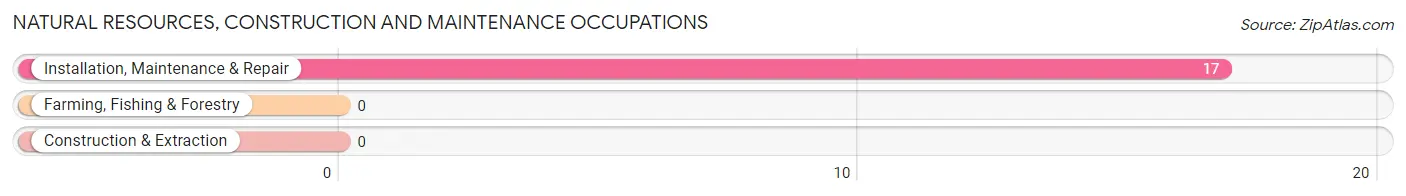
Natural Resources, Construction and Maintenance Occupations by Sex
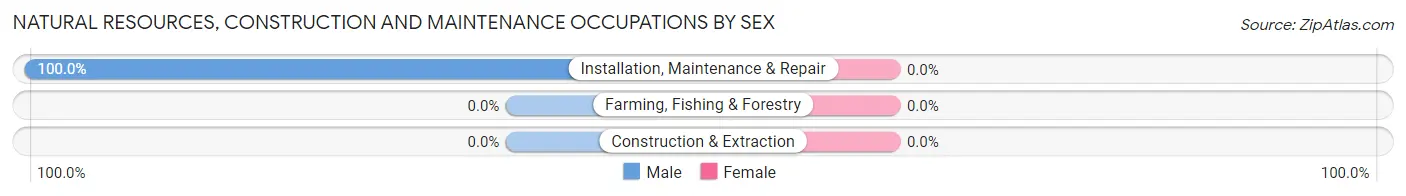
| Occupation | Male | Female |
| Farming, Fishing & Forestry | 0 (0.0%) | 0 (0.0%) |
| Construction & Extraction | 0 (0.0%) | 0 (0.0%) |
| Installation, Maintenance & Repair | 17 (100.0%) | 0 (0.0%) |
| Total (Category) | 17 (100.0%) | 0 (0.0%) |
| Total (Overall) | 178 (76.7%) | 54 (23.3%) |
Production, Transportation and Moving Occupations
The most common Production, Transportation and Moving occupations in Toomsuba are , and Production (40 | 17.2%).
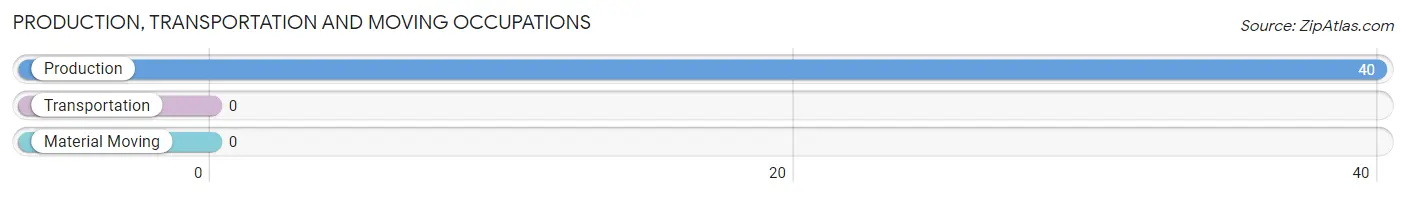
Production, Transportation and Moving Occupations by Sex
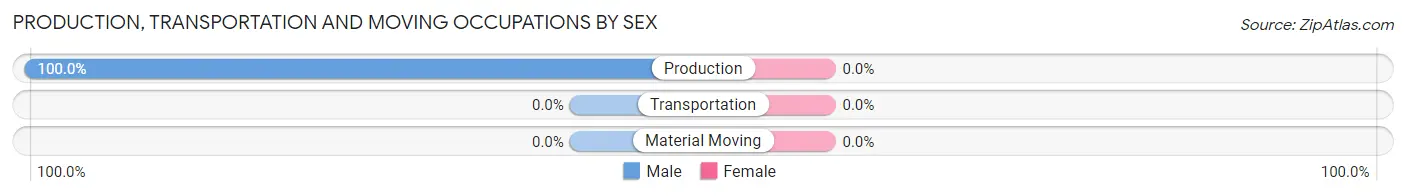
| Occupation | Male | Female |
| Production | 40 (100.0%) | 0 (0.0%) |
| Transportation | 0 (0.0%) | 0 (0.0%) |
| Material Moving | 0 (0.0%) | 0 (0.0%) |
| Total (Category) | 40 (100.0%) | 0 (0.0%) |
| Total (Overall) | 178 (76.7%) | 54 (23.3%) |
Employment Industries by Sex in Toomsuba
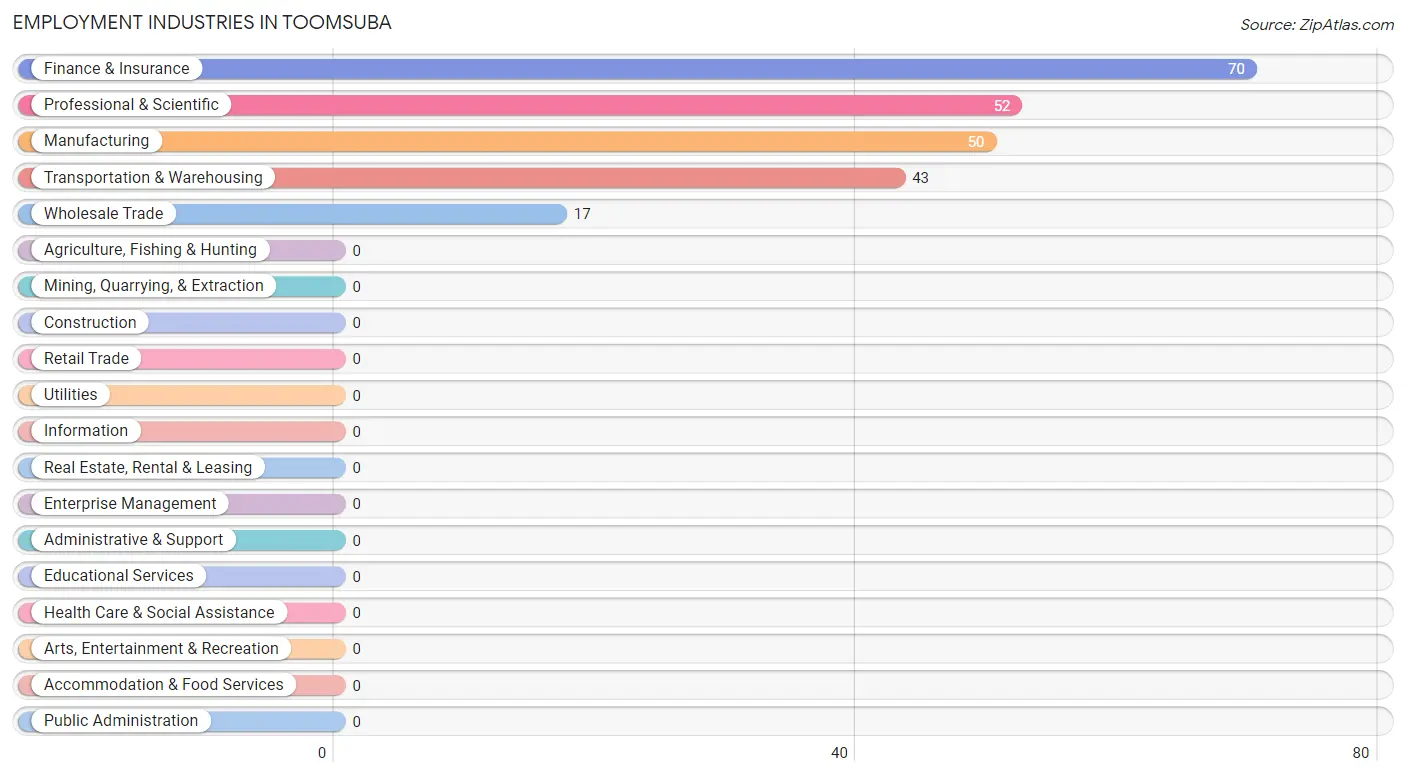
Employment Industries in Toomsuba
The major employment industries in Toomsuba include Finance & Insurance (70 | 30.2%), Professional & Scientific (52 | 22.4%), Manufacturing (50 | 21.5%), Transportation & Warehousing (43 | 18.5%), and Wholesale Trade (17 | 7.3%).
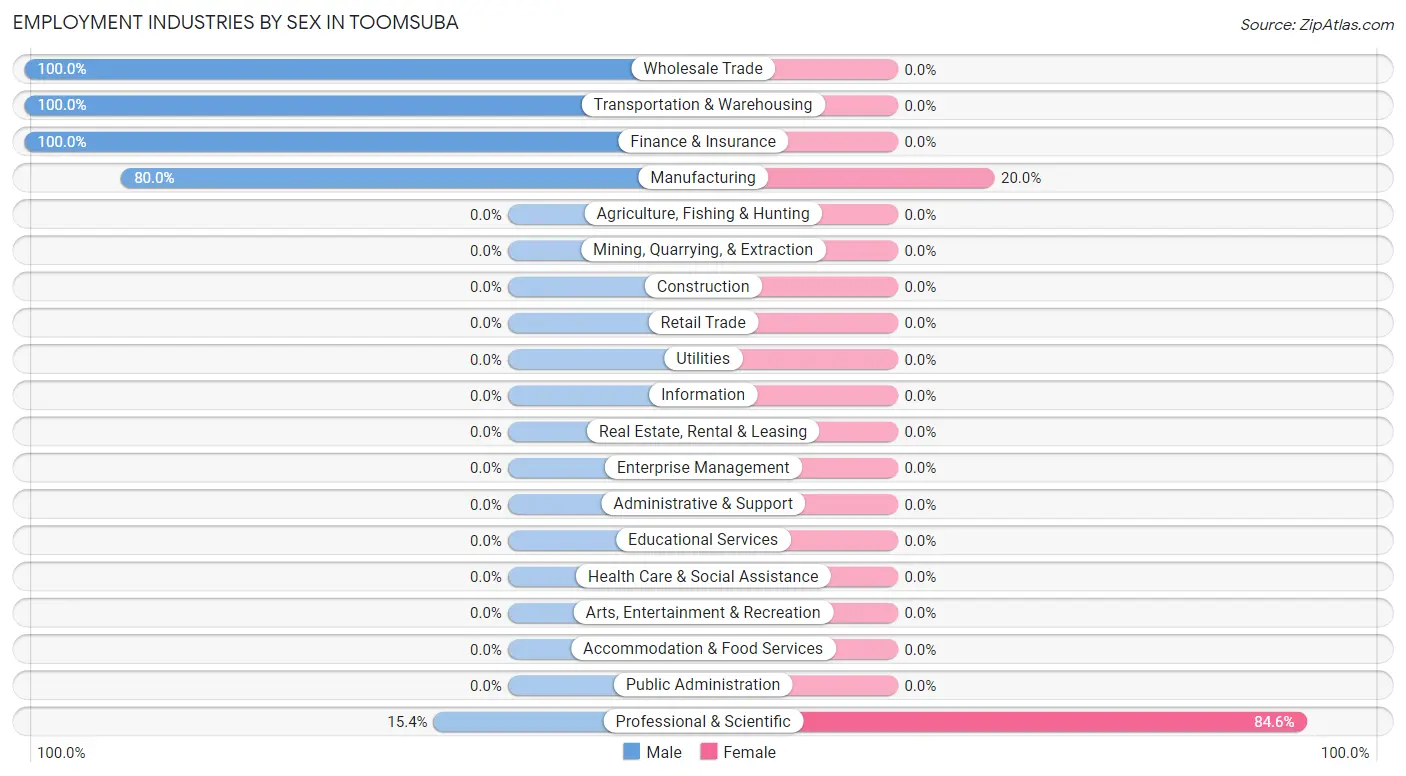
Employment Industries by Sex in Toomsuba
The Toomsuba industries that see more men than women are Wholesale Trade (100.0%), Transportation & Warehousing (100.0%), and Finance & Insurance (100.0%), whereas the industries that tend to have a higher number of women are Professional & Scientific (84.6%), and Manufacturing (20.0%).
| Industry | Male | Female |
| Agriculture, Fishing & Hunting | 0 (0.0%) | 0 (0.0%) |
| Mining, Quarrying, & Extraction | 0 (0.0%) | 0 (0.0%) |
| Construction | 0 (0.0%) | 0 (0.0%) |
| Manufacturing | 40 (80.0%) | 10 (20.0%) |
| Wholesale Trade | 17 (100.0%) | 0 (0.0%) |
| Retail Trade | 0 (0.0%) | 0 (0.0%) |
| Transportation & Warehousing | 43 (100.0%) | 0 (0.0%) |
| Utilities | 0 (0.0%) | 0 (0.0%) |
| Information | 0 (0.0%) | 0 (0.0%) |
| Finance & Insurance | 70 (100.0%) | 0 (0.0%) |
| Real Estate, Rental & Leasing | 0 (0.0%) | 0 (0.0%) |
| Professional & Scientific | 8 (15.4%) | 44 (84.6%) |
| Enterprise Management | 0 (0.0%) | 0 (0.0%) |
| Administrative & Support | 0 (0.0%) | 0 (0.0%) |
| Educational Services | 0 (0.0%) | 0 (0.0%) |
| Health Care & Social Assistance | 0 (0.0%) | 0 (0.0%) |
| Arts, Entertainment & Recreation | 0 (0.0%) | 0 (0.0%) |
| Accommodation & Food Services | 0 (0.0%) | 0 (0.0%) |
| Public Administration | 0 (0.0%) | 0 (0.0%) |
| Total | 178 (76.7%) | 54 (23.3%) |
Education in Toomsuba
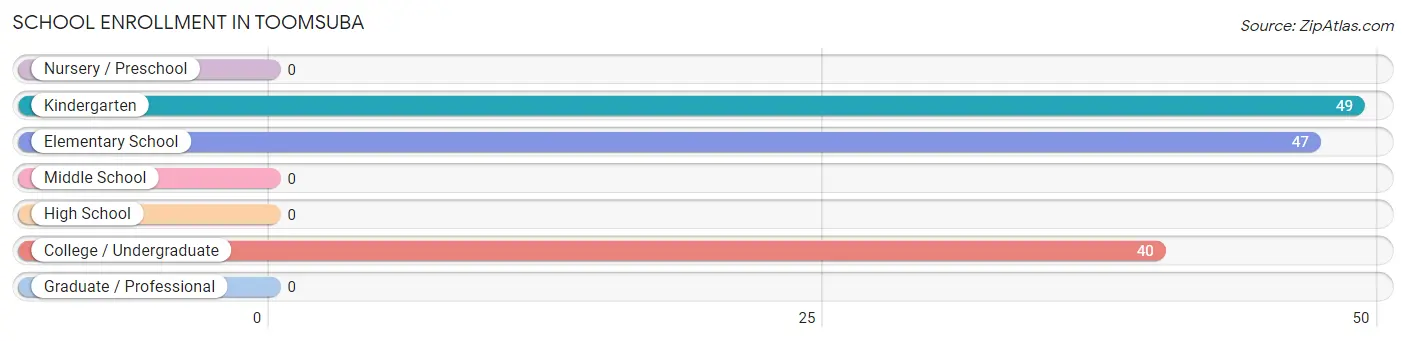
School Enrollment in Toomsuba
The most common levels of schooling among the 136 students in Toomsuba are kindergarten (49 | 36.0%), elementary school (47 | 34.6%), and college / undergraduate (40 | 29.4%).
| School Level | # Students | % Students |
| Nursery / Preschool | 0 | 0.0% |
| Kindergarten | 49 | 36.0% |
| Elementary School | 47 | 34.6% |
| Middle School | 0 | 0.0% |
| High School | 0 | 0.0% |
| College / Undergraduate | 40 | 29.4% |
| Graduate / Professional | 0 | 0.0% |
| Total | 136 | 100.0% |
School Enrollment by Age by Funding Source in Toomsuba
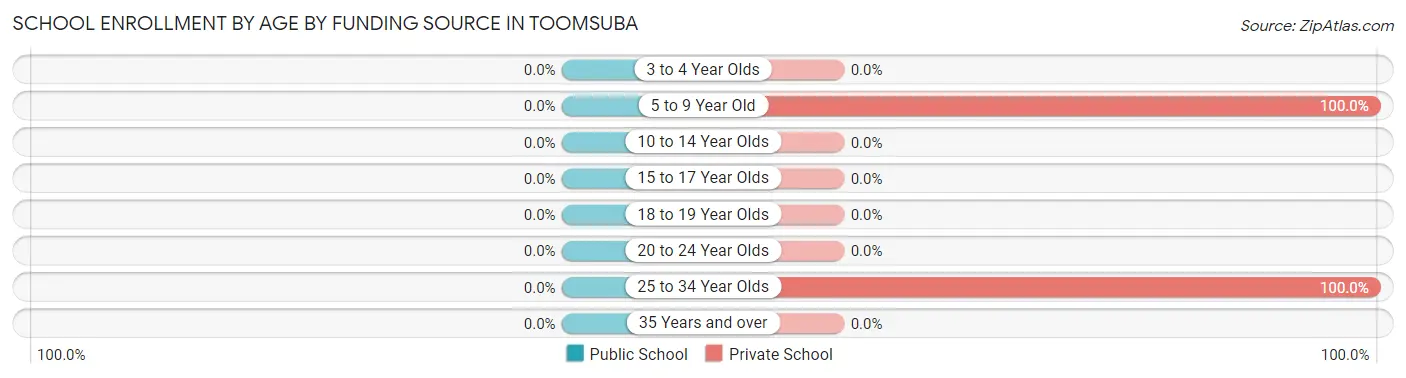
| Age Bracket | Public School | Private School |
| 3 to 4 Year Olds | 0 (0.0%) | 0 (0.0%) |
| 5 to 9 Year Old | 0 (0.0%) | 96 (100.0%) |
| 10 to 14 Year Olds | 0 (0.0%) | 0 (0.0%) |
| 15 to 17 Year Olds | 0 (0.0%) | 0 (0.0%) |
| 18 to 19 Year Olds | 0 (0.0%) | 0 (0.0%) |
| 20 to 24 Year Olds | 0 (0.0%) | 0 (0.0%) |
| 25 to 34 Year Olds | 0 (0.0%) | 40 (100.0%) |
| 35 Years and over | 0 (0.0%) | 0 (0.0%) |
| Total | 0 (0.0%) | 136 (100.0%) |
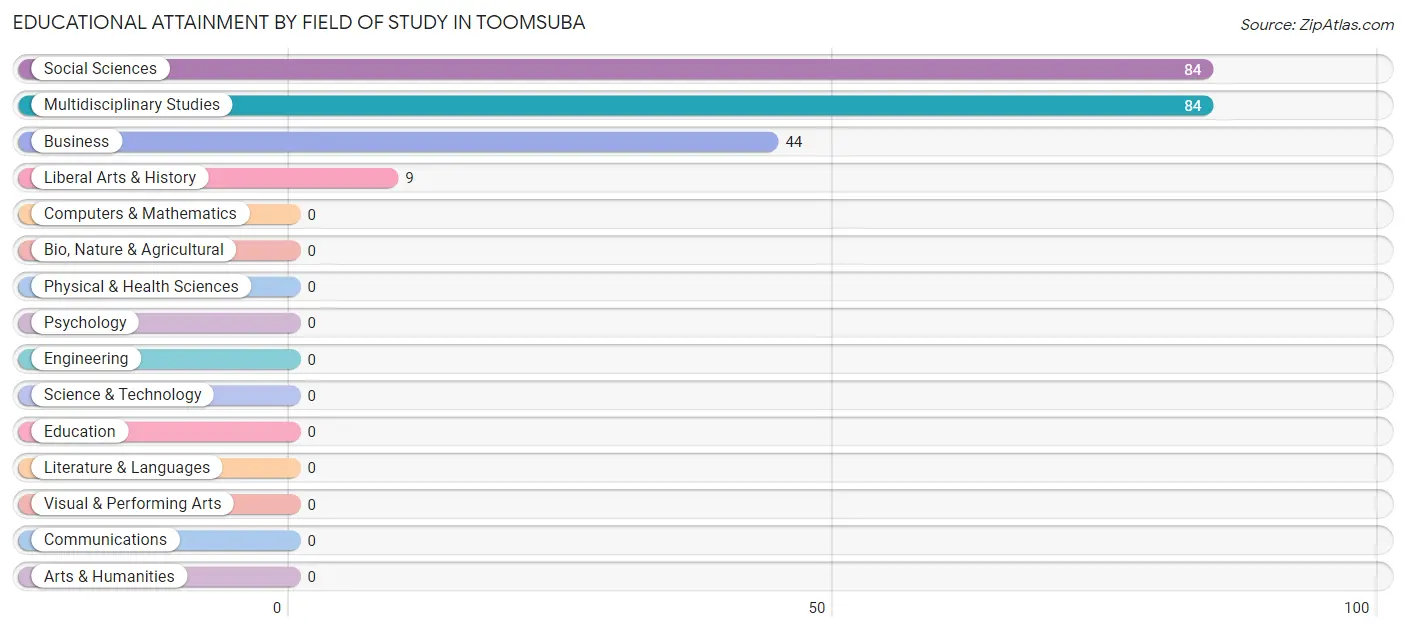
Educational Attainment by Field of Study in Toomsuba
Social sciences (84 | 38.0%), multidisciplinary studies (84 | 38.0%), business (44 | 19.9%), and liberal arts & history (9 | 4.1%) are the most common fields of study among 221 individuals in Toomsuba who have obtained a bachelor's degree or higher.
| Field of Study | # Graduates | % Graduates |
| Computers & Mathematics | 0 | 0.0% |
| Bio, Nature & Agricultural | 0 | 0.0% |
| Physical & Health Sciences | 0 | 0.0% |
| Psychology | 0 | 0.0% |
| Social Sciences | 84 | 38.0% |
| Engineering | 0 | 0.0% |
| Multidisciplinary Studies | 84 | 38.0% |
| Science & Technology | 0 | 0.0% |
| Business | 44 | 19.9% |
| Education | 0 | 0.0% |
| Literature & Languages | 0 | 0.0% |
| Liberal Arts & History | 9 | 4.1% |
| Visual & Performing Arts | 0 | 0.0% |
| Communications | 0 | 0.0% |
| Arts & Humanities | 0 | 0.0% |
| Total | 221 | 100.0% |
Transportation & Commute in Toomsuba
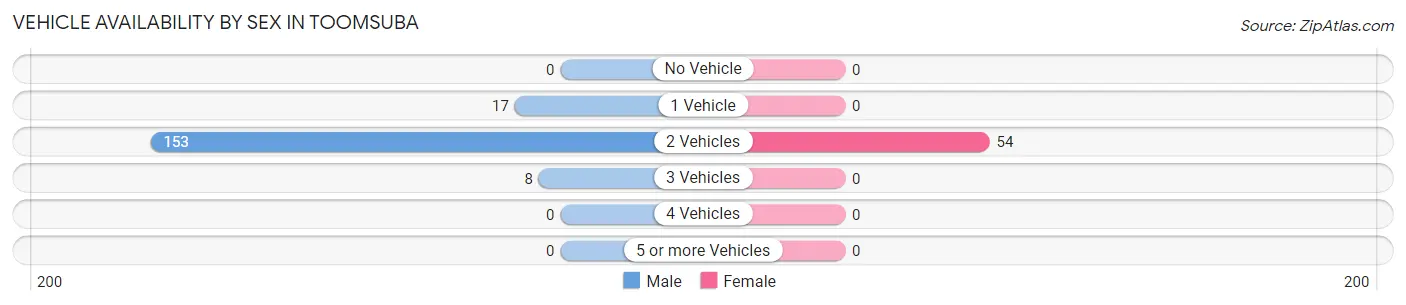
Vehicle Availability by Sex in Toomsuba
The most prevalent vehicle ownership categories in Toomsuba are males with 2 vehicles (153, accounting for 86.0%) and females with 2 vehicles (54, making up 283.3%).
| Vehicles Available | Male | Female |
| No Vehicle | 0 (0.0%) | 0 (0.0%) |
| 1 Vehicle | 17 (9.6%) | 0 (0.0%) |
| 2 Vehicles | 153 (86.0%) | 54 (100.0%) |
| 3 Vehicles | 8 (4.5%) | 0 (0.0%) |
| 4 Vehicles | 0 (0.0%) | 0 (0.0%) |
| 5 or more Vehicles | 0 (0.0%) | 0 (0.0%) |
| Total | 178 (100.0%) | 54 (100.0%) |
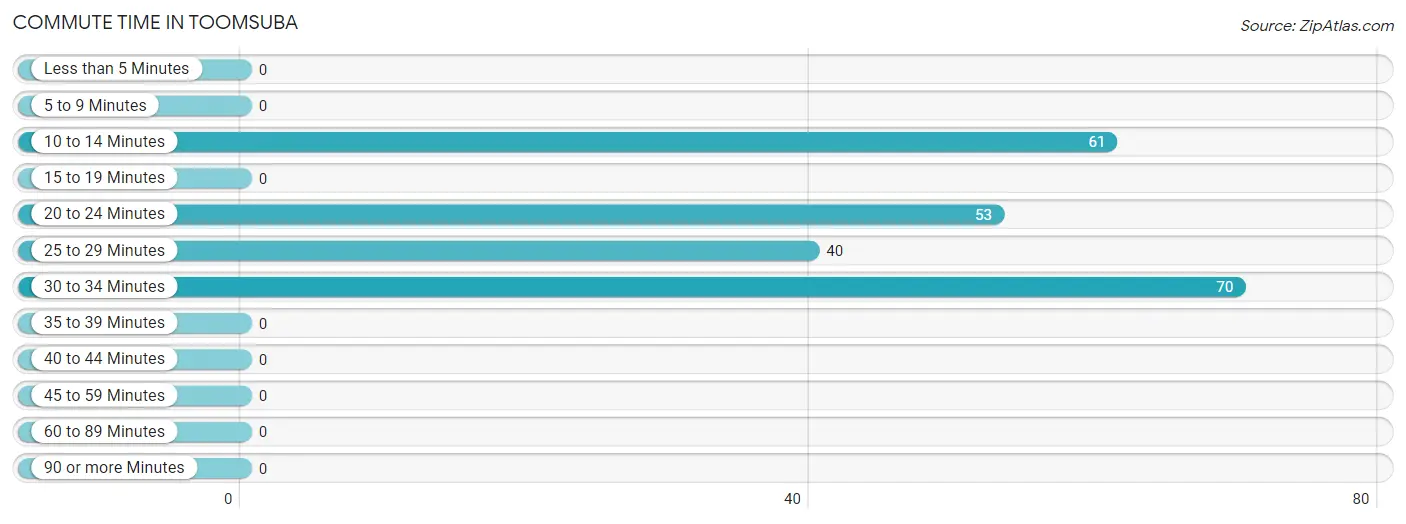
Commute Time in Toomsuba
The most frequently occuring commute durations in Toomsuba are 30 to 34 minutes (70 commuters, 31.2%), 10 to 14 minutes (61 commuters, 27.2%), and 20 to 24 minutes (53 commuters, 23.7%).
| Commute Time | # Commuters | % Commuters |
| Less than 5 Minutes | 0 | 0.0% |
| 5 to 9 Minutes | 0 | 0.0% |
| 10 to 14 Minutes | 61 | 27.2% |
| 15 to 19 Minutes | 0 | 0.0% |
| 20 to 24 Minutes | 53 | 23.7% |
| 25 to 29 Minutes | 40 | 17.9% |
| 30 to 34 Minutes | 70 | 31.2% |
| 35 to 39 Minutes | 0 | 0.0% |
| 40 to 44 Minutes | 0 | 0.0% |
| 45 to 59 Minutes | 0 | 0.0% |
| 60 to 89 Minutes | 0 | 0.0% |
| 90 or more Minutes | 0 | 0.0% |
Commute Time by Sex in Toomsuba
The most common commute times in Toomsuba are 30 to 34 minutes (70 commuters, 41.2%) for males and 10 to 14 minutes (44 commuters, 81.5%) for females.
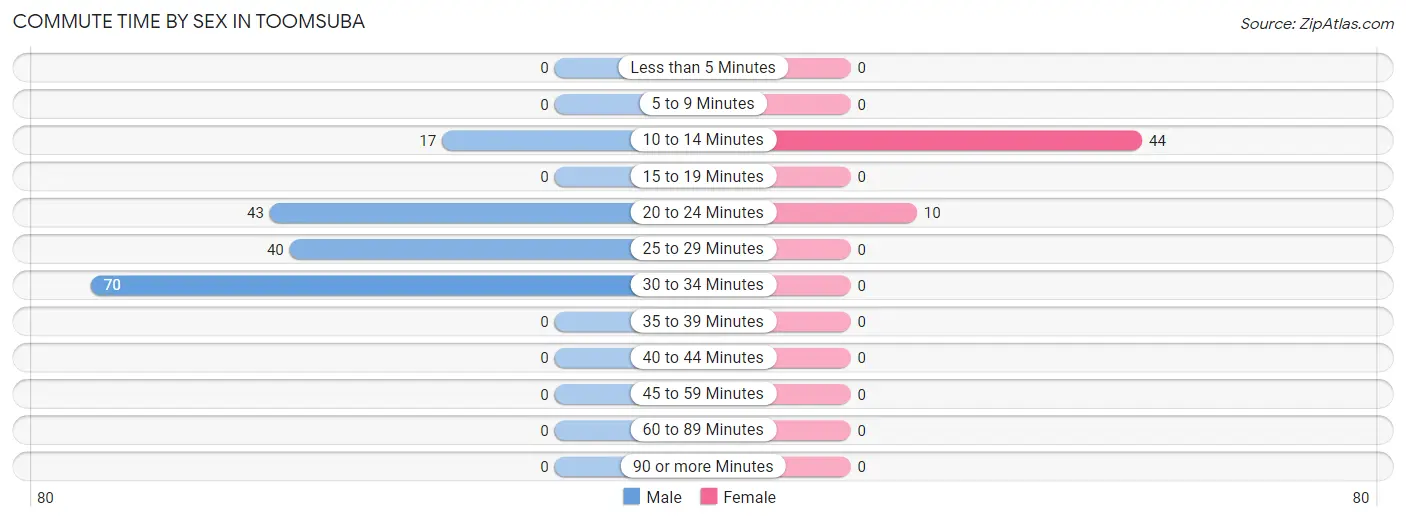
| Commute Time | Male | Female |
| Less than 5 Minutes | 0 (0.0%) | 0 (0.0%) |
| 5 to 9 Minutes | 0 (0.0%) | 0 (0.0%) |
| 10 to 14 Minutes | 17 (10.0%) | 44 (81.5%) |
| 15 to 19 Minutes | 0 (0.0%) | 0 (0.0%) |
| 20 to 24 Minutes | 43 (25.3%) | 10 (18.5%) |
| 25 to 29 Minutes | 40 (23.5%) | 0 (0.0%) |
| 30 to 34 Minutes | 70 (41.2%) | 0 (0.0%) |
| 35 to 39 Minutes | 0 (0.0%) | 0 (0.0%) |
| 40 to 44 Minutes | 0 (0.0%) | 0 (0.0%) |
| 45 to 59 Minutes | 0 (0.0%) | 0 (0.0%) |
| 60 to 89 Minutes | 0 (0.0%) | 0 (0.0%) |
| 90 or more Minutes | 0 (0.0%) | 0 (0.0%) |
Time of Departure to Work by Sex in Toomsuba
The most frequent times of departure to work in Toomsuba are 6:00 AM to 6:29 AM (153, 90.0%) for males and 7:00 AM to 7:29 AM (44, 81.5%) for females.
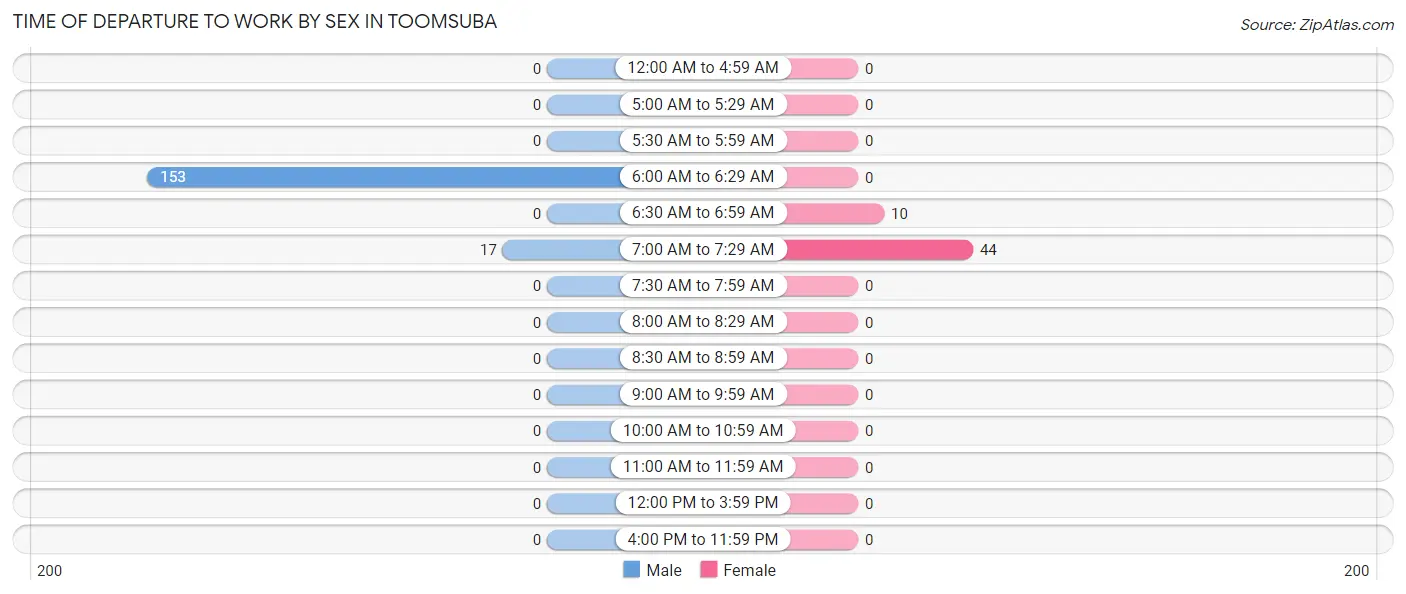
| Time of Departure | Male | Female |
| 12:00 AM to 4:59 AM | 0 (0.0%) | 0 (0.0%) |
| 5:00 AM to 5:29 AM | 0 (0.0%) | 0 (0.0%) |
| 5:30 AM to 5:59 AM | 0 (0.0%) | 0 (0.0%) |
| 6:00 AM to 6:29 AM | 153 (90.0%) | 0 (0.0%) |
| 6:30 AM to 6:59 AM | 0 (0.0%) | 10 (18.5%) |
| 7:00 AM to 7:29 AM | 17 (10.0%) | 44 (81.5%) |
| 7:30 AM to 7:59 AM | 0 (0.0%) | 0 (0.0%) |
| 8:00 AM to 8:29 AM | 0 (0.0%) | 0 (0.0%) |
| 8:30 AM to 8:59 AM | 0 (0.0%) | 0 (0.0%) |
| 9:00 AM to 9:59 AM | 0 (0.0%) | 0 (0.0%) |
| 10:00 AM to 10:59 AM | 0 (0.0%) | 0 (0.0%) |
| 11:00 AM to 11:59 AM | 0 (0.0%) | 0 (0.0%) |
| 12:00 PM to 3:59 PM | 0 (0.0%) | 0 (0.0%) |
| 4:00 PM to 11:59 PM | 0 (0.0%) | 0 (0.0%) |
| Total | 170 (100.0%) | 54 (100.0%) |
Housing Occupancy in Toomsuba
Occupancy by Ownership in Toomsuba
Of the total 403 dwellings in Toomsuba, owner-occupied units account for 269 (66.7%), while renter-occupied units make up 134 (33.3%).
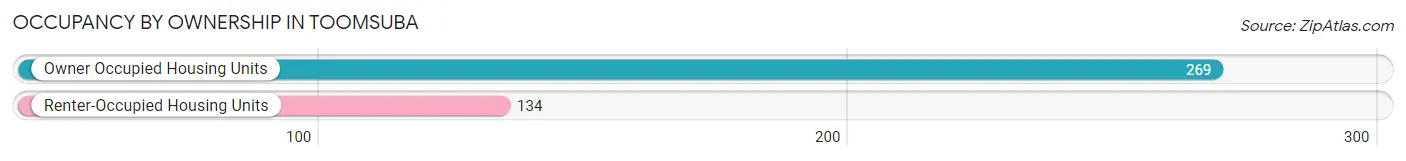
| Occupancy | # Housing Units | % Housing Units |
| Owner Occupied Housing Units | 269 | 66.7% |
| Renter-Occupied Housing Units | 134 | 33.3% |
| Total Occupied Housing Units | 403 | 100.0% |
Occupancy by Household Size in Toomsuba
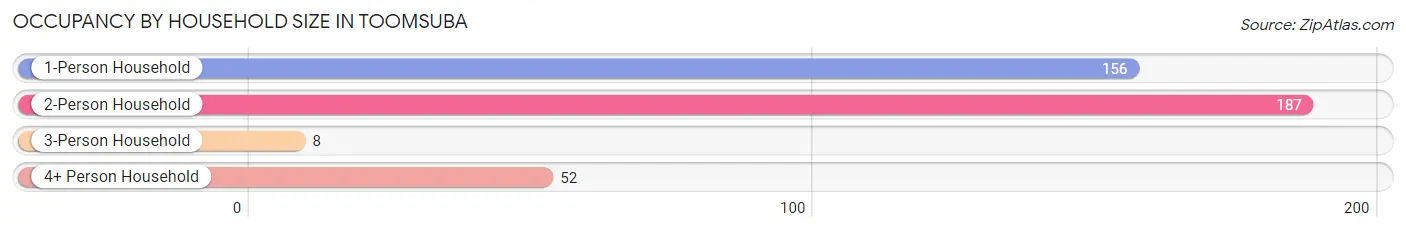
| Household Size | # Housing Units | % Housing Units |
| 1-Person Household | 156 | 38.7% |
| 2-Person Household | 187 | 46.4% |
| 3-Person Household | 8 | 2.0% |
| 4+ Person Household | 52 | 12.9% |
| Total Housing Units | 403 | 100.0% |
Occupancy by Ownership by Household Size in Toomsuba

| Household Size | Owner-occupied | Renter-occupied |
| 1-Person Household | 106 (67.9%) | 50 (32.1%) |
| 2-Person Household | 103 (55.1%) | 84 (44.9%) |
| 3-Person Household | 8 (100.0%) | 0 (0.0%) |
| 4+ Person Household | 52 (100.0%) | 0 (0.0%) |
| Total Housing Units | 269 (66.7%) | 134 (33.3%) |
Occupancy by Educational Attainment in Toomsuba
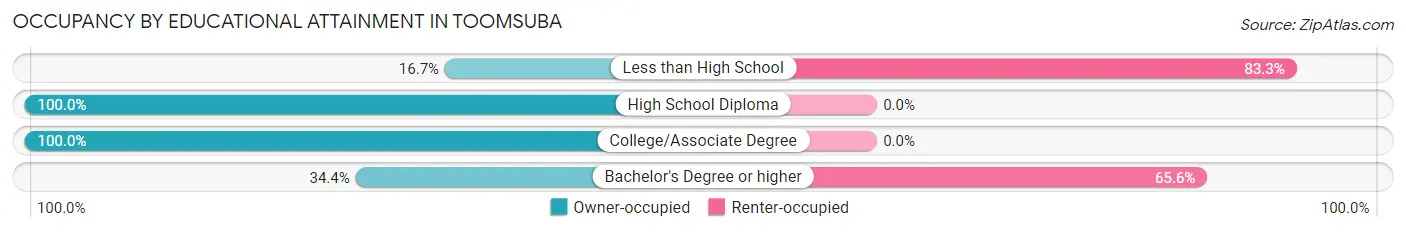
| Household Size | Owner-occupied | Renter-occupied |
| Less than High School | 10 (16.7%) | 50 (83.3%) |
| High School Diploma | 126 (100.0%) | 0 (0.0%) |
| College/Associate Degree | 89 (100.0%) | 0 (0.0%) |
| Bachelor's Degree or higher | 44 (34.4%) | 84 (65.6%) |
Occupancy by Age of Householder in Toomsuba
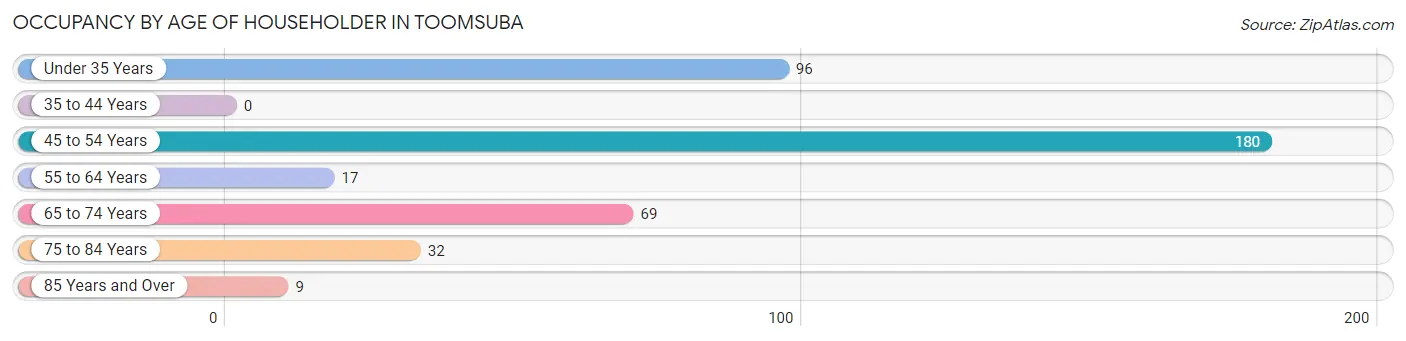
| Age Bracket | # Households | % Households |
| Under 35 Years | 96 | 23.8% |
| 35 to 44 Years | 0 | 0.0% |
| 45 to 54 Years | 180 | 44.7% |
| 55 to 64 Years | 17 | 4.2% |
| 65 to 74 Years | 69 | 17.1% |
| 75 to 84 Years | 32 | 7.9% |
| 85 Years and Over | 9 | 2.2% |
| Total | 403 | 100.0% |
Housing Finances in Toomsuba
Median Income by Occupancy in Toomsuba
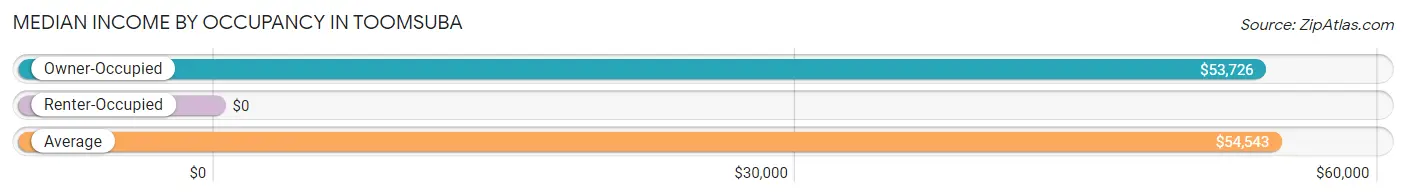
| Occupancy Type | # Households | Median Income |
| Owner-Occupied | 269 (66.7%) | $53,726 |
| Renter-Occupied | 134 (33.3%) | $0 |
| Average | 403 (100.0%) | $54,543 |
Occupancy by Householder Income Bracket in Toomsuba
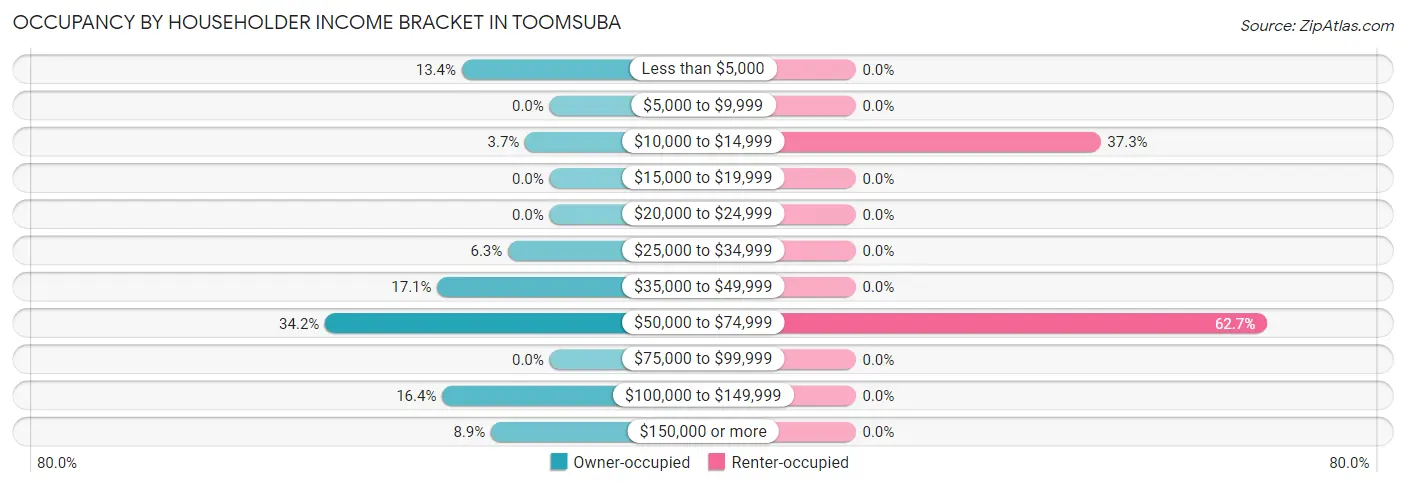
| Income Bracket | Owner-occupied | Renter-occupied |
| Less than $5,000 | 36 (13.4%) | 0 (0.0%) |
| $5,000 to $9,999 | 0 (0.0%) | 0 (0.0%) |
| $10,000 to $14,999 | 10 (3.7%) | 50 (37.3%) |
| $15,000 to $19,999 | 0 (0.0%) | 0 (0.0%) |
| $20,000 to $24,999 | 0 (0.0%) | 0 (0.0%) |
| $25,000 to $34,999 | 17 (6.3%) | 0 (0.0%) |
| $35,000 to $49,999 | 46 (17.1%) | 0 (0.0%) |
| $50,000 to $74,999 | 92 (34.2%) | 84 (62.7%) |
| $75,000 to $99,999 | 0 (0.0%) | 0 (0.0%) |
| $100,000 to $149,999 | 44 (16.4%) | 0 (0.0%) |
| $150,000 or more | 24 (8.9%) | 0 (0.0%) |
| Total | 269 (100.0%) | 134 (100.0%) |
Monthly Housing Cost Tiers in Toomsuba
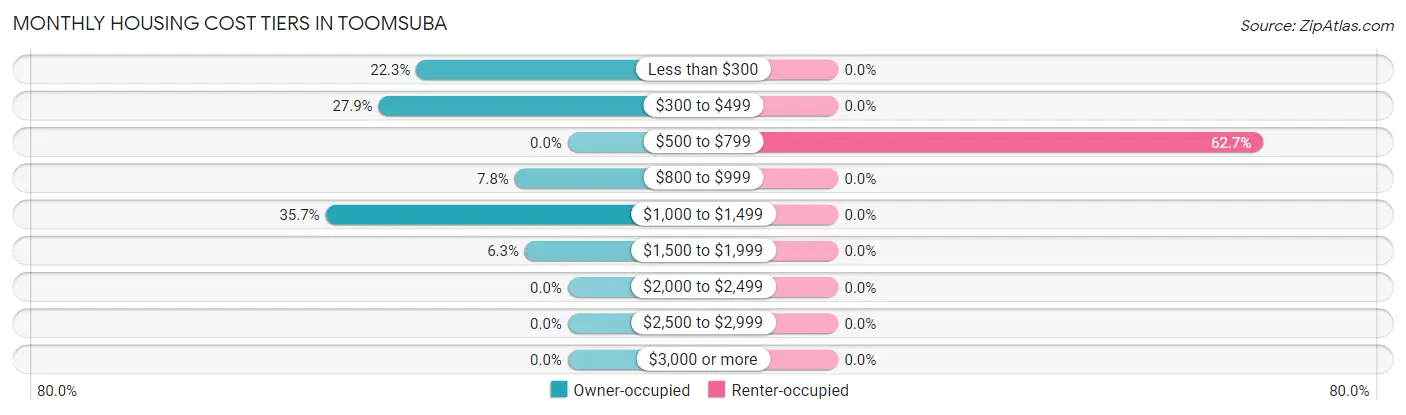
| Monthly Cost | Owner-occupied | Renter-occupied |
| Less than $300 | 60 (22.3%) | 0 (0.0%) |
| $300 to $499 | 75 (27.9%) | 0 (0.0%) |
| $500 to $799 | 0 (0.0%) | 84 (62.7%) |
| $800 to $999 | 21 (7.8%) | 0 (0.0%) |
| $1,000 to $1,499 | 96 (35.7%) | 0 (0.0%) |
| $1,500 to $1,999 | 17 (6.3%) | 0 (0.0%) |
| $2,000 to $2,499 | 0 (0.0%) | 0 (0.0%) |
| $2,500 to $2,999 | 0 (0.0%) | 0 (0.0%) |
| $3,000 or more | 0 (0.0%) | 0 (0.0%) |
| Total | 269 (100.0%) | 134 (100.0%) |
Physical Housing Characteristics in Toomsuba
Housing Structures in Toomsuba
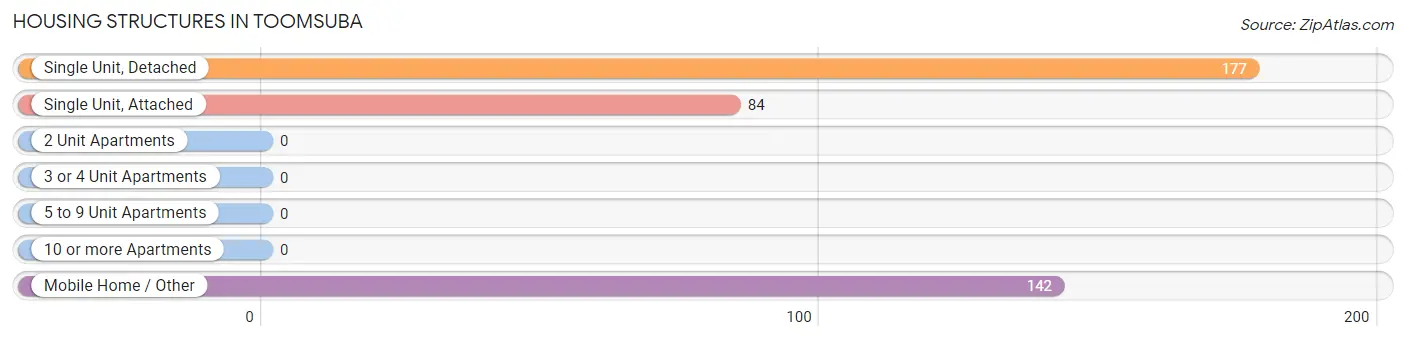
| Structure Type | # Housing Units | % Housing Units |
| Single Unit, Detached | 177 | 43.9% |
| Single Unit, Attached | 84 | 20.8% |
| 2 Unit Apartments | 0 | 0.0% |
| 3 or 4 Unit Apartments | 0 | 0.0% |
| 5 to 9 Unit Apartments | 0 | 0.0% |
| 10 or more Apartments | 0 | 0.0% |
| Mobile Home / Other | 142 | 35.2% |
| Total | 403 | 100.0% |
Housing Structures by Occupancy in Toomsuba
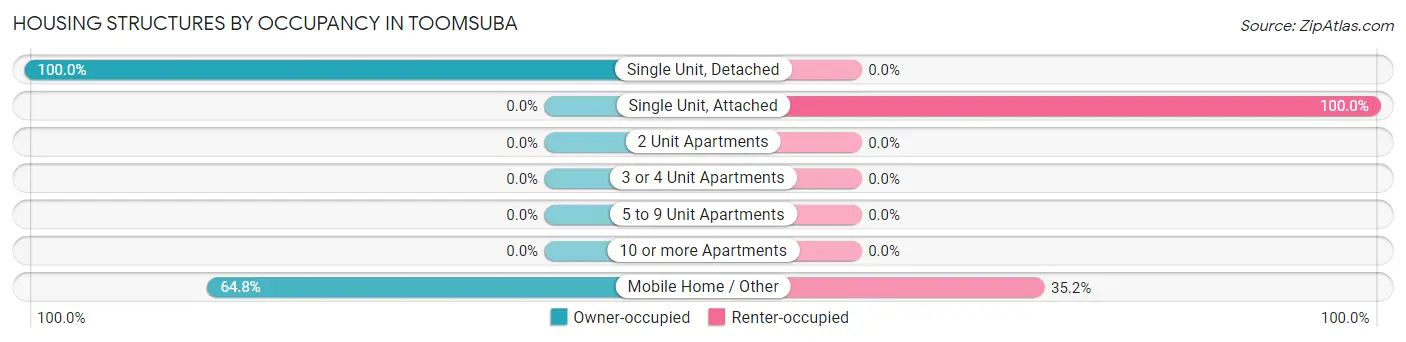
| Structure Type | Owner-occupied | Renter-occupied |
| Single Unit, Detached | 177 (100.0%) | 0 (0.0%) |
| Single Unit, Attached | 0 (0.0%) | 84 (100.0%) |
| 2 Unit Apartments | 0 (0.0%) | 0 (0.0%) |
| 3 or 4 Unit Apartments | 0 (0.0%) | 0 (0.0%) |
| 5 to 9 Unit Apartments | 0 (0.0%) | 0 (0.0%) |
| 10 or more Apartments | 0 (0.0%) | 0 (0.0%) |
| Mobile Home / Other | 92 (64.8%) | 50 (35.2%) |
| Total | 269 (66.7%) | 134 (33.3%) |
Housing Structures by Number of Rooms in Toomsuba
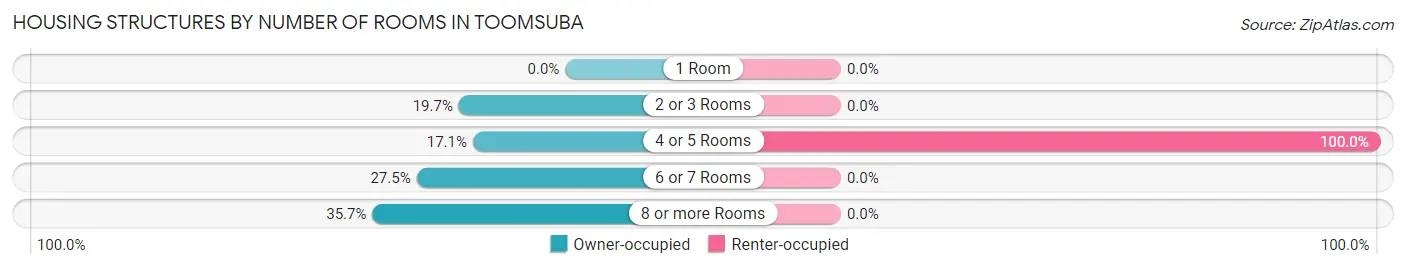
| Number of Rooms | Owner-occupied | Renter-occupied |
| 1 Room | 0 (0.0%) | 0 (0.0%) |
| 2 or 3 Rooms | 53 (19.7%) | 0 (0.0%) |
| 4 or 5 Rooms | 46 (17.1%) | 134 (100.0%) |
| 6 or 7 Rooms | 74 (27.5%) | 0 (0.0%) |
| 8 or more Rooms | 96 (35.7%) | 0 (0.0%) |
| Total | 269 (100.0%) | 134 (100.0%) |
Housing Structure by Heating Type in Toomsuba
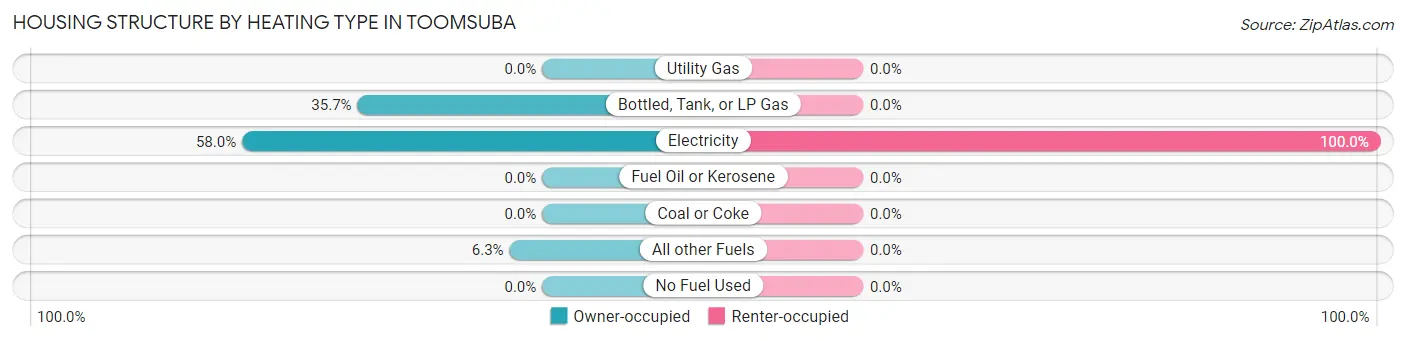
| Heating Type | Owner-occupied | Renter-occupied |
| Utility Gas | 0 (0.0%) | 0 (0.0%) |
| Bottled, Tank, or LP Gas | 96 (35.7%) | 0 (0.0%) |
| Electricity | 156 (58.0%) | 134 (100.0%) |
| Fuel Oil or Kerosene | 0 (0.0%) | 0 (0.0%) |
| Coal or Coke | 0 (0.0%) | 0 (0.0%) |
| All other Fuels | 17 (6.3%) | 0 (0.0%) |
| No Fuel Used | 0 (0.0%) | 0 (0.0%) |
| Total | 269 (100.0%) | 134 (100.0%) |
Household Vehicle Usage in Toomsuba
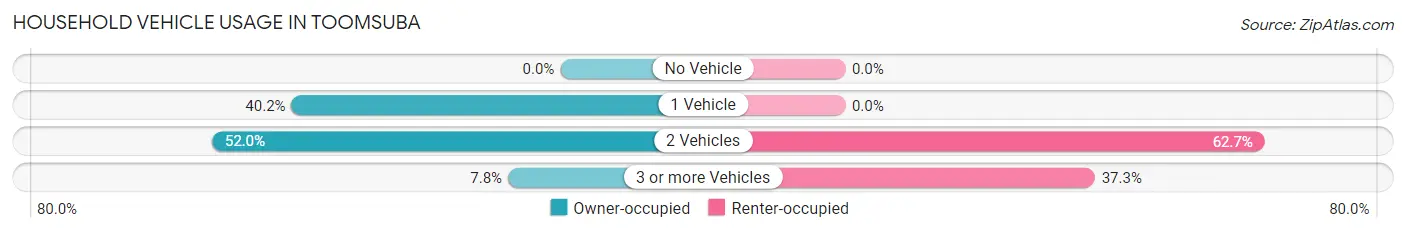
| Vehicles per Household | Owner-occupied | Renter-occupied |
| No Vehicle | 0 (0.0%) | 0 (0.0%) |
| 1 Vehicle | 108 (40.2%) | 0 (0.0%) |
| 2 Vehicles | 140 (52.0%) | 84 (62.7%) |
| 3 or more Vehicles | 21 (7.8%) | 50 (37.3%) |
| Total | 269 (100.0%) | 134 (100.0%) |
Real Estate & Mortgages in Toomsuba
Real Estate and Mortgage Overview in Toomsuba
| Characteristic | Without Mortgage | With Mortgage |
| Housing Units | 143 | 126 |
| Median Property Value | $28,800 | $172,800 |
| Median Household Income | $38,886 | $0 |
| Monthly Housing Costs | $351 | $0 |
| Real Estate Taxes | $199 | $17 |
Property Value by Mortgage Status in Toomsuba
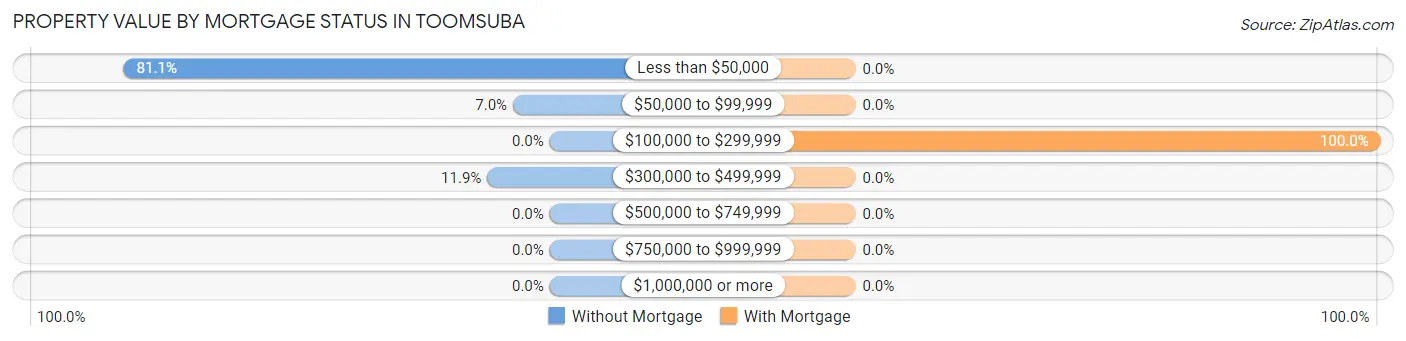
| Property Value | Without Mortgage | With Mortgage |
| Less than $50,000 | 116 (81.1%) | 0 (0.0%) |
| $50,000 to $99,999 | 10 (7.0%) | 0 (0.0%) |
| $100,000 to $299,999 | 0 (0.0%) | 126 (100.0%) |
| $300,000 to $499,999 | 17 (11.9%) | 0 (0.0%) |
| $500,000 to $749,999 | 0 (0.0%) | 0 (0.0%) |
| $750,000 to $999,999 | 0 (0.0%) | 0 (0.0%) |
| $1,000,000 or more | 0 (0.0%) | 0 (0.0%) |
| Total | 143 (100.0%) | 126 (100.0%) |
Household Income by Mortgage Status in Toomsuba
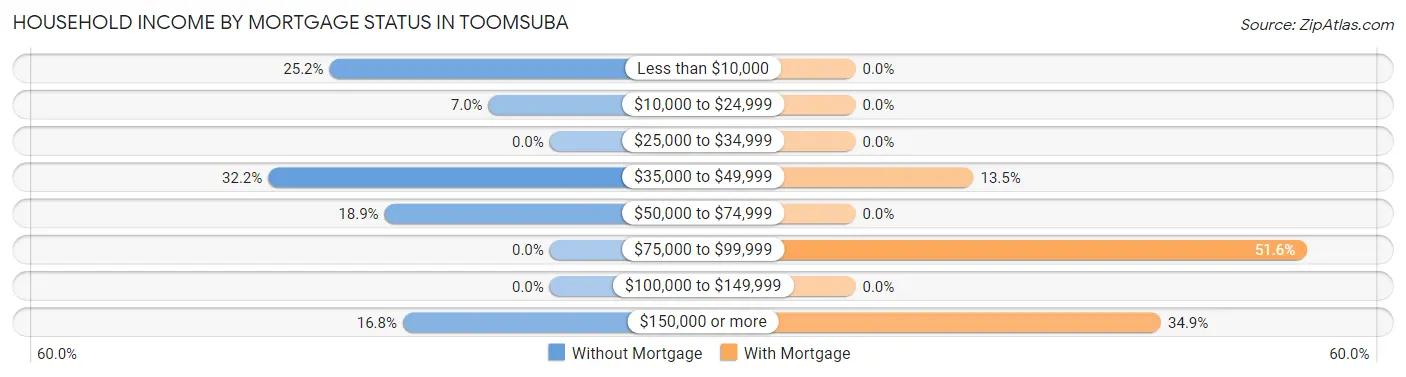
| Household Income | Without Mortgage | With Mortgage |
| Less than $10,000 | 36 (25.2%) | 0 (0.0%) |
| $10,000 to $24,999 | 10 (7.0%) | 0 (0.0%) |
| $25,000 to $34,999 | 0 (0.0%) | 0 (0.0%) |
| $35,000 to $49,999 | 46 (32.2%) | 17 (13.5%) |
| $50,000 to $74,999 | 27 (18.9%) | 0 (0.0%) |
| $75,000 to $99,999 | 0 (0.0%) | 65 (51.6%) |
| $100,000 to $149,999 | 0 (0.0%) | 0 (0.0%) |
| $150,000 or more | 24 (16.8%) | 44 (34.9%) |
| Total | 143 (100.0%) | 126 (100.0%) |
Property Value to Household Income Ratio in Toomsuba
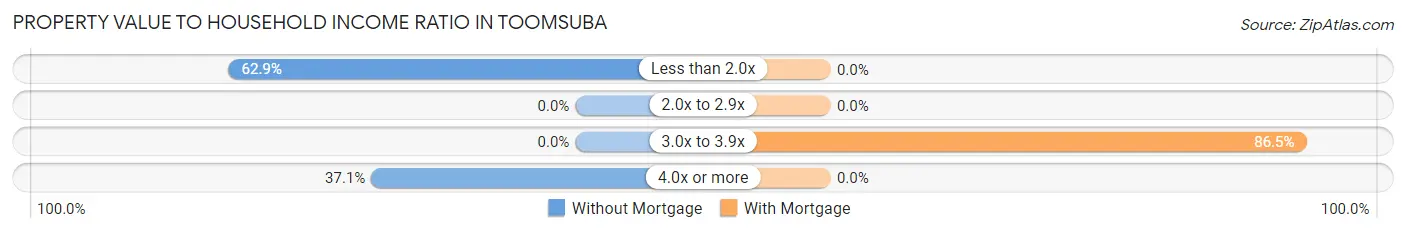
| Value-to-Income Ratio | Without Mortgage | With Mortgage |
| Less than 2.0x | 90 (62.9%) | 0 (0.0%) |
| 2.0x to 2.9x | 0 (0.0%) | 0 (0.0%) |
| 3.0x to 3.9x | 0 (0.0%) | 109 (86.5%) |
| 4.0x or more | 53 (37.1%) | 0 (0.0%) |
| Total | 143 (100.0%) | 126 (100.0%) |
Real Estate Taxes by Mortgage Status in Toomsuba
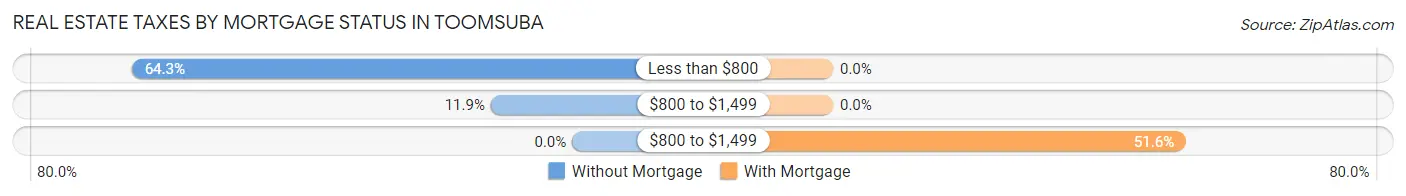
| Property Taxes | Without Mortgage | With Mortgage |
| Less than $800 | 92 (64.3%) | 0 (0.0%) |
| $800 to $1,499 | 17 (11.9%) | 0 (0.0%) |
| $800 to $1,499 | 0 (0.0%) | 65 (51.6%) |
| Total | 143 (100.0%) | 126 (100.0%) |
Health & Disability in Toomsuba
Health Insurance Coverage by Age in Toomsuba
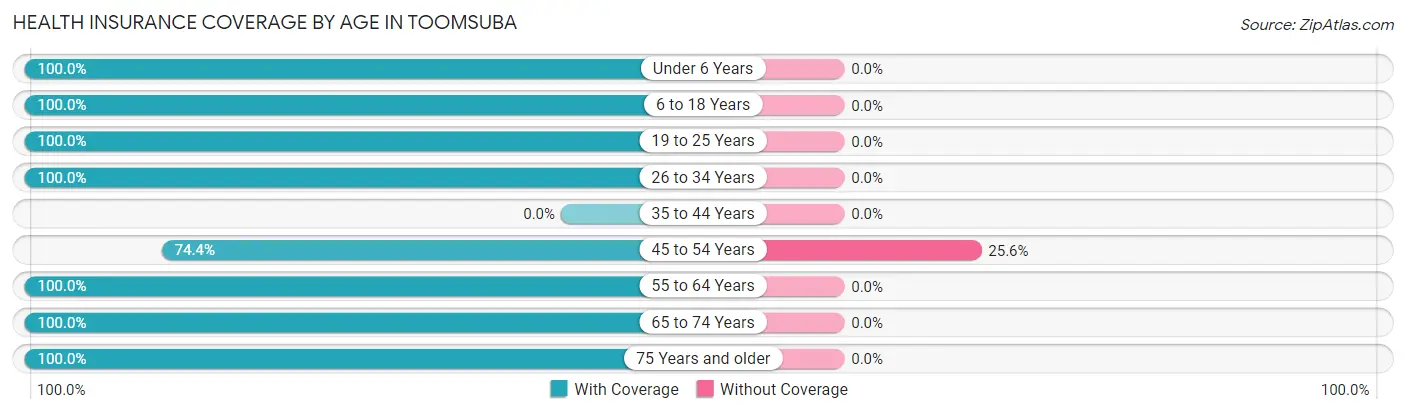
| Age Bracket | With Coverage | Without Coverage |
| Under 6 Years | 49 (100.0%) | 0 (0.0%) |
| 6 to 18 Years | 47 (100.0%) | 0 (0.0%) |
| 19 to 25 Years | 70 (100.0%) | 0 (0.0%) |
| 26 to 34 Years | 179 (100.0%) | 0 (0.0%) |
| 35 to 44 Years | 0 (0.0%) | 0 (0.0%) |
| 45 to 54 Years | 134 (74.4%) | 46 (25.6%) |
| 55 to 64 Years | 25 (100.0%) | 0 (0.0%) |
| 65 to 74 Years | 69 (100.0%) | 0 (0.0%) |
| 75 Years and older | 109 (100.0%) | 0 (0.0%) |
| Total | 682 (93.7%) | 46 (6.3%) |
Health Insurance Coverage by Citizenship Status in Toomsuba
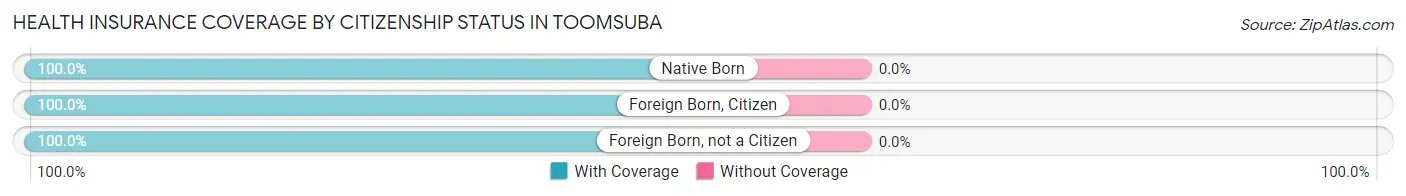
| Citizenship Status | With Coverage | Without Coverage |
| Native Born | 49 (100.0%) | 0 (0.0%) |
| Foreign Born, Citizen | 47 (100.0%) | 0 (0.0%) |
| Foreign Born, not a Citizen | 70 (100.0%) | 0 (0.0%) |
Health Insurance Coverage by Household Income in Toomsuba
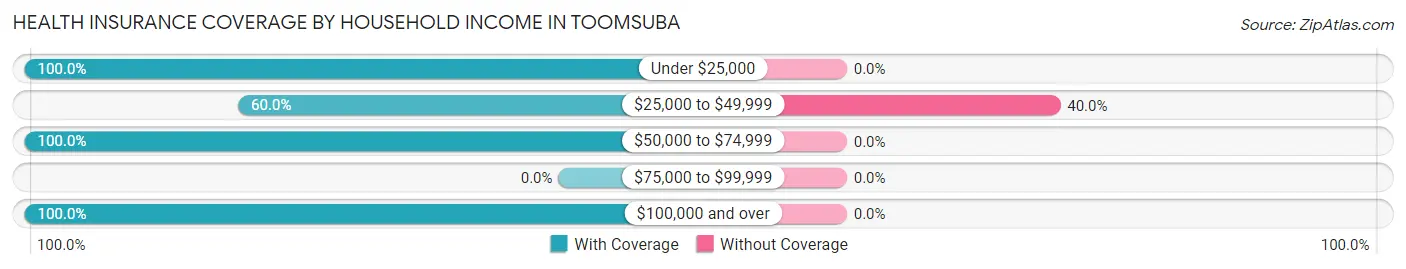
| Household Income | With Coverage | Without Coverage |
| Under $25,000 | 96 (100.0%) | 0 (0.0%) |
| $25,000 to $49,999 | 69 (60.0%) | 46 (40.0%) |
| $50,000 to $74,999 | 409 (100.0%) | 0 (0.0%) |
| $75,000 to $99,999 | 0 (0.0%) | 0 (0.0%) |
| $100,000 and over | 108 (100.0%) | 0 (0.0%) |
Public vs Private Health Insurance Coverage by Age in Toomsuba
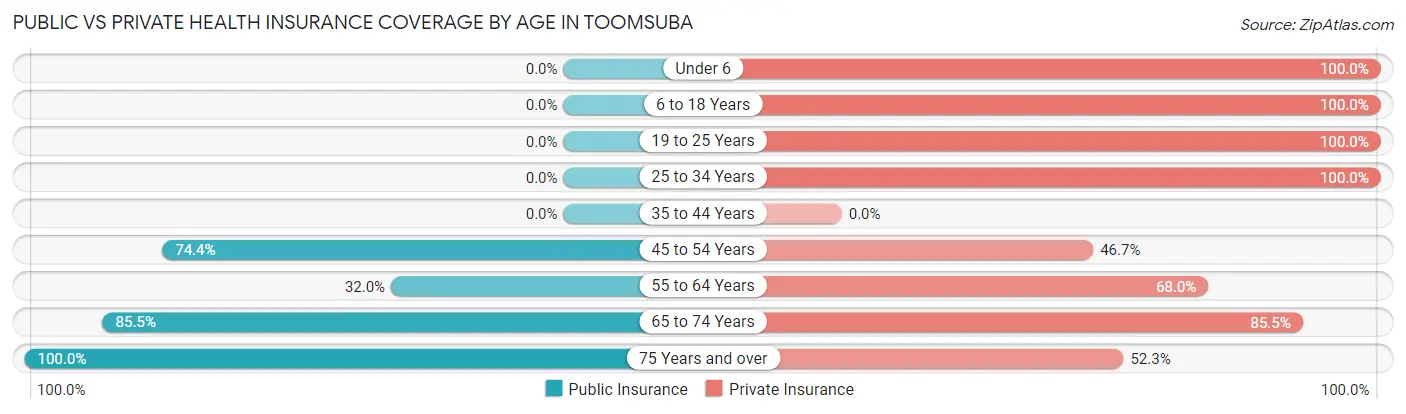
| Age Bracket | Public Insurance | Private Insurance |
| Under 6 | 0 (0.0%) | 49 (100.0%) |
| 6 to 18 Years | 0 (0.0%) | 47 (100.0%) |
| 19 to 25 Years | 0 (0.0%) | 70 (100.0%) |
| 25 to 34 Years | 0 (0.0%) | 179 (100.0%) |
| 35 to 44 Years | 0 (0.0%) | 0 (0.0%) |
| 45 to 54 Years | 134 (74.4%) | 84 (46.7%) |
| 55 to 64 Years | 8 (32.0%) | 17 (68.0%) |
| 65 to 74 Years | 59 (85.5%) | 59 (85.5%) |
| 75 Years and over | 109 (100.0%) | 57 (52.3%) |
| Total | 310 (42.6%) | 562 (77.2%) |
Disability Status by Sex by Age in Toomsuba
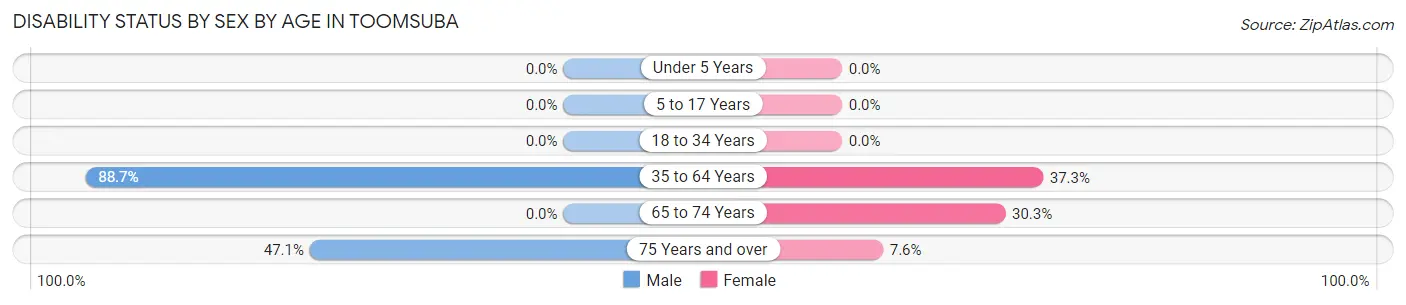
| Age Bracket | Male | Female |
| Under 5 Years | 0 (0.0%) | 0 (0.0%) |
| 5 to 17 Years | 0 (0.0%) | 0 (0.0%) |
| 18 to 34 Years | 0 (0.0%) | 0 (0.0%) |
| 35 to 64 Years | 63 (88.7%) | 50 (37.3%) |
| 65 to 74 Years | 0 (0.0%) | 10 (30.3%) |
| 75 Years and over | 8 (47.1%) | 7 (7.6%) |
Disability Class by Sex by Age in Toomsuba
Disability Class: Hearing Difficulty

| Age Bracket | Male | Female |
| Under 5 Years | 0 (0.0%) | 0 (0.0%) |
| 5 to 17 Years | 0 (0.0%) | 0 (0.0%) |
| 18 to 34 Years | 0 (0.0%) | 0 (0.0%) |
| 35 to 64 Years | 0 (0.0%) | 0 (0.0%) |
| 65 to 74 Years | 0 (0.0%) | 0 (0.0%) |
| 75 Years and over | 0 (0.0%) | 0 (0.0%) |
Disability Class: Vision Difficulty
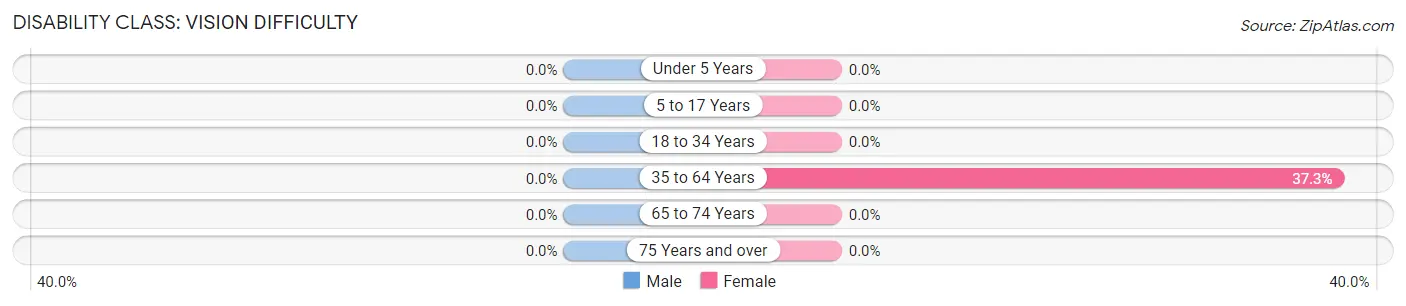
| Age Bracket | Male | Female |
| Under 5 Years | 0 (0.0%) | 0 (0.0%) |
| 5 to 17 Years | 0 (0.0%) | 0 (0.0%) |
| 18 to 34 Years | 0 (0.0%) | 0 (0.0%) |
| 35 to 64 Years | 0 (0.0%) | 50 (37.3%) |
| 65 to 74 Years | 0 (0.0%) | 0 (0.0%) |
| 75 Years and over | 0 (0.0%) | 0 (0.0%) |
Disability Class: Cognitive Difficulty
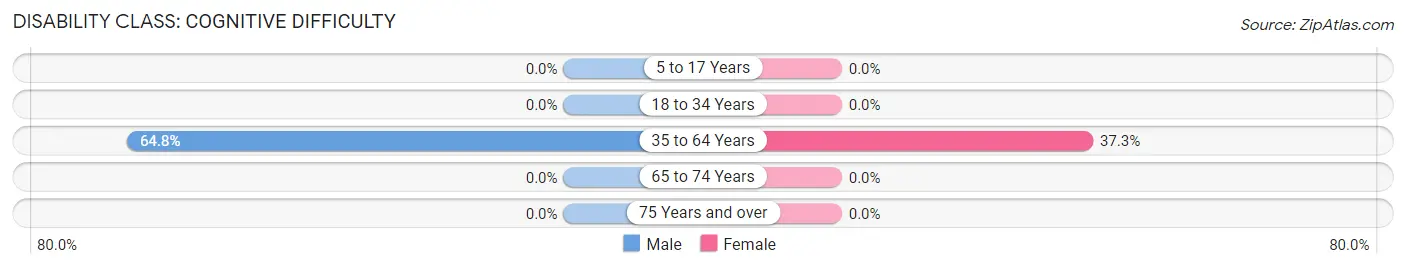
| Age Bracket | Male | Female |
| 5 to 17 Years | 0 (0.0%) | 0 (0.0%) |
| 18 to 34 Years | 0 (0.0%) | 0 (0.0%) |
| 35 to 64 Years | 46 (64.8%) | 50 (37.3%) |
| 65 to 74 Years | 0 (0.0%) | 0 (0.0%) |
| 75 Years and over | 0 (0.0%) | 0 (0.0%) |
Disability Class: Ambulatory Difficulty
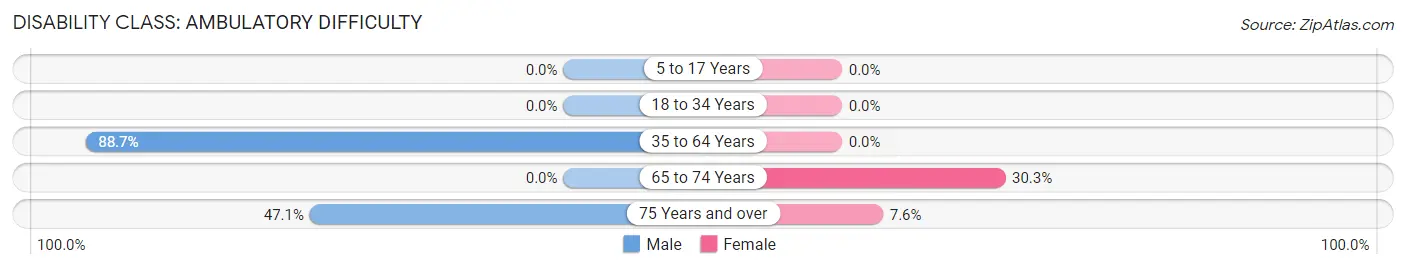
| Age Bracket | Male | Female |
| 5 to 17 Years | 0 (0.0%) | 0 (0.0%) |
| 18 to 34 Years | 0 (0.0%) | 0 (0.0%) |
| 35 to 64 Years | 63 (88.7%) | 0 (0.0%) |
| 65 to 74 Years | 0 (0.0%) | 10 (30.3%) |
| 75 Years and over | 8 (47.1%) | 7 (7.6%) |
Disability Class: Self-Care Difficulty
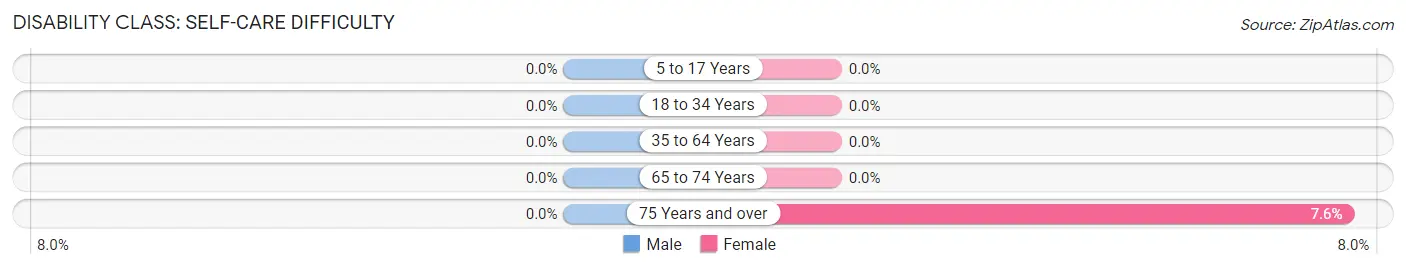
| Age Bracket | Male | Female |
| 5 to 17 Years | 0 (0.0%) | 0 (0.0%) |
| 18 to 34 Years | 0 (0.0%) | 0 (0.0%) |
| 35 to 64 Years | 0 (0.0%) | 0 (0.0%) |
| 65 to 74 Years | 0 (0.0%) | 0 (0.0%) |
| 75 Years and over | 0 (0.0%) | 7 (7.6%) |
Technology Access in Toomsuba
Computing Device Access in Toomsuba
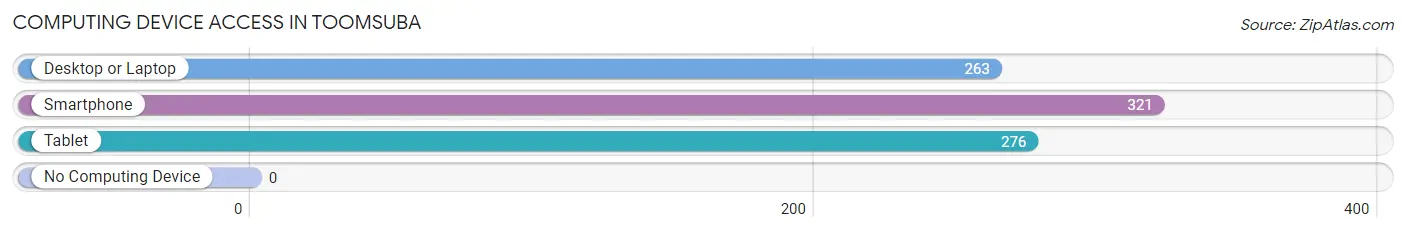
| Device Type | # Households | % Households |
| Desktop or Laptop | 263 | 65.3% |
| Smartphone | 321 | 79.6% |
| Tablet | 276 | 68.5% |
| No Computing Device | 0 | 0.0% |
| Total | 403 | 100.0% |
Internet Access in Toomsuba
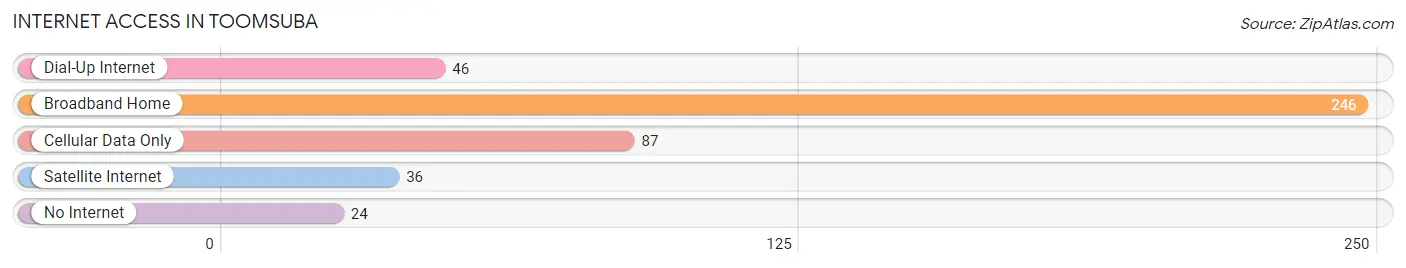
| Internet Type | # Households | % Households |
| Dial-Up Internet | 46 | 11.4% |
| Broadband Home | 246 | 61.0% |
| Cellular Data Only | 87 | 21.6% |
| Satellite Internet | 36 | 8.9% |
| No Internet | 24 | 6.0% |
| Total | 403 | 100.0% |
Toomsuba Summary
Toomsuba is a small town located in Lauderdale County, Mississippi. It is situated about 10 miles east of Meridian, the county seat. The town was founded in 1848 and is named after the Toomsuba Creek, which runs through the area. As of the 2010 census, the population of Toomsuba was 1,092.
History
Toomsuba was founded in 1848 by a group of settlers from Georgia. The town was originally known as Toomsboro, but the name was changed to Toomsuba in 1858. The town was incorporated in 1872 and was the first town in Lauderdale County to be incorporated.
The town was a major stop on the Mobile and Ohio Railroad, which ran through the area in the late 19th century. The railroad brought economic growth to the area and helped to make Toomsuba a thriving community.
Geography
Toomsuba is located in Lauderdale County, Mississippi. It is situated about 10 miles east of Meridian, the county seat. The town is located at the intersection of U.S. Highway 11 and Mississippi Highway 19.
Toomsuba is located in the East Central Hills region of Mississippi. The town is situated on a ridge between the Toomsuba Creek and the Chickasawhay River. The terrain is mostly flat with some rolling hills.
Economy
Toomsuba’s economy is largely based on agriculture. The town is home to several farms, which produce cotton, soybeans, corn, and other crops. The town also has several small businesses, including a grocery store, a hardware store, and a few restaurants.
Demographics
As of the 2010 census, the population of Toomsuba was 1,092. The racial makeup of the town was 79.3% White, 19.2% African American, 0.3% Native American, 0.2% Asian, and 0.9% from other races.
The median household income in Toomsuba was $30,938, and the median family income was $37,500. The per capita income was $15,945. About 17.2% of the population was below the poverty line.
Conclusion
Toomsuba is a small town located in Lauderdale County, Mississippi. It was founded in 1848 and is home to about 1,092 people. The town’s economy is largely based on agriculture, and it has several small businesses. The racial makeup of the town is mostly White, with a small percentage of African Americans and other races. The median household income in Toomsuba is $30,938, and the per capita income is $15,945.
Common Questions
What is Per Capita Income in Toomsuba?
Per Capita income in Toomsuba is $34,572.
What is the Median Family Income in Toomsuba?
Median Family Income in Toomsuba is $67,604.
What is the Median Household income in Toomsuba?
Median Household Income in Toomsuba is $54,543.
What is Income or Wage Gap in Toomsuba?
Income or Wage Gap in Toomsuba is 19.6%.
Women in Toomsuba earn 80.4 cents for every dollar earned by a man.
What is Inequality or Gini Index in Toomsuba?
Inequality or Gini Index in Toomsuba is 0.45.
What is the Total Population of Toomsuba?
Total Population of Toomsuba is 728.
What is the Total Male Population of Toomsuba?
Total Male Population of Toomsuba is 326.
What is the Total Female Population of Toomsuba?
Total Female Population of Toomsuba is 402.
What is the Ratio of Males per 100 Females in Toomsuba?
There are 81.09 Males per 100 Females in Toomsuba.
What is the Ratio of Females per 100 Males in Toomsuba?
There are 123.31 Females per 100 Males in Toomsuba.
What is the Median Population Age in Toomsuba?
Median Population Age in Toomsuba is 48.2 Years.
What is the Average Family Size in Toomsuba
Average Family Size in Toomsuba is 2.4 People.
What is the Average Household Size in Toomsuba
Average Household Size in Toomsuba is 1.8 People.
How Large is the Labor Force in Toomsuba?
There are 316 People in the Labor Forcein in Toomsuba.
What is the Percentage of People in the Labor Force in Toomsuba?
50.0% of People are in the Labor Force in Toomsuba.
What is the Unemployment Rate in Toomsuba?
Unemployment Rate in Toomsuba is 26.6%.